
Nano sized ZnO composites: Preparation, characterization and application as photocatalysts for...
13
Nano sized ZnO composites: Preparation, characterization and application as photocatalysts for degradation of AB92 azo dye Neda Mohaghegh a , Mahboubeh Tasviri b,n , Esmail Rahimi c , Mohammad Reza Gholami a,nn a Department of Chemistry, Sharif University of Technology, Azadi Avenue, Tehran, Iran b Department of Chemistry, Shahid Beheshti University, Evin, P.O. Box 19839-63113, Tehran, Iran c Department of Mining Engineering, Islamic Azad University, South Tehran Branch, Tehran, Iran article info Available online 31 January 2014 Keywords: Photocatalysis ZnO nanoparticles Mordenite zeolite Nanocomposites Acid Blue 92 abstract ZnO and Mordenite zeolite (MOR) nanoparticles were prepared by precipitation process using ultrasonic irradiation and hydrothermal method, respectively. Supported ZnO catalysts were prepared and the effect of different supports on the photocatalytic activity of ZnO nanoparticles was investigated. All prepared samples were characterized by X-ray Diffraction (XRD), Scanning Electron Microscopy (SEM), Fourier Transform-Infra Red Spectroscopy (FTIR), UV–vis spectroscopy (UV–vis) and BET surface area technique. The photocatalytic activity of the synthesized catalysts was elucidated using the photo- oxidation of Acid Blue 92 (AB92) as a hazardous pollutant under UV light. The effect of different parameters such as catalyst concentration, initial dye concentration, pH, UV irradiation and amount of ZnO loaded on the nanocomposites have been examined on the yield and the rate of photocatalytic degradation process. The photodegradation results of AB92 in aqueous medium under UV irradiation revealed that nanocomposite of ZnO and mordenite zeolite exhibit much higher photocatalytic activity than the other nanocom- posites and pure ZnO. It was found that the type of support plays an important role in photocatalytic oxidation of AB92 and significantly improved the photocatalytic activity of ZnO. Chemical Oxygen Demand (COD) for dye solutions were examined at regular intervals and gave a good idea about mineralization of the dye. & 2014 Elsevier Ltd. All rights reserved. 1. Introduction Toxic wastewater effluents from textile and other dye- stuff industries contain a large variety of toxic residual organic dyes [1–3]. Azo dyes are the largest group of widely used synthetic dyes and one of the major hazards for human health in dye wastewaters [4]. Acid Blue 92 (AB92) arising from dyestuff industries is highly toxic and comparatively more refractory to natural degradation. It is a monoazo dye bearing three sulfonic groups (Fig. 1(a)) [5]. This dye is used in huge quantities in Iran and produces a lot of environmental problems. When AB92 solution is incorporated into the body, cleaved into aromatic amines by liver enzymes and can cause various cancers in human. Therefore, the removing of AB92 dye from wastewaters is more important [4]. The UV–vis absorption spectrum of AB92 in aqueous medium is shown in Fig. 1(b). The peak at λ ¼ 572 nm was used to monitor the dye concentration. The elimination of hazardous dyes from textile waste- water effluents is vital for human being. In recent years, heterogeneous metal oxide semiconductor assisted photocatalysis has become an important area among various Advanced Oxidation Processes (AOPs) for waste- water treatment [4–7]. ZnO is one of the most promising photocatalyst for degradation and complete mineralization Contents lists available at ScienceDirect journal homepage: www.elsevier.com/locate/mssp Materials Science in Semiconductor Processing 1369-8001/$ - see front matter & 2014 Elsevier Ltd. All rights reserved. http://dx.doi.org/10.1016/j.mssp.2013.12.023 n Corresponding author. Tel.: þ98 21 29902895; fax: þ98 21 22431661. nn Corresponding author. Tel.: þ98 21 66165314; fax: þ98 21 66029165. E-mail addresses: [email protected] (M. Tasviri), [email protected] (M.R. Gholami). Materials Science in Semiconductor Processing 21 (2014) 167–179
Transcript of Nano sized ZnO composites: Preparation, characterization and application as photocatalysts for...

Contents lists available at ScienceDirect
Materials Science in Semiconductor Processing
Materials Science in Semiconductor Processing 21 (2014) 167–179
1369-80http://d
n Corrnn CorE-m
gholam
journal homepage: www.elsevier.com/locate/mssp
Nano sized ZnO composites: Preparation, characterization andapplication as photocatalysts for degradation of AB92 azo dye
Neda Mohaghegh a, Mahboubeh Tasviri b,n, Esmail Rahimi c, MohammadReza Gholami a,nn
a Department of Chemistry, Sharif University of Technology, Azadi Avenue, Tehran, Iranb Department of Chemistry, Shahid Beheshti University, Evin, P.O. Box 19839-63113, Tehran, Iranc Department of Mining Engineering, Islamic Azad University, South Tehran Branch, Tehran, Iran
a r t i c l e i n f o
Available online 31 January 2014
Keywords:PhotocatalysisZnO nanoparticlesMordenite zeoliteNanocompositesAcid Blue 92
01/$ - see front matter & 2014 Elsevier Ltd.x.doi.org/10.1016/j.mssp.2013.12.023
esponding author. Tel.: þ98 21 29902895; faresponding author. Tel.: þ98 21 66165314; faail addresses: [email protected] (M. [email protected] (M.R. Gholami).
a b s t r a c t
ZnO and Mordenite zeolite (MOR) nanoparticles were prepared by precipitation processusing ultrasonic irradiation and hydrothermal method, respectively. Supported ZnOcatalysts were prepared and the effect of different supports on the photocatalytic activityof ZnO nanoparticles was investigated. All prepared samples were characterized by X-rayDiffraction (XRD), Scanning Electron Microscopy (SEM), Fourier Transform-Infra RedSpectroscopy (FTIR), UV–vis spectroscopy (UV–vis) and BET surface area technique. Thephotocatalytic activity of the synthesized catalysts was elucidated using the photo-oxidation of Acid Blue 92 (AB92) as a hazardous pollutant under UV light. The effect ofdifferent parameters such as catalyst concentration, initial dye concentration, pH, UVirradiation and amount of ZnO loaded on the nanocomposites have been examined on theyield and the rate of photocatalytic degradation process. The photodegradation results ofAB92 in aqueous medium under UV irradiation revealed that nanocomposite of ZnO andmordenite zeolite exhibit much higher photocatalytic activity than the other nanocom-posites and pure ZnO. It was found that the type of support plays an important role inphotocatalytic oxidation of AB92 and significantly improved the photocatalytic activity ofZnO. Chemical Oxygen Demand (COD) for dye solutions were examined at regularintervals and gave a good idea about mineralization of the dye.
& 2014 Elsevier Ltd. All rights reserved.
1. Introduction
Toxic wastewater effluents from textile and other dye-stuff industries contain a large variety of toxic residualorganic dyes [1–3]. Azo dyes are the largest group ofwidely used synthetic dyes and one of the major hazardsfor human health in dye wastewaters [4]. Acid Blue 92(AB92) arising from dyestuff industries is highly toxic andcomparatively more refractory to natural degradation. It isa monoazo dye bearing three sulfonic groups (Fig. 1(a)) [5].
All rights reserved.
x: þ98 21 22431661.x: þ98 21 66029165.),
This dye is used in huge quantities in Iran and produces alot of environmental problems. When AB92 solution isincorporated into the body, cleaved into aromatic aminesby liver enzymes and can cause various cancers in human.Therefore, the removing of AB92 dye from wastewaters ismore important [4]. The UV–vis absorption spectrum ofAB92 in aqueous medium is shown in Fig. 1(b). The peak atλ¼572 nm was used to monitor the dye concentration.
The elimination of hazardous dyes from textile waste-water effluents is vital for human being. In recentyears, heterogeneous metal oxide semiconductor assistedphotocatalysis has become an important area amongvarious Advanced Oxidation Processes (AOPs) for waste-water treatment [4–7]. ZnO is one of the most promisingphotocatalyst for degradation and complete mineralization
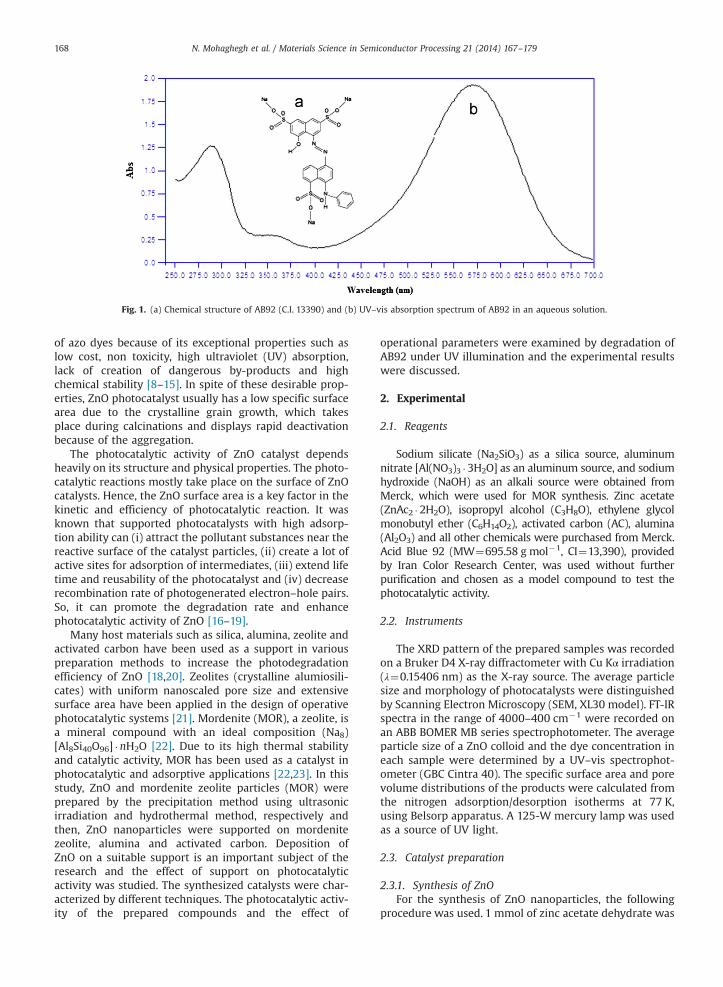
Fig. 1. (a) Chemical structure of AB92 (C.I. 13390) and (b) UV–vis absorption spectrum of AB92 in an aqueous solution.
N. Mohaghegh et al. / Materials Science in Semiconductor Processing 21 (2014) 167–179168
of azo dyes because of its exceptional properties such aslow cost, non toxicity, high ultraviolet (UV) absorption,lack of creation of dangerous by-products and highchemical stability [8–15]. In spite of these desirable prop-erties, ZnO photocatalyst usually has a low specific surfacearea due to the crystalline grain growth, which takesplace during calcinations and displays rapid deactivationbecause of the aggregation.
The photocatalytic activity of ZnO catalyst dependsheavily on its structure and physical properties. The photo-catalytic reactions mostly take place on the surface of ZnOcatalysts. Hence, the ZnO surface area is a key factor in thekinetic and efficiency of photocatalytic reaction. It wasknown that supported photocatalysts with high adsorp-tion ability can (i) attract the pollutant substances near thereactive surface of the catalyst particles, (ii) create a lot ofactive sites for adsorption of intermediates, (iii) extend lifetime and reusability of the photocatalyst and (iv) decreaserecombination rate of photogenerated electron–hole pairs.So, it can promote the degradation rate and enhancephotocatalytic activity of ZnO [16–19].
Many host materials such as silica, alumina, zeolite andactivated carbon have been used as a support in variouspreparation methods to increase the photodegradationefficiency of ZnO [18,20]. Zeolites (crystalline alumiosili-cates) with uniform nanoscaled pore size and extensivesurface area have been applied in the design of operativephotocatalytic systems [21]. Mordenite (MOR), a zeolite, isa mineral compound with an ideal composition (Na8)[Al8Si40O96] �nH2O [22]. Due to its high thermal stabilityand catalytic activity, MOR has been used as a catalyst inphotocatalytic and adsorptive applications [22,23]. In thisstudy, ZnO and mordenite zeolite particles (MOR) wereprepared by the precipitation method using ultrasonicirradiation and hydrothermal method, respectively andthen, ZnO nanoparticles were supported on mordenitezeolite, alumina and activated carbon. Deposition ofZnO on a suitable support is an important subject of theresearch and the effect of support on photocatalyticactivity was studied. The synthesized catalysts were char-acterized by different techniques. The photocatalytic activ-ity of the prepared compounds and the effect of
operational parameters were examined by degradation ofAB92 under UV illumination and the experimental resultswere discussed.
2. Experimental
2.1. Reagents
Sodium silicate (Na2SiO3) as a silica source, aluminumnitrate [Al(NO3)3 �3H2O] as an aluminum source, and sodiumhydroxide (NaOH) as an alkali source were obtained fromMerck, which were used for MOR synthesis. Zinc acetate(ZnAc2 �2H2O), isopropyl alcohol (C3H8O), ethylene glycolmonobutyl ether (C6H14O2), activated carbon (AC), alumina(Al2O3) and all other chemicals were purchased from Merck.Acid Blue 92 (MW¼695.58 g mol�1, CI¼13,390), providedby Iran Color Research Center, was used without furtherpurification and chosen as a model compound to test thephotocatalytic activity.
2.2. Instruments
The XRD pattern of the prepared samples was recordedon a Bruker D4 X-ray diffractometer with Cu Kα irradiation(λ¼0.15406 nm) as the X-ray source. The average particlesize and morphology of photocatalysts were distinguishedby Scanning Electron Microscopy (SEM, XL30 model). FT-IRspectra in the range of 4000–400 cm�1 were recorded onan ABB BOMER MB series spectrophotometer. The averageparticle size of a ZnO colloid and the dye concentration ineach sample were determined by a UV–vis spectrophot-ometer (GBC Cintra 40). The specific surface area and porevolume distributions of the products were calculated fromthe nitrogen adsorption/desorption isotherms at 77 K,using Belsorp apparatus. A 125-W mercury lamp was usedas a source of UV light.
2.3. Catalyst preparation
2.3.1. Synthesis of ZnOFor the synthesis of ZnO nanoparticles, the following
procedure was used. 1 mmol of zinc acetate dehydrate was

N. Mohaghegh et al. / Materials Science in Semiconductor Processing 21 (2014) 167–179 169
dissolved in isopropyl alcohol under vigorous stirring at45 1C. Then 1 g of ethylene glycol monobutyl ether wasadded to zinc acetate solution and sonicated for 30 min.A 0.2 M NaOH solution was prepared by adding sodiumhydroxide to the pure isopropyl alcohol solvent undervigorous stirring at 45 1C. After cooling, NaOH solutionwas slowly added dropwise into the zinc acetate solutionunder magnetic stirring at 40 1C in a water bath. The whiteprecipitate was collected by centrifugation, washed withethanol and double-distilled water several times, dried inoven at 80 1C and calcined at 450 1C for 3 h.
2.3.2. Synthesis of MORHydrothermal synthesis of nanocrystalline MOR zeolite
with a uniform particle size was performed accordingto the previous report [25]. The formation of MOR zeoliteinvolves a two step process. First, a gel containing silicaand aluminum species prepared by dissolving finely
Fig. 3. UV–vis absorption spectrum of the
Fig. 2. Schematic representation of the experimental set-up used forphotocatalytic experiments.
divided silica and aluminum in alkaline solution of 6 MNaOH. To obtain small particles and complete mixing ofthe gel, solution of the gel was magnetically stirred for 2 h.Second, the product was immediately transferred into thestainless steel pressure bomb with a Teflon liner underautogenous pressure and static conditions. After complet-ing the period of synthesis, the resulting solid product wascollected by filtration and repeatedly washed with double-distilled water until the pH of the resultant solution wasbelow 9. Finally, the obtained sample was dried at 100 1Cand calcinated at 550 1C for 8 h. The prepared zeolitedenoted MOR.
2.3.3. Synthesis of ZnO compositesThe ZnO supported catalysts were prepared by mixing
synthesized MOR zeolite with zinc acetate solution in2-propanol under vigorous stirring at room temperaturefor 14 h. After cooling, 0.2 M NaOH solution was slowlyadded dropwise into the prepared solution under mag-netic stirring at 40 1C in a water bath. After completing theperiod of synthesis, the white precipitate was separated bycentrifugation, repeatedly washed with double-distilledwater, dried at 80 1C and calcined at 450 1C for 3 h. Inanother similar experiment, activated carbon and aluminawere used as the supporting materials. The conditions forpreparing ZnO nanostructures in the presence of AC andalumina were the same as MOR.
2.4. Photocatalytic experiments
Photocatalytic reaction of AB92 was carried out in aPyrex reactor. The reactor was equipped with an UV lampand covered with aluminum foil followed by a black clothto prevent UV light leakage. This set-up of reactor wassurrounded by a circulating water jacket to maintainconstant temperature as demonstrated in Fig. 2. Solutionswith the desired dye concentration and catalyst were fedinto the reactor and pH was controlled with phosphatebuffer. Prior to irradiation, the suspension was magneti-cally stirred for 30 min in dark and then photocatalytic
ZnO colloids as a function of time.
N. Mohaghegh et al. / Materials Science in Semiconductor Processing 21 (2014) 167–179170
reaction was started. 2 mL of samples was withdrawn forUV–vis analysis at regular time intervals and centrifugedfor 10 min at the rate of 10,000 rpm. The dye concentra-tion in each degraded sample was determined spectro-photometrically at λ¼572 nm.
3. Results and discussion
3.1. Characterization of synthesized samples
3.1.1. UV–vis absorption spectrum of ZnOAs shown in Fig. 3, the UV–vis absorption spectrum of
ZnO demonstrates the absorption onset which is signifi-cantly blue-shifted compared to the absorption onset forzinc oxide in bulk at about 385 nm. This blue shift inabsorption spectrum is attributed to the quantum sizeeffect and shows that the average particle size is in thequantum regime [24]. It is obvious from Fig. 3 thatthe absorption peak of ZnO shifts to higher wavelength(red shift) with time which attributed to the increasing
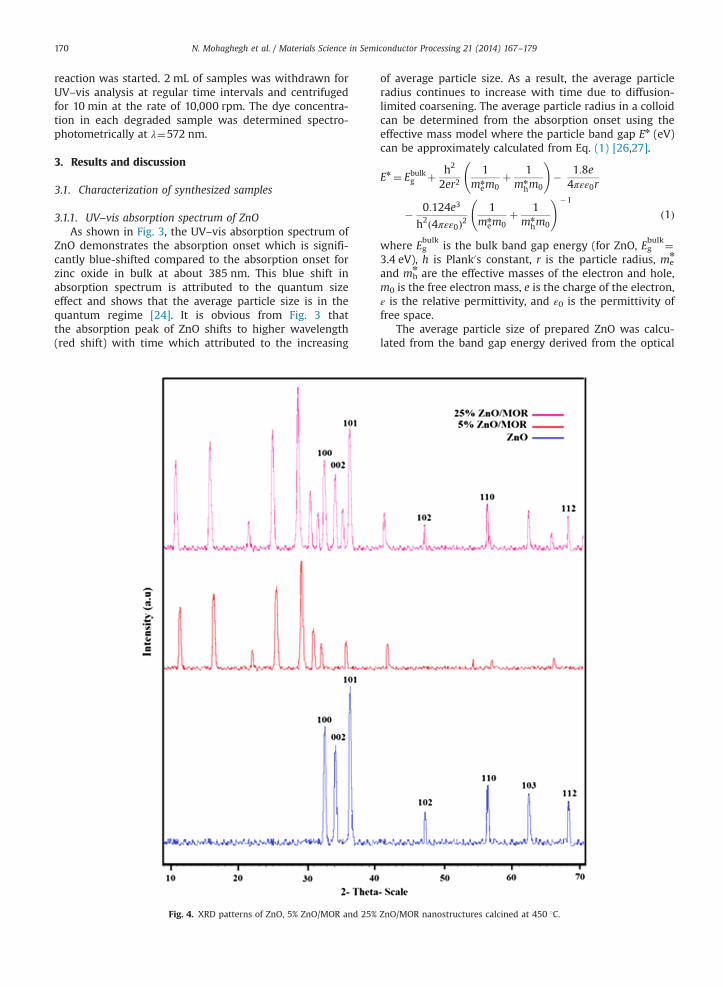
Fig. 4. XRD patterns of ZnO, 5% ZnO/MOR and 25%
of average particle size. As a result, the average particleradius continues to increase with time due to diffusion-limited coarsening. The average particle radius in a colloidcan be determined from the absorption onset using theeffective mass model where the particle band gap En (eV)can be approximately calculated from Eq. (1) [26,27].
En ¼ Ebulkg þ h2
2er21
mnem0
þ 1mn
hm0
!� 1:8e
4πεε0r
� 0:124e3
h2ð4πεε0Þ21
mnem0
þ 1mn
hm0
!�1
ð1Þ
where Egbulk
is the bulk band gap energy (for ZnO, Egbulk¼
3.4 eV), h is Plank0s constant, r is the particle radius, men
and mhnare the effective masses of the electron and hole,
m0 is the free electron mass, e is the charge of the electron,ε is the relative permittivity, and ε0 is the permittivity offree space.
The average particle size of prepared ZnO was calcu-lated from the band gap energy derived from the optical
ZnO/MOR nanostructures calcined at 450 1C.

Table 1Propertis of the samples.
Samples SBET (m2 g�1) Total porevolume (cm3 g�1)
ZnO 17.42 0.0430MOR 402.02 0.2129AC 500.0 0.2311Al2O3 373.7 0.15125% ZnO/MOR 384.4 0.189125% ZnO/MOR 314.6 0.176025% ZnO/AC 414.6 0.213125% ZnO/Al2O3 371.2 0.1472
Fig. 5. XRD pattern of MOR nanostructure.
N. Mohaghegh et al. / Materials Science in Semiconductor Processing 21 (2014) 167–179 171
absorption spectra using Eq. (2) and estimated to be4–6 nm [23]. En can be calculated from En ¼ hc=λ, whereλ is the absorption onset wavelength.
1243:1λ
¼ 3:2þ 8:37r2
� 0:61r
ð2Þ
3.1.2. XRD analysisThe XRD pattern of samples calcined at 450 1C are
demonstrated in Fig. 4. The reflection peaks in Fig. 4(a), canbe indexed to the known hexagonal wurtzite structure ofZnO with lattice constants of a¼b¼3.242 A1 and c¼5.205 A1(JCPDS89-1397). The diffraction peaks of pure ZnO areintense and narrow which reveals the highly crystallinecharacter of ZnO. The average crystalline size of the samplecalcined at 450 1C was calculated from half the width of thediffraction peaks using the Scherrer equation [28]. The meanparticle size for the crystallographic planes (101), (002) and(100) was calculated and estimated to be 30 nm.
The XRD patterns of 5% ZnO/MOR and 25% ZnO/MORare depicted in Fig. 4(b) and (c), respectively. In the XRDpattern of 5% ZnO/MOR, (Fig. 4(b)) no diffraction peakbelonging to the pure ZnO was observed. This suggeststhat either ZnO can be completely dispersed over the MORsurface or the amount of ZnO loaded on MOR is too slightto be detected by XRD. In Fig. 4(c), ZnO crystalline phasesare observed. It is interesting to note that the intensity ofthese peaks is almost as same as that of ZnO in Fig. 4(a).This indicates that by supporting ZnO on MOR surface nochange of crystalline order of ZnO has taken place and theframe structure is almost unchanged.
The XRD pattern of MOR is depicted in Fig. 5. The averagecrystallite size of the MOR powder was calculated andestimated to be 22 nm. The zeolitic phases were identifiedby comparing the diffraction peaks with the data reported inthe inorganic crystal structure database (ICSD) [25].
3.1.3. BET analysisAccording to Table 1, the surface area and total pore
volume of the samples were increased by the addition of
MOR and the other support materials to ZnO nanoparti-cles. This addition stabilizes textural structure; preventfrom the particle aggregation and the collapse of the porestructure, which reduce the loss of surface area of ZnOduring calcination. Since supports have high surface area,supported ZnO nanocomposites would have higher BETsurface area than pure ZnO nanoparticles.
3.1.4. SEM imagesSEM images of the prepared photocatalysts are shown in
Figs. 6 and 7. Two magnifications of ZnO/MOR are shown inFig. 6(b) and (c). Under the same calcination temperature(450 1C), the nanoparticle size of ZnO in ZnO/MOR is smallerthan pure ZnO (72 nm for 5% ZnO/MOR and 58 nm for 25%ZnO/MOR). The zinc precursor may interact with the defectsites on the MOR surface which led to the distribution of ZnOon the MOR surface. The SEM images also show that ZnOnanoparticles are distributed well on the surface of MOR.
The SEM images of 25% ZnO/AC and 25% ZnO/Al2O3
are shown in Fig. 7(a) and (b), respectively. A commoncharacteristic observed in two composites is a heterogeneousdispersion of ZnO nanoparticles on the surface of supports.
3.1.5. FT-IR spectroscopyFig. 8 shows the FT-IR spectrum of MOR. The peaks
around 420–500 cm�1 and 700–850 cm�1 and 1000–1150 cm�1 attributed to the asymmetric and symmetric
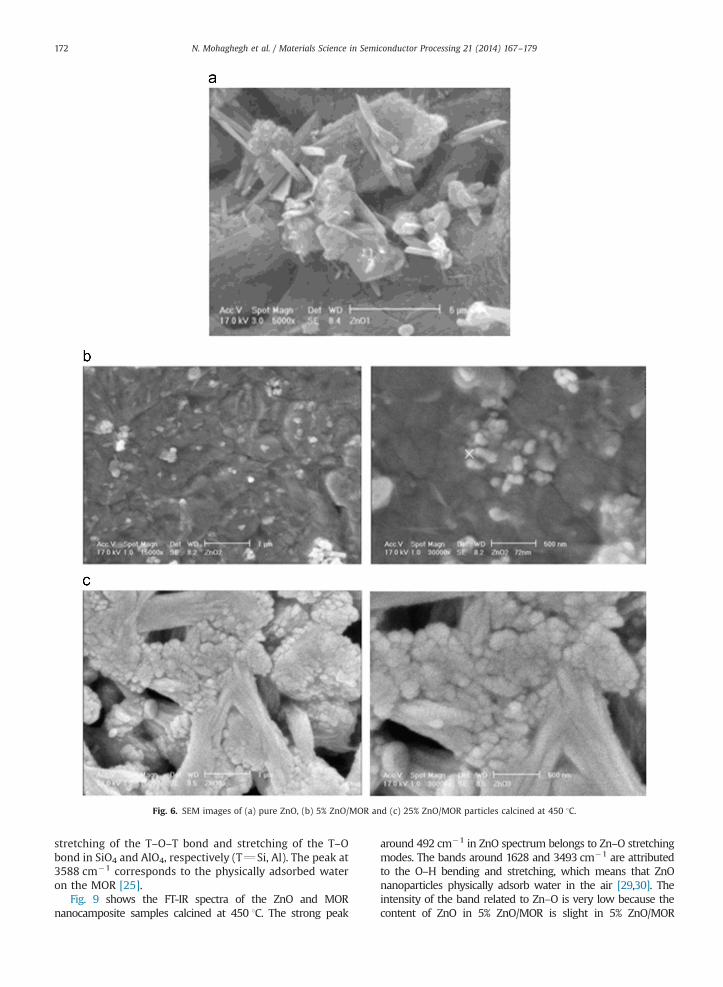
Fig. 6. SEM images of (a) pure ZnO, (b) 5% ZnO/MOR and (c) 25% ZnO/MOR particles calcined at 450 1C.
N. Mohaghegh et al. / Materials Science in Semiconductor Processing 21 (2014) 167–179172
stretching of the T–O–T bond and stretching of the T–Obond in SiO4 and AlO4, respectively (TQSi, Al). The peak at3588 cm�1 corresponds to the physically adsorbed wateron the MOR [25].
Fig. 9 shows the FT-IR spectra of the ZnO and MORnanocamposite samples calcined at 450 1C. The strong peak
around 492 cm�1 in ZnO spectrum belongs to Zn–O stretchingmodes. The bands around 1628 and 3493 cm�1 are attributedto the O–H bending and stretching, which means that ZnOnanoparticles physically adsorb water in the air [29,30]. Theintensity of the band related to Zn–O is very low because thecontent of ZnO in 5% ZnO/MOR is slight in 5% ZnO/MOR

Fig. 7. SEM images of (a) 25% ZnO/Al2O3 and (b) 25% ZnO/AC.
Fig. 8. FT-IR spectrum of pure MOR.
N. Mohaghegh et al. / Materials Science in Semiconductor Processing 21 (2014) 167–179 173
spectrum. In addition, the bending frequency of Zn–Omight beoverlapped with T–O stretching frequency (TQSi, Al), below500 cm�1, and therefore the overlap peaks are observed in thisregion. But, in 25% ZnO/MOR the Zn–O band around 490 cm�1
confirms the formation of ZnO.Fig. 10 shows the FT-IR spectra of the 25% ZnO/AC and
25% ZnO/Al2O3 composite samples calcined at 450 1C. Theintensity of the band related to Zn–O in 25% ZnO/ACspectrum is strong, which means that AC physicallyadsorbs ZnO and confirms the formation of ZnO. Thebands around 1585 cm�1 and 1000–1185 cm�1 are attrib-uted to CQC, C–O and C–C stretching in AC, respectively[31]. In Fig.10(b), the intensity of the band related to Zn–Ois very low, because the ZnO precursor may not properlyinteract with the defect sites on the Al2O3 surface.
3.2. Effect of different supports on the photocatalyticdegradation of AB92 of ZnO catalyst
The results of dye degradation over supported catalysts aredemonstrated in Fig. 11. It shows that the degradation of AB92
over 25% ZnO/MOR is higher than that over 25% ZnO/Al2O3
and 25% ZnO/AC. Degradation of AB92 over 25% ZnO/Al2O3 isthe lowest, which is only 48% of dye removal after 120 min. Inalkali media, Al2O3 could not achieve a high adsorption ofZnAc2 �2H2O. In addition, Al2O3 is not competent due to thepoor adsorption of AB92. Meanwhile, dye removal of 70% wasachieved using 25% ZnO/AC in the same time. On ZnO/ACsupported catalyst, both adsorption of AB92 by AC and itsphotodegradation by ZnO processes occur. Since the adsorp-tion process onto AC proceeds much faster than the degrada-tion by the photocatalysis, the AB92 removal is chiefly takenplace by the former process. So, in 25% ZnO/AC particles, ACparticles do not have any photoactivity for degradation andonly act as an adsorbent. Although 25% ZnO/AC particles couldachieve a high adsorption due to high surface area, lowerphotocatalysis than 25% ZnO/MOR was also observed due tothe poor coverage on ZnO to hinder the mass transfer of AB92[32–34]. When MOR was used as a support, the lower UVabsorption derived from loading could be compensated by itssuperior adsorption of dye and its intermediates. It wasknown that MOR has a unique structure [23]. MOR0s
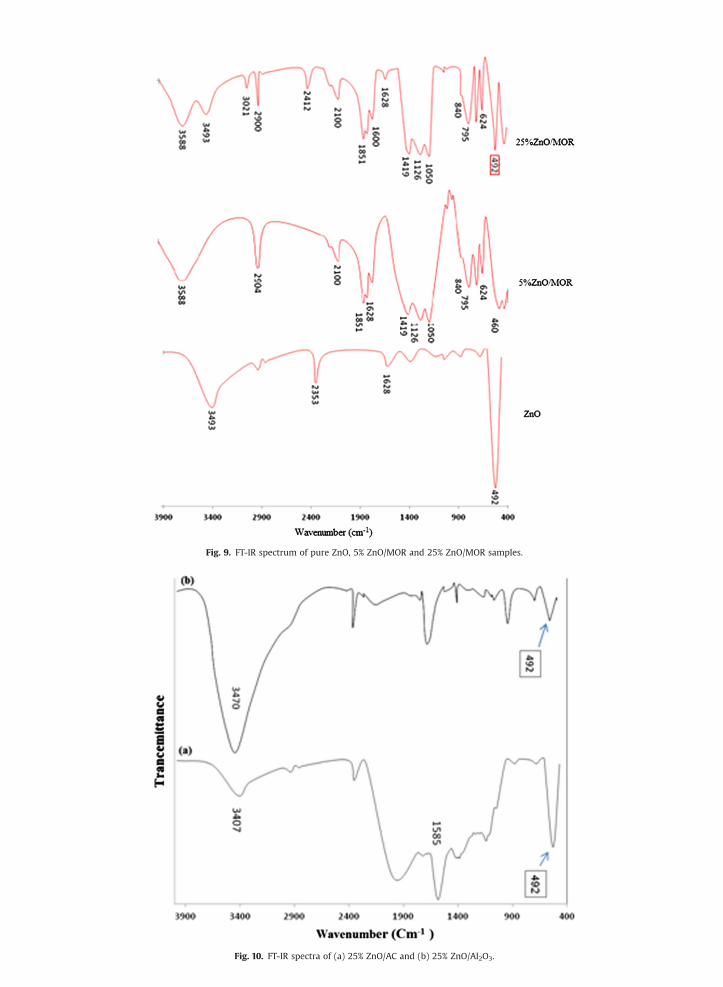
Fig. 9. FT-IR spectrum of pure ZnO, 5% ZnO/MOR and 25% ZnO/MOR samples.
Fig. 10. FT-IR spectra of (a) 25% ZnO/AC and (b) 25% ZnO/Al2O3.
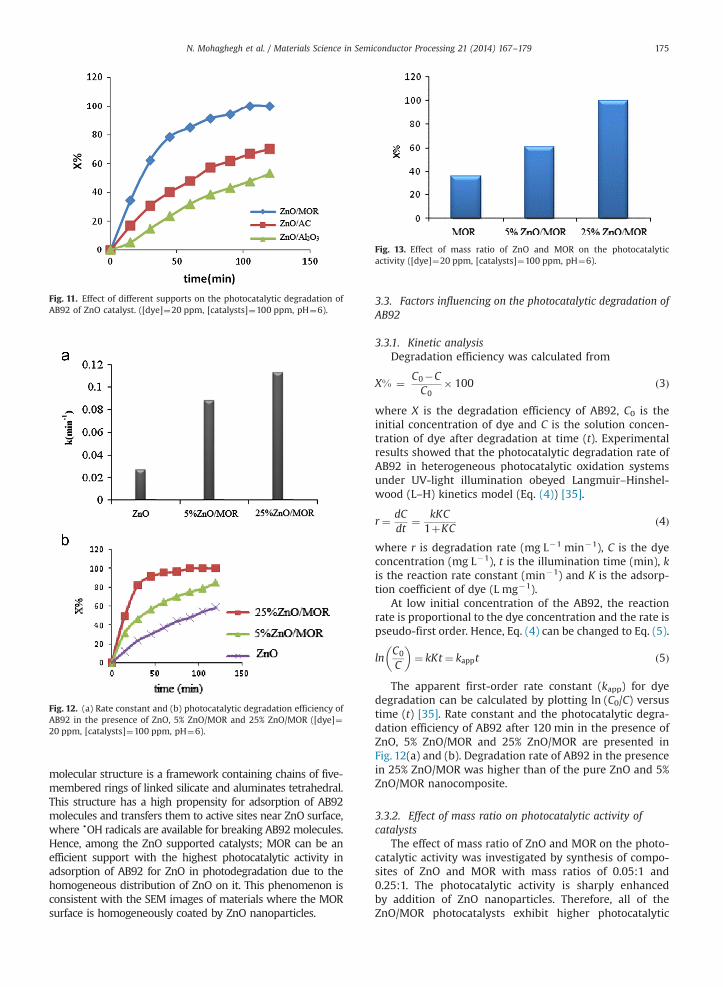
Fig. 11. Effect of different supports on the photocatalytic degradation ofAB92 of ZnO catalyst. ([dye]¼20 ppm, [catalysts]¼100 ppm, pH¼6).
Fig. 12. (a) Rate constant and (b) photocatalytic degradation efficiency ofAB92 in the presence of ZnO, 5% ZnO/MOR and 25% ZnO/MOR ([dye]¼20 ppm, [catalysts]¼100 ppm, pH¼6).
Fig. 13. Effect of mass ratio of ZnO and MOR on the photocatalyticactivity ([dye]¼20 ppm, [catalysts]¼100 ppm, pH¼6).
N. Mohaghegh et al. / Materials Science in Semiconductor Processing 21 (2014) 167–179 175
molecular structure is a framework containing chains of five-membered rings of linked silicate and aluminates tetrahedral.This structure has a high propensity for adsorption of AB92molecules and transfers them to active sites near ZnO surface,where dOH radicals are available for breaking AB92molecules.Hence, among the ZnO supported catalysts; MOR can be anefficient support with the highest photocatalytic activity inadsorption of AB92 for ZnO in photodegradation due to thehomogeneous distribution of ZnO on it. This phenomenon isconsistent with the SEM images of materials where the MORsurface is homogeneously coated by ZnO nanoparticles.
3.3. Factors influencing on the photocatalytic degradation ofAB92
3.3.1. Kinetic analysisDegradation efficiency was calculated from
X% ¼ C0�CC0
� 100 ð3Þ
where X is the degradation efficiency of AB92, C0 is theinitial concentration of dye and C is the solution concen-tration of dye after degradation at time (t). Experimentalresults showed that the photocatalytic degradation rate ofAB92 in heterogeneous photocatalytic oxidation systemsunder UV-light illumination obeyed Langmuir–Hinshel-wood (L–H) kinetics model (Eq. (4)) [35].
r¼ dCdt
¼ kKC1þKC
ð4Þ
where r is degradation rate (mg L�1 min�1), C is the dyeconcentration (mg L�1), t is the illumination time (min), kis the reaction rate constant (min�1) and K is the adsorp-tion coefficient of dye (L mg�1).
At low initial concentration of the AB92, the reactionrate is proportional to the dye concentration and the rate ispseudo-first order. Hence, Eq. (4) can be changed to Eq. (5).
lnC0
C
� �¼ kKt ¼ kappt ð5Þ
The apparent first-order rate constant (kapp) for dyedegradation can be calculated by plotting ln (C0/C) versustime (t) [35]. Rate constant and the photocatalytic degra-dation efficiency of AB92 after 120 min in the presence ofZnO, 5% ZnO/MOR and 25% ZnO/MOR are presented inFig. 12(a) and (b). Degradation rate of AB92 in the presencein 25% ZnO/MOR was higher than of the pure ZnO and 5%ZnO/MOR nanocomposite.
3.3.2. Effect of mass ratio on photocatalytic activity ofcatalysts
The effect of mass ratio of ZnO and MOR on the photo-catalytic activity was investigated by synthesis of compo-sites of ZnO and MOR with mass ratios of 0.05:1 and0.25:1. The photocatalytic activity is sharply enhancedby addition of ZnO nanoparticles. Therefore, all of theZnO/MOR photocatalysts exhibit higher photocatalytic
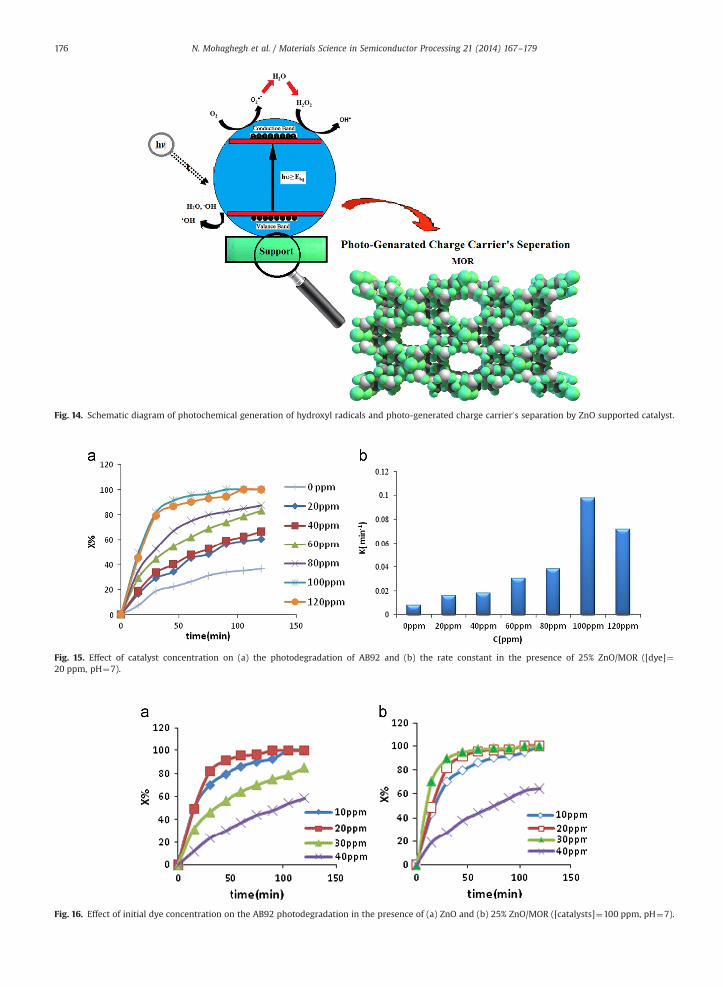
Fig. 14. Schematic diagram of photochemical generation of hydroxyl radicals and photo-generated charge carrier0s separation by ZnO supported catalyst.
Fig. 15. Effect of catalyst concentration on (a) the photodegradation of AB92 and (b) the rate constant in the presence of 25% ZnO/MOR ([dye]¼20 ppm, pH¼7).
Fig. 16. Effect of initial dye concentration on the AB92 photodegradation in the presence of (a) ZnO and (b) 25% ZnO/MOR ([catalysts]¼100 ppm, pH¼7).
N. Mohaghegh et al. / Materials Science in Semiconductor Processing 21 (2014) 167–179176
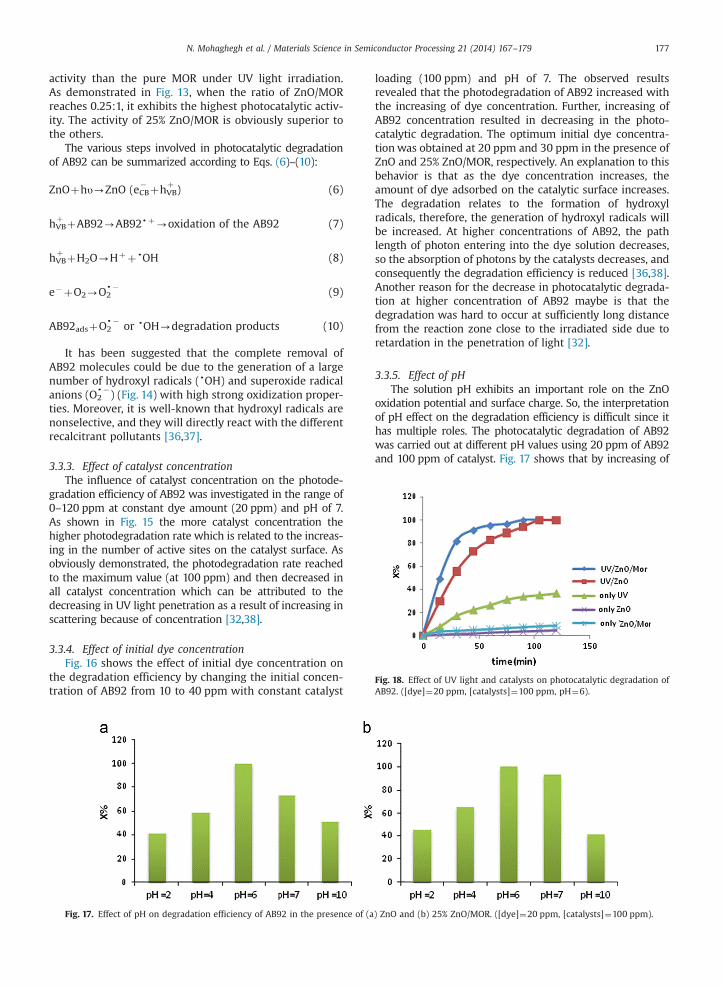
Fig. 18. Effect of UV light and catalysts on photocatalytic degradation ofAB92. ([dye]¼20 ppm, [catalysts]¼100 ppm, pH¼6).
N. Mohaghegh et al. / Materials Science in Semiconductor Processing 21 (2014) 167–179 177
activity than the pure MOR under UV light irradiation.As demonstrated in Fig. 13, when the ratio of ZnO/MORreaches 0.25:1, it exhibits the highest photocatalytic activ-ity. The activity of 25% ZnO/MOR is obviously superior tothe others.
The various steps involved in photocatalytic degradationof AB92 can be summarized according to Eqs. (6)–(10):
ZnOþhυ-ZnO (eCB� þhVB
þ) (6)
hVBþ þAB92-AB92dþ-oxidation of the AB92 (7)
hVBþ þH2O-HþþdOH (8)
e�þO2-O2d�
(9)
AB92adsþO2d�
or dOH-degradation products (10)
It has been suggested that the complete removal ofAB92 molecules could be due to the generation of a largenumber of hydroxyl radicals (dOH) and superoxide radicalanions (O2
d�) (Fig. 14) with high strong oxidization proper-
ties. Moreover, it is well-known that hydroxyl radicals arenonselective, and they will directly react with the differentrecalcitrant pollutants [36,37].
3.3.3. Effect of catalyst concentrationThe influence of catalyst concentration on the photode-
gradation efficiency of AB92 was investigated in the range of0–120 ppm at constant dye amount (20 ppm) and pH of 7.As shown in Fig. 15 the more catalyst concentration thehigher photodegradation rate which is related to the increas-ing in the number of active sites on the catalyst surface. Asobviously demonstrated, the photodegradation rate reachedto the maximum value (at 100 ppm) and then decreased inall catalyst concentration which can be attributed to thedecreasing in UV light penetration as a result of increasing inscattering because of concentration [32,38].
3.3.4. Effect of initial dye concentrationFig. 16 shows the effect of initial dye concentration on
the degradation efficiency by changing the initial concen-tration of AB92 from 10 to 40 ppm with constant catalyst
Fig. 17. Effect of pH on degradation efficiency of AB92 in the presence of (a
loading (100 ppm) and pH of 7. The observed resultsrevealed that the photodegradation of AB92 increased withthe increasing of dye concentration. Further, increasing ofAB92 concentration resulted in decreasing in the photo-catalytic degradation. The optimum initial dye concentra-tion was obtained at 20 ppm and 30 ppm in the presence ofZnO and 25% ZnO/MOR, respectively. An explanation to thisbehavior is that as the dye concentration increases, theamount of dye adsorbed on the catalytic surface increases.The degradation relates to the formation of hydroxylradicals, therefore, the generation of hydroxyl radicals willbe increased. At higher concentrations of AB92, the pathlength of photon entering into the dye solution decreases,so the absorption of photons by the catalysts decreases, andconsequently the degradation efficiency is reduced [36,38].Another reason for the decrease in photocatalytic degrada-tion at higher concentration of AB92 maybe is that thedegradation was hard to occur at sufficiently long distancefrom the reaction zone close to the irradiated side due toretardation in the penetration of light [32].
3.3.5. Effect of pHThe solution pH exhibits an important role on the ZnO
oxidation potential and surface charge. So, the interpretationof pH effect on the degradation efficiency is difficult since ithas multiple roles. The photocatalytic degradation of AB92was carried out at different pH values using 20 ppm of AB92and 100 ppm of catalyst. Fig. 17 shows that by increasing of
) ZnO and (b) 25% ZnO/MOR. ([dye]¼20 ppm, [catalysts]¼100 ppm).

Fig. 19. Absorption spectra of textile wastewater at different times of degradation. ([dye]¼20 ppm, [25%ZnO/MOR]¼100 ppm, pH¼6).
N. Mohaghegh et al. / Materials Science in Semiconductor Processing 21 (2014) 167–179178
pH, the degradation efficiency increases and reaches to thehighest value at pH 6.0 which can be attributed to the moreadsorption of AB92 on the catalyst surface. The surfacecharge of ZnO has a significant effect on the adsorption anddissociation of AB92. The zero point charge (zpc) of ZnO is9.070.3 [32]. Hence, the catalyst surface has positive chargebelow this pH and negative charge above this pH. As a result,at pH 6.0 as a maximum pH, catalyst surface has positivecharge. AB92 has pKa of 3.2 and for pH4pKa AB92 exists asits anion. Therefore, the optimum pH for efficient AB92removal occurs in the pHzpc4pH4pKa (dye) due to theanionic charge of AB92. This pH would promote the electro-static interaction between catalyst surface with positivecharge and AB92 as an anionic dye, resulting to the increas-ing of adsorption and photodegradation. The lower removalefficiency in high acidic pH may be related to the dissolutionof ZnO.
3.3.6. Effect of UV irradiation and catalyst particlesThe degradation yield by catalysts in the present and
the absence of UV light is demonstrated in Fig. 18. Thedegradation achieved by photolysis is also given forcomparison. As shown in Fig. 18 degradation by photolysiswas negligible and failed to treat resistant compounds.Finally, both UV light and photocatalysts are neededfor the effective degradation of AB92. Hence, the combina-tion of catalysis and UV light system is demonstrated to bean efficient process to remove organic pollutants fromwastewater.
3.3.7. Photocatalytic degradation of textile wastewaterIn order to evaluate the photocatalytic activity of 25%
ZnO/MOR, wastewater of textile industry was examinedand the absorbent spectrum is shown in Fig. 19. Notably,25% ZnO/MOR showed a decrease of absorption in allwavelengths, which displays the high activity of 25%ZnO/MOR nanocomposite.
3.3.8. Measurment of chemical oxygen demand (COD)COD is widely used as a useful technique to measure
the water quality. COD of the dye solution was evaluatedbefore and after the treatment. In this work the maximumdegradation efficiency was achieved by 25% ZnO/MOR(about 88%).
4. Conclusions
In conclusion, ZnO, MOR zeolite nanoparticles andZnO/MOR, ZnO/AC and ZnO/Al2O3 nanocompositeswere prepared and characterized by the various techni-ques. The results revealed that the insertion of ZnO ondifferent supports decreases the particle size, increasesthe surface area and reduces electron–hole recombi-nation rate in comparison to pure ZnO. Photocatalyticactivity of catalysts was investigated by degradation ofAB92 azo dye in water. 25% ZnO/MOR nanoparticlescalcined at 450 1C showed the highest photocatalyticactivity. The complete removal of AB92 model solutioncould be obtained in a relatively short time for 25%ZnO/MOR (as a catalyst with the highest photocatalyticactivity) in optimal condition. ZnO/MOR nanocompositesdemonstrate the significant increase in the AB92 photo-degradation compared to the other supported catalysts.Although, ZnO/MOR nanocomposites have less surfacearea than ZnO/AC, they have higher photocatalytic activ-ity. This phenomenon can be attributed to the morphol-ogy of ZnO/MOR with a unique framework that causesthe highest photocatalytic activity of ZnO/MOR nano-composites. Finally, the best catalyst, 25% ZnO/MOR,was used for photodegradation of textile wastewaterwhere a maximum of 88% degradation efficiency wasobserved in 2 h.
Acknowledgment
The authors are grateful to Dr. S. Rohani from Iran ColorResearch Center for providing dye sample (AB 92).

N. Mohaghegh et al. / Materials Science in Semiconductor Processing 21 (2014) 167–179 179
References
[1] A.R. Khataee, M.N. Pons, O. Zahraa, J. Hazard. Mater. 168 (2009)451–457.
[2] Y. Liu, G. Su, B. Zhang, G. Jiang, B. Yan, Analyst 136 (2011) 872–877.[3] A. Aguedach, S. Brosillon, J. Morvan, E.K. Lhadi, J. Hazard. Mater. 150
(2008) 250–256.[4] S. Ghasemi, S. Rahimnejad, S. Rahman Setayesh, S. Rohani,
M.R. Gholami, J. Hazard. Mater. 172 (2009) 1573–1578.[5] A. Szygu1a, E. Guibal, M.A. Palacin, M. Ruiz, A.M. Sastre, J. Environ.
Manage. 90 (2009) 2979–2986.[6] J.H. Sun, S.Y. Dong, Y.K. Wang, S.P. Sun, J. Hazard. Mater. 172 (2009)
1520–1526.[7] S. Wang, Dyes Pigm. 76 (2008) 714–720.[8] A.C. Cakir, S. Erten-Ela, Adv. Powder Technol. 23 (2012) 655–660.[9] J.Z. Kong, A. DongLi, X. YuLi, H. FaZhai, W. QiZhang, Y. PinGong,
Hui Li, Di Wu, J. Solid State Chem. 183 (2010) 1359–1364.[10] J.M. Herrmann, C. Duchamp, M. Karkmaz, B.T. Hoai, H. Lachheb,
E. Puzenat, C. Guillard, J. Hazard. Mater. 145 (2007) 624–629.[11] A.J. Abbas, K.H. Salih, H.H. Falah, E—J. Chem. 5 (2008) 219–223.[12] S.K. Kansal, M. Singh, D. Sud, J. Hazard. Mater. 141 (2007) 581–590.[13] K. Byrappa, A.K. Subramani, S. Anadada, K.M. Lokanatha Rai,
R. Dinesh, M. Yoshimura, Bull. Mater. Sci. 29 (2006) 433–443.[14] S. Erten-Ela, S. Cogal, G. Turkmen, S. Icli, Curr. Appl. Phys. 10 (2010)
187–192.[15] S. Erten-Ela, S. Cogal, S. Icli, Inorg. Chim. Acta 362 (2009) 1855–1858.[16] J. Chen, L. Eberlein, C.H. Langford, J. Photochem. Photobiol. A: Chem.
148 (2002) 183–189.[17] H. Sun, X. Feng, S. Wang, H. Ming Ang, Moses O. Tadé, Chem. Eng. J.
170 (2011) 270–277.[18] T.A. Saleh, M.A. Gondal, Q.A. Drmosh, Z.H. Yamani, A. AL-yamani,
Chem. Eng. J. 166 (2011) 407–412.[19] A. Akyol, M. Bayramoglu, J. Hazard. Mater. 180 (2010) 466–473.[20] H. Xia, F. Tang, J. Phys. Chem. B 107 (2003) 9175–9178.
[21] G. Zhu, S. Qiu, J. Yu, Y. Sakamoto, F. Xiao, R. Xu, O. Terasaki, Chem.Mater. 10 (1998) 1483–1486.
[22] Hisham M. Aly, Moustafa E. Moustafa, Ehab A. Abdelrahman, Adv.Powder Technol. 23 (2012) 757–760.
[23] K. Shiokawa, M. Ito, K. Itabashi, Zeolites 9 (1989) 170–176.[24] P.S. Hale, L.M. Maddox, J.G. Shapter, N.H. Voelcker, M.J. Ford,
E.R. Waclawik, J. Chem. Educ. 82 (2005) 775–778.[25] S. Pankaj, P. Rajaram, R. Tomar, J. Colloid Interface Sci. 325 (2008)
547–557.[26] E.K. Goharshadi, M. Abareshi, R. Mehrkhah, S. Samiee, M. Moosavi,
A. Youssefi, P. Nancarrow, Mater. Sci. Semicond. Process 14 (2011)69–72.
[27] Z. Hu, G. Oskam, P.C. Searson, J. Colloid Interface Sci. 263 (2003)454–460.
[28] E.K. Goharshadi, Y. Ding, M. Namayandeh Jorabchi, P. Nancarrow,Ultrason. Sonochem. 16 (2009) 120–123.
[29] S.B. Khan, M. Faisal, M.M. Rahman, A. Jamal, Talanta 85 (2011)943–949.
[30] S.K. Kansal, A.H. Ali, S. Kapoor, D.W. Bahnemann, Sep. Purif. Technol.80 (2011) 125–130.
[31] M.O. Marı´n, C.F. Gonza´lez, A.M. Garcı´a b, V.G. Serrano, Appl. Surf.Sci. 252 (2006) 5967–5971.
[32] N. Sobana, M. Swaminathan, Sol. Energy Mater. Sol. Cells 91 (2007)727–734.
[33] N. Sobana, M. Muruganandam, M. Swaminathan, Catal. Commun. 9(2008) 262–268.
[34] T.A. Saleh, M.A. Gondal, Q.A. Drmosh, Z.H. Yamani, A. AL-yamani,Chem. Eng. J. 166 (2011) 407–412.
[35] S. Ghasemi, S. Rahman Setayesh, A. Habibi-Yangjeh, M.R. Hormozi-Nezhad, M.R. Gholami, J. Hazard. Mater. 199 (200) (2012) 170–178.
[36] S. Anandan, A. Vinu, N. Venkatachalam, B. Arabindoo, V. Murugesan,J. Mol. Catal. A.: Chem. 256 (2006) 312–320.
[37] C. Pan, Y. Zhu, Environ. Sci. Technol. 44 (2010) 5570–5574.[38] M.A. Behnajady, N. Modirshahla, R. Hamzavi, J. Hazard. Mater. B 133
(2006) 226–232.