Phase Transition of a Disordered Nuage Protein Generates ...
Upload
independentCategory
view
3download
0
DOI: 10.1002/cbic.201402407
Generic Structures of Cytotoxic Liprotides: Nano-SizedComplexes with Oleic Acid Cores and Shells of DisorderedProteinsJørn D. Kaspersen,[a] Jannik N. Pedersen,[b] Jon G. Hansted,[b, f] Søren B. Nielsen,[b, g]
Srinivasan Sakthivel,[b] Kristina Wilhelm,[e, h] Ekaterina L. Nemashkalova,[c]
Sergei E. Permyakov,[c] Eugene A. Permyakov,[c] Cristiano Luis Pinto Oliveira,[d]
Ludmilla A. Morozova-Roche,[e] Daniel E. Otzen,*[b] and Jan Skov Pedersen*[a]
Introduction
a-Lactalbumin (aLA) has been shown to form cytotoxic com-plexes called HAMLETs (human a-lactalbumin made lethal totumour cells) with the common fatty acid oleic acid (OA);these complexes target cancer cells,[1] other mammalian cells,[2]
and even bacteria.[3] Cytotoxic HAMLET-like complexes may beprepared in different ways, all leading to partial denaturation.[4]
The cytotoxicity of the HAMLET complex might be caused bythe transfer of sparingly soluble OA to the cell membrane,[5]
thereby lowering membrane transition temperature and in-creasing flexibility,[6] though intracellular pathways might alsobe involved.[4b, 7] It is suggested that, at very low OA/aLA ratios,aLA unfolds in the C-terminal region, allowing it to bind OAand at the same time to access potential cellular binding part-
ners.[8] Other proteins can also form cytotoxic complexes withOA in vitro,[5b, 9] and other unsaturated acids may substituteOA,[10] with variable protein/lipid stoichiometries.[2a, 10a, 11] Insuch a complex the protein is usually in a dynamic, oligomer-ic[11, 12] and partially denatured conformation.
The key to understanding the protein–OA complexes’ fasci-nating properties is their structures, but they defy both crystal-lography and NMR. We therefore used small-angle X-ray scat-tering (SAXS) to investigate the structures of seven differentproteins in complexation with OA at neutral pH. SAXS provideslow-resolution structures of complexes in solutions on a nano-metre length scale without any need for special sample prepa-ration. A recent SAXS study of an aLA·OA complex prepared
The cytotoxic complex formed between a-lactalbumin andoleic acid (OA) has inspired many studies on protein–fatty acidcomplexes, but structural insight remains sparse. After havingused small-angle X-ray scattering (SAXS) to obtain structural in-formation, we present a new, generic structural model of cyto-toxic protein–oleic acid complexes, which we have termed li-protides (lipids and partially denatured proteins). Twelve lipro-
tides formed from seven structurally unrelated proteins andprepared by different procedures all displayed core–shell struc-tures, each with a micellar OA core and a shell consisting offlexible, partially unfolded protein, which stabilizes the OA mi-celle. The common structure explains similar effects exerted oncells by different liprotides and is consistent with a cargo off-loading of the OA into cell membranes.
[a] Dr. J. D. Kaspersen, Prof. Dr. J. S. PedersenDepartment of Chemistry and Interdisciplinary Nanoscience Center (iNANO)Aarhus UniversityGustav Wieds Vej 14, 8000 Aarhus C (Denmark)E-mail : [email protected]
[b] J. N. Pedersen, Dr. J. G. Hansted, Dr. S. B. Nielsen, S. Sakthivel,Prof. Dr. D. E. OtzenInterdisciplinary Nanoscience Center (iNANO)Department of Molecular Biology and GeneticsCenter for Insoluble Protein Structures (inSPIN), Aarhus UniversityGustav Wieds Vej 14, 8000 Aarhus C (Denmark)E-mail : [email protected]
[c] Dr. E. L. Nemashkalova, Prof. Dr. S. E. Permyakov, Prof. Dr. E. A. PermyakovInstitute for Biological Instrumentation of the Russian Academy of Sciencesand Pushchino State Institute of Natural SciencesPushchino, Moscow region, 142290 (Russia)
[d] Prof. Dr. C. L. Pinto OliveiraDepartment of Experimental Physics, University of Sao Paulo66318, S¼o Paulo, 05314-970 (Brazil)
[e] Dr. K. Wilhelm, Prof. Dr. L. A. Morozova-RocheDepartment of Medical Biochemistry and Biophysics, Ume� UniversityLinnaeus v�g 10, 901 87 Ume� (Sweden)
[f] Dr. J. G. HanstedPresent address: Dupont, Nutrition and HealthEdwin Rahrs Vej 38, 8220 Brabrand (Denmark)
[g] Dr. S. B. NielsenPresent address: Arla Foods, R&D Nr. ViumSønderupvej 26, 6920 Videbæk (Denmark)
[h] Dr. K. WilhelmPresent address: University of Tennessee Health Science Center (Physiology)201 NASH Research Building, Department of Physiology, Memphis, TN38163 (USA)
Supporting information for this article is available on the WWW underhttp ://dx.doi.org/10.1002/cbic.201402407: materials and methods includingpreparation of liprotide complexes, size exclusion chromatography, determi-nation of stoichiometries, haemolysis assays, CD and fluorescence andSAXS measurements and analysis. Results include SAXS analysis of oleicacid, CD analysis of liprotides and other spectroscopic and haemolyticproperties of liprotides formed by Ova, BSA and IgG.
� 2014 Wiley-VCH Verlag GmbH & Co. KGaA, Weinheim ChemBioChem 0000, 00, 1 – 11 &1&
These are not the final page numbers! ��
CHEMBIOCHEMFULL PAPERS
(and maintained) at pH 12 highlighted an extended conforma-tion of aLA in this complex, but did not derive a specificmodel for the distribution of OA and protein in the complex.[13]
On the basis of our SAXS results, in the present study we hy-pothesize that protein–OA complexes, whether found in vivoor constructed artificially, are a generic class that we term lipro-tides, which have a general structure based on a micellar OAcore and a shell consisting of flexible, partially unfolded pro-teins surrounding the OA micelle.
Results
The self-assembled structures of pure OA depend on pH
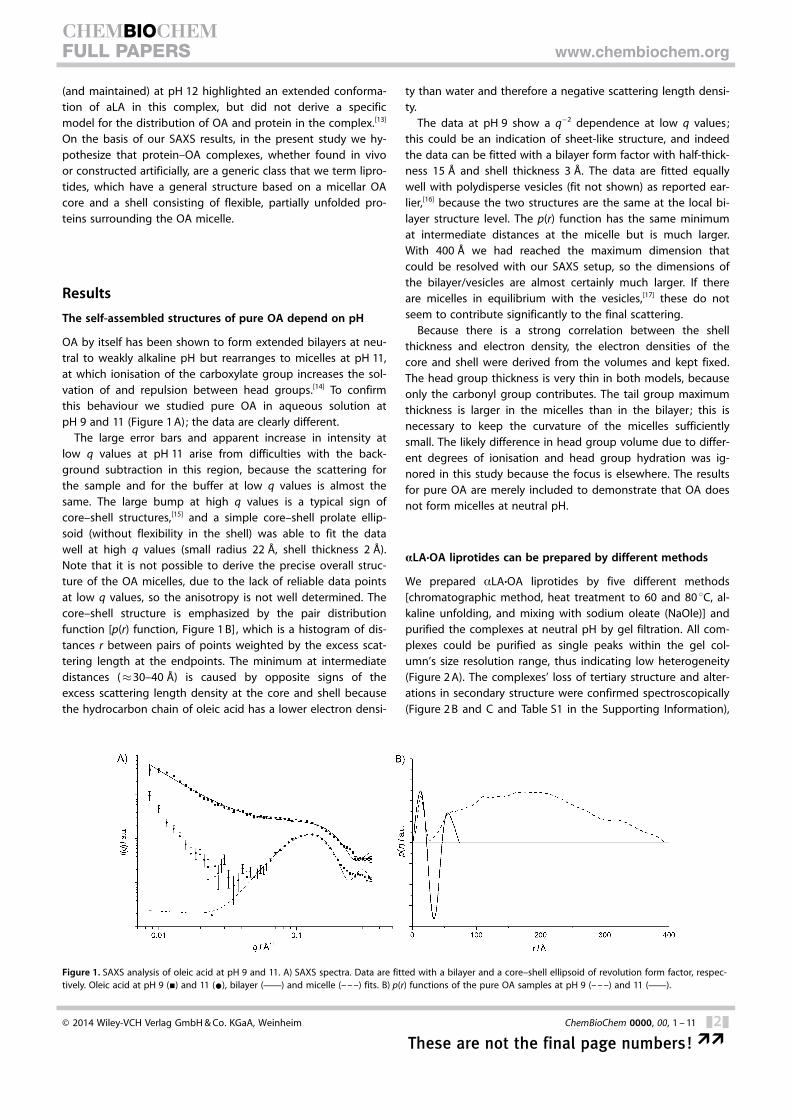
OA by itself has been shown to form extended bilayers at neu-tral to weakly alkaline pH but rearranges to micelles at pH 11,at which ionisation of the carboxylate group increases the sol-vation of and repulsion between head groups.[14] To confirmthis behaviour we studied pure OA in aqueous solution atpH 9 and 11 (Figure 1 A); the data are clearly different.
The large error bars and apparent increase in intensity atlow q values at pH 11 arise from difficulties with the back-ground subtraction in this region, because the scattering forthe sample and for the buffer at low q values is almost thesame. The large bump at high q values is a typical sign ofcore–shell structures,[15] and a simple core–shell prolate ellip-soid (without flexibility in the shell) was able to fit the datawell at high q values (small radius 22 �, shell thickness 2 �).Note that it is not possible to derive the precise overall struc-ture of the OA micelles, due to the lack of reliable data pointsat low q values, so the anisotropy is not well determined. Thecore–shell structure is emphasized by the pair distributionfunction [p(r) function, Figure 1 B], which is a histogram of dis-tances r between pairs of points weighted by the excess scat-tering length at the endpoints. The minimum at intermediatedistances (�30–40 �) is caused by opposite signs of theexcess scattering length density at the core and shell becausethe hydrocarbon chain of oleic acid has a lower electron densi-
ty than water and therefore a negative scattering length densi-ty.
The data at pH 9 show a q�2 dependence at low q values;this could be an indication of sheet-like structure, and indeedthe data can be fitted with a bilayer form factor with half-thick-ness 15 � and shell thickness 3 �. The data are fitted equallywell with polydisperse vesicles (fit not shown) as reported ear-lier,[16] because the two structures are the same at the local bi-layer structure level. The p(r) function has the same minimumat intermediate distances at the micelle but is much larger.With 400 � we had reached the maximum dimension thatcould be resolved with our SAXS setup, so the dimensions ofthe bilayer/vesicles are almost certainly much larger. If thereare micelles in equilibrium with the vesicles,[17] these do notseem to contribute significantly to the final scattering.
Because there is a strong correlation between the shellthickness and electron density, the electron densities of thecore and shell were derived from the volumes and kept fixed.The head group thickness is very thin in both models, becauseonly the carbonyl group contributes. The tail group maximumthickness is larger in the micelles than in the bilayer ; this isnecessary to keep the curvature of the micelles sufficientlysmall. The likely difference in head group volume due to differ-ent degrees of ionisation and head group hydration was ig-nored in this study because the focus is elsewhere. The resultsfor pure OA are merely included to demonstrate that OA doesnot form micelles at neutral pH.
aLA·OA liprotides can be prepared by different methods
We prepared aLA·OA liprotides by five different methods[chromatographic method, heat treatment to 60 and 80 8C, al-kaline unfolding, and mixing with sodium oleate (NaOle)] andpurified the complexes at neutral pH by gel filtration. All com-plexes could be purified as single peaks within the gel col-umn’s size resolution range, thus indicating low heterogeneity(Figure 2 A). The complexes’ loss of tertiary structure and alter-ations in secondary structure were confirmed spectroscopically(Figure 2 B and C and Table S1 in the Supporting Information),
Figure 1. SAXS analysis of oleic acid at pH 9 and 11. A) SAXS spectra. Data are fitted with a bilayer and a core–shell ellipsoid of revolution form factor, respec-tively. Oleic acid at pH 9 (&) and 11 (*), bilayer (c) and micelle (– – –) fits. B) p(r) functions of the pure OA samples at pH 9 (– – –) and 11 (c).
� 2014 Wiley-VCH Verlag GmbH & Co. KGaA, Weinheim ChemBioChem 0000, 00, 1 – 11 &2&
These are not the final page numbers! ��
CHEMBIOCHEMFULL PAPERS www.chembiochem.org
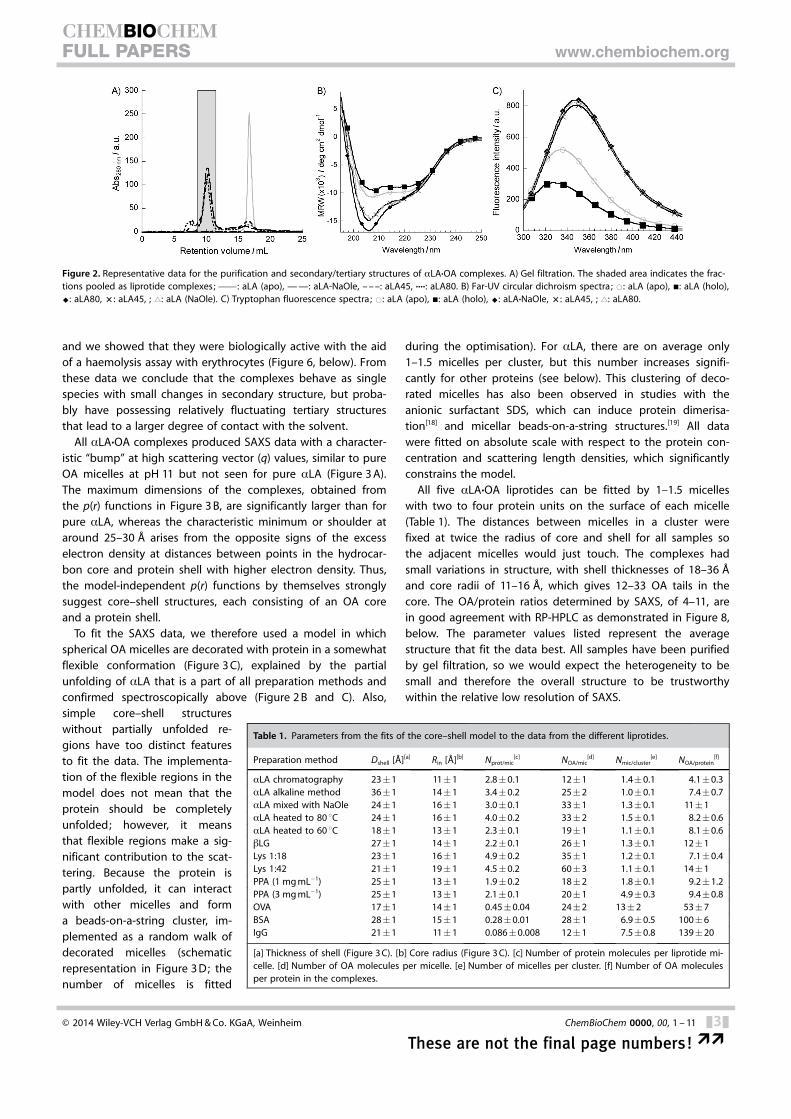
and we showed that they were biologically active with the aidof a haemolysis assay with erythrocytes (Figure 6, below). Fromthese data we conclude that the complexes behave as singlespecies with small changes in secondary structure, but proba-bly have possessing relatively fluctuating tertiary structuresthat lead to a larger degree of contact with the solvent.
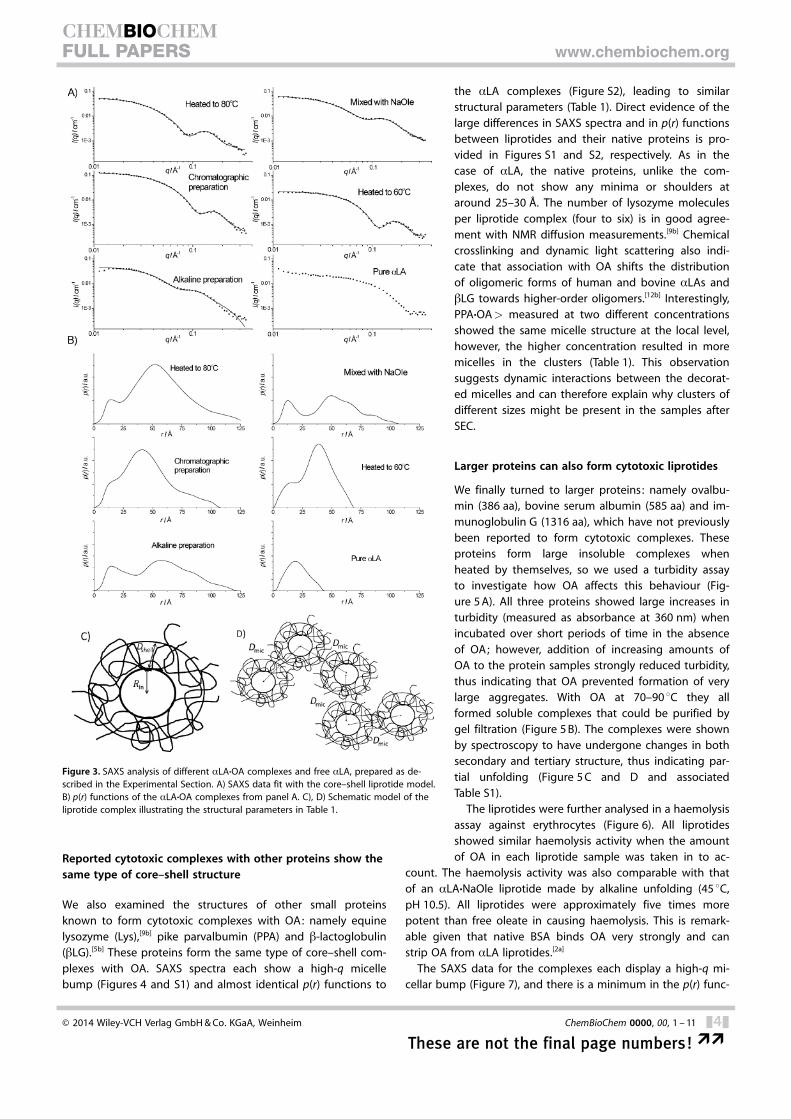
All aLA·OA complexes produced SAXS data with a character-istic “bump” at high scattering vector (q) values, similar to pureOA micelles at pH 11 but not seen for pure aLA (Figure 3 A).The maximum dimensions of the complexes, obtained fromthe p(r) functions in Figure 3 B, are significantly larger than forpure aLA, whereas the characteristic minimum or shoulder ataround 25–30 � arises from the opposite signs of the excesselectron density at distances between points in the hydrocar-bon core and protein shell with higher electron density. Thus,the model-independent p(r) functions by themselves stronglysuggest core–shell structures, each consisting of an OA coreand a protein shell.
To fit the SAXS data, we therefore used a model in whichspherical OA micelles are decorated with protein in a somewhatflexible conformation (Figure 3 C), explained by the partialunfolding of aLA that is a part of all preparation methods andconfirmed spectroscopically above (Figure 2 B and C). Also,simple core–shell structureswithout partially unfolded re-gions have too distinct featuresto fit the data. The implementa-tion of the flexible regions in themodel does not mean that theprotein should be completelyunfolded; however, it meansthat flexible regions make a sig-nificant contribution to the scat-tering. Because the protein ispartly unfolded, it can interactwith other micelles and forma beads-on-a-string cluster, im-plemented as a random walk ofdecorated micelles (schematicrepresentation in Figure 3 D; thenumber of micelles is fitted
during the optimisation). For aLA, there are on average only1–1.5 micelles per cluster, but this number increases signifi-cantly for other proteins (see below). This clustering of deco-rated micelles has also been observed in studies with theanionic surfactant SDS, which can induce protein dimerisa-tion[18] and micellar beads-on-a-string structures.[19] All datawere fitted on absolute scale with respect to the protein con-centration and scattering length densities, which significantlyconstrains the model.
All five aLA·OA liprotides can be fitted by 1–1.5 micelleswith two to four protein units on the surface of each micelle(Table 1). The distances between micelles in a cluster werefixed at twice the radius of core and shell for all samples sothe adjacent micelles would just touch. The complexes hadsmall variations in structure, with shell thicknesses of 18–36 �and core radii of 11–16 �, which gives 12–33 OA tails in thecore. The OA/protein ratios determined by SAXS, of 4–11, arein good agreement with RP-HPLC as demonstrated in Figure 8,below. The parameter values listed represent the averagestructure that fit the data best. All samples have been purifiedby gel filtration, so we would expect the heterogeneity to besmall and therefore the overall structure to be trustworthywithin the relative low resolution of SAXS.
Table 1. Parameters from the fits of the core–shell model to the data from the different liprotides.
Preparation method Dshell [�][a] Rin [�][b] Nprot/mic[c] NOA/mic
[d] Nmic/cluster[e] NOA/protein
[f]
aLA chromatography 23�1 11�1 2.8�0.1 12�1 1.4�0.1 4.1�0.3aLA alkaline method 36�1 14�1 3.4�0.2 25�2 1.0�0.1 7.4�0.7aLA mixed with NaOle 24�1 16�1 3.0�0.1 33�1 1.3�0.1 11�1aLA heated to 80 8C 24�1 16�1 4.0�0.2 33�2 1.5�0.1 8.2�0.6aLA heated to 60 8C 18�1 13�1 2.3�0.1 19�1 1.1�0.1 8.1�0.6bLG 27�1 14�1 2.2�0.1 26�1 1.3�0.1 12�1Lys 1:18 23�1 16�1 4.9�0.2 35�1 1.2�0.1 7.1�0.4Lys 1:42 21�1 19�1 4.5�0.2 60�3 1.1�0.1 14�1PPA (1 mg mL�1) 25�1 13�1 1.9�0.2 18�2 1.8�0.1 9.2�1.2PPA (3 mg mL�1) 25�1 13�1 2.1�0.1 20�1 4.9�0.3 9.4�0.8OVA 17�1 14�1 0.45�0.04 24�2 13�2 53�7BSA 28�1 15�1 0.28�0.01 28�1 6.9�0.5 100�6IgG 21�1 11�1 0.086�0.008 12�1 7.5�0.8 139�20
[a] Thickness of shell (Figure 3 C). [b] Core radius (Figure 3 C). [c] Number of protein molecules per liprotide mi-celle. [d] Number of OA molecules per micelle. [e] Number of micelles per cluster. [f] Number of OA moleculesper protein in the complexes.
Figure 2. Representative data for the purification and secondary/tertiary structures of aLA·OA complexes. A) Gel filtration. The shaded area indicates the frac-tions pooled as liprotide complexes; c : aLA (apo), — —: aLA-NaOle, – – –: aLA45, ····: aLA80. B) Far-UV circular dichroism spectra; *: aLA (apo), &: aLA (holo),^: aLA80, � : aLA45, ; ~: aLA (NaOle). C) Tryptophan fluorescence spectra; *: aLA (apo), &: aLA (holo), ^: aLA·NaOle, � : aLA45, ; ~: aLA80.
� 2014 Wiley-VCH Verlag GmbH & Co. KGaA, Weinheim ChemBioChem 0000, 00, 1 – 11 &3&
These are not the final page numbers! ��
CHEMBIOCHEMFULL PAPERS www.chembiochem.org
Reported cytotoxic complexes with other proteins show thesame type of core–shell structure
We also examined the structures of other small proteinsknown to form cytotoxic complexes with OA: namely equinelysozyme (Lys),[9b] pike parvalbumin (PPA) and b-lactoglobulin(bLG).[5b] These proteins form the same type of core–shell com-plexes with OA. SAXS spectra each show a high-q micellebump (Figures 4 and S1) and almost identical p(r) functions to
the aLA complexes (Figure S2), leading to similarstructural parameters (Table 1). Direct evidence of thelarge differences in SAXS spectra and in p(r) functionsbetween liprotides and their native proteins is pro-vided in Figures S1 and S2, respectively. As in thecase of aLA, the native proteins, unlike the com-plexes, do not show any minima or shoulders ataround 25–30 �. The number of lysozyme moleculesper liprotide complex (four to six) is in good agree-ment with NMR diffusion measurements.[9b] Chemicalcrosslinking and dynamic light scattering also indi-cate that association with OA shifts the distributionof oligomeric forms of human and bovine aLAs andbLG towards higher-order oligomers.[12b] Interestingly,PPA·OA> measured at two different concentrationsshowed the same micelle structure at the local level,however, the higher concentration resulted in moremicelles in the clusters (Table 1). This observationsuggests dynamic interactions between the decorat-ed micelles and can therefore explain why clusters ofdifferent sizes might be present in the samples afterSEC.
Larger proteins can also form cytotoxic liprotides
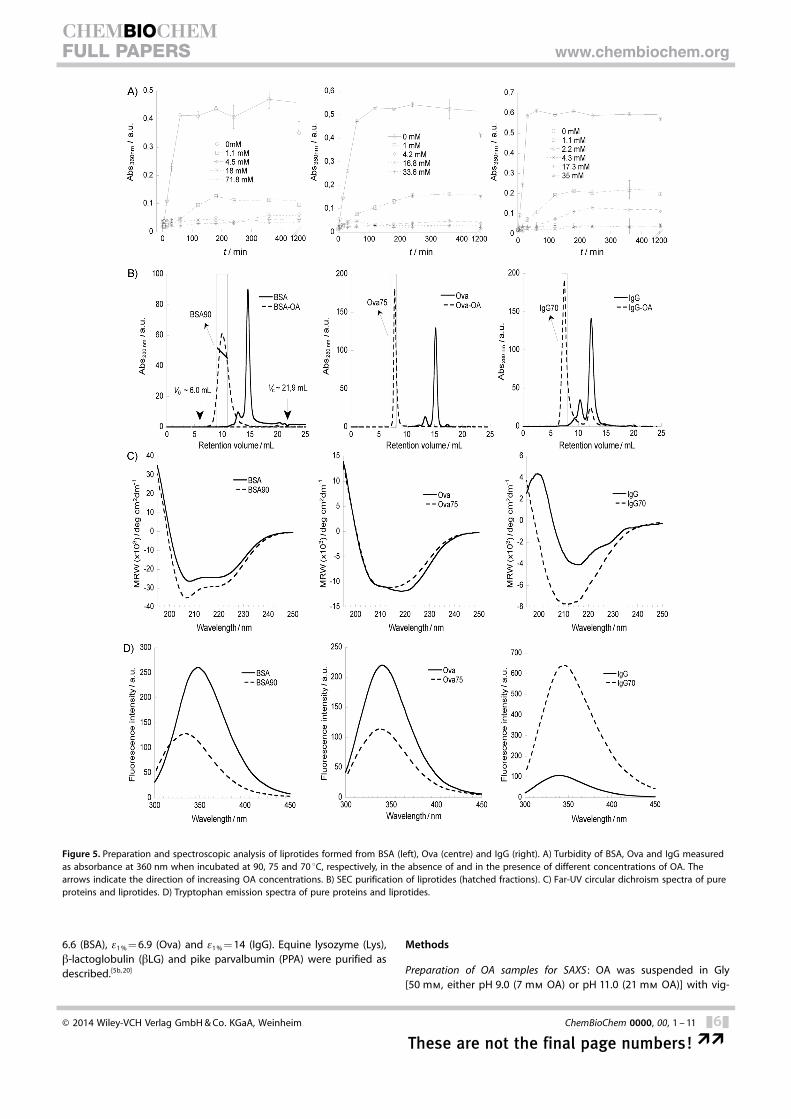
We finally turned to larger proteins: namely ovalbu-min (386 aa), bovine serum albumin (585 aa) and im-munoglobulin G (1316 aa), which have not previouslybeen reported to form cytotoxic complexes. Theseproteins form large insoluble complexes whenheated by themselves, so we used a turbidity assayto investigate how OA affects this behaviour (Fig-ure 5 A). All three proteins showed large increases inturbidity (measured as absorbance at 360 nm) whenincubated over short periods of time in the absenceof OA; however, addition of increasing amounts ofOA to the protein samples strongly reduced turbidity,thus indicating that OA prevented formation of verylarge aggregates. With OA at 70–90 8C they allformed soluble complexes that could be purified bygel filtration (Figure 5 B). The complexes were shownby spectroscopy to have undergone changes in bothsecondary and tertiary structure, thus indicating par-tial unfolding (Figure 5 C and D and associatedTable S1).
The liprotides were further analysed in a haemolysisassay against erythrocytes (Figure 6). All liprotidesshowed similar haemolysis activity when the amountof OA in each liprotide sample was taken in to ac-
count. The haemolysis activity was also comparable with thatof an aLA·NaOle liprotide made by alkaline unfolding (45 8C,pH 10.5). All liprotides were approximately five times morepotent than free oleate in causing haemolysis. This is remark-able given that native BSA binds OA very strongly and canstrip OA from aLA liprotides.[2a]
The SAXS data for the complexes each display a high-q mi-cellar bump (Figure 7), and there is a minimum in the p(r) func-
Figure 3. SAXS analysis of different aLA·OA complexes and free aLA, prepared as de-scribed in the Experimental Section. A) SAXS data fit with the core–shell liprotide model.B) p(r) functions of the aLA·OA complexes from panel A. C), D) Schematic model of theliprotide complex illustrating the structural parameters in Table 1.
� 2014 Wiley-VCH Verlag GmbH & Co. KGaA, Weinheim ChemBioChem 0000, 00, 1 – 11 &4&
These are not the final page numbers! ��
CHEMBIOCHEMFULL PAPERS www.chembiochem.org

tions around 25 � (Figure S2 B), indicating local core–shellstructure. And indeed, our model is able to fit the data quitewell, as can be seen in Figure 7. Interestingly, the resulting OA/protein ratios derived from the fits for the larger complexeswere remarkably close to the values obtained by RP-HPLC forIgG and OVA, whereas the value for BSA was a little off butwithin the trend (Figure 8). Note that the lack of a clear Guinierregion in the SAXS data for the Ova·OA and IgG·OA complexesdue to their large size (Figure 7) makes it impossible to deter-mine their overall dimensions (e.g. , the number of decoratedmicelles, and thus number of proteins, per cluster). However,local micelle structures, and hence the OA/protein ratios, arewell determined. In the Ova·OA complexes the distance wasslightly larger than expected (84 �), whereas for BSA·OA it wassmaller (41 �), indicating closer interactions of the proteinshells (but no overlapping of the OA cores). This is possible be-cause the shells are very dilute.
Discussion
Our data demonstrate that it is possible to produce generictypes of protein–lipid complexes (liprotides) from a wide rangeof structurally unrelated proteins in vitro. We suggest thattheir ease of preparation and common functionality, despitetheir diverse compositions, stem from their common and rela-tively fluid structures, in which protein in a dynamic conforma-tion wraps around an OA core. There is in general quite goodagreement between the secondary structure content estimat-ed from the PDB files and the CD measurements for the nativeproteins (Table S1), thus indicating that it is mostly fluctuationin the tertiary structure that gives the contribution of flexibleregions to the scattering. The shell thickness is large enoughto include regions of organized secondary structure. The OAmicelle is not formed in isolation at neutral pH, at which mostacid head groups are protonated and have a small head grouparea, but the protein shell stabilizes the micelle by positioningitself at the interface, increasing effective head group size andshell thickness. Variations in size can arise from variations in
the levels and availability of hydrophobic, polar and electro-static binding regions of the protein. Several of the complexeshave been prepared more than once and have provided similarSAXS data.
Liprotides formed by heating show a linear relationship be-tween protein size and lipid/protein stoichiometry as deter-mined by RP-HPLC, and also indicated by our SAXS results(Figure 8). This correspondence suggests a generic binding re-lationship. A partially denatured protein is an ideal complexingpartner for OA because it combines conformational versatilityand surface accessibility with contiguous hydrophobic regions.The derived structure might be a blueprint for other com-plexes involving proteins and self-assembling molecules andthus represents a new class of protein-stabilized complexes.
Although liprotides are not likely to be widespread in vivo,they might have important applications. Their generic struc-ture immediately suggests a means for efficient transfer of OAto membranes: upon associating with a hydrophobic regionsuch as the membrane, the protein complexes rearrange andopen up to release their micellar OA content. Transfer is facili-tated by the proteins’ partial denaturation and the reversibilityof OA binding. The protein thus acts as an efficient solubilisingcontainer for OA and transports it to a suitable place where itscargo is off-loaded.[11] Our model opens an avenue to designcytotoxic liprotides with other fatty acids or other hydrophobicmolecules.[10c] If they share the same generic core–shell struc-ture, they are likely to have a similar mechanism of cytotoxicity.
Conclusion
We have used small-angle X-ray scattering to study a range ofdifferent proteins in complexation with oleic acid and preparedby different methods. The model-independent information inreal space [p(r) functions, obtained from the SAXS data] fromall complexes strongly suggests core–shell structures with OAin the core and protein in the shell. In accordance with this,we were able to fit all SAXS data with such a model, with OAin the core and protein situated in the shell in a dilute, ratherflexible conformation. The loss of tertiary structure and changein secondary structure was confirmed by spectroscopic meth-ods, and the protein/OA ratio obtained from the model corre-sponds nicely to the results from RP-HPLC. We term these simi-lar complexes liprotides and suggest that their cell-killingmechanism can be explained by cargo off-loading, in whichthe proteins function as carriers that release OA into the cellmembrane.
Experimental Section
Materials : Ca2 +-depleted a-lactalbumin (apo; aLA, �85 % pure)and Ca2 +-containing aLA (holo), bovine serum albumin (BSA,A3912, �96 % pure), immunoglobulin G (IgG, �95 % pure), ovalbu-min (Ova, �98 % pure), oleic acid (OA, 99 % pure) and sodiumoleate (NaOle, �95 % pure) were from Sigma. Bovine blood wascollected from a slaughterhouse. Protein powders were suspendedin and extensively dialysed against Milli-Q water at 4 8C. Proteinconcentrations were determined with use of e1 % = 20.1 (aLA), e1 % =
Figure 4. SAXS data for liprotides containing Lys, bLG or PPA in complexa-tion with OA and fitted with the core–shell model. Lys·OA complexes wereprepared at two different Lys/OA ratios.
� 2014 Wiley-VCH Verlag GmbH & Co. KGaA, Weinheim ChemBioChem 0000, 00, 1 – 11 &5&
These are not the final page numbers! ��
CHEMBIOCHEMFULL PAPERS www.chembiochem.org
6.6 (BSA), e1 % = 6.9 (Ova) and e1 % = 14 (IgG). Equine lysozyme (Lys),b-lactoglobulin (bLG) and pike parvalbumin (PPA) were purified asdescribed.[5b, 20]
Methods
Preparation of OA samples for SAXS : OA was suspended in Gly[50 mm, either pH 9.0 (7 mm OA) or pH 11.0 (21 mm OA)] with vig-
Figure 5. Preparation and spectroscopic analysis of liprotides formed from BSA (left), Ova (centre) and IgG (right). A) Turbidity of BSA, Ova and IgG measuredas absorbance at 360 nm when incubated at 90, 75 and 70 8C, respectively, in the absence of and in the presence of different concentrations of OA. Thearrows indicate the direction of increasing OA concentrations. B) SEC purification of liprotides (hatched fractions). C) Far-UV circular dichroism spectra of pureproteins and liprotides. D) Tryptophan emission spectra of pure proteins and liprotides.
� 2014 Wiley-VCH Verlag GmbH & Co. KGaA, Weinheim ChemBioChem 0000, 00, 1 – 11 &6&
These are not the final page numbers! ��
CHEMBIOCHEMFULL PAPERS www.chembiochem.org

orous vortexing and equilibrated for an hour before SAXS meas-urements.
Chromatographic preparation of liprotides : This is the original chro-matographic method to prepare HAMLET complexes, in which theCa2 + cofactor is removed from aLA by use of the chelator EDTA,after which the apo-protein is passed over an anion exchangecolumn conditioned with OA and eluted by a salt gradient as de-scribed.[4a] Lys·OA complexes were prepared in a similar fashion.For the Lys·OA complexes, this led to protein/oleic acid ratios of
1:18 (14.2 kDa, 3.33 mg mL�1) and 1:42 (0.69 mg mL�1), as deter-mined by NMR spectroscopy.[11]
aLA·OA liprotides heated to 60 8C : An aliquot corresponding toa 1:100 aLA/OA molar ratio was prepared in glycine [pH 9.0,50 mm, protein concentration 1 mg mL�1, NaCl (150 mm), EDTA(2.5 mm)] . The sample was incubated at 60 8C for 15 min in a glassvial sealed with a screw cap in an oil bath, followed by purificationby size-exclusion chromatography (SEC) and subsequent analysisby SAXS (1.05 mg mL�1 protein).
aLA·OA liprotides heated to 80 8C (aLA80): OA was dissolved in etha-nol (71 mg mL�1, w/v). An aliquot corresponding to a 1:90 aLA/OAmolar ratio was prepared [protein concentration 2 mg mL�1,NaHPO4 (pH 7.4, 50 mm), NaCl (150 mm), EDTA (2.5 mm)] . Thesample was incubated at 80 8C for 120 min in an Eppendorf blockheater (SBH130DC, Stuart). After thermal treatment the sample wascooled to 20 8C before SEC, purification (to 1.07 mg mL�1) and anal-ysis by SAXS.
aLA mixed with NaOle (aLA·NaOle): NaOle (38 mg mL�1, w/v) wasdissolved in ethanol (20 %). An aliquot corresponding to a 1:50aLA/NaOle molar ratio was prepared [protein concentration2 mg mL�1, NaHPO4 (pH 7.4, 50 mm), NaCl (150 mm), EDTA(2.5 mm)] . The sample was kept at room temperature before SEC,purification (to 2.17 mg mL�1) and analysis by SAXS.
aLA alkaline unfolding with OA (aLA45): OA (71 mg mL�1, w/v) wasdissolved in ethanol. An aliquot corresponding to a 1:90 aLA/OAmolar ratio was prepared [protein concentration 2 mg mL�1, KOH(pH 10.5, 10 mm), EDTA (2.5 mm)] . The sample was incubated at45 8C for 15 min in an Eppendorf block heater. After alkaline treat-ment the sample was allowed to cool to 20 8C, and Tris (50 mm)was added to give a final pH of 7.4 before SEC, purification (to1.67 mg mL�1) and analysis by SAXS.
Alkaline preparation of liprotides with bLG and PPA : The bLG·OAand PPA·OA complexes were prepared as described in ref. [5b], byalkaline treatment at 45 8C followed by acidification to remove un-bound OA. Samples were dissolved in NaCl (50 mm) and sodiumphosphate (10 mm), giving the following concentrations for SAXSanalysis: PPA (12.0 kDa, 1.0 and 3.0 mg mL�1) and b-LG (18.4 kDa,2.9 mg mL�1).
Figure 6. Haemolysis. NaOle assays with liprotides formed with aLA (madeby mixing aLA with NaOle at room temperature), BSA, Ova and IgG. Data forfree NaOle included for comparison. OA concentrations determined by RP-HPLC. *: NaOle, &: BSA·OA, ^: Ova·OA, � : IgG·OA, j : aLA·NaOle.
Figure 7. SAXS data for the liprotides from the larger proteins OVA, IgG andBSA and the fits by the proposed model.
Figure 8. The OA/protein stoichiometries determined by RP-HPLC (*) for li-protide complexes formed by heating aLA, Ova, BSA or IgG in the presenceof OA show a linear relationship (R2 = 0.96) between the OA/protein molarratio and the protein molecular weight. The ratios obtained from SAXS (*)match the RP-HPLC data extremely well.
� 2014 Wiley-VCH Verlag GmbH & Co. KGaA, Weinheim ChemBioChem 0000, 00, 1 – 11 &7&
These are not the final page numbers! ��
CHEMBIOCHEMFULL PAPERS www.chembiochem.org
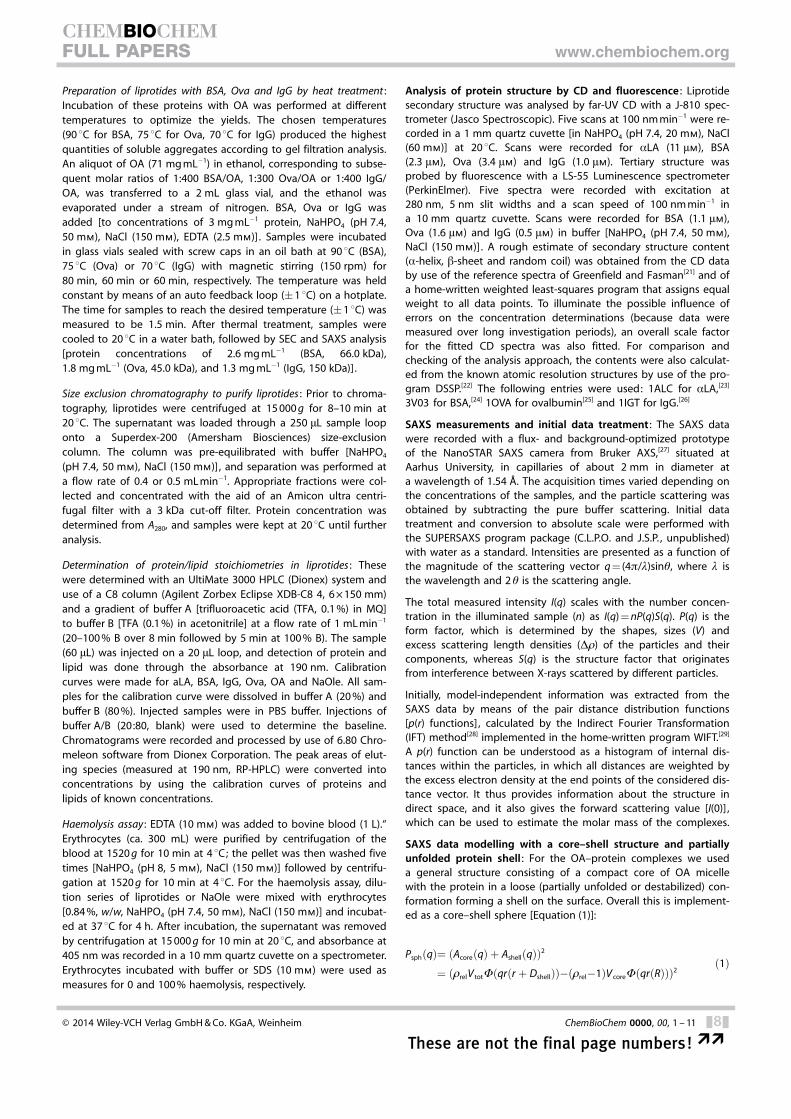
Preparation of liprotides with BSA, Ova and IgG by heat treatment :Incubation of these proteins with OA was performed at differenttemperatures to optimize the yields. The chosen temperatures(90 8C for BSA, 75 8C for Ova, 70 8C for IgG) produced the highestquantities of soluble aggregates according to gel filtration analysis.An aliquot of OA (71 mg mL�1) in ethanol, corresponding to subse-quent molar ratios of 1:400 BSA/OA, 1:300 Ova/OA or 1:400 IgG/OA, was transferred to a 2 mL glass vial, and the ethanol wasevaporated under a stream of nitrogen. BSA, Ova or IgG wasadded [to concentrations of 3 mg mL�1 protein, NaHPO4 (pH 7.4,50 mm), NaCl (150 mm), EDTA (2.5 mm)] . Samples were incubatedin glass vials sealed with screw caps in an oil bath at 90 8C (BSA),75 8C (Ova) or 70 8C (IgG) with magnetic stirring (150 rpm) for80 min, 60 min or 60 min, respectively. The temperature was heldconstant by means of an auto feedback loop (�1 8C) on a hotplate.The time for samples to reach the desired temperature (�1 8C) wasmeasured to be 1.5 min. After thermal treatment, samples werecooled to 20 8C in a water bath, followed by SEC and SAXS analysis[protein concentrations of 2.6 mg mL�1 (BSA, 66.0 kDa),1.8 mg mL�1 (Ova, 45.0 kDa), and 1.3 mg mL�1 (IgG, 150 kDa)].
Size exclusion chromatography to purify liprotides : Prior to chroma-tography, liprotides were centrifuged at 15 000 g for 8–10 min at20 8C. The supernatant was loaded through a 250 mL sample looponto a Superdex-200 (Amersham Biosciences) size-exclusioncolumn. The column was pre-equilibrated with buffer [NaHPO4
(pH 7.4, 50 mm), NaCl (150 mm)] , and separation was performed ata flow rate of 0.4 or 0.5 mL min�1. Appropriate fractions were col-lected and concentrated with the aid of an Amicon ultra centri-fugal filter with a 3 kDa cut-off filter. Protein concentration wasdetermined from A280, and samples were kept at 20 8C until furtheranalysis.
Determination of protein/lipid stoichiometries in liprotides : Thesewere determined with an UltiMate 3000 HPLC (Dionex) system anduse of a C8 column (Agilent Zorbex Eclipse XDB-C8 4, 6 � 150 mm)and a gradient of buffer A [trifluoroacetic acid (TFA, 0.1 %) in MQ]to buffer B [TFA (0.1 %) in acetonitrile] at a flow rate of 1 mL min�1
(20–100 % B over 8 min followed by 5 min at 100 % B). The sample(60 mL) was injected on a 20 mL loop, and detection of protein andlipid was done through the absorbance at 190 nm. Calibrationcurves were made for aLA, BSA, IgG, Ova, OA and NaOle. All sam-ples for the calibration curve were dissolved in buffer A (20 %) andbuffer B (80 %). Injected samples were in PBS buffer. Injections ofbuffer A/B (20:80, blank) were used to determine the baseline.Chromatograms were recorded and processed by use of 6.80 Chro-meleon software from Dionex Corporation. The peak areas of elut-ing species (measured at 190 nm, RP-HPLC) were converted intoconcentrations by using the calibration curves of proteins andlipids of known concentrations.
Haemolysis assay : EDTA (10 mm) was added to bovine blood (1 L).“Erythrocytes (ca. 300 mL) were purified by centrifugation of theblood at 1520 g for 10 min at 4 8C; the pellet was then washed fivetimes [NaHPO4 (pH 8, 5 mm), NaCl (150 mm)] followed by centrifu-gation at 1520 g for 10 min at 4 8C. For the haemolysis assay, dilu-tion series of liprotides or NaOle were mixed with erythrocytes[0.84 %, w/w, NaHPO4 (pH 7.4, 50 mm), NaCl (150 mm)] and incubat-ed at 37 8C for 4 h. After incubation, the supernatant was removedby centrifugation at 15 000 g for 10 min at 20 8C, and absorbance at405 nm was recorded in a 10 mm quartz cuvette on a spectrometer.Erythrocytes incubated with buffer or SDS (10 mm) were used asmeasures for 0 and 100 % haemolysis, respectively.
Analysis of protein structure by CD and fluorescence : Liprotidesecondary structure was analysed by far-UV CD with a J-810 spec-trometer (Jasco Spectroscopic). Five scans at 100 nm min�1 were re-corded in a 1 mm quartz cuvette [in NaHPO4 (pH 7.4, 20 mm), NaCl(60 mm)] at 20 8C. Scans were recorded for aLA (11 mm), BSA(2.3 mm), Ova (3.4 mm) and IgG (1.0 mm). Tertiary structure wasprobed by fluorescence with a LS-55 Luminescence spectrometer(PerkinElmer). Five spectra were recorded with excitation at280 nm, 5 nm slit widths and a scan speed of 100 nm min�1 ina 10 mm quartz cuvette. Scans were recorded for BSA (1.1 mm),Ova (1.6 mm) and IgG (0.5 mm) in buffer [NaHPO4 (pH 7.4, 50 mm),NaCl (150 mm)] . A rough estimate of secondary structure content(a-helix, b-sheet and random coil) was obtained from the CD databy use of the reference spectra of Greenfield and Fasman[21] and ofa home-written weighted least-squares program that assigns equalweight to all data points. To illuminate the possible influence oferrors on the concentration determinations (because data weremeasured over long investigation periods), an overall scale factorfor the fitted CD spectra was also fitted. For comparison andchecking of the analysis approach, the contents were also calculat-ed from the known atomic resolution structures by use of the pro-gram DSSP.[22] The following entries were used: 1ALC for aLA,[23]
3V03 for BSA,[24] 1OVA for ovalbumin[25] and 1IGT for IgG.[26]
SAXS measurements and initial data treatment : The SAXS datawere recorded with a flux- and background-optimized prototypeof the NanoSTAR SAXS camera from Bruker AXS,[27] situated atAarhus University, in capillaries of about 2 mm in diameter ata wavelength of 1.54 �. The acquisition times varied depending onthe concentrations of the samples, and the particle scattering wasobtained by subtracting the pure buffer scattering. Initial datatreatment and conversion to absolute scale were performed withthe SUPERSAXS program package (C.L.P.O. and J.S.P. , unpublished)with water as a standard. Intensities are presented as a function ofthe magnitude of the scattering vector q = (4p/l)sinq, where l isthe wavelength and 2 q is the scattering angle.
The total measured intensity I(q) scales with the number concen-tration in the illuminated sample (n) as I(q) = nP(q)S(q). P(q) is theform factor, which is determined by the shapes, sizes (V) andexcess scattering length densities (D1) of the particles and theircomponents, whereas S(q) is the structure factor that originatesfrom interference between X-rays scattered by different particles.
Initially, model-independent information was extracted from theSAXS data by means of the pair distance distribution functions[p(r) functions], calculated by the Indirect Fourier Transformation(IFT) method[28] implemented in the home-written program WIFT.[29]
A p(r) function can be understood as a histogram of internal dis-tances within the particles, in which all distances are weighted bythe excess electron density at the end points of the considered dis-tance vector. It thus provides information about the structure indirect space, and it also gives the forward scattering value [I(0)] ,which can be used to estimate the molar mass of the complexes.
SAXS data modelling with a core–shell structure and partiallyunfolded protein shell : For the OA–protein complexes we useda general structure consisting of a compact core of OA micellewith the protein in a loose (partially unfolded or destabilized) con-formation forming a shell on the surface. Overall this is implement-ed as a core–shell sphere [Equation (1)]:
PsphðqÞ¼ ðAcoreðqÞ þ AshellðqÞÞ2
¼ ð1relV totFðqrðr þ DshellÞÞ�ð1rel�1ÞV coreFðqrðRÞÞÞ2ð1Þ
� 2014 Wiley-VCH Verlag GmbH & Co. KGaA, Weinheim ChemBioChem 0000, 00, 1 – 11 &8&
These are not the final page numbers! ��
CHEMBIOCHEMFULL PAPERS www.chembiochem.org
which includes the sphere form factor [Eq. (2)]:
FðqrÞ ¼ 3½sinðqrÞ�qr cosðqrÞ�ðqrÞ3 ð2Þ
and Acore(q) and Ashell(q) are scattering amplitudes, R is the radius ofthe core, and Dshell is shell thickness. Vtot and Vcore are the volumesof core plus shell and only core, respectively. The excess scatteringlength density is set to unity for the core, and the head groupexcess scattering length density is taken relative to that of the coreas prel. This approach fits the data on an arbitrary scale, and the ab-solute scale was exploited in the scaling. The interfaces are madediffuse by multiplying by the factor exp(�s2q2/2), where s is thewidth of the Gaussian distribution used to smear the interface. Thesmearing of the inner interface was kept constant at 1 � in all fitsin order to decrease the number of fitting parameters and to keepthe solutions physically reasonable. The outer interface was ex-pressed as a function of the shell thickness and fixed at Dshell/4. Atthis value of sout the interface of the shell starts at around Dshell/2.
Because the proteins had been partly denatured in the liprotidecomplexes and the core–shell sphere was too simple to describethe scattering completely, especially at high q values, we intro-duced flexible or unstructured regions by describing the internalstructure of the corona as random coils obeying Gaussian statis-tics.[30] The form factor can thus be written as [Eq. (3)]:
PðqÞ ¼ PsphðqÞ þðPGðqÞ�AshellðqÞ2Þ
Nð3Þ
which includes both coil–coil and coil–core interference effects. Ncorresponds to the number of random coils in the shell and is in-cluded in the fitting as a scale factor. PG(q) is the random coil formfactor, as calculated by Debye[31] [Eq. (4)]:
PGðqÞ ¼2½expð�uÞ þ u�1�
u2ð4Þ
where u = hR2giq2 and hR2
gi is the mean of the squared radius of gy-ration. Rg was fixed as half the shell thickness to keep the solutionsmeaningful.
Modelling beads-on-a-string cluster (random walk of decoratedmicelles): It had been observed earlier that the protein a-synucleindenatured by the surfactant sodium dodecylsulfate forms a beads-on-a-string cluster of individual micelles connected to each otherby the denatured protein.[19] We have used the same expressionfor points on a random flight, as originally calculated by Burchardand Kajiwara[32] [Eq. (5)]:
SclusterðqÞ ¼2
1�x�1� 2ð1�xNmic Þ
Nmicð1�xÞ2 x ð5Þ
where x = [sin(qDmic)]/qDshell, Nmic is the number of micelles in thecluster, and Dmic is the distance between the micelles. For all sam-ples except the Ova·OA and BSA·OA complexes this distance wasfixed at twice the radius of core and shell, so the adjacent micelleswould just touch. When the number of micelles per cluster is notan integer, it is fitted as a linear combination of the two nearestintegers. The cluster factor is normalized to SN(0) = Nmic and wasapplied as described by Pedersen[33] to provide the expression forthe intensity [Eq. (6)]:
IðqÞ ¼ PðqÞ þ PsphðqÞðSðqÞ�1Þ ð6Þ
which, including the form factor from above, gives [Eq. (7)]
IðqÞ ¼ 1NðPG�AshellðqÞ2Þ þ PsphðqÞ SðqÞ ð7Þ
In order to respect information about the protein concentrationand thereby fit the data on absolute scale, the scaling factor wasimplemented as [Eq. (8)]:
Scale factor ¼ cp
Nprot=micr2
eðVpD1e,p þ NOAðVhD1e,h þ VOAD1e,OAÞÞ2 ð8Þ
where cp is the protein number concentration (molecules pervolume), Nprot/mic is the number of proteins per complex, re is theThomson radius, NOA is the number of OA molecules in each com-plex, and VOA, Vh, D1e,OA and D1e,h are the volumes and excess elec-tron densities of the OA tail and head group, respectively. Likewise,D1e,p is the protein excess electron density, and Vp is the volume ofthe protein in the shell, which is calculated as [Eq. (9)]
Vp ¼VS1relD1e,OA�NOAVhD1e,h
D1e,pð9Þ
where VS is the shell volume. The shell is constituted by protein,OA head groups (taken as the carboxyl group) and solvent. Thenumber of proteins per micelle comes from the volume of proteinin the shell and the volume of one protein, calculated from theprotein partial specific volume.[34] The excess electron density ofthe protein is calculated from the protein volume and meannumber of electrons[34] in the protein. For the volume of the wholeOA molecule a value of 520 �3 was used, and for the tail volume480 �3 was used.[35]
Pure oleic acid micelle modelling : The OA micelles at pH 11 weremodelled with a core–shell ellipsoid of revolution with the formfactor, as determined by Guinier[36] [Eq. (10)]:
PellðqÞ ¼Zp=2
0
½D1shellV totFðqrðRþ Dshell,eshell,�ÞÞ
�ðD1shell�D1coreÞVcoreFðqrðR,e,�ÞÞ�2sin�d�
ð10Þ
(Most of the parameters are defined above.) The radius of the corewith axes (R, R, eR) is given as r(R,e,f) = R(sin2f+e2cos2f)1/2, wheref is the angle between the scattering vector and the ellipsoidmain axis. The eccentricity of the shell is given as [Eq. (11)]
eshell ¼ ðeRþ DshellÞ=ðRþ DshellÞ ð11Þ
in order to keep a constant shell thickness Dshell. The interfaces aremade diffuse by multiplying with the smearing factor exp(�s2q2/2)as in the liprotide modelling above. The smearing was fixed at s=0.5 � pure oleic acid samples, due to the small head group.
Bilayer modelling : For the pure OA sample at pH 9, a simplecore–shell bilayer form factor was used [Eq. (12)]:
PbilayerðqÞ ¼1
D1outRout�RinðD1out�D1inÞ�D1outRoutsinðqRoutÞ
qRout� RinðD1out�D1inÞsinðqRinÞ
qRin
�2ð12Þ
� 2014 Wiley-VCH Verlag GmbH & Co. KGaA, Weinheim ChemBioChem 0000, 00, 1 – 11 &9&
These are not the final page numbers! ��
CHEMBIOCHEMFULL PAPERS www.chembiochem.org
Here Rin is the inner half-thickness and Rout = Rin + Dshell. The inter-phase smearing was included as above and fixed at s= 0.5 �.
Acknowledgements
J.D.K. and J.S.P. acknowledge Lundbeckfonden for financial sup-port. J.G.H. was supported by Arla Foods A/S and the DanishMinistry of Science. S.B.N. was supported by the Danish ResearchCouncil (Industrial Postdoc). S.B.N. and J.S.P. were supported bythe Danish Council for Independent Research–Natural Sciences.D.E.O. is supported by the Danish Research Foundation (InSPIN).The authors thank Christian Moestrup Jessen for helpful discus-sions and Wim Noppe, KU Leuven, Campus Kortrijk for equine ly-sozyme purification.
The authors declare no competing financial interests.
Keywords: lipids · micelles · protein folding · proteinstructures · protein–protein interactions
[1] a) M. Svensson, A. H�kansson, A. K. Mossberg, S. Linse, C. Svanborg,Proc. Natl. Acad. Sci. USA 2000, 97, 4221 – 4226; b) A. H�kansson, M.Svensson, A. K. Mossberg, H. Sabharwal, S. Linse, I. Lazou, B. Lçnnerdal,C. Svanborg, Mol. Microbiol. 2000, 35, 589 – 600.
[2] a) C. R. Brinkmann, S. Thiel, M. K. Larsen, T. E. Petersen, J. C. Jensenius,C. W. Heegaard, J. Dairy Sci. 2011, 94, 2159 – 2170; b) C. R. Brinkmann,C. W. Heegaard, T. E. Petersen, J. C. Jensenius, S. Thiel, FEBS J. 2011, 278,1955 – 1967.
[3] E. A. Clementi, L. R. Marks, M. E. Duffey, A. P. Hakansson, J. Biol. Chem.2012, 287, 27168 – 27182.
[4] a) M. Svensson, H. Sabharwal, A. H�kansson, A.-K. Mossberg, P. Lipniu-nas, H. Leffler, C. Svanborg, S. Linse, J. Biol. Chem. 1999, 274, 6388 –6396; b) C. R. Brinkmann, S. Thiel, D. E. Otzen, FEBS J. 2013, 280, 1733 –1749.
[5] a) A. Malmendal, J. Underhaug, D. E. Otzen, N. C. Nielsen, PloS One2010, 5, e10262; b) S. E. Permyakov, E. L. Knyazeva, L. M. Khasanova,R. S. Fadeev, A. P. Zhadan, H. Roche-Hakansson, A. P. Hakansson, V. S.Akatov, E. A. Permyakov, Biol. Chem. 2012, 393, 85 – 92.
[6] B. Ongpipattanakul, R. R. Burnette, R. O. Potts, M. L. Francoeur, Pharm.Res. 1991, 8, 350 – 354.
[7] A. K. Mossberg, K. H. Mok, L. A. Morozova-Roche, C. Svanborg, FEBS J.2010, 277, 4614 – 4625.
[8] C. S. Ho, A. Rydstrom, M. S. Manimekalai, C. Svanborg, G. Gruber, PLoSOne 2012, 7, e53051.
[9] a) J. Pettersson, A. K. Mossberg, C. Svanborg, Biochem. Biophys. Res.Commun. 2006, 345, 260 – 270; b) K. Wilhelm, A. Darinskas, W. Noppe, E.Duchardt, K. H. Mok, V. Vukojevic, J. Schleucher, L. A. Morozova-Roche,FEBS J. 2009, 276, 3975 – 3989; c) T. Nakamura, T. Aizawa, R. Kariya, S.Okada, M. Demura, K. Kawano, K. Makabe, K. Kuwajima, J. Biol. Chem.2013, 288, 14408 – 14416.
[10] a) M. Svensson, A. K. Mossberg, J. Pettersson, S. Linse, C. Svanborg, Pro-tein Sci. 2003, 12, 2805 – 2814; b) M. Zhang, F. Yang, Jr. , F. Yang, J. Chen,
C. Y. Zheng, Y. Liang, Chem.-Biol. Interact. 2009, 180, 131 – 142; c) C. R.Brinkmann, A. Brodkorb, S. Thiel, J. J. Kehoe, Eur. J. Lipid Sci. Technol.2013, 115, 591 – 600.
[11] S. B. Nielsen, K. Wilhelm, B. Vad, J. Schleucher, L. A. Morozova-Roche, D.Otzen, J. Mol. Biol. 2010, 398, 351 – 361.
[12] a) B. Spolaore, O. Pinato, M. Canton, M. Zambonin, P. P. De Laureto, A.Fontana, Biochemistry 2010, 49, 8658 – 8667; b) E. L. Nemashkalova, A. S.Kazakov, L. M. Khasanova, E. A. Permyakov, S. E. Permyakov, Biochemistry2013, 52, 6286 – 6299.
[13] E. M. Rath, A. P. Duff, A. P. Hakansson, R. B. Knott, W. B. Church, ProteinsStruct. Funct. Bioinf. 2014, 82, 1400 – 1408.
[14] D. P. Cistola, J. A. Hamilton, D. Jackson, D. M. Small, Biochemistry 1988,27, 1881 – 1888.
[15] J. Lipfert, L. Columbus, V. B. Chu, S. A. Lesley, S. Doniach, J. Phys. Chem.B 2007, 111, 12427 – 12438.
[16] a) W. R. Hargreaves, D. W. Deamer, Biochemistry 1978, 17, 3759 – 3768;b) K. Morigaki, P. Walde, Curr. Opin. Colloid Interface Sci. 2007, 12, 75 –80.
[17] H. Fukuda, A. Goto, H. Yoshioka, R. Goto, K. Morigaki, P. Walde, Langmuir2001, 17, 4223 – 4231.
[18] K. K. Andersen, C. L. P. Oliveira, K. L. Larsen, F. M. Poulsen, T. H. Callisen,P. Westh, J. S. Pedersen, D. E. Otzen, J. Mol. Biol. 2009, 391, 207 – 226.
[19] L. Giehm, C. L. P. Oliveira, G. Christiansen, J. S. Pedersen, D. E. Otzen, J.Mol. Biol. 2010, 401, 115 – 133.
[20] W. Noppe, I. Hanssens, M. De Cuyper, J. Chromatogr. A 1996, 719, 327 –331.
[21] N. Greenfield, G. D. Fasman, Biochemistry 1969, 8, 4108 – 4116.[22] W. Kabsch, C. Sander, Biopolymers 1983, 22, 2577 – 2637.[23] K. R. Acharya, D. I. Stuart, N. P. Walker, M. Lewis, D. C. Phillips, J. Mol.
Biol. 1989, 208, 99 – 127.[24] K. A. Majorek, P. J. Porebski, A. Dayal, M. D. Zimmerman, K. Jablonska,
A. J. Stewart, M. Chruszcz, W. Minor, Mol. Immunol. 2012, 52, 174 – 182.[25] P. E. Stein, A. G. Leslie, J. T. Finch, R. W. Carrell, J. Mol. Biol. 1991, 221,
941 – 959.[26] L. J. Harris, S. B. Larson, K. W. Hasel, A. McPherson, Biochemistry 1997,
36, 1581 – 1597.[27] J. S. Pedersen, J. Appl. Crystallogr. 2004, 37, 369 – 380.[28] O. Glatter, J. Appl. Crystallogr. 1977, 10, 415 – 421.[29] a) C. L. P. Oliveira, M. A. Behrens, J. S. Pedersen, K. Erlacher, D. Otzen,
J. S. Pedersen, J. Mol. Biol. 2009, 387, 147 – 161; b) J. S. Pedersen, S.Hansen, R. Bauer, Eur. Biophys. J. Biophys. Lett. 1994, 23, 227 – 229.
[30] a) J. S. Pedersen, M. C. Gerstenberg, Macromolecules 1996, 29, 1363 –1365; b) J. S. Pedersen, C. Svaneborg, Curr. Opin. Colloid Interface Sci.2002, 7, 158 – 166.
[31] P. Debye, J. Phys. Colloid Chem. 1947, 51, 18 – 32.[32] W. Burchard, K. Kajiwara, Proc. R. Soc. London Ser. A 1970, 316, 185 –
199.[33] J. S. Pedersen, J. Chem. Phys. 2001, 114, 2839 – 2846.[34] E. Mylonas, D. I. Svergun, J. Appl. Crystallogr. 2007, 40, S245 – S249.[35] a) B. W. Koenig, K. Gawrisch, Biochim. Biophys. Acta Biomembr. 2005,
1715, 65 – 70; b) D. Marsh, Chem. Phys. Lipids 2010, 163, 667 – 677; c) J.Tsai, R. Taylor, C. Chothia, M. Gerstein, J. Mol. Biol. 1999, 290, 253 – 266.
[36] A. Guinier, Ann. Phys. 1939, 12, 161 – 237.
Received: July 24, 2014Published online on && &&, 0000
� 2014 Wiley-VCH Verlag GmbH & Co. KGaA, Weinheim ChemBioChem 0000, 00, 1 – 11 &10&
These are not the final page numbers! ��
CHEMBIOCHEMFULL PAPERS www.chembiochem.org
FULL PAPERS
J. D. Kaspersen, J. N. Pedersen,J. G. Hansted, S. B. Nielsen, S. Sakthivel,K. Wilhelm, E. L. Nemashkalova,S. E. Permyakov, E. A. Permyakov,C. L. Pinto Oliveira, L. A. Morozova-Roche,D. E. Otzen,* J. S. Pedersen*
&& –&&
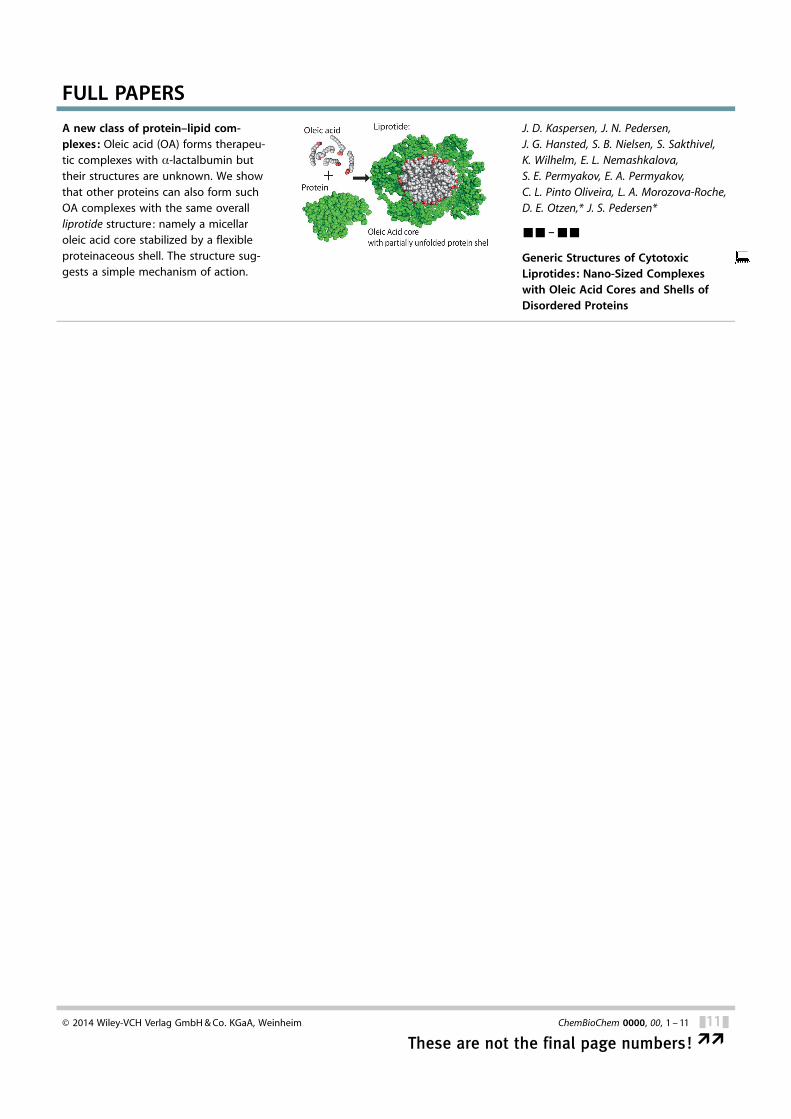
Generic Structures of CytotoxicLiprotides: Nano-Sized Complexeswith Oleic Acid Cores and Shells ofDisordered Proteins
A new class of protein–lipid com-plexes: Oleic acid (OA) forms therapeu-tic complexes with a-lactalbumin buttheir structures are unknown. We showthat other proteins can also form suchOA complexes with the same overallliprotide structure: namely a micellaroleic acid core stabilized by a flexibleproteinaceous shell. The structure sug-gests a simple mechanism of action.
� 2014 Wiley-VCH Verlag GmbH & Co. KGaA, Weinheim ChemBioChem 0000, 00, 1 – 11 &11&
These are not the final page numbers! ��
Copyright © 2022 FDOKUMEN