Argonaute2 Mediates Compensatory Expansion of the Pancreatic β Cell
13
Cell Metabolism Article Argonaute2 Mediates Compensatory Expansion of the Pancreatic b Cell Sudhir G. Tattikota, 1,14 Thomas Rathjen, 1,14 Sarah J. McAnulty, 1 Hans-Hermann Wessels, 1 Ildem Akerman, 5 Martijn van de Bunt, 7 Jean Hausser, 8 Jonathan L.S. Esguerra, 9 Anne Musahl, 1 Amit K. Pandey, 1 Xintian You, 1 Wei Chen, 1 Pedro L. Herrera, 10 Paul R. Johnson, 7,11,12 Donal O’Carroll, 13 Lena Eliasson, 9 Mihaela Zavolan, 8 Anna L. Gloyn, 7,11 Jorge Ferrer, 5,6 Ruby Shalom-Feuerstein, 4 Daniel Aberdam, 2,3 and Matthew N. Poy 1, * 1 Max Delbrueck Center for Molecular Medicine, 13125 Berlin, Germany 2 Institut National de la Sante ´ et de la Recherche Me ´ dicale (INSERM), UMR-S 976, 75475 Paris, France 3 Universite ´ Paris Diderot, Skin Research Center, 75013 Paris, France 4 Department of Anatomy and Cell Biology, The Ruth and Bruce Rappaport Faculty of Medicine, The Technion-Israel Institute of Technology, 31096 Haifa, Israel 5 Genomic Programming of Beta-Cells Laboratory, Institut d’Investigacions Biome ` diques August Pi I Sunyer (IDIBAPS), 08036 Barcelona, Spain 6 Department of Medicine, Imperial College London, W12 0NN London, UK 7 Oxford Centre for Diabetes, Endocrinology, & Metabolism, University of Oxford, OX3 7LE Oxford, UK 8 Computational and Systems Biology, Biozentrum, University of Basel, 4056 Basel, Switzerland 9 Department of Clinical Sciences, Lund University Diabetes Center, Lund University, Malmo ¨ University Hospital, SE-205 02 Malmo ¨ , Sweden 10 Department of Genetic Medicine and Development, Faculty of Medicine, University of Geneva, 1211 Geneva, Switzerland 11 NIHR Oxford Biomedical Research Centre, ORH Trust, OCDEM, Churchill Hospital, OX3 7LJ Oxford, UK 12 Nuffield Department of Surgery, University of Oxford, OX3 9DU Oxford, UK 13 European Molecular Biology Laboratory, 00015 Monterotondo Scalo, Italy 14 These authors contributed equally to this work *Correspondence: [email protected] http://dx.doi.org/10.1016/j.cmet.2013.11.015 SUMMARY Pancreatic b cells adapt to compensate for increased metabolic demand during insulin resis- tance. Although the microRNA pathway has an essential role in b cell proliferation, the extent of its contribution is unclear. Here, we report that miR- 184 is silenced in the pancreatic islets of insulin- resistant mouse models and type 2 diabetic human subjects. Reduction of miR-184 promotes the expression of its target Argonaute2 (Ago2), a compo- nent of the microRNA-induced silencing complex. Moreover, restoration of miR-184 in leptin-deficient ob/ob mice decreased Ago2 and prevented compen- satory b cell expansion. Loss of Ago2 during insulin resistance blocked b cell growth and relieved the regulation of miR-375-targeted genes, including the growth suppressor Cadm1. Lastly, administration of a ketogenic diet to ob/ob mice rescued insulin sensitivity and miR-184 expression and restored Ago2 and b cell mass. This study identifies the targeting of Ago2 by miR-184 as an essential compo- nent of the compensatory response to regulate pro- liferation according to insulin sensitivity. INTRODUCTION Adaptation to environmental stress is a fundamental cellular pro- cess that promotes the maintenance of the physiologic steady state (Spriggs et al., 2010). Stress responses have been shown to induce numerous changes, such as activation of gene expres- sion programs, which have evolved to allow for the cell to pro- mote its own survival (Ku ¨ ltz, 2005; Ebert and Sharp, 2012). For example, in response to insulin resistance, the pancreatic b cell undertakes measures to proliferate and increase its output of secreted insulin. A coordinated increase in both b cell mass and secretory function constitutes the compensatory response to maintain normoglycemia (Muoio and Newgard, 2008). Although the underlying mechanisms directing these processes are still not completely understood, several studies have illus- trated a role for metabolic changes in catalyzing b cell expansion (Steil et al., 2001). Furthermore, cellular pathways enabling the b cells to proliferate and adapt to increases in metabolic load may act by ultimately promoting signaling cascades essential to increasing both secretion and islet mass (Rhodes, 2005). Recent evidence has shown the microRNA (miRNA) pathway as an important regulator of gene expression in response to metabolic stress (Leung and Sharp, 2010). Central to this mechanism are the Argonaute (Ago) proteins, which mediate this pathway by facilitating the interaction between miRNAs and their target mRNAs (Ho ¨ ck and Meister, 2008; Bartel, 2009). In addition, Ago proteins have been shown to accumulate in stress granules upon exposure to oxidative stress; however, their role in this compartment is not understood (Leung et al., 2006). Although loss of Argonaute2 (Ago2) expression in the MIN6 b cell line model resulted in enhanced secretion, its role in the stress response of the b cell has not been described (Tattikota et al., 2013). We have previously shown that loss of miR-375 expression, among the most abundant miRNA in the pancreatic islet, inhibited the compensatory b cell proliferation in leptin-deficient 122 Cell Metabolism 19, 122–134, January 7, 2014 ª2014 Elsevier Inc.
Transcript of Argonaute2 Mediates Compensatory Expansion of the Pancreatic β Cell

Cell Metabolism
Article
Argonaute2 Mediates Compensatory Expansionof the Pancreatic b CellSudhir G. Tattikota,1,14 Thomas Rathjen,1,14 Sarah J. McAnulty,1 Hans-Hermann Wessels,1 Ildem Akerman,5
Martijn van de Bunt,7 Jean Hausser,8 Jonathan L.S. Esguerra,9 Anne Musahl,1 Amit K. Pandey,1 Xintian You,1 Wei Chen,1
Pedro L. Herrera,10 Paul R. Johnson,7,11,12 Donal O’Carroll,13 Lena Eliasson,9 Mihaela Zavolan,8 Anna L. Gloyn,7,11
Jorge Ferrer,5,6 Ruby Shalom-Feuerstein,4 Daniel Aberdam,2,3 and Matthew N. Poy1,*1Max Delbrueck Center for Molecular Medicine, 13125 Berlin, Germany2Institut National de la Sante et de la Recherche Medicale (INSERM), UMR-S 976, 75475 Paris, France3Universite Paris Diderot, Skin Research Center, 75013 Paris, France4Department of Anatomy and Cell Biology, The Ruth and Bruce Rappaport Faculty of Medicine, The Technion-Israel Institute of Technology,31096 Haifa, Israel5Genomic Programming of Beta-Cells Laboratory, Institut d’Investigacions Biomediques August Pi I Sunyer (IDIBAPS),
08036 Barcelona, Spain6Department of Medicine, Imperial College London, W12 0NN London, UK7Oxford Centre for Diabetes, Endocrinology, & Metabolism, University of Oxford, OX3 7LE Oxford, UK8Computational and Systems Biology, Biozentrum, University of Basel, 4056 Basel, Switzerland9Department of Clinical Sciences, Lund University Diabetes Center, Lund University, Malmo University Hospital, SE-205 02 Malmo, Sweden10Department of Genetic Medicine and Development, Faculty of Medicine, University of Geneva, 1211 Geneva, Switzerland11NIHR Oxford Biomedical Research Centre, ORH Trust, OCDEM, Churchill Hospital, OX3 7LJ Oxford, UK12Nuffield Department of Surgery, University of Oxford, OX3 9DU Oxford, UK13European Molecular Biology Laboratory, 00015 Monterotondo Scalo, Italy14These authors contributed equally to this work
*Correspondence: [email protected]
http://dx.doi.org/10.1016/j.cmet.2013.11.015
SUMMARY
Pancreatic b cells adapt to compensate forincreased metabolic demand during insulin resis-tance. Although the microRNA pathway has anessential role in b cell proliferation, the extent of itscontribution is unclear. Here, we report that miR-184 is silenced in the pancreatic islets of insulin-resistant mouse models and type 2 diabetic humansubjects. Reduction of miR-184 promotes theexpression of its targetArgonaute2 (Ago2), a compo-nent of the microRNA-induced silencing complex.Moreover, restoration of miR-184 in leptin-deficientob/obmice decreasedAgo2 and prevented compen-satory b cell expansion. Loss of Ago2 during insulinresistance blocked b cell growth and relieved theregulation of miR-375-targeted genes, including thegrowth suppressor Cadm1. Lastly, administrationof a ketogenic diet to ob/ob mice rescued insulinsensitivity and miR-184 expression and restoredAgo2 and b cell mass. This study identifies thetargeting ofAgo2 bymiR-184 as an essential compo-nent of the compensatory response to regulate pro-liferation according to insulin sensitivity.
INTRODUCTION
Adaptation to environmental stress is a fundamental cellular pro-
cess that promotes the maintenance of the physiologic steady
122 Cell Metabolism 19, 122–134, January 7, 2014 ª2014 Elsevier In
state (Spriggs et al., 2010). Stress responses have been shown
to induce numerous changes, such as activation of gene expres-
sion programs, which have evolved to allow for the cell to pro-
mote its own survival (Kultz, 2005; Ebert and Sharp, 2012). For
example, in response to insulin resistance, the pancreatic b
cell undertakes measures to proliferate and increase its output
of secreted insulin. A coordinated increase in both b cell mass
and secretory function constitutes the compensatory response
to maintain normoglycemia (Muoio and Newgard, 2008).
Although the underlying mechanisms directing these processes
are still not completely understood, several studies have illus-
trated a role for metabolic changes in catalyzing b cell expansion
(Steil et al., 2001). Furthermore, cellular pathways enabling the b
cells to proliferate and adapt to increases in metabolic load may
act by ultimately promoting signaling cascades essential to
increasing both secretion and islet mass (Rhodes, 2005).
Recent evidence has shown the microRNA (miRNA) pathway
as an important regulator of gene expression in response to
metabolic stress (Leung and Sharp, 2010). Central to this
mechanism are the Argonaute (Ago) proteins, which mediate
this pathway by facilitating the interaction between miRNAs
and their target mRNAs (Hock and Meister, 2008; Bartel,
2009). In addition, Ago proteins have been shown to accumulate
in stress granules upon exposure to oxidative stress; however,
their role in this compartment is not understood (Leung et al.,
2006). Although loss of Argonaute2 (Ago2) expression in the
MIN6 b cell line model resulted in enhanced secretion, its role
in the stress response of the b cell has not been described
(Tattikota et al., 2013).
We have previously shown that loss of miR-375 expression,
among the most abundant miRNA in the pancreatic islet,
inhibited the compensatory b cell proliferation in leptin-deficient
c.

0
0.4
0.8
1.2
1.6
4 8 12 16age (weeks)
miR
-184
(AU
) ob/obWT
***** ***0
0.4
0.8
1.2
1.6
4 8 12 16age (weeks)
miR
-184
(AU
) ob/obWT
***** ***0
0.4
0.8
1.2
WT ob/ob
pri-m
iR-1
84(A
U)
**0
0.4
0.8
1.2
WT ob/ob
pri-m
iR-1
84(A
U)
**
B C
J K
H I**0.0
1.5
mAgo2norm
. luc
.(R
r/Pp)
mAgo2MUT
mAgo2MUT
**
hAgo2hAgo2 hAgo2MUT
hAgo2MUT
1.00.5
0.0
1.5
mAgo2norm
. luc
.(R
r/Pp)
hAgo2
1.00.5
+ ctrl-mimic+ MUT-184
n.s. n.s.
0.0
1.5
mAgo2norm
. luc
.(R
r/Pp)
hAgo2
1.00.5
+ ctrl-mimic+ MUT-184+ ctrl-mimic+ MUT-184
n.s. n.s.
miR-184
miR-375
1 10 100 10000 1000000
110
100
1000
010
0000
0
WT islet (reads)
ob/o
bis
let (
read
s)
A
miR-184
miR-375
1 10 100 10000 1000000
110
100
1000
010
0000
0
WT islet (reads)
ob/o
bis
let (
read
s)
00.40.81.2
WT db/db
miR
-184
(AU
)
***0
0.40.81.2
WT db/db
miR
-184
(AU
)
***
D F GChowHFD
0.0
1.0
2.0
8 16 20
* ***
weeks on HFD
miR
-184
(AU
)
ChowHFDChowHFD
0.0
1.0
2.0
8 16 20
* ***
weeks on HFD
miR
-184
(AU
)
ChowHFDChowHFD
0.0
1.0
2.0
20weeks on
HFD
miR
-375
(AU
) *
WTob/obWTob/ob
0.0
1.0
2.0
miR
-375
(AU
) *
EGFP-GFP+
miR
-184
(AU
)
05
1015
GFP-GFP+GFP-GFP+
miR
-184
(AU
)
05
1015
05
1015
ctrl-mimic 184-mimic
Ago2
γ-tubulin
50 pM 200 pM200 pMctrl-mimic 184-mimic
Ago2
γ-tubulin
50 pM 200 pM200 pM
miR
-184
(AU
)(N
orm
. to
Con
trol
Isle
ts)
0.0
0.5
1.0
1.5 **
Non T2D
miR
-184
(AU
)(N
orm
. to
Con
trol
Isle
ts)
0.0
0.5
1.0
1.5 **
Non T2D
L M
R = - 0.334
0
1
2
3
0 1 2
Ago
2 (A
U)
miR-184 (AU)
T2DNon
p < 0.05R = - 0.334
0
1
2
3
0 1 2
Ago
2 (A
U)
miR-184 (AU)
T2DNon
p < 0.05
0.0
1.0
2.0
3.0
Non T2D
Ago
2m
RN
A(N
orm
. to
Con
trol
Isle
ts)
0.0
1.0
2.0
3.0
Non T2D
Ago
2m
RN
A(N
orm
. to
Con
trol
Isle
ts)
0
1
2
3
Non T2D
miR
-184
(AU
)(N
orm
. to
Con
trol
Isle
ts) **
0
1
2
3
Non T2D
miR
-184
(AU
)(N
orm
. to
Con
trol
Isle
ts)
0
1
2
3
Non T2D
miR
-184
(AU
)(N
orm
. to
Con
trol
Isle
ts) **
50 200
ctrl-mimic184-mimic
Ago
2m
RN
A (A
U)
** **
0.00.51.01.5
pMpM50 200
ctrl-mimic184-mimicctrl-mimic184-mimic
Ago
2m
RN
A (A
U)
** **
0.00.51.01.5
0.00.51.01.5
pMpMAgo2
pro
tein
exp
.(n
orm
aliz
ed)
0.00.51.01.5
ctrl 50 200
***
pMpMAgo2
pro
tein
exp
.(n
orm
aliz
ed)
0.00.51.01.5
ctrl 50 200
***
pMpMctrl 50 200
***
pMpM
+ctrl-mimic+184-mimic+ctrl-mimic+184-mimic
Figure 1. miR-184 Is Silenced during
Insulin Resistance and Directly Targets
Argonaute2
(A) Comparison of small RNA sequencing analysis
from total RNA from islets of 12-week-old ob/ob
and wild-type (WT) littermates.
(B) Quantitative real-time PCR analysis ofmiR-184
in islets of ob/ob andWTmice from 4–16 weeks of
age (n = 3–5).
(C) Quantitative real-time PCR analysis of pri-miR-
184 in islets of ob/ob mice and WT littermates at
16 weeks of age (n = 3–5).
(D) Quantitative real-time PCR analysis ofmiR-184
in FACS-sorted b cells from 16-week-old mouse
insulin promoter-GFP mice (n = 6).
(E) Quantitative real-time PCR analysis ofmiR-184
in islets of db/db mice and WT littermates at age
12 weeks (n = 4).
(F) Quantitative real-time PCR analysis ofmiR-184
in islets of C57BL/6 mice on high-fat diet (HFD) or
chow diet.
(G) Quantitative real-time PCR analysis ofmiR-375
in islets of C57BL/6 mice on HFD or chow diet and
in islets of ob/ob mice and littermates at age
12 weeks (n = 6).
(H and I) Luciferase assays in MIN6 cells testing
direct targeting of mouse and human Ago2 genes
by miR-184 (184-mimic) or mutant (MUT-184).
(J and K) Western blot and quantitative real-time
PCR analysis of Ago2 after transfection of miR-
184-mimic and scrambled control.
(L) Quantitative real-time PCR analysis ofmiR-184
and Ago2 in islets from nondiabetic (Non) and
type-2 diabetic human subjects (T2D) after
normalization to RNU6b and TBP, respectively,
expressed as fraction of control islets. p values
represent a Mann-Whitney significance test (p =
0.009 for miR-184).
(M) Correlation of quantitative real-time PCR
analysis from (L) of Ago2 andmiR-184 in individual
T2D (n = 12) and nondiabetic (n = 15) human
subjects. Results presented as mean ± SEM. *p <
0.05; **p < 0.01; ***p < 0.001.
See also Figure S1 and Tables S1 and S2.
Cell Metabolism
Ago2 Mediates Compensatory b Cell Expansion
ob/ob mice and resulted in severe hyperglycemia and diabetes
(Poy et al., 2009). The absence of any dramatic effect on the
development or specification of the different cell populations in
the miR-375 knockout mouse may indicate a larger role for this
miRNA in stress responses (Mendell and Olson, 2012). Further-
more, these observations suggest that many of the targets of
miR-375 are also relevant to the adaptive response of the b
cell and likely play a role in proliferation during metabolic stress.
Although extensive sequencing efforts have identified �2,000
mature miRNA sequences in human tissues, relatively little is
understood regarding how small RNAs coordinately function in
these cellular processes (Kozomara and Griffiths-Jones, 2011).
Here, we show that miR-184 is silenced during insulin resis-
tance to promote the expression of Ago2 in the pancreatic b
cell. Deletion of Ago2 in ob/obmice reduced compensatory pro-
liferation of this cell type, thereby underlining an integral role for
the miRNA pathway in this process. Moreover, we observed that
Ago2 mediates the function of miR-375 in regulating the growth
suppressor Cadm1. Taken together, our results show that
several components of the miRNA pathway contribute in a
Cell
concerted effort to facilitate proliferation of the b cell to meet
metabolic demand during insulin resistance.
RESULTS
Silencing of miR-184 in the Pancreatic b-Cell PromotesIts Target Argonaute2In light of the essential role of miR-375 in adaptive growth of the
pancreatic b cell, we first sought to identify the additional com-
ponents of the miRNA pathway that coordinately mediate this
mechanism. We performed small RNA sequencing on total
RNA from islets of 12-week-old ob/ob mice (Table S1 available
online). Consistent with results by Zhao et al. (2009), expression
of miR-184 was the most reduced miRNA identified (Figure 1A;
Table S1). We then measured miR-184 in the islets of ob/ob
mice from age 4–16 weeks and observed the decrease in
expression starting at 8weeks of agewith the onset of resistance
(Figures 1B, S1A, and S1B). Similarly, the pri-miR-184 transcript
in the islets of ob/ob mice by quantitative real-time PCR was
also silenced, indicating that this miRNA is regulated on a
Metabolism 19, 122–134, January 7, 2014 ª2014 Elsevier Inc. 123

Cell Metabolism
Ago2 Mediates Compensatory b Cell Expansion
transcriptional level (Figure 1C). As recently described, miR-184
is enriched in pancreatic b cells as shown by quantitative real-
time PCR from fluorescence-activated cell sorting (FACS)-
sorted, GFP-positive b cells (MIP-GFP) (Figure 1D) (Hara et al.,
2003; van de Bunt et al., 2013). We also observed a similar
loss of expression of mature miR-184 in the islets of 12-week-
old leptin receptor-deficient db/db mice and in mice on a high-
fat diet (HFD; 60% calories from fat), all of which showed that
this observation is not limited to one mouse model of obesity
and insulin resistance (Figures 1E and 1F). In contrast to miR-
184, miR-375 was modestly increased in HFD-fed animals as
previously observed in ob/ob mice (Figure 1G) (Poy et al.,
2009). In addition, the suppression ofmiR-184was not observed
in the eye of ob/obmice, the highest site at which expression has
been measured (Figures S1C and S1D).
In order to identify direct targets of miR-184, we induced its
expression in the MIN6 line with doxycycline after transfection
with plasmids expressing the rtTA transactivator and miR-184
under control of the operator sequence of the Escherichia coli
tetracycline-resistance operon (184-tetO). Illumina WG6v2
arrays measured changes in gene expression after 16 hr of treat-
ment with doxycycline in triplicate (Figure S1E). Several compu-
tationally predicted genes for miR-184 were downregulated in
both the array and luciferase-based experiments, including
Ago2 (Figure 1H; Figures S1F–S1H) (Friedman et al., 2009). We
cloned a portion of the mouse 30 UTR of Ago2 (912 nt) and the
complete human UTR of Ago2 (899 nt) into a luciferase reporter
construct and observed decreased activity in the presence of the
miR-184mimic. In addition, mutating six nucleotides in the bind-
ing site within the mouse or human UTR (at position 152) from
UCCGUCC to CGGGCGG abolished the inhibitory effect of
miR-184 (Figure 1H). Conversely, transfecting a mutant miR-
184 mimic had no effect on reporter activity from constructs
bearing either the mouse or human Ago2 30 UTR sequences
(Figure 1I). Western blotting after overexpression of miR-184
resulted in an approximately 60% decrease in Ago2 protein
levels, whereas quantitative real-time PCR revealed a 40%
decrease in Ago2 mRNA in MIN6 cells (Figures 1J and 1K).
To address the relevance of this microRNA:target interaction
in the islets of human subjects, we measured the expression of
miR-184 and Ago2 in the pancreatic islets from 15 nondiabetic
and 12 type 2 diabetic (T2D) donors. miR-184 was significantly
decreased in T2D islets, indicating that the expression of this
specific miRNA is linked to changes in metabolic status in both
mice and humans (Figure 1L; Table S2). Whereas levels of
Ago2 were not statistically significantly increased in T2D donor
islets compared to the nondiabetic cohort, the inverse correla-
tion between Ago2 and miR-184 expression was significant
across the entire cohort (Figure 1M).
Argonaute2 Regulates b-Cell ProliferationWe next measured Ago2 expression in the islets of insulin-resis-
tant ob/ob mice and observed increased levels at 8 weeks of
age, whereas Ago1 was not altered (Figure 2A). Similarly, Ago2
levels were increased in islets isolated from 12-week-old db/
db mice and C57BL/6 mice on a HFD for 16 weeks (Figures
2B). As shown in other tissues, Ago2 is the most abundant of
the Ago family in GFP-positive b cells as measured by quantita-
tive real-time PCR (Figures 2C and S2A) (Wang et al., 2012). To
124 Cell Metabolism 19, 122–134, January 7, 2014 ª2014 Elsevier In
understand the contribution of Ago2 to growth and function of
the b cell, we generated transgenic mice bearing the mouse
Ago2 cDNA under the regulatory control of a tetracycline-
responsive promoter element and crossed them with mice
expressing the reverse tetracycline-controlled transactivator
(rtTA) protein under the control of the rat insulin2 (Ins-rtTA) pro-
moter as described (dox-Ago2) (Nir et al., 2007). Administration
of doxycycline via drinking water for 30 days to four different
lines (14, 30, 61, and 69) resulted in �1.5- to 25-fold increase
of Ago2 protein levels in isolated islets (Figures 2D and S2B).
Characterization of all lines showed no changes in body weight,
random glucose, or insulin levels. After a glucose challenge,
dox-Ago2 mice (line 30) exhibited transiently elevated glucose
levels compared to littermates; however, no difference was
observed in insulin sensitivity (Figures S2C and S2D). Moreover,
acute-phase plasma insulin levels were diminished after glucose
challenge, indicating reduced insulin release (Figure S2E).
Morphometric analysis in dox-Ago2 (line 30) animals showed
increased b cell mass in addition to increased insulin-positive
cell number and BrdU incorporation compared to littermates
(Figures 2E–2H).
We then established the conditional deletion in b cells by
crossing mice bearing the floxed allele of the Ago2 gene with
animals expressing Cre-recombinase under control of the rat
insulin promoter (bAgo2KO) (O’Carroll et al., 2007; Herrera,
2000). Quantitative RT-PCR and western blotting analysis
confirmed an efficient reduction in Ago2 expression in islets
from bAgo2KO mice compared to littermate controls (Figures
2I and 2J). In contrast, Ago1 was upregulated in islets isolated
from bAgo2KO mice, suggesting a degree of compensation by
this family member on the protein level (Figure 2J). Both
random-fed and fasted glucose and insulin levels were un-
changed; however, bAgo2KO mice exhibited improved glucose
tolerance without any alteration in insulin sensitivity at 10 weeks
of age compared to littermates (Figures S2F and S2G). As previ-
ously observed in the MIN6 model, loss of Ago2 expression
in vivo resulted in enhanced secretion of insulin after glucose
challenge (Figure S2H) (Tattikota et al., 2013). In contrast to
dox-Ago2 mice, we observed decreased b cell mass and
number, BrdU incorporation, and pancreatic insulin content in
bAgo2KO animals without any change in islet architecture, a
cell number, or total pancreatic mass (Figures 2K–2N, S2I, and
S2J). Moreover, no change was detected in TUNEL-positive b
cells, indicating cell death was not a primary mechanism for
the effect on b cell mass (Figure 2O). Lastly, we measured an
increase in both b cell size and the total number of granules
(Nv, measured as LDCV volume density), whereas the number
of docked granules remained unchanged (Ns, LDCV surface
density) in bAgo2KO mice compared to their littermates using
electron micrographs (Figure S2K).
Loss of miR-184 Expression Promotes b-CellProliferationTo determine the functional role ofmiR-184 in the b cell, we char-
acterized the constitutivemiR-184-knockout mouse (184KO) for
changes in b cell proliferation, insulin release, and glucose
homeostasis. The loss of miR-184 expression resulted in
decreased fasted glucose levels and increased fasted plasma
insulin levels (Figures 3A–3C). Consistent with loss of miR-184
c.

A B
Ago1
Ago2
Ago3
Ago4
rela
tive
Ago
expr
essi
on (A
U)
0.0
2.0
4.0
6.0
Ago1
Ago2
Ago3
Ago4
rela
tive
Ago
expr
essi
on (A
U)
0.0
2.0
4.0
6.0
0.0
2.0
4.0
6.0
D
H
F
dox-Ago2WT
insulin brdU
dox-Ago2WT
insulin brdU
K L
0
10
20
WT KOgcg+
cel
l num
ber
(cel
ls/m
m2
panc
reas
)
0
20
40
WT KO
*
ins+
cel
l num
ber
(cel
ls/m
m2
panc
reas
)
0
20
40
WT KO
*
ins+
cel
l num
ber
(cel
ls/m
m2
panc
reas
)
WT0.0
2.0
4.0
6.0
Brd
U+
cells
/in
sulin
+ ce
lls (%
)
**
Ago2dox-Ago2dox-
E
1.01
Ago2 24.5
β-actin
WT Ago2dox-
fold
1.01
Ago2 24.5
β-actin
WT Ago2dox-Ago2dox-
fold
Ago2dox-Ago2dox-
C
G
0.0
1.0
2.0
Ago1
Ago2
rela
tive
expr
essi
on (A
U)
***WTβAgo2KO
Ago3
Ago4
0.0
1.0
2.0
Ago1
Ago2
rela
tive
expr
essi
on (A
U)
***WTβAgo2KOWTβAgo2KO
Ago3
Ago4
I
WT
Ago2 0.03
γ-tubulin 1.22
βAgo2KO fold
Ago1 1.80
WT
Ago2 0.03
γ-tubulin 1.22
βAgo2KO fold
Ago1 1.80
J
M
WT ob/ob fold
Ago2 1.39 **
γ-tubulin 1.08
Ago1 0.77
WT ob/ob fold
Ago2 1.39 **
γ-tubulin 1.08
Ago1 0.77
WT ob/ob fold
Ago2 1.39 **
γ-tubulin 1.08
Ago1 0.77
Ago2dox-
0
30
60
WT
*
ins+
cel
l num
ber
(cel
ls/m
m2
panc
reas
)
Ago2dox-
0
10
20
gcg+
cel
l num
ber
(cel
ls/m
m2
panc
reas
)
n.s.
WTAgo2dox-Ago2dox-
0
30
60
WT
*
ins+
cel
l num
ber
(cel
ls/m
m2
panc
reas
)
Ago2dox-
0
10
20
gcg+
cel
l num
ber
(cel
ls/m
m2
panc
reas
)
n.s.
WT0
30
60
WT
*
ins+
cel
l num
ber
(cel
ls/m
m2
panc
reas
)
Ago2dox-Ago2dox-
0
10
20
gcg+
cel
l num
ber
(cel
ls/m
m2
panc
reas
)
n.s.
WT
WT KO
β-ce
ll m
ass
(mg)
0
1
2
3 *
WT KO
β-ce
ll m
ass
(mg)
0
1
2
3
0
1
2
3 *
WT KO
TUN
EL+
cells
/in
sulin
+ ce
lls (%
)
0.0
0.5
1.0
1.5n.s.
O
048
121620
WT KOpanc
reat
ic m
ass
(mg/
g BW
)
048
121620
WT KOpanc
reat
ic m
ass
(mg/
g BW
) n.s.
WT
β-ce
ll m
ass
(mg)
*
0
1
2
3
WT
β-ce
ll m
ass
(mg)
*
0
1
2
3
N
WT
Brd
U+
cells
/in
sulin
+ ce
lls (%
)
KO
*
01234
WT
Brd
U+
cells
/in
sulin
+ ce
lls (%
)
KO
*
01234
0.0
1.0
2.0 *
Ago
2m
RN
A(A
U) Chow
HFD
Ago
2m
RN
A(A
U)
*
0
1
23
WT db/db
0.0
1.0
2.0
0.0
1.0
2.0 *
Ago
2m
RN
A(A
U) Chow
HFDChowHFD
Ago
2m
RN
A(A
U)
*
0
1
23
WT0
1
23
WT db/db
Figure 2. Argonaute2 Is Increased during Insulin Resistance and Promotes b-Cell Proliferation
(A) Western blot analysis of Ago1 and Ago2 from islets of 8-week-old ob/ob mice and wild-type (WT) littermates.
(B) Quantitative real-time PCR analysis of Ago2 in islets after 16 weeks HFD and from 12-week-old db/db mice (n = 3–6).
(C) Quantitative real-time PCR analysis of Argonaute genes in FACS-sorted b cells from 12-week-old MIP-GFP mice (n = 3).
(D) Western blot analysis of Ago2 from islets of 10-week-old dox-Ago2 mice (line 30) and WT littermates.
(E) b cell mass analysis of 10-week-old dox-Ago2 mice (line 30) and WT (n = 3).
(F) Morphometric analysis of insulin+ and glucagon+ cells in dox-Ago2 and WT at age 10 weeks (n = 5–6).
(G and H) Ratio of BrdU (red) and insulin+ cells (green) in 10-week-old dox-Ago2 mice and WT littermates (n = 4) after immunostaining. Scale bars = 30 mm.
(I) Quantitative real-time PCR analysis of Argonaute family members in islets of 10-week-old bAgo2KO mice and littermates (n = 4).
(J) Western blot analysis of Ago2 and Ago1 from islets of 10-week-old bAgo2KO mice and WT.
(K) b cell mass analysis of 10-week-old bAgo2KO and WT mice (n = 3).
(L) Morphometric analysis of insulin+ and glucagon+ cells in bAgo2KO and littermates at 10 weeks of age (n = 5–6).
(M) Ratio of BrdU+ and insulin+ cells in bAgo2KO and littermates at 10 weeks of age (n = 5–6).
(N) Pancreatic mass to total body mass ratio of bAgo2KO and littermates at 10 weeks of age (n = 5).
(O) Ratio of TUNEL+ and insulin+ cells in bAgo2KO and littermates (n = 3). Results presented as mean ± SEM. *p < 0.05; **p < 0.01.
See also Figure S2.
Cell Metabolism
Ago2 Mediates Compensatory b Cell Expansion
expression during insulin resistance, morphometric analysis of
pancreatic sections from 184KO mice showed an increase in b
cell mass and number and BrdU incorporation rate (Figures
3D–3F). Moreover, in line with islet expression analysis in
insulin-resistant models, Ago2 expression was increased in
Cell
miR-184-deficient islets (Figures 3G and 3H). Knockout mice
exhibited transiently elevated insulin release and improved toler-
ance after glucose challenge, indicating additional targets, such
as Slc25a22, an established regulator of insulin release, may
mediate the effect of miR-184 on secretion (Figures S1H, S3A,
Metabolism 19, 122–134, January 7, 2014 ª2014 Elsevier Inc. 125

J K N
0
50
100
150
miR
-184
/ U6
(AU
)
WT dox-184
0
50
100
150
miR
-184
/ U6
(AU
)
WT dox-184
O
L*
Brd
U+
cells
/in
sulin
+ ce
lls (%
)
0.0
1.0
2.0
3.0
WT dox-184
*
Brd
U+
cells
/in
sulin
+ ce
lls (%
)
0.0
1.0
2.0
3.0
WT dox-184
Brd
U+
cells
/in
sulin
+ ce
lls (%
)
0.0
1.0
2.0
3.0
WT dox-184
insu
lin +
cel
ls/
mm
2 pa
ncre
as0
40
80
WT dox-184
*
insu
lin +
cel
ls/
mm
2 pa
ncre
as0
40
80
WT dox-184
*
gcg
+ ce
lls/
mm
2 pa
ncre
as
0
20
40
WT dox-184
n.s.
gcg
+ ce
lls/
mm
2 pa
ncre
as
0
20
40
WT dox-184
n.s.
Ago2
γ-tubulin
ctrl-dox
dox-184
ctrl-dox/ob
dox-184ob
Ago2
γ-tubulin
ctrl-dox
dox-184
ctrl-dox/ob
dox-184ob
0.0
1.0
2.0
ctrl-dox
dox-184
dox-184ob
ctrl-dox/ob
Ago2
exp
ress
ion
(nor
mal
ized
)
1.00.6
1.4
0.7
0.0
1.0
2.0
ctrl-dox
dox-184
dox-184ob
ctrl-dox/ob
Ago2
exp
ress
ion
(nor
mal
ized
)
1.00.6
1.4
0.7
dox-184ob
ctrl-dox/ob
miR
-184
/ U6
(AU
)
0100200300400
ctrl-dox
dox-184ob
ctrl-dox/ob
miR
-184
/ U6
(AU
)
0100200300400
ctrl-dox
0.00.51.01.52.0
WT dox-184
plas
ma
insu
lin(n
g/m
l)
*
0.00.51.01.52.0
WT dox-184
plas
ma
insu
lin(n
g/m
l)
*M
WT dox-184
*
β-ce
ll m
ass
(mg)
0
1
2
3
WT dox-184
*
β-ce
ll m
ass
(mg)
0
1
2
3
0
1
2
3
A C DB
GF
0
50
100
150
bloo
d gl
ucos
e(m
g/dL
)
WT184KO
0 15 60 120time post inj. (min)
30
*0
50
100
150
bloo
d gl
ucos
e(m
g/dL
)
WT184KOWT184KO
0 15 60 120time post inj. (min)
30
*
H
0
20
40
WT KO
*
ins+
cel
l num
ber
(cel
ls/m
m2
panc
reas
)
WT KOgcg+
cel
l num
ber
(cel
ls/m
m2
panc
reas
)
0
10
20
0
20
40
WT KO
*
ins+
cel
l num
ber
(cel
ls/m
m2
panc
reas
)
WT KOgcg+
cel
l num
ber
(cel
ls/m
m2
panc
reas
)
0
10
20
WT KOgcg+
cel
l num
ber
(cel
ls/m
m2
panc
reas
)
0
10
20
0.0
0.5
1.0
WT KO
*
β-ce
ll m
ass
(mg)
0.0
0.5
1.0
WT KO
*
β-ce
ll m
ass
(mg)WT
184KO
miR-184
miR-375
rela
tive
expr
essi
on (A
U)
***
0.00.51.01.5
WT184KOWT184KO
miR-184
miR-375
rela
tive
expr
essi
on (A
U)
***
0.00.51.01.5
0.0
0.5
1.0
1.5
WT KO
*
Ago
2m
RN
A(A
U)
0.0
0.5
1.0
1.5
0.0
0.5
1.0
1.5
WT KO
*
Ago
2m
RN
A(A
U)
WT184KO
bloo
d gl
ucos
e(m
g/dL
)
050
100150 **
6-hrfast
rand.fed
WT184KOWT184KO
bloo
d gl
ucos
e(m
g/dL
)
050
100150 **
6-hrfast
rand.fed
6-hrfast
rand.fed
I
1.68Slc25a22
γ-tubulin
WT 184KOAgo2
fold1.87
1.02
1.68Slc25a22
γ-tubulin
WT 184KOAgo2
fold1.87
1.02
E
plas
ma
insu
lin(n
g/m
L) *
WT KO0.0
0.5
1.0
plas
ma
insu
lin(n
g/m
L) *
WT KO0.0
0.5
1.0B
rdU
+ ce
lls /
insu
lin+
cells
(%)
WT KO
*
0.0
1.0
2.0
Brd
U+
cells
/in
sulin
+ ce
lls (%
)
WT KO
*
0.0
1.0
2.0
*
0.0
1.0
2.0
P
0.00.51.01.52.0
TUN
EL+
cells
/in
sulin
+ ce
lls (%
)
WTdox-184
n.s.
0.00.51.01.52.0
TUN
EL+
cells
/in
sulin
+ ce
lls (%
)
WTdox-184
n.s.
Figure 3. miR-184 Regulates Ago2 and Pancreatic b-Cell Proliferation In Vivo
(A) Quantitative real-time PCR analysis of miR-184 and miR-375 in islets of 10-week-old 184KO mice and wild-type (WT) littermates (n = 4).
(B) Blood glucose of 10-week-old 184KO mice and littermates (n = 4).
(C) Fasted plasma insulin levels of 10-week-old 184KO mice and littermates (n = 4).
(D) b cell mass analysis of 10-week-old 184KO and WT mice (n = 4).
(E) Morphometric analysis of insulin+ and glucagon+ cells in 184KO and WT at 10 weeks of age (n = 3).
(F) Ratio of BrdU (red) and insulin+ cells (green) in 12-week-old 184KO mice and WT (n = 3).
(G) Western blot analysis of Ago2, Slc25a22, and g-tubulin from islets of 184KO mice and WT.
(H) Quantitative real-time PCR analysis of Ago2 in islets of 10-week-old 184KO mice and littermates (n = 4–5).
(I) Blood glucose levels during an ITT on 10-week-old 184KO mice and WT (n = 4–5).
(J) Quantitative real-time PCR analysis of miR-184 in islets of 12-week-old dox-184 mice and WT mice after 15 days on doxycycline (n = 4).
(K) Plasma insulin levels of 10-week-old dox-184 mice and WT after 15 days on doxycycline (n = 4).
(L) b cell mass analysis of 10-week-old dox-184 mice and WT after 15 days on doxycycline (n = 3).
(M) Morphometric analysis of insulin+ and glucagon+ cells in 10-week-old dox-184 mice and WT (n = 4).
(N) Ratio of BrdU and insulin+ cells in dox-184 mice and WT (n = 4).
(O) Ratio of TUNEL+ and insulin+ cells in dox-184 mice and WT (n = 3).
(P) Western blot analysis of Ago2 and g-tubulin after ex vivo treatment of doxycycline on the islets of dox-184 and dox-184ob mice compared to islets from
respective control lean or ob/ob littermates. Densitometry is normalized to g-tubulin expression of ctrl-dox islets. Quantitative real-time PCR analysis ofmiR-184
in dox-184ob mice and ob/ob littermates. Results presented as mean ± SEM. *p < 0.05; **p < 0.01.
See also Figure S3.
Cell Metabolism
Ago2 Mediates Compensatory b Cell Expansion
and S3B) (Casimir et al., 2009). Lastly, insulin sensitivity was
unchanged in 184KO mice, indicating that loss of this miRNA
in the b cell does not contribute to insulin resistance (Figure 3I).
Restored Expression of miR-184 in ob/ob Mice InhibitsAgo2 and b-Cell ProliferationTwo gain-of-functionmodels formiR-184were then generated in
order to restore its expression in the b cell and validate the regu-
126 Cell Metabolism 19, 122–134, January 7, 2014 ª2014 Elsevier In
lation of Ago2 by this miRNA during insulin resistance. Similar to
dox-Ago2 mice, Ins2-rtTA mice were crossed to newly gener-
ated mice bearing the mouse miR-184 precursor under regu-
latory control of a tetracycline-responsive promoter element
(dox-184). Administration of doxycycline for 15 days via drinking
water (1 mg/ml) resulted in �100-fold increase in expression
(Figure 3J). No change was observed in body weight; however,
dox-184 animals exhibited decreased plasma insulin levels, b
c.

E
0.0
1.0
WT 04ob
miR
-375
(AU
)ob/obob/ob
Tg-04Tg-04
2.0A D
G
C
0200400600800
WT Tg-04
ob/ob
04ob
bloo
d gl
ucos
e(m
g/dL
)
***B ***
plas
ma
insu
lin(n
g/m
L)
0
10
40
60
*
WT Tg-04
ob/ob
04ob
***
plas
ma
insu
lin(n
g/m
L)
0
10
40
60
*
WT Tg-04
ob/ob
04ob
insu
lin c
onte
nt(μ
g /g
pan
crea
s)
***04obob/obob/obTg-04Tg-04WT
insulin glucagon
I
0.0
1.0
2.0
WT ob/ob
04ob
Ago
2m
RN
A(A
U)
****
0.0
1.0
2.0
WT ob/ob
04ob
Ago
2m
RN
A(A
U)
****J
0
50
100
F
WTTg-04
ob/ob
04ob
miR
-184
(AU
)
0
100
200
ob/ob
Tg-04
04ob
WT
miR
-184
(AU
)
0
100
200
ob/ob
Tg-04
04ob
WT
*
0
2
4
6
ob/ob
04ob
*
β-ce
ll m
ass
(mg)
WT
*
Tg-04
*0
2
4
6
ob/ob
04ob
*
β-ce
ll m
ass
(mg)
WT
*
Tg-04
* gcg
+ ce
lls/
mm
2pa
ncre
as
0
25
50
ob/ob
04ob
WTTg-04
n.s.
gcg
+ ce
lls/
mm
2pa
ncre
as
0
25
50
0
25
50
ob/ob
04ob
WTTg-04
n.s.
insu
lin +
cel
ls/
mm
2pa
ncre
as **
0
50
100
150
200
ob/ob
04ob
WTTg-04
*
**
insu
lin +
cel
ls/
mm
2pa
ncre
as **
0
50
100
150
200
ob/ob
04ob
WTTg-04
*
**
body
wei
ght (
g)
01020304050
WTTg-04
ob/ob
04ob
****
body
wei
ght (
g)
01020304050
WTTg-04
ob/ob
04ob
****
H
***n.s.***
***
Figure 4. Restoration of miR-184 during Insulin Resistance Inhibits Compensatory b-Cell Proliferation
(A) Quantitative real-time PCR analysis of miR-184 in islets of 8-week-old wild-type (WT), Tg-04, ob/ob, and 04ob mice (n = 3).
(B) Quantitative real-time PCR analysis of miR-375 in islets of 8-week-old WT, Tg-04, ob/ob, and 04ob mice (n = 4).
(C) Random blood glucose of 8-week-old WT, Tg-04, ob/ob, and 04ob mice (n = 4–12).
(D) Plasma insulin concentrations of 8-week-old WT, Tg-04, ob/ob, and 04ob mice (n = 3–6).
(E) Immunostaining analysis of pancreatic sections in 8-week-old WT, Tg-04, ob/ob, and 04ob mice for insulin (green) and glucagon (red). Scale bars = 50 mm.
(F) Pancreatic insulin content in 8-week-old WT, Tg-04, ob/ob, and 04ob mice (n = 4–6).
(G) b cell mass analysis of 10-week-old WT, Tg-04, ob/ob, and 04ob mice (n = 3).
(H) Quantification of insulin+ and glucagon+ cells per area of pancreas in WT, Tg-04, ob/ob, and 04ob mice (n = 4).
(I) Body weight analysis of WT, Tg-04, ob/ob, and 04ob mice (n = 4–12).
(J) Quantitative real-time PCR analysis of Ago2 in islets of 10-week-old WT, ob/ob, and 04ob mice (n = 4–5). Results presented as mean ± SEM. *p < 0.05;
**p < 0.01; ***p < 0.001.
See also Figure S4.
Cell Metabolism
Ago2 Mediates Compensatory b Cell Expansion
cell mass and number, and BrdU incorporation (Figures 3K–3N
and S3C). The number of apoptotic cells was unchanged, indi-
cating the hyperglycemia (>250 mg/dl) and glucose intolerance
in dox-184 mice were due to a decrease in b cell mass and
rate of proliferation (Figures 3O and S3D–S3F). Isolated islets
from dox-184mice treated with doxycycline for 48 hr ex vivo ex-
hibited decreased Ago2 expression (Figure 3P). Moreover, we
crossed dox-184 mice onto the ob/ob background (dox-184ob)
and observed a 50% reduction in Ago2 expression after doxycy-
cline treatment and restoring expression ofmiR-184 (Figure 3P).
Furthermore, whereas islet levels ofmiR-375 and Ago1 were un-
changed, random blood glucose levels increased and plasma
insulin levels were significantly reduced in dox-184ob mice (Fig-
ures S3G–S3J). An additional transgenic model of constitutive
overexpression was developed to further confirm the role of
miR-184 in b cell growth and function. We focused on three inde-
pendent mouse lines (Tg-96, Tg-04, and Tg-32), which showed
Cell
by Southern analysis varying numbers of the transgene contain-
ing the miR-184 precursor sequence under control of the rat
insulin promoter (Figure S3K). All lines exhibited a mild decrease
in body weight, but the highest overexpression of miR-184
(�100-fold in Tg-04 and 32) resulted in severe hyperglycemia
and reduced systemic insulin levels, whereas a 5-fold increase
(Tg-96) induced glucose intolerance and impaired insulin release
(Figures S3L–S3Q). Similar to dox-184 animals, Tg-04 and Tg-32
animals exhibited hyperglycemia and reduced circulating insulin
due to loss of b cell mass and pancreatic insulin content (Figures
4A–4G and S4A–S4G). Crossing Tg-04 animals onto the ob/ob
background (04ob) resulted in sustained expression of miR-
184 and did not compromise the most abundant miRNAs, such
as miR-375 (Figures 4A and 4B). As in dox-184ob mice, 04ob
mice exhibited severe hyperglycemia as a result of diminished
insulin levels and b cell mass and ultimately contributed toweight
loss (Figures 4C–4I). Lastly, restoring expression ofmiR-184 in b
Metabolism 19, 122–134, January 7, 2014 ª2014 Elsevier Inc. 127
0.31 **
γ-tubulin2.35 * 1.18
si-Ctrl si-Ago2 fold ch.Ago2
1.38 *Ago1
Cadm1
Ago2 4.01 ***0.87Ago1
Cadm1 0.65 *1.01γ-tubulin
Ctrl OE Ago2OE fold ch.
A C
E F
G
WTβAgo2KO
cadm
1m
RN
A (A
U)
0.0
1.0
2.0 **
miR
-375
/ U
6 (A
U)
0.0
1.0
1.5n.s.
WTβAgo2KOWTβAgo2KO
cadm
1m
RN
A (A
U)
0.0
1.0
2.0 **
cadm
1m
RN
A (A
U)
0.0
1.0
2.0 **
miR
-375
/ U
6 (A
U)
0.0
1.0
1.5n.s.
si-ctrlsi-Ago1si-Ago2
si-ctrlsi-Ago1si-Ago2
**
cadm
1m
RN
A (A
U)
0.0
1.0
2.0
cadm
1m
RN
A (A
U)
0.0
1.0
2.0
0.0
1.0
2.0
Ago
1m
RN
A (A
U) **
*
0.0
0.5
1.0
1.5
Ago
2m
RN
A (A
U)
**
0.0
0.5
1.0
1.5
Ago
2m
RN
A (A
U)
**
D
ch.
γ-tubulin
WT
Cadm1
Ago2
foldAgo2dox-
25.1
0.74
1.00
ch.
γ-tubulin
WT
Cadm1
Ago2
foldAgo2dox-
Ago2dox-
25.1
0.74
1.00
B
IH
0.0
0.5
1.0
1.5
IgG Ago2OE AS375
% In
put
*
*****
IP: Ago2
0.0
0.5
1.0
1.5
IgG Ago2OE AS375
% In
put
*
*****
IP: Ago2re
lativ
e ex
pres
sion
(AU
)
WTob/obWTob/ob
*
0.00.51.01.52.0 **
Cadm1 Gphn
*
Elavl4
*
Rasd1 Ago2
***
Cadm1 Gphn
*
Elavl4
*
Rasd1 Ago2
*WTcadm1KOWTcadm1KO
fold ch.WT
Ago2 0.01
γ-tubulin
βAgo2KO
Cadm1
1.36
1.66
WT
Ago2 0.01
γ-tubulin
βAgo2KO
Cadm1
1.36
1.66
gcg
+ ce
lls/
mm
2 pa
ncre
as
0
10
15
5
insu
lin +
cel
ls/
mm
2 pa
ncre
as
0
20
40 **
gcg
+ ce
lls/
mm
2 pa
ncre
as
0
10
15
5
insu
lin +
cel
ls/
mm
2 pa
ncre
as
0
20
40 **B
rdU
+ ce
lls /
insu
lin+
cells
(%)
*
0.0
1.0
2.0
3.0
Brd
U+
cells
/in
sulin
+ ce
lls (%
)
*
0.0
1.0
2.0
3.0*
β-ce
ll m
ass
(mg)
0
1
2**
β-ce
ll m
ass
(mg)
0
1
2
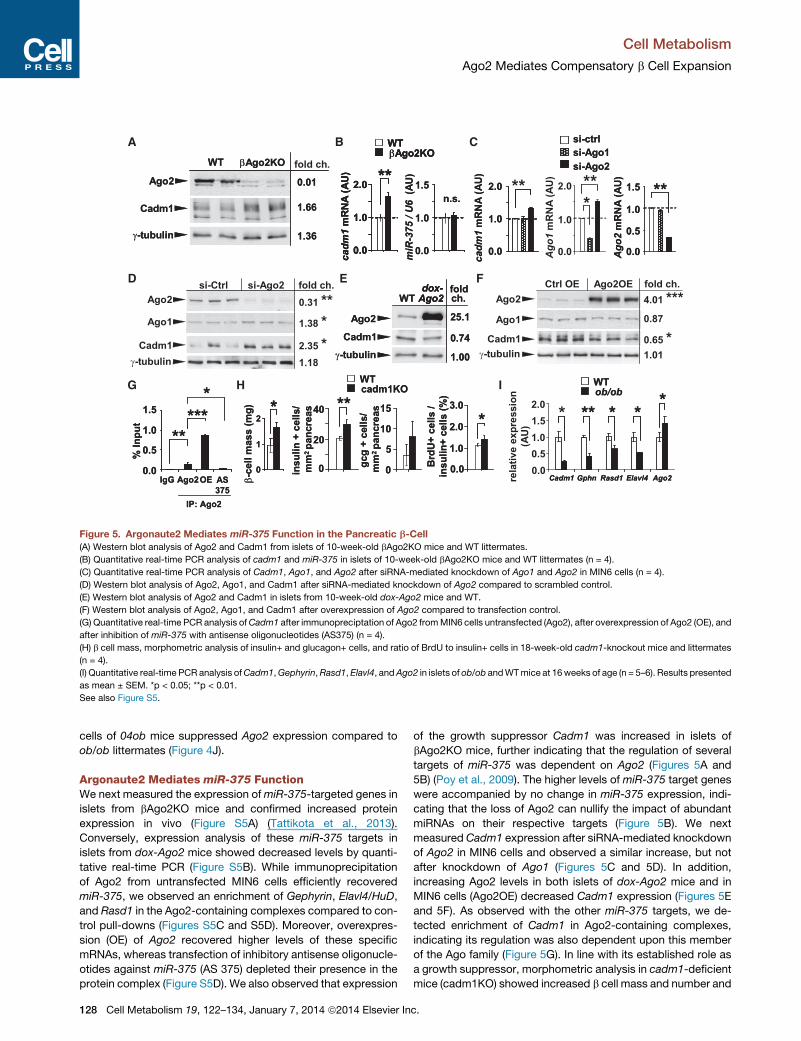
Figure 5. Argonaute2 Mediates miR-375 Function in the Pancreatic b-Cell
(A) Western blot analysis of Ago2 and Cadm1 from islets of 10-week-old bAgo2KO mice and WT littermates.
(B) Quantitative real-time PCR analysis of cadm1 and miR-375 in islets of 10-week-old bAgo2KO mice and WT littermates (n = 4).
(C) Quantitative real-time PCR analysis of Cadm1, Ago1, and Ago2 after siRNA-mediated knockdown of Ago1 and Ago2 in MIN6 cells (n = 4).
(D) Western blot analysis of Ago2, Ago1, and Cadm1 after siRNA-mediated knockdown of Ago2 compared to scrambled control.
(E) Western blot analysis of Ago2 and Cadm1 in islets from 10-week-old dox-Ago2 mice and WT.
(F) Western blot analysis of Ago2, Ago1, and Cadm1 after overexpression of Ago2 compared to transfection control.
(G) Quantitative real-time PCR analysis ofCadm1 after immunopreciptation of Ago2 fromMIN6 cells untransfected (Ago2), after overexpression of Ago2 (OE), and
after inhibition of miR-375 with antisense oligonucleotides (AS375) (n = 4).
(H) b cell mass, morphometric analysis of insulin+ and glucagon+ cells, and ratio of BrdU to insulin+ cells in 18-week-old cadm1-knockout mice and littermates
(n = 4).
(I) Quantitative real-time PCR analysis ofCadm1,Gephyrin,Rasd1,Elavl4, andAgo2 in islets of ob/ob andWTmice at 16weeks of age (n = 5–6). Results presented
as mean ± SEM. *p < 0.05; **p < 0.01.
See also Figure S5.
Cell Metabolism
Ago2 Mediates Compensatory b Cell Expansion
cells of 04ob mice suppressed Ago2 expression compared to
ob/ob littermates (Figure 4J).
Argonaute2 Mediates miR-375 FunctionWe next measured the expression ofmiR-375-targeted genes in
islets from bAgo2KO mice and confirmed increased protein
expression in vivo (Figure S5A) (Tattikota et al., 2013).
Conversely, expression analysis of these miR-375 targets in
islets from dox-Ago2 mice showed decreased levels by quanti-
tative real-time PCR (Figure S5B). While immunoprecipitation
of Ago2 from untransfected MIN6 cells efficiently recovered
miR-375, we observed an enrichment of Gephyrin, Elavl4/HuD,
and Rasd1 in the Ago2-containing complexes compared to con-
trol pull-downs (Figures S5C and S5D). Moreover, overexpres-
sion (OE) of Ago2 recovered higher levels of these specific
mRNAs, whereas transfection of inhibitory antisense oligonucle-
otides against miR-375 (AS 375) depleted their presence in the
protein complex (Figure S5D). We also observed that expression
128 Cell Metabolism 19, 122–134, January 7, 2014 ª2014 Elsevier In
of the growth suppressor Cadm1 was increased in islets of
bAgo2KO mice, further indicating that the regulation of several
targets of miR-375 was dependent on Ago2 (Figures 5A and
5B) (Poy et al., 2009). The higher levels of miR-375 target genes
were accompanied by no change in miR-375 expression, indi-
cating that the loss of Ago2 can nullify the impact of abundant
miRNAs on their respective targets (Figure 5B). We next
measured Cadm1 expression after siRNA-mediated knockdown
of Ago2 in MIN6 cells and observed a similar increase, but not
after knockdown of Ago1 (Figures 5C and 5D). In addition,
increasing Ago2 levels in both islets of dox-Ago2 mice and in
MIN6 cells (Ago2OE) decreased Cadm1 expression (Figures 5E
and 5F). As observed with the other miR-375 targets, we de-
tected enrichment of Cadm1 in Ago2-containing complexes,
indicating its regulation was also dependent upon this member
of the Ago family (Figure 5G). In line with its established role as
a growth suppressor, morphometric analysis in cadm1-deficient
mice (cadm1KO) showed increased b cell mass and number and
c.

Cell Metabolism
Ago2 Mediates Compensatory b Cell Expansion
BrdU incorporation without any change in total pancreatic mass
(van der Weyden et al., 2006, 2012) (Figures 5H and S5E). Lastly,
consistent with observations in dox-Ago2 animals, quantitative
real-time PCR analysis in the islets of ob/ob mice and littermate
controls showed the miR-375 targets Cadm1, Gephyrin, Rasd1,
and Elavl4/HuD to be decreased, whereas Ago2 expression was
significantly upregulated (Figure 5I).
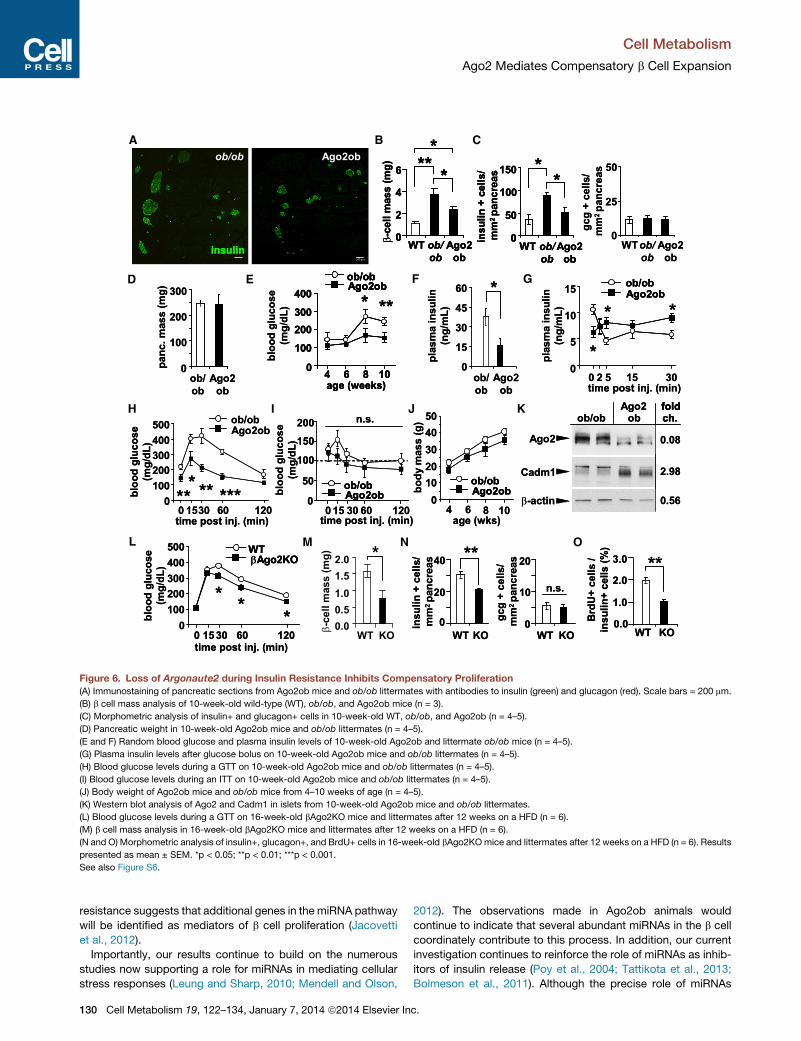
Loss of Argonaute2 Blocks Proliferation during InsulinResistanceTo address whether Ago2 mediates the compensatory expan-
sion of b cells during insulin resistance, we next crossed mice
carrying the Ago2-floxed allele onto the ob/ob background to
generate mice deficient in both Ago2 and leptin (Ago2ob). In
line with bAgo2KO mice, b cell mass and the number of insu-
lin-positive cells were significantly reduced in Ago2ob animals
compared to ob/ob littermates without any alterations in the
number of glucagon-positive cells or total pancreatic mass (Fig-
ures 6A–6D). Furthermore, random glucose levels and the corre-
sponding insulin levels were decreased, thereby underlining an
important functional role for Ago2 in the growth and function of
the b cell (Figures 6E and 6F). In spite of the decrease in b cell
mass, Ago2ob mice exhibited higher circulating insulin levels
after challenge and improved glucose tolerance, confirming
again that loss of Ago2 increases secretion in vivo (Figures 6G
and 6H). Insulin sensitivity, body weight, or food intake (5.2 ±
0.4 in ob/ob and 5.0 ± 0.3 g/day in Ago2ob mice) were not signif-
icantly altered, but the decrease in both circulating glucose and
insulin suggests insulin resistance has been partially attenuated
(Figures 6I and 6J). In addition, western blotting analysis of iso-
lated islets showed that loss of Ago2 expression resulted in
increased levels of the miR-375 target Cadm1 (Figure 6K).
Similar results in islet morphometry and glucose tolerance
were observed in bAgo2KO mice placed on a HFD, indicating
that the effect on b cell mass was consistent in multiple forms
of insulin resistance and, although extrapancreatic recombina-
tion has been shown with this Cre line, including in the hypothal-
amus, energy expenditure or food intake was not affected
(Figures 6L–6O and S6A–S6D).
Administration of the Ketogenic Diet to ob/ob MiceRestores miR-184 ExpressionPublished studies have shown that the administration of the
ketogenic diet improves insulin sensitivity and glycemic status
(Badman et al., 2009). To further support the functional relevance
of miR-184 and Ago2 in the b cell, we next tested whether miR-
184 is regulated after administering the ketogenic diet to C57BL/
6 mice (Keto mice). After 24 days on the diet, we observed �4-
fold increase of miR-184 in islets from Keto mice (Figure 7A).
As previously shown, Keto mice exhibited decreased body
weight and reduced glucose levels at steady state and during
an ITT in line with improved insulin sensitivity (Figures 7B, S7A,
and S7B). Consistent with mild �4-fold, overexpression of
miR-184, Keto mice exhibited reduced insulin levels and
impaired tolerance compared to control mice after a glucose
challenge; however, no changewas observed in b cell mass (Fig-
ures 7C, 7D, and S7C). Moreover, administration of the keto-
genic diet to ob/ob mice (Keto/ob) for 15 days was sufficient to
restore normal expression of miR-184; however, after 45 days,
Cell
we observed a�18-fold increase in the expression of this miRNA
in islets from Keto/ob mice compared to chow-fed, nonobese
littermate controls (Ch-WT) (Figure 7E). Keto/ob mice also ex-
hibited lower glucose levels during an ITT, reduced random
glucose and plasma insulin levels, and no change in body weight
(Figures 7F–7H, S7D, and S7E). Similar to Keto mice, Keto/ob
mice were relatively more glucose intolerant as a result of
decreased insulin release compared to Chow/ob littermates
(Figures 7I and 7J). These results may reflect a significant reduc-
tion in the demand for insulin because Keto/obmice are normo-
glycemic. Moreover, after 45 days on the ketogenic diet, we
observed a decrease in b cell mass and Ki-67+ b cells in Keto/
ob animals, and quantitative real-time PCR analysis at this time
point showed Ago2 and Slc25a22 expression to be significantly
reduced, whereas measurements produced by western blotting
showed Cadm1 to be increased (Figures 7K–7M, S7F, and S7G).
Taken together, these data further show that both miR-184 and
Ago2 expression are inversely regulated in accordance with
changes in the requirement for insulin.
DISCUSSION
Here, we show that the onset of insulin resistance induces the
silencing of miR-184 in order to promote the function of Ago2
in the pancreatic b cell. Our data suggest that miR-184 acts as
a ‘‘brake’’ on Ago2 that becomes released to increase prolifera-
tion and accommodate the elevated demand for insulin.
Moreover, we show that the increased expression of Ago2 will
facilitate the function ofmiR-375 in suppressing genes, including
Cadm1 in vivo. Our observations functionally associating miR-
184 together with Ago2 and miR-375 now identify a network
within the miRNA pathway that coordinately regulates the
compensatory proliferation of the b cell.
Interestingly, miR-184 is unique as the most downregulated
islet miRNA during insulin resistance, and additionally, adminis-
tration of the ketogenic diet in leptin-deficient ob/ob mice
rescued its expression. Furthermore, the increase of miR-184
expression in the islets of ob/ob mice after restoring insulin
sensitivity further underlines a dynamic role for the miRNA
pathway in regulating b cell growth and function according to
the demand for insulin. Published work identified the regulation
of miRNAs in the retina according to light levels, thereby linking
turnover of small RNAs with physiologic stimuli in neuronal cells;
together, our results may indicate another common property
between these cell types (Krol et al., 2010). Likewise, after
treatment with serotonin in Aplysia sea snails, miR-184 was
significantly downregulated in the nervous system, the site of
orthologous insulin expression (Rajasethupathy et al., 2009;
Floyd et al., 1999). Moreover, serotonin has been previously
shown to mediate compensatory expansion of the b cell during
pregnancy (Kim et al., 2010). In line with these studies, we
observed that miR-184 was transiently decreased at day 18.5
of gestation in C57BL/6 mice and that the expression of this
miRNA had been restored by day 5 in the postpartum phase.
Neither tryptophan hydroxlase 1 nor 2 (Tph1/2) were regulated
in the pancreatic islets of ob/ob mice, further suggesting that
multiple independent pathways promote proliferation in these
models (Rieck et al., 2009). However, the robust consistency of
the silencing ofmiR-184 in both models of pregnancy and insulin
Metabolism 19, 122–134, January 7, 2014 ª2014 Elsevier Inc. 129
F
time post inj. (min)
bloo
dgl
ucos
e(m
g/dL
)
***
ob/obAgo2ob
0100200300400500
0 1530 60 120****
*
time post inj. (min)
bloo
dgl
ucos
e(m
g/dL
)
***
ob/obAgo2ob
0100200300400500
0 1530 60 120****
*
A B
G
I
L M N
insu
lin +
cel
ls/
mm
2 pa
ncre
as
0
20
40
WT KO
**
gcg
+ ce
lls/
mm
2 pa
ncre
as
0
10
20
WT KO
n.s.
insu
lin +
cel
ls/
mm
2 pa
ncre
as
0
20
40
WT KO
**
gcg
+ ce
lls/
mm
2 pa
ncre
as
0
10
20
WT KO
n.s.B
rdU
+ ce
lls /
insu
lin+
cells
(%)
**
0.0
1.0
2.0
3.0
WT KO
Brd
U+
cells
/in
sulin
+ ce
lls (%
)
**
0.0
1.0
2.0
3.0
WT KO
0
5
10
15
0 52 15 30
plas
ma
insu
lin(n
g/m
L)
time post inj. (min)
*ob/obAgo2ob
*
*0
5
10
15
0 52 15 30
plas
ma
insu
lin(n
g/m
L)
time post inj. (min)
*ob/obAgo2obob/obAgo2ob
*
*
J
age (wks)
body
mas
s (g
)
ob/obAgo2ob
4 6 8 100
1020304050
age (wks)
body
mas
s (g
)
ob/obAgo2obob/obAgo2ob
4 6 8 100
1020304050
D E
0
15
30
45
60
ob/ob
Ago2ob
plas
ma
insu
lin(n
g/m
L)
*
0
15
30
45
60
ob/ob
Ago2ob
plas
ma
insu
lin(n
g/m
L)
*bl
ood
gluc
ose
(mg/
dL)
0
100
200300
400
4 6 8 10age (weeks)
* **
ob/obAgo2ob
bloo
d gl
ucos
e(m
g/dL
)
0
100
200300
400
4 6 8 10age (weeks)
* **
ob/obAgo2ob
0
100
200300
400
4 6 8 10age (weeks)
* **
ob/obAgo2obob/obAgo2ob
K
β-actin
Cadm1
0.08
2.98
ob/ob
Ago2
0.56
Ago2ob
foldch.
β-actin
Cadm1
0.08
2.98
ob/ob
Ago2
0.56
Ago2ob
foldch.foldch.
time post inj. (min)
bloo
dgl
ucos
e(m
g/dL
)
*
WTβAgo2KO
0100200300400500
0 15 30 60 120
**
time post inj. (min)
bloo
dgl
ucos
e(m
g/dL
)
*
WTβAgo2KOWTβAgo2KO
0100200300400500
0 15 30 60 120
**
0
50
100
150
200
0 60 120
bloo
d gl
ucos
e(m
g/dL
)
15 30time post inj. (min)
ob/obAgo2ob
n.s.
0
50
100
150
200
0 60 120
bloo
d gl
ucos
e(m
g/dL
)
15 30time post inj. (min)
ob/obAgo2obob/obAgo2ob
n.s.
O
0.00.51.01.52.0
β-ce
ll m
ass
(mg) *
WT KO
Ago2obob/ob
insulininsulin
β-ce
ll m
ass
(mg)
ob/ob
Ago2ob
WT
*
0
2
4
6 ***
gcg
+ ce
lls/
mm
2 pa
ncre
as
ob/ob
Ago2ob
0
25
50
WTinsu
lin +
cel
ls/
mm
2 pa
ncre
as
ob/ob
Ago2ob
*
0
50
100
150
WT
*
β-ce
ll m
ass
(mg)
ob/ob
Ago2ob
WT
*
0
2
4
6 ***
β-ce
ll m
ass
(mg)
ob/ob
Ago2ob
WT
*
0
2
4
6 ***
gcg
+ ce
lls/
mm
2 pa
ncre
as
ob/ob
Ago2ob
0
25
50
WTinsu
lin +
cel
ls/
mm
2 pa
ncre
as
ob/ob
Ago2ob
*
0
50
100
150
WT
*
insu
lin +
cel
ls/
mm
2 pa
ncre
as
ob/ob
Ago2ob
*
0
50
100
150
WT
*
H
C
0
100
200
300
panc
. mas
s (m
g)
ob/ob
Ago2ob
0
100
200
300
panc
. mas
s (m
g)
ob/ob
Ago2ob
Figure 6. Loss of Argonaute2 during Insulin Resistance Inhibits Compensatory Proliferation
(A) Immunostaining of pancreatic sections from Ago2ob mice and ob/ob littermates with antibodies to insulin (green) and glucagon (red). Scale bars = 200 mm.
(B) b cell mass analysis of 10-week-old wild-type (WT), ob/ob, and Ago2ob mice (n = 3).
(C) Morphometric analysis of insulin+ and glucagon+ cells in 10-week-old WT, ob/ob, and Ago2ob (n = 4–5).
(D) Pancreatic weight in 10-week-old Ago2ob mice and ob/ob littermates (n = 4–5).
(E and F) Random blood glucose and plasma insulin levels of 10-week-old Ago2ob and littermate ob/ob mice (n = 4–5).
(G) Plasma insulin levels after glucose bolus on 10-week-old Ago2ob mice and ob/ob littermates (n = 4–5).
(H) Blood glucose levels during a GTT on 10-week-old Ago2ob mice and ob/ob littermates (n = 4–5).
(I) Blood glucose levels during an ITT on 10-week-old Ago2ob mice and ob/ob littermates (n = 4–5).
(J) Body weight of Ago2ob mice and ob/ob mice from 4–10 weeks of age (n = 4–5).
(K) Western blot analysis of Ago2 and Cadm1 in islets from 10-week-old Ago2ob mice and ob/ob littermates.
(L) Blood glucose levels during a GTT on 16-week-old bAgo2KO mice and littermates after 12 weeks on a HFD (n = 6).
(M) b cell mass analysis in 16-week-old bAgo2KO mice and littermates after 12 weeks on a HFD (n = 6).
(N and O) Morphometric analysis of insulin+, glucagon+, and BrdU+ cells in 16-week-old bAgo2KOmice and littermates after 12 weeks on a HFD (n = 6). Results
presented as mean ± SEM. *p < 0.05; **p < 0.01; ***p < 0.001.
See also Figure S6.
Cell Metabolism
Ago2 Mediates Compensatory b Cell Expansion
resistance suggests that additional genes in the miRNA pathway
will be identified as mediators of b cell proliferation (Jacovetti
et al., 2012).
Importantly, our results continue to build on the numerous
studies now supporting a role for miRNAs in mediating cellular
stress responses (Leung and Sharp, 2010; Mendell and Olson,
130 Cell Metabolism 19, 122–134, January 7, 2014 ª2014 Elsevier In
2012). The observations made in Ago2ob animals would
continue to indicate that several abundant miRNAs in the b cell
coordinately contribute to this process. In addition, our current
investigation continues to reinforce the role of miRNAs as inhib-
itors of insulin release (Poy et al., 2004; Tattikota et al., 2013;
Bolmeson et al., 2011). Although the precise role of miRNAs
c.

F
H
AChowKetoChowKeto
time post inj. (min)
bloo
d gl
ucos
e(m
g/dL
)
0
200
400
600
30 60 120150
****
***
B C
*
Chow/obKeto/ob
bloo
d gl
ucos
e(m
g/dL
)
0100200300400
fast fed
***
Chow/obKeto/ob
bloo
d gl
ucos
e(m
g/dL
)
0100200300400
fast fed0
100200300400
fast fed
**Chow/obKeto/ob
plas
ma
insu
lin(n
g/m
L)
010203040 **
Chow/obKeto/ob
plas
ma
insu
lin(n
g/m
L)
010203040 **
time post inj. (min)
bloo
d gl
ucos
e(m
g/dL
)
0100200300400500
0 30 60 12015
Chow/obKeto/ob
* ** **
time post inj. (min)
bloo
d gl
ucos
e(m
g/dL
)
0100200300400500
0 30 60 12015
Chow/obKeto/obChow/obKeto/ob
* ** **
***
ChowKeto
**0.00.51.01.52.0
0 52.5 15
*
plas
ma
insu
lin(n
g/m
L)
*
time post inj. (min)
ChowKetoChowKeto
**0.00.51.01.52.0
0 52.5 15
*
plas
ma
insu
lin(n
g/m
L)
*
time post inj. (min)
E
L
G
D
Ago
2 m
RN
A (A
U)
0.00.51.01.52.0
*Chow/obKeto/ob
45 d15 d5 d
* *
Slc2
5a22
mR
NA
(AU
)
0.00.51.01.52.0
45 d15 d5 d
Chow/obKeto/ob
Ago
2 m
RN
A (A
U)
0.00.51.01.52.0
*Chow/obKeto/obChow/obKeto/ob
45 d15 d5 d
* *
Slc2
5a22
mR
NA
(AU
)
0.00.51.01.52.0
45 d15 d5 d
Chow/obKeto/obChow/obKeto/ob
M
**
0100200300400500
time post inj. (min)0 30 60 12015
bloo
d gl
ucos
e(p
erce
nt c
hang
e)
** **
Chow/obKeto/ob
**
0100200300400500
time post inj. (min)0 30 60 12015
bloo
d gl
ucos
e(p
erce
nt c
hang
e)
** **
Chow/obKeto/obChow/obKeto/ob
0
10
20
30
0 10 20 30time post inj. (min)
plas
ma
insu
lin(n
g/m
L)
5*****
Chow/obKeto/ob
0
10
20
30
0 10 20 30time post inj. (min)
plas
ma
insu
lin(n
g/m
L)
5*****
Chow/obKeto/obChow/obKeto/ob
I J K
rela
tive
expr
essi
on(n
orm
aliz
ed to
U6) miR-184
* ******
0123
10152025
n.s.
Ch Ch Keto Ch Keto
ob/ob ob/ob5 d 15 d
WT
***
Ch Keto
ob/ob45 d
rela
tive
expr
essi
on(n
orm
aliz
ed to
U6) miR-184
* ******
0123
10152025
n.s.
Ch Ch Keto Ch Keto
ob/ob ob/ob5 d 15 d
WT
***
Ch Keto
ob/ob45 d
***
Ch Keto
ob/ob45 d
rel.
expr
essi
on(n
orm
aliz
ed to
U6)
miR-375
Ch Keto Ch Keto
ob/ob5 d
ob/ob45 d
0123 n.s.
n.s.
4
rel.
expr
essi
on(n
orm
aliz
ed to
U6)
miR-375miR-375
Ch Keto Ch Keto
ob/ob5 d
ob/ob45 d
0123 n.s.
n.s.
4
Chow/ob insulin Keto/obChow/ob insulin Keto/ob
**
β-ce
ll m
ass
(mg) **
05
101520 **
Ch Ch Ketoob/obWT
β-ce
ll m
ass
(mg) **
05
101520 **
Ch Ch Ketoob/obWT
0
50
100
150
0 30 6015 120time post inj. (min)
bloo
d gl
ucos
e(m
g/dL
)
**** ** * *
ChowKeto
0
50
100
150
0 30 6015 120time post inj. (min)
bloo
d gl
ucos
e(m
g/dL
)
**** ** * *
ChowKetoChowKeto
ChowKeto
miR-184
miR-375
rela
tive
expr
essi
onno
rmal
ized
to U
6 (A
U)
012345 ***
n.s.
ChowKeto
miR-184
miR-375
rela
tive
expr
essi
onno
rmal
ized
to U
6 (A
U)
012345 ***
ChowKetoChowKeto
miR-184
miR-375
rela
tive
expr
essi
onno
rmal
ized
to U
6 (A
U)
012345 ***
n.s.
Figure 7. Administration of the Ketogenic Diet during Insulin Resistance Rescues miR-184 Expression
(A) Quantitative real-time PCR analysis ofmiR-184 andmiR-375 in islets of 10-week-old C57BL/6mice on chow (Chow) or ketogenic diet (Keto) for 24 days (n = 4).
(B) Blood glucose levels during an ITT on 10-week-old Chow and Keto mice for 24 days (n = 4–5).
(C and D) Plasma insulin and blood glucose levels after glucose challenge on 10-week-old Chow and Keto mice for 24 days (n = 4–5).
(E) Quantitative real-time PCR analysis of miR-184 and miR-375 in islets of 16-week-old ob/ob mice on chow or ketogenic diet and WT littermates (n = 4).
(F and G) Blood glucose and random plasma insulin levels in 16-week-old ob/ob mice on chow (Chow/ob) or ketogenic diet (Keto/ob) for 15 days (n = 4).
(H) Blood glucose levels during an ITT on 16-week-old ob/ob mice on chow or ketogenic diet for 15 days (n = 4–5).
(I and J) Plasma insulin and blood glucose levels after glucose challenge on 16-week-old ob/ob mice on chow or ketogenic diet for 15 days (n = 4-5).
(K and L) Quantification of b cell mass after immunostaining pancreatic sections for insulin (green) of 16-week-old ob/ob mice on chow or ketogenic diet for
45 days (n = 3). Scale bars = 200 mm.
(M) Quantitative real-time PCR analysis of Ago2 and Slc25a22 in islets of 16-week-old ob/ob mice on chow or ketogenic diet (n = 4–5). Results presented as
mean ± SEM. *p < 0.05; **p < 0.01; ***p < 0.001.
See also Figure S7.
Cell Metabolism
Ago2 Mediates Compensatory b Cell Expansion
remains unclear, the accumulating evidence may suggest that
‘‘brakes’’ on gene expression are essential in managing the
dynamic nature of both first- and second-phase insulin release
(Wang and Thurmond, 2009). Of note, the increased release of
insulin after loss of Ago2 expression in the b cells of ob/ob
mice improved many aspects of the diabetic phenotype,
Cell
including circulating glucose and insulin levels, and glucose
tolerance; however, this came at the expense of b cell mass
and may suggest that the miRNA pathway mediates a delicate
balance between both growth and secretion. Many of the genes
being targeted by small RNAs in the b cell may regulate this
balance via independent mechanisms. Several studies indicate
Metabolism 19, 122–134, January 7, 2014 ª2014 Elsevier Inc. 131

Cell Metabolism
Ago2 Mediates Compensatory b Cell Expansion
F-actin and the microtubule networks are actively engaged in
managing insulin release and many of the targets of miR-375,
including Cadm1 and Gephyrin, may contribute to the remodel-
ing of the cytoskeleton (Seino et al., 2011; Charrier et al., 2010;
Masuda et al., 2010). In addition, published studies have already
shown that during pregnancy, Rasd1 acts as a growth suppres-
sor and is inhibited during islet expansion and then is increased
in the postpartum phase when islet mass is restored (Lellis-
Santos et al., 2012). Also, inhibition of the RNA-binding protein
HuD/Elavl4 was shown to promote expression of insulin (Lee
et al., 2012). Lastly, as evidenced in the differences in the pheno-
types of dox-184 and bAgo2KOmice, our observations support-
ing Slc25a22, a regulator of glutamate transport and secretion in
the b cell, as an additional target of miR-184 indicates that this
miRNA may also regulate both proliferation and exocytosis
through the targeting of different genes (Casimir et al., 2009).
Future studies will presumably continue to establish that
numerous targets of all miRNAs conspire to orchestrate the
demands placed on the cell during insulin resistance, including
growth and the continual recruitment of insulin-containing gran-
ules. It will also remain to be seen whether specificmiRNA-medi-
ated gene regulations are unique to their metabolic context,
including insulin resistance, fasting, hypoxia, and cold exposure
(Dumortier et al., 2013). Published studies have illustrated
reduced expression of miR-375 in the pancreatic islets of db/
dbmice andGoto-Kakizaki rats, suggesting that differential roles
may exist for miRNAs and their targets according to alterations in
the metabolic environment (Zhu et al., 2013; El Ouaamari et al.,
2008).
Therefore, it will be important to understand the factors that
dictate the kinetics of miRNA regulation in the b cell. It also re-
mains to be determined whether the same genes that expedite
the decay ofmiR-184 during insulin resistance are the same fac-
tors that promote its expression as sensitivity improves after
administration of the ketogenic diet. Moreover, the increase in
miR-184 that results from this diet and the resulting suppression
of insulin release indicate that miRNAs play a significant role in
the maintenance of steady-state circulating glucose and insulin
levels. Furthermore, the identification of increased miR-184
expression can explain the simultaneous occurrence of both
improved insulin sensitivity and glucose intolerance observed
in mice on ketogenic diet. Although the results appear paradox-
ical at first, this may be explained by the drastic reduction in both
circulating glucose and the demand for insulin. Another apparent
conflict appears in the mouse models exhibiting hypersecretion
and decreased b cell mass. However, in spite of the reduction in
b cell mass in Ago2obmice (35% lower compared to ob/ob litter-
mates), the decrease is significantly below the threshold that
would induce hyperglycemia (Orland et al., 1985).Ago2-deficient
models still maintain the capacity to transiently secrete higher
amounts of insulin because b cells release a relatively small per-
centage of its stored granule pool in response to glucose (Seino
et al., 2011). Conversely, although increased expression of Ago2
causes transient glucose intolerance in dox-Ago2 mice, these
mice have normal circulating glucose and insulin levels and insu-
lin sensitivity, and therefore it is unlikely that the increase in Ago2
levels in the islets of ob/obmice plays a causal role in the hyper-
glycemia or hyperinsulinemia. As shown in dox-184ob animals,
restoring miR-184 in the b cell and reducing Ago2 levels in an
132 Cell Metabolism 19, 122–134, January 7, 2014 ª2014 Elsevier In
insulin-resistant model exacerbated the diabetic phenotype. In
contrast, reducing glucose levels and the demand for insulin in
ob/ob mice by administration of ketogenic diet to ultimately
suppress Ago2 and restore b cell mass underlines an important
function this gene plays in the adaptation of the b cell according
to metabolic need.
Many aspects of b cell physiology remain largely unexplored in
terms of nutrient sensing, cellular metabolism, and intercellular
signaling pathways. Our observations on the effects of the keto-
genic diet on miRNA function in the b cell unify several poorly
understood mechanisms and reinforce the potential in studying
the role of small RNAs in physiologic stresses. Continued
emphasis on characterizing the functional role of miRNA targets
in this cell type should bring clarity in understanding how the
network of small RNAs contribute to maintaining essential meta-
bolic processes and how their failure ultimately leads to disease.
EXPERIMENTAL PROCEDURES
Generation and Maintenance of Animals
Mice were maintained on a 12 hr light/dark cycle with ad libitum access to
regular chow food, a HFD (containing 60% kcal fat, cat. no. E15741-347, ssniff
Spezialdiaten GmbH), or a ketogenic diet (cat. No. E15149-30, ssniff Spezial-
diaten GmbH) in accordance with requirements established by Landesamt fur
Gesundheit und Soziales (Lageso). All experimental procedures were
approved under protocols G 0357/10, O 0405/09, and T 0436/08. Results
were consistent in both genders; however, data from female mice are not
shown. Total Cadm1 knockouts and floxed Ago2 mice were generated as
described (van der Weyden et al., 2006; O’Carroll et al., 2007). The total
miR-184 knockout was generated by D. Aberdam and R. Shalom-Feuerstein
(Institut Clinique de la Souris) and genotyped with forward and reverse primers
50 ACTGAACATTATTTCATGGGCCGGG and 50 AACTACAACTGTTTGGCT
AGCAGGGTG (knockout allele) and the substitute reverse primer 50 CGCT
GAGACCTTGTGATAAACCGTT (wild-type allele). To generate dox-184
mice, a 292 bp genome fragment encompassing miR-184 precursor was
amplified using the primers 50 TGCTGAAGAGTGGCCTGCTAGG and 50
CTCCTCCTCACGTCCTGTGGTA, cloned into a pTRE-2 vector (Clontech),
and the resulting construct was used for microinjections. The Ago2-tetO
mice were generated from a mouse Ago2 cDNA construct (a kind gift of G.
Meister, University of Regensburg) (Nir et al., 2007).
Gene Expression Analysis in Mouse and Human Islets
Small RNA sequencing and expression analysis from cell lines and mouse
islets was performed as described; primers used with FastStart SYBR Green
PCR Master Mix (Roche) are available upon request (Tattikota et al., 2013).
Relative quantification of Ago genes was determined after normalization with
standard curves established with mouse Ago1-4 cDNA constructs
(G. Meister). RIP experiments using Ago1 and Ago2 antibodies were per-
formed as described (Keene et al., 2006). Human islets were obtained with
research consent and selected based on islet cell purity and isolated at the
University of Virginia, Oxford DRWF Human Islet Isolation Facility and Prodo
Laboratories (USA) (Moran et al., 2012). Information for nondiabetic and
diabetic donors is provided in Table S2.
Analytic Procedures
Insulin measurements from plasma and pancreatic extracts weremeasured by
radioimmunoassay (RIA) (Millipore), and blood glucose and luciferase assays
were measured as described previously (Poy et al., 2009). Islet morphometric
analysis after intraperitoneal injections of BrdU on four consecutive days
(50 mg/g BW, Sigma B5002) was performed on 8 mm sections of paraffin-
embedded pancreas approximately 150–200 mm apart. Sections were
dewaxed, washed, and stained for insulin (Dako A0564), glucagon (Millipore
AB932), BrdU (Abcam ab6326), Ki-67 (Dako), or TUNEL (Roche cat.
no.12156792910). Cell numbers from all islets in 3–7 sections were counted
with ImageJ software from 20X images obtained using a Zeiss LSM700
c.

Cell Metabolism
Ago2 Mediates Compensatory b Cell Expansion
(Schneider et al., 2012). b cell mass was measured as the ratio of insulin-
positive cell area to the total tissue area, multiplied by the weight of the
pancreas using Imaris software (Bitplane). In vivo insulin release and glucose
(GTT) or insulin (ITT) tolerance tests were performed following a 6 hr fast and
injected intraperitoneally with either glucose (2 g/kg BW) or insulin
(0.75 U/kg BW).
Cell Culture, Immunoprecipitation, and Antibodies
MIN6 cells were cultured in Dulbecco’s modified Eagle’s medium (Invitrogen)
containing 4.5 g/l glucose supplemented with 15% v/v heat-inactivated FCS,
50 mM b-mercaptoethanol, and 50 mg/ml penicillin, and 100 mg/ml strepto-
mycin and insulin release was performed as described (Poy et al., 2004).
Antibodies were as described: Gephyrin (BD 610584), Rasd1 (Millipore
AB15794), Ago2 (for immunoprecipitation, Wako 018-22021), Ago2 (for
western blotting, Cell Signaling C34C6), Ago1 (MBL RN028PW), Slc25a22
(Sigma AV44041), HuD/Elavl4 (Santa Cruz sc-48421), g-tubulin (Sigma
T6557), Cadm1 (Sigma S4945), and b-actin (Sigma). Guinea pig anti-insulin
and rabbit anti-glucagon antibodies (Millipore) were used on paraffin-
embedded pancreata fixed in 4% paraformaldehyde for 3 hr.
Statistical Analysis
Pearson’s R coefficient and independent two-groupMann-Whitney tests were
implemented using the R statistical package (http://www.r-project.org). Com-
parisons between data sets with two groups were evaluated using an unpaired
Student’s t test. ANOVA analysis was performed for comparisons of three or
more groups. A p value of less than or equal to 0.05 was considered statisti-
cally significant. Results presented as mean ± SEM. *p < 0.05; **p < 0.01;
***p < 0.001.
ACCESSION NUMBERS
The NCBI Gene Expression Omnibus (GEO) accession number for referenced
array data is GSE46623.
SUPPLEMENTAL INFORMATION
Supplemental Information includes seven figures, Supplemental Experimental
Procedures, and two tables and can be found with this article online at http://
dx.doi.org/10.1016/j.cmet.2013.11.015.
ACKNOWLEDGMENTS
This work was funded by the Helmholtz Gemeinschaft, an ERC Starting Grant
(IsletVasc 260744), the Fritz Thyssen Stiftung, the Deutsches Zentrum fuer
Herz-Kreislauf Forschung, E.V. (DZHK), ANR11-03 erare2-SkinDev (to D.A.),
Swedish Diabetes Association, Swedish Research Council, and the Wellcome
Trust (095101/Z/10/Z [to A.L.G.] and 101033/Z/13/Z [to J.F.]). The authors
thank L.v.d.Weyden for providing the Cadm1 knockout mouse and T. Horvath,
M. Landthaler, T. Willnow, M. Gotthardt, F. Spagnoli, R. Schweiker,
K.L. Brayman, H.P. Rahn, M. Richter, A. Sporbert, and the MDC Microscopy
Core Facility for assistance in conducting this work.
Received: May 4, 2013
Revised: July 26, 2013
Accepted: November 10, 2013
Published: December 19, 2013
REFERENCES
Badman, M.K., Kennedy, A.R., Adams, A.C., Pissios, P., and Maratos-Flier, E.
(2009). A very low carbohydrate ketogenic diet improves glucose tolerance in
ob/ob mice independently of weight loss. Am. J. Physiol. Endocrinol. Metab.
297, E1197–E1204.
Bartel, D.P. (2009). MicroRNAs: target recognition and regulatory functions.
Cell 136, 215–233.
Cell
Bolmeson, C., Esguerra, J.L.S., Salehi, A., Speidel, D., Eliasson, L., and Cilio,
C.M. (2011). Differences in islet-enriched miRNAs in healthy and glucose intol-
erant human subjects. Biochem. Biophys. Res. Commun. 404, 16–22.
Casimir, M., Lasorsa, F.M., Rubi, B., Caille, D., Palmieri, F., Meda, P., and
Maechler, P. (2009). Mitochondrial glutamate carrier GC1 as a newly identified
player in the control of glucose-stimulated insulin secretion. J. Biol. Chem.
284, 25004–25014.
Charrier, C., Machado, P., Tweedie-Cullen, R.Y., Rutishauser, D., Mansuy,
I.M., and Triller, A. (2010). A crosstalk between b1 and b3 integrins controls
glycine receptor and gephyrin trafficking at synapses. Nat. Neurosci. 13,
1388–1395.
Dumortier, O., Hinault, C., and Van Obberghen, E. (2013). MicroRNAs and
metabolism crosstalk in energy homeostasis. Cell Metab. 18, 312–324.
Ebert, M.S., and Sharp, P.A. (2012). Roles for microRNAs in conferring robust-
ness to biological processes. Cell 149, 515–524.
El Ouaamari, A., Baroukh, N., Martens, G.A., Lebrun, P., Pipeleers, D., and van
Obberghen, E. (2008). miR-375 targets 30-phosphoinositide-dependentprotein kinase-1 and regulates glucose-induced biological responses in
pancreatic beta-cells. Diabetes 57, 2708–2717.
Floyd, P.D., Li, L., Rubakhin, S.S., Sweedler, J.V., Horn, C.C., Kupfermann, I.,
Alexeeva, V.Y., Ellis, T.A., Dembrow, N.C., Weiss, K.R., and Vilim, F.S. (1999).
Insulin prohormone processing, distribution, and relation to metabolism in
Aplysia californica. J. Neurosci. 19, 7732–7741.
Friedman, R.C., Farh, K.K.-H., Burge, C.B., and Bartel, D.P. (2009). Most
mammalian mRNAs are conserved targets of microRNAs. Genome Res. 19,
92–105.
Hara, M., Wang, X., Kawamura, T., Bindokas, V.P., Dizon, R.F., Alcoser, S.Y.,
Magnuson, M.A., and Bell, G.I. (2003). Transgenic mice with green fluorescent
protein-labeled pancreatic b -cells. Am. J. Physiol. Endocrinol. Metab. 284,
E177–E183.
Herrera, P.L. (2000). Adult insulin- and glucagon-producing cells differentiate
from two independent cell lineages. Development 127, 2317–2322.
Hock, J., andMeister, G. (2008). The Argonaute protein family. GenomeBiol. 9,
210.
Jacovetti, C., Abderrahmani, A., Parnaud, G., Jonas, J.-C., Peyot, M.-L.,
Cornu, M., Laybutt, R., Meugnier, E., Rome, S., Thorens, B., et al. (2012).
MicroRNAs contribute to compensatory b cell expansion during pregnancy
and obesity. J. Clin. Invest. 122, 3541–3551.
Keene, J.D., Komisarow, J.M., and Friedersdorf, M.B. (2006). RIP-Chip: the
isolation and identification of mRNAs, microRNAs and protein components
of ribonucleoprotein complexes from cell extracts. Nat. Protoc. 1, 302–307.
Kim, H., Toyofuku, Y., Lynn, F.C., Chak, E., Uchida, T., Mizukami, H., Fujitani,
Y., Kawamori, R., Miyatsuka, T., Kosaka, Y., et al. (2010). Serotonin regulates
pancreatic beta cell mass during pregnancy. Nat. Med. 16, 804–808.
Kozomara, A., and Griffiths-Jones, S. (2011). miRBase: integrating microRNA
annotation and deep-sequencing data. Nucleic Acids Res. 39 (Database
issue), D152–D157.
Krol, J., Busskamp, V., Markiewicz, I., Stadler, M.B., Ribi, S., Richter, J.,
Duebel, J., Bicker, S., Fehling, H.J., Schubeler, D., et al. (2010).
Characterizing light-regulated retinal microRNAs reveals rapid turnover as a
common property of neuronal microRNAs. Cell 141, 618–631.
Kultz, D. (2005). Molecular and evolutionary basis of the cellular stress
response. Annu. Rev. Physiol. 67, 225–257.
Lee, E.K., Kim, W., Tominaga, K., Martindale, J.L., Yang, X., Subaran, S.S.,
Carlson, O.D., Mercken, E.M., Kulkarni, R.N., Akamatsu, W., et al. (2012).
RNA-binding protein HuD controls insulin translation. Mol. Cell 45, 826–835.
Lellis-Santos, C., Sakamoto, L.H., Bromati, C.R., Nogueira, T.C.A., Leite, A.R.,
Yamanaka, T.S., Kinote, A., Anhe, G.F., and Bordin, S. (2012). The regulation of
Rasd1 expression by glucocorticoids and prolactin controls peripartum
maternal insulin secretion. Endocrinology 153, 3668–3678.
Leung, A.K.L., and Sharp, P.A. (2010). MicroRNA functions in stress
responses. Mol. Cell 40, 205–215.
Metabolism 19, 122–134, January 7, 2014 ª2014 Elsevier Inc. 133
Cell Metabolism
Ago2 Mediates Compensatory b Cell Expansion
Leung, A.K.L., Calabrese, J.M., and Sharp, P.A. (2006). Quantitative analysis of
Argonaute protein reveals microRNA-dependent localization to stress gran-
ules. Proc. Natl. Acad. Sci. USA 103, 18125–18130.
Masuda, M., Maruyama, T., Ohta, T., Ito, A., Hayashi, T., Tsukasaki, K.,
Kamihira, S., Yamaoka, S., Hoshino, H., Yoshida, T., et al. (2010). CADM1
interacts with Tiam1 and promotes invasive phenotype of human T-cell
leukemia virus type I-transformed cells and adult T-cell leukemia cells.
J. Biol. Chem. 285, 15511–15522.
Mendell, J.T., and Olson, E.N. (2012). MicroRNAs in stress signaling and
human disease. Cell 148, 1172–1187.
Moran, I., Akerman, I., van de Bunt, M., Xie, R., Benazra, M., Nammo, T.,
Arnes, L., Naki�c, N., Garcıa-Hurtado, J., Rodrıguez-Seguı, S., et al. (2012).
Human b cell transcriptome analysis uncovers lncRNAs that are tissue-spe-
cific, dynamically regulated, and abnormally expressed in type 2 diabetes.
Cell Metab. 16, 435–448.
Muoio, D.M., and Newgard, C.B. (2008). Mechanisms of disease: molecular
and metabolic mechanisms of insulin resistance and beta-cell failure in type
2 diabetes. Nat. Rev. Mol. Cell Biol. 9, 193–205.
Nir, T., Melton, D.A., and Dor, Y. (2007). Recovery from diabetes in mice by
beta cell regeneration. J. Clin. Invest. 117, 2553–2561.
O’Carroll, D., Mecklenbrauker, I., Das, P.P., Santana, A., Koenig, U., Enright,
A.J., Miska, E.A., and Tarakhovsky, A. (2007). A Slicer-independent role for
Argonaute 2 in hematopoiesis and the microRNA pathway. Genes Dev. 21,
1999–2004.
Orland, M.J., Chyn, R., and Permutt, M.A. (1985). Modulation of proinsulin
messenger RNA after partial pancreatectomy in rats. Relationships to glucose
homeostasis. J. Clin. Invest. 75, 2047–2055.
Poy, M.N., Eliasson, L., Krutzfeldt, J., Kuwajima, S., Ma, X., Macdonald, P.E.,
Pfeffer, S., Tuschl, T., Rajewsky, N., Rorsman, P., and Stoffel, M. (2004). A
pancreatic islet-specific microRNA regulates insulin secretion. Nature 432,
226–230.
Poy, M.N., Hausser, J., Trajkovski, M., Braun, M., Collins, S., Rorsman, P.,
Zavolan, M., and Stoffel, M. (2009). miR-375 maintains normal pancreatic
alpha- and beta-cell mass. Proc. Natl. Acad. Sci. USA 106, 5813–5818.
Rajasethupathy, P., Fiumara, F., Sheridan, R., Betel, D., Puthanveettil, S.V.,
Russo, J.J., Sander, C., Tuschl, T., and Kandel, E. (2009). Characterization
of small RNAs in Aplysia reveals a role for miR-124 in constraining synaptic
plasticity through CREB. Neuron 63, 803–817.
Rhodes, C.J. (2005). Type 2 diabetes-a matter of beta-cell life and death?
Science 307, 380–384.
134 Cell Metabolism 19, 122–134, January 7, 2014 ª2014 Elsevier In
Rieck, S., White, P., Schug, J., Fox, A.J., Smirnova, O., Gao, N., Gupta, R.K.,
Wang, Z.V., Scherer, P.E., Keller, M.P., et al. (2009). The transcriptional
response of the islet to pregnancy in mice. Mol. Endocrinol. 23, 1702–1712.
Schneider, C.A., Rasband, W.S., and Eliceiri, K.W. (2012). NIH Image to
ImageJ: 25 years of image analysis. Nat. Methods 9, 671–675.
Seino, S., Shibasaki, T., and Minami, K. (2011). Dynamics of insulin secretion
and the clinical implications for obesity and diabetes. J. Clin. Invest. 121,
2118–2125.
Spriggs, K.A., Bushell, M., and Willis, A.E. (2010). Translational regulation of
gene expression during conditions of cell stress. Mol. Cell 40, 228–237.
Steil, G.M., Trivedi, N., Jonas, J.C., Hasenkamp, W.M., Sharma, A., Bonner-
Weir, S., andWeir, G.C. (2001). Adaptation of beta-cell mass to substrate over-
supply: enhanced function with normal gene expression. Am. J. Physiol.
Endocrinol. Metab. 280, E788–E796.
Tattikota, S.G., Sury, M.D., Rathjen, T., Wessels, H.-H., Pandey, A.K., You, X.,
Becker, C., Chen, W., Selbach, M., and Poy, M.N. (2013). Argonaute2 regu-
lates the pancreatic b-cell secretome. Mol. Cell. Proteomics 12, 1214–1225.
Wang, Z., and Thurmond, D.C. (2009). Mechanisms of biphasic insulin-granule
exocytosis - roles of the cytoskeleton, small GTPases and SNARE proteins.
J. Cell Sci. 122, 893–903.
Wang, D., Zhang, Z., O’Loughlin, E., Lee, T., Houel, S., O’Carroll, D.,
Tarakhovsky, A., Ahn, N.G., and Yi, R. (2012). Quantitative functions of
Argonaute proteins in mammalian development. Genes Dev. 26, 693–704.
van de Bunt, M., Gaulton, K.J., Parts, L., Moran, I., Johnson, P.R., Lindgren,
C.M., Ferrer, J., Gloyn, A.L., and McCarthy, M.I. (2013). The miRNA profile of
human pancreatic islets and beta-cells and relationship to type 2 diabetes
pathogenesis. PLoS ONE 8, e55272.
van der Weyden, L., Arends, M.J., Chausiaux, O.E., Ellis, P.J., Lange, U.C.,
Surani, M.A., Affara, N., Murakami, Y., Adams, D.J., and Bradley, A. (2006).
Loss of TSLC1 causes male infertility due to a defect at the spermatid stage
of spermatogenesis. Mol. Cell. Biol. 26, 3595–3609.
van derWeyden, L., Arends, M.J., Rust, A.G., Poulogiannis, G., McIntyre, R.E.,
and Adams, D.J. (2012). Increased tumorigenesis associated with loss of the
tumor suppressor gene Cadm1. Mol. Cancer 11, 29.
Zhao, E., Keller, M.P., Rabaglia, M.E., Oler, A.T., Stapleton, D.S., Schueler,
K.L., Neto, E.C., Moon, J.Y., Wang, P., Wang, I.-M., et al. (2009). Obesity
and genetics regulate microRNAs in islets, liver, and adipose of diabetic
mice. Mamm. Genome 20, 476–485.
Zhu, Y., You, W., Wang, H., Li, Y., Qiao, N., Shi, Y., Zhang, C., Bleich, D., and
Han, X. (2013). MicroRNA-24/MODY gene regulatory pathway mediates
pancreatic beta-cell dysfunction. Diabetes 62, 3194–3206.
c.