CLASP Mediates Microtubule Repair by ... - Cell Press
21
Report CLASP Mediates Microtubule Repair by Restricting Lattice Damage and Regulating Tubulin Incorporation Graphical Abstract Highlights d CLASP stabilizes damaged microtubule lattices d CLASP converts partial protofilament assemblies into complete tubes d CLASP promotes complete repair of microtubule lattice defects d CLASP inhibits softening of microtubules bent by hydrodynamic flow Authors Amol Aher, Dipti Rai, Laura Schaedel, ..., Laurent Blanchoin, Manuel Thery, Anna Akhmanova Correspondence [email protected] In Brief Using in vitro reconstitution assays combined with laser microsurgery and microfluidics, Aher et al. show that CLASP, a positive regulator of microtubule growth, promotes microtubule repair by stabilizing incomplete lattices and stimulating continuous tubulin incorporation into damaged sites. Microtubule lattice damage (laser, mechanical stress) CLASP + tubulin Tubulin alone Complete repair Partial repair GTP- tubulin GDP- tubulin Aher et al., 2020, Current Biology 30, 2175–2183 June 8, 2020 ª 2020 The Author(s). Published by Elsevier Inc. https://doi.org/10.1016/j.cub.2020.03.070 ll
-
Upload
khangminh22 -
Category
Documents
-
view
0 -
download
0
Transcript of CLASP Mediates Microtubule Repair by ... - Cell Press

Report
CLASP Mediates Microtub
ule Repair by RestrictingLattice Damage and Regulating TubulinIncorporationGraphical Abstract
Microtubule lattice damage (laser, mechanical stress)
CLASP + tubulinTubulin alone
Complete repairPartial repair
GTP-tubulin
GDP-tubulin
Highlights
d CLASP stabilizes damaged microtubule lattices
d CLASP converts partial protofilament assemblies into
complete tubes
d CLASP promotes complete repair of microtubule lattice
defects
d CLASP inhibits softening of microtubules bent by
hydrodynamic flow
Aher et al., 2020, Current Biology 30, 2175–2183June 8, 2020 ª 2020 The Author(s). Published by Elsevier Inc.https://doi.org/10.1016/j.cub.2020.03.070
Authors
Amol Aher, Dipti Rai,
Laura Schaedel, ..., Laurent Blanchoin,
Manuel Thery, Anna Akhmanova
In Brief
Using in vitro reconstitution assays
combined with laser microsurgery and
microfluidics, Aher et al. show that
CLASP, a positive regulator of
microtubule growth, promotes
microtubule repair by stabilizing
incomplete lattices and stimulating
continuous tubulin incorporation into
damaged sites.
ll
OPEN ACCESS
llReport
CLASP Mediates Microtubule Repairby Restricting Lattice Damageand Regulating Tubulin IncorporationAmol Aher,1 Dipti Rai,1 Laura Schaedel,2 Jeremie Gaillard,2 Karin John,3 Qingyang Liu,1 Maarten Altelaar,4
Laurent Blanchoin,2,5 Manuel Thery,2,5 and Anna Akhmanova1,6,*1Cell Biology, Neurobiology and Biophysics, Department of Biology, Faculty of Science, Utrecht University, Padualaan 8, 3584 CH Utrecht,
the Netherlands2University of Grenoble-Alpes, CEA, CNRS, INRA, Interdisciplinary Research Institute of Grenoble, Laboratoire de Phyiologie Cellulaire &V�eg�etale, CytoMorpho Lab, 38054 Grenoble, France3University of Grenoble-Alpes, CNRS, Laboratoire Interdisciplinaire de Physique, 38000 Grenoble, France4Biomolecular Mass Spectrometry and Proteomics, Bijvoet Center for Biomolecular Research, Utrecht Institute for Pharmaceutical Sciences
and the Netherlands Proteomics Centre, Utrecht University, Padualaan 8, 3584 CH Utrecht, the Netherlands5Universit�e de Paris, INSERM, CEA, Institut de Recherche Saint Louis, U 976, CytoMorpho Lab, 75010 Paris, France6Lead Contact
*Correspondence: [email protected]
https://doi.org/10.1016/j.cub.2020.03.070
SUMMARY
Microtubules play a key role in cell division,motility, and intracellular trafficking.Microtubule lattices are gener-ally regarded as stable structures that undergo turnover through dynamic instability of their ends [1]. However,recent evidence suggests that microtubules also exchange tubulin dimers at the sites of lattice defects, whichcan be induced bymechanical stress, severing enzymes, or occur spontaneously during polymerization [2–6].Tubulin incorporation can restore microtubule integrity; moreover, ‘‘islands’’ of freshly incorporated GTP-tubulin can inhibit microtubule disassembly and promote rescues [3, 4, 6–8]. Microtubule repair occursin vitro in the presence of tubulin alone [2–6, 9]. However, in cells, it is likely to be regulated by specific factors,the nature of which is currently unknown. CLASPs are interesting candidates for microtubule repair becausethey induce microtubule nucleation, stimulate rescue, and suppress catastrophes by stabilizing incompletegrowing plus ends with lagging protofilaments and promoting their conversion into complete ones [10–17].Here, we used in vitro reconstitution assays combined with laser microsurgery and microfluidics to showthat CLASP2a indeed stimulates microtubule lattice repair. CLASP2a promoted tubulin incorporation intodamaged lattice sites, thereby restoring microtubule integrity. Furthermore, it induced the formation of com-plete tubes from partial protofilament assemblies and inhibited microtubule softening caused by hydrody-namic-flow-induced bending. The catastrophe-suppressing domain of CLASP2a, TOG2, combined with amicrotubule-tethering region, was sufficient to stimulate microtubule repair, suggesting that catastrophe sup-pression and lattice repair are mechanistically similar. Our results suggest that the cellular machinery control-ling microtubule nucleation and growth can also help to maintain microtubule integrity.
RESULTS AND DISCUSSION
CLASP Stalls Depolymerization and Promotes Repair ofMicrotubule Lattices Damaged by PhotoablationTo investigate whether CLASPs can promote microtubule repair,
we modified previously described in vitro reconstitution assays
with GFP-tagged CLASP2a purified from HEK293T cells (Fig-
ure S1A; Table S1) [12]. Microtubules were grown from
GMPCPP-stabilized seeds, visualized by adding fluorescently
labeled tubulin and observed by total internal reflection fluores-
cence (TIRF) microscopy [12, 18]. In this assay, GFP-CLASP2a
(Figure 1A) shows some binding to microtubule lattices and a
weak enrichment at growing microtubule tips [12]. To explore
the capacity of CLASP to repair damaged microtubules, we per-
formed laser-mediated microsurgery on dynamic microtubules.
Current Biology 30, 2175–2183, JThis is an open access article und
Laser irradiation at a point along microtubule lattice resulted in
local reduction of the tubulin intensity with or without microtu-
bule bending (outcomes I and II), or lattice severing, distin-
guished by the appearance of two microtubule ends at the irra-
diated site (outcome III) (Figure 1B). In the presence of tubulin
alone, microtubules that bent by more than 10� after damage
(outcome I) typically broke (Figures 1B and 1C; Video S1),
although in 18% of the cases, microtubules straightened again,
suggesting that they were repaired (Figure 1D). These data are in
agreement with previous work showing that damaged microtu-
bule lattices can be autonomously repaired by tubulin incorpora-
tion [2, 3, 6, 9]. When these experiments were performed in the
presence of CLASP2a, the percentage of successful repair of mi-
crotubules bent at an irradiated site by more than 10� increased3-fold to 62% (Figures 1D and 1G).
une 8, 2020 ª 2020 The Author(s). Published by Elsevier Inc. 2175er the CC BY license (http://creativecommons.org/licenses/by/4.0/).

CLASP/TOG2-SIntensity
123
0
8
654
7****
***
Nor
mal
ized
inte
nsity
****
Tubulin Intensity
Nor
mal
ized
inte
nsity
0.0
0.5
1.0
After repairAfter damage****
A
C
SxIP (S)
CLASP2α
TOG1 TOG2 TOG3 CLIP-ID
TOG2
TOG2-S
B
t=7.3s
t=8.3s t=9.9s
t=0s
532 nm lasernilubuTnilubuT
F
Microtubule breaksand detachesMicrotubule repairand straightening
0
25
50
75
125
100
Perc
enta
geof
tota
leve
nts
D
15
)%(
ytisnetn idezila
mroN
t=6.6s
MT length (μm)5 100
532 nm laser
15
t=16.7s
MT length (μm)5 10 15
t=22.6s
MT length (μm)5 100
t=53.3s
MT length (μm)5 100 15
t=35.1s
MT length (μm)5 1000
t=0s
2PSALC
αnilubuT
MT length (μm)5 10
0
50
100
0 15 15
I J K
E
G
0
20
40
60
80
100
Perc
enta
geof
tota
leve
nts
a) Depolymerization to seedb) Depolymerization/Rescuec) Re-growth at the cut
site
PA
PA
0.0
5.2
8.3
30.9
90.0
Tubulin, CLASP2α
time(s)
Local laser irradiation along the microtubule lattice
532 nm laserSeed +-
+>10o
-
Outcome I
- +
Outcome III
+-
Outcome II
Outcome I Outcome I
Outcome III Outcome III Outcome III
Outcome I
Outcome I
- +
Microtubule breaks and detaches
- +
Microtubule repair and straightening
+-
Monitor tubulin intensity over time
- +
Monitor depolymerization of the new + end
SeedPA
PA
Seed
0.0
12.6
27.2
37.0
90.0
Tubulin alone
time(s)
CLASP2α slope= 0.047
Tubulin aloneslope= 0.073
ecnecseroulfnae
mdezila
mroN
0
2
4
6
time (s)10 20 300 40
H Tubulin intensity over time afterdamage (Outcome II)
50
CLASP2αTubulinalone
150 ***
Figure 1. CLASP Promotes Repair of Microtubule Lattices Damaged by Laser Illumination
(A) A scheme of full-length CLASP2a and its TOG2-S fragment. Vertical lines labeled SxIP (Ser-any amino acid-Ile-Pro) represent EB-binding motifs located in the
unstructured positively charged region adjacent to the TOG2 domain.
(legend continued on next page)
llOPEN ACCESS
2176 Current Biology 30, 2175–2183, June 8, 2020
Report

llOPEN ACCESSReport
Mammalian CLASPs contain three TOG-like domains, TOG1,
TOG2, and TOG3, connected by flexible positively charged
linkers, and a C-terminal domain (CLIP-ID) that binds to different
partners and targets CLASPs to various subcellular locations
[17, 19] (Figure 1A). Our previous work has shown that an iso-
lated TOG2 domain has a very low affinity for microtubules and
does not bind to free tubulin [12]. However, when TOG2 was
fused to the adjacent intrinsically disordered positively charged
region (a fusion protein termed TOG2-S, Figure 1A), it could
bind to microtubule lattice, show some autonomous enrichment
at growingmicrotubule ends, and suppress catastrophes even in
the absence of end-binding (EB) proteins, which normally target
CLASPs to growing microtubule plus ends [12]. By performing
laser damage experiments in the presence of TOG2-S, we found
that it could also promote repair and straightening of microtu-
bules bent after irradiation (Figures 1D, S1A, and S1B; Video
S1). Although mass spectrometry analysis of CLASP2a revealed
the presence of some proteins binding to CLASP C terminus,
such as CLIP-170 (Table S1), the repair activity observed for
TOG2-S, which lacks the partner-binding C-terminal region of
CLASP, indicates that the ability to promotemicrotubule restora-
tion is autonomous to CLASP.
Before irradiation, CLASP2a weakly labeled entire microtu-
bules, and its fluorescence intensity was the same at the sites
that were subsequently repaired and the sites that broke (Fig-
ure S1C). However, after irradiation, both CLASP2a and TOG2-
S rapidly bound to the sites of damage (Figures 1E, 1G, S1B,
S1D, and S1E), indicating they can autonomously recognize
such sites. Over time, the accumulation of CLASP2a and
TOG2-S diminished, whereas tubulin intensity at the irradiated
site increased (Figures 1E–1G, S1B, S1D, S1E, and S1G; Video
S1). Such an increase was also observed with tubulin alone (Fig-
ures 1F and S1F). However, since repair of bent microtubules in
the absence of CLASP2a or TOG2-S was infrequent, we could
(B) Schematic for an experiment to monitor the possible outcomes of a 532 nm p
bending at the site of damage, which can lead to either straightening of the lattice
severing resulting in direct appearance of two microtubule ends.
(C) Stills from a time-lapse video showing photodamage of a dynamic microtubu
subsequent breakage (outcome I). Scale bar, 2 mm.
(D) Percentage of total events for outcome I resulting in either microtubule breakag
(n = 22microtubules analyzed from 4 experiments) or together with either 30 nMG
TOG2-S (n = 54 from 8 experiments). Error bars denote SD.
(E and F) Normalized mean intensity at the site of photodamage in case of outcom
channel in the presence of tubulin alone or together with either CLASP2a or TOG
microtubule straightening (blue). Tubulin alone: n = 4microtubules, 4 experiments;
experiments. Error bars denote SD.
(G) Stills from a time-lapse video showing a dynamic microtubule grown in the pre
Normalized intensity profiles along the microtubule for the CLASP (green) and tub
with the arrow pointing to the site of photodamage. The purple circle on the plot
(H) Normalized mean tubulin fluorescence intensity over time at the site of loc
Rhodamine tubulin alone (gray) (n = 35 microtubules, 2 experiments) or together w
lines were fitted to the initial increase in tubulin intensity until saturation for the re
(I and J) Stills and the corresponding kymograph of amicrotubule grown in the pre
severed with a 532 nm laser as indicated (outcome III). Scale bars: still image, 2 m
the time point of the still in the kymograph.
(K) Percentage of total laser severing events resulting in either immediate microtu
seed or depolymerization followed by rescue along the lattice, in the presence of R
GFP-TOG2-S. Tubulin alone: n = 186 microtubules, 3 experiments: CLASP2a: n =
For plots in Figure 1D: *p = 0.0091, **p = 0.0381, for Figures 1E and 1F, ****p < 0.0
and Videos S1 and S2.
not reliably compare tubulin incorporation rates with and without
CLASP. To obtain a larger number of measurements, we moni-
tored microtubules that did not bend but displayed reduced
tubulin intensity at the site of damage, likely due to a combination
of photobleaching and loss of tubulin dimers (Figure 1B,
outcome II). We found that both with tubulin alone and in the
presence of CLASP2a, tubulin intensity at the damaged sites first
increased linearly after irradiation and then reached a plateau
(Figures S1H–S1J). The rate of tubulin incorporation based on
the slopes of the linear part of the plot was �1.7-fold higher for
tubulin alone compared to the condition where CLASP2a was
included in the assay (Figure 1H), and the tubulin intensity after
repair at the irradiated sites with respect to the intensity immedi-
ately after damage increased �5.4-fold in the case of tubulin
alone but only �1.9-fold in the presence of CLASP2a (Figures
S1H–S1J). Since bent microtubules were restored more often
in the presence of CLASP2a compared to tubulin alone (Fig-
ure 1D), this suggests that CLASP2a most likely promotes rapid
repair by inhibiting microtubule disassembly at the irradiated site
and thus limits the zone where new tubulin can incorporate.
We next tested whether CLASP2a had a stabilizing effect on
microtubule ends generated upon completemicrotubule severing
(outcome III) (Figure 1B). In agreement with previouswork [20], we
found that in the presence of tubulin alone, 81%of freshly severed
microtubule plus endsdepolymerized to the seed,whereas the re-
maining 19%were rescued along the lattice (Figures 1I–1K; Video
S2). In the presence of CLASP2a, the depolymerization of newly
generated plus ends was strongly inhibited: 53% of the microtu-
bules promptly re-grew directly from the ablation site (Figures 1J
and1K; VideoS2). The remaining 47%were rescuedalong thedy-
namic lattice, in linewith the fact thatCLASPsactas rescue factors
[10–13, 21] (Figure 1K). TOG2-S fusion was also sufficient to sup-
press depolymerization of severed plus ends and promoted re-
growth at the site of photo-ablation in 29%of the cases, although
ulsed laser induced damage at a site along the dynamic lattice. (I) Microtubule
or microtubule breakage. (II) Reduction of the tubulin intensity. (III) Microtubule
le grown in the presence of Rhodamine-tubulin alone followed by bending and
e or straightening at the point of photodamage in the presence of tubulin alone
FP-CLASP2a (n = 53microtubule analyzed from 6 experiments) or 30 nMGFP-
e I for the GFP channel for CLASP2a and TOG2-S (E) and Rhodamine-tubulin
2-S (F); before damage (black), immediately after damage (orange) and after
CLASP2a: n = 21microtubules, 4 experiments; TOG2-S: n = 20microtubules, 6
sence of Rhodamine-tubulin together with 30 nMGFP-CLASP2a for outcome I.
ulin channel (magenta) at different time points are shown in the bottom panels,
indicates the end of the microtubule. Scale bars, 2 mm.
al photodamage (outcome II); microtubules were grown in the presence of
ith 30 nM GFP-CLASP2a (blue) (n = 44 microtubules, 2 experiments). Straight
spective mean values yielding slopes as indicated.
sence of Rhodamine-tubulin alone (I) or together with GFP-CLASP2a (30 nM) (J)
m; kymograph, 4 mm (horizontal) and 10 s (vertical). Dotted yellow lines point to
bule regrowth at the site of photoablation, microtubule depolymerization to the
hodamine-tubulin alone or together with either 30 nMGFP-CLASP2a or 30 nM
36 microtubules, 3 experiments; TOG2-S: n = 48 microtubules, 8 experiments.
001, ***p = 0.001 Mann-Whitney U test. See also Figures S1 and S2, Table S1,
Current Biology 30, 2175–2183, June 8, 2020 2177

A
B
Tubu
linKi
n-5
dim
erC
LASP
2α
t= 0s t= 5min 16s t= 8min 20s t= 10 minE
t= 0s t= 3min 24s t= 4min 34s t= 6min
Tubu
linKi
n-5
dim
erKin-5 dimer
Kin-5 dimeralone
Kin-5 dimer+ CLASP2α
>45o
Tube completion in partial structures
Microtubulebreakage within a curled region
Microtubulegrowth
at both ends
Partial end structuredepolymerizes
Tubu
linKi
n-5
dim
erTO
G2-
S
t= 0s t= 3min 20s t= 4min 40s t= 10minF
Mea
ntu
bulin
inte
nsity
(a.u
)
0
2000
4000
6000
8000***
Kin-5 dimer (30 nM)
Num
bero
f MT
ends
0
1
2
3
4
5D****
********C
Figure 2. CLASP Promotes Formation of Complete Microtubules from Partial Protofilament Assemblies
(A) Cartoon illustrating the changes in tubulin sheet- or ribbon-like structures generated at the plus ends of dynamic microtubules in the presence of 30 nM
kinesin-5-GFP dimer (Kin-5 dimer) alone or together with 30 nM GFP-CLASP2a.
(B) Stills from a time-lapse video showing a plus end of a microtubule grown in the presence of Rhodamine-tubulin and 30 nM Kin-5-GFP dimer. Scale bar: 2 mm.
(C) Mean tubulin intensity values for the straight and the curled portions of the microtubule lattice as indicated for microtubules grown in the presence of
Rhodamine tubulin and 30 nM Kin-5-GFP dimer. n = 25 microtubules from 2 experiments. Error bars denote SD.
(D) Number of newly generatedmicrotubule ends from a singlemicrotubule plus end formicrotubules grown in the presence of Rhodamine-tubulin and 30 nMKin-
5-GFP dimer alone (n = 38microtubule plus ends, 3 experiments) or together with 30 nMTagBFP-CLASP2a (n = 95microtubule plus ends, 3 experiments), or with
30 nM TagBFP-TOG2-S (n = 85 microtubule plus ends, 3 experiments), or with 100 nM Tag-BFP-TOG2-S (n = 26 microtubule plus ends, 2 experiments). Events
where the microtubule plus ends bent by angles over 45� with respect to the lattice were monitored in a 10 min time lapse. Error bars denote SD.
(E) Stills from a time-lapse video showing the plus end for a microtubule grown in the presence of Rhodamine tubulin, 30 nM Kin-5-GFP dimer, and 30 nM
TagBFP-CLASP2a. Scale bar: 2 mm.
(F) Stills from a time-lapse video showing a microtubule plus end grown in the presence of Rhodamine-tubulin, 30 nM Kin-5-GFP dimer together with 30 nM
TagBFP-TOG2-S. Scale bar: 3 mm.
For (B), (E), and (F), green arrowheads point to the plus end and blue arrowheads to the minus ends. For all plots, ****p < 0.0001, ***p = 0.001 and ns, no significant
difference with control, Mann-Whitney U test. See also Video S3.
llOPEN ACCESS Report
the protection was less efficient than with full-length CLASP2a
(Figures 1K and S2A). Importantly, in the presence of either
CLASP2a or TOG2-S, none of the ablated microtubules depoly-
merized to the seed (Figure 1K), and most of these microtubules
exhibited only very short depolymerization excursions (<1 mm)
compared to tubulin alone (Figure S2B).We note that observation
2178 Current Biology 30, 2175–2183, June 8, 2020
of depolymerization events in the presence of CLASP2a or TOG2-
Swas not limited by the lengths of the seed-proximal microtubule
parts after severing, which were longer than the depolymerization
lengths (Figure S2C).
We also tested whether CLASP2a could protect freshly gener-
ated microtubule ends in the absence of tubulin. To test this, we
25 % glycerol wash
Tubulin (5 μM)±
CLASP2α/TOG2-S (30 nM)
Taxol MTs to monitorlattice repair
Taxol microtubule
1.5 min Incubationwithout tubulin
10 min
Tubulin alone (5 μM)
TubulinMerge Taxol MT
12
Tubulin
Glycerol
B
Distance (μm)0
Inte
nsity
(a.u
)
5 100
4
8
12
16HL488-tubulinRh-tubulin
1
2
Merge
F
Frac
tion
of to
tale
vent
s>1
μm
0.0
0.5
1.0
CompletePartial
A Tubulin (5 μM) + CLASP2α (30 nM)
TubulinMerge Taxol MT, CLASP2α1 2 3
Distance (μm)0
Inte
nsity
(a.u
)5 10
0
4
8
12
16 HL488-tubulinRh-tubulin + CLASP2α
1
2 3
Merge
Tubulin +CLASP2α
C
Glycerol
Tubulin (5 μM) + TOG2-S (30 nM)
TubulinMerge Taxol MT, TOG2-S
Tubulin +TOG2-S
MergeHL488-tubulinRh-tubulin+ TOG2-S
Distance (μm)0
Inte
nsity
(a.u
)
5 100
4
8
12
16
D
mμ(noitaroprocnifo
yc neuqerF-1
)
0.0
0.20.4
0.6
0.8
1.0
Leng
thof
inco
rpor
atio
n(μ
m)
0
1
2
3
45
E G
ns
**
ns
ns
(legend on next page)
llOPEN ACCESS
Current Biology 30, 2175–2183, June 8, 2020 2179
Report
llOPEN ACCESS Report
performed local laser ablation of microtubules in the absence of
free tubulin, which were capped with GMPCPP-tubulin to pre-
vent their depolymerization (Figure S2D). All freshly generated
microtubule ends depolymerized to the seed or the GMPCPP
cap in the absence of CLASP2a but were protected in its pres-
ence (Figures S2E–S2H). We conclude that CLASP2a promotes
microtubule repair, and this activity is at least partly dependent
on recognition of damaged microtubule lattices and inhibition
of their disassembly.
CLASP Converts Partial Protofilament Assemblies intoComplete TubesThe experiments described above suggest that CLASP pro-
motes formation of complete tubes from microtubules lacking
some parts of protofilaments. To further test the effect of CLASP
on partial protofilament assemblies, we used a previously
described engineered kinesin-5 dimer, which consists of themo-
tor domain and neck linker of Xenopus kinesin-5 (Eg5) fused to
the motor-proximal coiled coil derived from Drosophila kinesin-
1 [22]. This engineered kinesin-5 (Kin-5 dimer) was shown to
generate long tubulin ribbons and protofilament sheets at micro-
tubule plus ends [22] (Figure 2A), likely by stabilizing specific
tubulin conformations and enhancing lateral contacts between
tubulin dimers [23]. In the presence of Kin-5 dimer, we observed
curled microtubule ends, which displayed a 25% reduction in
tubulin intensity compared to the straight parts of the lattice, in
line with the idea that the curled regions miss some protofila-
ments (Figures 2B and 2C). Similar curved microtubule plus-
end extensions were also formed when CLASP2a or TOG2-S
were included with the Kin-5 dimer in the assay (Figures 2A,
2E, and 2F; Video S3). However, whereas in the presence of
the Kin-5 dimer alone these structures were transient and typi-
cally depolymerized, in the presence of CLASP2a or TOG2-S,
curled microtubule ends were converted into multiple straight
microtubules (Figures 2D–2F). These data suggest that
CLASP2a and its TOG2-S fragment can promote formation of
complete microtubules from protofilament sheets. Since several
microtubules could form from a single curled end, these results
suggest that CLASP2a and TOG2-S not only help to repair
strongly tapered microtubule ends, as it occurs during
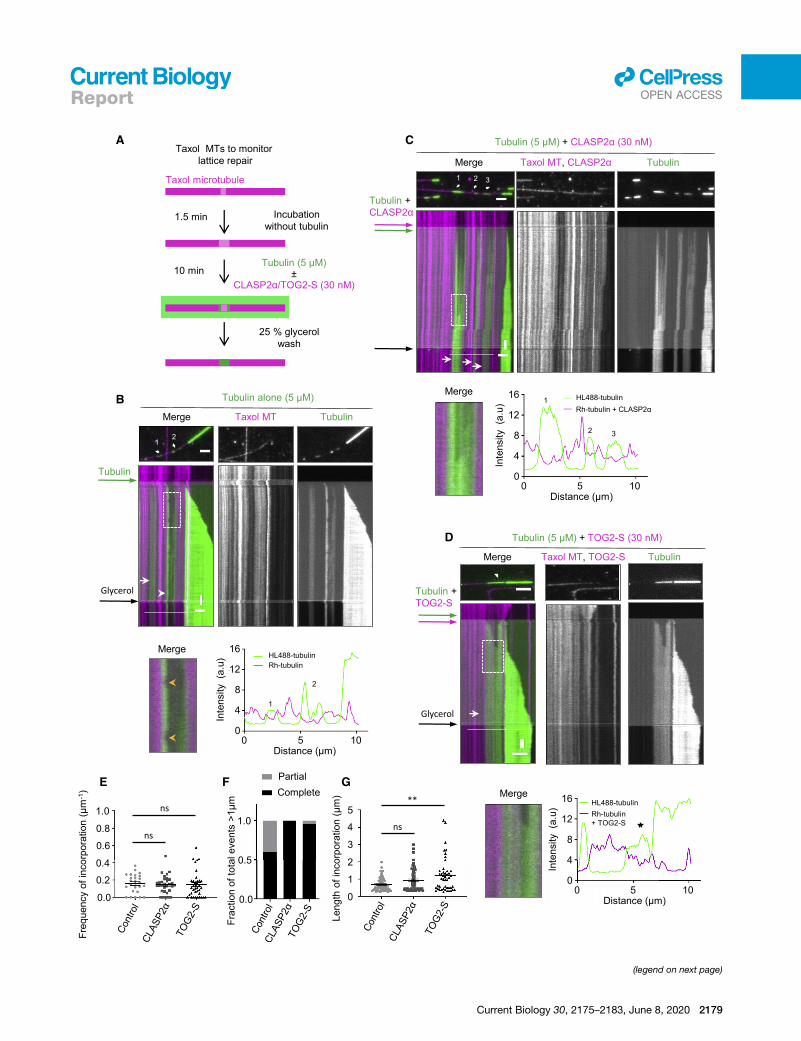
Figure 3. CLASP Promotes Complete Repair of Damaged Microtubule
(A) Schematic for an experiment to monitor tubulin incorporation into damaged
presence of Taxol were first incubated without Taxol and tubulin for 1.5 min and s
mCherry-CLASP2a or 30 nM mCherry-TOG2-S. After 10 min, the residual free
glycerol to prevent microtubule depolymerization, in order to better visualize inco
(B–D) Microtubule repair in the presence of tubulin alone (B) or together with eithe
(top) of time-lapse videos after the final washout and kymographs (bottom) s
Rhodamine-labeledmicrotubule lattices (magenta). In kymographs, white arrows
the boxed regions in the kymographs in (B)–(D) showing partial (B) or complete m
arrowheads in (B) (bottom left) indicate events of loss of freshly incorporated
microtubule seed channel (magenta) with or without mCherry-CLASP2a, and for th
The numbers indicate incorporation sites specified in stills in (B) and (D). Scale b
(E and G) Frequency of incorporation per unit length per microtubule (E) and the
M = 25, L = 459.25 mm, 2 experiments), together with 30 nMmCherry-CLASP2a (n
M = 37, L = 418.43 mm, 4 experiments), where n, M, and L are total number of i
analyzed, respectively. Error bars represent SEM. **p = 0.0038 and ns, no signifi
(F) Fraction of total events resulting in either complete or partial repair at the site
tubulin alone (n = 15, 2 experiments), together with either 30 nM mCherry-CLASP
where n is the total number of incorporations longer than 1 mm. See also Video S
2180 Current Biology 30, 2175–2183, June 8, 2020
catastrophe suppression [12] but also likely promote extension
of protofilament bundles from the side, allowing them to close
into complete tubes.
CLASP Promotes Complete Repair of MicrotubuleLattice DefectsTo generate a substrate in which we could monitor tubulin
incorporation into partially damaged microtubule lattices, we
prepared Rhodamine-labeled microtubules stabilized with
Taxol. Microtubules polymerized in the presence of Taxol are
known to exhibit extensive lattice defects [24]; this property
has been used, for example, to demonstrate the impact of
microtubule defects on kinesin-based transport [25, 26].
Taxol-stabilized microtubules display more structural defects
in the lattice when incubated with very low tubulin concentra-
tions [27]. To promote defect formation, we incubated Taxol-
stabilized microtubules for 1.5 min in a buffer without Taxol
and tubulin (Figure 3A). In these conditions, microtubules
gradually lose tubulin dimers from discrete sites, which can
be detected as gaps with a reduced intensity of tubulin signal
(Figure 3B; Video S4). When 5 mM tubulin with a green (HiLyte
Fluor488) fluorescent label was added to such partially
‘‘eroded’’ Rhodamine-labeled microtubules, we observed that
green tubulin was incorporated not only at microtubule ends
but also into the microtubule lattices where the original tubulin
signal was reduced (Figures 3B; Video S4). The addition of
CLASP2a or TOG2-S had no effect on the frequency of tubulin
incorporation sites, as they depended on the number of defects
induced by Taxol washout and the extent of microtubule
erosion (Figures 3C–3E). However, CLASP2a and TOG2-S
increased the percentage of damaged lattice sites that ap-
peared completely ‘‘healed’’ (Figure 3F; Video S4). This was
because the polymerization of freshly added tubulin within
such sites was continuous, whereas, in the presence of tubulin
alone, incorporation was often confined to the edges of the
gaps (Figures 3B–3D). As a result, the average length of the
analyzed incorporation sites appeared slightly longer in the
presence of CLASP2a or TOG-S, and, in case of TOG2-S,
this difference was significant (Figure 3G). Importantly, in this
assay, free tubulin concentration was lower than in the assays
Lattices
microtubule lattices. Microtubules prepared from Rhodamine-tubulin in the
ubsequently with 5 mM HiLyte Fluor-488-labeled tubulin with or without 30 nM
green tubulin was washed out with the wash buffer supplemented with 25%
rporation of green tubulin.
r 30 nM mCherry-CLASP2a (C) or 30 nM mCherry-TOG2-S (D). Single frames
howing green tubulin incorporation sites (numbered asterisks in stills) into
indicate complete repair and white arrowheads partial repair. Enlarged views of
icrotubule repair (C and D) in the bottom-left panel for each condition. Yellow
tubulin. Intensity profiles along the microtubule for the Rhodamine-labeled
e green tubulin channel are shown in the bottom-right panel for each condition.
ars: 2 mm (horizontal) and 60 s (vertical). See also Video S4.
average length of incorporations (G) in the presence of tubulin alone (n = 73,
= 64,M = 31, L = 450.74 mm, 5 experiments) or 30 nMmCherry-TOG2-S (n = 52,
ncorporations, total number of microtubules, and total length of microtubules
cant difference with control, Mann-Whitney U test.
of tubulin incorporations with the length exceeding 1 mm, in the presence of
2a (n = 22, 5 experiments) or 30 nM mCherry-TOG2-S (n = 23, 4 experiments),
4.
Flow
A
F
*50
100
150
0N
orm
aliz
edpe
rsis
tenc
ele
ngth
(%) Changes in persistence length
1 2 3 4 5 6
CLASP2α
Control10 s
Tubulin Tubulin + CLASP2α
1. MT elongation 2. Bending 3. Relaxation
6 cycles
BTubulin + CLASP2α
Flow
D
123456123456
Tubulin
Tubulin + CLASP2α
CLASP2α
123456
Tubulin
Tubulin aloneE
100
200
0
htgnelecnetsisrep
dezil amro
N
Control (Tubulin alone)
1 2 3 4 5 6Bending cycles
0
0
0
( )
1 2 3 44444444 5 6
G
100
200
0Nor
mal
ized
pers
iste
nce
leng
th
CLASP2α (30 nM)
1 2 3 4 5 6Bending cycles
H
Softening (16/23)No Softening (7/23)
Softening (3/20)No Softening (17/20)
15
5
Mic
rotu
bule
leng
th(1
stcy
cle)
10
20
0
ns
I
C
3
5
1Ab
solu
tepe
rsis
tenc
ele
ngth
2
4
0
ns1st cycle
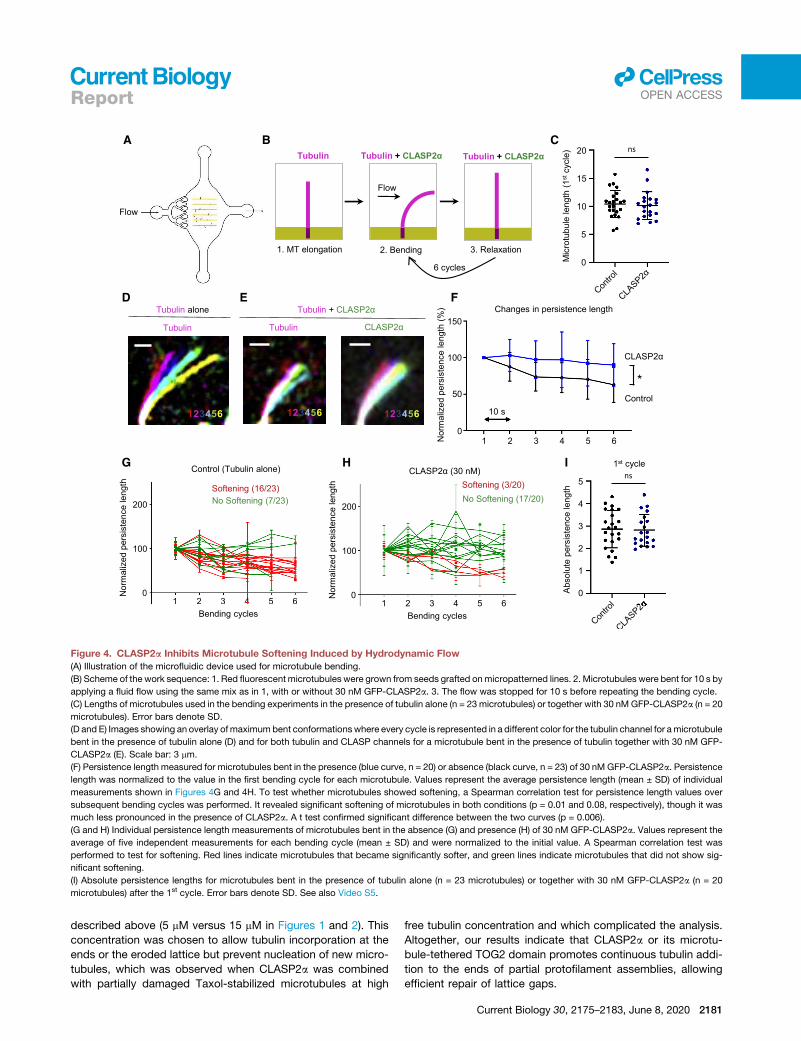
Figure 4. CLASP2a Inhibits Microtubule Softening Induced by Hydrodynamic Flow
(A) Illustration of the microfluidic device used for microtubule bending.
(B) Scheme of the work sequence: 1. Red fluorescent microtubules were grown from seeds grafted onmicropatterned lines. 2. Microtubules were bent for 10 s by
applying a fluid flow using the same mix as in 1, with or without 30 nM GFP-CLASP2a. 3. The flow was stopped for 10 s before repeating the bending cycle.
(C) Lengths of microtubules used in the bending experiments in the presence of tubulin alone (n = 23 microtubules) or together with 30 nMGFP-CLASP2a (n = 20
microtubules). Error bars denote SD.
(D and E) Images showing an overlay ofmaximumbent conformationswhere every cycle is represented in a different color for the tubulin channel for amicrotubule
bent in the presence of tubulin alone (D) and for both tubulin and CLASP channels for a microtubule bent in the presence of tubulin together with 30 nM GFP-
CLASP2a (E). Scale bar: 3 mm.
(F) Persistence length measured for microtubules bent in the presence (blue curve, n = 20) or absence (black curve, n = 23) of 30 nM GFP-CLASP2a. Persistence
length was normalized to the value in the first bending cycle for each microtubule. Values represent the average persistence length (mean ± SD) of individual
measurements shown in Figures 4G and 4H. To test whether microtubules showed softening, a Spearman correlation test for persistence length values over
subsequent bending cycles was performed. It revealed significant softening of microtubules in both conditions (p = 0.01 and 0.08, respectively), though it was
much less pronounced in the presence of CLASP2a. A t test confirmed significant difference between the two curves (p = 0.006).
(G and H) Individual persistence length measurements of microtubules bent in the absence (G) and presence (H) of 30 nM GFP-CLASP2a. Values represent the
average of five independent measurements for each bending cycle (mean ± SD) and were normalized to the initial value. A Spearman correlation test was
performed to test for softening. Red lines indicate microtubules that became significantly softer, and green lines indicate microtubules that did not show sig-
nificant softening.
(I) Absolute persistence lengths for microtubules bent in the presence of tubulin alone (n = 23 microtubules) or together with 30 nM GFP-CLASP2a (n = 20
microtubules) after the 1st cycle. Error bars denote SD. See also Video S5.
llOPEN ACCESSReport
described above (5 mM versus 15 mM in Figures 1 and 2). This
concentration was chosen to allow tubulin incorporation at the
ends or the eroded lattice but prevent nucleation of new micro-
tubules, which was observed when CLASP2a was combined
with partially damaged Taxol-stabilized microtubules at high
free tubulin concentration and which complicated the analysis.
Altogether, our results indicate that CLASP2a or its microtu-
bule-tethered TOG2 domain promotes continuous tubulin addi-
tion to the ends of partial protofilament assemblies, allowing
efficient repair of lattice gaps.
Current Biology 30, 2175–2183, June 8, 2020 2181

llOPEN ACCESS Report
Microtubules Exhibit Increased Resistance toMechanical Stress in the Presence of CLASPFinally, we investigated the effect of CLASP on dynamic micro-
tubules damaged in a more natural way, by inducing mechan-
ical stress with a microfluidics setup described previously [2]. In
order to study the impact of CLASP on the deformation of mi-
crotubules induced by mechanical forces, we applied cycles of
hydrodynamic bending stress to microtubules in the absence
or presence of CLASP2a. To this end, we grew dynamic micro-
tubules in the absence of CLASP2a from GMPCPP and Taxol-
stabilized seeds attached to micropatterns inside a microfluidic
device (Figure 4A). Microtubules were then bent by an orthog-
onal fluid flow for 10 s in either the absence or presence of
CLASP2a. The flow was subsequently stopped for 10 s and
the bending cycle was repeated (Figure 4B) [28]. Previous
work showed that microtubules bend and subsequently
straighten after each flow application, but the degree of soft-
ening (quantified by monitoring the persistence length of micro-
tubules) increases with each cycle due to the gradual loss of
tubulin dimers from the lattice [2]. In the presence of tubulin
alone, 70% of the microtubules showed softening after six
bending cycles; quantification of the persistence length of the
entire microtubule population showed that on average, they
became 37% softer (Figures 4C, 4D, 4F, and 4G). In the pres-
ence of CLASP2a, the average drop in the persistence length of
microtubules that were of similar length as the control ones
(Figure 4C) was much less pronounced (10%), with only 15%
of the microtubules showing softening (Figures 4E, 4F, and
4H). This indicates that microtubules exhibit increased resis-
tance to mechanical stress in the presence of CLASP2a. These
data support the idea that CLASP either alters the mechanical
properties of microtubules or promotes repair of the damage
induced by bending. Since we did not observe any difference
in the persistence length after the first bending cycle (Figure 4I),
it is likely that CLASP does not directly alter lattice rigidity but
promotes repair of bent lattices.
ConclusionsTaken together, our data reveal that CLASP2a is an autono-
mous microtubule repair factor. Our experiments suggest
that CLASP repair activity is a combination of recognition
and stabilization of damaged but not yet depolymerizing sites
within the microtubule lattice and a more continuous tubulin
incorporation at the sites of damage. Since full-length
CLASP2a and its microtubule-tethered TOG2 domain were
both active in microtubule repair assays, and, since TOG2 is
highly conserved between CLASP1 and CLASP2 and is pre-
sent in all CLASP isoforms [19, 29], this property is likely
shared by all mammalian CLASPs. Furthermore, given that
previous work showed that the TOG2-S fusion can suppress
catastrophes [12], our data suggest that the mechanism of
microtubule repair is similar to that of catastrophe suppres-
sion. Our previous work has shown that CLASPs can stabilize
a microtubule plus end with an incomplete set of protofila-
ments, thereby promoting its recovery into a complete tube
[12]. Furthermore, CLASPs are essential for microtubule
nucleation from the Golgi in cells [30] and reduce the kinetic
threshold for templated microtubule nucleation in vitro [12].
In the current study, we showed that CLASP2a promotes
2182 Current Biology 30, 2175–2183, June 8, 2020
formation of complete tubes from tubulin sheets or ribbons
generated by kinesin-5 dimer, structures that resemble micro-
tubule nucleation intermediates [23]. All these activities likely
depend on the ability of CLASPs to stabilize partial microtu-
bule structures prone to depolymerization, prevent their cata-
strophic disassembly, and shift the balance toward their
continuous polymerization. Given that the microtubule-teth-
ered TOG2 domain, which might be binding between protofi-
laments [12], was sufficient to promote microtubule lattice
repair, this activity might depend on stabilizing lateral con-
tacts between tubulin dimers.
If CLASPs help to repair microtubules rapidly and efficiently,
their loss could potentially lead to accumulation of microtubule
damage that is repaired slowly. This might explain why CLASP
depletion leads to increased guanosine triphosphate (GTP)-
tubulin content and EB accumulation along microtubule shafts,
a phenotype that could be restored to control levels by the
TOG2 domain of CLASP2 [31]. These observations in cells fit
well with our observation of lower extent of damage and less
extensive tubulin incorporation at irradiated sites in the pres-
ence of CLASP. The strong reduction in the density of microtu-
bule networks observed in CLASP-depleted cells could thus be
caused not only by reduced microtubule nucleation and plus-
end stability as assumed previously but also by the decreased
stability of microtubule lattices, which are repaired less effi-
ciently when CLASPs are absent. An important question for
future research is whether and how other components of
microtubule polymerization machinery contribute to microtu-
bule repair.
STAR+METHODS
Detailed methods are provided in the online version of this paper
and include the following:
d KEY RESOURCES TABLE
d LEAD CONTACT AND MATERIALS AVAILABILITY
d EXPERIMENTAL MODEL AND SUBJECT DETAILS
d METHOD DETAILS
B Protein purification for in vitro reconstitutions
B In vitro microtubule dynamics assays
B TIRF microscopy
B Intensity quantifications along the lattice at damage
site
B Intensity analysis for Rhodamine tubulin and CLASP/
TOG2-S along a microtubule
B Microtubule repair assays with Taxol-stabilized micro-
tubules
B Microtubule repair assays with mechanically damaged
microtubules
B Mass spectrometry
d QUANTIFICATION AND STATISTICAL ANALYSIS
d DATA AND CODE AVAILABILITY
SUPPLEMENTAL INFORMATION
Supplemental Information can be found online at https://doi.org/10.1016/j.
cub.2020.03.070.
llOPEN ACCESSReport
ACKNOWLEDGMENTS
We thank Dr. Kai Jiang, Wuhan University for suggesting experiments with the
Kin-5 dimer and Prof. William Hancock, Pennsylvania State University for the
kind gift of the Kin-5 dimer construct. This work was supported by the Euro-
pean Research Council Synergy grant 609822 to A. Akhmanova and European
Research Council Consolidator grant 771599 to M.T.
AUTHOR CONTRIBUTIONS
A. Aher, D.R., L.S., M.T., L.B., and A. Akhmanova designed experiments and
wrote the paper. A. Aher, D.R., L.S., J.G., K.J., Q.L., and M.A. performed ex-
periments and data analysis, and A. Akhmanova coordinated the project.
DECLARATION OF INTERESTS
The authors declare no competing interests.
Received: October 17, 2019
Revised: March 5, 2020
Accepted: March 27, 2020
Published: April 30, 2020
REFERENCES
1. Desai, A., and Mitchison, T.J. (1997). Microtubule polymerization dy-
namics. Annu. Rev. Cell Dev. Biol. 13, 83–117.
2. Schaedel, L., John, K., Gaillard, J., Nachury, M.V., Blanchoin, L., and
Th�ery, M. (2015). Microtubules self-repair in response to mechanical
stress. Nat. Mater. 14, 1156–1163.
3. Aumeier, C., Schaedel, L., Gaillard, J., John, K., Blanchoin, L., and Th�ery,
M. (2016). Self-repair promotes microtubule rescue. Nat. Cell Biol. 18,
1054–1064.
4. Schaedel, L., Triclin, S., Chr�etien, D., Abrieu, A., Aumeier, C., Gaillard, J.,
Blanchoin, L., Th�ery, M., and John, K. (2019). Lattice defects induce
microtubule self-renewal. Nat. Phys. 15, 830–838.
5. Aher, A., and Akhmanova, A. (2018). Tipping microtubule dynamics, one
protofilament at a time. Curr. Opin. Cell Biol. 50, 86–93.
6. Vemu, A., Szczesna, E., Zehr, E.A., Spector, J.O., Grigorieff, N.,
Deaconescu, A.M., and Roll-Mecak, A. (2018). Severing enzymes amplify
microtubule arrays through lattice GTP-tubulin incorporation. Science
361, eaau1504.
7. Tropini, C., Roth, E.A., Zanic, M., Gardner, M.K., and Howard, J. (2012).
Islands containing slowly hydrolyzable GTP analogs promote microtubule
rescues. PLoS ONE 7, e30103.
8. Dimitrov, A., Quesnoit, M., Moutel, S., Cantaloube, I., Pous, C., and Perez,
F. (2008). Detection of GTP-tubulin conformation in vivo reveals a role for
GTP remnants in microtubule rescues. Science 322, 1353–1356.
9. de Forges, H., Pilon, A., Cantaloube, I., Pallandre, A., Haghiri-Gosnet,
A.M., Perez, F., and Pous, C. (2016). Localized Mechanical Stress
Promotes Microtubule Rescue. Curr. Biol. 26, 3399–3406.
10. Lawrence, E.J., Arpag, G., Norris, S.R., and Zanic, M. (2018). Human
CLASP2 specifically regulates microtubule catastrophe and rescue. Mol.
Biol. Cell 29, 1168–1177.
11. Lawrence, E.J., and Zanic, M. (2019). Rescuing microtubules from the
brink of catastrophe: CLASPs lead the way. Curr. Opin. Cell Biol. 56,
94–101.
12. Aher, A., Kok, M., Sharma, A., Rai, A., Olieric, N., Rodriguez-Garcia, R.,
Katrukha, E.A., Weinert, T., Olieric, V., Kapitein, L.C., et al. (2018).
CLASP Suppresses Microtubule Catastrophes through a Single TOG
Domain. Dev. Cell 46, 40–58.e8.
13. Al-Bassam, J., Kim, H., Brouhard, G., van Oijen, A., Harrison, S.C., and
Chang, F. (2010). CLASP promotes microtubule rescue by recruiting
tubulin dimers to the microtubule. Dev. Cell 19, 245–258.
14. Moriwaki, T., and Goshima, G. (2016). Five factors can reconstitute all
three phases of microtubule polymerization dynamics. J. Cell Biol. 215,
357–368.
15. Yu, N., Signorile, L., Basu, S., Ottema, S., Lebbink, J.H.G., Leslie, K., Smal,
I., Dekkers, D., Demmers, J., and Galjart, N. (2016). Isolation of Functional
Tubulin Dimers and of Tubulin-Associated Proteins from Mammalian
Cells. Curr. Biol. 26, 1728–1736.
16. Galjart, N. (2005). CLIPs and CLASPs and cellular dynamics. Nat. Rev.
Mol. Cell Biol. 6, 487–498.
17. Al-Bassam, J., and Chang, F. (2011). Regulation of microtubule dynamics
by TOG-domain proteins XMAP215/Dis1 and CLASP. Trends Cell Biol. 21,
604–614.
18. Bieling, P., Laan, L., Schek, H., Munteanu, E.L., Sandblad, L., Dogterom,
M., Brunner, D., and Surrey, T. (2007). Reconstitution of a microtubule
plus-end tracking system in vitro. Nature 450, 1100–1105.
19. Akhmanova, A., Hoogenraad, C.C., Drabek, K., Stepanova, T., Dortland,
B., Verkerk, T., Vermeulen, W., Burgering, B.M., De Zeeuw, C.I.,
Grosveld, F., and Galjart, N. (2001). Clasps are CLIP-115 and -170 asso-
ciating proteins involved in the regional regulation of microtubule dy-
namics in motile fibroblasts. Cell 104, 923–935.
20. Walker, R.A., Inou�e, S., and Salmon, E.D. (1989). Asymmetric behavior of
severed microtubule ends after ultraviolet-microbeam irradiation of indi-
vidual microtubules in vitro. J. Cell Biol. 108, 931–937.
21. Mimori-Kiyosue, Y., Grigoriev, I., Lansbergen, G., Sasaki, H., Matsui, C.,
Severin, F., Galjart, N., Grosveld, F., Vorobjev, I., Tsukita, S., and
Akhmanova, A. (2005). CLASP1 and CLASP2 bind to EB1 and regulate
microtubule plus-end dynamics at the cell cortex. J. Cell Biol. 168,
141–153.
22. Chen, Y., and Hancock, W.O. (2015). Kinesin-5 is a microtubule polymer-
ase. Nat. Commun. 6, 8160.
23. Chen, G.Y., Cleary, J.M., Asenjo, A.B., Chen, Y., Mascaro, J.A.,
Arginteanu, D.F.J., Sosa, H., and Hancock, W.O. (2019). Kinesin-5
Promotes Microtubule Nucleation and Assembly by Stabilizing a Lattice-
Competent Conformation of Tubulin. Curr. Biol. 29, 2259–2269.e4.
24. Arnal, I., and Wade, R.H. (1995). How does taxol stabilize microtubules?
Curr. Biol. 5, 900–908.
25. Gramlich, M.W., Conway, L., Liang, W.H., Labastide, J.A., King, S.J., Xu,
J., and Ross, J.L. (2017). Single Molecule Investigation of Kinesin-1
Motility Using Engineered Microtubule Defects. Sci. Rep. 7, 44290.
26. Liang, W.H., Li, Q., Rifat Faysal, K.M., King, S.J., Gopinathan, A., and Xu,
J. (2016). Microtubule Defects Influence Kinesin-Based Transport In Vitro.
Biophys. J. 110, 2229–2240.
27. Reid, T.A., Coombes, C., and Gardner, M.K. (2017). Manipulation and
quantification of microtubule lattice integrity. Biol. Open 6, 1245–1256.
28. Portran, D., Schaedel, L., Xu, Z., Th�ery, M., and Nachury, M.V. (2017).
Tubulin acetylation protects long-lived microtubules against mechanical
ageing. Nat. Cell Biol. 19, 391–398.
29. Leano, J.B., Rogers, S.L., and Slep, K.C. (2013). A cryptic TOG domain
with a distinct architecture underlies CLASP-dependent bipolar spindle
formation. Structure 21, 939–950.
30. Efimov, A., Kharitonov, A., Efimova, N., Loncarek, J., Miller, P.M.,
Andreyeva, N., Gleeson, P., Galjart, N., Maia, A.R., McLeod, I.X., et al.
(2007). Asymmetric CLASP-dependent nucleation of noncentrosomal mi-
crotubules at the trans-Golgi network. Dev. Cell 12, 917–930.
31. Grimaldi, A.D., Maki, T., Fitton, B.P., Roth, D., Yampolsky, D., Davidson,
M.W., Svitkina, T., Straube, A., Hayashi, I., and Kaverina, I. (2014).
CLASPs are required for proper microtubule localization of end-binding
proteins. Dev. Cell 30, 343–352.
32. Mohan, R., Katrukha, E.A., Doodhi, H., Smal, I., Meijering, E., Kapitein,
L.C., Steinmetz, M.O., and Akhmanova, A. (2013). End-binding proteins
sensitize microtubules to the action of microtubule-targeting agents.
Proc. Natl. Acad. Sci. USA 110, 8900–8905.
Current Biology 30, 2175–2183, June 8, 2020 2183
llOPEN ACCESS Report
STAR+METHODS
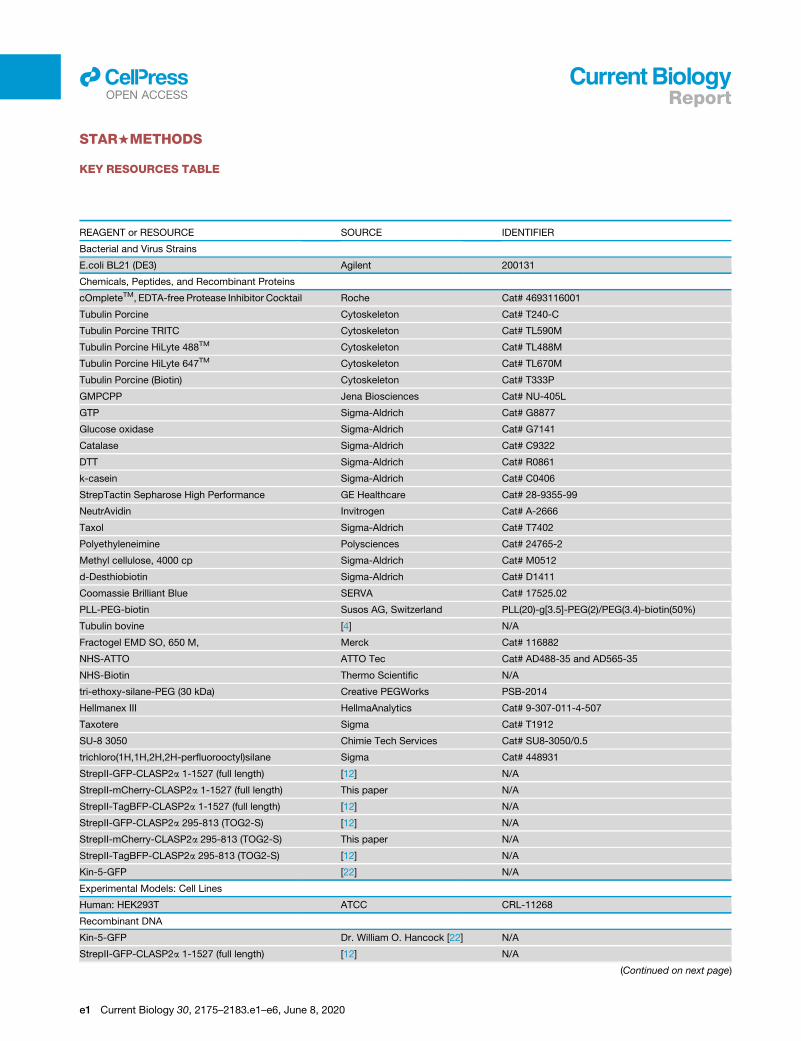
KEY RESOURCES TABLE
REAGENT or RESOURCE SOURCE IDENTIFIER
Bacterial and Virus Strains
E.coli BL21 (DE3) Agilent 200131
Chemicals, Peptides, and Recombinant Proteins
cOmpleteTM, EDTA-free Protease Inhibitor Cocktail Roche Cat# 4693116001
Tubulin Porcine Cytoskeleton Cat# T240-C
Tubulin Porcine TRITC Cytoskeleton Cat# TL590M
Tubulin Porcine HiLyte 488TM Cytoskeleton Cat# TL488M
Tubulin Porcine HiLyte 647TM Cytoskeleton Cat# TL670M
Tubulin Porcine (Biotin) Cytoskeleton Cat# T333P
GMPCPP Jena Biosciences Cat# NU-405L
GTP Sigma-Aldrich Cat# G8877
Glucose oxidase Sigma-Aldrich Cat# G7141
Catalase Sigma-Aldrich Cat# C9322
DTT Sigma-Aldrich Cat# R0861
k-casein Sigma-Aldrich Cat# C0406
StrepTactin Sepharose High Performance GE Healthcare Cat# 28-9355-99
NeutrAvidin Invitrogen Cat# A-2666
Taxol Sigma-Aldrich Cat# T7402
Polyethyleneimine Polysciences Cat# 24765-2
Methyl cellulose, 4000 cp Sigma-Aldrich Cat# M0512
d-Desthiobiotin Sigma-Aldrich Cat# D1411
Coomassie Brilliant Blue SERVA Cat# 17525.02
PLL-PEG-biotin Susos AG, Switzerland PLL(20)-g[3.5]-PEG(2)/PEG(3.4)-biotin(50%)
Tubulin bovine [4] N/A
Fractogel EMD SO, 650 M, Merck Cat# 116882
NHS-ATTO ATTO Tec Cat# AD488-35 and AD565-35
NHS-Biotin Thermo Scientific N/A
tri-ethoxy-silane-PEG (30 kDa) Creative PEGWorks PSB-2014
Hellmanex III HellmaAnalytics Cat# 9-307-011-4-507
Taxotere Sigma Cat# T1912
SU-8 3050 Chimie Tech Services Cat# SU8-3050/0.5
trichloro(1H,1H,2H,2H-perfluorooctyl)silane Sigma Cat# 448931
StrepII-GFP-CLASP2a 1-1527 (full length) [12] N/A
StrepII-mCherry-CLASP2a 1-1527 (full length) This paper N/A
StrepII-TagBFP-CLASP2a 1-1527 (full length) [12] N/A
StrepII-GFP-CLASP2a 295-813 (TOG2-S) [12] N/A
StrepII-mCherry-CLASP2a 295-813 (TOG2-S) This paper N/A
StrepII-TagBFP-CLASP2a 295-813 (TOG2-S) [12] N/A
Kin-5-GFP [22] N/A
Experimental Models: Cell Lines
Human: HEK293T ATCC CRL-11268
Recombinant DNA
Kin-5-GFP Dr. William O. Hancock [22] N/A
StrepII-GFP-CLASP2a 1-1527 (full length) [12] N/A
(Continued on next page)
e1 Current Biology 30, 2175–2183.e1–e6, June 8, 2020
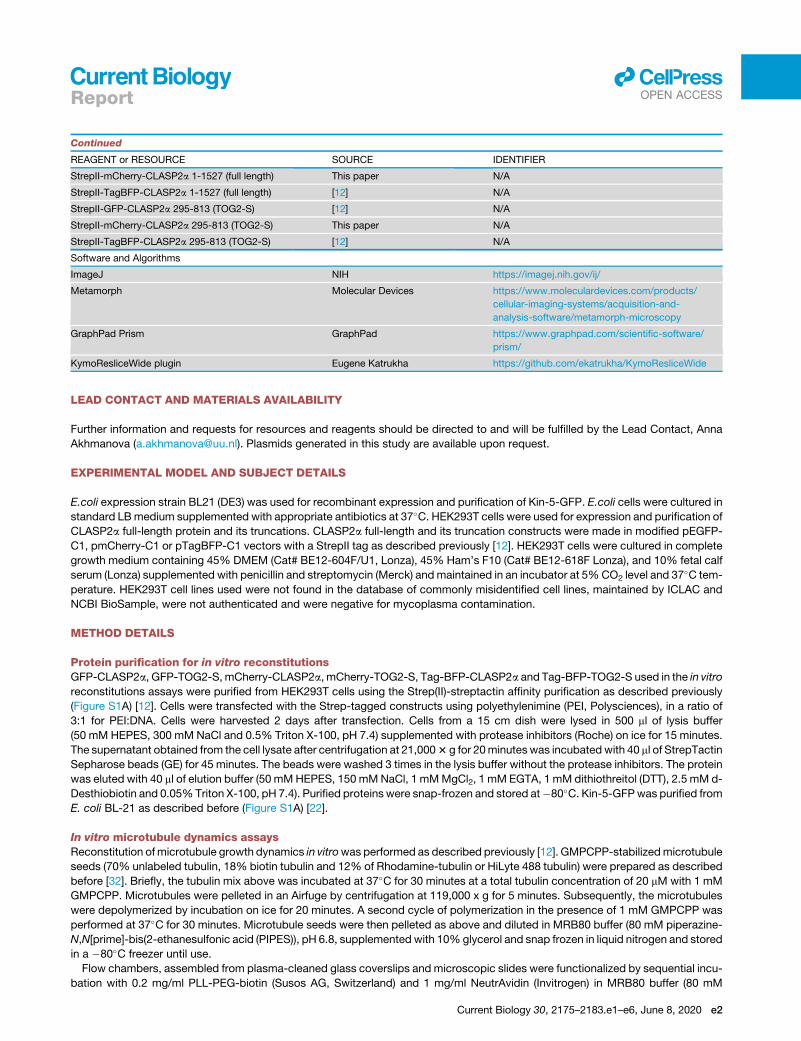
Continued
REAGENT or RESOURCE SOURCE IDENTIFIER
StrepII-mCherry-CLASP2a 1-1527 (full length) This paper N/A
StrepII-TagBFP-CLASP2a 1-1527 (full length) [12] N/A
StrepII-GFP-CLASP2a 295-813 (TOG2-S) [12] N/A
StrepII-mCherry-CLASP2a 295-813 (TOG2-S) This paper N/A
StrepII-TagBFP-CLASP2a 295-813 (TOG2-S) [12] N/A
Software and Algorithms
ImageJ NIH https://imagej.nih.gov/ij/
Metamorph Molecular Devices https://www.moleculardevices.com/products/
cellular-imaging-systems/acquisition-and-
analysis-software/metamorph-microscopy
GraphPad Prism GraphPad https://www.graphpad.com/scientific-software/
prism/
KymoResliceWide plugin Eugene Katrukha https://github.com/ekatrukha/KymoResliceWide
llOPEN ACCESSReport
LEAD CONTACT AND MATERIALS AVAILABILITY
Further information and requests for resources and reagents should be directed to and will be fulfilled by the Lead Contact, Anna
Akhmanova ([email protected]). Plasmids generated in this study are available upon request.
EXPERIMENTAL MODEL AND SUBJECT DETAILS
E.coli expression strain BL21 (DE3) was used for recombinant expression and purification of Kin-5-GFP. E.coli cells were cultured in
standard LBmedium supplemented with appropriate antibiotics at 37�C. HEK293T cells were used for expression and purification of
CLASP2a full-length protein and its truncations. CLASP2a full-length and its truncation constructs were made in modified pEGFP-
C1, pmCherry-C1 or pTagBFP-C1 vectors with a StrepII tag as described previously [12]. HEK293T cells were cultured in complete
growth medium containing 45% DMEM (Cat# BE12-604F/U1, Lonza), 45% Ham’s F10 (Cat# BE12-618F Lonza), and 10% fetal calf
serum (Lonza) supplemented with penicillin and streptomycin (Merck) andmaintained in an incubator at 5%CO2 level and 37�C tem-
perature. HEK293T cell lines used were not found in the database of commonly misidentified cell lines, maintained by ICLAC and
NCBI BioSample, were not authenticated and were negative for mycoplasma contamination.
METHOD DETAILS
Protein purification for in vitro reconstitutionsGFP-CLASP2a, GFP-TOG2-S,mCherry-CLASP2a, mCherry-TOG2-S, Tag-BFP-CLASP2a and Tag-BFP-TOG2-S used in the in vitro
reconstitutions assays were purified from HEK293T cells using the Strep(II)-streptactin affinity purification as described previously
(Figure S1A) [12]. Cells were transfected with the Strep-tagged constructs using polyethylenimine (PEI, Polysciences), in a ratio of
3:1 for PEI:DNA. Cells were harvested 2 days after transfection. Cells from a 15 cm dish were lysed in 500 ml of lysis buffer
(50 mM HEPES, 300 mM NaCl and 0.5% Triton X-100, pH 7.4) supplemented with protease inhibitors (Roche) on ice for 15 minutes.
The supernatant obtained from the cell lysate after centrifugation at 21,0003 g for 20minuteswas incubated with 40 ml of StrepTactin
Sepharose beads (GE) for 45 minutes. The beads were washed 3 times in the lysis buffer without the protease inhibitors. The protein
was eluted with 40 ml of elution buffer (50 mMHEPES, 150 mMNaCl, 1 mMMgCl2, 1 mM EGTA, 1 mM dithiothreitol (DTT), 2.5 mM d-
Desthiobiotin and 0.05%Triton X-100, pH 7.4). Purified proteins were snap-frozen and stored at�80�C. Kin-5-GFPwas purified from
E. coli BL-21 as described before (Figure S1A) [22].
In vitro microtubule dynamics assaysReconstitution ofmicrotubule growth dynamics in vitrowas performed as described previously [12]. GMPCPP-stabilizedmicrotubule
seeds (70% unlabeled tubulin, 18% biotin tubulin and 12% of Rhodamine-tubulin or HiLyte 488 tubulin) were prepared as described
before [32]. Briefly, the tubulin mix above was incubated at 37�C for 30 minutes at a total tubulin concentration of 20 mM with 1 mM
GMPCPP. Microtubules were pelleted in an Airfuge by centrifugation at 119,000 x g for 5 minutes. Subsequently, the microtubules
were depolymerized by incubation on ice for 20 minutes. A second cycle of polymerization in the presence of 1 mM GMPCPP was
performed at 37�C for 30 minutes. Microtubule seeds were then pelleted as above and diluted in MRB80 buffer (80 mM piperazine-
N,N[prime]-bis(2-ethanesulfonic acid (PIPES)), pH 6.8, supplemented with 10%glycerol and snap frozen in liquid nitrogen and stored
in a �80�C freezer until use.
Flow chambers, assembled from plasma-cleaned glass coverslips and microscopic slides were functionalized by sequential incu-
bation with 0.2 mg/ml PLL-PEG-biotin (Susos AG, Switzerland) and 1 mg/ml NeutrAvidin (Invitrogen) in MRB80 buffer (80 mM
Current Biology 30, 2175–2183.e1–e6, June 8, 2020 e2
llOPEN ACCESS Report
piperazine-N,N[prime]-bis(2-ethanesulfonic acid (PIPES)), pH 6.8, supplemented with 4 mM MgCl2, and 1 mM EGTA). Microtubule
seeds were attached to the coverslip through biotin-NeutrAvidin interactions. Flow chambers were further blocked with 1 mg/ml
k-casein. The reaction mixture with or without CLASP proteins (MRB80 buffer supplemented with 14.5 mM porcine brain tubulin,
0.5 mMRhodamine-tubulin, 50mMKCl, 1 mM guanosine triphosphate (GTP), 0.5 mg/ml k-casein, 0.1%methylcellulose, and oxygen
scavenger mix (50 mM glucose, 400 mg/ ml glucose oxidase, 200 mg/ml catalase, and 4 mM DTT)) was added to the flow chamber
after centrifugation in an Airfuge for 5 minutes at 119,000 3 g. For experiments with the Kin-5-GFP, KCl was excluded from the re-
action mixture. The flow chamber was sealed with vacuum grease, and dynamic microtubules were imaged immediately at 30�C us-
ing TIRF microscopy. All tubulin products were from Cytoskeleton Inc.
TIRF microscopyIn vitro reconstitution assays were imaged on a TIRF microscope setup as described previously [32] or on an iLas2 TIRF setup (see
below). In brief, we used an inverted research microscope Nikon Eclipse Ti-E (Nikon) with the perfect focus system (Nikon), equipped
with Nikon CFI Apo TIRF 100x 1.49 N.A. oil objective (Nikon) and controlled with MetaMorph 7.7.5 software (Molecular Devices). The
microscope was equipped with TIRF-E motorized TIRF illuminator modified by Roper Scientific France/PICT-IBiSA, Institut Curie. To
keep the in vitro samples at 30�C, a stage top incubator model INUBG2E-ZILCS (Tokai Hit) was used. For excitation, 491 nm 100mW
Calypso (Cobolt) and 561 nm 100 mW Jive (Cobolt) lasers were used. We used ET-GFP 49002 filter set (Chroma) for imaging of pro-
teins tagged with GFP or ET-mCherry 49008 filter set (Chroma) for imaging of proteins tagged with mCherry. Fluorescence was de-
tected using an EMCCD Evolve 512 camera (Roper Scientific) with the intermediate lens 2.5X (Nikon C mount adaptor 2.5X) or using
the CoolSNAP HQ2 CCD camera (Roper Scientific) without an additional lens. In both cases the final magnification was 0.063 mm/
pixel.
The iLas2 system (Roper Scientific) is a dual laser illuminator for azimuthal spinning TIRF (or Hilo) illumination and with a custom
modification for targeted photomanipulation. This system was installed on Nikon Ti microscope (with the perfect focus system, Ni-
kon), equipped with 150 mW 488 nm laser and 100 mW 561 nm laser, 49002 and 49008 Chroma filter sets, EMCCD Evolve mono FW
DELTA 512x512 camera (Roper Scientific) with the intermediate lens 2.5X (Nikon C mount adaptor 2.5X), CCD camera CoolSNAP
MYO M-USB-14-AC (Roper Scientific) and controlled with MetaMorph 7.8.8 software (Molecular Device). To keep the in vitro sam-
ples at 30�C, a stage top incubator model INUBG2E-ZILCS (Tokai Hit) was used. The final resolution using EMCCD camera was
0.065 mm/pixel, using CCD camera it was 0.045 mm/pixel.
Both microscopes were equipped with an iLas system (Roper Scientific France/PICT-IBiSA) for FRAP and photoablation. The
532 nm Q-switched pulsed laser (Teem Photonics) was used for photoablation by targeting the laser on the microtubule lattice on
the TIRFmicroscope and next to the lattice to induce damage. For severing or damage, a 20 by 20 pixel box was used for illumination
at 10%–15% laser power of the 532 nm pulsed laser with a maximum of 20 Hz at 100% for 100ms. For severing, the laser was aimed
at a point on the microtubule lattice whereas for damage the laser irradiation was performed very close to the microtubule lattice but
not directly at the lattice.
Intensity quantifications along the lattice at damage siteFor tubulin and CLASP2a/TOG2-S intensity analysis in Figures 1E and 1F, 6 pixel wide lines were manually drawn at the damage site
and the mean intensity values obtained from by Fiji were background subtracted. For both the tubulin and CLASP/TOG2-S intensity
analysis, the mean intensities before damage, after damage and after repair IðxÞ were normalized by the mean intensity before dam-
age Ibeforedamage yielding mean intensity before damage = 1:
InormðxÞ = IðxÞIbeforedamage
For Figures S1C and S1D, the raw intensity values were obtained bymanually drawing 10 pixel wide line at the site of damage and the
mean value obtained was background subtracted. Similarly, for Figures S1E–S1G, the mean intensity values were recorded at each
frame during the time course, background subtracted (Ix) and normalized to the mean intensity value before damage to monitor the
relative changes in intensity with respect to the intensity before damage:
InormðxÞ = IðxÞIbeforedamage
$100
All the intensity profiles were aligned at the point immediately after damage as indicated by the vertical dotted lines and depicted as
mean and standard deviation of the normalized intensity at each time point.
For Figures 1H and S1H and S1I, the intensity profiles over time were generated by drawing a 10 pixel wide line at the site of dam-
age to obtain mean intensity values at each time point during acquisition which were subsequently background subtracted (Ix). All the
intensity profiles were aligned to the time point immediately after damage and normalized to the mean intensity value immediately
after damage (Iafterdamage) (intensity immediately after damage = 1).
InormðxÞ = IðxÞIafterdamage
e3 Current Biology 30, 2175–2183.e1–e6, June 8, 2020
llOPEN ACCESSReport
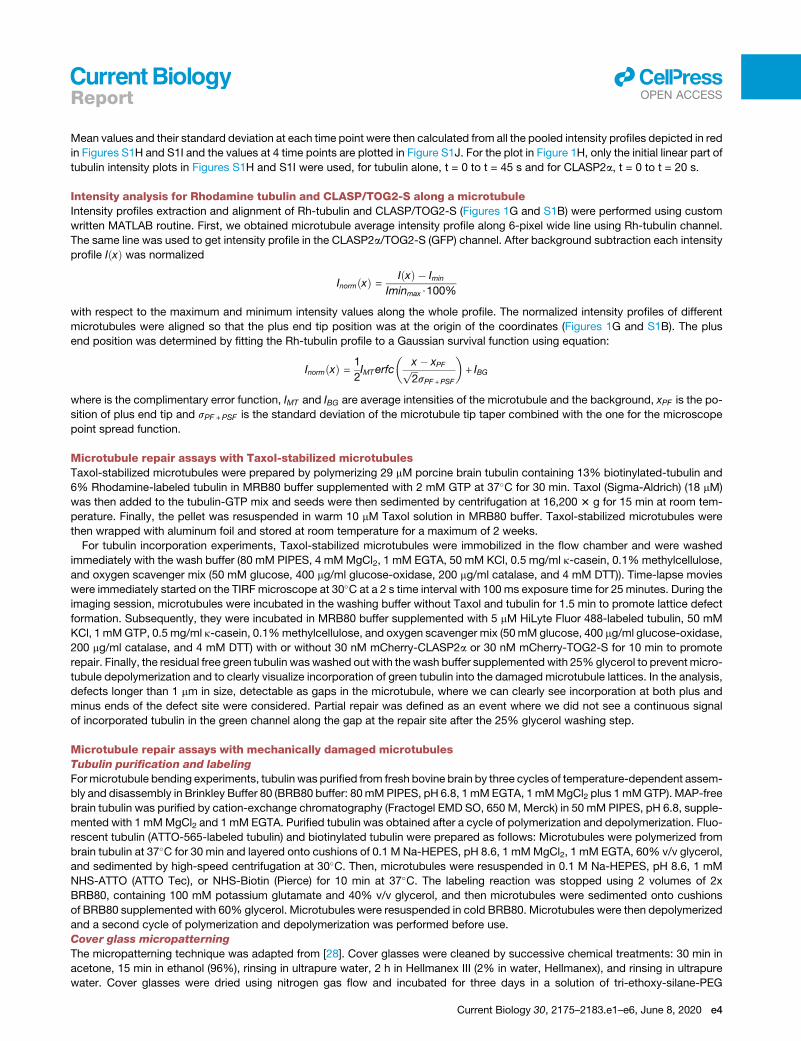
Mean values and their standard deviation at each time point were then calculated from all the pooled intensity profiles depicted in red
in Figures S1H and S1I and the values at 4 time points are plotted in Figure S1J. For the plot in Figure 1H, only the initial linear part of
tubulin intensity plots in Figures S1H and S1I were used, for tubulin alone, t = 0 to t = 45 s and for CLASP2a, t = 0 to t = 20 s.
Intensity analysis for Rhodamine tubulin and CLASP/TOG2-S along a microtubuleIntensity profiles extraction and alignment of Rh-tubulin and CLASP/TOG2-S (Figures 1G and S1B) were performed using custom
written MATLAB routine. First, we obtained microtubule average intensity profile along 6-pixel wide line using Rh-tubulin channel.
The same line was used to get intensity profile in the CLASP2a/TOG2-S (GFP) channel. After background subtraction each intensity
profile IðxÞ was normalized
InormðxÞ = IðxÞ � Imin
Iminmax$100%
with respect to the maximum and minimum intensity values along the whole profile. The normalized intensity profiles of different
microtubules were aligned so that the plus end tip position was at the origin of the coordinates (Figures 1G and S1B). The plus
end position was determined by fitting the Rh-tubulin profile to a Gaussian survival function using equation:
InormðxÞ = 1
2IMTerfc
�x � xPFffiffiffi2
psPF +PSF
�+ IBG
where is the complimentary error function, IMT and IBG are average intensities of the microtubule and the background, xPF is the po-
sition of plus end tip and sPF +PSF is the standard deviation of the microtubule tip taper combined with the one for the microscope
point spread function.
Microtubule repair assays with Taxol-stabilized microtubulesTaxol-stabilized microtubules were prepared by polymerizing 29 mM porcine brain tubulin containing 13% biotinylated-tubulin and
6% Rhodamine-labeled tubulin in MRB80 buffer supplemented with 2 mM GTP at 37�C for 30 min. Taxol (Sigma-Aldrich) (18 mM)
was then added to the tubulin-GTP mix and seeds were then sedimented by centrifugation at 16,200 3 g for 15 min at room tem-
perature. Finally, the pellet was resuspended in warm 10 mM Taxol solution in MRB80 buffer. Taxol-stabilized microtubules were
then wrapped with aluminum foil and stored at room temperature for a maximum of 2 weeks.
For tubulin incorporation experiments, Taxol-stabilized microtubules were immobilized in the flow chamber and were washed
immediately with the wash buffer (80 mM PIPES, 4 mMMgCl2, 1 mM EGTA, 50 mM KCl, 0.5 mg/ml k-casein, 0.1% methylcellulose,
and oxygen scavenger mix (50 mM glucose, 400 mg/ml glucose-oxidase, 200 mg/ml catalase, and 4 mM DTT)). Time-lapse movies
were immediately started on the TIRF microscope at 30�C at a 2 s time interval with 100 ms exposure time for 25 minutes. During the
imaging session, microtubules were incubated in the washing buffer without Taxol and tubulin for 1.5 min to promote lattice defect
formation. Subsequently, they were incubated in MRB80 buffer supplemented with 5 mM HiLyte Fluor 488-labeled tubulin, 50 mM
KCl, 1 mMGTP, 0.5 mg/ml k-casein, 0.1%methylcellulose, and oxygen scavenger mix (50mM glucose, 400 mg/ml glucose-oxidase,
200 mg/ml catalase, and 4 mM DTT) with or without 30 nM mCherry-CLASP2a or 30 nM mCherry-TOG2-S for 10 min to promote
repair. Finally, the residual free green tubulin waswashed out with the wash buffer supplemented with 25%glycerol to preventmicro-
tubule depolymerization and to clearly visualize incorporation of green tubulin into the damaged microtubule lattices. In the analysis,
defects longer than 1 mm in size, detectable as gaps in the microtubule, where we can clearly see incorporation at both plus and
minus ends of the defect site were considered. Partial repair was defined as an event where we did not see a continuous signal
of incorporated tubulin in the green channel along the gap at the repair site after the 25% glycerol washing step.
Microtubule repair assays with mechanically damaged microtubulesTubulin purification and labeling
Formicrotubule bending experiments, tubulin was purified from fresh bovine brain by three cycles of temperature-dependent assem-
bly and disassembly in Brinkley Buffer 80 (BRB80 buffer: 80mMPIPES, pH 6.8, 1mMEGTA, 1mMMgCl2 plus 1mMGTP). MAP-free
brain tubulin was purified by cation-exchange chromatography (Fractogel EMD SO, 650 M, Merck) in 50 mM PIPES, pH 6.8, supple-
mented with 1 mMMgCl2 and 1 mM EGTA. Purified tubulin was obtained after a cycle of polymerization and depolymerization. Fluo-
rescent tubulin (ATTO-565-labeled tubulin) and biotinylated tubulin were prepared as follows: Microtubules were polymerized from
brain tubulin at 37�C for 30 min and layered onto cushions of 0.1 M Na-HEPES, pH 8.6, 1 mMMgCl2, 1 mM EGTA, 60% v/v glycerol,
and sedimented by high-speed centrifugation at 30�C. Then, microtubules were resuspended in 0.1 M Na-HEPES, pH 8.6, 1 mM
NHS-ATTO (ATTO Tec), or NHS-Biotin (Pierce) for 10 min at 37�C. The labeling reaction was stopped using 2 volumes of 2x
BRB80, containing 100 mM potassium glutamate and 40% v/v glycerol, and then microtubules were sedimented onto cushions
of BRB80 supplemented with 60% glycerol. Microtubules were resuspended in cold BRB80. Microtubules were then depolymerized
and a second cycle of polymerization and depolymerization was performed before use.
Cover glass micropatterning
The micropatterning technique was adapted from [28]. Cover glasses were cleaned by successive chemical treatments: 30 min in
acetone, 15 min in ethanol (96%), rinsing in ultrapure water, 2 h in Hellmanex III (2% in water, Hellmanex), and rinsing in ultrapure
water. Cover glasses were dried using nitrogen gas flow and incubated for three days in a solution of tri-ethoxy-silane-PEG
Current Biology 30, 2175–2183.e1–e6, June 8, 2020 e4
llOPEN ACCESS Report
(30 kDa, PSB-2014, Creative PEGWorks) 1 mg/ml in ethanol (96%) and 0.02%HCl, with gentle agitation at room temperature. Cover
glasses were then successively washed in ethanol and ultrapure water, dried with nitrogen gas, and stored at 4�C. Passivated cover
glasses were placed into contact with a photomask (Toppan) with a custom-made vacuum-compatible holder and exposed to deep
UV (7 mW/cm2 at 184 nm, Jelight) for 2.5 min. Deep UV exposure through the transparent micropatterns on the photomask created
oxidized micropatterned regions on the PEG-coated cover glasses.
Microfluidic circuit fabrication and flow control
The microfluidic device was fabricated in polydimethylsiloxane (PDMS, Sylgard 184, Dow Corning) using standard photolithography
and soft lithography. The master mold was fabricated by patterning 85 mm thick negative photoresist (SU8 3050, Microchem, MA) by
photolithography. A positive replica was fabricated by replica molding PDMS against the master. Prior to molding, the master mold
was silanized with trichloro(1H,1H,2H,2H-perfluorooctyl)silane (Sigma) for easier lift-off. Four inlet and outlet ports were made in the
PDMS device using 0.5 mm soft substrate punches (UniCore 0.5, Ted Pella, Redding, CA). The PDMS device was then brought into
contact with amicropatterned cover glass and placed in a custom-made holder that could be fitted on themicroscope stage. A trans-
parent plate was fixed on the holder to apply gentle pressure on the chip in order to avoid leaks without the need of permanent
bonding to the cover glass. The top plate had four openings for the inlet and outlet tubing. Teflon tubing (Tefzel, inner diameter:
0.03’’, outer diameter: 1/16’’, Upchurch Scientific) was inserted into the two ports serving as outlets. Tubing with 0.01’’ inner and
1/16’’ outer diameter was used to connect the inlets via two three-way valves (Omnifit Labware, Cambridge, UK) that could be
opened and closed by hand to a computer-controlled microfluidic pump (MFCS-4C, Fluigent, Villejuif, France). Flow inside the
chip was controlled using theMFCS-Flex control software (Fluigent). Custom rubber pieces that fit onto the tubing were used to close
the open ends of the outlet tubing when needed.
Microtubule growth on micropatterns
Microtubule seeds were prepared at 10 mM tubulin concentration (30%ATTO-565 or ATTO-488-labeled tubulin and 70%biotinylated
tubulin) in BRB80 supplemented with 0.5 mM GMPCPP at 37�C for 1 h. The seeds were incubated with 1 mM Taxotere (Sigma) at
room temperature for 30 min and were then sedimented by high speed centrifugation at 30�C and resuspended in BRB80 supple-
mented with 0.5 mM GMPCPP and 1 mM Taxotere. Seeds were stored in liquid nitrogen and quickly warmed to 37�C before use.
The holder with the chip was fixed on the stage and the chip was perfused with NeutrAvidin (25 mg/ml in BRB80, Pierce), then
washed with BRB80, passivated for 20 s with PLL-g-PEG (Pll 20K-G35-PEG2K, Jenkam Technology) at 0.1 mg/ml in 10 mM Na-
HEPES (pH 7.4), and washed again with BRB80. Microtubule seeds were flown into the chamber at high flow rates perpendicular
to the micropatterned lines to ensure proper orientation of the seeds. Unattached seeds were washed out immediately using
BRB80 supplemented with 1% BSA. Seeds were elongated with a mixture containing 27 mM tubulin (20% labeled) in BRB80 supple-
mented with 50 mMNaCl, 25 mMNaPi, 1 mMGTP, an oxygen scavenger cocktail (20 mMDTT, 1.2 mg/ml glucose, 8 mg/ml catalase
and 40 mg/ml glucose oxidase), 0.1% BSA and 0.033%methyl cellulose (1500 cp, Sigma). Microtubules were bent by an orthogonal
fluid flow either using the same mixture supplemented with 0.02% red fluorescent beads (0.52 mm diameter, Thermo Scientific) or
supplementing it additionally with 30 nM GFP-CLASP2a.
Imaging
Microtubules were visualized using an objective-based azimuthal ILAS2 TIRF microscope (Nikon Eclipse Ti, modified by Roper Sci-
entific) and an Evolve 512 camera (Photometrics). The microscope stage was kept at 35�C using a warm stage controller (LINKAM
MC60). Excitation was achieved using 491 and 561 nm lasers (Optical Insights). Time-lapse recording was performed using Meta-
morph software (version 7.7.5, Universal Imaging). Movies were processed to improve the signal/noise ratio (smooth and subtract
background functions of ImageJ, version 2.2.0-rc-65 / 1.51 s).
Measurement of microtubule persistence length
Themicrotubule is described as an inextensible slender filament with length L and bending rigidity k, which is bent in two dimensions
by the fluid flow. Its elastic energy E is given by
EðrÞ =Z L
0
(k
2
�d2r
ds2
�2
+l
2
"�dr
ds
�2
� 1
#)ds Equation 1
The vector r(s) denotes the position of the filament parameterized by the arc length s and l denotes a Lagrange multiplier associated
with the inextensibility condition |dr/ds| = 1. The force exerted on the filament is given by the functional variation of the potential E with
respect to the filament position vector r
FB = � dE
drEquation 2
The filament orientation is fixed by the seed orientation at s = 0, whereas the other end of the filament at s = L is force-free. The hy-
drodynamic drag exerted by the fluid flow on a slender filament is given by
FH = gm
�I� 1
2
dr
ds5
dr
ds
�vb Equation 3
where vb denotes the velocity fieldmeasured by the bead displacements, m denotes the viscosity of the fluid and g denotes a geomet-
rical factor of the order of 1, which depends on the distance of the filament from the surface, the radius of the filament and the
e5 Current Biology 30, 2175–2183.e1–e6, June 8, 2020

llOPEN ACCESSReport
distance of the beads from the surface. 5 denotes the outer product and I is the identity tensor. In mechanical equilibrium
FB + FH = 0 Equation 4
which determines the equilibrium shape of the filament subject to the appropriate boundary conditions. The filament rigidity was
determined by solving Equations 1, 2, 3, and 4 using the AUTO-07p software package and by minimizing the function
u2ðkÞ = 1
L
Z L
0
½rRðsÞ � rðsÞ�2ds Equation 5
where rR(s) denotes themeasured position of the filament. The persistence length is then given by Lp = k/(kB T).u is a measure for the
distance between the shapes of two microtubules. In the fitting routine for the experimentally measured microtubule shapes, u de-
notes the distance between the shape of the experimental snake and an inextensible flexible filament subjected to the same flow as
the experimental snake. We assumed that the origin of the microtubule was clamped in the direction of the seed. To correct for a
measurement error of the microtubule origin, we optimized Equation 5 also for the position of the microtubule origin.
Mass spectrometryPurified CLASP2a was run on SDS-PAGE gel. After in-gel digestion, samples were resuspended in 10% formic acid (FA)/5% DMSO
and were analyzed using an Agilent 1290 Infinity (Agilent Technologies) LC connected to an Orbitrap Q-Exactive HF mass spectrom-
eter (Thermo Fisher Scientific). Samples were first trapped (Dr Maisch Reprosil C18, 3 um, 2 cm x 100 mm) before being separated on
an analytical column (Agilent Poroshell EC-C18, 2.7 mm, 40 cm x 50 mm), using a gradient of 50min at a column flow of 150 nl/min. The
mass spectrometer was used in a data-dependent mode, automatically switching between MS and MS/MS. Full scan MS spectra
fromm/z 375 – 1600 were acquired at a resolution of 60.000 after the accumulation to a target value of 3E6. HCD fragmentation of up
to 15 most intense precursor ions was performed at normalized collision energy of 25% after the accumulation to a target value of
1e5. MS2 was acquired at a resolution of 15.000 and dynamic exclusion was enabled. Raw files were processed using Proteome
Discoverer 1.4 (version 1.4.0.288, Thermo Fisher Scientific). The database search was performed usingMascot (version 2.4.1, Matrix
Science, UK) against the Uniprot human database (version 2.4). Carbamidomethylation of cysteines was set as a fixed modification
and oxidation of methionine was set as a variable modification. Trypsin was specified as enzyme and up to two miss cleavages were
allowed. Data filtering was performed using percolator, resulting in 1% false discovery rate (FDR). Additional filters were; search en-
gine rank 1 peptides and ion score > 20.
QUANTIFICATION AND STATISTICAL ANALYSIS
Kymographs were generated using the ImageJ plugin KymoResliceWide (https://github.com/ekatrukha/KymoResliceWide). MT
growth rate was determined from kymographs using an optimized version of the custom-made JAVA plug in for ImageJ as described
previously [12]. Number of samples, replicates and error bars have been indicated in the figure legends. Spearman correlation test
was performed to test for microtubule softening. All statistical analyses were performed using GraphPad Prism 7 and the details of
statistical tests and the resulting p values were included in the figure legends.
DATA AND CODE AVAILABILITY
ImageJ plugin KymoResliceWide is available online at https://github.com/ekatrukha/KymoResliceWide. All data supporting the con-
clusions of the current study are available from the corresponding author on request.
Current Biology 30, 2175–2183.e1–e6, June 8, 2020 e6
Current Biology, Volume 30
Supplemental Information
CLASP Mediates Microtubule Repair
by Restricting Lattice Damage
and Regulating Tubulin Incorporation
Amol Aher, Dipti Rai, Laura Schaedel, Jeremie Gaillard, Karin John, QingyangLiu, Maarten Altelaar, Laurent Blanchoin, Manuel Thery, and Anna Akhmanova
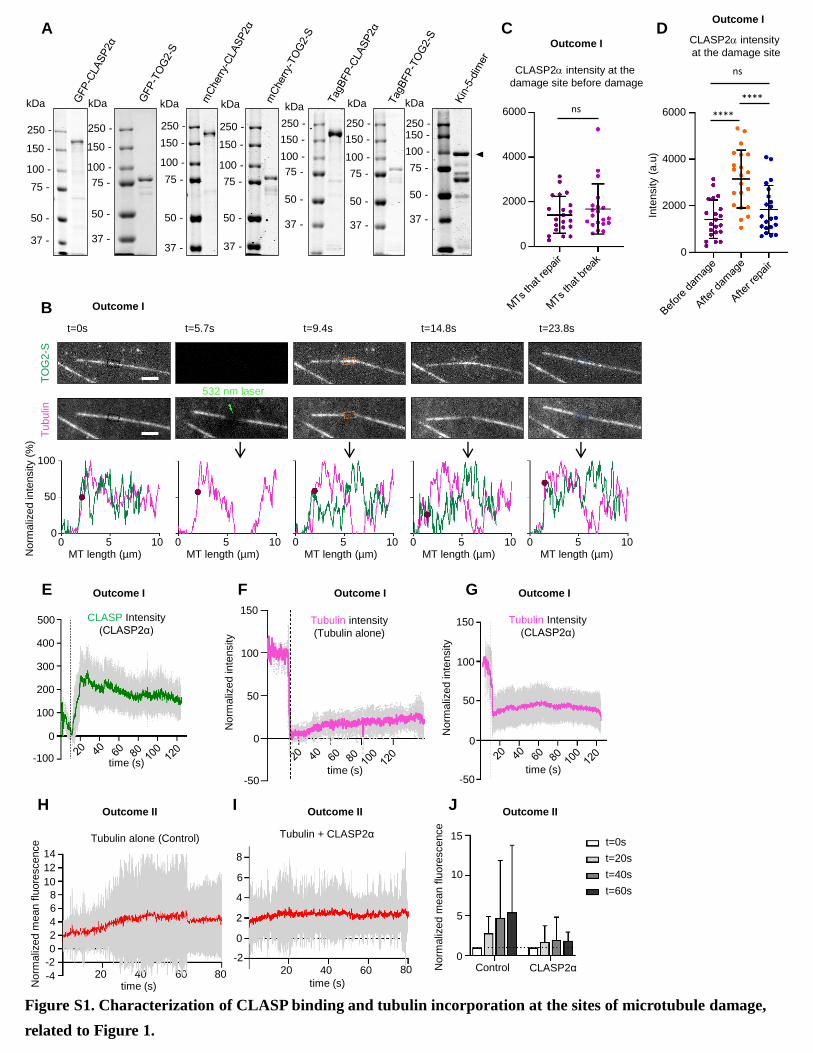
-50
Norm
aliz
ed in
tensity
Tubulin Intensity
(CLASP2α)
time (s)
0
50
100
150
0
100
CLASP Intensity
(CLASP2α)
200
300
400
500
-100 time (s)
CLASP2a intensity at the
damage site before damage
0
2000
4000
6000 ns
Tubulin intensity
(Tubulin alone)
0
50
100
150
Norm
aliz
ed in
tensity
-50time (s)
B
F GE
CN
orm
aliz
ed in
tensity (
%)
t=5.7s
532 nm laser
t=9.4s t=14.8st=0s
TO
G2-S
Tubulin
MT length (µm)5 100
MT length (µm)5 10
MT length (µm)5 1000
MT length (µm)5 10
0
50
100
0
t=23.8s
MT length (µm)5 100
A
50 -
37 -
kDa
250 -
150 -
100 -
75 -
50 -
37 -
250 -
150 -
100 -
75 -
kDa
50 -
37 -
kDa
250 -
150 -
100 -
75 -
50 -
37 -
250 -
150 -
100 -
75 -
kDa
50 -
37 -
kDa
250 -
150 -
100 -
75 -
50 -
37 -
250 -
150 -
100 -
75 -
kDa
50 -
37 -
250 -150 -
100 -
75 -
kDa
D
time (s)
Tubulin alone (Control)
Norm
aliz
ed m
ean f
luore
scence
-4
-2
0
2
4
6
8
10
12
14
20 40 60 80
Tubulin + CLASP2α
-2
0
2
4
6
8
20 40 60 80
time (s)
CLASP2αControl0
5
10
15
Norm
aliz
ed m
ean f
luore
scence
H I J
t=0s
t=20s
t=40s
t=60s
Outcome I Outcome I Outcome I
Outcome II Outcome II
Outcome I
Outcome I
Outcome II
Outcome I
Figure S1. Characterization of CLASP binding and tubulin incorporation at the sites of microtubule damage,
related to Figure 1.
0
2000
4000
6000
CLASP2a intensity
at the damage site
Inte
nsity (
a.u
)
****
****
ns
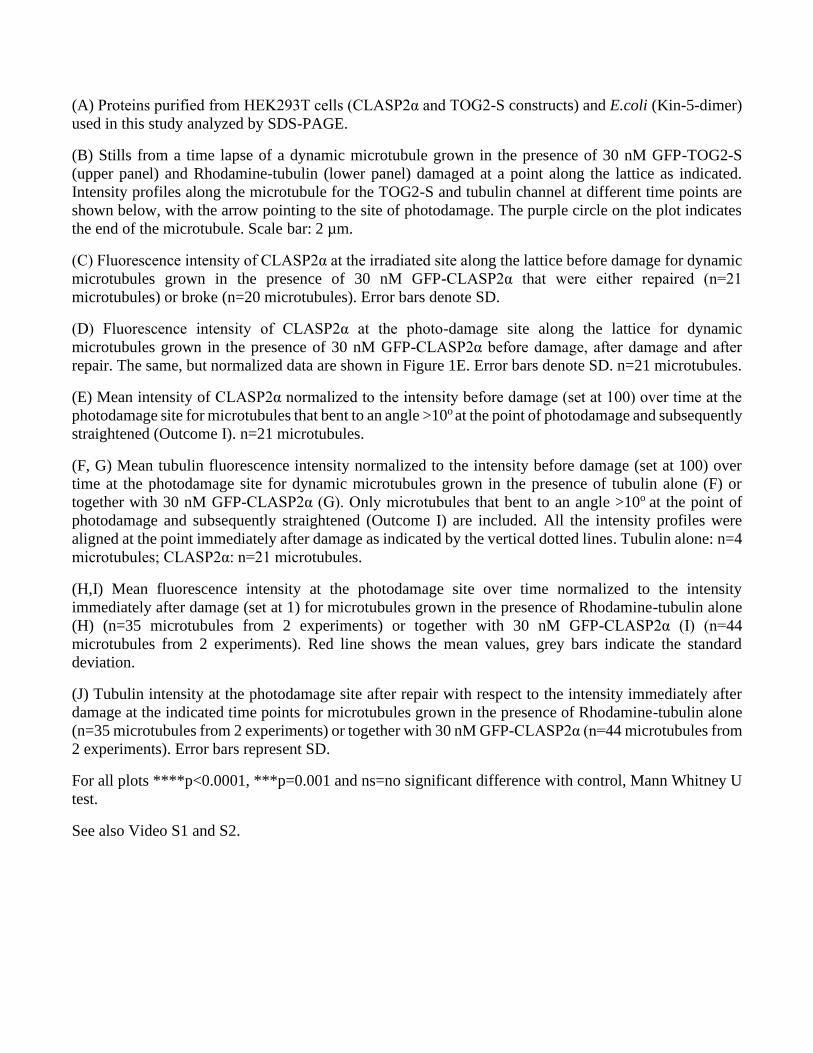
(A) Proteins purified from HEK293T cells (CLASP2α and TOG2-S constructs) and E.coli (Kin-5-dimer)
used in this study analyzed by SDS-PAGE.
(B) Stills from a time lapse of a dynamic microtubule grown in the presence of 30 nM GFP-TOG2-S
(upper panel) and Rhodamine-tubulin (lower panel) damaged at a point along the lattice as indicated.
Intensity profiles along the microtubule for the TOG2-S and tubulin channel at different time points are
shown below, with the arrow pointing to the site of photodamage. The purple circle on the plot indicates
the end of the microtubule. Scale bar: 2 µm.
(C) Fluorescence intensity of CLASP2α at the irradiated site along the lattice before damage for dynamic
microtubules grown in the presence of 30 nM GFP-CLASP2α that were either repaired (n=21
microtubules) or broke (n=20 microtubules). Error bars denote SD.
(D) Fluorescence intensity of CLASP2α at the photo-damage site along the lattice for dynamic
microtubules grown in the presence of 30 nM GFP-CLASP2α before damage, after damage and after
repair. The same, but normalized data are shown in Figure 1E. Error bars denote SD. n=21 microtubules.
(E) Mean intensity of CLASP2α normalized to the intensity before damage (set at 100) over time at the
photodamage site for microtubules that bent to an angle >10o at the point of photodamage and subsequently
straightened (Outcome I). n=21 microtubules.
(F, G) Mean tubulin fluorescence intensity normalized to the intensity before damage (set at 100) over
time at the photodamage site for dynamic microtubules grown in the presence of tubulin alone (F) or
together with 30 nM GFP-CLASP2α (G). Only microtubules that bent to an angle >10o at the point of
photodamage and subsequently straightened (Outcome I) are included. All the intensity profiles were
aligned at the point immediately after damage as indicated by the vertical dotted lines. Tubulin alone: n=4
microtubules; CLASP2α: n=21 microtubules.
(H,I) Mean fluorescence intensity at the photodamage site over time normalized to the intensity
immediately after damage (set at 1) for microtubules grown in the presence of Rhodamine-tubulin alone
(H) (n=35 microtubules from 2 experiments) or together with 30 nM GFP-CLASP2α (I) (n=44
microtubules from 2 experiments). Red line shows the mean values, grey bars indicate the standard
deviation.
(J) Tubulin intensity at the photodamage site after repair with respect to the intensity immediately after
damage at the indicated time points for microtubules grown in the presence of Rhodamine-tubulin alone
(n=35 microtubules from 2 experiments) or together with 30 nM GFP-CLASP2α (n=44 microtubules from
2 experiments). Error bars represent SD.
For all plots ****p<0.0001, ***p=0.001 and ns=no significant difference with control, Mann Whitney U
test.
See also Video S1 and S2.

Tubulin (20 µM)
D
Depolymerization to seed/
GMPCPP cap
E
Microtubule
GMPCPP cap
532 nm laser t=3.0s t=9.7sMicrotubule
CLASP2α
532 nm laser
Microtubule
GMPCPP cap
t=4.5s Microtubule
CLASP2α
t=49.9s
Microtubule
GMPCPP cap
t=7.0s Microtubule
CLASP2α
t=100s
No Tubulin +
CLASP2α (30nM)
Microtubule
GMPCPP cap
t=0s
No Tubulin Seed
Seed GMPCPP Cap
Tubulin (5 µM) + GMPCPP
(3) Monitor ablated
microtubule lattice
(1) Polymerize microtubules
(2) GMPCPP capping
532 nm laser
+ -
+ -
Depolymerization of freshly
generated ends
Seed + -
+ -
Stabilization of freshly
generated ends
Seed
Reaction mix without
tubulin, ± CLASP2α
F
Microtubule
CLASP2α
t=0sSeedSeed
Stabilization along lattice
Freshly generated
microtubule + end
Perc
enta
ge o
f to
tal events
0
25
50
75
100
0
25
50
75
100
Freshly generated
microtubule - end
G H
C
Length (µm)
Control (tubulin alone)
Rela
tive f
requency (
%)
0
5
10
15
20CLASP2α TOG2-S
0
10
20
30
0
5
10
15
20Total MT length
Severed MT length
Severed microtubule plus end shortening length
100
75
50
25
0
100
75
50
25
0
100
75
50
25
0
Rela
tive f
requency (
%)
0 1 2 3 ≥4 0 1 2 3 ≥40 1 2 3 ≥4
Length (µm)
Control
(Tubulin alone)
CLASP2α TOG2-S
A
PA
PA
Tubulin, TOG2-S
0.0
5.1
7.8
74.2
90.0
time(s)
BOutcome III
Figure S2. CLASP protects severed microtubules from depolymerization, related to Figure 1.
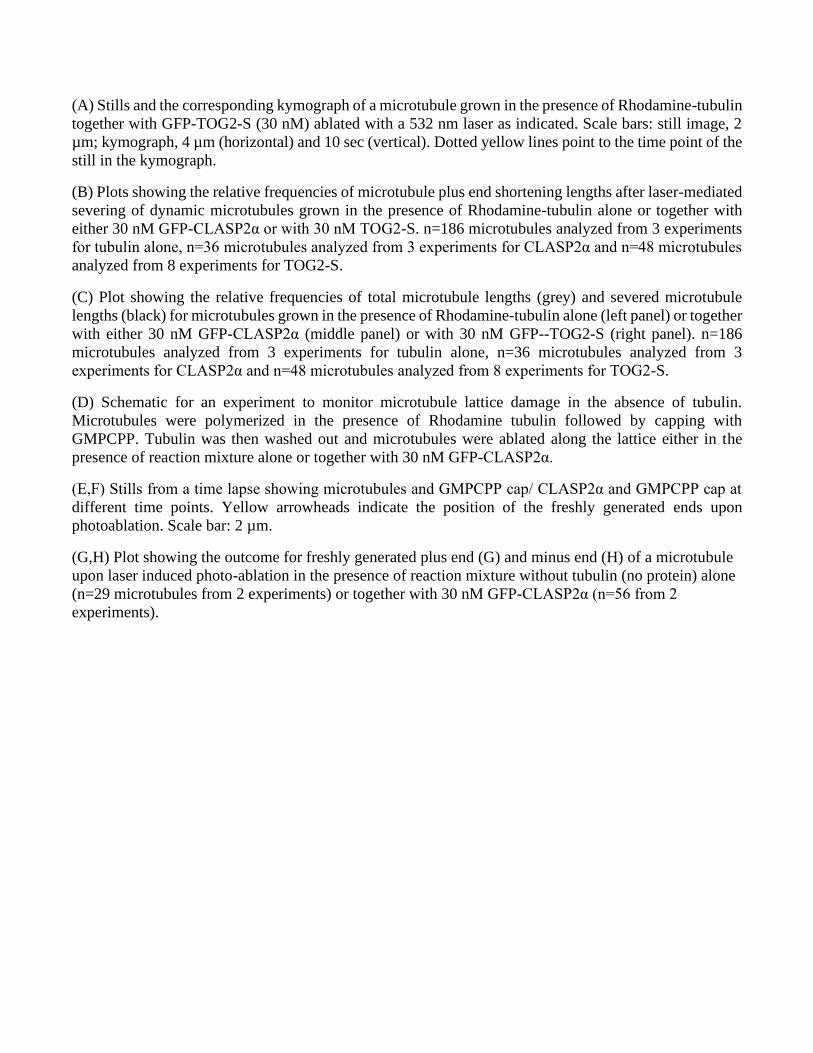
(A) Stills and the corresponding kymograph of a microtubule grown in the presence of Rhodamine-tubulin
together with GFP-TOG2-S (30 nM) ablated with a 532 nm laser as indicated. Scale bars: still image, 2
µm; kymograph, 4 µm (horizontal) and 10 sec (vertical). Dotted yellow lines point to the time point of the
still in the kymograph.
(B) Plots showing the relative frequencies of microtubule plus end shortening lengths after laser-mediated
severing of dynamic microtubules grown in the presence of Rhodamine-tubulin alone or together with
either 30 nM GFP-CLASP2α or with 30 nM TOG2-S. n=186 microtubules analyzed from 3 experiments
for tubulin alone, n=36 microtubules analyzed from 3 experiments for CLASP2α and n=48 microtubules
analyzed from 8 experiments for TOG2-S.
(C) Plot showing the relative frequencies of total microtubule lengths (grey) and severed microtubule
lengths (black) for microtubules grown in the presence of Rhodamine-tubulin alone (left panel) or together
with either 30 nM GFP-CLASP2α (middle panel) or with 30 nM GFP--TOG2-S (right panel). n=186
microtubules analyzed from 3 experiments for tubulin alone, n=36 microtubules analyzed from 3
experiments for CLASP2α and n=48 microtubules analyzed from 8 experiments for TOG2-S.
(D) Schematic for an experiment to monitor microtubule lattice damage in the absence of tubulin.
Microtubules were polymerized in the presence of Rhodamine tubulin followed by capping with
GMPCPP. Tubulin was then washed out and microtubules were ablated along the lattice either in the
presence of reaction mixture alone or together with 30 nM GFP-CLASP2α.
(E,F) Stills from a time lapse showing microtubules and GMPCPP cap/ CLASP2α and GMPCPP cap at
different time points. Yellow arrowheads indicate the position of the freshly generated ends upon
photoablation. Scale bar: 2 µm.
(G,H) Plot showing the outcome for freshly generated plus end (G) and minus end (H) of a microtubule
upon laser induced photo-ablation in the presence of reaction mixture without tubulin (no protein) alone
(n=29 microtubules from 2 experiments) or together with 30 nM GFP-CLASP2α (n=56 from 2
experiments).