The compensatory growth response of the Atlantic cod: effects of nutritional history
16
Aquaculture International 2, 75-90 (1994) The compensatory growth response of the Atlantic cod: effects of nutritional history M. Jobling*, O.H. Meloy, J. dos Santos and B. Christiansen NFH, University of Troms~, 9037 Tromsg, Norway The effects of different combinations of nutritional background, feeding regimes and dietary compositions on growth responses of the Atlantic cod have been examined Alternating short periods (1-3 weeks) of food deprivation with unlimited prowslon of food depressed growth below that of controls, but cod that were fed on alternate weeks (1 1) were larger than those that were exposed to 2 or 3 week periods of deprlvahon and feeding (2 2 or 3 3) Thus, periods of food deprwatmn of short duration were insufficient to reduce any marked compensatory growth response When cod were deprived of food for longer periods a compensatory growth response was observed On receiving excess food supplies following 8 weeks of food deprivation the fish grew more rapidly than the controls and had completely recovered body weight within 12 weeks The greatest compensatory growth response was shown by cod in poor condition (lowest condition factor), because at the end of an 18 week growth trial there were no differences In body weight between fish irrespectwe of their initial condition Both sexes displayed a compensatory growth response KEYWORDS Atlantic cod (Gadus morhua), Feeding regimes, Compensatory growth INTRODUCTION During the course of the 1970s and 1980s there was an increased interest m the development of marine fish farming, and research efforts were directed towards the examination of the aquaculture potential of a range of species, including the Atlantic cod, Gadus morhua (Jobhng, 1988, Jobhng and Pedersen, m press) Whilst some progress has been made towards controlling reproduction, and defining the environmental and nutritional requirements of the cod, there are doubts regarding the economic viability of cod farming Because food costs may represent over 40% of the production costs involved in fish farming, it m important to examine the benefits that may accrue from the employment of different rearing methods and feeding regimes When refed following a period of undernutrltlon ammals will often display a rapid growth spurt, known as compensatory growth Compensatory growth occurs m a wide range of domestic ammals and birds (Wilson and Osbourn, 1960, O'Donovan, 1984, Plavmk and Hurwltz, 1985, Greeff et al, 1986a,b, Summers et al, 1990, Kynazakm and Emmans, 1991, Leeson et al, 1991, Marms et al, 1991, Stamatans et al, 1991, Jones and Farrell, 1992a,b) Amongst fish species, compensatory growth has been reported for salmomds, cypnmds and pleuronectlds (Briton and Robins, 1973, Weatherley and Gill, 1981, 1987, Dobson and Holmes, 1984, Kmdsch~, 1988, Mlglavs and Jobhng, 1989, Qumton *Author to whom correspondence should be addressed 0967-6120 ~) 1994 Chapman & Hall
-
Upload
independent -
Category
Documents
-
view
7 -
download
0
Transcript of The compensatory growth response of the Atlantic cod: effects of nutritional history

Aquaculture International 2, 75-90 (1994)
The compensatory growth response of the Atlantic cod: effects of nutritional history M. Jobling*, O.H. Meloy, J. dos Santos and B. Christiansen NFH, University of Troms~, 9037 Tromsg, Norway
The effects of different combinations of nutritional background, feeding regimes and dietary compositions on growth responses of the Atlantic cod have been examined Alternating short periods (1-3 weeks) of food deprivation with unlimited prowslon of food depressed growth below that of controls, but cod that were fed on alternate weeks (1 1) were larger than those that were exposed to 2 or 3 week periods of deprlvahon and feeding (2 2 or 3 3) Thus, periods of food deprwatmn of short duration were insufficient to reduce any marked compensatory growth response When cod were deprived of food for longer periods a compensatory growth response was observed On receiving excess food supplies following 8 weeks of food deprivation the fish grew more rapidly than the controls and had completely recovered body weight within 12 weeks The greatest compensatory growth response was shown by cod in poor condition (lowest condition factor), because at the end of an 18 week growth trial there were no differences In body weight between fish irrespectwe of their initial condition Both sexes displayed a compensatory growth response
KEYWORDS Atlantic cod (Gadus morhua), Feeding regimes, Compensatory growth
INTRODUCTION
During the course of the 1970s and 1980s there was an increased interest m the development of marine fish farming, and research efforts were directed towards the examination of the aquacul ture potential of a range of species, including the Atlantic cod, Gadus morhua (Jobhng, 1988, Jobhng and Pedersen, m press) Whilst some progress has been made towards controlling reproduction, and defining the environmental and nutritional requirements of the cod, there are doubts regarding the economic viability of cod farming Because food costs may represent over 40% of the product ion costs involved in fish farming, it m important to examine the benefits that may accrue from the employment of different rearing methods and feeding regimes
When refed following a period of undernutrl t lon ammals will often display a rapid growth spurt, known as compensa to ry growth Compensa tory growth occurs m a wide range of domest ic ammals and birds (Wilson and Osbourn, 1960, O'Donovan, 1984, Plavmk and Hurwltz, 1985, Greeff et al, 1986a,b, Summers et al, 1990, Kynazakm and Emmans, 1991, Leeson et al, 1991, Marms et al, 1991, S tamatans et al, 1991, Jones and Farrell, 1992a,b) Amongst fish species, compensa tory growth has been reported for sa lmomds, c y p n m d s and pleuronect lds (Briton and Robins, 1973, Weatherley and Gill, 1981, 1987, Dobson and Holmes, 1984, Kmdsch~, 1988, Mlglavs and Jobhng, 1989, Qumton
* Author to whom correspondence should be addressed
0967-6120 ~) 1994 Chapman & Hall
76 M Jobbng et al
and Blake, 1990, Belda et al , 1992, Russell and Wootton, 1992, Wleser et al , 1992, Jobhng et al , 1993) It has also been reported that Atlantic cod may display a pronounced compensatory growth response following the return to good feeding conditions after a period of nutritional deficiency (Black and Love, 1986, Pedersen and Jobhng, 1989, Jobhng et al , 1991)
A number of workers have speculated that compensatory growth could be exploited in the commercial production of both farm animals and fish, to control rates of weight gain, or to manipulate the final composition of the body tissues, or to improve growth efficiency (Wilson and Osbourn, 1960, Plavnlk and Hurwltz, 1985, Klndschi, 1988, Qulnton and Blake, 1990, Jones and Farrell, 1992a) In order for this to become a reality, detailed information is required about the effects of different feeding regimes upon weight gain and tissue deposition in different fish species
There is an increasing body of evidence from work with domestic animals that the compensatory growth response may be influenced by factors such as the severity of the feed restriction Imposed, dietary composition and the age, sex and state of sexual maturity of the animals (Wilson and Osbourn, 1960, Plavnik and Hurwltz, 1985, Summers et a l , 1990, Yu et al , 1990, Marals et al , 1991, Stamatarls et al , 1991, Jones and Farrell, 1992a,b) The possible effects of these factors on compensatory growth in fish are, however, almost unknown Consequently, the purpose of the current work was to investigate the compensatory growth responses displayed by Atlantic cod when exposed to a range of different feeding and rearing regimes
MATERIALS AND METHODS
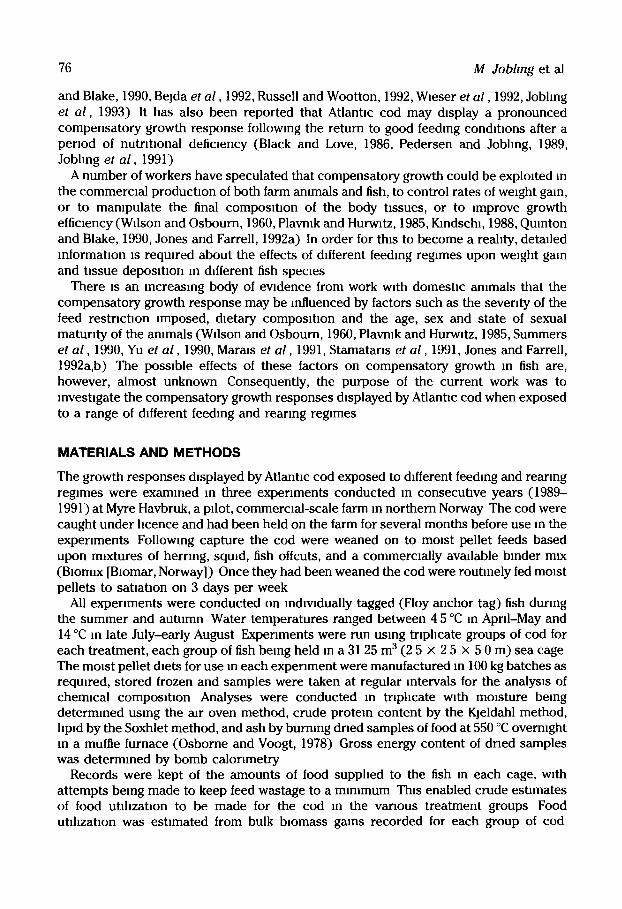
The growth responses displayed by Atlantic cod exposed to different feeding and rearing regimes were examined In three experiments conducted in consecutive years (1989- 1991) at Myre Havbruk, a pilot, commercial-scale farm in northern Norway The cod were caught under llcence and had been held on the farm for several months before use in the experiments Following capture the cod were weaned on to moist pellet feeds based upon mixtures of herring, squid, fish offcuts, and a commercially available binder mix (Blomix [Blomar, Norway]) Once they had been weaned the cod were routinely fed moist pellets to satiation on 3 days per week
All experiments were conducted on individually tagged (Floy anchor tag) fish during the summer and autumn Water temperatures ranged between 4 5 °C in April-May and 14 °C in late July-early August Experiments were run using triplicate groups of cod for each treatment, each group of fish being held in a 31 25 m 3 (2 5 × 2 5 × 5 0 m) sea cage The moist pellet diets for use in each experiment were manufactured in 100 kg batches as required, stored frozen and samples were taken at regular intervals for the analysis of chemical composition Analyses were conducted in triplicate with moisture being determined using the air oven method, crude protein content by the Kleldahl method, lipid by the Soxhlet method, and ash by burning dried samples of food at 550 °C overnight In a muffle furnace (Osborne and Voogt, 1978) Gross energy content of dried samples was determined by bomb calorimetry
Records were kept of the amounts of food supplied to the fish in each cage, with attempts being made to keep feed wastage to a minimum This enabled crude estimates of food utilization to be made for the cod in the various treatment groups Food utilization was estimated from bulk blomass gains recorded for each group of cod
Compensatory growth m cod
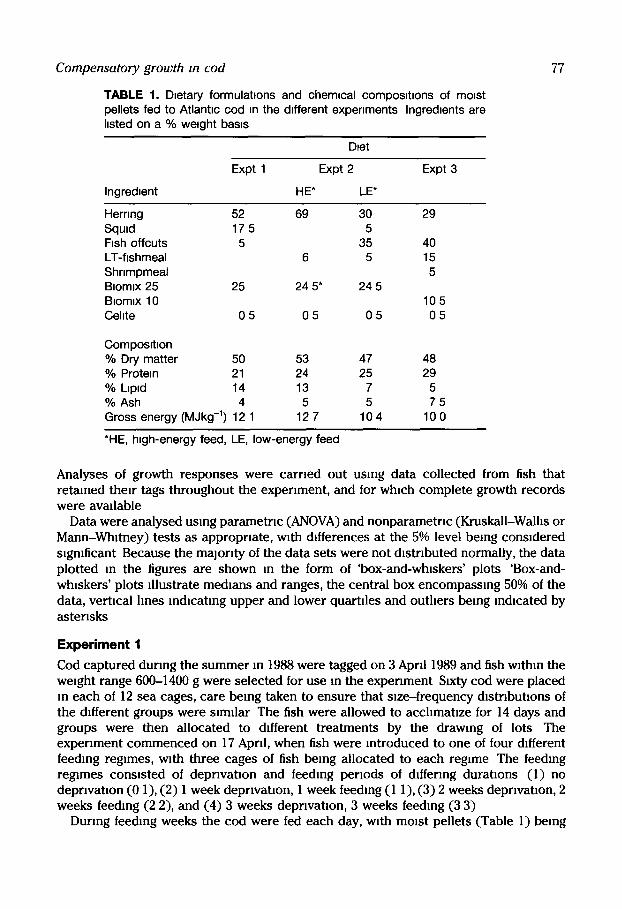
TABLE 1. Dtetary formulattons and chem,cal composttlons of momt pellets fed to Atlanttc cod tn the dtfferent experiments Ingredtents are hsted on a % wetght basts
77
Dtet
Expt 1 Expt 2 Expt 3
Ingredient HE* LE*
Herring 52 69 30 29 Squtd 17 5 5 Ftsh offcuts 5 35 40 LT-fishmeal 6 5 15 Shnmpmeal 5 Btomtx 25 25 24 5* 24 5 Btomtx 10 10 5 Cehte 0 5 0 5 0 5 0 5
Composthon % Dry matter 50 53 47 48 % Protein 21 24 25 29 % Ltpld 14 13 7 5 % Ash 4 5 5 7 5 Gross energy (MJkg -1) 12 1 12 7 104 10 0
*HE, htgh-energy feed, LE, low-energy feed
Analyses of growth responses were carried out using data collected from fish that retained their tags throughout the experiment, and for which complete growth records were avmlable
Data were analysed using parametric (ANOVA) and nonparametrlC (Kruskall-Wallls or Mann-Whitney) tests as appropriate, with differences at the 5% level being considered slgmficant Because the malorlty of the data sets were not distributed normally, the data plotted in the figures are shown in the form of 'box-and-whiskers' plots 'Box-and- whiskers' plots illustrate medmns and ranges, the central box encompassing 50% of the data, vertical hnes indicating upper and lower quartlles and outhers being indicated by asterisks
Experiment 1 Cod captured during the summer in 1988 were tagged on 3 April 1989 and fish within the weight range 600-1400 g were selected for use In the experiment Sixty cod were placed in each of 12 sea cages, care being taken to ensure that size-frequency distributions of the different groups were s~mllar The fish were allowed to acchmatlze for 14 days and groups were then allocated to different treatments by the drawing of lots The experiment commenced on 17 April, when fish were introduced to one of four different feeding regimes, with three cages of fish being allocated to each regime The feeding regimes consisted of deprivation and feeding periods of differing durations (1) no deprwatlon (0 1), (2) 1 week deprwat]on, 1 week feeding (1 1), (3) 2 weeks deprivation, 2 weeks feeding (2 2), and (4) 3 weeks deprivation, 3 weeks feeding (3 3)
During feeding weeks the cod were fed each day, with moist pellets (Table 1) being
78 M Jobbng et al
provided on five or six occasions between 08 30 and 15 00 h in an attempt to ensure that the fish were fed to satiation For fish on the different deprivation regimes a cycle always commenced with a period of food deprivation Fmh were measured and weighed at the start of the experiment and on termination after 24 weeks At the end of the experiment fish were killed and samples taken for the analys~s of liver weight and fillet yield
Exper,ment 2 Cod which had been held in a large sea cage for several months since capture were divided into two groups in mid-March One of the groups was starved for 8 weeks (19 March-14 May 1990), and the other was fed moist pellets slmdar in composition to those used in Experiment 1 (Table 1) on 3 days each week Cod were then selected from each of the groups on the basra of body length such that the fish in all experimental treatment groups had equal average body length (50-51 cm), but the prewously-fed and starved fish differed in body weight Sorting and tagging procedures were carried out on 15-16 May, and the tagged cod were then distributed amongst 12 cages, six of which contained prewously fed fish, and the other six cages held cod which had been starved Each cage held a group of 35 cod Two test diets differing in protein, lipid and gross energy contents were formulated (Table 1) and each diet was fed to six cages of fish Thus, there were four ddferent treatments with three cages of cod per treatment (1) previously starved cod fed high-energy feed, (2) prewously starved cod fed low-energy feed, (3) prewously fed cod fed high-energy feed, and (4) prevaously fed cod fed low-energy feed
The experiment commenced on 17 May and fish were fed to apparent satmtlon each day for the following 18 weeks Body weight was measured at the start of the experiment and after 6, 12 and 18 weeks Samples of fish were taken for examination of fillet yield, dressout percentage (percentage of total body weight remaining following gutting and decapitation) and liver size at the start (n = 18), after 6 and 12 weeks (n = 15 per treatment) and at the end of the experiment (all remaining fish) Liver raze was expressed in terms of the hepatosomatlc index (HSI = [liver weight/body weight] × 100)
Experiment 3 During April cod that had been held in capt~wty since the previous summer were tagged and sorted using body length and condition factor (CF = [W/L 3] × 100) as criteria (1) cod under 60 cm and CF less than 0 8, (2) cod under 60 cm and CF 0 8-0.9, (3) cod under 60 cm and CF greater than 0 9, (4) cod 60-70 cm and CF less than 0 8, (5) cod 60-70 cm and CF 0 8-0 9, and (6) cod 60-70 cm and CF greater than 0 9
Fmh were distributed amongst 18 sea cages to establish six different groups, with three replicates per group Each cage held 35 cod Fmh were fed each day to apparent satmtlon on moist pellets (Table 1) The fish were weighed, and length measured at the start of the experiment, after 6 weeks, 12 weeks, and at the termination of the experiment after 18 weeks At the end of the experiment 10 fish from each replicate (30 fish per group) were killed and dmsected, livers and gonads weighed, and dressout percentages measured
RESULTS
Experiment 1 The sorting procedures employed ensured that there were no slgmficant differences In either body weight or length between the groups of cod allocated to the different

Compensatory growth m cod 79
TABLE 2. The effects of d,fferent feed,ng reg,mes upon growth performance ,n Atlantic cod Groups of cod were etther fed each day (0 1) or were subjected to alternate penods of starvat,on and feed,ng at 1 (1 1). 2 (2 2) or 3 (3 3) week ,ntervals Values shown are means (SD)
In,t,al F,nal L,ver F,Ilet Feed
Feed,ng We,ght We,ght we,ght yteld ga,n rat,o reg,me n (kg) CF (kg) CF (kg) (kg) (MJ kg -1)
0 1 140 094(022) 112(013) 228(047) 131(011) 036(009) 088(018) 379 1 1 138 095(021) 112(015) 195(039) 127(011) 027(007) 069(014) 340 2 2 136 094(022) 113(013) 171(035) 122(011) 024(006) 062(013) 391 3 3 135 093(021) 111 (015) 176(037) 125(011) 026(006) 064(014) 399
treatments, with initial weights and condition factors (CFs) being approximately 0 94 kg and 1 12, respectively (Table 2) Cod m all treatments increased m weight, and significantly improved in condition, during the course of the experiment The data are summarized in Table 2 There were found to be significant differences in growth performance between treatment groups By the end of the experiment the cod that were fed each day were heavier than those fed according to the restricted feeding regimes Cod fed each day also had higher CFs, larger livers and gave higher fillet yields than the fish held on the restricted feeding regimes, irrespective of whether liver and fillet data were treated in absolute (weight) or relative (% of body weight) terms No significant differences were found between treatments in feed gain ratios
There were found to be differences in growth performance between the groups of cod held on the different restricted feeding regimes, with fish that were starved and fed on alternate weeks (1 1) being slgmficantly heawer by the end of the experiment than those on the other regimes (2 2 and 3 3) Thus, there was no evidence that deprwatlon periods of either 2 or 3 weeks imposed a sufficiently severe nutritional stress on the cod to induce a compensatory growth response On the contrary, under the condlUons employed m this experiment, deprivation periods of 2 or 3 weeks (2 2 and 3 3) resulted m the cod growing less well than those that had been deprived of food for a shorter period (1 1), despite the fact that all three groups had been offered food on an equal number of days in total
Experiment 2
At the start of the experiment the cod that had been deprived of food for 8 weeks were significantly lighter than those fed at regular intervals, the mean weight difference amounting to approximately 200 g (Fig 1) The starved fish were thin and thin was reflected in a relatively low mean fillet yield (34%, n = 18), compared with that (39%, n = 17) obtained from the group of cod that had been fed regularly HSIs did not differ between the two groups, being 11 2% and 11 6% for the starved and fed cod, respectwely
Following 6 weeks of feeding the previously starved fish had recovered the malorlty of the body weight lost prior to the start of the experiment, and after 12 and 18 weeks of feeding there were no significant differences in body weight amongst the different treatment groups (Fig 1) Thus, the cod that had been starved prior to the start of the experiment had completely recovered body weight after 12 weeks, and grew at the same rate as the previously fed fish thereafter

80 M Jobhng et al
3500
.•3000 p.. " r
2500 IJ.I
2000
1500 3500~-
3000 I
~25°° I~_
2000 f rn
1500
1000 L 2500
2000
I-'-" 1500 1- Q~ UJ 1000
500 G R O U P
DIET
18 w e e k s
t 12 w e e k s
S t a r t
I I I L 1 2 3 4
S T A R V E D FED HE LE HE LE
FIG. 1. The effects of nutnhonal history (starving or feeding) and d)etary type (h)gh [HE] or low [LE] energy) on weight change )n Atlantic cod Data are illustrated using 'box-and-whiskers' plots (note that astensks denote outhers-see text) Sample sizes are 89, 81,84 and 79 for groups 1-4, respectwely
During the early part of the feeding period most of the weight gain by the previously starved cod was in the form of swlmmlng muscle, and this led to a marked increase m fillet yield compared with fish sampled at the start of the experiment Fillet yield was also influenced by the diet provided, with the previously starved cod fed on the low-energy diet giving a significantly greater relative yield than fish fed the high-energy diet after both 6 weeks (42% vs 39%) and 12 weeks (47% vs 44 5%) of feeding (n = 15 for each treatment) These differences were reflected in dressout percentages after 12 weeks of feeding, with cod fed the low-energy diet giving a higher dressout yield than those fed on the high-energy diet (Fig 2)
Dietary type had much less influence upon fillet yield and dressout percentage

Compensatory growth m cod 81
70
Z w 60 0
LU
0 70
cO uJ rr" O
6 0
18 weeks
12 weeks
I J I i
GROUP 1 2 3 4 STARVED FED
DIET HE LE HE LE
FIG. 2. The effects of nutntlonal htstory (starv)ng or feeding) and dietary type (hagh [HE] or low [LE] energy) on dressout percentage ,n Atlantic cod Sample sizes are 15 per group at 12 weeks, and 89, 81, 84 and 79 for groups 1-4, respectwely, at 18 weeks
obtained from the cod fed prior to the start of the experiment, although yields increased as time progressed Fdlet yields were, for example, 43% and 42% at 6 weeks, and 46% and 46% at 12 weeks for the low-energy and high-energy dietary groups, respectively (n = 15 for each treatment), and there were only small differences in dressout percentages between the different dietary groups sampled after 12 weeks (Fig 2)
When the fish were killed at the end of the experiment, dressout percentages were found to differ amongst groups, but dressout was influenced more by diet than the treatment (starving or feeding) of the cod prior to the start of the experiment (Fig 2)
HSIs showed a trend towards increasing with time, and 12 weeks into the experiment significant dietary effects were also observed At this hme, HSIs were 12 4% and 13 0% for the low-energy starved and fed groups, and 16 0% and 14 2% for the high-energy starved and fed groups, respectively Treatment prior to the experiment (starving or feeding) had no significant effect upon the HSI at the end of the experiment, but cod fed the high- energy diet were found to have significantly larger livers than those fed on the low- energy diet (Fig 3)
Because records were kept of the amounts of moist pellet food provided to each cage of fish, it was possible to estimate food utlhzatlon by each treatment group Dietary composition was not found to have any significant effect on the feed gain ratios displayed by the cod that had been starved prior to the start of the experiment (Table 3) The previously starved fish were, however, particularly efficient in converting food during the early part of the experiment (weeks O-6), and had significantly better feed gain ratios than the cod that had been fed prior to the start of the experiment Dietary type was found to influence the feed gain ratios of the cod that had been fed

82 M Joblmg et al
1 7 -
o~ v
1 4 -
"1-
1 1 - -
I I GROUP 2 3 4
STARVED FED DIET HE LE HE LE
FIG. 3. The effects of nutritional history (starving or feeding) on the hepatosomatlc mdmes (HSI) of Atlantic cod following 18 weeks of feeding on either high-energy (HE) or low-energy (LE) moist pellets Sample sizes are 89, 81, 84 and 79 for groups 1-4, respectwely
TABLE 3. Influence of nutnt,onal history (starving or feeding) and dietary type (high-energy [HE] or low-energy [LE] momt pellets) on food utdlzation by Atlantic cod
Feed gain ratio (MJ kg -1)
Pre- 0-6 0-12 0-18 Group treatment Diet weeks weeks weeks
1 Starved HE 23 1 31 4 32 8 2 Starved LE 24 4 31 0 31 1 3 Fed HE 36 7 39 8 39 5 4 Fed LE 27 2 35 9 34 9
regularly prior to the start of the experiment In these fish, feed gain ratios were poorer for the cod fed the high-energy diet than those fed the low-energy diet (Table 3)
E x p e r i m e n t 3
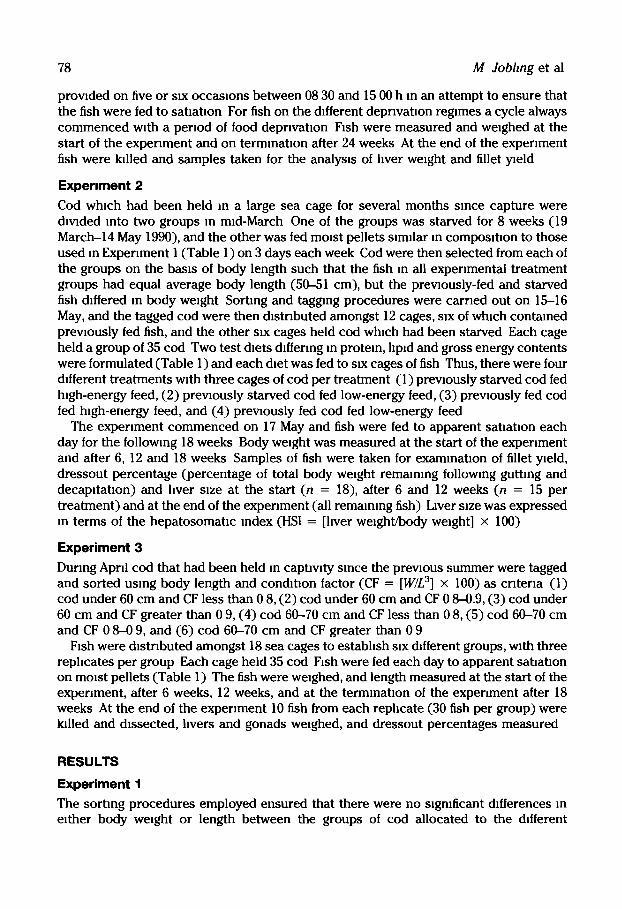
Condition factor was used as the criterion for sorting fish w~thm a gwen length range, so at the start of the experiment the groups of cod differed slgmficantly m body weight (F~g 4) The cod that were m poorest condition at the start dmplayed h~gh rates of weight gain, and almost doubled their body weight within the space of 6 weeks Thin led to body weight differences between groups being markedly reduced after 6 weeks, and by the end of the experiment at 18 weeks, the body weights attained by cod within each mltml length group were similar (Fig 4)
High rates of weight gain tended to be accompamed by efficient utilization of food for growth (Table 4), although no slgmficant differences between treatments were found due to considerable w~thm-treatment varmbdlty Nevertheless, there was a clear trend
Compensatory growth m cod
S ~
°t -t-
w
2
4
1
T
18 weeks
6 weeks
~ 2
I-- n'-
tu 1
Start
I I I I I I
GROUP 1 2 3 4 5 6
Condltton (Start) <08 08-09 >09 <08 08-09 >09
Length (cm) (Start) <60 60 70
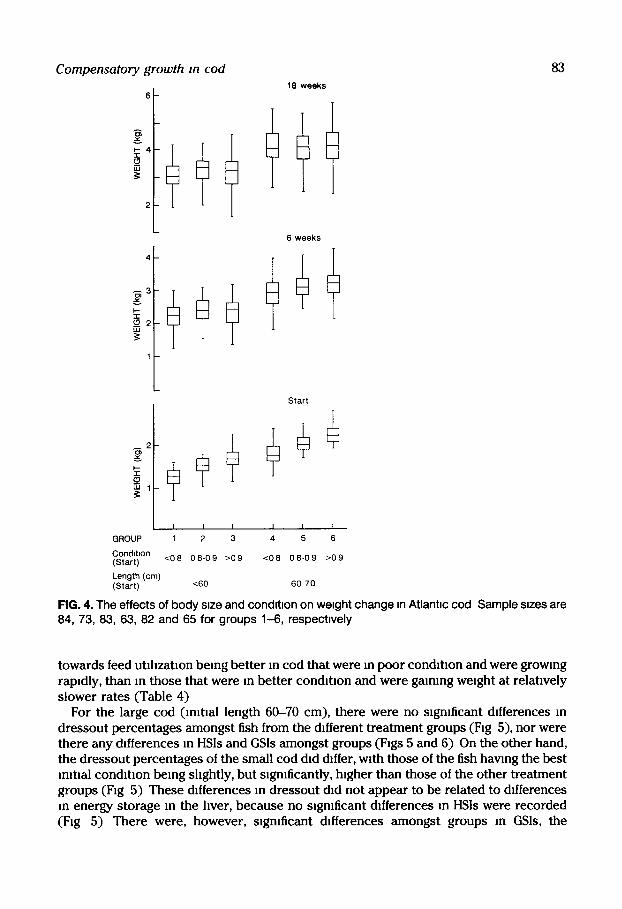
FIG. 4, The effects of body stze and condttton on weight change tn Atlantm cod Sample stzes are 84, 73, 83, 63, 82 and 65 for groups 1-6, respectwely
towards feed utd~zat~on being better m cod that were m poor condition and were growing rapidly, than m those that were in better condition and were gaming weight at relatwely slower rates (Table 4)
For the large cod Omtlal length 60-70 cm), there were no slgmficant differences m dressout percentages amongst fish from the d~fferent treatment groups (Fig 5), nor were there any differences m HSIs and GSIs amongst groups (Figs 5 and 6) On the other hand, the dressout percentages of the small cod d~d differ, w~th those of the fish hawng the best lmt~al condition being shghtly, but s~gmficantly, h~gher than those of the other treatment groups (Fig 5) These differences in dressout did not appear to be related to differences in energy storage in the liver, because no s~gmficant differences m HSIs were recorded (Fig 5) There were, however, slgmficant differences amongst groups m GSIs, the

84
TABLE 4. Influence of initial body size (length) and condition factor on food utihzat~on by Atlantic cod
Feed gain ratio (MJ kg -1)
Initial length 0-6 0-12 0-18 (cm) CF* weeks weeks weeks
<60 < 0 8 25 5 32 8 32 5 <60 0 8 -0 9 27 0 29 6 31 4 <60 > 0 9 32 7 34 4 36 4 60-70 < 0 8 25 5 28 3 30 0 60-70 0 8 -0 9 25 3 28 2 30 4 60-70 >0 9 29 4 30 2 32 5
* Condition factor CF = 100 (W/L3), where Was weight (g) and L is length (cm)
M Jobllng et al
n= 30 30 30 30 29 30
uJ C5 ~< 6 5
Z I.u O r r uJ n
~ 6o CO W n,- 121
i
1 2
"r"
9
GROUP
C o n d i t i o n <0 8 ( S t a r t )
L e n g t h (cm) ( S t a r t )
i i E i i
B i i
8-09 > 0 9 < 0 8 0 8 - 0 9 > 0 9
<60 60-70
FIG. 5. Dressout percentages and hepatosomahc ind~ces (HSI) of Atlantic cod of mlbally ddferent body sizes and condition following 18 weeks of feeding on moist pellets
differences being particularly pronounced for the males (Fig 6) In other words, male cod that had been m poor condit ion at the start of the experiment had invested relatwely more energy m gonadal deve lopment than fish with a higher mlbal CF These differences

Compensatory growth m cod
MALES
n= 12 18 13 16 10 18
85
5
GROUP 4 ~
F E M A L E S
n= 18 12 17 14 19 12
GRouP 4 ~ ~ ~, ~ Condlhon <08 08 09 >09 <08 0 8 - 0 9 >09 {Start)
Length (cm) <60 60 70 (Start)
FIG 6, Gonadosomatlc indices (GSI) of male and female Atlant)c cod of )nltlally d)fferent body s~zes and condition following 18 weeks feeding on moist pellets
m GSIs (Fig 6) were sufficiently large to account for the differences in dressout percentages amongst treatment groups (F~g 5)
DISCUSSION
Experiment 1 showed that rates of weight gain were influenced by the type of food- restrlchon regime Imposed Cod that were fed on a regular basra each day were larger than those fed on the various restricted regimes (1 1,2 2 and 3 3) (Table 2) In addlhon, growth was also influenced by the type of restricted regime apphed, since by the end of the experiment the cod that were fed on the 1 1 regime were significantly larger than those exposed to feeding regimes m which deprlvahon and feeding were alternated at 2 (2 2) or 3 week (3 3) intervals (Table 2)
Thus, the ]mposlhon of restricted feeding, mvolwng alternating periods of deprivation and food supply from May until October, did not appear to lead to the mduchon of a compensatory growth response m cod Consequently, there would not appear to be any

86 M Joblmg et al
advantage to be gained in terms of either growth performance or improved food utlhzatlon efficiency by imposing food restriction regimes of this type under commercial farming conditions
The results of this study with cod appear to differ from the findings reported for a range of fish (Bllton and Robins, 1973, Dobson and Holmes, 1984, Russell and Wootton, 1992, Wleser et al , 1992) and homeotherms (Wilson and Osbourn, 1960, Plavnlk and Hurwltz, 1985, Jones and Farrell, 1992a), in which the imposition of feed restriction for periods ranging between a few days and 2-3 weeks has been shown to be sufficient to reduce a compensatory growth response Most studies have, however, been carried out on the young, rapidly growing stages of fish and domestic animals in which a restriction of food supply of short duration may impose the 'nutritional stress' required to induce a compensatory growth response
The results for cod are similar to those recently reported for Arctic charr, Saivehnus alptnus, In which deprivation periods of up to 3 weeks in duration were insufficient to induce compensatory growth (Jobhng et al , 1993) In this latter study, the Arctic charr were returned to adequate feeding conditions following 6 months on cycles of restricted feeding This return to adequate feeding gave rise to a compensatory growth response, with the degree of compensation being directly related to the severity of the food restriction previously Imposed (Jobhng et al , 1993) Thus, larger animals may require longer periods of deprivation or feeding restriction than do small before the 'nutritional stress' becomes sufficiently severe to induce a compensatory growth response
Results of previous studies with Atlantic cod have been interpreted as indicating that there was a compensatory growth response, but the findings stem from studies in which the fish were either sublected to food deprivation for a prolonged period, or were in poor condition at the start of the experiment (Black and Love, 1986, Pedersen and Jobhng, 1989, Jobhng et al , 1991) The results obtained in experiments 2 and 3 confirm that cod display a compensatory growth response following exposure to severe feeding restriction The findings also provide evidence that there may be a complete recovery of body weight (Figs 1 and 4) In other words, the cod can be said to have displayed a complete, rather than a partial, compensatory growth response
Partial compensation occurs when animals display more rapid rates of weight gain than do controls following the removal of feed restriction, but do not manage to fully restore body weight to the same levels as the control individuals A partial compensation is the response most often recorded in both domestic animals (Wilson and Osbourn, 1960, O'Donovan, 1984) and fish (Weatherley and Gill, 1981, 1987, Mlglavs and Jobhng, 1989, Jobhng et al , 1993), although complete compensation has previously been recorded in some studies carried out on fish (Bllton and Robins, 1973, Dobson and Holmes, 1984, Qulnton and Blake, 1990)
To what extent animals show complete or partial recovery following the return from restricted to ad llbitum feeding seems to depend upon the age at which the restriction is applied, and upon the severity and duration of restricted feeding (Plavnlk and Hurwltz, 1985, Summers et al , 1990, Yu et al , 1990, Leeson et al , 1991, Jones and Farrell, 1992a,b) Whilst it seems clear that the interaction between the duration and severity of the feed restriction period is of critical importance to the success of food-restriction regimes in allowing recovery of body weight, the composition of the diet provided during the re- ahmentatlon phase may also influence the response (Kyriazakls and Emmans, 1991)
Jobhng et al (1991) suggested that high-energy, lipid-rich, diets might promote more

Compensatory growth m cod 87
rapid rates of weight gain during the period of compensatory growth than diets having a lower energy and higher protein content Results from the present study (experiment 2) failed to confirm this (Fig 1), possibly because the high- and low-energy diets used were Insufficiently disparate in composition (Table 1) to induce marked differences in growth responses Nevertheless, the feeding of these diets for a prolonged period did lead to differences between treatment groups, with cod fed the high-energy diet tending to have larger livers by the end of the experiment (Fig 3) Because the liver is the main hpld storage organ in the cod (Jobhng, 1988, Jobhng et al, 1991) It can be assumed that lipid deposition was greater in the cod fed the high-energy diet than in those fed the low- energy diet
These findings seem to be consistent with the idea that, when animals are provided with diets of fixed protein energy ratios, food intake is adlusted in an attempt to regulate the rate of protein growth, whereas fat deposition is permitted to vary (Webster, 1993) In other words, animals may consume energy to excess, such that protein growth is regulated through the control of food intake, whereas fat deposition is much less strictly regulated There is, however, evidence that rates of fat deposition are regulated to some extent, because negative correlations have been reported to exist between the size of body energy reserves (hpld depots), appetite and food consumption (Forbes, 1992, Metcalfe and Thorpe, 1992, Jobhng and Miglavs, 1993)
It has often been reported that the compensatory growth response is accompanied by increased appetite (Wilson and Osbourn, 1960, O'Donovan, 1984, Mlglavs and Jobhng, 1989) It is possible that the increased food intake, or hyperphagla, that occurs during compensatory growth is attributable to differences in body composition (Metcalfe and Thorpe, 1992, Jobhng and Mlglavs, 1993) in that the animals may 'sense' that they are insufficiently fat or that muscle development does not conform to the 'genotyplc norm' (Webster, 1993)
Implicit in this theory is the expectation that both the composition, and rates of accretion, of tissues differ between animals displaying compensatory and normal body growth, with protein deposition tending to be given priority (KyrlazaklS and Emmans, 1991, Webster, 1993) Studies conducted on domestic animals provide evidence that the composition of the weight gain differs between animals that are undergoing compensa- tory growth and those that are growing normally, the former often tending to deposit greater proportions of the gain as lean body mass (Greeff et al, 1986a, Yu et al, 1990, Marals et al, 1991, Stamatans et al, 1991, Jones and Farrell, 1992b) The same appears to be true for the cod, because the relative size of the swimming muscle (fillet) increased rapidly during the course of compensatory growth (experiment 2), and muscle growth is given priority over the accumulation of liver energy stores in cod that are recovering from a period of undernutrltlOn (Black and Love, 1986)
The preferential accretion of lean body mass during compensatory growth has clear lmphcatlons for food utlhzatlon efficiency animals that are accumulating lean body mass would be expected to display better feed gain ratios than those depositing greater amounts of body fat Indeed, improved gross food utilization is an aspect frequently highlighted In studies of compensatory growth, and is often used to argue in favour of the exploitation of the response In the production of fish and domestic animals (Wilson and Osbourn, 1960, Dobson and Holmes, 1984, O'Donovan, 1984, Klndschl, 1988, Qulnton and Blake, 1990, Marals et al, 1991) In the current work with cod there were clear trends towards feed gain ratios being better in the fish undergoing compensatory growth than

88 M Jobllng et al
in those growing normally (experiments 2 and 3), but it must be stressed that such an improvement does not necessardy imply that fish undergoing compensatory growth are more energetically efficient than those growing normally In other words, the observed differences in feed gain ratios may have been related to differences in the composition of tissue gain between groups
Whilst final body sizes and yields of saleable product were not substantially different between groups of cod that had undergone a period of compensatory growth and those that had experienced normal growth conditions, some small, but slgmficant, differences were noted Final dressout weights of the cod that had undergone a period of 'nutritional stress' tended to be slightly lower than those of fish that had not experienced deprivation (Figs 2 and 5) These differences in dressout appeared to be related to differences In the gonad size (Fig 6) in other words, gonadosomatlc indices tended to be larger in cod, especially the males, that had experienced 'nutritional stress' Whilst increased investment in reproduct ion by fish sublected to poor feeding conditions has been found in some studies, other data tend to be equivocal, and there is a lack of consensus (Rubensteln, 1981, Weeks and Quattro, 1991, Jennlngs and Phlhpp, 1992, Hlndar and Jonsson, 1993, Weeks, 1993)
CONCLUSIONS
1 Cod display a compensatory growth response, which is seen as a rapid and complete recovery of body weight when the fish are provided with adequate food supplies following a period of undernutrltlOn
2 Compensatory growth is accompanied by efficient food utilization and only minor shifts in tmsue accret ion compared with those seen in cod showing normal growth patterns
3 These observations suggest that the ability of cod to show a compensatory growth response may be exploited commercially under conditions where farming is based upon the on-growing of wild-caught fish that are in poor condition at the time of capture
ACKNOWLEDGEMENT
This work forms part of the Myre project supported by the Norwegian Fisheries Research Council
REFERENCES
Belda, A J, Phelan, B.A and Studholme, A L (1992) The effect of dissolved oxygen on the growth of young-of-the-year winter flounder, Pseudopleuronectes amencanus Environmental Btology of Ftshes 34, 321-27
Bllton, H T and Robins, G L (1973) The effects of starvahon and subsequent feeding on survival and growth of Fulton channel sockeye salmon fry (Oncorhynchus nerka) Journal of the Fisheries Research Board of Canada 30, 1-5
Black, D and Love, R M (1986) The sequential mobilization and restoration of energy reserves in tissues of Atlantic cod during starvahon and refeedlng Journal of Comparatwe Phystology 156B, 469--479

Compensatory growth In cod 89
Dobson, S H and Holmes, R M (1984) Compensatory growth in the rainbow trout, Salmo gatrdnerl Richardson Journal of Ftsh Biology 25, 649-656
Forbes, JaM (1992) Metabolic aspects of satiety Proceedings of the Nutntton Society 51, 13-19 Greeff, JC, Meissner, HH, Roux, CZ and Janse Van Rensburg, RJ (1986a) The effect of
compensatory growth of body composition in sheep South Afrtcan Journal of Ammal Science 16, 155-161
Greeff, J C, Melssner, H H, Roux, C Z and Janse Van Rensburg, RA (1986b) The effect of compensatory growth on feed intake, growth rate and efficiency of feed utilization in sheep South African Journal of Animal Science 16, 162-168
Hlndar, K and Jonsson, B (1993) Ecological polymorphism in Arctic charr Biological Journal of the Lmnean Society 48, 63-74
Jennlngs, M J and Phlhpp, D P (1992) Reproductive investment and somatic growth rates in longear sunfish Environmental Biology of Fishes 35,257-271
Jobhng, M (1988) A review of the physiological and nutritional energehcs of cod, Gadus morhua L, with parhcular reference to growth under farmed conditions Aquaculture 70, 1-19
Jobhng, M and Miglavs, I (1993) The size of lipid depots - a factor contributing to the control of food intake in Arctic chart, Salvehnus alpmus Journal ofFish Biology 43,487-489
Jobhng, M and Pedersen, T (in press) Cultivation of the Atlantic cod In World Animal Sctences, Aquatic Ammal Production -Ftshes (eds C E Nash and A.J Novotny) Elsevier Science Amsterdam
Jobhng, M, Jorgensen, E H and Snkavuoplo, S 1 (1993) The Influence of previous feeding regime on the compensatory growth response of maturing and immature Arctic charr, Salvelmus alpmus Journal ofFish Biology 43,409-419
Jobhng, M, Knudsen, R, Pedersen, P S and dos Santos, J (1991) Effects of dietary composition and energy content on the nutritional energetics of cod, Gadus morhua Aquaculture 82,243-257
Jones, G P D and Farrell, D J (1992a) Early-life food restriction of broiler chickens 1 Methods of application, amino aod supplementation and the age at which restrictions should commence British Poultry Sctence 33,579-587
Jones, G P D and Farreil, D J (1992b) Early-life food restriction of broiler chickens Ii Effects of food restrictions on the development of fat tissue Bnnsh Poultry Science 33, 589-601
Kindschl, GA (1988) Effect of intermittent feeding on growth of rainbow trout, Salmo galrdnert Richardson Aquaculture and Fisheries Management 19,213-215
Kyriazakls, l and Emmans, G C (1991) Diet selection in pigs dietary choices made by pigs following a period of underfeeding with protein Animal Producnon 38,337-346
Leeson, S, Summers, J D and Caston, LJ (1991) Diet dilution and compensatory growth in broilers Poultry Science 70, 867473
Marais, P G, Van Der Merwe, H J and Dutolt, J E J (1991) The effect of compensatory growth on food intake, growth rate, body composition and effioency of feed utilization in Dorper sheep South Afrtcan Journal of Ammal Science 21, 80-88
Metcalfe, N B and Thorpe, J E (1992) Anorexia and defended energy levels in over-wintering ]uvenlle salmon Journal of Ammal Ecology 61,175-181
Mlglavs, I and Jobhng, M (1989) Effects of feeding regime on food consumption, growth rates and tissue nucleic acids in luvemle Arctic charr, Salvehnus alpmus, with particular respect to compensatory growth Journal ofFish Btology 34, 947-957
O'Donovan, P B (1984) Compensatory gain m cattle and sheep Nutntton Abstracts and Reviews 54B, 389-410
Osborne, D R and Voogt, P (1978) The analysis of Nutrients in Foods Academic Press London, p 251
Pedersen, T and Jobhng, M (1989) Growth rates of large, sexually mature cod, Gadus morhua, in relation to condition and temperature during an annual cycle Aquaculture 81,161-168
Plavnlk, I and Hurwitz, S (1985) The performance of broiler chicks durmg and following a severe food restrichon at an early age Poultry Saence 64,348-355

90 M Jobhng et al
Qumton, J C and Blake, R W (1990) The effect of feed cychng and rahon level on the compensatory growth response in rainbow trout, Oncorhynchus myktss Journal of Ftsh Biology 37, 33--41
Rubenstem, D I (1981) Individual varlahon and competition m the Everglades pygmy sunfish Journal of Ammal Ecology 50, 337-350
Russell, N R and Wootton, RJ (1992)Appetite and growth compensation m the European minnow, Phoxmus phoxmus (Cypnmdae), following short periods of food restnchon Envlronrnental Btology of Ftshes 34, 277-285
Stamatarm, C, Kynazakm, I and Emmans, G C (1991) The performance and body composition of young pigs following a period of growth retardation by food restnchon Amrnal Production 53, 373-381
Summers, J D, Spratt, D and Atkmson, J L (1990) Restricted feeding and compensatory growth for broilers Poultry Science 69, 1855-1861
Weatherley, A H and Gill, H S (1981) Recovery growth following periods of restricted rahons and starvation m rainbow trout, Salmo ga:rdnen Richardson Journal ofFtsh Btology 18, 195-208
Weatherley, A H and Gill, H~S (1987) The Btology of F:sh Growth Academic Press London, p 443 Webster, AJ F (1993) Energy partitioning, hssue growth and appetite control Proceedings of the
Nutrition Society 52, 69-76 Weeks, S C (1993) Phenotyplc plasticity of hfe-hmtory trmts m clonal and sexual fish (Poecdlopsls)
at high and low densities Oecologta 93,307-314 Weeks, S C and Quattro, JJM (1991) Life-hmtory plasticity under resource stress m a clonal fish
(Poecflndae Poeahopsts) Journal of Ftsh Biology 39, 485--494 Wleser, W, Krumschnabel, G and Olwang-Okwor, J P (1992) The energetlcs of starvation and
growth after re-feeding in ]uvemles of three cypnmd species Enwronmental Biology of Fishes 33, 63-71
Wilson, P N and Osbourn, D F (1960) Compensatory growth after undernutntmon m mammals and birds Biologtcal Rewews 37, 324-363
Yu, M W, Robinson, F E, Clandmm, M T and Bodnar, L (1990) Growth and body composition of broiler chickens m response to different regimes of feed restnchon Poultry Science 69, 2074- 2081