Transarterial (chemo)embolisation for unresectable hepatocellular carcinoma
Upload
independentCategory
view
1download
0
PROCEEDINGS Open Access
Application of microRNA and mRNA expressionprofiling on prognostic biomarker discovery forhepatocellular carcinomaLin Wei1,2, Baofeng Lian3,4, Yuannv Zhang2, Wei Li3, Jianren Gu2, Xianghuo He2*, Lu Xie3*
From The Twelfth Asia Pacific Bioinformatics Conference (APBC 2014)Shanghai, China. 17-19 January 2014
Abstract
Background: Hepatocellular carcinoma (HCC) is one of the most highly malignant and lethal cancers of the world.Its pathogenesis has been reported to be multi-factorial, and the molecular carcinogenesis of HCC can not beattributed to just a few individual genes. Based on the microRNA and mRNA expression profiling of normal livertissues, pericancerous hepatocellular tissues and hepatocellular carcinoma tissues, we attempted to find prognosisrelated gene sets for HCC patients.
Results: We identified differentially expressed genes (DEG) from three comparisons: Cancer/Normal, Cancer/Pericancerous and Pericancerous/Normal. GSEA (gene set enrichment analysis) were performed. Based on theenriched gene sets of GO terms, pathways and transcription factor targets, it was found that the genome instabilityand cell proliferation increased while the metabolism and differentiation decreased in HCC tissues. The expressionprofile of DEGs in each enriched gene set was used to correlate to the postoperative survival time of HCC patients.Nine gene sets were found to prognostic correlation. Furthermore, after substituting DEG-targeting-microRNA forDEG members of each gene set, two gene sets with the microRNA expression profiles were obtained that hadprognostic potential.
Conclusions: The malignancy of HCC could be represented by gene sets, and pericancerous liver exhibitsimportant characteristics of liver cancer. The expression level of gene sets not only in HCC but also in thepericancerous liver showed potential for prognosis implying an option for HCC prognosis at an early stage.Additionally, the gene-targeting-microRNA expression profiles also showed prognostic potential, demonstratingthat the multi-factorial molecular pathogenesis of HCC is contributed by various genes and microRNAs.
BackgroundHepatocellular carcinoma (HCC), is the sixth most preva-lent cancer and the third most frequent cause of cancer-related death [1]. More than 50% of the world’s HCCcases occur in China (age-standardized incidence rate:men, 35.2/100 000; women, 13.3/100 000) [2]. The patho-genesis of HCC has been reported to be multi-factorial
[3,4]. Liver cirrhosis is the most important risk factor forHCC [1], which occurs in 80%-90% of HCC patients [5].In China, chronic hepatitis B virus (HBV) infection isanother major risk factor [6], which occurs in approxi-mately 85% of HCC patients [7]. Additionally, the greatmajority of HBV-infected HCC patients (70% and 90%)have coexisting cirrhosis [2].The complex process of molecular pathogenesis in HCC
also indicates that it is caused by multiple types of genesduring its development and progression. For years, thecombination of microarray and bioinformatics analyticaltools have been widely used to find differentially expressedgenes in hepatocellular carcinoma and to find differential
* Correspondence: [email protected]; [email protected] Key Laboratory of Oncogenes and Related Genes, Shanghai CancerInstitute, Renji Hospital, Shanghai Jiao Tong University School of Medicine,Shanghai 200032, P. R. China3Shanghai Center for Bioinformation Technology, Shanghai Academy ofScience and Technology, Shanghai 201203, P. R. ChinaFull list of author information is available at the end of the article
Wei et al. BMC Genomics 2014, 15(Suppl 1):S13http://www.biomedcentral.com/1471-2164/15/S1/S13
© 2014 Wei et al.; licensee BioMed Central Ltd. This is an Open Access article distributed under the terms of the Creative CommonsAttribution License (http://creativecommons.org/licenses/by/2.0), which permits unrestricted use, distribution, and reproduction inany medium, provided the original work is properly cited. The Creative Commons Public Domain Dedication waiver (http://creativecommons.org/publicdomain/zero/1.0/) applies to the data made available in this article, unless otherwise stated.

diagnostic and prognostic markers [8-15]. Many suchstudies have used pericancerous liver tissue (assumed tobe normal) as the control when selecting differentiallychanged genes in HCC [8-13]. However, because mostpericancerous tissue of HCC is cirrhotic, this assumptioncould miss important basal molecular changes in the can-cer microenvironment. Scientists also attempted to lookfor differentially expressed genes for prognosis in cirrhosis[15] and non-cancerous liver tissues [14]. As we and otherresearchers have discovered, dynamic dysregulation existsin the development from cirrhosis to HCC [16], and differ-entially expressed microRNA in peri-cancer has been usedfor the prognosis of HCC patients [17].The low survival rate of HCC patients is largely attribu-
ted to the high metastasis rate of HCC. Early studiesshowed that molecular changes in primary HCC tissuealready implied future distant metastasis potential [13].Additionally, the metastases were reported to be influ-enced by liver microenvironment that can be representedby inflammation/immune response-related signatures ofdifferentially expressed genes [14]. It would be very inter-esting to know what kind of molecular changes in thepericancerous tissue of HCC also bear a prediction poten-tial for survival.In this work, by applying gene expression profiling in
hepatocellular carcinoma and pericancerous hepatocellulartissues from HCC patients and in normal liver tissuesfrom healthy individuals, we made an effort to investigatethe functional transition in pericancerous liver and cancerliver in HCC patients. We identified expression-changedgenes in pericancerous liver and HCC tissue. Then,we conducted functional enrichment analyses to demon-strate the mechanism causing these transitional molecularchanges. Additionally, we checked the relationshipbetween the expression level of differentially expressedmembers of each gene set and the postoperative survivaltime of HCC patients. We found nine gene sets to bepotential prognostic markers. Furthermore, according tothe targeting relationships between genes and microRNAs,we also substituted microRNAs for the gene members ofeach gene set, and we attempted to predict the prognosiswith the expression level of the microRNAs that target dif-ferentially expressed members of gene sets. Two prog-nosis-related microRNA sets were identified.
MethodsEthics statementAll human materials were obtained according to consentregulation and approved by the Ethical Review Committeeof the World Health Organization Collaborating Centerfor Human Products Research (authorized by ShanghaiMunicipal Government). The individuals in this manu-script have given written informed consent to publishthese case details.
Expression profile of mRNA and microRNAThe expression profiling of mRNA and microRNA wereperformed on three types of liver tissues: HCC, pericancer-ous liver and normal liver. Forty-five pairs of homogenoushuman primary hepatocellular carcinoma and adjacentpericancerous liver tissues were collected from the surgicalspecimen archives of the Department of Pathology, FirstAffiliated Hospital of Zhejiang University (Hangzhou City,Zhejiang Province, China) and Qidong Liver Cancer Insti-tute (Qidong City, Jiangsu Province, China). The perican-cerous liver tissues were collected three centimeters awayfrom any liver tumor. Phenotypic information was col-lected from patients’ records (Additional file 1). And noneof the HCC patients had received chemotherapy prior tosurgical operation. Ten normal liver tissues were obtainedfrom persons who died in traffic accidents. All of these tis-sues were freshly frozen at -80°C and confirmed by apathologist. In each tissue, the total RNA was extracted byTRIzol reagent (Invitrogen, CA, USA); the gene expressionwas profiled by CapitalBio Human 22k oligonucleotidemicroarray ([GEO:GPL5918]); and the microRNA expres-sion was profiled by CapitalBio Mammalian miRNA ArrayServices V1.0 ([GEO:GPL6542]). The expression profilingby array is deposited in Gene Expression Omnibus (GEO)[18] with the accession numbers [GEO:GSE45114](mRNA) and [GEO:GSE10694] (microRNA) [17].
Differentially expressed genesDifferentially expressed genes (DEG) involved in threecomparisons (Cancer/Normal, Cancer/Pericancerous andPericancerous/Normal) were detected by the limma[19,20] package in Bioconductor [21] with absolute log2-fold-change > 2 and adjusted p-value < 0.001, which wasadjusted by Benjamini and Hochberg’s method (BH) [22].These three groups of DEGs (C/N_all, C/P_all andP/N_all) were further separated into smaller groups, up-regulated DEGs and down-regulated DEGs: C/N_up andC/N_down; C/P_up and C/P_down; and P/N_up andP/N_down.
Gene set enrichment analysisGene set enrichment analysis for each group of DEGs wasperformed by the HTSanalyzeR [23] package in Bioconduc-tor with the collection of annotated gene sets provided bythe Molecular Signatures Database [24] (MSigDB v4.0,released Jun 7, 2013, including 10295 records). The MSigDBcollects various types of gene set, including seven major col-lections: c1, chromosome and cytogenetic band; c2, onlinepathway database, publications in PubMed, and knowledgeof domain experts, its CP sub-collection collected 1320Canonical pathways derived from the pathway databases ofBioCarta [25], KEGG [26], PID [27], Reactome [28] andfour others (SigmaAldrich [29], Signaling Gateway [30], Sig-nal Transduction KE [31], SuperArray [32]); c3, conserved
Wei et al. BMC Genomics 2014, 15(Suppl 1):S13http://www.biomedcentral.com/1471-2164/15/S1/S13
Page 2 of 13

cis-regulatory motifs, its TFT sub-collection collected 615gene sets that contain genes sharing a transcription factorbinding site defined in the TRANSFAC (version 7.4) data-base; c4, computational gene sets defined by mining largecollections of cancer-oriented microarray data; c5, geneontology, collected 1454 gene sets derived from the con-trolled vocabulary of the Gene Ontology (GO) project [33];c6, oncogenic signatures; and c7, immunologic signatures.Only when the BH-adjusted p-values from a hypergeo-metric test and Gene Set Enrichment Analysis (GSEA) [24]were both lower than 0.05 was the gene set thought to besignificantly enriched with this group of DEGs.
MicroRNAs that target differentially expressed genesBy the RmiR [34] package in Bioconductor, we obtainedthe targeting relationships between microRNAs and genesthat appear in at least three microRNA target databasesfrom six: miRBase [35], TargetScan [36], miRanda [37],tarBase [38], mirTarget2 [39] and PicTar [40]. Then, weobtained the set of microRNAs that target differentiallyexpressed genes in each gene set.
Association between gene (or microRNA) expressionprofile and postoperative survival timeWe used either the DEGs in each enriched gene set or themicroRNAs that target DEGs in each enriched gene set tocomprise a candidate classifier for prognosis. The associa-tions between gene (or microRNA) expression and post-operative survival time were tested by the phenoTest [41]package in Bioconductor. The effects of the gene expres-sion (or microRNA expression) on survival were tested viathe Cox proportional hazards model [42] and Kaplan-Meier estimator [43]. Additionally, these associations werevalidated on two independent data sets: [GEO:GSE14520][44,45] (including gene expression profiles of 227 pairs ofcancer and pericancerous liver samples, as well as 2 nor-mal liver samples), and the liver hepatocellular carcinomatumor type from The Cancer Genome Atlas [46] (TCGALIHC) (including gene and microRNA expression profiledwith RNASeq from 27 pairs of cancer and pericancerousliver tissues). The phenotypic information of 227 patientsfrom [GEO:GSE14520] and 27 patients from TCGA LIHCare provided in Additional file 1.
ResultsDifferentially expressed genesWith the threshold of absolute log2-fold-change > 2 andadjusted p-value < 0.001, totally 551 differentially expressedgenes (DEG) were identified from three comparisons,Cancer/Normal (C/N, 479 DEGs), Cancer/Pericancerous(C/P, 234 DEGs) and Pericancerous/Normal (P/N, 76DEGs) (Additional file 2). And subgroups of DEGs fromeach comparison were selected with up or down regulationof DEGs (Figure 1). In Figure 1, sum of the “up_regulated
DEGs” (322) and “down-regulated DEGs” (233) are morethan “all DEGs” (555 vs. 551), because some genes wereup-regulated in one comparison but down-regulated inanother, such as EGR1 listed in Figure 1D, and theyappeared in both Figure 1B and 1C.Among the 551 DEGs, six genes were differentiallyexpressed in all three comparisons (Figure 1). FromFigure 1D, DKK1, GABRE, HKDC1 and LRRC1 were up-regulated in pericancerous liver and more up-regulatedin cancer liver. The DKK1 is a Wnt pathway inhibitor,promoting invasion and metastasis of HCC [47], and aserum biomarker for HCC diagnosis [48]. Although theother three DEGs have not been reported in HCC, theyare disease related. GABRE is related to migraine suscept-ibility [49]. HKDC1 is related to Alzheimer disease [50].And LRRC1 is DNA repair related [51]. We think theymay be important in HCC carcinogenesis. On the con-trary, KCNN2 was down-regulated in pericancerous andmore down-regulated in cancer liver. Since KCNN2 isimportant for mediating the increase of transepithelialsecretion in biliary epithelial cells and prominentlyexpressed in intact liver [52], it seems some function ofnormal liver was gradually suppressed in pericancerousand cancer liver. And EGR1 was more up-regulated inpericancerous liver but less up-regulated in cancer liver.Considering that EGR1 is required for differentiationand mitogenesis [53], the cell proliferation might be up-regulated in both HCC and pericancerous liver, whiledifferentiation might be kept in pericancerous liver butsuppressed in HCC.
Gene sets enriched with differentially expressed genesGene set enrichment analysis was performed to identifyDEG-related functional gene sets. For each subgroup ofDEGs in Figure 1, the gene set enrichment analysis (byhypergeometric test and GSEA) was run on 10295 anno-tated gene sets in MSigDB v4.0, and a small part of themwere enriched with the nine subgroups of DEGs (see thenine circles in Figure 1 A, B and C). The intersections ofgene sets enriched with different groups of DEGs werecounted in a Venn diagram (Additional file 3). Most genesets were enriched with both C/N DEGs and C/P DEGs.Especially, the gene sets enriched with both C/N_up DEGsand C/P_up DEGs (or both C/N_down DEGs andC/P_down DEGs) showed the characters present in peri-cancerous liver but more dys-regulated in HCC. Thus theywould provide us some clues about the gradual carcino-genesis of liver tissue.We further focused on detailed functional analyses of
gene sets enriched in three categories of MsigDB v4.0 col-lection: c5, Gene Ontology (GO) sets; c2, Canonical path-way sets; and c3, transcription factor targets gene sets(TFT). There are 19 GO terms enriched with bothC/N_up and C/P_up DEGs (Additional file 4, 5), including
Wei et al. BMC Genomics 2014, 15(Suppl 1):S13http://www.biomedcentral.com/1471-2164/15/S1/S13
Page 3 of 13

biological process (BP) related to “cell cycle” and “mitosis”,as well as cellular component (CC) related to “chromo-some” and “spindle”, showing us the character of cellproliferation that is closely related to carcinogenesis.Meanwhile, 21 GO terms were enriched with bothC/N_down and C/P_down DEGs (Additional file 4, 5),
including various “metabolism” related BP, CC and MF(molecular function), indicating that metabolisms weredisturbed in pericancerous liver and more so in HCC.Similarly, there are 24 pathways that were enriched with
both C/N_up and C/P_up DEGs (Additional file 4, 5).Keywords such as “Cell Cycle”, “G1”, “S”, “G2”, “M” and
Figure 1 Venn diagram of differently expressed genes (DEGs) from three comparisons. Venn diagram of differently expressed genes (DEGs)from three comparisons: Cancer/Normal (C/N), Pericancerous/Normal (P/N) and Cancer/Pericancerous (C/P). A. Venn diagram of all DEGs from threecomparisons. The purple number in the center showed the number of DEGs appeared in all three comparisons. B. Venn diagram of up-regulated DEGsfrom three comparisons. The red number in the center showed the number of DEGs appeared in all three comparisons. C. Venn diagram of down-regulated DEGs from three comparisons. The blue number in the center showed the number of DEGs appeared in all three comparisons. D. The log2-fold-change of DEGs in centers of subgraph A, B and C. The DEGs in red were appeared in the centers of subgraph A and B. The DEGs in blue wereappeared in the centers of subgraph A and C. The DEGs in purple was only appeared in the center of subgraph A.
Wei et al. BMC Genomics 2014, 15(Suppl 1):S13http://www.biomedcentral.com/1471-2164/15/S1/S13
Page 4 of 13

“Replication” indicate the genome instability and cell pro-liferation hallmark of cancer cells [54] being activated. The“p53” and “p73” related pathways indicate DNA damageand apoptosis found in tumorigenesis. At the same time,the ATR (ataxia telangiectasia and Rad3-related [55]) path-way, PLK1 (polo-like kinase 1 [56]) pathway and the Fan-coni anemia pathway showed the ability to repair DNAdamage in cancer cells. Thus, as a hallmark of HCC, cellproliferation is the result of rebalancing between activeapoptosis by DNA damage and active survival by DNAdamage repair. Twenty-one pathways were enriched withboth C/N_down and C/P_down DEGs (Additional file 4,5). The most repetitive keywords are “Metabolism” and“PID_HNF3BPATHWAY” (transcription factor networkof FOXA2 and FOXA3), hinting that the function of meta-bolism regulation and the potential for differentiationwere abnormal in HCC, because FOXA2 (forkhead box A2[57]) and FOXA3 (forkhead box A3 [58]) are hepatocytenuclear factors that act as transcriptional activators forliver-specific genes such as albumin and transthyretin.Similar results have been found in mice [59].Not only GO and pathway gene sets, but the transcrip-
tion factor targets gene sets (TFTs) also provided func-tional annotations for DEGs. We found 19 TFTs wereenriched with both C/N_up and C/P_up DEGs (Additionalfile 4, 5), with the cell cycle controlling transcription factorE2F family being the most conspicuous factor. And E2F3and E2F8 were over-expressed in HCC indeed (Additionalfile 2). At the same time, only one TFT “RGTTAMW-NATT_V$HNF1_01” was enriched with both C/N_downand C/P_down DEGs (Additional file 4, 5).From the gene ontology, pathway and transcription fac-
tor targets related gene sets enriched with both C/N DEGsand C/P DEGs, we found that during cancer progress ofHCC, cell proliferation was gradually up-regulated whilemetabolism was progressively down-regulated. It is rare toobserve such phenomena with direct proofs, the advantagestem from our gene expression profiling of gradually chan-ging samples: from normal, to pericancerous, to cancerousliver tissues.
Association between gene expression profile andpostoperative survival timeIt is understandable that transitional molecular changesrepresented by gene sets may demonstrate mechanistictrend of development from normal tissue to cancer tissue,however, whether such changes can be prognostic may beanother question.The DEGs in each enriched gene set might comprise a
candidate gene classifier for prognosis. We tested the asso-ciation between the expression of these candidate geneclassifiers and postoperative survival time in our data set,which was 45 HCC patients from [GEO:GSE45114]. Ninegene sets with the expression level of DEGs that associated
with the postoperative survival time in our dataset werealso validated in [GEO:GSE14520] (227 HCC patients)(Table 1). As shown in Table 1, Figure 2, 3 and Additionalfile 6, the expression profile of sets of DEGs in HCC, evenpericancerous liver could be used for prognosis.The first three gene sets in Table 1 showed prognosis
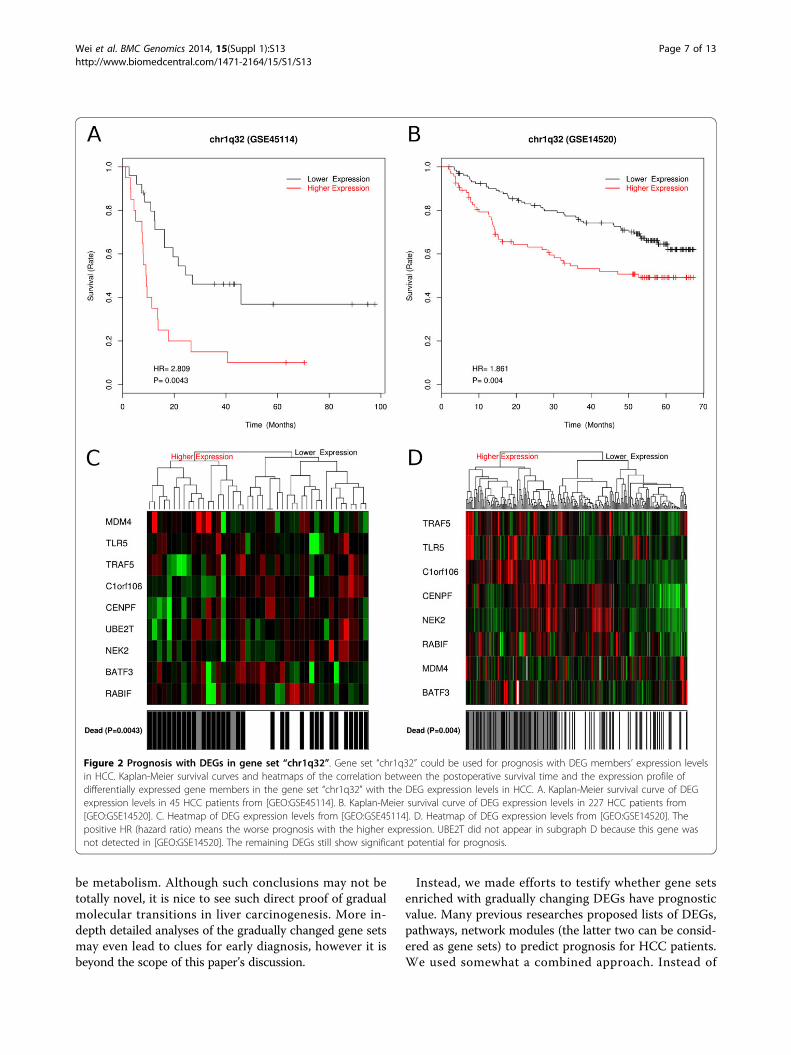
potential with up-regulated DEGs in cancer liver. TheirDEG members expression level in cancer could be usedfor prognosis in both our 45 HCC patients from [GEO:GSE45114] and the 227 HCC patients from [GEO:GSE14520] (P < 0.05 and HR > 0). The positive HR (hazardratio) means the higher DEGs expression the worse theprognosis. In Figure 2, we show the prognosis ability ofnine DEGs in gene set “chr1q32” which was reported to bethe most recurrently gained genomic region in HCC [60].Another gene set “KAUFFMANN_MELANOMA_RELAP-SE_UP” [61] contains DNA repair and replication relatedgenes (Additional file 6).The next three gene sets in Table 1 showed prognosis
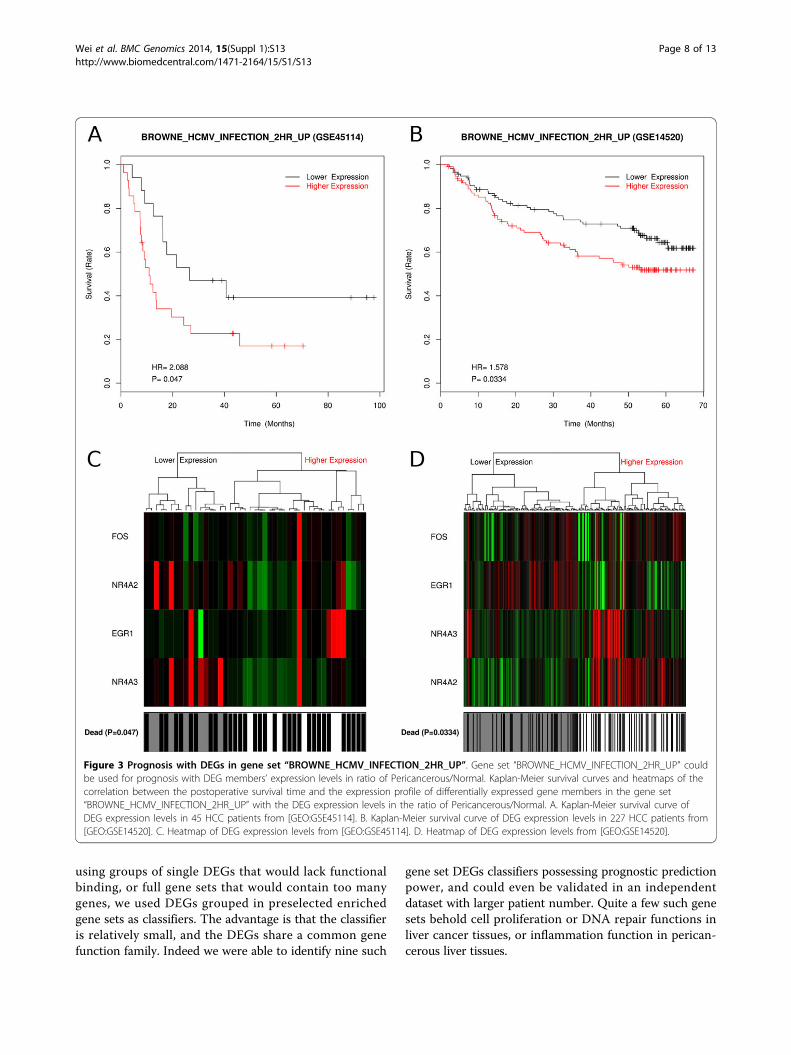
potential of pericancerous liver with up-regulated DEGs.Gene set “BROWNE_HCMV_INFECTION_2HR_UP”contains genes that were related to hepatic inflammationand cirrhosis [62]. Their expression level may representnot only inflammation and cirrhosis but also carcinogen-esis of HCC (Figure 3). And the gene set “ENK_UV_RE-SPONSE_EPIDERMIS_DN” [63] contains genes related toDNA damage repair (Additional file 6).Besides up-regulated DEGs, the down-regulated DEGs
in cancer liver also showed prognosis potential in the lastthree gene sets (Table 1 and Additional file 6). Here, nega-tive HR (hazard ratio) means the lower DEG expressionthe worse the prognosis.In summary, prognosis of HCC patients could be pre-
dicted with expression profiles of both up-regulated DEGsand down-regulated DEGs enriched in certain functionalgene sets.
Association between microRNA expression profile andpostoperative survival timeGene sets enriched with DEGs either in C/N, C/P or P/Nwere shown to have prognosis potential, as reportedabove. MicroRNA profiling data is also available for the45 HCC patients with paired pericancer/cancer samples.Since microRNA expression signatures in hepatocellularcarcinoma have been stated to possess prognostic valuebefore [17,64], we would like to see in our work, whetherDEGs related microRNA sets could be prognostic. Weidentified the targeting relationships between microRNAsand genes that appear in at least three microRNA targetdatabases from six: miRBase [35], TargetScan [36], miR-anda [37], tarBase [38], mirTarget2 [39] and PicTar [40].The microRNAs that target DEGs in each enriched geneset comprise a candidate microRNA set for prognosisprediction. Then we tested the association between the
Wei et al. BMC Genomics 2014, 15(Suppl 1):S13http://www.biomedcentral.com/1471-2164/15/S1/S13
Page 5 of 13

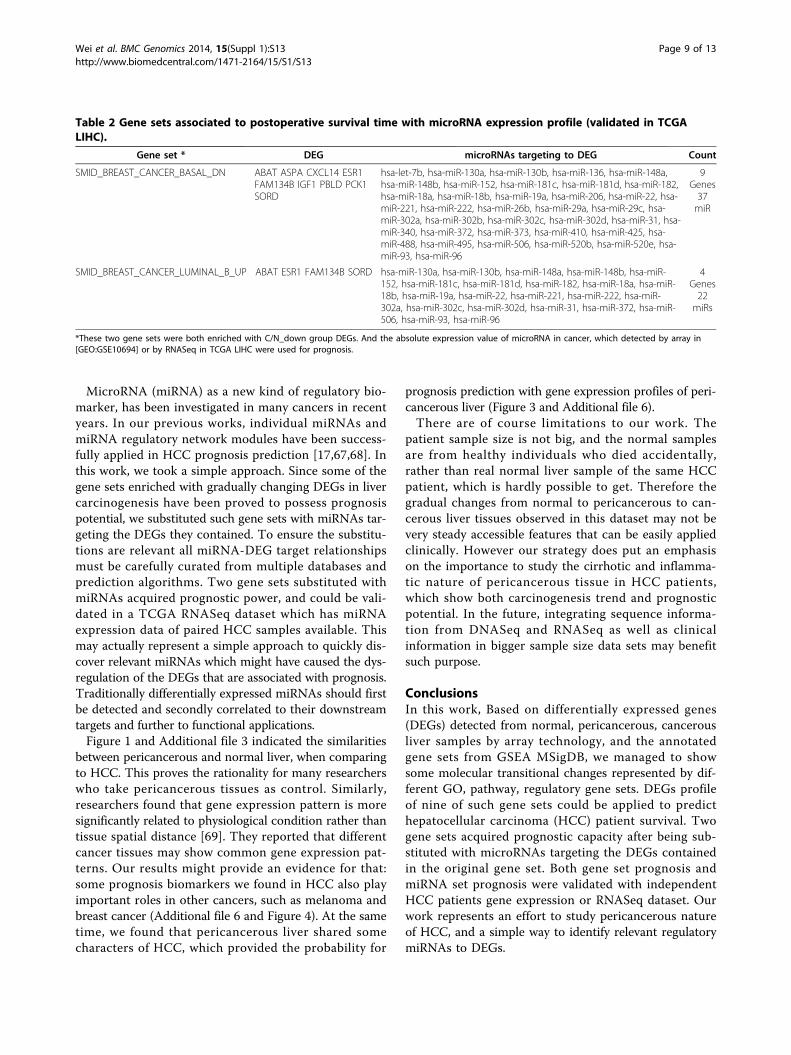
expression of these microRNAs and postoperative survi-val times in our 45 patients from [GEO:GSE10694]. Twoprognostic microRNA gene sets were validated in anindependent test dataset TCGA LIHC (27 HCC patientswith RNASeq data) (Table 2).Gene set “SMID_BREAST_CANCER_BASAL_DN”
contains genes that are down-regulated in basal subtypeof breast cancer samples [65]. We found that 32 membergenes were down-regulated in HCC relative to normalliver and nine of them were targeted by 37 microRNAs.The 37 microRNAs expression profile in cancer livercould be used for prognosis (Figure 4). The positive HR(hazard ratio) means the higher expression the worseprognosis.The other gene set “SMID_BREAST_CANCER_LUMI-
NAL_B_UP” contains genes that are up-regulated in theluminal B subtype of breast cancer [65]. Its 12 membergenes were down-regulated in HCC relative to normalliver and four of them were targeted by 22 microRNAs.The 22 microRNAs expression profile in the cancer livercould be used for prognosis (Additional file 6). Interest-ingly, the four DEGs are subset of the nine DEGs men-tioned in above gene set (Table 2), which shows thesimilarity and difference between basal subtype and lumi-nal subtype of breast cancers.Most of the microRNAs listed in Table 2 have been
annotated to be related to HCC in The human micro-RNA disease database (HMDD) [66] (Additional file 7).Such as the cell proliferation related microRNAs: hsa-mir-18a, hsa-mir-93, hsa-mir-96; and cancer recurrence
related microRNAs: hsa-mir-148a, hsa-mir-18a, hsa-mir-18b, hsa-mir-19a, hsa-mir-22, hsa-mir-221, hsa-mir-222,hsa-mir-96. In Table 2 there are some microRNAs havenot been recorded to be HCC related by HMDD,including: hsa-miR-136, hsa-miR-206, hsa-miR-26b, hsa-miR-302a, hsa-miR-302d, hsa-miR-340, hsa-miR-410,hsa-miR-488, hsa-miR-495, hsa-miR-506. They may bepotentially HCC related.
DiscussionThere have been numerous studies of hepatocellular carci-noma(HCC) in comparison with pericancerous tissue asnormal control, in the purpose of identifying differentiallyexpressed genes, modules, networks etc., in order to findcancer biomarkers, cluster samples, or to predict prog-nosis. Such studies especially on Chinese HCC patientsamples take on a strong assumption that pericancerousliver tissue of HCC is normal, while this in a large percen-tage is wrong. Most patients diagnosed with HCC inChina already went through years of liver cirrhotic changebecause of chronic HBV infection, alcoholism, or fattyliver etc. Therefore, in this work of ours, we designed a setof normal liver tissues as control. With such a design, wewere able to identify differentially expressed genes (DEGs)with a gradual up-regulation from normal to pericancer-ous to cancerous liver, or DEGs with a gradual down-regulation. Further gene set enrichment analysis (GSEA)on GO terms, pathway, and transcription factor targetssuggested the main up-regulated trend to be in cell cycleand proliferation, and the main down-regulated trend to
Table 1 Gene sets associated to postoperative survival time with DEG expression profile (validated in [GEO:GSE14520]).
Gene set Enrichedwith DEGgroup
DEGCount
DEG Profile*
chr1q32 C/N_up 9 BATF3, C1orf106, CENPF, MDM4, NEK2, RABIF, TLR5, TRAF5,UBE2T
C
KAUFFMANN_MELANOMA_RELAPSE_UP C/N_up 12 CENPF, CHEK1, CHEK2, FANCD2, GINS2, MCM6, MSH2,RAD54L, RFC4, RRM2, SMC2, TOP2A
C
PETROVA_PROX1_TARGETS_UP C/N_up &C/P_up
5 BUB1B, CCNE2, CDK1, MCM6, TOP2A C & C/P
BROWNE_HCMV_INFECTION_2HR_UP P/N_up 4 EGR1, FOS, NR4A2, NR4A3 P/N
ENK_UV_RESPONSE_EPIDERMIS_DN P/N_up 10 AREG, CH25H, EGR1, EGR2, FJX1, GSN, LXN, NR4A2, PTGS2,STK17B
P/N
GSE9988_LOW_LPS_VS_CTRL_TREATED_MONOCYTE_UP P/N_up 8 AREG, EGR1, IL6, NR4A2, NR4A3, PTGS2, RGS1, SERPINB8 P/N
MODULE_43 C/N_down 17 ACADL, ACADSB, CAT, CYP1A1, CYP26A1, CYP2C8, CYP3A4,CYP3A7, CYP4A11, DAO, ETFDH, FMO3, GYS2, LEPR,PPP1R1A, QDPR, TREH
C
MODULE_99 C/N_down 17 ABAT, AFM, BBOX1, BCHE, CRHBP, F11, FETUB, IGF1, LEPR,LIFR, MARCO, NAT2, OTC, PCK1, SLC10A1, SLC22A1, UGT8
C/N
PKCA_DN.V1_UP C/N_down 17 ADRA1A, BBOX1, CYP2C18, CYP2C8, DIO1, FBP1, LECT2,NR1I3, PCK1, PIPOX, PRODH2, RDH16, RDH5, SEC14L2,SLC2A2, TREH, UPB1
C
*"Profile": the expression profile used for prognosis; “C” means the absolute expression value of genes in cancer; while “C/P” and “P/N” mean the relative geneexpression level of cancer/pericancerous liver and pericancerous/normal liver respectively.
Wei et al. BMC Genomics 2014, 15(Suppl 1):S13http://www.biomedcentral.com/1471-2164/15/S1/S13
Page 6 of 13
be metabolism. Although such conclusions may not betotally novel, it is nice to see such direct proof of gradualmolecular transitions in liver carcinogenesis. More in-depth detailed analyses of the gradually changed gene setsmay even lead to clues for early diagnosis, however it isbeyond the scope of this paper’s discussion.
Instead, we made efforts to testify whether gene setsenriched with gradually changing DEGs have prognosticvalue. Many previous researches proposed lists of DEGs,pathways, network modules (the latter two can be consid-ered as gene sets) to predict prognosis for HCC patients.We used somewhat a combined approach. Instead of
Figure 2 Prognosis with DEGs in gene set “chr1q32”. Gene set “chr1q32” could be used for prognosis with DEG members’ expression levelsin HCC. Kaplan-Meier survival curves and heatmaps of the correlation between the postoperative survival time and the expression profile ofdifferentially expressed gene members in the gene set “chr1q32” with the DEG expression levels in HCC. A. Kaplan-Meier survival curve of DEGexpression levels in 45 HCC patients from [GEO:GSE45114]. B. Kaplan-Meier survival curve of DEG expression levels in 227 HCC patients from[GEO:GSE14520]. C. Heatmap of DEG expression levels from [GEO:GSE45114]. D. Heatmap of DEG expression levels from [GEO:GSE14520]. Thepositive HR (hazard ratio) means the worse prognosis with the higher expression. UBE2T did not appear in subgraph D because this gene wasnot detected in [GEO:GSE14520]. The remaining DEGs still show significant potential for prognosis.
Wei et al. BMC Genomics 2014, 15(Suppl 1):S13http://www.biomedcentral.com/1471-2164/15/S1/S13
Page 7 of 13
using groups of single DEGs that would lack functionalbinding, or full gene sets that would contain too manygenes, we used DEGs grouped in preselected enrichedgene sets as classifiers. The advantage is that the classifieris relatively small, and the DEGs share a common genefunction family. Indeed we were able to identify nine such
gene set DEGs classifiers possessing prognostic predictionpower, and could even be validated in an independentdataset with larger patient number. Quite a few such genesets behold cell proliferation or DNA repair functions inliver cancer tissues, or inflammation function in perican-cerous liver tissues.
Figure 3 Prognosis with DEGs in gene set “BROWNE_HCMV_INFECTION_2HR_UP”. Gene set “BROWNE_HCMV_INFECTION_2HR_UP” couldbe used for prognosis with DEG members’ expression levels in ratio of Pericancerous/Normal. Kaplan-Meier survival curves and heatmaps of thecorrelation between the postoperative survival time and the expression profile of differentially expressed gene members in the gene set“BROWNE_HCMV_INFECTION_2HR_UP” with the DEG expression levels in the ratio of Pericancerous/Normal. A. Kaplan-Meier survival curve ofDEG expression levels in 45 HCC patients from [GEO:GSE45114]. B. Kaplan-Meier survival curve of DEG expression levels in 227 HCC patients from[GEO:GSE14520]. C. Heatmap of DEG expression levels from [GEO:GSE45114]. D. Heatmap of DEG expression levels from [GEO:GSE14520].
Wei et al. BMC Genomics 2014, 15(Suppl 1):S13http://www.biomedcentral.com/1471-2164/15/S1/S13
Page 8 of 13
MicroRNA (miRNA) as a new kind of regulatory bio-marker, has been investigated in many cancers in recentyears. In our previous works, individual miRNAs andmiRNA regulatory network modules have been success-fully applied in HCC prognosis prediction [17,67,68]. Inthis work, we took a simple approach. Since some of thegene sets enriched with gradually changing DEGs in livercarcinogenesis have been proved to possess prognosispotential, we substituted such gene sets with miRNAs tar-geting the DEGs they contained. To ensure the substitu-tions are relevant all miRNA-DEG target relationshipsmust be carefully curated from multiple databases andprediction algorithms. Two gene sets substituted withmiRNAs acquired prognostic power, and could be vali-dated in a TCGA RNASeq dataset which has miRNAexpression data of paired HCC samples available. Thismay actually represent a simple approach to quickly dis-cover relevant miRNAs which might have caused the dys-regulation of the DEGs that are associated with prognosis.Traditionally differentially expressed miRNAs should firstbe detected and secondly correlated to their downstreamtargets and further to functional applications.Figure 1 and Additional file 3 indicated the similarities
between pericancerous and normal liver, when comparingto HCC. This proves the rationality for many researcherswho take pericancerous tissues as control. Similarly,researchers found that gene expression pattern is moresignificantly related to physiological condition rather thantissue spatial distance [69]. They reported that differentcancer tissues may show common gene expression pat-terns. Our results might provide an evidence for that:some prognosis biomarkers we found in HCC also playimportant roles in other cancers, such as melanoma andbreast cancer (Additional file 6 and Figure 4). At the sametime, we found that pericancerous liver shared somecharacters of HCC, which provided the probability for
prognosis prediction with gene expression profiles of peri-cancerous liver (Figure 3 and Additional file 6).There are of course limitations to our work. The
patient sample size is not big, and the normal samplesare from healthy individuals who died accidentally,rather than real normal liver sample of the same HCCpatient, which is hardly possible to get. Therefore thegradual changes from normal to pericancerous to can-cerous liver tissues observed in this dataset may not bevery steady accessible features that can be easily appliedclinically. However our strategy does put an emphasison the importance to study the cirrhotic and inflamma-tic nature of pericancerous tissue in HCC patients,which show both carcinogenesis trend and prognosticpotential. In the future, integrating sequence informa-tion from DNASeq and RNASeq as well as clinicalinformation in bigger sample size data sets may benefitsuch purpose.
ConclusionsIn this work, Based on differentially expressed genes(DEGs) detected from normal, pericancerous, cancerousliver samples by array technology, and the annotatedgene sets from GSEA MSigDB, we managed to showsome molecular transitional changes represented by dif-ferent GO, pathway, regulatory gene sets. DEGs profileof nine of such gene sets could be applied to predicthepatocellular carcinoma (HCC) patient survival. Twogene sets acquired prognostic capacity after being sub-stituted with microRNAs targeting the DEGs containedin the original gene set. Both gene set prognosis andmiRNA set prognosis were validated with independentHCC patients gene expression or RNASeq dataset. Ourwork represents an effort to study pericancerous natureof HCC, and a simple way to identify relevant regulatorymiRNAs to DEGs.
Table 2 Gene sets associated to postoperative survival time with microRNA expression profile (validated in TCGALIHC).
Gene set * DEG microRNAs targeting to DEG Count
SMID_BREAST_CANCER_BASAL_DN ABAT ASPA CXCL14 ESR1FAM134B IGF1 PBLD PCK1SORD
hsa-let-7b, hsa-miR-130a, hsa-miR-130b, hsa-miR-136, hsa-miR-148a,hsa-miR-148b, hsa-miR-152, hsa-miR-181c, hsa-miR-181d, hsa-miR-182,hsa-miR-18a, hsa-miR-18b, hsa-miR-19a, hsa-miR-206, hsa-miR-22, hsa-miR-221, hsa-miR-222, hsa-miR-26b, hsa-miR-29a, hsa-miR-29c, hsa-miR-302a, hsa-miR-302b, hsa-miR-302c, hsa-miR-302d, hsa-miR-31, hsa-miR-340, hsa-miR-372, hsa-miR-373, hsa-miR-410, hsa-miR-425, hsa-miR-488, hsa-miR-495, hsa-miR-506, hsa-miR-520b, hsa-miR-520e, hsa-miR-93, hsa-miR-96
9Genes37miR
SMID_BREAST_CANCER_LUMINAL_B_UP ABAT ESR1 FAM134B SORD hsa-miR-130a, hsa-miR-130b, hsa-miR-148a, hsa-miR-148b, hsa-miR-152, hsa-miR-181c, hsa-miR-181d, hsa-miR-182, hsa-miR-18a, hsa-miR-18b, hsa-miR-19a, hsa-miR-22, hsa-miR-221, hsa-miR-222, hsa-miR-302a, hsa-miR-302c, hsa-miR-302d, hsa-miR-31, hsa-miR-372, hsa-miR-506, hsa-miR-93, hsa-miR-96
4Genes22miRs
*These two gene sets were both enriched with C/N_down group DEGs. And the absolute expression value of microRNA in cancer, which detected by array in[GEO:GSE10694] or by RNASeq in TCGA LIHC were used for prognosis.
Wei et al. BMC Genomics 2014, 15(Suppl 1):S13http://www.biomedcentral.com/1471-2164/15/S1/S13
Page 9 of 13

Figure 4 Prognosis with DEG-members-targeting-microRNAs in gene set “SMID_BREAST_CANCER_BASAL_DN”. Gene set“SMID_BREAST_CANCER_BASAL_DN” could be used for prognosis with DEG-members-targeting-microRNA expression levels in HCC. Kaplan-Meiersurvival curves and heatmaps of the correlation between the postoperative survival time and the expression profile of microRNAs that targetdifferentially expressed gene members in the gene set “SMID_BREAST_CANCER_BASAL_DN”. A. Kaplan-Meier survival curve of DEG-targeting-microRNA expression levels in 45 HCC patients from [GEO:GSE10694]. B. Kaplan-Meier survival curve of DEG-targeting-microRNA expression levelsin 27 HCC patients from TCGA LIHC. C. Heatmap of DEG-targeting-microRNA expression levels from [GEO:GSE10694]. D. Heatmap of DEG-targeting-microRNA expression levels from TCGA LIHC.
Wei et al. BMC Genomics 2014, 15(Suppl 1):S13http://www.biomedcentral.com/1471-2164/15/S1/S13
Page 10 of 13

Additional material
Additional file 1: Tables, phenotypic data of HCC patients.Phenotypic data of: 45 patients from [GEO:GSE45114] and [GEO:GSE10694]; 227 patients from [GEO:GSE14520]; 27 patients from TCGALIHC.
Additional file 2: Tables, DEGs and gene sets enriched with DEGs.The 551 identified differentially expressed genes (DEGs) of threecomparisons: Cancer/Normal (C/N), Cancer/Pericancerous (C/P) andPericancerous/Normal (P/N). The value “NA” means that this gene (rowhead) is not a DEG in this comparison (column head). And the 868 nonrepetitive gene sets that enriched with the nine groups of DEGs (ninecircles in Figure 1) by both two enrich method (hypergeometric test andGSEA). The value “NA” means that this gene set (row head) is notenriched with this group of DEGs (column head).
Additional file 3: Figure, venn diagram of gene sets enriched withDEGs from three comparisons. Venn diagram of gene sets enrichedwith DEGs from three comparisons: Cancer/Normal (C/N), Pericancerous/Normal (P/N) and Cancer/Pericancerous (C/P). A. Venn diagram of genesets enriched with the all DEGs from three comparisons. B. Venn diagramof gene sets enriched with the up-regulated DEGs from threecomparisons. The red number showed the number of gene setsenriched with both C/N_up DEGs and C/P_up DEGs. C. Venn diagram ofgene sets enriched with the down-regulated DEGs from threecomparisons. The blue number showed the number of gene setsenriched with both C/N_down DEGs and C/P_down DEGs. D. Counts ofgene ontology, pathway and transcription factor targets gene setsenriched with both C/N DEGs and C/P DEGs. The numbers in red werecovered by red number in subgraph B. The numbers in blue werecovered by blue number in subgraph C.
Additional file 4: Figures, venn diagram of GOs, Pathways and TFTsenriched with DEGs from three comparisons. Venn diagram of genesets about gene ontology terms (GO), Pathways and Transcription factortargets (TFT) enriched with DEGs from three comparisons: Cancer/Normal(C/N), Pericancerous/Normal (P/N) and Cancer/Pericancerous (C/P). A.Venn diagram of gene sets enriched with the all DEGs from threecomparisons. B. Venn diagram of gene sets enriched with the up-regulated DEGs from three comparisons. The red number showed thenumber of gene sets enriched with both C/N_up DEGs and C/P_upDEGs. C. Venn diagram of gene sets enriched with the down-regulatedDEGs from three comparisons. The blue number showed the number ofgene sets enriched with both C/N_down DEGs and C/P_down DEGs.
Additional file 5: Tables, gene sets enriched with both C/N DEGsand C/P DEGs. Gene sets about Gene ontology terms (GOs), Pathwaysand Transcription factor targets gene sets (TFTs) enriched with both C/NDEGs and C/P DEGs.
Additional file 6: Figures, gene sets used for prognosis withexpression profile of DEG members. Kaplan-Meier survival curves andheatmaps of the correlation between the postoperative survival time andthe expression profile of DEG members in the gene set“KAUFFMANN_MELANOMA_RELAPSE_UP”,“PETROVA_PROX1_TARGETS_UP”, “ENK_UV_RESPONSE_EPIDERMIS_DN”,“GSE9988_LOW_LPS_VS_CTRL_TREATED_MONOCYTE_UP”, “MODULE_43”,“MODULE_99” and “PKCA_DN.V1_UP”. Each figure includs four subgraphs:A. Kaplan-Meier survival curve of DEG expression levels in 45 HCC patientsfrom [GEO:GSE45114]. B. Kaplan-Meier survival curve of DEG expressionlevels in 227 HCC patients from [GEO:GSE14520]. C. Heatmap of DEGexpression levels in 45 HCC patients from [GEO:GSE45114]. D. Heatmap ofDEG expression levels in 227 HCC patients from [GEO:GSE14520]. And theKaplan-Meier survival curves and heatmaps of the correlation between thepostoperative survival time and expression profile of DEG-targetingmicroRNAs in gene set “SMID_BREAST_CANCER_LUMINAL_B_UP” whichvalidated with 27 HCC patients from TCGA LIHC. Including four subgraphs:A. Kaplan-Meier survival curve of DEG expression levels in 45 HCC patientsfrom [GEO:GSE10694]. B. Kaplan-Meier survival curve of DEG expressionlevels in 27 HCC patients from TCGA LIHC. C. Heatmap of DEG expressionlevels in 45 HCC patients from [GEO:GSE10694]. D. Heatmap of DEGexpression levels in 27 HCC patients from TCGA LIHC. (Note: The positiveHR (hazard ratio) means the higher expression the worse prognosis. While
the negative HR (hazard ratio) means the lower expression the worseprognosis. Some genes may not appear in subgraph D, because thosegenes (or microRNAs) were not detected in [GEO:GSE14520] (or TCGALIHC). The remaining DEGs (or microRNAs) still show significant potentialfor prognosis.)
Additional file 7: Table, microRNAs annotation recorded by thehuman microRNA disease database (HMDD). Most microRNAs listed inTable 2 have been annotated by the human microRNA disease database(HMDD). The table list the 27 HCC related microRNAs with theirreferences and descriptions annotated by HMDD.
List of abbreviations usedHCC: Hepatocellular carcinoma; DEG: Differentially expressed genes; GSEA:Gene set enrichment analysis; GEO: Gene expression omnibus; MSigDB:Molecular signatures database; GO: Gene ontology; TCGA: The cancergenome atlas; LIHC: Liver hepatocellular carcinoma; C/N: Cancer/Normal; C/P:Cancer/Pericancerous; P/N: Pericancerous/Normal; TFT: Transcription factortargets; HR: Hazard ratio; HMDD: Human microRNA disease database.
Competing interestsThe authors declare that they have no competing interests.
Authors’ contributionsLW performed the analyses of this research and drafted the manuscript. BLparticipated in microRNA targeting, and revision of manuscript. YZparticipated in gene set enrichment analysis. WL participated in survivalanalysis. JG designed this work. XH participated in design and revision. LXparticipated in design and wrote part of the manuscript. All authors readand approved the final manuscript.
AcknowledgementsWritten consent was obtained from the patient or their relative forpublication for this study. This work was supported by grants from theNational 973 Key Basic Research Program (2013CB910500), the NationalNatural Science Foundation of China (81125016, 81071637, 91029728) andthe Key Infectious Disease Project [2012ZX10002012-014].
DeclarationsPublication of this article was funded by State Key Laboratory of Oncogenesand Related Genes, Shanghai Cancer Institute, Renji Hospital, Shanghai JiaoTong University School of Medicine.This article has been published as part of BMC Genomics Volume 15Supplement 1, 2014: Selected articles from the Twelfth Asia PacificBioinformatics Conference (APBC 2014): Genomics. The full contents of thesupplement are available online at http://www.biomedcentral.com/bmcgenomics/supplements/15/S1.
Authors’ details1Shanghai Medical College, Fudan University, Shanghai 200032, P. R. China.2State Key Laboratory of Oncogenes and Related Genes, Shanghai CancerInstitute, Renji Hospital, Shanghai Jiao Tong University School of Medicine,Shanghai 200032, P. R. China. 3Shanghai Center for BioinformationTechnology, Shanghai Academy of Science and Technology, Shanghai201203, P. R. China. 4School of Life Sciences and Biotechnology, ShanghaiJiao Tong University, Shanghai 200240, P. R. China.
Published: 24 January 2014
References1. Forner A, Llovet JM, Bruix J: Hepatocellular carcinoma. Lancet 2012,
379:1245-1255.2. El-Serag HB, Rudolph KL: Hepatocellular carcinoma: epidemiology and
molecular carcinogenesis. Gastroenterology 2007, 132:2557-2576.3. Teufel A, Staib F, Kanzler S, Weinmann A, Schulze-Bergkamen H, Galle PR:
Genetics of hepatocellular carcinoma. World J Gastroenterol WJG 2007,13:2271-2282.
4. Thorgeirsson SS, Grisham JW: Molecular pathogenesis of humanhepatocellular carcinoma. Nat Genet 2002, 31:339-346.
Wei et al. BMC Genomics 2014, 15(Suppl 1):S13http://www.biomedcentral.com/1471-2164/15/S1/S13
Page 11 of 13

5. Fattovich G, Stroffolini T, Zagni I, Donato F: Hepatocellular carcinoma incirrhosis: incidence and risk factors. Gastroenterology 2004, 127(5 Suppl 1):S35-50.
6. Kumagi T, Hiasa Y, Hirschfield GM: Hepatocellular carcinoma for the non-specialist. BMJ 2009, 339:b5039.
7. Tanaka M, Katayama F, Kato H, Tanaka H, Wang J, Qiao YL, Inoue M:Hepatitis B and C virus infection and hepatocellular carcinoma in China:a review of epidemiology and control measures. J Epidemiol JpnEpidemiol Assoc 2011, 21:401-416.
8. Choi JK, Choi JY, Kim DG, Choi DW, Kim BY, Lee KH, Yeom YI, Yoo HS,Yoo OJ, Kim S: Integrative analysis of multiple gene expression profilesapplied to liver cancer study. FEBS Lett 2004, 565:93-100.
9. Neo SY, Leow CK, Vega VB, Long PM, Islam AFM, Lai PBS, Liu ET, Ren EC:Identification of discriminators of hepatoma by gene expressionprofiling using a minimal dataset approach. Hepatol Baltim Md 2004,39:944-953.
10. Tanaka S, Arii S, Yasen M, Mogushi K, Su NT, Zhao C, Imoto I, Eishi Y,Inazawa J, Miki Y, Tanaka H: Aurora kinase B is a predictive factor for theaggressive recurrence of hepatocellular carcinoma after curativehepatectomy. Br J Surg 2008, 95:611-619.
11. Wang K, Liu J, Yan ZL, Li J, Shi LH, Cong WM, Xia Y, Zou QF, Xi T, Shen F,Wang HY, Wu MC: Overexpression of aspartyl-(asparaginyl)-beta-hydroxylase in hepatocellular carcinoma is associated with worsesurgical outcome. Hepatol Baltim Md 2010, 52:164-173.
12. Yang JD, Sun Z, Hu C, Lai J, Dove R, Nakamura I, Lee JS, Thorgeirsson SS,Kang KJ, Chu IS, Roberts LR: Sulfatase 1 and sulfatase 2 in hepatocellularcarcinoma: associated signaling pathways, tumor phenotypes, andsurvival. Genes Chromosomes Cancer 2011, 50:122-135.
13. Ye QH, Qin LX, Forgues M, He P, Kim JW, Peng AC, Simon R, Li Y, Robles AI,Chen Y, Ma ZC, Wu ZQ, Ye SL, Liu YK, Tang ZY, Wang XW: Predictinghepatitis B virus-positive metastatic hepatocellular carcinomas usinggene expression profiling and supervised machine learning. Nat Med2003, 9:416-423.
14. Budhu A, Forgues M, Ye QH, Jia HL, He P, Zanetti KA, Kammula US, Chen Y,Qin LX, Tang ZY, Wang XW: Prediction of venous metastases, recurrence,and prognosis in hepatocellular carcinoma based on a unique immuneresponse signature of the liver microenvironment. Cancer Cell 2006,10:99-111.
15. Paradis V, Bièche I, Dargère D, Laurendeau I, Laurent C, Bioulac Sage P,Degott C, Belghiti J, Vidaud M, Bedossa P: Molecular profiling ofhepatocellular carcinomas (HCC) using a large-scale real-time RT-PCRapproach: determination of a molecular diagnostic index. Am J Pathol2003, 163:733-741.
16. Huang T, Liu L, Liu Q, Ding G, Tan Y, Tu Z, Li Y, Dai H, Xie L: The role ofHepatitis C Virus in the dynamic protein interaction networks ofhepatocellular cirrhosis and carcinoma. Int J Comput Biol Drug Des 2011,4:5-18.
17. Li W, Xie L, He X, Li J, Tu K, Wei L, Wu J, Guo Y, Ma X, Zhang P, Pan Z,Hu X, Zhao Y, Xie H, Jiang G, Chen T, Wang J, Zheng S, Cheng J, Wan D,Yang S, Li Y, Gu J: Diagnostic and prognostic implications of microRNAsin human hepatocellular carcinoma. Int J Cancer 2008, 123:1616-1622.
18. Edgar R, Domrachev M, Lash AE: Gene Expression Omnibus: NCBI geneexpression and hybridization array data repository. Nucleic Acids Res 2002,30:207-210.
19. Smyth GK: Limma: linear models for microarray data. Bioinforma ComputBiol Solut Using R Bioconductor New York: Springer; 2005, 397-420.
20. Smyth GK: Linear models and empirical bayes methods for assessingdifferential expression in microarray experiments. Stat Appl Genet Mol Biol2004, 3:Article3.
21. Bioconductor. [http://www.bioconductor.org].22. Benjamini Y, Hochberg Y: Controlling the False Discovery Rate: A Practical
and Powerful Approach to Multiple Testing. J R Stat Soc Ser B Methodol1995, 57:289-300.
23. Wang X, Terfve C, Rose JC, Markowetz F: HTSanalyzeR: an R/Bioconductorpackage for integrated network analysis of high-throughput screens.Bioinforma Oxf Engl 2011, 27:879-880.
24. Subramanian A, Tamayo P, Mootha VK, Mukherjee S, Ebert BL, Gillette MA,Paulovich A, Pomeroy SL, Golub TR, Lander ES, Mesirov JP: Gene setenrichment analysis: a knowledge-based approach for interpretinggenome-wide expression profiles. Proc Natl Acad Sci USA 2005,102:15545-15550.
25. BioCarta. [http://www.biocarta.com].26. Kanehisa M, Goto S: KEGG: Kyoto Encyclopedia of Genes and Genomes.
Nucleic Acids Res 2000, 28:27-30.27. PID. [http://pid.nci.nih.gov].28. Reactome. [http://www.reactome.org].29. SigmaAldrich. [http://www.sigmaaldrich.com/life-science.html].30. Signaling Gateway. [http://www.signaling-gateway.org].31. Signal Transduction KE. [http://stke.sciencemag.org].32. SuperArray. [http://www.superarray.com].33. Ashburner M, Ball CA, Blake JA, Botstein D, Butler H, Cherry JM, Davis AP,
Dolinski K, Dwight SS, Eppig JT, Harris MA, Hill DP, Issel-Tarver L, Kasarskis A,Lewis S, Matese JC, Richardson JE, Ringwald M, Rubin GM, Sherlock G: Geneontology: tool for the unification of biology. The Gene OntologyConsortium. Nat Genet 2000, 25:25-29.
34. Francesco F: RmiR: Package to work with miRNAs and miRNA targetswith R. R package version 1.16.0..
35. Griffiths-Jones S, Saini HK, van Dongen S, Enright AJ: miRBase: tools formicroRNA genomics. Nucleic Acids Res 2008, 36(Database):D154-158.
36. Garcia DM, Baek D, Shin C, Bell GW, Grimson A, Bartel DP: Weak seed-pairing stability and high target-site abundance decrease the proficiencyof lsy-6 and other microRNAs. Nat Struct Mol Biol 2011, 18:1139-1146.
37. Betel D, Wilson M, Gabow A, Marks DS, Sander C: The microRNA.orgresource: targets and expression. Nucleic Acids Res 2008, 36(suppl 1):D149-D153.
38. Papadopoulos GL, Reczko M, Simossis VA, Sethupathy P, Hatzigeorgiou AG:The database of experimentally supported targets: a functional updateof TarBase. Nucleic Acids Res 2009, 37(Database):D155-158.
39. Wang X: miRDB: a microRNA target prediction and functional annotationdatabase with a wiki interface. RNA N Y N 2008, 14:1012-1017.
40. PicTar. [http://pictar.mdc-berlin.de].41. Planet E: phenoTest: Tools to test association between gene expression
and phenotype in a way that is efficient, structured, fast and scalable.We also provide tools to do GSEA (Gene set enrichment analysis) andcopy number variation.. R package version 1.6.0. 2010.
42. Cox D: Regression models and life-tables. J R Stat Soc Ser B 1972,34:187-220.
43. Kaplan EL, Meier P: Nonparametric Estimation from IncompleteObservations. J Am Stat Assoc 1958, 53:457.
44. Roessler S, Jia HL, Budhu A, Forgues M, Ye QH, Lee JS, Thorgeirsson SS,Sun Z, Tang ZY, Qin LX, Wang XW: A unique metastasis gene signatureenables prediction of tumor relapse in early-stage hepatocellularcarcinoma patients. Cancer Res 2010, 70:10202-10212.
45. Roessler S, Long EL, Budhu A, Chen Y, Zhao X, Ji J, Walker R, Jia HL, Ye QH,Qin LX, Tang ZY, He P, Hunter KW, Thorgeirsson SS, Meltzer PS, Wang XW:Integrative genomic identification of genes on 8p associated withhepatocellular carcinoma progression and patient survival.Gastroenterology 2012, 142:957-966.e12.
46. The Cancer Genome Atlas (TCGA). [http://cancergenome.nih.gov].47. Tao YM, Liu Z, Liu HL: Dickkopf-1 (DKK1) promotes invasion and
metastasis of hepatocellular carcinoma. Dig Liver Dis Off J Ital SocGastroenterol Ital Assoc Study Liver 2013, 45:251-257.
48. Shen Q, Fan J, Yang XR, Tan Y, Zhao W, Xu Y, Wang N, Niu Y, Wu Z, Zhou J,Qiu SJ, Shi YH, Yu B, Tang N, Chu W, Wang M, Wu J, Zhang Z, Yang S, Gu J,Wang H, Qin W: Serum DKK1 as a protein biomarker for the diagnosis ofhepatocellular carcinoma: a large-scale, multicentre study. Lancet Oncol2012, 13:817-826.
49. Fernandez F, Esposito T, Lea RA, Colson NJ, Ciccodicola A, Gianfrancesco F,Griffiths LR: Investigation of gamma-aminobutyric acid (GABA) Areceptors genes and migraine susceptibility. BMC Med Genet 2008, 9:109.
50. Grupe A, Li Y, Rowland C, Nowotny P, Hinrichs AL, Smemo S,Kauwe JSK, Maxwell TJ, Cherny S, Doil L, Tacey K, van Luchene R,Myers A, Wavrant-De Vrièze F, Kaleem M, Hollingworth P, Jehu L, Foy C,Archer N, Hamilton G, Holmans P, Morris CM, Catanese J, Sninsky J,White TJ, Powell J, Hardy J, O’Donovan M, Lovestone S, Jones L, et al: Ascan of chromosome 10 identifies a novel locus showing strongassociation with late-onset Alzheimer disease. Am J Hum Genet 2006,78:78-88.
51. Svendsen JM, Smogorzewska A, Sowa ME, O’Connell BC, Gygi SP,Elledge SJ, Harper JW: Mammalian BTBD12/SLX4 assembles a Hollidayjunction resolvase and is required for DNA repair. Cell 2009,138:63-77.
Wei et al. BMC Genomics 2014, 15(Suppl 1):S13http://www.biomedcentral.com/1471-2164/15/S1/S13
Page 12 of 13
52. Feranchak AP, Doctor RB, Troetsch M, Brookman K, Johnson SM, Fitz JG:Calcium-dependent regulation of secretion in biliary epithelial cells: therole of apamin-sensitive SK channels. Gastroenterology 2004, 127:903-913.
53. Sukhatme VP, Cao XM, Chang LC, Tsai-Morris CH, Stamenkovich D,Ferreira PC, Cohen DR, Edwards SA, Shows TB, Curran T: A zinc finger-encoding gene coregulated with c-fos during growth anddifferentiation, and after cellular depolarization. Cell 1988, 53:37-43.
54. Hanahan D, Weinberg RA: Hallmarks of cancer: the next generation. Cell2011, 144:646-674.
55. Cimprich KA, Shin TB, Keith CT, Schreiber SL: cDNA cloning and genemapping of a candidate human cell cycle checkpoint protein. Proc NatlAcad Sci USA 1996, 93:2850-2855.
56. Holtrich U, Wolf G, Bräuninger A, Karn T, Böhme B, Rübsamen-Waigmann H,Strebhardt K: Induction and down-regulation of PLK, a human serine/threonine kinase expressed in proliferating cells and tumors. Proc NatlAcad Sci USA 1994, 91:1736-1740.
57. Wang H, Gauthier BR, Hagenfeldt-Johansson KA, Iezzi M, Wollheim CB:Foxa2 (HNF3beta ) controls multiple genes implicated in metabolism-secretion coupling of glucose-induced insulin release. J Biol Chem 2002,277:17564-17570.
58. Mincheva A, Lichter P, Schütz G, Kaestner KH: Assignment of the humangenes for hepatocyte nuclear factor 3-alpha, -beta, and -gamma(HNF3A, HNF3B, HNF3G) to 14q12-q13, 20p11, and 19q13.2-q13.4.Genomics 1997, 39:417-419.
59. Wolfrum C, Shih DQ, Kuwajima S, Norris AW, Kahn CR, Stoffel M: Role ofFoxa-2 in adipocyte metabolism and differentiation. J Clin Invest 2003,112:345-356.
60. Kim TM, Yim SH, Shin SH, Xu HD, Jung YC, Park CK, Choi JY, Park WS,Kwon MS, Fiegler H, Carter NP, Rhyu MG, Chung YJ: Clinical implication ofrecurrent copy number alterations in hepatocellular carcinoma andputative oncogenes in recurrent gains on 1q. Int J Cancer J Int Cancer2008, 123:2808-2815.
61. Kauffmann A, Rosselli F, Lazar V, Winnepenninckx V, Mansuet-Lupo A,Dessen P, van den Oord JJ, Spatz A, Sarasin A: High expression of DNArepair pathways is associated with metastasis in melanoma patients.Oncogene 2008, 27:565-573.
62. McCaughan GW, Gorrell MD, Bishop GA, Abbott CA, Shackel NA,McGuinness PH, Levy MT, Sharland AF, Bowen DG, Yu D, Slaitini L,Church WB, Napoli J: Molecular pathogenesis of liver disease: anapproach to hepatic inflammation, cirrhosis and liver transplanttolerance. Immunol Rev 2000, 174:172-191.
63. Enk CD, Jacob-Hirsch J, Gal H, Verbovetski I, Amariglio N, Mevorach D,Ingber A, Givol D, Rechavi G, Hochberg M: The UVB-induced geneexpression profile of human epidermis in vivo is different from that ofcultured keratinocytes. Oncogene 2006, 25:2601-2614.
64. Wei RR, Huang GL, Zhang MY, Li BK, Zhang HZ, Shi M, Chen XQ, Huang L,Zhou QM, Jia WHJ, Zheng XFS, Yuan YF, Wang HY: Clinical significanceand prognostic value of microRNA expression signatures inhepatocellular carcinoma. Clin Cancer Res Off J Am Assoc Cancer Res 2013.
65. Smid M, Wang Y, Zhang Y, Sieuwerts AM, Yu J, Klijn JGM, Foekens JA,Martens JWM: Subtypes of breast cancer show preferential site ofrelapse. Cancer Res 2008, 68:3108-3114.
66. Lu M, Zhang Q, Deng M, Miao J, Guo Y, Gao W, Cui Q: An Analysis ofHuman MicroRNA and Disease Associations. PLoS ONE 2008, 3:e3420.
67. Zeng L, Yu J, Huang T, Jia H, Dong Q, He F, Yuan W, Qin L, Li Y, Xie L:Differential combinatorial regulatory network analysis related to venousmetastasis of hepatocellular carcinoma. BMC Genomics 2012, , 13 Suppl 8:S14.
68. Tu K, Yu H, Hua YJ, Li YY, Liu L, Xie L, Li YX: Combinatorial network ofprimary and secondary microRNA-driven regulatory mechanisms. NucleicAcids Res 2009, 37:5969-5980.
69. Chen M, Xiao J, Zhang Z, Liu J, Wu J, Yu J: Identification of human HKgenes and gene expression regulation study in cancer fromtranscriptomics data analysis. PloS One 2013, 8:e54082.
doi:10.1186/1471-2164-15-S1-S13Cite this article as: Wei et al.: Application of microRNA and mRNAexpression profiling on prognostic biomarker discovery forhepatocellular carcinoma. BMC Genomics 2014 15(Suppl 1):S13.
Submit your next manuscript to BioMed Centraland take full advantage of:
• Convenient online submission
• Thorough peer review
• No space constraints or color figure charges
• Immediate publication on acceptance
• Inclusion in PubMed, CAS, Scopus and Google Scholar
• Research which is freely available for redistribution
Submit your manuscript at www.biomedcentral.com/submit
Wei et al. BMC Genomics 2014, 15(Suppl 1):S13http://www.biomedcentral.com/1471-2164/15/S1/S13
Page 13 of 13
Copyright © 2022 FDOKUMEN