Antigen peptide transporter 1 is involved in the development of fructose-induced hepatic steatosis...
7
HEPATOLOGY Antigen peptide transporter 1 is involved in the development of fructose-induced hepatic steatosis in mice Shailendra Arindkar,* ,‡ Jashdeep Bhattacharjee,* ,‡ Jerald Mahesh Kumar, † Barun Das,* Pramod Upadhyay,* Shajahan Asif,* Ramesh C Juyal,* Subeer S Majumdar* and Nagarajan Perumal* *National Institute of Immunology, New Delhi, and † CSIR—Centre for Cellular and Molecular Biology, Hyderabad, India Key words CD8 cells, fructose, NAFLD, TAP1 mutant mice. Accepted for publication 13 February 2013. Correspondence Nagarajan Perumal, Experimental Animal Facility, National Institute of Immunology, New Delhi 110067, India. Email: [email protected], [email protected] ‡ Equally contributed. Abstract Background and Aim: The purpose of this study is to assess whether the decrease in CD8 cells has any role in the development of non-alcoholic fatty liver disease (NAFLD). In this study, we therefore used antigen peptide transporter 1 (TAP1 -/- ) mice that cannot transport major histocompatibility complex class I antigens onto the cell surface resulting in failure of the generation of CD8 cells. Methods: Wild-type C57Bl/6J and TAP1 -/- mice were fed with 30% fructose solution for 8 weeks. The percentage of CD4, CD8 cells in peripheral blood mononuclear cells, and liver were sorted by fluorescence-activated cell sorting in both control and fructose-treated mice. Bodyweight, histopathological changes, oil red O staining, glucose tolerance test, intraperitoneal insulin tolerance test, serum levels of triglycerides, cholesterol, aspartate aminotransferase, and alanine aminotransferase were also evaluated. Quantitative real-time polymerase chain reaction was performed to determine the expression of specific genes involved in development of fatty changes in the liver. Results: Chronic consumption of fructose in TAP1 -/- mice did not develop NAFLD, insulin resistance, or change in level of CD8 cells. Moreover, there was delay in relative expression levels of genes involved in development of NAFLD in fructose-treated TAP1 -/- mice. Conclusion: Taken together, the data suggest that TAP1 -/- -deficient mice displayed reduced levels of CD8 cells that have a vital role in the initiation and propagation of liver inflammation and is a casual role in the beginning of fructose-induced liver damage as well as insulin resistance in mice. Introduction Non-alcoholic fatty liver disease (NAFLD) is associated with obesity, insulin resistance, and type 2 diabetes. NAFLD repre- sents a wide spectrum of diseases ranging from fatty liver (hepatic steatosis), steatosis with inflammation and necrosis, to cirrhosis. The animal model to study NAFLD/non-alcoholic ste- atohepatitis (NASH) is particularly useful to clarify the unappre- ciated events involved in the pathology of NASH. The studies from the established animal models have provided some clues in the pathogenesis of steatosis and steatohepatitis, but these remain incompletely understood. Additionally, therapeutic options are still limited, as the mechanisms involved in the development of NAFLD are not yet fully clarified. 1 Therefore, a better under- standing of the biochemical and pathological changes that cause the early stages of NAFLD is desirable to develop intervention strategies. 2 Recent studies in human beings express that the diet rich in carbohydrates, particularly fructose, may be a substantial cause of NAFLD. 3 Fructose-rich diet has been postulated to be a key factor in the development of NAFLD. 4 In line with these findings, it has also been shown in animal studies that increased consumption of fructose may result in hepatic steatosis accompanied by insulin resistance, elevated plasma triglyceride (TG) levels, and oxidative stress in the liver. 5,6 Understanding the mechanisms that lead to progress from simple steatosis to NASH is essential in designing realistic treat- ment strategies toward patients who developed progressive dis- ease. 7 In addition, lipopolysaccharide, oxidative stress, cytokine production, and other pro-inflammatory mediators have been implicated for delivering a ‘second hit’ during the transition from simple steatosis to NASH. 8 Hepatic immune responses also play key roles in the pathogenesis of NASH and other progressive diseases. 9 CD8+ T cells and regulatory T cells in adipose tissue and liver involve in mediating the adverse effects of inflammation on metabolism. Recently, it has been shown that CD8 cells have critical roles in the initiation and maintenance of adipose tissue inflammation and systemic insulin resistance. 10 doi:10.1111/jgh.12186 1403 Journal of Gastroenterology and Hepatology 28 (2013) 1403–1409 © 2013 Journal of Gastroenterology and Hepatology Foundation and Wiley Publishing Asia Pty Ltd
Transcript of Antigen peptide transporter 1 is involved in the development of fructose-induced hepatic steatosis...

HEPATOLOGY
Antigen peptide transporter 1 is involved in thedevelopment of fructose-induced hepatic steatosis in miceShailendra Arindkar,*,‡ Jashdeep Bhattacharjee,*,‡ Jerald Mahesh Kumar,† Barun Das,*Pramod Upadhyay,* Shajahan Asif,* Ramesh C Juyal,* Subeer S Majumdar* and Nagarajan Perumal*
*National Institute of Immunology, New Delhi, and †CSIR—Centre for Cellular and Molecular Biology, Hyderabad, India
Key words
CD8 cells, fructose, NAFLD, TAP1 mutantmice.
Accepted for publication 13 February 2013.
Correspondence
Nagarajan Perumal, Experimental AnimalFacility, National Institute of Immunology,New Delhi 110067, India. Email:[email protected], [email protected]
‡Equally contributed.
AbstractBackground and Aim: The purpose of this study is to assess whether the decrease in CD8cells has any role in the development of non-alcoholic fatty liver disease (NAFLD). In thisstudy, we therefore used antigen peptide transporter 1 (TAP1-/-) mice that cannot transportmajor histocompatibility complex class I antigens onto the cell surface resulting in failureof the generation of CD8 cells.Methods: Wild-type C57Bl/6J and TAP1-/- mice were fed with 30% fructose solution for8 weeks. The percentage of CD4, CD8 cells in peripheral blood mononuclear cells, andliver were sorted by fluorescence-activated cell sorting in both control and fructose-treatedmice. Bodyweight, histopathological changes, oil red O staining, glucose tolerance test,intraperitoneal insulin tolerance test, serum levels of triglycerides, cholesterol, aspartateaminotransferase, and alanine aminotransferase were also evaluated. Quantitative real-timepolymerase chain reaction was performed to determine the expression of specific genesinvolved in development of fatty changes in the liver.Results: Chronic consumption of fructose in TAP1-/- mice did not develop NAFLD,insulin resistance, or change in level of CD8 cells. Moreover, there was delay in relativeexpression levels of genes involved in development of NAFLD in fructose-treatedTAP1-/- mice.Conclusion: Taken together, the data suggest that TAP1-/--deficient mice displayedreduced levels of CD8 cells that have a vital role in the initiation and propagation of liverinflammation and is a casual role in the beginning of fructose-induced liver damage as wellas insulin resistance in mice.
IntroductionNon-alcoholic fatty liver disease (NAFLD) is associated withobesity, insulin resistance, and type 2 diabetes. NAFLD repre-sents a wide spectrum of diseases ranging from fatty liver(hepatic steatosis), steatosis with inflammation and necrosis, tocirrhosis. The animal model to study NAFLD/non-alcoholic ste-atohepatitis (NASH) is particularly useful to clarify the unappre-ciated events involved in the pathology of NASH. The studiesfrom the established animal models have provided some clues inthe pathogenesis of steatosis and steatohepatitis, but these remainincompletely understood. Additionally, therapeutic options arestill limited, as the mechanisms involved in the development ofNAFLD are not yet fully clarified.1 Therefore, a better under-standing of the biochemical and pathological changes that causethe early stages of NAFLD is desirable to develop interventionstrategies.2
Recent studies in human beings express that the diet rich incarbohydrates, particularly fructose, may be a substantial cause of
NAFLD.3 Fructose-rich diet has been postulated to be a key factorin the development of NAFLD.4 In line with these findings, it hasalso been shown in animal studies that increased consumption offructose may result in hepatic steatosis accompanied by insulinresistance, elevated plasma triglyceride (TG) levels, and oxidativestress in the liver.5,6
Understanding the mechanisms that lead to progress fromsimple steatosis to NASH is essential in designing realistic treat-ment strategies toward patients who developed progressive dis-ease.7 In addition, lipopolysaccharide, oxidative stress, cytokineproduction, and other pro-inflammatory mediators have beenimplicated for delivering a ‘second hit’ during the transition fromsimple steatosis to NASH.8 Hepatic immune responses also playkey roles in the pathogenesis of NASH and other progressivediseases.9 CD8+ T cells and regulatory T cells in adipose tissue andliver involve in mediating the adverse effects of inflammation onmetabolism. Recently, it has been shown that CD8 cells havecritical roles in the initiation and maintenance of adipose tissueinflammation and systemic insulin resistance.10
doi:10.1111/jgh.12186
bs_bs_banner
1403Journal of Gastroenterology and Hepatology 28 (2013) 1403–1409
© 2013 Journal of Gastroenterology and Hepatology Foundation and Wiley Publishing Asia Pty Ltd

The antigen peptide transporter 1 (TAP1), together with TAP2,constitutes a major histocompatibility complex class 1 antigens(MHC1) transporter maintaining the major pathway of MHC classI surface expression. TAP1 is essential for thymic differentiation ofT cells, and its deficiency result in a diminished supply of periph-eral CD8 cells.11 Since CD8 cells can become activated by extra-cellular antigens cross-presented via MHC class I, TAP1-/- miceare defective in the normal assembly and intracellular transport ofclass I molecule.12 Those mice also show severely reduced levelsof class I surface molecules.
In this study, we evaluated the role of CD8 cells in pathogenesisof NAFLD. We used fructose-induced animal model and hypo-thesized that CD8 regulation are involved in development ofNAFLD.
Materials and methods
Animals. Experimental procedures used in this study wereapproved by the Institutional Animal Ethics Committee. Six-week-old C57Bl6/J and TAP1-/- male mice (Jackson Laboratories, BarHarbour, ME, USA) were used in this study. The animals werehoused in a pathogen-free environment under standard light (12 hlight, 12 h dark cycle), temperature (23 � 1°C), and humidity(50% � 5%) conditions. All mice received standard chow dietcomposed of 4.8% fat and 21% crude protein (Nutrilab, Banga-lore, India). During 8 weeks, animals from each genotype wererandomly divided into four groups: control C57BL/6J and TAP1-/-
mice received drinking water (n = 5) with and without 30% (w/v)fructose (HiMedia, Mumbai, India) daily for 8 weeks.
Biochemical analysis. After 6 h of fasting, blood sampleswere withdrawn from mice, collected from cardiac puncture underanesthesia at the end of the experimental time to determineglucose, insulin, TGs, and cholesterol levels in the blood. Bloodglucose was estimated using a digital glucometer (Accu-Chek,Mumbai, India). Serum biochemical parameters such as choles-terol (CHO), TGs, aspartate aminotransferase (AST) alanine ami-
notransferase (ALT) were analyzed using a serum auto-analyzer(Screen Master 3000, Tulip, Alto Santacruz, India). The levels ofGlutathione from the frozen liver tissue were estimated usingGlutathione Assay Kit (Sigma Aldrich, St. Louis, MO, USA).
Histological analysis. Liver tissues were isolated afteranesthesia and embedded in paraffin sections of 4-micron thick-ness and stained with hematoxylin and eosin. Frozen sections offormalin-fixed liver were stained with oil red O using standardtechniques. Representative photomicrographs were captured at an¥40 magnification using a system incorporated in a microscope.
Glucose tolerance test and intraperitoneal insulintolerance test. Mice fasted for 6 h were injected intraperito-neally with 2 g/kg dextrose, and tail blood glucose was measuredat different times using a glucose monitor (Accucheck) at 0, 30,60, and 120 min. For intraperitoneal insulin tolerance test (IPITT),insulin was injected intraperitoneally (1 U/kg), and blood glucosewas measured at time points of 0, 30, 60, and 120 min postinjec-tion. These tests were done 1 day and 2 days before euthanizingmice.
Reverse transcription–polymerase chain reaction.Total RNA was extracted from the liver of mice by TRI Reagent(Sigma Aldrich, St. Louis, MO, USA). Complementary DNA(cDNA) synthesis was performed by ProtoScript M-MuLV first-strand cDNA synthesis kit (NEB, Ipswich, MA, USA) using 1 mgtotal RNA. Quantitative real-time polymerase chain reaction(PCR) was performed with 5X HOT FIREPol EvaGreen qPCRMix Plus (Solis BioDyne, Tartu, Estonia) on the MastercyclerRealPlex4 platform (Eppendorf, Wesseling-Berzdorf, Germany).The primer pairs used is listed in Table 1. The PCR conditionsused were as follows: initial denaturation 95°C for 15 min, fol-lowed by 40 cycles of 95°C for 15 s (denaturation) and 60°C for40 s (annealing and extension). The expression of genes was nor-malized to housekeeping gene (18S ribosomal ribonucleic acid,
Table 1 The primers employed in this study
Genes Forward primer Reverse primer
PGC-1a GCCCGGTACAGTGAGTGTTC CTGGGCCGTTTAGTCTTCCTChREBP GATGGTGCGAACAGCTCTTCT CTGGGCTGTGTCATGGTGAASREBP1c GATGTGCGAACTGGACACAG CATAGGGGGCGTCAAACAGFAS ATCCTGGAACGAGAACACGATCT AGAGACGTGTCACTCCTGGACTTSCD1 TGGGTTGGCTGCTTGTG GCGTGGGCAGGATGAAGPPARa CGGGAAAGACCAGCAACAAC TGGCAGCAGTGGAAGAATCGIRS1 CTCTACACCCGAGACGAACAC TGGGCCTTTGCCCGATTATGIRS2 GGAGAACCCAGACCCTAAGCTACT GATGCCTTTGAGGCCTTCACPEPCK CAGGATCGAAAGCAAGACAGT AAGTCCTCTTCCGACATCCAGG6Pase GAAAAAGCCAACGTATGGATTCC CAGCAAGGTAGATCCGGGA18S rRNA GTAACCCGTTGAACCCCATT CCATCCAATCGGTAGTAGCGMCP1 CCACTCACCTGCTGCTACTCAT TGGTGATCCTCTTGTAGCTCTCC
ChREBP, carbohydrate responsive element binding protein; FAS, fatty acid synthase; G6Pase, glucose 6-phosphatase; IRSI, insulin receptor sibstrate1; IRS2, insulin receptor substrate 2; MCP1, monocyte chemotactic protein-1; PEPCK, phosphoenolpyruvate carboxykinase 1; PGC1a, peroxisomeproliferative activated receptor gamma coactivator 1 alpha; PRARa, peroxisome proliferators-activated receptor alpha; rRNA, ribosomal ribonucleic;SCD1, stearoyl-CoA desaturase-1; SREBP1c, sterol regulatory element-binding proteins.
Mutant mice model for steatosis S Arindkar et al.
1404 Journal of Gastroenterology and Hepatology 28 (2013) 1403–1409
© 2013 Journal of Gastroenterology and Hepatology Foundation and Wiley Publishing Asia Pty Ltd

18S rRNA), and relative expression was calculated. Target genelevels are presented as a ratio of levels in treated versus corre-sponding control groups, according to the DDCt method.
CD4 and CD8 cells in liver and blood. The CD4 andCD8 cells were isolated from liver by retrograde perfusion. Micewere anesthetized by ketamine hydrochloride and xylazine (100and 10 mg/kg of bodyweight, respectively) injection administeredintraperitoneally. A midline incision was made from tail to neckfollowed by two mid-transverse incisions at right and left of themidline incision to expose the abdominal cavity. The intestineswere displaced to expose liver, right kidney, portal vein, and infe-rior vena cava. The inferior vena cava was cannulated, and perfu-sate consisting of 0.5 mmol/L EGTA (ethylene glycol tetraaceticacid, Sigma Aldrich) in 10 mmol/L HEPES was administeredthrough peristaltic pump. The portal vein was cut for outflow. After15 min of washing, another perfusate containing 10 mmol/LHEPES (4-(2-hydroxyethyl)-1-piperazineethanessulfonic acid,Himedia) was administered to remove EGTA for 10 min. Finally,perfusate containing 10 mg Type IV collagenase dissolved in50 mL HEPES buffer containing 2.5 mmol/L CaCl2, 136 mmol/LNaCl, 5 mmol/L KCl, and 0.5% glucose at pH 7.6 was adminis-tered, and the entire solution was perfused. After perfusion, theliver was removed from the abdomen and kept in a medium con-taining Dulbecco’s modified Eagle’s medium and 10% fetal calfserum (FCS). The liver was teased with forceps to dislodge thecells. The cell suspension that is devoid of undissociated tissue wascollected in a 50-mL centrifuge tube and centrifuged at 50 g for10 min at 4°C. The supernatant was collected and centrifuged at300 g for 10 min at 4°C. The cell pellet was resuspended in 200 mLphosphate-buffered saline (PBS) containing 1% bovine serumalbumin, and 0.5 million cells were used to analyze each of themarkers. The antibody against CD4 and CD8 were fluoresceinisothiocyanate-conjugated (BD Pharmingen, San Jose, California,USA), and propidium iodide (BD Pharmingen) staining was alsodone to exclude dead cell during analysis.
For estimating percentage of CD4 and CD8 cells in blood,40 mL of blood was collected in 40 mL CPD buffer from ocularvein of mice. For each staining parameter i.e. CD4, CD8 10 mL ofblood –CPD mixture was taken in each tube and 50 mL of antibodysolution (1:200) was added in each tube and incubated on ice for30 min. For red blood cell lysis, 1 mL of 1¥ BD fluorescence-
activated cell sorting (FACS) lysing solution (BD Biosciences, SanJose, California, USA) was added in each tube and incubated atroom temperature for 10 min. Four milliliters of PBS was thenadded to each tube and centrifuged at 300 g at 4°C. The cell pelletwas finally resuspended in 200-mL PBS. For cells isolated fromliver the dilution of antibody and staining procedure was same asthat for the blood sample. CyFlow (Partec Gmbh, Münster,Germany) was used for flow cytometry, and data were analyzedusing FCS Express 4 Plus (De Novo Software, Los Angeles, CA,USA).
Statistical analysis. We expressed the results as means �standard deviation. We determined the statistical significance ofdifferences between two groups using Student’s t-tests. The valueof P < 0.05 was considered significant.
ResultsNo statistically significant changes in serum biochemical variablesin TAP1-/- mice between control and fructose-fed, except body-weight gain. In contrast, the mean serum TG, AST, ALT, glucose,and bodyweight gain were significantly greater (P < 0.01) inchronic fructose-fed C57BL/6J mice than C57BL/6J mice fed withregular water (Table 2).
FACS analysis. In order to investigate changes in CD8 andCD4 cells composition, we analyzed the levels of CD8 and CD4cells in peripheral blood mononuclear cells (PBMCs) and liver. Weobserved that there were no significant changes in the number ofCD8 cells in the blood and liver from fructose-treated TAP1-/-
mice with control TAP1-/- (Fig. 1). In the liver of fructose-fedTAP1-/- mice, the percentage CD4 cells increased dramaticallyfrom 1.46% to 9.36%. However, in C57BL/6J fructose-fed mice,marginal changes in the CD4 and CD8 percentage were observed(Fig. 1).
Glucose tolerance and insulin tolerance tests.While examining the glucose tolerance test and IPITT, weobserved that C57BL/6J with chronic fructose solution developedboth glucose tolerance and insulin resistance as expected. The
Table 2 Effect of fructose feeding on bodyweight and clinical parameters of liver (n = 5)
Parameters C57BL/6J control C57BL6/J fructose TAP1-/- control TAP1-/- fructose
Cholesterol (mg/dL) 91.7 � 3.5 124.0 � 40.3* 75 � 27.26 77.33 � 20.29Triglycerides (mg/dL) 33.9 � 2.60 74.66 � 14.0* 55 � 31.02 53.9 � 25.0AST (IU/L) 156 � 21.54 285 � 97.23* 40.16 � 10.74 54 � 11.01ALT (IU/L) 40.02 � 12.4 56.8 � 11.5 31 � 9.01 30.5 � 7.99Glucose (mg/dL) 152.21 � 21.4 182 � 16.53* 128 � 27.32 141 � 18.62Bodyweight gain (g) 3.31 � 0.34 4.77 � 0.48* 3.01 � 0.58 4.13 � 0.56*Liver weight (mg) 1.10 � 0.05 1.39 � 0.07 1.14 + 0.23 1.29 � 0.24Glutathione (nmol/mL) 22.04 10.74 30.08 27.64
*P < 0.05.The values are compared with control and fructose-treated.ALT, alanine aminotransferase; AST, aspartate aminotransferase; TAP1-/-, antigen peptide transporter 1.
S Arindkar et al. Mutant mice model for steatosis
1405Journal of Gastroenterology and Hepatology 28 (2013) 1403–1409
© 2013 Journal of Gastroenterology and Hepatology Foundation and Wiley Publishing Asia Pty Ltd

degree of neither glucose intolerance nor insulin resistance wasnoticed in TAP1-/- (control) and TAP1-/- fructose-fed mice(Fig. 2).
Liver histopathology and oil red O staining. We nextstudied the morphological changes in the liver to fructose treat-ment. There was no change in the liver of control C57BL/6J and
TAP1-/- mice. In contrast, oil red O staining of the liver showedmild accentuation of fat staining from fructose-fed mice (Fig. 3d).The liver of fructose-fed C57BL/6J mice showed diffuse microve-sicular and macrovesicular fatty changes throughout the paren-chyma. Small foci of individual cell necrosis of hepatocyteswere frequently noticed. They had pyknotic nuclei, eosinophiliccytoplasm, and complete vacuolization of total hepatocytes. In
Figure 1 The percentages of CD4 and CD8cells in blood (a) and liver (b) in C57BL/6J andantigen peptide transporter 1 (TAP1-/-) mice.In the fructose groups, mice were fructose-treated for 8 weeks.
Mutant mice model for steatosis S Arindkar et al.
1406 Journal of Gastroenterology and Hepatology 28 (2013) 1403–1409
© 2013 Journal of Gastroenterology and Hepatology Foundation and Wiley Publishing Asia Pty Ltd

some of the centrilobular regions, lipid was accumulated and sur-rounded by a single layer of endothelial or epithelial cells forminga cyst-like structure. Frozen biopsy samples from fructose-fedC57BL/6J mice stained for oil red O showed red-colored micro-vesicular and macrovesicular fatty droplets and blue-colorednucleus pushed eccentric to a red-colored fat-globuled cytoplasmin macrovesicular.
Gene expression analysis by reverse transcription–polymerase chain reaction. Next, we analyzed theexpression pattern of several genes involved in transcription,
lipogenesis, and inflammation (Fig. 4). The relative messengerRNA (mRNA) expressions in both the groups (C57BL/6J fructoseand TAP1-/- fructose) have been compared with their respectivenormal controls. Except insulin receptor substrate 1 (IRS1) andmonocyte chemotactic protein-1 (MCP1) genes are underex-pressed in both the groups. The IRS1 is overexpressed in fructose-fed C57BL/6J mice indicating increased insulin sensitivity,whereas the MCP1 gene is expressed substantially higher infructose-fed TAP1 mice suggesting enhanced macrophage infiltra-tion into adipose tissues. As a consequence of fructose feed, theperoxisome proliferative activated receptor, gamma, coactivator 1alpha (PGC1a), carbohydrate responsive element binding protein
Figure 2 Glucose tolerance test (GTT) and intraperitoneal insulin tolerance test (IPITT). Values presented are means � standard deviation from fivemice. ( ) antigen peptide transporter 1 (TAP1) control; ( ) TAP1 fructose; ( ) C57BL/6 control; ( ) C57BL/6 fructose.
Figure 3 Histological analyses of liver sections from antigen peptide transporter 1 (TAP1-/-) and C57BL/6J mice. Representative photomicrographsof hematoxylin and eosin (HE), and oil red O staining (Top panel: oil red O staining; down panel: HE staining) are shown with an original magnificationof ¥40.
S Arindkar et al. Mutant mice model for steatosis
1407Journal of Gastroenterology and Hepatology 28 (2013) 1403–1409
© 2013 Journal of Gastroenterology and Hepatology Foundation and Wiley Publishing Asia Pty Ltd
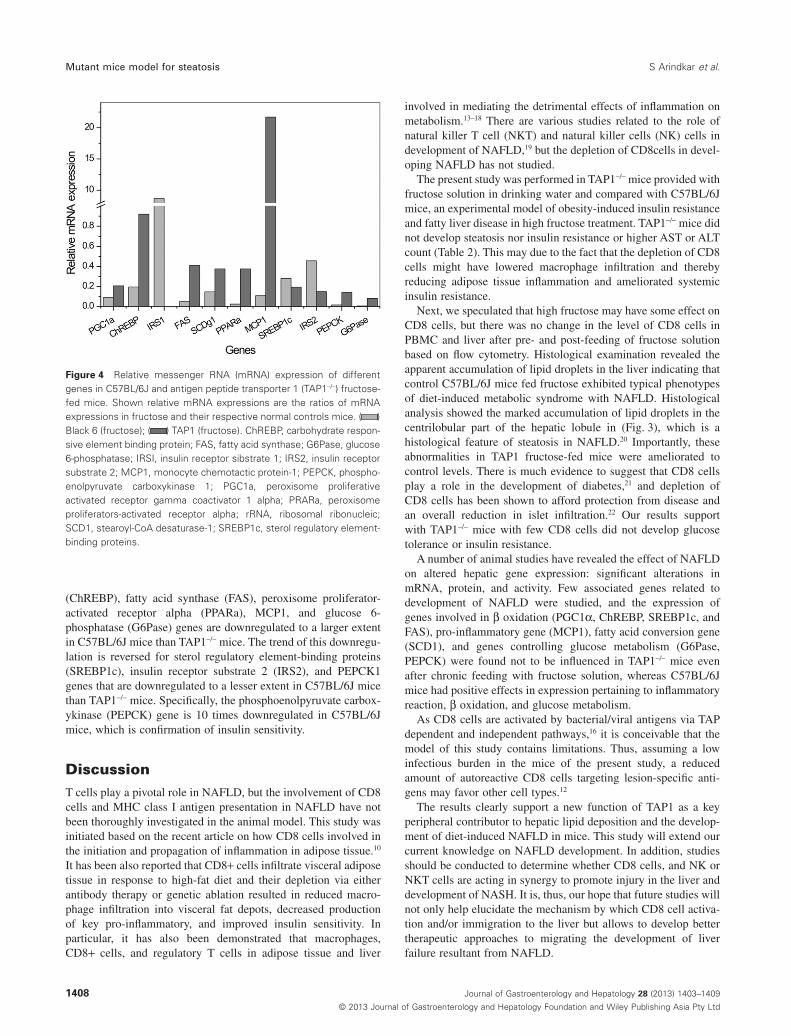
(ChREBP), fatty acid synthase (FAS), peroxisome proliferator-activated receptor alpha (PPARa), MCP1, and glucose 6-phosphatase (G6Pase) genes are downregulated to a larger extentin C57BL/6J mice than TAP1-/- mice. The trend of this downregu-lation is reversed for sterol regulatory element-binding proteins(SREBP1c), insulin receptor substrate 2 (IRS2), and PEPCK1genes that are downregulated to a lesser extent in C57BL/6J micethan TAP1-/- mice. Specifically, the phosphoenolpyruvate carbox-ykinase (PEPCK) gene is 10 times downregulated in C57BL/6Jmice, which is confirmation of insulin sensitivity.
DiscussionT cells play a pivotal role in NAFLD, but the involvement of CD8cells and MHC class I antigen presentation in NAFLD have notbeen thoroughly investigated in the animal model. This study wasinitiated based on the recent article on how CD8 cells involved inthe initiation and propagation of inflammation in adipose tissue.10
It has been also reported that CD8+ cells infiltrate visceral adiposetissue in response to high-fat diet and their depletion via eitherantibody therapy or genetic ablation resulted in reduced macro-phage infiltration into visceral fat depots, decreased productionof key pro-inflammatory, and improved insulin sensitivity. Inparticular, it has also been demonstrated that macrophages,CD8+ cells, and regulatory T cells in adipose tissue and liver
involved in mediating the detrimental effects of inflammation onmetabolism.13–18 There are various studies related to the role ofnatural killer T cell (NKT) and natural killer cells (NK) cells indevelopment of NAFLD,19 but the depletion of CD8cells in devel-oping NAFLD has not studied.
The present study was performed in TAP1-/- mice provided withfructose solution in drinking water and compared with C57BL/6Jmice, an experimental model of obesity-induced insulin resistanceand fatty liver disease in high fructose treatment. TAP1-/- mice didnot develop steatosis nor insulin resistance or higher AST or ALTcount (Table 2). This may due to the fact that the depletion of CD8cells might have lowered macrophage infiltration and therebyreducing adipose tissue inflammation and ameliorated systemicinsulin resistance.
Next, we speculated that high fructose may have some effect onCD8 cells, but there was no change in the level of CD8 cells inPBMC and liver after pre- and post-feeding of fructose solutionbased on flow cytometry. Histological examination revealed theapparent accumulation of lipid droplets in the liver indicating thatcontrol C57BL/6J mice fed fructose exhibited typical phenotypesof diet-induced metabolic syndrome with NAFLD. Histologicalanalysis showed the marked accumulation of lipid droplets in thecentrilobular part of the hepatic lobule in (Fig. 3), which is ahistological feature of steatosis in NAFLD.20 Importantly, theseabnormalities in TAP1 fructose-fed mice were ameliorated tocontrol levels. There is much evidence to suggest that CD8 cellsplay a role in the development of diabetes,21 and depletion ofCD8 cells has been shown to afford protection from disease andan overall reduction in islet infiltration.22 Our results supportwith TAP1-/- mice with few CD8 cells did not develop glucosetolerance or insulin resistance.
A number of animal studies have revealed the effect of NAFLDon altered hepatic gene expression: significant alterations inmRNA, protein, and activity. Few associated genes related todevelopment of NAFLD were studied, and the expression ofgenes involved in b oxidation (PGC1a, ChREBP, SREBP1c, andFAS), pro-inflammatory gene (MCP1), fatty acid conversion gene(SCD1), and genes controlling glucose metabolism (G6Pase,PEPCK) were found not to be influenced in TAP1-/- mice evenafter chronic feeding with fructose solution, whereas C57BL/6Jmice had positive effects in expression pertaining to inflammatoryreaction, b oxidation, and glucose metabolism.
As CD8 cells are activated by bacterial/viral antigens via TAPdependent and independent pathways,16 it is conceivable that themodel of this study contains limitations. Thus, assuming a lowinfectious burden in the mice of the present study, a reducedamount of autoreactive CD8 cells targeting lesion-specific anti-gens may favor other cell types.12
The results clearly support a new function of TAP1 as a keyperipheral contributor to hepatic lipid deposition and the develop-ment of diet-induced NAFLD in mice. This study will extend ourcurrent knowledge on NAFLD development. In addition, studiesshould be conducted to determine whether CD8 cells, and NK orNKT cells are acting in synergy to promote injury in the liver anddevelopment of NASH. It is, thus, our hope that future studies willnot only help elucidate the mechanism by which CD8 cell activa-tion and/or immigration to the liver but allows to develop bettertherapeutic approaches to migrating the development of liverfailure resultant from NAFLD.
Figure 4 Relative messenger RNA (mRNA) expression of differentgenes in C57BL/6J and antigen peptide transporter 1 (TAP1-/-) fructose-fed mice. Shown relative mRNA expressions are the ratios of mRNAexpressions in fructose and their respective normal controls mice. ( )Black 6 (fructose); ( ) TAP1 (fructose). ChREBP, carbohydrate respon-sive element binding protein; FAS, fatty acid synthase; G6Pase, glucose6-phosphatase; IRSI, insulin receptor sibstrate 1; IRS2, insulin receptorsubstrate 2; MCP1, monocyte chemotactic protein-1; PEPCK, phospho-enolpyruvate carboxykinase 1; PGC1a, peroxisome proliferativeactivated receptor gamma coactivator 1 alpha; PRARa, peroxisomeproliferators-activated receptor alpha; rRNA, ribosomal ribonucleic;SCD1, stearoyl-CoA desaturase-1; SREBP1c, sterol regulatory element-binding proteins.
Mutant mice model for steatosis S Arindkar et al.
1408 Journal of Gastroenterology and Hepatology 28 (2013) 1403–1409
© 2013 Journal of Gastroenterology and Hepatology Foundation and Wiley Publishing Asia Pty Ltd
AcknowledgmentThe authors wish to thank the director of National Institute ofImmunology for providing kind support from the funds originatedfrom Department of Biotechnology, India. The authors also wishto thank Drs Gopalan Sampathkumar, NII, New Delhi and Nan-thakumar Thirunarayanan, National Institutes of Health, USA fortheir kind support and advice to carry out this study.
References1 Nagarajan P, Mahesh Kumar MJ, Venkatesan R, Majundar SS,
Juyal RC. Genetically modified mouse models for the study ofnonalcoholic fatty liver disease. World J. Gastroenterol. 2012; 18:1141–53.
2 Spruss A, Kanuri G, Uebel K, Bischoff SC, Bergheim I. Role ofthe inducible nitric oxide synthase in the onset of fructose-inducedsteatosis in mice. Antioxid. Redox Signal. 2011; 14: 2121–35.
3 Thuy S, Ladurner R, Volynets V et al. Nonalcoholic fatty liverdisease in humans is associated with increased plasma endotoxin andplasminogen activator inhibitor 1 concentrations and with fructoseintake. J. Nutr. 2008; 138: 1452–5.
4 Ouyang X, Cirillo P, Sautin Y et al. Fructose consumption as a riskFactor for non-alcoholic fatty liver disease. J. Hepatol. 2008; 48:993–9.
5 Bergheim I, Weber S, Vos M et al. Antibiotics protect againstfructose-induced hepatic lipid accumulation in mice: role ofendotoxin. J. Hepatol. 2008; 48: 983–92.
6 Jurgens H, Haass W, Castaneda TR et al. Consumingfructose-sweetened beverages increases body adiposity in mice.Obes. Res. 2005; 13: 1146–56.
7 London RM, George J. Pathogenesis of NASH: animal models.Clin. Liver Dis. 2007; 11: 55–74.
8 Leclercq IA. Pathogenesis of steatohepatitis: insights from the studyof animal models. Acta Gastroenterol Belg. 2007; 70: 25–31.
9 Tang Y, Bian Z, Zhao L et al. Interleukin-17 exacerbates hepaticsteatosis and inflammation in non-alcoholic fatty liver disease. Clin.Exp. Immunol. 2011; 166: 281–90.
10 Nishimura S, Manabe I, Nagasaki M et al. CD8+ effector T cellscontribute to macrophage recruitment and adipose tissueinflammation in obesity. Nat. Med. 2009; 15: 914–20.
11 Ljunggren HG, Glas R, Sandberg JK, Karre K. Reactivity andspecificity of CD8 cells in mice with defects in the MHC class Iantigen-presenting pathway. Immunol. Rev. 1996; 151: 123–48.
12 Rock KL, Shen L. Cross-presentation: underlying mechanismsand role in immune surveillance. Immunol. Rev. 2005; 207:166–83.
13 Xu H, Barnes GT, Yang Q et al. Chronic inflammation in fat plays acrucial role in the development of obesity-related insulin resistance.J. Clin. Invest. 2003; 112: 1821–30.
14 Cancello R, Henegar C, Viguerie N et al. Reduction of macrophageinfiltration and chemoattractant gene expression changes in whiteadipose tissue of morbidly obese subjects after surgery-inducedweight loss. Diabetes 2005; 54: 2277–86.
15 Cancello R, Tordjman J, Poitou C et al. Increased infiltration ofmacrophages in omental adipose tissue is associated with markedhepatic lesions in morbid human obesity. Diabetes 2006; 55:1554–61.
16 Weisberg SP, McCann D, Desai M, Rosenbaum M, Leibel RL,Ferrante AW Jr. Obesity is associated with macrophage accumulationin adipose tissue. J. Clin. Invest. 2003; 112: 1796–808.
17 Hotamisligil GS. Inflammation and metabolic disorders. Nature2006; 444: 860–7.
18 Olefsky JM, Glass CK. Macrophages, inflammation, and insulinresistance. Annu. Rev. Physiol. 2010; 72: 219–46.
19 Tajiri K, Shimizu Y. Role of NKT cells in the pathogenesis ofNAFLD. Int. J. Hepatol. 2012; 2012: 850836. Epub 2012Apr 5.
20 Brunt EM, Tiniakos DG. Histopathology of nonalcoholic fatty liverdisease. World J. Gastroenterol. 2010; 16: 5286–96.
21 Phillips JM, Parish NM, Raine T et al. Type 1 diabetes developmentrequires both CD4+ and CD8 cells and can be reversed bynon-depleting antibodies targeting both T cell populations. Rev.Diabet. Stud. 2009; 6: 97–103.
22 Miller BJ, Appel MC, O’Neil JJ, Wicker LS. Both the Lyt-2+ andL3T4+ T cell subsets are required for the transfer of diabetes innonobese diabetic mice. J. Immunol. 1988; 140: 52–8.
S Arindkar et al. Mutant mice model for steatosis
1409Journal of Gastroenterology and Hepatology 28 (2013) 1403–1409
© 2013 Journal of Gastroenterology and Hepatology Foundation and Wiley Publishing Asia Pty Ltd