Antibody microarray-based profiling of complex specimens: systematic evaluation of labeling...
14
RESEARCH ARTICLE Antibody microarray-based profiling of complex specimens: systematic evaluation of labeling strategies Wlad Kusnezow 1 , Virryan Banzon 1 , Christoph Schröder 1 , René Schaal 1 , Jörg D. Hoheisel 1 , Sven Rüffer 1 , Petra Luft 2 , Albert Duschl 2 and Yana V. Syagailo 1 1 Division of Functional Genome Analysis, Deutsches Krebsforschungszentrum (DKFZ), Heidelberg, Germany 2 Institute of Chemistry and Biochemistry, University of Salzburg, Salzburg, Austria Antibody microarrays have often had limited success in detection of low abundant proteins in complex specimens. Signal amplification systems improve this situation, but still are quite la- borious and expensive. However, the issue of sensitivity is more likely a matter of kinetically ap- propriate microarray design as demonstrated previously. Hence, we re-examined in this study the suitability of simple and inexpensive detection approaches for highly sensitive antibody micro- array analysis. N-hydroxysuccinimidyl ester (NHS)- and Universal Linkage System (ULS)-based fluorescein and biotin labels used as tags for subsequent detection with anti-fluorescein and extravidin, respectively, as well as fluorescent dyes were applied for analysis of blood plasma. Parameters modifying strongly the performance of microarray detection such as labeling condi- tions, incubation time, concentrations of anti-fluorescein and extravidin and extent of protein labeling were analyzed and optimized in this study. Indirect detection strategies whether based on NHS- or ULS-chemistries strongly outperformed direct fluorescent labeling and enabled detection of low abundant cytokines with many dozen-fold signal-to-noise ratios. Finally, partic- ularly sensitive detection chemistry was applied to monitoring cytokine production of stimulated peripheral T cells. Microarray data were in accord with quantitative cytokine levels measured by ELISA and Luminex, demonstrating comparable reliability and femtomolar range sensitivity of the established microarray approach. Received: July 13, 2006 Revised: January 24, 2007 Accepted: March 2, 2007 Keywords: Antibody microarray / Detection strategies / Microspot kinetics / Protein profiling / Sensitivity 1786 Proteomics 2007, 7, 1786–1799 1 Introduction In the last few years, antibody microarrays are continuously increasing in importance as prospective tools for the func- tional analysis of cellular activity and regulation as well as for diagnosis of disease [1, 2]. A wide range of immobilization [3, 4] and detection [5–7] technologies is now available for a designer of microspot assays. Nevertheless, microarray- based immunoassays, whenever applied to analysis of com- plex specimens, have had only limited success and had to overcome again and again their main hurdle, the failure to detect low abundant proteins. Hence, the improvement of sensitivity is going to be the most important challenge of this technology nowadays [7, 8]. Correspondence: Dr. Wlad Kusnezow, Division of Functional Ge- nome Analysis, DKFZ, Im Neuenheimer Feld 580, D-69120 Heidel- berg, Germany E-mail: [email protected] Fax: 149-6221-424 687 Abbreviations: ALB, human serum albumin; Bio, biotin; GPTS, (3-glycidoxypropyl)trimethoxy-silane; Flu, fluorescein; IFNG, interferon-gamma; IL, interleukin; KLH, keyhole limpet hemocya- nin; LR, labeling ratio; NHS, N-hydroxysuccinimidyl ester; PBMC, peripheral blood mononuclear cells; PSA, prostate specific anti- gen; rSI, relative signal intensity; rS/N ratio, relative signal-to- noise ratio; SI, absolute signal intensity; S/N ratio, absolute sig- nal-to-noise ratio; TG, thyroglobulin; TF , transferrin; ULS, Univer- sal Linkage System DOI 10.1002/pmic.200600762 © 2007 WILEY-VCH Verlag GmbH & Co. KGaA, Weinheim www.proteomics-journal.com
-
Upload
independent -
Category
Documents
-
view
2 -
download
0
Transcript of Antibody microarray-based profiling of complex specimens: systematic evaluation of labeling...

RESEARCH ARTICLE
Antibody microarray-based profiling of complex
specimens: systematic evaluation of labeling strategies
Wlad Kusnezow1, Virryan Banzon1, Christoph Schröder1, René Schaal1,Jörg D. Hoheisel1, Sven Rüffer1, Petra Luft2, Albert Duschl2 and Yana V. Syagailo1
1 Division of Functional Genome Analysis, Deutsches Krebsforschungszentrum (DKFZ), Heidelberg, Germany2 Institute of Chemistry and Biochemistry, University of Salzburg, Salzburg, Austria
Antibody microarrays have often had limited success in detection of low abundant proteins incomplex specimens. Signal amplification systems improve this situation, but still are quite la-borious and expensive. However, the issue of sensitivity is more likely a matter of kinetically ap-propriate microarray design as demonstrated previously. Hence, we re-examined in this study thesuitability of simple and inexpensive detection approaches for highly sensitive antibody micro-array analysis. N-hydroxysuccinimidyl ester (NHS)- and Universal Linkage System (ULS)-basedfluorescein and biotin labels used as tags for subsequent detection with anti-fluorescein andextravidin, respectively, as well as fluorescent dyes were applied for analysis of blood plasma.Parameters modifying strongly the performance of microarray detection such as labeling condi-tions, incubation time, concentrations of anti-fluorescein and extravidin and extent of proteinlabeling were analyzed and optimized in this study. Indirect detection strategies whether basedon NHS- or ULS-chemistries strongly outperformed direct fluorescent labeling and enableddetection of low abundant cytokines with many dozen-fold signal-to-noise ratios. Finally, partic-ularly sensitive detection chemistry was applied to monitoring cytokine production of stimulatedperipheral T cells. Microarray data were in accord with quantitative cytokine levels measured byELISA and Luminex, demonstrating comparable reliability and femtomolar range sensitivity ofthe established microarray approach.
Received: July 13, 2006Revised: January 24, 2007
Accepted: March 2, 2007
Keywords:
Antibody microarray / Detection strategies / Microspot kinetics / Protein profiling /Sensitivity
1786 Proteomics 2007, 7, 1786–1799
1 Introduction
In the last few years, antibody microarrays are continuouslyincreasing in importance as prospective tools for the func-tional analysis of cellular activity and regulation as well as fordiagnosis of disease [1, 2]. A wide range of immobilization [3,4] and detection [5–7] technologies is now available for adesigner of microspot assays. Nevertheless, microarray-based immunoassays, whenever applied to analysis of com-plex specimens, have had only limited success and had toovercome again and again their main hurdle, the failure todetect low abundant proteins. Hence, the improvement ofsensitivity is going to be the most important challenge of thistechnology nowadays [7, 8].
Correspondence: Dr. Wlad Kusnezow, Division of Functional Ge-nome Analysis, DKFZ, Im Neuenheimer Feld 580, D-69120 Heidel-berg, GermanyE-mail: [email protected]: 149-6221-424 687
Abbreviations: ALB, human serum albumin; Bio, biotin; GPTS,(3-glycidoxypropyl)trimethoxy-silane; Flu, fluorescein; IFNG,interferon-gamma; IL, interleukin; KLH, keyhole limpet hemocya-nin; LR, labeling ratio; NHS, N-hydroxysuccinimidyl ester; PBMC,peripheral blood mononuclear cells; PSA, prostate specific anti-gen; rSI, relative signal intensity; rS/N ratio, relative signal-to-noise ratio; SI, absolute signal intensity; S/N ratio, absolute sig-nal-to-noise ratio; TG, thyroglobulin; TF, transferrin; ULS, Univer-sal Linkage System
DOI 10.1002/pmic.200600762
© 2007 WILEY-VCH Verlag GmbH & Co. KGaA, Weinheim www.proteomics-journal.com

Proteomics 2007, 7, 1786–1799 Protein Arrays 1787
The current generation of successful and sensitive anti-body microarray applications for protein profiling usesmostly sandwich assay designs and strong signal generationsystems by rolling circle amplification (RCA) or resonancelight scattering particles (RLS) [6, 9–11]. While such systemswere demonstrated to be useful for microarrays with tensand even up to a few hundreds of antibody spots, they arestill difficult to apply for assays with a significantly highercontent, like a 750-feature microarray published by us lastyear [8]. One problem is the need to find an equivalentnumber of matched specific and often rare secondary anti-bodies. In addition, the cost of such analysis may be hun-dreds of dollars per microarray due to the expense for thelarge number of secondary antibodies required and for thesignal generating systems (see, e.g. RLS-kit; www.invitrogen.com). In summary, these approaches are quite laborious andexpensive, limiting the fast processing of large numbersof samples and thus restricting this technology to a fewspecialized laboratories worldwide.
Investigating antibody microarrays from a physico-chemical point of view, we demonstrated in our previousstudies [8, 12–14] that the main physicochemical limitationof this technology is a strong dependence of microspot reac-tion on mass transport (or diffusion). This results in longincubation times, which may reach hundreds of hours forachieving the thermodynamic equilibrium [13, 14]. The sen-sitivity problem is therefore the issue of a kinetically appro-priate design of microarray experiments, which may improvethe performance of an assay by many orders of magnitude[14]. Therefore, current efforts focused on development ofstrong signal generating systems may not still be decisive inthe context of the sensitivity and reproducibility of this tech-nology [8, 13, 14]. On the contrary, the simpler and cheaper adetection approach, the more suitable it is for high-through-put analysis. In an assay optimized with respect to max-imization of the reaction velocity, sensitivities in the low fM–high aM range could be demonstrated in our recent studies[13, 14], and in fact by using only simple detection strategies(e.g. direct protein labeling with Cy3-NHS).
However, only a few simple detection approaches likelabeling with fluorescent dyes or haptens found applicationin antibody microarray technology. Classical Cy3/Cy5 label-ing, often applied for profiling purposes [15, 16], is anapproach originating from the related DNA microarraytechnology. Streptavidin-biotin (Bio) detection is also fre-quently used in profiling experiments [17–19]. Evaluations ofthe label-based detection strategies in some studies [18, 20]were still quite artificial as only signal intensities (SI)obtained from merely a few antigen-antibody interactionswere analyzed. Therefore, there is a gap in our knowledgecaused primarily by the assumption that such detectionstrategies yield insufficient sensitivity for protein profilingpurposes.
To find an optimal detection strategy and chemistry, dif-ferent Bio and fluorescein (Flu) labels and fluorescent dyesfunctionalized with classical N-hydroxysuccinimidyl ester
(NHS)- or novel Universal Linkage System (ULS™) [21]-reac-tive groups (Fig. 1) were investigated in this study. NHSgroups react covalently with primary amines of proteins (onlysine residues and at the amino terminus). ULS technologyis based on the stable, coordinative binding properties of aplatinum complex to methionines, cysteines and histidines.ULS technology was evaluated for labeling of nucleic acids influorescent in situ hybridization (FISH) and various micro-array technologies [22] as well as for total serum labeling inmicrotiter well plate-based ELISA [23]. Their suitability forantibody microarrays is, however, more ambiguous and isalso investigated here. Upon optimization and analysis ofdifferent detection chemistries, the capability of the mostsuitable and sensitive one was demonstrated on an exampleof a real expression profiling and expression profilesobtained from microarray were matched against quantitativedata gained with classical ELISA and Luminex-system.
Figure 1. General reaction scheme of NHS (A) and ULS (B) label-ing reagents reacting with primary amine and SH-group-con-taining amino acids, respectively. Note that ULS also coordinateswith histidine residues in proteins. R- reporter functional groups,e.g. fluorophores or haptens. AA- other amino acids.
2 Materials and methods
2.1 Materials
All chemicals were purchased from Fluka (Taufkirchen,Germany), Sigma-Aldrich (Munich, Germany) or SDS (Pey-pin, France), unless stated otherwise. Untreated slides werepurchased from Menzel-Gläser (Braunschweig, Germany).Milk powder and (3-glycidoxypropyl)trimethoxy-silane(GPTS) were obtained from Sigma-Aldrich. For the home-made antibody microarray, antibodies against human serumantigens were purchased from the following suppliers: anti-interleukin-1b1 (anti-IL1B), anti-IL6, anti-IL8, anti-IL10,anti-TGFB and anti-prostate-specific antigen (anti-PSA) wereobtained from Acris Antibodies (Hiddenhausen, Germany);anti-IL2, anti-IL4, and anti-thyroglobulin (anti-TG) fromHyTest (Turku, Finland); anti-interferon-g (anti-IFNG), anti-keyhole limpet hemocyanin (KLH), anti-transferrin (TF),
© 2007 WILEY-VCH Verlag GmbH & Co. KGaA, Weinheim www.proteomics-journal.com

1788 W. Kusnezow et al. Proteomics 2007, 7, 1786–1799
Table 1. List of tested labeling substances and their suppliers
Name MW Supplier max./opt. LRa)
Biotin groupDetection: Cy3-labeled extravidin; Abs/Emb): 548/562; MECc): 150 000
Bio-LC-NHS 454.5 Pierce (Rockford, IL, USA) 2–4/0.5Bio-ULS 808.3 Kreatech Biotechnology (Amsterdam, The Netherlands) .8/0.5Bio-PEG4-NHS 588.7 Quanta BioDesign Ltd. (Powel, OH, USA) 1/1Bio-PEG68-NHS 3400 Nektar Therapeutics (San Carlos, CA, USA) 2/1
Fluorescein groupDetection: Dy647-labeled anti-fluorescein; Abs/Em: 653/672; MEC: 250 000
Flu-NHS 473.4 Molecular Probes™-Invitrogen (Karlsruhe, Germany) 4/,4Flu-ULS 764.13 Kreatech Biotechnology .4/.4Flu-PEG68-NHS 3400 Nektar Therapeutics -/-
Direct labeling groupAbs/Em: Cy3 - 548/562; Dy547 - 557/574; Dy647 653/672MEC: Cy3 and Dy547 -150 000; Dy647- 250 000
Cy3-NHS 765.9 Amersham Biosciences (Uppsala, Sweden) 4/2Dy547-NHS 735.8 Dyomics (Jena, Germany) 1/2Dy547-ULS 1089.6 Kreatech Biotechnology .4/0.5Dy547-PEG-ULS ,3000 Kreatech Biotechnology .4/0.5Dy647-ULS 1115.7 Kreatech Biotechnology .2/0.5
a) LR of interest were defined from two points of view: the maximal LR (max.) is the lowest LR enabling to achieve the highest overall SI onarray; the optimal LR (opt.) is defined for the highest overall rS/N ratio obtained in our test system. The maximal LR represents thehighest appropriate label concentration, which may be useful, e.g. for systems with lower sample complexity. The optimal LR wereused in the comparison experiment in Fig. 7.
b) Abs/Em-absorption and emission maxima.c) MEC-molar extinction coefficient in (Mcm)–1.
anti-serum albumin (ALB) as well as antigens such asrecombinant IFNG, KLH and TG from Sigma-Aldrich. Dif-ferent labeling substances were purchased from providers asindicated in Table 1.
2.2 Production of antibody arrays
Homemade epoxysilanized slides were manufacturedaccording to the following protocol. Untreated slides weretreated with 3 M NaOH for 5 min, incubated in freshlyprepared Piranha solution (3:1 ratio of sulfuric acids andhydrogen peroxide, respectively) for 2 h, rinsed four timesin water and derivatized in a 100% GPTS solution atroom temperature for 3 h. After silanization, GPTS-treated slides were washed thoroughly with dichloro-ethane and dried with gaseous N2. The 1x PBS buffersupplemented with 0.5% trehalose was used as spottingbuffer [24]. The antibodies were spotted using an SDDC-2Micro-Arrayer from Engineering Services (Toronto,Canada). After spotting, the slides were incubated at 47Covernight and subsequently blocked for 3 h at room tem-perature in PBST (1x PBS and 0.05% Tween20) supple-mented with 4% of milk powder.
2.3 Sample preparation and processing
Blood plasma obtained from healthy donors was used in theoptimization experiments in this study (Figs. 2–7). Bloodplasma was prepared using BD Vacutainer spray-coated K2
EDTA tubes (BD, Franklin Lakes, NJ, USA) according to themanufacturer’s instructions. Protein concentration in bloodplasma was measured using the NanoOrange protein quan-tification kit (Molecular Probes™-Invitrogen, Karlsruhe, Ger-many) as indicated by the manufacturer. Plasma was sup-plemented with KLH, recombinant IFNG and TG to a finalconcentration of 5 nM each in the incubation solution. To-gether with ALB, these represent the set of high abundantproteins. The remaining antibodies printed on microarrayssuch as anti-IL4, anti-IL2, anti-IL1B and anti-PSA bind lowabundant proteins, which are present in low-pM and middle-fM concentrations in blood [25].
For validation of the established antibody microarraysystem, peripheral blood mononuclear cells (PBMC) wereprepared from buffy coats of healthy donors by densitygradient centrifugation using Ficoll-Paque Plus (Amers-ham, Arlington Heights, IL). After washing two times withRPMI 1640 medium cells were incubated for 1 h in plastictissue-culture dishes at 377C in a humidified atmosphere
© 2007 WILEY-VCH Verlag GmbH & Co. KGaA, Weinheim www.proteomics-journal.com

Proteomics 2007, 7, 1786–1799 Protein Arrays 1789
containing 5% CO2. Nonadherent lymphocytes were col-lected and cultured without or with 100 ng/mL anti-CD3and anti-CD28 (both generous gifts of Novartis, Vienna,Austria), with or without patulin (Sigma-Aldrich) for 48 hin RPMI 1640 1 10% FCS (heat inactivated), 100 U/mLpenicillin and 100 mg/mL streptomycin at 377C in a humi-dified atmosphere containing 5% CO2. The collected cul-ture supernatants from non-stimulated, CD3/CD28- andCD3/CD28/patulin-stimulated lymphocytes were analyzedby microarray containing antibodies against followingcytokines: IL1B, IL2, IL4, IL6, IL8, IL10, IFNG and TGFB1.The levels of IFNG, IL10, IL4, and IL8 were also measuredby classical commercially available ELISA (BD, Belgium).To quantify levels of very low concentrated cytokines suchas IL1B, IL6 and TGFB, the Fluorescent Bead Immuno-assay (Bender MedSystems, Vienna, Austria) based on aLuminex 100 LabMap System (Luminex, Austin, TX, USA)was applied.
2.4 Sample labeling
Sample labeling using NHS-containing substances wasperformed according to a common protocol: diluted serumcontaining 3–5 mg protein/mL was labeled in 0.1 MSodium Bicarbonate solution for 1 h at 47C. Non-reacted dyewas blocked from further reaction by addition of hydroxyl-amine to a final concentration of 1 M followed by 10 minincubation at room temperature. Samples were labeled withULS-containing substances overnight in a hybridizationoven at 377C with continuous stirring in ULS-protein label-ing buffer according to the manufacturer’s instructions(Kreatech Biotechnology BV, Amsterdam, The Netherlands).The reaction was stopped by addition of Kreastop solution.Several concentrations of substances were used for labeling,which are subsequently indicated as “labeling ratio” or LRand were calculated as follows: e.g. LR of 4 means that fourmols of the respective label was used to label one virtualmol of total proteins, the molecular weight of which isassumed for simplicity to be 10 kDa. In other words, tolabel 1 mg of total plasma proteins (corresponding to0.1 mmol of virtual protein), a fourfold higher mol quantityof label substance (0.4 mm) was applied. LR from 0.5 to 8were usually analyzed for every substance, aiming at label-ing a substantial portion of the low-molecular weight pro-teins in plasma (e.g. cytokines between 10 and 30 kDa) evenat the lowest LR used.
Non-reacted fluorescent dyes were separated from thelabeled proteins using PD-10 columns (Sephadex™ G-25,Amersham Biosciences). Bio-containing reagents were sepa-rated, depending on the obtained volume, using Microcon™
YM-10 centrifugal units (maximal volume 500 mL) or Ami-con Ultra 10K device (maximal volume 4 mL) from Millipore(Schwalbach, Germany). Both centrifugal filter devices werealso used to adjust the concentration of labeled serum to4 mg/mL if needed.
2.5 Incubation
Incubation of the microarrays with labeled blood plasmawas performed in Flexiperms (Sigma-Aldrich), microtiterplate well-like incubation chambers, attached to the sur-face of the slides with double adhesive tape. The incuba-tion solution (300 mL) was incubated at room temperatureusing a SlideBooster (Advalytix, Brunnthal, Germany)about 7 h, if not stated otherwise. After incubation of themicroarrays with Bio- or Flu-containing substances, theslides were washed four times (5 min each)with PBST andincubated for 1 h with 10 nM extravidin (Sigma-Aldrich)labeled previously with Cy3 or 40 nM anti-Flu-DY-647(Kreatech Biotechnology BV) also in the SlideBooster.Finally, the slides were washed five times (5 min each)with PBST. Slides incubated with plasma, which waslabeled with dyes from the group of direct labels (Table 1),were washed six times (5 min each) with PBST. All slideswere centrifuged 10 min at 1500 rpm to dry.
The antibody microarray system used here has the samedesign parameters as described previously in [13, 14], so thatmany quantitative reaction characteristics, such as diffusioncoefficients, mass-transport constants, binding-site density,reaction durations, etc. can be obtained for our assay from[13, 14].
2.6 Scanning and data analysis
Fluorescence signals were recorded using a ScanArray5000 unit (Packard Biosciences, Billerica, MA, USA)and analyzed with the GenePix software package (AxonInstruments, Union City, CA, USA). The results werestored and managed in an appropriate Microsoft Accessdatabase. The complete dataset analyzed consists of morethan 8000 records, including signal intensities and sepa-rately measured background signals, both obtained frommore than 300 individual arrays scanned at various scan-ner adjustments. All data points in this work represent anaverage of three-to-four individual measurements. Signal-to-noise (S/N) ratio was defined as signal intensity (SI) inproportion to mean background measured on arrays be-tween spots by a special grid. Only spots with absolutesignal-to-noise (S/N) ratio of more than 2 were includedin the analysis. Arrays with less than seven such spots (ofnine altogether) were excluded from the analysis andgraphical presentation.
When trying to compare slides incubated with differentlytreated samples, we found it unpractical and mathematicallyincorrect to present the averages from SI or S/N ratiosobtained for very different antigen-antibody pairs on a chip,the way it is usually done. The contribution of particular SIor S/N ratios to the average values differs by many orders ofmagnitude and does not allow estimating the actual impactof the parameter of interest on the overall microarray perfor-mance. To avoid this and to bring absolute values obtainedfrom different antibody-spots on one scale, all data presented
© 2007 WILEY-VCH Verlag GmbH & Co. KGaA, Weinheim www.proteomics-journal.com

1790 W. Kusnezow et al. Proteomics 2007, 7, 1786–1799
in Figures below were converted into relative, normalizedform.
Absolute SI or S/N ratio (Sijk) obtained for an i-antigen-antibody pair at j-parameter of interest on k replicate arraywere first normalized against the corresponding mean
values (1N
XN
n¼1
Sijk) calculated from the total number of i-sig-
nals (N) within a group of tested parameters (time, labels,LR) for a particular antigen-antibody pair. For example, allabsolute SI, which were obtained on IFNG-spots at differentincubation times or for different LR, were divided by themean value determined from these absolute SI. Subse-quently, the obtained values for K-number of array replicateswithin j-parameter of interest were averaged out. More pre-cisely, the calculation was done according to the followingequation:
Sij ¼1K
XK
k¼1
NSijk
PN
n¼1Sijk
0
BBB@
1
CCCA (1)
where Sij, which is subsequently indicated in the text asrSI or rS/N ratio, is the mean of relative values for i-anti-body at j-parameter calculated from K-number of arrayreplicates. For example, if the substance X was used forplasma labeling at LR 1, 2, 4 and 8 (j1, j2, j4 and j8) andevery plasma sample was incubated on three single spottedarrays (k1, k2 and k3) containing nine antibodies, then K = 3for every j-parameter and N = 12 for every i-antibody. Todetermine the impact of parameter of interest on the overallarray performance, Sij values were averaged out over allantibodies or
Sj ¼XI
i¼1
Sij�
I, (2)
where Sj is the mean of relative values at j-parameter and I isthe total number of different antibodies (I = 9 in exampleabove). Subsequently, Sj is indicated as overall rSI or overallrS/N ratio.
To allow comparison between different antibodies Sij
and to obtain consequently proper Sj values, Sijk for anantibody used in the analysis have to be present at alltested parameters. Therefore, in case that SI were missingfor a parameter, the whole row of the respective antigen-antibody pair or alternatively this parameter were exclud-ed from calculation. As will be demonstrated below sucha presentation approach provides proper analytical valuesas well as an insight into the process influenced by theanalyzed parameter. In our opinion, it can also be usedfor analysis of a variety of multiple other factors influen-cing the performance of a complex microarray assay (seegraphical demonstration of this normalization method inSupporting Information).
3 Results
3.1 Experimental design
The assay used here, which was kinetically investigatedand designed with respect to maximization of reactionrates on spots, results in strong and reproducible develop-ment of SI as demonstrated for IFNG, TG and KLH anti-gen-antibody pairs in our previous studies [13, 14]. Assess-ment of performance in a profiling experiment especiallyin the case of complex samples is a more difficult case,since it is performed with a multitude of interactions hav-ing unknown regime, velocity and duration of reaction aswell as an unknown labeling extent of particular antigens.To avoid some potential fortuitousness in results andexperimental interpretations, three experimental pointswere stipulated prior to analyzing detection approaches.(i) Two sets of antigen-antibody pairs for low (IL2, IL4,IL1B and PSA) and high (ALB, TG, TF, KLH and IFNG)abundant proteins were chosen for microarray constructionto encompass two limits in bulk of interactions occurringwhile analyzing in a complex sample very long lasting andquickly saturated reactions, respectively. (ii) Kinetic behav-ior of these antigen-antibody interactions was analyzed fordifferent detection approaches (see Section 3.3). (iii) Theobtained data were analyzed and presented in relativeterms enabling us to quantify and to compare the impactof parameters of interest on the whole array and withoutrelation to a particular antigen-antibody pair (see also Sup-porting Information).
3.2 Optimization of labeling conditions
To minimize the denaturating effect of hydrophobic labelson proteins in blood plasma, various additives for thelabeling buffer were tested in the first step. Addition ofnon-ionic detergents such as Triton X-100 was found toimprove by manifold S/N ratios obtained on a chip asdemonstrated for NHS-PEG4-Bio and FLU-NHS in Fig. 2.This effect was also observed for different other sub-stances having NHS- or ULS-reactive groups (data notshown). The optimal concentration of Triton X-100 in thelabeling mixture was found to be 1–2%, a concentrationrange often applied for extraction of membrane proteinsusing this reagent [26]. This improvement is primarilyattributed to lower and more even background signal onarrays (twice for NHS-PEG4-Bio and threefold for FLU-NHS). In addition, SI slightly increased and even nearlydoubled in the groups of high and low abundant proteins,respectively. Addition of other detergents such asTween20 influenced the obtained S/N ratios only slightly(data not shown). In addition, continuous stirring oflabeling mixture on a shaker at about 100 rpm resulted ina moderate improvement of the S/N ratios obtained on anarray by about 10–20% (data not shown).
© 2007 WILEY-VCH Verlag GmbH & Co. KGaA, Weinheim www.proteomics-journal.com

Proteomics 2007, 7, 1786–1799 Protein Arrays 1791
Figure 2. Relative change (in %) of SI, background signal and S/Nratios obtained on arrays upon addition of 2% Triton X-100 in thelabeling mixture as compared to the data obtained without thedetergent addition. SI and S/N ratios are separately presented forlow and high abundant proteins. Plasma was labeled with NHS-PEG4-Bio (left panel) and Flu-NHS (right panel).
3.3 Kinetic analysis of test system
To find optimal incubation conditions in terms of sensitivityand reproducibility and to analyze different direct and indi-rect detection strategies from a kinetic point of view, blood
plasma samples were labeled with two Bio-substances, twofluorescent dyes, and FLU-NHS at LR of 1. Arrays were ana-lyzed at different time points from 1 until 17 h of incubation.
The development of SI in the two groups of high and lowabundant proteins was found to be extremely different. Asdemonstrated for the case of labeling with FLU-NHS(Fig. 3A), relative signal intensities (rSI) in the low abundantgroup increased linearly with the incubation time, while forhigh concentration proteins, saturation was reached within1–4 h of incubation. The rSI increased in this case at 17 hcompared to 1 h to various levels, ranging from insignificant(ALB) to about fivefold (IFNG). The same pattern wasobserved for all tested substances. Comparing 17-h versus 1-hincubation, the overall rSI rose about sixfold for Cy3-NHSand Flu-NHS and more than tenfold for DY547-NHS(Fig. 3B). In case of both Bio-containing substances, theoverall rSI increased, however, only by about threefold.Another important parameter in our test assay was thechange in S/N ratio with the time of incubation (Figs. 3C andD). The observed general trend was quite similar for all test-ed substances: The overall relative S/N (rS/N) ratios reachedtheir optimum after 2–5 h of incubation (Fig. 3D), decreas-ing after that by about two- to- fourfold at later time points.However, the low abundant proteins attained their optimumin S/N ratios at significantly later time points (after about 5 hof incubation) (Fig. 3C).
Figure 3. Normalized time-dependent development of rSI (A) and rS/N ratios (C) for nine antigen-antibody pairs (see panel on the graphs)as detected with FLU-NHS/anti-Flu system. Data are calculated according to Eq. (1), where N is the number of all replicates at all time pointsfor a particular antigen antibody pair. Overall rSI (B) and rS/N ratios (D) for five different detection strategies (see panel on the graphs).Equation (2) is used for data calculation. N is the number of all replicates at all time points and for all tested substances for a particularantigen-antibody pair.
© 2007 WILEY-VCH Verlag GmbH & Co. KGaA, Weinheim www.proteomics-journal.com
1792 W. Kusnezow et al. Proteomics 2007, 7, 1786–1799
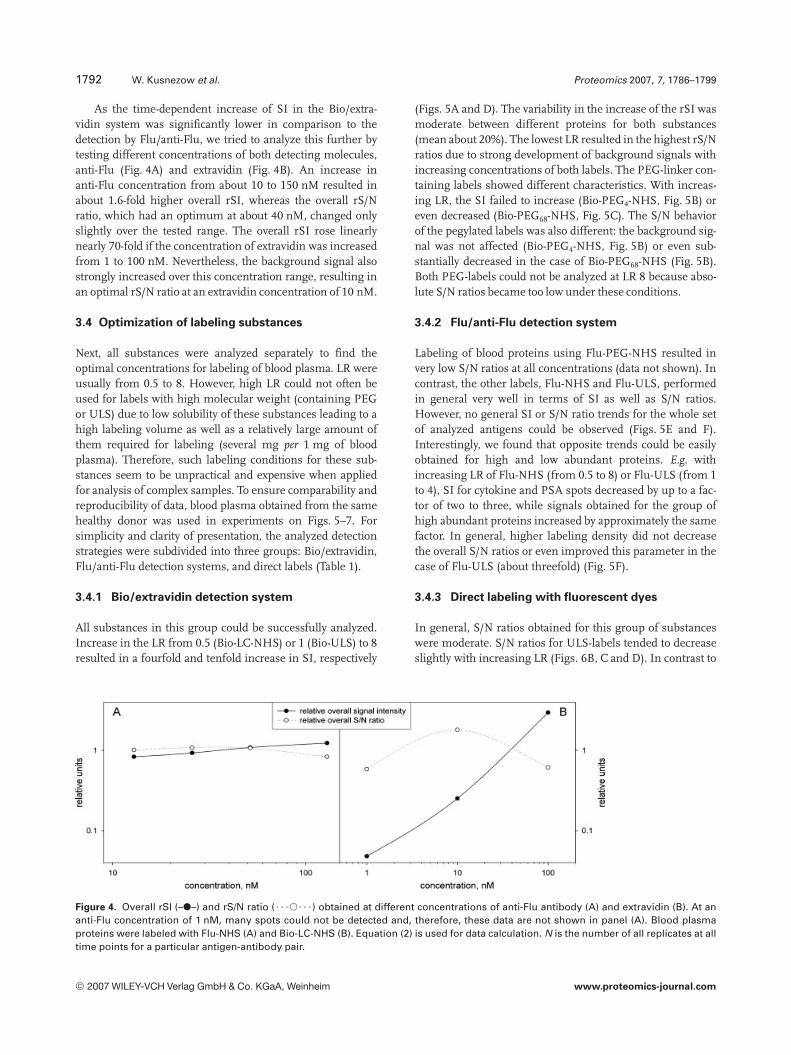
As the time-dependent increase of SI in the Bio/extra-vidin system was significantly lower in comparison to thedetection by Flu/anti-Flu, we tried to analyze this further bytesting different concentrations of both detecting molecules,anti-Flu (Fig. 4A) and extravidin (Fig. 4B). An increase inanti-Flu concentration from about 10 to 150 nM resulted inabout 1.6-fold higher overall rSI, whereas the overall rS/Nratio, which had an optimum at about 40 nM, changed onlyslightly over the tested range. The overall rSI rose linearlynearly 70-fold if the concentration of extravidin was increasedfrom 1 to 100 nM. Nevertheless, the background signal alsostrongly increased over this concentration range, resulting inan optimal rS/N ratio at an extravidin concentration of 10 nM.
3.4 Optimization of labeling substances
Next, all substances were analyzed separately to find theoptimal concentrations for labeling of blood plasma. LR wereusually from 0.5 to 8. However, high LR could not often beused for labels with high molecular weight (containing PEGor ULS) due to low solubility of these substances leading to ahigh labeling volume as well as a relatively large amount ofthem required for labeling (several mg per 1 mg of bloodplasma). Therefore, such labeling conditions for these sub-stances seem to be unpractical and expensive when appliedfor analysis of complex samples. To ensure comparability andreproducibility of data, blood plasma obtained from the samehealthy donor was used in experiments on Figs. 5–7. Forsimplicity and clarity of presentation, the analyzed detectionstrategies were subdivided into three groups: Bio/extravidin,Flu/anti-Flu detection systems, and direct labels (Table 1).
3.4.1 Bio/extravidin detection system
All substances in this group could be successfully analyzed.Increase in the LR from 0.5 (Bio-LC-NHS) or 1 (Bio-ULS) to 8resulted in a fourfold and tenfold increase in SI, respectively
(Figs. 5A and D). The variability in the increase of the rSI wasmoderate between different proteins for both substances(mean about 20%). The lowest LR resulted in the highest rS/Nratios due to strong development of background signals withincreasing concentrations of both labels. The PEG-linker con-taining labels showed different characteristics. With increas-ing LR, the SI failed to increase (Bio-PEG4-NHS, Fig. 5B) oreven decreased (Bio-PEG68-NHS, Fig. 5C). The S/N behaviorof the pegylated labels was also different: the background sig-nal was not affected (Bio-PEG4-NHS, Fig. 5B) or even sub-stantially decreased in the case of Bio-PEG68-NHS (Fig. 5B).Both PEG-labels could not be analyzed at LR 8 because abso-lute S/N ratios became too low under these conditions.
3.4.2 Flu/anti-Flu detection system
Labeling of blood proteins using Flu-PEG-NHS resulted invery low S/N ratios at all concentrations (data not shown). Incontrast, the other labels, Flu-NHS and Flu-ULS, performedin general very well in terms of SI as well as S/N ratios.However, no general SI or S/N ratio trends for the whole setof analyzed antigens could be observed (Figs. 5E and F).Interestingly, we found that opposite trends could be easilyobtained for high and low abundant proteins. E.g. withincreasing LR of Flu-NHS (from 0.5 to 8) or Flu-ULS (from 1to 4), SI for cytokine and PSA spots decreased by up to a fac-tor of two to three, while signals obtained for the group ofhigh abundant proteins increased by approximately the samefactor. In general, higher labeling density did not decreasethe overall S/N ratios or even improved this parameter in thecase of Flu-ULS (about threefold) (Fig. 5F).
3.4.3 Direct labeling with fluorescent dyes
In general, S/N ratios obtained for this group of substanceswere moderate. S/N ratios for ULS-labels tended to decreaseslightly with increasing LR (Figs. 6B, C and D). In contrast to
Figure 4. Overall rSI (–d–) and rS/N ratio (? ? ?s? ? ?) obtained at different concentrations of anti-Flu antibody (A) and extravidin (B). At ananti-Flu concentration of 1 nM, many spots could not be detected and, therefore, these data are not shown in panel (A). Blood plasmaproteins were labeled with Flu-NHS (A) and Bio-LC-NHS (B). Equation (2) is used for data calculation. N is the number of all replicates at alltime points for a particular antigen-antibody pair.
© 2007 WILEY-VCH Verlag GmbH & Co. KGaA, Weinheim www.proteomics-journal.com

Proteomics 2007, 7, 1786–1799 Protein Arrays 1793
Figure 5. rSI and rS/N ratios obtained at different LR for different indirect detection strategies. Labeling substances used are: (A) BIO-LC-NHS, (B) BIO-PEG68-NHS, (C) BIO-PEG4-NHS, (D) BIO-ULS, (E) FLU-NHS and (F) FLU-ULS. Overall rSI and overall rS/N ratios are shown withbrown and black lines, respectively. rSI for the particular proteins is depicted as s for low abundant and u for high abundant proteins (seepanel C). In the case of Flu-containing substances (E and F), overall rSI and rS/N ratios are additionally separated for these two groups: (––)low abundant and (—) high abundant proteins (see panel F). For data calculation, Eq. (1) for data points and Eq. (2) for lines are used. N isthe number of all replicates at all LR for a particular antigen-antibody pair.
this, Dy547-NHS demonstrated saturation of SI as well as anoptimum for S/N ratios at LR of 2 (Fig. 6A). Exceptionallystrong SI increase over the tested concentration range (10–20-fold) was observed in this group for DY547-ULS and
DY547-PEG-ULS, while the signals with NHS-labeled pro-teins increased only by a factor of 3–4. The differences in therelative increase of SI between different proteins were rela-tively low in this group of substances (usually less than 10%).
© 2007 WILEY-VCH Verlag GmbH & Co. KGaA, Weinheim www.proteomics-journal.com

1794 W. Kusnezow et al. Proteomics 2007, 7, 1786–1799
Figure 6. rSI and rS/N ratios obtained at different LR for different direct detection strategies. Labeling substances used are: (A) Dy547-NHS,(B) Dy547-ULS, (C) Dy547-PEG-ULS and (D) Dy647-ULS. Overall rSI and overall rS/N ratios are shown with brown and black lines, respec-tively. rSI for the particular proteins is depicted as s for low abundant and u for high abundant proteins (see panel D). The data were cal-culated in the same way as in Figs. 5A–D.
3.5 Comparison of different detection approaches
and labeling substances
The substances chosen for the next experiment were appliedfor labeling at their optimal LR in terms of S/N ratios(Table 1; Figs. 5 and 6). All labels with long PEG-linkers wereexcluded from the analysis because of much too low absoluteS/N ratios obtained for these substances in previous experi-ments. Cy3-NHS, LR of which was also optimized (data notshown), was used in this experiment as reference substanceat LR of 2.
By far the highest overall rSI on our arrays were obtainedby labeling with DY647-ULS followed by Flu-NHS, Bio-LC-NHS and Bio-PEG4-NHS (Fig. 7A). Some general differencesbetween SI produced by NHS- and ULS-substances wereobserved in our experiments. Dependence of overall rSI onLR for all NHS-labels demonstrated saturation at LR of 1–2or slightly more (Figs. 5 and 6). In contrast, overall rSIobtained for ULS-labels increased nearly proportionally with
increasing LR (Flu-ULS seems to be an exception from thisrule) and still remained many times lower compared toNHS-counterparts at similar LR (cf. Flu-NHS with Flu-ULSboth applied at LR 4, and Bio-LC-NHS with Bio-ULS bothapplied at LR 0.5 in Fig. 7A). The latter effect is mainly at-tributed to the fact that especially the high abundant groupproduced many times lower SI with ULS as compared toNHS, while SI in the low abundant group remained rela-tively high (Figs. 7C and D).
In terms of overall S/N ratios, indirect detection strate-gies outperformed significantly the group of fluorescentlabels (Figs. 7B, C and D) and demonstrated a nearly unde-tectable background signal (Fig. 7C). When using thesedetection approaches, S/N ratios of a few dozens and of acouple of hundreds could be obtained for low and highabundant groups, respectively (Fig. 7D). Interestingly, de-spite relatively low overall rSI, ULS-labels still demonstratedvery high reliability in detection of low abundant antigens(Fig. 7D). The S/N ratios obtained from this group of pro-
© 2007 WILEY-VCH Verlag GmbH & Co. KGaA, Weinheim www.proteomics-journal.com

Proteomics 2007, 7, 1786–1799 Protein Arrays 1795
Figure 7. Comparison of overall rSI (A) and overall rS/N ratios (B) for different labeling substances. SD bars in panels (A) and (B) indicatethe variations between rSI or rS/N ratios obtained for particular proteins ( Sij in Eq. (1)). Equation (2) was used for data calculation in panels(A) and (B). N is the number of all replicates at all labeling strategies used in an experiment for a particular antigen-antibody pair. (C)Pseudo-color images of arrays incubated with plasma labeled with six different substances (see corresponding bars in Fig. 7A). Antibodieswere spotted as follows (from left to right): IL1B, IL4, IL2 in the first row, IFNG, TG, PSA in the second and KLH, TF, ALB in the third row. (D)Grey bars in panel (D) show mean over absolute S/N ratios for the group of high abundant proteins, white bars demonstrate the same pa-rameter as calculated only for four low abundant proteins on the array.
teins, which usually are in the low pM–fM range in plasma,can be considered as an indication for attainable limits ofdetection. From this point of view, Flu-NHS, Bio-ULS, Flu-ULS, and Bio-PEG4-NHS were assigned as the best suitableand most sensitive approaches for labeling and analysis ofthe complex specimens.
3.6 Assessment of reliability and sensitivity of the
established system
In our previous publications, low fM sensitivities, dynamicrange over five order of magnitude as well as good repro-ducibility could be attained in our antibody microarray sys-tem using direct Cy3 labeling [13] and Bio-PEG4-NHS/extra-vidin detection strategy [14]. In particular, Bio-PEG4-NHS-based detection was demonstrated to represent a significant
improvement in comparison to the classical labeling with Cy-dyes [14]. To evaluate reliability and capability of the estab-lished antibody microarrays in real experimental conditions,a selected detection strategy, Flu-NHS/anti-Flu, was appliedto analyze cytokine production by PBMC that were unstim-ulated, stimulated with anti-CD3 and anti-CD28, or withboth antibodies plus patulin. Anti-CD3 and anti-CD28 areroutinely used for activation of T cells for up-regulation ofsecretion of many cytokines. Patulin produced by commonPenicillium and Aspergillus mould species can cause immuno-suppressive effects [27], but it may also enhance immunereactions to environmental allergens. It was shown thatpatulin modulates strongly the level of several T cell-derivedcytokines and skews the Th1/Th2 balance towards Th2 cells,which favors the development of allergies [28, 29]. The samesamples were used for analysis of cytokine profile by means
© 2007 WILEY-VCH Verlag GmbH & Co. KGaA, Weinheim www.proteomics-journal.com

1796 W. Kusnezow et al. Proteomics 2007, 7, 1786–1799
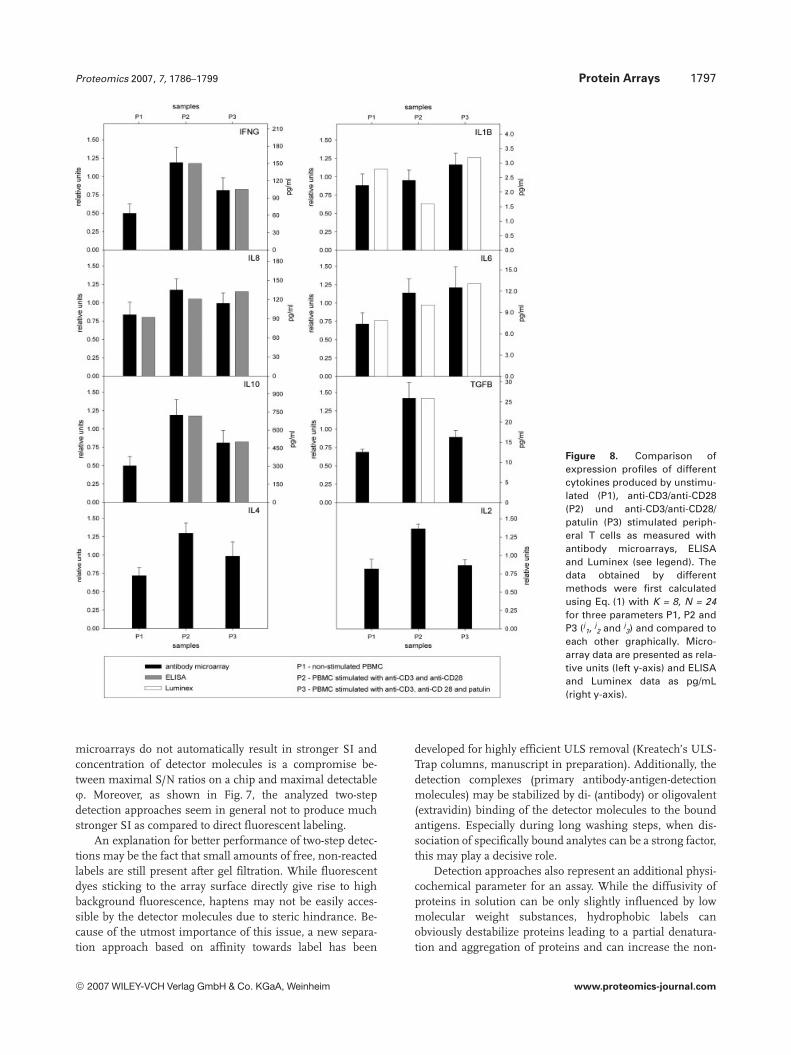
of ELISA, Luminex-system and antibody microarrays (eightrepetitions), which were expanded by additional anti-cyto-kines antibodies against IL6, IL8, IL10 and TGFB (Fig. 8).
The expression profiles obtained matched well betweenantibody microarrays and the other methods. The relativechanges in cytokine levels as obtained from ratios P1/P2, P2/P3 or P1/P3 varied usually within 15%, while, in the case ofIL1B, this variation was stronger at about 30–40%. Unfortu-nately, a row of the analyzed cytokine concentrations close orbelow the LOD of ELISA or Luminex-system and thereforecould not be reliably measured by these methods. Moreover,ELISA completely failed to detect IL4 in any sample. In con-trast to this, all cytokines in all samples could be successfullydetected by antibody microarrays. In accordance with our pre-vious reports, sensitivities in the middle-low fM range can beconcluded on the basis of the quantitative data for the estab-lished microarray approach. The lowest cytokine concentra-tions as measured by antibody microarrays correspond to thefollowing values: in the range of 10 pM for IL8 and IL10, about1 pM for IFNG, 250 fM for IL8, 100–500 fM for TGFB (multi-meric forms) and about 90 fM for IL1B, which was detectedwith lowest S/N ratio in this row of about three- to- fourfold.
4 Discussion
Physicochemical considerations have to be the starting pointfor design and development of practically every facet of anti-body microarray technology. Due to the prolonged and com-plex microspot kinetics, SI as well as S/N ratio as measuredat any time point is only a snapshot of a complex dynamicprocess, depending on affinity parameters, analyte con-centration, mass-transport characteristics, reaction regimeand adsorptive forces in the system. This situation requires apreceding experimental specification of a model microspotassay. Otherwise, it may lead to fortuitous interpretation ofthe experimental results [8].
A detection approach reflects the current state of the overallsignal development on a complex chip. Our results indicatethat SI and S/N ratios strongly changed in a non-linearmanner and in dependence on applied detection strategy atshort incubation times (Fig. 3). In general, microspot reac-tion predominantly develops at the beginning in proportion-ality to
ffiffitp
and changes its regimes to ,t modus at longerincubation times [8, 12, 14]. In addition, spots detecting highabundant proteins reached saturation on our arrays withinthe early hours of incubation. Therefore, the contribution ofparticular interactions to the overall SI strongly changes atinitial time points (Fig. 3A). Labels modifying these initialnon-linear processes lead to a situation where it is difficult toestablish a sequence of “good-bad” substances without rela-tion to the time parameter (Fig. 3B). In contrast to this, anacceptable consistency in the row best-worst-case scenariocould be observed at much longer incubation time. There-fore, incubation of about 5–10 h seems to be a good com-
promise, enabling to obtain good reproducibility as well as todetect all proteins with high S/N ratios.
Similarly to antigen-antibody binding on the spot, the inter-action of detector molecules (e.g. extravidin or anti-Flu anti-body in this study) with bound antigens can be limited in thesame manner by mass transport. Using our theory of masstransport-dependent microspot reaction described in [8, 12–14] a simple relation can be derived for the concentration ofdetector molecules (Ld) required to detect a certain fractionaloccupancy of antibodies by analyte molecules (f):
Ld ¼prRj4Dt
(3)
where D is diffusion coefficient of detector molecules incm2/s (or effective diffusion coefficient in the case of stir-ring), t is the incubation time during the detection step in s,r is the density of binding sites on a spot in mol/cm2 and R isthe spot radius in cm. It has to be emphasized that Eq. (3) isonly valid if the following conditions are true: (i) the reactionoccurs in mass-transport limit or kþ � 4D= prjRð Þ, wherek1 is the association rate constant of the detector moleculesin cm3/(mol6s); (ii) the dissociation of the bound analytemolecules is insignificant; (iii) Ld do not decrease because ofthe nonspecific adsorption on surface; (iv) Ld�Kd, where Kd
is the binding affinity constant of the detector molecule in M(e.g. extravidin 10–15 M). The latter point ensures the funda-mental possibility to detect all bound antigens according tothe law of mass action. Taking now parameters from ourprevious publication as D = 10-7cm2/s, r = 11-11 mol/cm2 [14]and assuming R = 0.01cm, j = 1 and t = 3600 s (1 h), oneneeds Ld < 220 nM to be able to detect all bound analytemolecules on a saturated spot. In general, using any realisticparameters, at least some dozens or even many hundredsnM concentration of the detector molecules would be neededaccording to Eq. (3).
Consequently, the complete conversion of bound analytemolecules into SI can be supposed only for non-saturatedspots using realistic optimal concentrations of detector mole-cules. Assuming the same parameter as above, j-value wouldbe in the range of j�0.1 in our experiments (few dozensnM), while the typical concentration of secondary antibodiesin the literature of about 0.6 nM (0.1 mg/mL) [6, 10, 30] wouldenable to detect properly only spots with about j�0.001. Inaddition, a significant or even proportional to Ld change of SIcould be expected as found in the experiment shown inFig. 4. This effect may be additionally strengthen by a strongenergy of nonspecific adsorption of the detector molecules asknown, e.g. for streptavidin and its derivatives [31] (Fig. 4B).In accordance with our data, strong dependence of the gen-erated SI on streptavidin concentration was also observed forthe case of RP microarray [32]. It has to be emphasized thatthe maximal detectable j-value may dramatically decrease, ifother prerequisites for successful binding of detector mole-cules listed above are not fulfilled. Of note, and as a con-sequence, multi-step detection approaches as applied for
© 2007 WILEY-VCH Verlag GmbH & Co. KGaA, Weinheim www.proteomics-journal.com
Proteomics 2007, 7, 1786–1799 Protein Arrays 1797
Figure 8. Comparison ofexpression profiles of differentcytokines produced by unstimu-lated (P1), anti-CD3/anti-CD28(P2) und anti-CD3/anti-CD28/patulin (P3) stimulated periph-eral T cells as measured withantibody microarrays, ELISAand Luminex (see legend). Thedata obtained by differentmethods were first calculatedusing Eq. (1) with K = 8, N = 24for three parameters P1, P2 andP3 (j
1,j2 and j
3) and compared toeach other graphically. Micro-array data are presented as rela-tive units (left y-axis) and ELISAand Luminex data as pg/mL(right y-axis).
microarrays do not automatically result in stronger SI andconcentration of detector molecules is a compromise be-tween maximal S/N ratios on a chip and maximal detectablej. Moreover, as shown in Fig. 7, the analyzed two-stepdetection approaches seem in general not to produce muchstronger SI as compared to direct fluorescent labeling.
An explanation for better performance of two-step detec-tions may be the fact that small amounts of free, non-reactedlabels are still present after gel filtration. While fluorescentdyes sticking to the array surface directly give rise to highbackground fluorescence, haptens may not be easily acces-sible by the detector molecules due to steric hindrance. Be-cause of the utmost importance of this issue, a new separa-tion approach based on affinity towards label has been
developed for highly efficient ULS removal (Kreatech’s ULS-Trap columns, manuscript in preparation). Additionally, thedetection complexes (primary antibody-antigen-detectionmolecules) may be stabilized by di- (antibody) or oligovalent(extravidin) binding of the detector molecules to the boundantigens. Especially during long washing steps, when dis-sociation of specifically bound analytes can be a strong factor,this may play a decisive role.
Detection approaches also represent an additional physi-cochemical parameter for an assay. While the diffusivity ofproteins in solution can be only slightly influenced by lowmolecular weight substances, hydrophobic labels canobviously destabilize proteins leading to a partial denatura-tion and aggregation of proteins and can increase the non-
© 2007 WILEY-VCH Verlag GmbH & Co. KGaA, Weinheim www.proteomics-journal.com

1798 W. Kusnezow et al. Proteomics 2007, 7, 1786–1799
specific adsorption energies of proteins on surface. Experi-mental evidence of this is the increased background signal.As a result, these processes may significantly reduce theconcentration of reactive analyte molecules as well as reac-tion rates on spots (for details of the reaction mechanismssee [8, 14]). These factors may contribute to the manifolddifferences of SI obtained for labels with comparable reac-tivity and molecular extinction coefficients (Fig. 7, cf. Dy647-ULS and Dy547-ULS).
Preservation of protein stability is, therefore, a crucialprecondition and is mostly the result of empirical optimiza-tion. Independent of label used, non-ionic detergents such asTriton X-100 in the labeling buffer seem to affect more equallabeling conditions due to increased homogenization andsolubility of proteins. This may prevent local over-labelingeffects leading to aggregation of denatured proteins andincreased background signal (Fig. 2). Depending on proteinnature, Triton X-100 binds to the protein surface via hydro-phobic and polar interactions enclosing the protein in amicelle [33]. Disrupting protein-protein/lipid interactions[26], this detergent still preserves and even improves the ac-tivity and stability of proteins [34, 35]. Interestingly, theaddition of Triton X-100 especially improved the detectivity oflow abundant proteins (Fig. 2), which are known to be asso-ciated with high abundant components or even lipid fractionin blood [25, 36, 37]. Most probably, this detergent acts as asort of extracting agent for low abundant plasma proteome.
In addition, PEG-chemistry as applied for labeling isexpected to have a protective effect on proteins. PEG bindsstrongly water molecules (two to three H2O per each ethyl-ene glycol subunit) [38] and creates a sort of hydrophilic coataround protein molecules. However, known properties ofpegylated proteins such as shielding epitopes for recognitionby an antibody [39] and strongly decreased mobility of PEG-modified proteins [40] seem to be responsible for mal-functioning of all long-PEG containing substances in thisstudy. Quite the reverse, Bio-PEG4-NHS performed well incomparison to the long-PEG labels as well as Bio-LC-NHS,indicating that a hydrophilic linker of optimal length maystill have positive effects [41]. In confirmation of this, Geho etal. [32] could significantly improve the S/N ratios on an RPmicroarray by application of a pegylated form of streptavidinin a multi-step detection approach.
Although comparable performance for NHS- and ULS-derivatized substances is attainable, one should still payattention to some fundamental differences between thesetwo labels. Maximal SI are attainable with NHS-labels at anLR of about 1–2 and it is unpractical to use much higher labelconcentrations in view of any performance aspect. ApplyingULS-labels, better performance may be still achieved evenwith higher LR. Obviously, the difference in the observedlabeling efficiency between ULS- and NHS-substances maybe based on the difference in target amino acids: thio-groupsare rarer in proteins than primary amines, and a consider-able part of them resides in the core of large proteins andmay be, therefore, hardly accessible to the ULS-labels.
In general, the detection by hapten labeling using one ofthe four best performing substances (Flu-ULS, Bio-ULS, Flu-NHS and Bio-PEG4-NHS) can be recommended for analysisof complex biological samples, whereas fluorescent dyes arereasonable to use only for samples with low complexity or forinstance for interaction studies. While the presentedapproach is ready for use, optimal values obtained in thisstudy for incubation time, LR, or concentration of detectormolecules can be even corrected up with improvements inincubation buffer composition, surface chemistry or withdecreasing samples complexity. Of note, the blood plasmaused here for optimization is the most complex human pro-teome [25].
Today’s best-performing protein profiling strategies byantibody microarrays are mostly based on sandwich detec-tion systems aiming to amplify strongly the SI [6, 9–11].However, these approaches are more expensive and com-plex, may result in a decrease in the number of detectableantigen molecules as well as increase loss of bound antigenmolecules because of longer detection, and washing steps.The fM sensitivities in a protein profiling experiment areattainable even with simple detection approaches asdemonstrated here as well as in our previous studies [13,14]. Moreover, since the microarray data matched well withprofiles obtained by alternative immunometric methods(Fig. 8), even small differences of 1.5 in antigen concentra-tions can be reliably detected by the established microarrayapproach. Furthermore, the observed expression profiles arealso in good accordance with literature. Under comparableexperimental conditions, stimulation of PBMC with anti-CD3/anti-CD28 is known to increase strongly the produc-tion of IFNG, IL4 [42, 43], IL2 and IL10 [42, 44]; an addi-tional stimulation with patulin results in about 1.5–2-folddecrease of levels of IFNG and IL4 [28].
The suitability of such detection approaches entails a rowof crucial benefits including simplicity, low costs and highspeed of analysis. A larger spreading of this technology,which is today mostly limited to only a few laboratories in theworld, is facilitated by these advantages.
In conclusion, this study provides a comprehensiveinvestigation of various detection strategies. A series of Bioand Flu labels used as haptens with subsequent extravidinand anti-Flu detection, respectively, as well as fluorescent dyeswere applied for analysis of complex specimens on antibodymicroarray. Reproducible analysis of different detectionapproaches could be done only at relatively long incubationtimes because of non-linear development of SI at initial timepoints. In case of Bio/extravidin and Flu/anti-Flu detectionstrategies, interaction of detector molecules did not guaranteethe complete conversion of bound antigen molecules into SI.Probably due to some steric reasons, the two-step detectionstill performed better as compared to labeling with fluores-cent dyes. Labels also influence the reaction rates on spots aswell as nonspecific adsorption of proteins on surface. To pre-vent proteins from destabilization by labeling, addition ofTriton X-100 in labeling buffer was found to improve strongly
© 2007 WILEY-VCH Verlag GmbH & Co. KGaA, Weinheim www.proteomics-journal.com

Proteomics 2007, 7, 1786–1799 Protein Arrays 1799
the obtained S/N ratios especially in case of low abundantproteins. NHS- and ULS-derivatized labels targeting dissim-ilar amino acids significantly differed in labeling efficiency ofindividual proteins, while they still revealed comparable per-formance in detection of low abundant proteins. Flu-ULS,Bio-ULS, Flu-NHS and Bio-PEG4-NHS were identified asmost suitable labels enabling to attain many dozen-folds S/Nratios for low abundant blood cytokines. Finally, analyzingcytokine production by peripheral T cells, microarray expres-sion profiles were found to match well with quantitative dataobtained by ELISA and Luminex as well as with data obtainedfrom literature. It indicates high reliability and fM sensitiv-ities attained in the established antibody microarrayapproach.
We would like to thank Dr. Paul van der Hoeven, Dr. FrankJ. M. Opdam and other co-workers from Kreatech BiotechnologyBV for helpful discussions and critical reading of the manuscript.The work was funded by grants of the German Federal Ministry ofEducation and Research (BMBF) as part of the programs Prote-omics, DHGP and NGFN as well as the MolTools project of theEuropean Commission.
5 References
[1] Kusnezow, W., Hoheisel, J. D., Biotechniques 2002, Suppl,14–23.
[2] Haab, B. B., Mol. Cell. Proteomics 2005, 4, 377–383.
[3] Kusnezow, W., Hoheisel, J. D., J. Mol. Recognit. 2003, 16,165–176.
[4] Kusnezow, W., Pulli, T., Witt, O.,Hoheisel, J. D., in: Schena,M., (Ed.), Protein microarrays, Jones and Bartlett Publishers,Sudbury 2004, pp. 247–284.
[5] Schweitzer, B., Kingsmore, S. F., Curr. Opin. Biotechnol.2002, 13, 14–19.
[6] Saviranta, P., Okon, R., Brinker, A., Warashina, M. et al., Clin.Chem. 2004, 50, 1907–1920.
[7] Espina, V., Woodhouse, E. C., Wulfkuhle, J., Asmussen, H. D.et al., J. Immunol. Methods 2004, 290, 121–133.
[8] Kusnezow, W., Syagailo, Y. V., Goychuk, I., Hoheisel, J. D.,Wild, D. G. Expert Rev. Mol. Diagn. 2006, 6, 111–124.
[9] Rai, A. J., Gelfand, C. A., Haywood, B. C., Warunek, D. J. etal., Proteomics 2005, 5, 3262–3277.
[10] Haab, B. B., Geierstanger, B. H., Michailidis, G., Vitzthum, F.et al., Proteomics 2005, 5, 3278–3291.
[11] Schweitzer, B., Roberts, S., Grimwade, B., Shao, W. et al.,Nat. Biotechnol. 2002, 20, 359–365.
[12] Klenin, K. V., Kusnezow, W., Langowski, J., J. Chem. Phys.2005, 122, 214715.
[13] Kusnezow, W., Syagailo, Y. V., Ruffer, S., Klenin, K. et al.,Proteomics 2006, 6, 794–803.
[14] Kusnezow, W., Syagailo, Y. V., Rueffer, S., Baudenstiel, N. etal., Mol. Cell. Proteomics 2006, 5, 1681–1696.
[15] Hamelinck, D., Zhou, H., Li, L., Verweij, C. et al., Mol. Cell.Proteomics 2005, 4, 773–784.
[16] Sreekumar, A., Nyati, M. K., Varambally, S., Barrette, T. R. etal., Cancer Res. 2001, 61, 7585–7593.
[17] Knezevic, V., Leethanakul, C., Bichsel, V. E., Worth, J. M. etal., Proteomics 2001, 1, 1271–1278.
[18] Li, Y., Reichert, W. M., Langmuir 2002, Published on Web,page est: 9.2.
[19] Madoz-Gurpide, J., Wang, H., Misek, D. E., Brichory, F.,Hanash, S. M. Proteomics 2001, 1, 1279–1287.
[20] Wiese, R. Luminescence 2003, 18, 25–30.
[21] Heetebrij, R. J., Talman, E. G., v Velzen, M. A., van Gijlswijk,R. P. et al., Chembiochem. 2003, 4, 573–583.
[22] van Gijlswijk, R. P., Talman, E. G., Janssen, P. J., Snoeijers, S.S. et al., Expert Rev. Mol. Diagn. 2001, 1, 81–91.
[23] van Gijlswijk, R. P., Talman, E. G., Peekel, I., Bloem, J. et al.,Clin. Chem. 2002, 48, 1352–1359.
[24] Kusnezow, W., Jacob, A., Walijew, A., Diehl, F., Hoheisel, J.D., Proteomics 2003, 3, 254–264.
[25] Anderson, N. L., Anderson, N. G., Mol. Cell. Proteomics2002, 1, 845–867.
[26] London, E., Brown, D. A., Biochim. Biophys. Acta 2000, 1508,182–195.
[27] Fung, F., Clark, R. F., J. Toxicol. Clin. Toxicol. 2004, 42, 217–234.
[28] Wichmann, G., Herbarth, O., Lehmann, I., Environ. Toxicol.2002, 17, 211–218.
[29] Marin, M. L., Murtha, J., Dong, W., Pestka, J. J., J. Toxicol.Environ. Health 1996, 48, 379–396.
[30] Zhou, H., Bouwman, K., Schotanus, M., Verweij, C. et al.,Genome Biol. 2004, 5, R28.
[31] Schetters, H., Biomo. Eng. 1999, 16, 73–78.
[32] Geho, D., Lahar, N., Gurnani, P., Huebschman, M. et al., Bio-conjug. Chem. 2005, 16, 559–566.
[33] Singh, S. K., Kishore, N., J. Phys. Chem. B Condens. MatterMater. Surf. Interfaces Biophys. 2006, 110, 9728–9737.
[34] Choi, N. S., Hahm, J. H., Maeng, P. J., Kim, S. H., J. Biochem.Mol. Biol. 2005, 38, 177–181.
[35] Stanton, J. B., Goldberg, A. F., Hoppe, G., Marmorstein, L. Y.,Marmorstein, A. D., Biochim. Biophys. Acta 2006, 1758, 241–247.
[36] Tirumalai, R. S., Chan, K. C., Prieto, D. A., Issaq, H. J. et al.,Mol. Cell. Proteomics 2003, 2, 1096–1103.
[37] Cho, S. Y., Lee, E. Y., Lee, J. S., Kim, H. Y. et al., Proteomics2005, 5, 3386–3396.
[38] Harris, J. M., Chess, R. B., Nat. Rev. Drug Discov. 2003, 2,214–221.
[39] Bhadra, D., Bhadra, S., Jain, P., Jain, N. K., Pharmazie 2002,57, 5–29.
[40] Kozlowski, A., Harris, J. M., J. Control Release 2001, 72, 217–224.
[41] Caliceti, P., Veronese, F. M., Adv. Drug Deliv. Rev. 2003, 55,1261–1277.
[42] Raziuddin, S., Bahabri, S., Al-Dalaan, A., Siraj, A. K., Al-Sedairy, S., Clin. Immunol. Immunopathol. 1998, 86, 192–198.
[43] Verhoef, C. M., Van Roon, J. A., Vianen, M. E., Glaudemans,C. A. et al., Scand. J. Immunol. 1999, 50, 427–432.
[44] Schwarz, M., Majdic, O., Knapp, W., Holter, W., Immunology1995, 86, 364–371.
© 2007 WILEY-VCH Verlag GmbH & Co. KGaA, Weinheim www.proteomics-journal.com