Cryo-electron microscopy of vitrified specimens
100
Quarterly Review of Biophysics 21, 2 (1988), pp. 129-228 I 29 Printed in Great Britain Cryo-electron microscopy of vitrified specimens JACQUES DUBOCHET 1 , MARC ADRIAN 2 , JIIN-JU CHANG 3 , JEAN-CLAUDE HOMO 4 , JEAN LEPAULT 5 , ALASDAIR W. McDOWALL 6 AND PATRICK SCHULTZ 4 European Molecular Biology Laboratory (EMBL), Postfach 10. 22og, D-6900 Heidelberg, FRG 1. FOREWORD 130 2. INTRODUCTION 132 3. WATER 135 3.1 Water and its bonds 136 3.2 The water molecule 137 3-3 Ice 137 3.4 Liquid water 139 3.5 Aqueous solution 140 3.6 Water in the electron microscope 141 4. FREEZING 145 4.1 Nucleation and growth 145 4.2 Hexagonal ice in solution 147 4.3 Cubic ice 150 4.4 Vitrification 151 4.5 Cryofixation 152 5. SECTIONS 155 5.1 Vitrified sections 155 5.2 Cryo-ultramicrotomy 158 5.3 Cutting artifacts 160 5.4 The sectioning process 163 6. SUSPENSION 165 6.1 Surface tension 165 6.2 Diffusion 167 6.3 Preparation on a supporting film 167 6.4 The bare-grid method 168 6.5 Evaporation 169 6.6 Surface effects 171 Present addresses: ' Centre de Microscopie Electronique (CME), 27 Rue du Bugnon, CH-105 Lausanne; 2 Laboratoire Europeen de Biologie Moleculaire, I.L.L. 156X; F-38042 Grenoble Cedex; ' The Institute of Biophysics, Academica Sinica, Peking, China; 4 Institut de Biochimie, n Rue Humann, F-67000 Strasbourg; 5 Centre de Genetique Moleculaire, C.N.R.S., F-9H90 Gif/Yvette; 6 Howard Hughes Medical Institute, Health Science Centre, 5323 Harry Hines Blvd. MY5-310, Dallas, Texas 75235- 9050, USA. 5 . QRB 21
-
Upload
khangminh22 -
Category
Documents
-
view
1 -
download
0
Transcript of Cryo-electron microscopy of vitrified specimens

Quarterly Review of Biophysics 21, 2 (1988), pp. 129-228 I 29Printed in Great Britain
Cryo-electron microscopy of vitrifiedspecimens
JACQUES DUBOCHET1, MARC ADRIAN2, JIIN-JU CHANG3,JEAN-CLAUDE HOMO4, JEAN LEPAULT5,ALASDAIR W. McDOWALL6 AND PATRICK SCHULTZ4
European Molecular Biology Laboratory (EMBL), Postfach 10. 22og, D-6900 Heidelberg, FRG
1. FOREWORD 130
2. INTRODUCTION 132
3. WATER 135
3.1 Water and its bonds 1363.2 The water molecule 137
3-3 Ice 1373.4 Liquid water 1393.5 Aqueous solution 1403.6 Water in the electron microscope 141
4. FREEZING 1454.1 Nucleation and growth 1454.2 Hexagonal ice in solution 1474.3 Cubic ice 1504.4 Vitrification 1514.5 Cryofixation 152
5. SECTIONS 155
5.1 Vitrified sections 1555.2 Cryo-ultramicrotomy 1585.3 Cutting artifacts 1605.4 The sectioning process 163
6. SUSPENSION 165
6.1 Surface tension 1656.2 Diffusion 1676.3 Preparation on a supporting film 1676.4 The bare-grid method 168
6.5 Evaporation 169
6.6 Surface effects 171
Present addresses: ' Centre de Microscopie Electronique (CME), 27 Rue du Bugnon, CH-105Lausanne;2 Laboratoire Europeen de Biologie Moleculaire, I.L.L. 156X; F-38042 Grenoble Cedex; ' TheInstitute of Biophysics, Academica Sinica, Peking, China; 4 Institut de Biochimie, n Rue Humann,F-67000 Strasbourg; 5 Centre de Genetique Moleculaire, C.N.R.S., F-9H90 Gif/Yvette; 6 HowardHughes Medical Institute, Health Science Centre, 5323 Harry Hines Blvd. MY5-310, Dallas, Texas 75235-9050, USA.
5 . QRB 21
130 J. Dubochet and others
7. CRYOSPECIMEN HOLDER I 76
7.1 Heat transfer 1767.2 Electron-beam heating 1787.3 Quantitative estimation 1797.4 Contamination 1797.5 Anticontaminator 1827.6 Stability 1827.7 Other side-entry cryospecimen holders 1847.8 To£ entry 185
8. IMAGE FORMATION 186
8.1 Amplitude contrast 1868.2 Phase contrast 1888.3 i?ea/ image 190
9. BEAM DAMAGE 191
9.1 Electron scattering 192
9.2 The forms of beam damage 1929.3 Mechanisms of beam damage 1959.4 Structural damage 196
10. HOW TO OPERATE 197
10.1 Safety 197
10.2 Bu/& specimens 19810.2.1 Freezing 19810.2.2 Sectioning 200
10.3 Thin layer of vitrified suspension 20210.4 Transfer and observation 207
11. SOME RESULTS 2 l 8
12. REFERENCES 2 l 8
I. FOREWORD
Cryo-electron microscopy of vitrified specimens was just emerging as a practicalmethod when Richard Henderson proposed that we should teach an EMBOcourse on the new technique. The request seemed to come too early because at thatmoment the method looked more like a laboratory game than a useful tool.However, during the months which ellapsed before the start of the course, severalof the major difficulties associated with electron microscopy of vitrified specimensfound surprisingly elegant solutions or simply became non-existent. The coursecould therefore take place under favourable circumstances in the summer of 1983.It was repeated the following years and cryo-electron microscopy spread rapidly.Since that time, water, which was once the arch enemy of all electron-microscopists, became what it always was in nature - an integral part of biologicalmatter and a beautiful substance.
Obviously, the early eighties was the right time for the final development of
Cryo-electron microscopy of vitrified specimens 131
methods for the observation of frozen hydrated specimens. Freeze fracture, freezedrying or freeze substitution had become very successful and popular in theseventies. With these methods, however, freezing is used at the beginning of thepreparation process, but at the end it is always a dry specimen which is observedin the electron microscope. The direct observation of frozen hydrated specimenshad long been advocated by Fernandez Moran. It required, however, the decisivework of Bob Glaeser and Ken Taylor in Berkeley and of Nigel Unwin inCambridge to make it ready for final development. The beginning of the eightieswas also the time when instrument manufacturers succeeded in producing stableand handy cryo-specimen holders and cryo-ultramicrotomes.
Cryo-electron microscopy of thin vitrified films of suspension is now widelyused for high-resolution observation of biological suspensions. Altogether, theresults compare favourably with those obtained by classical methods. This, atleast, can be said for those particles which give good results with classical methods,as, for example, small viruses and their components, or compact macromolecularcomplexes. The comparison favours vitrified specimens in many cases where theclassical methods are in trouble or are difficult to practice, as is, for example, thecase when observing lipid vesicles. Finally, there is a whole class of structureswhich cannot be visualized in dry specimens because they only exist under theaction of forces which are acting in the liquid water. They represent a new fieldof observation for the vitrified state. Besides its advantages in terms of structurepreservation, the thin vitrified film preparation method is easy, rapid andinexpensive. It seems therefore that there is really every reason for it to be usedsystematically in all electron-microscopy laboratories. This, indeed, is our opinionand also the working idea of our laboratory. In practice this means, for examplethat, when a colleague asks us to make a quick observation of some biologicalsolution, we first look at it in the vitrified state. Sometimes it is found useful tocomplement the observation on a negatively stained specimen.
The present section is based on this point of view. It is built on the experienceof the EMBO course of 1983 and of the following years. It is addressed to everyelectron microscopist who wants to use the method as we practice it at theEuropean Molecular Biology Laboratory. It does not require previous knowledgewith cryotechniques and it is intended to provide all the necessary information toimplement the method and to practice it in the daily operation of an electronmicroscopy laboratory. Besides this, experience has shown that the preparation,observation and interpretation of vitrified specimens requires some knowledgeabout water, aqueous solutions and freezing, as well as about beam damage andimage formation. The present article gives a concise presentation of these topicsin a form which, we hope, will be useful to newcomers in cryo-electronmicroscopy.
This article is not intended to be a complete review of cryo-electronmicroscopy, and even less a course on water or aqueous material, but we hope thatit will be a guide for those who want to learn how to work with vitrified specimens.It may also be useful for experienced cryo-electron microscopists who want tocompare their views with those developed in our laboratory during the last nine
5-2

132 J. Dubochet and others
years. In order to bridge the gap with the rest of the literature, we have tried, atthe beginning of each section, to cite authoritative references where detailedcoverage of the various subjects can be found. We apologize to all of those whoseimportant contribution seems to be neglected in our presentation.
It is a special pleasure to express our thanks to Sir John Kendrew, who madeour work on cryo-electron microscopy at EMBL possible. We have a deepgratitude for the support he gave us at the beginning of the project, when we werelearning to deal with water and when the results were meagre, to say the least. Wealso express our thanks to all those - and they are too numerous to be cited hereindividually — who helped, from close or far, during this research. This articlewould not have existed without the suggestion of Richard Henderson. It is notcertain that we should be grateful to him for that, but we can definitely express tohim our thankfulness for the friendly support he gave us all through our work. Wealso express our gratitude to Max Haider for useful comments and suggestions onthe manuscript and to Christine Barber for her competence and legendarypatience in typing and in dealing with the authors. Finally, we thank colleagueswho provided us with documents or unpublished information used in this article.In particular, we thank R. Milligan and G. Vigers for splendid micrographs.
2. INTRODUCTION
Water is a beautiful substance. Its action is everywhere around us and in us. It hasmoulded the earth during geological times and it was the cradle of life. Even now,it is by far the most abundant constituent of living matter. Our body contains 65 %water and the most ' intelligent' part of it, our brain, is all water, except for a fifthof its mass. At the molecular level also, life works in, and with water. The liquidmedium participates directly in many reactions and it provides the necessarymobility for the dynamics which is the essence of life.
However, water has long been neglected in molecular biology. There are goodreasons for this. The two most powerful methods of ultrastructural analysis, X-raydiffraction and electron microscopy, have both neglected water: the first becausethe mobility of water molecules makes them invisible by diffraction of crystallinestructure; the second because liquid water evaporates in the vacuum of themicroscope. The consequence of this systematic bias could well be that ourpresent understanding of biological ultrastructure is focused on rigid structuresand under-emphasizes the dynamics of the biological matter.
In spite of their difficulties with water, electron microscopists have not beenindifferent to it. On the contrary, it even seems probable that during their first fiftyyears of investigation they put more effort into finding out how to deal with waterthan into any other electron-microscopical problem. As we know, the results areremarkable. Biological specimens can now be observed in a surprisingly good stateof preservation even though all their water has been removed. Plastic embeddingor negative staining are, in this respect, admirable methods.
A number of researchers have also tried to overcome evaporation and thuspreserve the hydrated state in the electron microscope. Hydration chambers, inwhich the specimen can be kept in an environment saturated with water vapour,

Cryo-electron microscopy of vitrified specimens 133
have been designed. With their help, and using electron diffraction on catalasecrystals as a test, Parsons and collaborators could show, for the first time, that theatomic structure of biological objects can be preserved in an electron microscope(Parsons, 1974). Unfortunately, the method requires a physical separationbetween the specimen and the rest of the column. This is difficult to realizewithout a severe loss of resolution. In spite of all the efforts, the method has notyet become routine.
Cooling the specimen to a temperature where the evaporation rate of waterbecomes negligible is the other obvious avenue to preserve the hydrated state inthe electron microscope. For nearly thirty years Fernandez-Moran was the activeadvocate of cryo-electron microscopy (Fernandez-Moran, i960, 1985). In practicethe results were mediocre. It required the work of Nigel Unwin and his colleaguesat Cambridge, who introduced a whole new way of thinking towards electronmicroscopy, and which resulted in the now historical article on catalase and purplemembrane (Unwin & Henderson, 1975), and that by Bob Glaeser and theBerkeley group who first quantified beam damage (Glaeser, 1971), to put cryo-electron microscopy on its tracks. The break-through came in 1974, only a fewmonths after Parsons' group publication on catalase in water. Taylor & Glaeser(1974) showed that, in the frozen state, the structure of catalase crystals can bepreserved to atomic resolution. In the following years they succeeded further inobtaining a number of remarkable micrographs showing good contrast andresolution in ice (Taylor & Glaeser, 1976). Nevertheless, cryo-electronmicroscopy was limited by a number of severe technical difficulties and it wasconstantly facing a basic problem, common to all aspects of cryobiology: watercrystallizes upon cooling and ice is very different from liquid water; freezing killscells and organisms and causes severe damage to most biological structures.
The problem of freezing damage is not new, nor is the idea of vitrification(Luyet & Gehenio, 1940), which has now been applied to overcome freezingdamage in cryo-electron microscopy. The idea was proposed by the late FatherB. Luyet, one of the founders of modern cryobiology, towards the end of thethirties. It consists of cooling a liquid so rapidly that its molecules becomeimmobilized before they have time to crystallize. During his whole scientificcareer, Luyet and his excellent collaborators worked towards this goal. They didnot succeed in reaching it, but they accumulated an enormous amount of valuabledata which, till this day, forms the basis for modern cryobiology. With time, theirapproach lost favour because the alternative method, which consists of allowingice crystals to grow, but under controlled conditions, became much moresuccessful after the fortunate discovery of the cryoprotecting effect of glycerol(Polge et al. 1949; historical account in: Wilson, 1979). The result was theenormous development of cryobiology, with its known consequences for stock-farming, food technology and surgery. Perhaps it also had the effect of creditingthe belief that vitrification of pure water or dilute solutions is fundamentallyimpossible. Theoretical arguments were also found in support of this belief(Rasmussen, 1982; Johari, 1977). The abandonment of the vitrification conceptwas also expressed in electron-microscopy literature, where the definition ofvitrification was changed: vitreous became the state in which ice crystals are no
134 J- Dubochet and others
longer perceptible (Riehle, 1968). This is a distressing definition because it turnsthe worst observer into the best vitrifier.
Obviously, Briiggeller and Mayer in Innsbruck and ourselves in Heidelbergwere not sufficiently informed about the difficulty of vitrifying water. The formerfound that micrometre-sized water microdroplets are readily vitrified if they areviolently projected into cryogen (Briiggeller & Mayer, 1980), and we vitrified thinwater layers, obtained by spreading on a support, by immersion in liquid ethane(Dubochet & McDowall, 1981). The vitreous water obtained could becharacterized unambiguously by X-ray diffraction and differential thermalanalysis for the first group and by direct imaging and electron diffraction for thesecond. The reason for this success, when all previous attempts had failed, issimple: cooling speed increases with decreasing sample size and vitrificationbecomes easy when the dimension of the sample reaches the size required forobservation in transmission electron microscopy.
One piece of luck rarely comes alone, but seldom do they come as readily as theydid just after the discovery of vitrification. Within a year, a number of decisiveobservations could be made. In particular it was noticed that a thin uniform layerof solution can be prepared on a carbon support pretreated by glow discharge inamyl amine (Dubochet et al. 1982 c). Some time later it was even found thatsupporting film can be avoided altogether (Adrian et al. 1984). The low contrastinherent to unstained biological specimens in water was thought to represent asevere limitation for cryo-electron microscopy. It turns out that optimal use ofphase contrast overcomes much of this difficulty (Adrian et al. 1984; Lepault &Pitt, 1984). Beam damage is also significantly reduced at low temperature, andwater, which was thought to influence unfavourably the resistance of the specimento the electron beam, was found to have no harmful effect, at least in the range ofelectron dose compatible with high-resolution observations (Glaeser & Taylor,1978; Lepault et al. 1983 a). Finally, it was found that among all the cryo-specimen holders and all the devices for manipulating and transferring thevitrified specimens which have been designed, the simplest and least expensivegive the best results (Dubochet et al. 1982 c).
Put together, these findings resulted in a simple and powerful method for high-resolution observation of aqueous solution, provided it does not contain too manylarge particles and is not too viscous. With some variations it is now used in manylaboratories for the observation of a large number of specimens. Two recentreviews focusing on the applications of the method have already been published(Chiu, 1986; Stewart & Vigers, 1986). Other published works include studies onmicro-emulsions (Dubochet et al. 1984), on clathrin cages and coated vesicles(Vigers et al. 1986 a, b), on enveloped viruses (Vogel et al. 1986; Fuller, 1987;Fuller & Argos, 1987), on the packaging of DNA in bacteriophage heads (Lepaultet al. 1987), on assembly of microtubules (Mandelkow et al. 1986), on actin(Trinick et al. 1986) and myosin filaments (Milligan & Flicker, 1987), and on thestructure of chromosomes and chromatin (Dubochet et al. 1986; McDowall et al.1986).
After the rapid development of 1980-3, the method itself was not significantly

Cryo-electron microscopy of vitrified specimens 135
improved during the next few years. This is perhaps because it provides so manypossibilities for exploring biological structures that most microscopists choose toexploit the method instead of perfecting it. It is certainly not because it is nowcomplete and cannot be further improved. In particular, the fact that in thethin-film method, the particles are always close to a surface has significantconsequences that have hardly been investigated. Image formation in stronglydefocused images and with inelastically scattered electrons is another field thatrequires much more work.
The study of thin films of suspension is not the end of cryo-electronmicroscopy. Sometimes the structure to be observed is damaged when it isprepared in a thin liquid layer. More frequently, the specimen is bulky andimpossible to spread into a thin layer. The only solution in such cases is cryo-ultramicrotomy. It consists in vitrifying the specimen in order to cut it into thinsections and to observe it in the vitrified state. The method exists (McDowallet al. 1983; Dubochet & McDowall, 1984a). It has been applied with success toa number of specimens including bacteria (Dubochet et al. 19836), muscle(McDowall et al. 1984) and culture cells (McDowall et al. 1986). Unfortunatelyit is still limited by severe cutting artifacts (Chang et al. 1983) and by the technicaldifficulty of obtaining good sections. Much more work is needed before it will alsobecome a powerful method in routine use for ultrastructural investigations.
3. WATER
In order to interpret his micrographs and understand how water provides supportand mobility to biological structures, the electron-microscopist needs to knowabout the water molecule, the way it interacts with its neighbours and thestructures they can form all together. This is a difficult subject. It is outlined inthe present chapter, where it is shown how the water molecule defines thetetrahedron which is the basic structure for any further associations. The richpossibilities of arranging this more-or-less deformed tetrahedron are illustratedby the numerous forms of ice and of water clathrates which become valuabledidactical examples. They help one to understand what the much-more-complexstructure of liquid water and aqueous solution could be. More detailed descrip-tions are found in the prolific literature in which the newcomer is faced withthe difficulty of a choice. The series, edited by Felix Franks (1972—82), gives avoluminous description of the whole field in a form which is easily accessible tonon-specialists. The shorter book by Eisenberg & Kauzmann (1969) is an oldclassic. Simple, but very valuable, are the chapters on water in the famoustextbook of L. Pauling, General Chemistry (1970). Recent points of view can befound in conference proceedings (Neilson & Enderby, 1986). Four articles,published in Science by different authors (Narten & Levy, 1969; Frank, 1970;Stillinger, 1980; Stillinger & Weber, 1984) represent an excellent compendium.They give an impressive view of the evolution of the concepts during the last twodecades.

136 J. Dubochet and others
3.1 Water and its bonds
Water is an exceptional substance with strange properties, differing significantlyfrom most other substances. Some of these properties are: (a) A negative volumeof melting, meaning that the ordered crystalline state is less dense than the moredisordered liquid, (b) The highest density under normal pressure is reached at4 °C, in the normal liquid range, (c) As compared to its molecular weight, waterhas a high freezing, melting and critical temperature, (d) It has a high surfacetension and a high dielectric constant, (e) Its viscosity increases with pressure. (/)It forms at least ten solid polymorphs, including those existing under highpressure. All these properties are more or less directly related to the strong dipolemoment and the hydrogen bonding properties of the molecule.
The hydrogen bond is that specific attraction that exists between electro-negative elements such as nitrogen, oxygen or fluorine and hydrogen when thelatter is covalently bonded to another electro-negative atom. It is stronglydirectional in the prolongation of covalent bond joining the hydrogen atom and itselectro-negative neighbour. Its energy is of some 10-20 kj/mol, which makes it'strong among the weak bonds' of chemistry. Table 1 summarizes this situation.In practice, this means that one hydrogen bond is strong enough to hold twoparticles together, but in the human time-scale it is frequently broken by thermalagitation.
For most molecular biologists, van der Waals forces are strong repulsive forcesacting at very short distances. For physical chemists, however, they are weakattractive forces acting over long distances. The former view is correct if all theinteractions of the order of kT are neglected. This approximation may work wellfor describing solid structures, but it renders an understanding of the liquid stateor of the equilibrium of colloid solutions very difficult. By definition, van derWaals forces are dipolar interactions (Parsegian, 1975). They include thedispersion forces due to quantum fluctuation of atomic charges and therefore canalso act on molecules which are non-polar per se. At short range a small dipole isgenerally represented by a Lennard-Jones potential of the form V = ar~12-br~6, inwhich r is the distance and a and b are adjustable parameters. When the effect ofmany dipoles is added, they may result in attractive forces acting over longdistances between surfaces or particles. For example, on two parallel surfacesseparated by a distance in the range of 10 nm, the potential has the form r~y with7 not equal to 6 as for a small dipole but between 2 and 3. Its effect may thereforeextend over a relatively long distance.
Table 1. Typical energy involved in some bonds and in thermal agitation at roomtemperature
Covalent « 400 kj/mol van der Waals « 15 kj/molIonic x 100 kj/mol RT x 25 kj/molHydrogen « 20 kj/mol
Cryo-electron microscopy of vitrified specimens 137
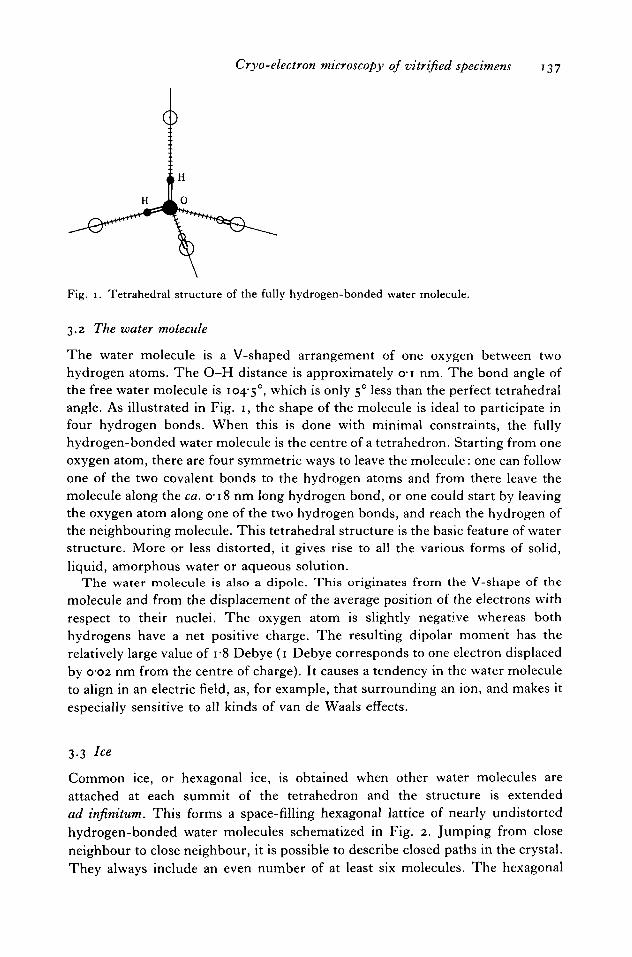
Fig. 1. Tetrahedral structure of the fully hydrogen-bonded water molecule.
3.2 The water molecule
The water molecule is a V-shaped arrangement of one oxygen between twohydrogen atoms. The O-H distance is approximately o-i nm. The bond angle ofthe free water molecule is 104-5°, which is only 5° less than the perfect tetrahedralangle. As illustrated in Fig. 1, the shape of the molecule is ideal to participate infour hydrogen bonds. When this is done with minimal constraints, the fullyhydrogen-bonded water molecule is the centre of a tetrahedron. Starting from oneoxygen atom, there are four symmetric ways to leave the molecule: one can followone of the two covalent bonds to the hydrogen atoms and from there leave themolecule along the ca. o-i8 nm long hydrogen bond, or one could start by leavingthe oxygen atom along one of the two hydrogen bonds, and reach the hydrogen ofthe neighbouring molecule. This tetrahedral structure is the basic feature of waterstructure. More or less distorted, it gives rise to all the various forms of solid,liquid, amorphous water or aqueous solution.
The water molecule is also a dipole. This originates from the V-shape of themolecule and from the displacement of the average position of the electrons withrespect to their nuclei. The oxygen atom is slightly negative whereas bothhydrogens have a net positive charge. The resulting dipolar moment has therelatively large value of i-8 Debye (1 Debye corresponds to one electron displacedby C02 nm from the centre of charge). It causes a tendency in the water moleculeto align in an electric field, as, for example, that surrounding an ion, and makes itespecially sensitive to all kinds of van de Waals effects.
3.3 Ice
Common ice, or hexagonal ice, is obtained when other water molecules areattached at each summit of the tetrahedron and the structure is extendedad infinitum. This forms a space-filling hexagonal lattice of nearly undistortedhydrogen-bonded water molecules schematized in Fig. 2. Jumping from closeneighbour to close neighbour, it is possible to describe closed paths in the crystal.They always include an even number of at least six molecules. The hexagonal
138 jf. Dubochet and others
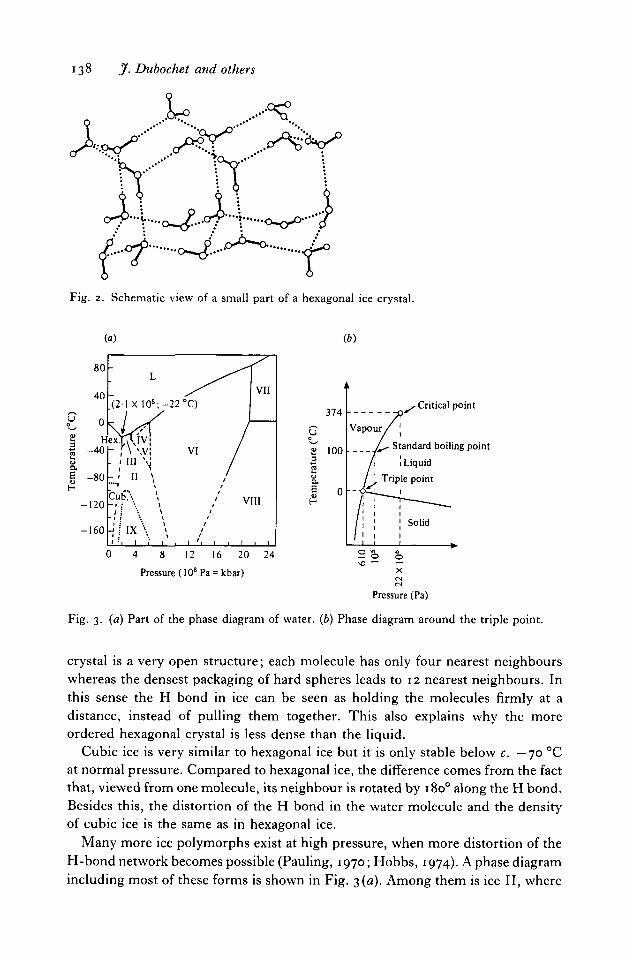
Fig. 2. Schematic view of a small part of a hexagonal ice crystal.
(a) (6)
Critical point
Standard boiling point
1 Liquid
Triple point
4 8 12 16 20 24
Pressure (108 Pa = kbar)
Pressure (Pa)
Fig. 3. (a) Part of the phase diagram of water, (b) Phase diagram around the triple point.
crystal is a very open structure; each molecule has only four nearest neighbourswhereas the densest packaging of hard spheres leads to 12 nearest neighbours. Inthis sense the H bond in ice can be seen as holding the molecules firmly at adistance, instead of pulling them together. This also explains why the moreordered hexagonal crystal is less dense than the liquid.
Cubic ice is very similar to hexagonal ice but it is only stable below c. —70 °Cat normal pressure. Compared to hexagonal ice, the difference comes from the factthat, viewed from one molecule, its neighbour is rotated by 1800 along the H bond.Besides this, the distortion of the H bond in the water molecule and the densityof cubic ice is the same as in hexagonal ice.
Many more ice polymorphs exist at high pressure, when more distortion of theH-bond network becomes possible (Pauling, 1970; Hobbs, 1974). A phase diagramincluding most of these forms is shown in Fig. 3 (a). Among them is ice II, where

Cryo-electron microscopy of vitrified specimens 139
the local tetrahedral symmetry is distorted by a fifth molecule approaching almostas closely as the 4 H-bonded neighbours. This distortion removes the degeneracyof the orientation of the molecules and therefore suppresses the residual oKentropy due, in hexagonal and cubic ice, to the several possible orientations thatthe water molecule can take in the lattice. In ice III and IX the distortion is strongenough to allow the formation of four member rings. The tetragonal symmetry isrestored in ice VII and VIII, which are formed by two interpenetrating networksof cubic ice. The density is therefore close to double that of hexagonal ice. Thehighest conceived high-pressure form, sometimes called ice X, introduces a newlevel of symmetry: the H-bonded water molecules are pushed so close togetherthat the hydrogen atom involved in the bond is at mid distance between theoxygens and is indifferently associated with both oxygens. This form seems tohave been detected at a pressure above 44 GPa (Polian & Grimsditch, 1984).
3.4 Liquid water
Liquid water differs from the various solid forms in the great mobility of itsmolecules. The rotation or the exchange time at room temperature is of the orderof io~12 s. Furthermore, liquid water has the same global symmetry as the gasphase, since it is possible to transform the gas into the liquid without phasetransition, provided the transformation is made at a high enough temperature andpressure to turn around the critical point (Fig. 36). Since the work of Bernal(Bernal & Fowler, 1933) it has been known that the structure of liquid water is alsobased on the tetrahedral nature of the molecule. Some of the H-bonds are,however, broken and the others are more or less distorted. Some non-H-bondedmolecules can therefore 'fall down' between H-bonded molecules, thus increasingthe density of the liquid. With the oversimplified but nevertheless useful modelthat melting is just a matter of H-bond breaking, the comparison of the latent heatof fusion (333 J/g) and of vaporization (2255 J/g) suggests that only 13 % of theH-bonds are broken in the liquid.
The detailed structure of liquid water is still mysterious, but this is certainly notdue to a lack of models. In fact, the history of the structure of water is a long listof models, made to fit some measured properties and generally giving a poordescription of the others. Since the beginning of the seventies rapid progress hasbeen made, thanks to the possibilities of molecular dynamics (MD) with high-speed computers. Nevertheless the quality of a simulation is never better than thechoice of the molecular potential used for the calculation. An outsider is generallyimpressed by the coarse approximations made in these choices. For example, thewell-known ST2 model (Rahman & Stillinger, 1971), which had, and still hasan important role in MD development, simply describes the tetrahedral localsymmetry of the water molecule by two positive and two equal negative chargesplaced at the vertices of a tetrahedron centred at the origin. The ST2 potential isthe sum, limited to the next neighbour molecules, of the coulomb potential due tothese four charges and the Lennart-Jones potential of neon, a spherical atom of thesame charge as H2O.

140 J. Dubochet and others
(a) (6)
^ 0
o l IF ^
Fig. 4. Percolation model of liquid water, (a) Representation of the topological network ofH-bonds between neighbouring molecules, (b) One possible schematic representation of thestate presented in (a). (From Teixeira et al. (1983), with permission.)
At present it is generally accepted that liquid water is best described by someform of the random H-bond network. It is based on the local tetrahedral symmetryof the molecule, so much distorted that the spatial correlation is lost between moredistant molecules. The disorder is thus spread everywhere in the liquid. This isthe opposite of the iceberg model, in which ice-like domains are separated bydisordered regions. The random H-bond network model is not easy to visualize,except for MD simulations, but the percolation model (Stanley & Teixeira, 1980)is an elegant way to represent it. In this topological model, each water moleculeis represented by a point in a two-dimensional square lattice (Fig. 4a). As requiredby the basic tetrahedral symmetry, each molecule has four neighbours. The H-bonds are randomly distributed between all the possible nearest neighbours butsome are left open. Each molecule therefore has a defined probability of beingengaged in 1, 2, 3 or 4 bonds. The binding state of the molecules, as also the waythey are clustered, can be represented by this model. Further MD calculations canthen lead to a useful geometrical description (Geiger et al. 1986).
Clathrate is another arrangement of water molecules, of special didactical valuefor understanding the interaction of water with solutes and the so-calledhydrophobic interaction (Pauling, 1970; Davidson, 1973). With little distortion, asmall number of water molecules can form a cage such that all the H-bondpossibilities of the involved molecules either participate in the formation of thecage or are directed towards the exterior. The smallest of these cages has the shapeof an icosahedron at the vertices of which one more H-bond is pointed towardsthe outside. Other cages may be larger. They can therefore solubilize atoms ormolecules which otherwise would be very hydrophobic. This is, for example, thecase at high pressure, for rare gas and for several small hydrocarbon molecules.In some cases, many cages, containing, for example, one Argon atom, form anH-bonded crystalline network.
3.5 Aqueous solution
The understanding of aqueous solution requires a microscopic description of howthe solute molecules are integrated in the H-bond water network. In general, we
Cryo-electron microscopy of vitrified specimens 141
are far away from reaching this level of knowledge. In particular, the question ofthe role of water in biological systems is still in its infancy and the problem couldbecome even more difficult if, as suggested by much indirect evidence, the volumeof water influenced by — and influencing - the solute is much larger than the fewwater molecules in direct contact with the solute (Clegg, 1982). Nevertheless, hardfacts are emerging from molecular studies, in particular from X-ray data (Finney,1986). Amazingly, it is more often when the solute molecules are not integratedinto the water network that the system is best understood. Clathrate, mentionedabove, is one such case.
The water dipole is the other feature of the molecule which plays a major rolein aqueous solution. Microscopically, the water molecule tends to become alignedby an electric field and to be attracted towards the charge, where the field ismaximum. Water dipoles are therefore associated with ions and they screen theirfield. In most cases the association is not strong enough to establish a fixed bindingbetween the ion and a small number of water molecules, but a dynamic cloud ofmany slightly polarized water molecules is formed around the ion. In the case ofdilute ionic solution, molecular dynamics gives a satisfactory description of thesystem. Macroscopically, the polar nature of the molecules causes water to havethe high dielectric constant of e0 = 80. The famous Debye-Htickel theory, whichforms the basis for the understanding of ionic solutions, is not easy to understandin detail (Berry et al. 1980) but its basic principles and results are simple(Feynman et al. 1965). It is a semi-microscopic theory in the sense that it considerseach ion separately but replaces the water dipoles by a continuous medium inwhich the magnitude of the electrostatic forces are decreased, and their rangeincreased by e0. The major conclusion is that each monovalent ion is surroundedby a counter-charge cloud of decreasing density extending over a distancecharacterized by the Debye length D = {eokT/2noe
2}^ in which n0 represents thecharge density and e the charge of an electron. This effect is of direct relevancefor interpreting the effect of charged liquid interfaces or particles in aqueoussolutions. For monovalent salt solution D is c. 10 nm for 1 mM solution. It wouldbe c. o-3 nm for 1 M solution, but at this high concentration the theory cannot beapplied. More elaborate descriptions will be faced with even greater difficulties.
3.6 Water in the electron microscope
Three kinds of solid water exist at low pressure. They are all easily observed in theelectron microscope. As illustrated in Fig. 5, they can be distinguished by theirgeneral appearance and by electron diffraction. Table 2 gives the position and therelative intensity of the main reflexions seen by electron diffraction. The mostimportant properties of these three forms of ice are summarized in previouspublications (Dowell & Rinfret, i960; Dubochet et al. 1982c) and in the followingparagraphs.
Hexagonal ice is obtained from cooled liquid water or by warming vitreousor cubic ice. The lattice parameters at —160 °C are a0 = 0-449 nm> co ~ ° 7 3 2
nm, density p = 933 kg/m3, and the linear thermal expansion coefficient is
142 J. Dubochet and others
- • * *
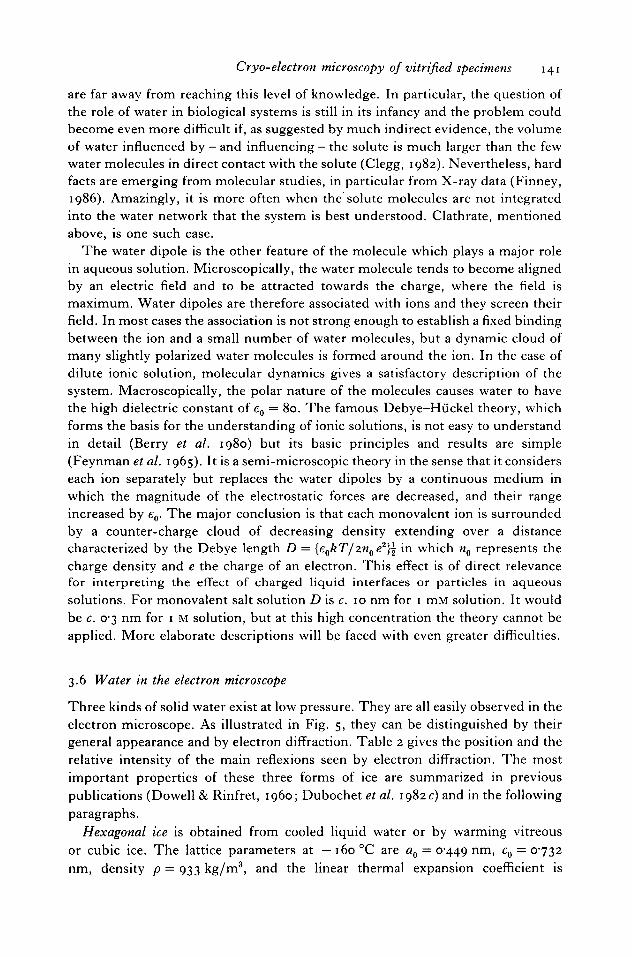
Fig. 5. Typical images and electron difFractograms of three forms of solid water observed inthe electron microscope. The direct images and their diffractograms are all printed at thesame scale, (a) Hexagonal ice obtained by rapid freezing of a water layer on a carbon film.The diffractograms, obtained from other specimens, show the (no) and (101) plane, (b)Cubic ice obtained by warming a layer of vitreous water obtained by condensation. Theshoulder on the ( m ) reflection, possibly indicating the presence of a small amount ofhexagonal ice, is marked by an arrow, (c) Vitreous water obtained in the microscope, bycondensation of vapour on a cold carbon film supporting polystyrene spheres. The shadoweffect demonstrates that the flux of water molecules was anisotropic. (From Dubochet et al.1982c.)
approximately 2 x io~6 °C~1. The aspect of hexagonal crystals depends on theirorigin. They are always relatively large (/tm) and are typically striated by bendcontours when they originate from the freezing of liquid water. They appear asgrains with more or less regular polygonal contours which can be as small as20-30 nm, when they originate from the condensation of atmospheric water
Cryo-electron microscopy of vitrified specimens 143
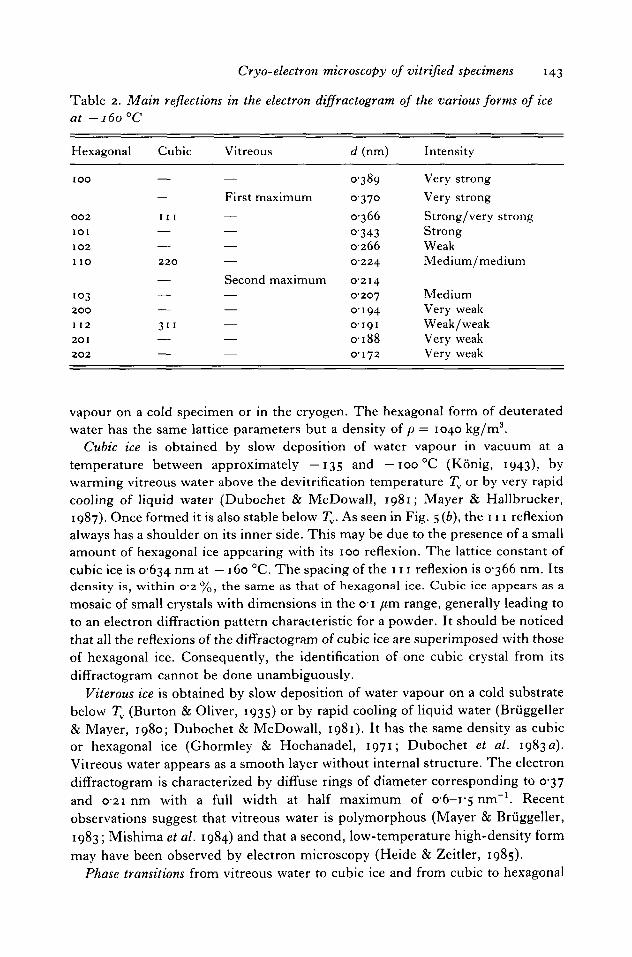
Table 2. Main reflections in the electron diffractogram of the various forms of iceat -i6o°C
Hexagonal
1 0 0
0 0 2
IOI
1 0 2
110
1 0 3
2 0 0
1122 0 1
2 0 2
Cubic
—
—
111
——
2 2 0
—
—
—
3 i i—
—
Vitreous
—
First maximum————
Second maximum—————
d (nm)
0-389
0-370
0-366
O-34302660-224
0-2140-2070-1940-1910-1880-172
Intensity
Very strongVery strongStrong/very strongStrongWeakMedium/medium
MediumVery weakWeak/weakVery weakVery weak
- -v
V
vapour on a cold specimen or in the cryogen. The hexagonal form of deuteratedwater has the same lattice parameters but a density of p = 1040 kg/m3.
Cubic ice is obtained by slow deposition of water vapour in vacuum at atemperature between approximately —135 and —100 °C (Konig, 1943), bywarming vitreous water above the devitrification temperature Tv or by very rapidcooling of liquid water (Dubochet & McDowall, 1981; Mayer & Hallbrucker,1987). Once formed it is also stable below Tv. As seen in Fig. 5(6), the 111 reflexionalways has a shoulder on its inner side. This may be due to the presence of a smallamount of hexagonal ice appearing with its 100 reflexion. The lattice constant ofcubic ice is 0-634 n m a t — 160 °C. The spacing of the 111 reflexion is 0-366 nm. Itsdensity is, within 0-2 %, the same as that of hexagonal ice. Cubic ice appears as amosaic of small crystals with dimensions in the o-i /*m range, generally leading toto an electron diffraction pattern characteristic for a powder. It should be noticedthat all the reflexions of the diffractogram of cubic ice are superimposed with thoseof hexagonal ice. Consequently, the identification of one cubic crystal from itsdiffractogram cannot be done unambiguously.
Viterous ice is obtained by slow deposition of water vapour on a cold substratebelow Tv (Burton & Oliver, 1935) or by rapid cooling of liquid water (Bruggeller& Mayer, 1980; Dubochet & McDowall, 1981). It has the same density as cubicor hexagonal ice (Ghormley & Hochanadel, 1971; Dubochet et al. 1983 a).Vitreous water appears as a smooth layer without internal structure. The electrondiffractogram is characterized by diffuse rings of diameter corresponding to 0-37and 0-21 nm with a full width at half maximum of O'6-i-5 nm"1. Recentobservations suggest that vitreous water is polymorphous (Mayer & Bruggeller,1983; Mishima et al. 1984) and that a second, low-temperature high-density formmay have been observed by electron microscopy (Heide & Zeitler, 1985).
Phase transitions from vitreous water to cubic ice and from cubic to hexagonal
144 J- Dubochet and others
(a) (b)
& 3
Cubic
Vitreous
t= l-58xl014e-°1267
Hexagonal
Cubic
t= l-22X103Oe-°-4657'
i i i i i i
-146 -132 -130 - 8 0
Temperature (°C)
- 6 0 -40
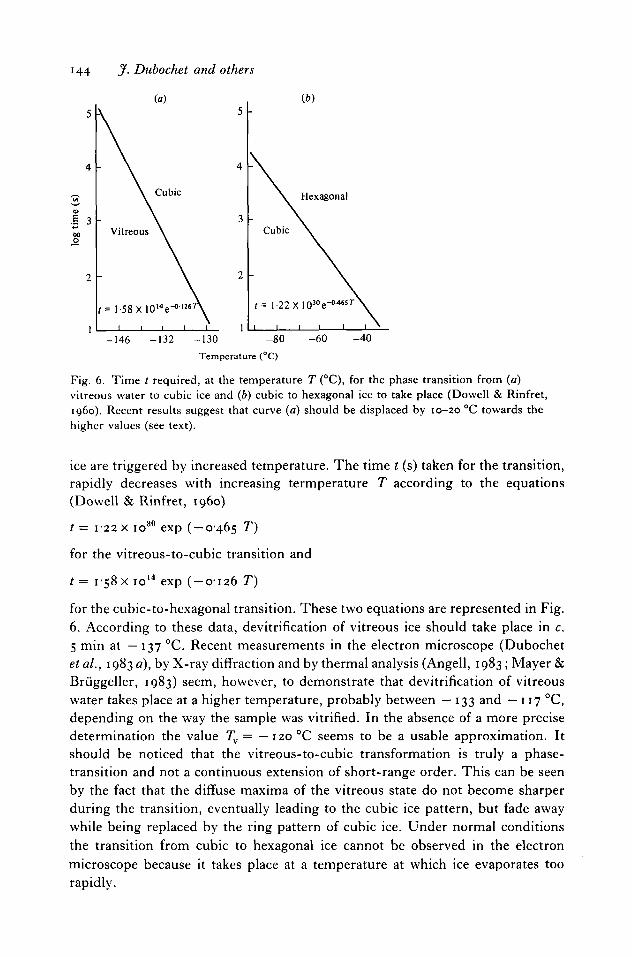
Fig. 6. Time t required, at the temperature T (°C), for the phase transition from (a)vitreous water to cubic ice and (b) cubic to hexagonal ice to take place (Dowell & Rinfret,i960). Recent results suggest that curve (a) should be displaced by 10-20 °C towards thehigher values (see text).
ice are triggered by increased temperature. The time t (s) taken for the transition,rapidly decreases with increasing termperature T according to the equations(Dowell & Rinfret, i960)
t = 1-22 x io30 exp (-0-465 T)
for the vitreous-to-cubic transition and
t= 1-58 x io14 exp ( -0126 T)
for the cubic-to-hexagonal transition. These two equations are represented in Fig.6. According to these data, devitrification of vitreous ice should take place in c.5 min at —137 °C. Recent measurements in the electron microscope (Dubochetetal., 1983 a), by X-ray diffraction and by thermal analysis (Angell, 1983; Mayer &Bruggeller, 1983) seem, however, to demonstrate that devitrification of vitreouswater takes place at a higher temperature, probably between — 133 and — 117 °C,depending on the way the sample was vitrified. In the absence of a more precisedetermination the value Tv = —120 °C seems to be a usable approximation. Itshould be noticed that the vitreous-to-cubic transformation is truly a phase-transition and not a continuous extension of short-range order. This can be seenby the fact that the diffuse maxima of the vitreous state do not become sharperduring the transition, eventually leading to the cubic ice pattern, but fade awaywhile being replaced by the ring pattern of cubic ice. Under normal conditionsthe transition from cubic to hexagonal ice cannot be observed in the electronmicroscope because it takes place at a temperature at which ice evaporates toorapidly.

Cryo-electron microscopy of vitrified specimens 145
(a)
42
0_2
- 4
-6-8
• /
' • / •
r io
"SB£
3CSO-CQ
-140 -100 -60 -20 -120 -115 -110 -105 -100 -95 -90
Temperature (°C)
Fig. 7. (a) Vapour pressure P expressed in Pa (133 Pa = 1 Torr; io5 Pa = 1 bar = 0987 atm)as a function of the temperature in °C. (6) Evaporation of water in perfect vacuum as afunction of the temperature in °C. One mg/m2 corresponds to 1 nm thickness at a density of1 g/cm3.
Evaporation and condensation of ice. In a perfect vacuum the mass flux ofevaporating ice F (expressed in g/m2.s) is
in which P (expressed in Pa) is the vapour pressure at the temperature T. (Thefactor becomes 2-47 x io3 if P is expressed in Torr). The curve P(T) is given inFig. 7 (a) whereas Fig. 7(6) gives the F(P, T) relation. It should be noticed that,in this latter equation, the sublimation rate is calculated on the assumption that theaccommodation coefficient (the probability that a molecule hitting the surface willstick to it) is 1. This was found to be correct in some cases (Davy & Branton,1970), but measurements made directly in the electron microscope lead to a slowersublimation rate (Dubochet et al. 1982 c; Heide, 1982 a). In any case thesublimation rate becomes very small at the devitrification temperature or below(F < 0-03 mg/m2.s corresponding to < 0-03 nm/s at — 120 °C) and we have neverobserved its effect in the electron microscope. In practice this means that, for acryo-microscopist, sublimation of vitreous water is negligible.
4. FREEZING
An excellent general introduction to the field of freezing can be found in Franks(1982), and the review by MacKenzie (1977) elaborates on the problem of rapidcooling of aqueous solutions. The wide range of literature on freezing to preserveviability is reviewed by Mazur (1970, 1984). The new developments resultingfrom the discovery of vitrification are discussed by Angell & Choi (1986) and byFahy et al. (1984).
4.1 Nucleation and growth
The classical nucleation theory (Franks, 1982) is represented schematically inFig. 8. It considers a spherical ice crystal of radius r in water below o °C. The freeenergy, AG, of the system has two components. The first, AGV, favours the growth

146 J. Dubochet and others
AG AG,~r2
Crystal radius
AG = AGV+ AGS
Fig. 8. Classical nucleation theory. The free energy, AG, of a spherical ice crystal of radiusr in water below o °C can be expressed as the sum of volume, AGV, and surface, AGS,contributions. Below r0 the crystal is unstable.
of the crystal. It expresses the fact that water molecules are more stable in thecrystal than in the liquid. It is proportional to the number of molecules inthe crystal and hence to its volume. The second component, AGS, expresses theinstability of the liquid-solid interface and is therefore proportional to the surfaceof the sphere. It favours the dissolution of the crystal. Whatever the constantsdenning the magnitude of these two components, the total free energy always hasthe same general shape: AG increases first, with increasing radius, until it reachesa maximum for r = r0, after which it decreases more and more rapidly. In otherwords, an ice crystal must be sufficiently large before it is thermodynamicallyfavoured. A nucleation event resulting from the favourable but fortuitousarrangement of randomly fluctuating molecules must first take place before thecrystal can grow independently.
The nucleation event in pure water is mysterious and will probably remain sofor a long time. It is also a rare event — at least if it is estimated at the molecularscale. Indeed, the fact that vitrification is possible in cubic micrometre-sizedvolumes, demonstrates that the molecules did not have the time to produce asingle nucleation event during cooling. As the number of molecules involved ismore than io10 and their average time for changing position is io~12 s, the numberof conformations that the system explores during the io~4 s required for coolingis larger than io18; a very large number indeed but still insufficient to producea nucleation event.
In principle, nucleation begins as soon as the water reaches o °C. However,thermal agitation counterbalances most of the thermodynamical potentialfavouring the ordered crystalline state over that of the liquid. A sample of purewater can therefore remain undercooled for a long period of time withoutcrystallizing. At a still lower temperature, call homogeneous nucleation temperature,7Q, crystallization becomes unavoidable. No absolute value can be attributed toTo as it depends on experimental conditions, including the time one is preparedto wait for the observation. In any case, it is very difficult to avoid crystallization
Cryo-electron microscopy of vitrified specimens 147
of pure liquid water below —35 °C. At a still lower temperature the nucleationprobability increases very rapidly unless the sample can be brought below the glasstemperature TG. This is when the viscosity of liquid water becomes so large thatall rearrangements, including the formation of nuclei, are essentially stopped.This takes place when the viscosity is at least io14 N s/m2. In practice, TG can beidentified with the devitrification temperature Tv and a sample which has notcrystallized before it reaches 7^ is vitrified.
In most real situations crystallization of macroscopic samples takes place longbefore To because it is triggered by the phenomenon of heterogeneous nucleation,taking place at temperature TE somewhere between the melting temperature TM
and To. It can be understood as a catalytic-like formation of a nucleus by a seedcontaminant. Seeds of this kind are omnipresent in nature except (a) in the purestwater, (b) in the cleanest atmosphere (as in cloud chambers), (c) when the watervolume is very small (micrometre-sized water droplets in oil; Rasmussen &Mackenzie, 1973) or, to a large extent, (d) in living cells.
Once nucleation has taken place the growth of an ice crystal occurs very rapidly.However, the process releases energy, causing a local heating of the sample. Ascomplete crystallization would correspond to a temperature rise of 80 °C, freezingcannot proceed to an end before the heat is dissipated. Crystal growth is thereforebased on the dynamic equilibrium between heat production and dissipation at thecrystal surface. Recent computer simulations have provided a better insight intothis complicated process (Langer, 1980; Maddox, 1983; Nittmann & Stanley,1986).
4.2 Hexagonal ice in solution
The presence of a solute changes the freezing conditions (Mackenzie, 1977). Asshown in Fig. 9, TM, TE and To are lowered and TG is raised with increasing soluteconcentration. During crystal growth, the solute is rejected from the crystal, thusfurther increasing its concentration in the remaining liquid. The evolution of aslowly cooling liquid, frozen by heterogenous nucleation, can then be representedby the heavy line in the graph of Fig. 9. In the case of extremely rapid cooling, thesample may reach TG before crystallization starts, and become vitrified. Thiscourse of events is represented by the vertical dotted line. Most practical freezingconditions correspond to an intermediate situation, represented by the dashed lineon the figure.
During the rapid growth of an ice crystal there is not enough time for the soluterejected from the crystal to equilibrate its concentration in the residual liquidvolume. A gradient of concentration is built up in front of the ice surface, furtherincreasing the resistance to crystal growth. As illustrated in Fig. 10, this situationfavours the formation of ramified ice crystals which may extend over largevolumes, though no molecules of the solute are displaced by more than the radiusof each ramification. When the observation of frozen hydrated sections becamepossible, it was demonstrated that this crystal shape is usual in frozen biologicalmaterials (Chang et al. 1983; Dubochet & McDowall, 19846). An example is

148 J. Dubochet and others
uo
s
o
-35
120
r.
^ \ ^ ' \ /
'^ /
iii
1 iConcentration solute
Fig. 9. Temperature of a binary solution where the solute does not crystallize duringfreezing. TM, TE, To, TG and Tv, are melting, heterogeneous nucleation, homogeneousnucleation, glass and devitrification temperature, respectively. The heavy line represents thecase of slow cooling; the dashed line a more rapid cooling; the dotted line represents thecase in which vitrification is achieved.
(a) (b)
. ' Solution
Fig. 10. Growth of an hexagonal ice crystal in an aqueous solution. Starting from a flatsurface in a homogeneous solution (a), the rapid growth of the crystal makes the soluteaccumulate in front of the ice surface. This reduces the crystallization speed. Localstatistical fluctuations in growth are amplified by the resistance of the concentrated solutelayer (b). Finally, all the freezable volume may be filled by the ramified network of a singleor a few crystals (c).
shown in Fig. 11. It represents a thin section of a frozen 15 % gelatine solution.A large number of domains are clearly visible. However, electron diffractiondemonstrates that there is only one, somewhat distorted, ice crystal in theobserved field. Each domain therefore represents another ramification of the samecrystal. This observation is reproduced each time water is frozen into hexagonalcrystals in a biological sample. The crystals are then, at least, some micrometresin overall size. In most cases there is only one, or a few, of them per cell.Consequently their size does not depend very much on the cooling speed. Whatvaries, however, is the size of the domains or of the ramifications in the crystal.

Cryo-electron microscopy of vitrifiec specimens 149
Fig. 11. {a) Cryosection of a frozen 15% gelatin solution in wr.ch severe freezing damage isobvious. Some domains from which the solute has been exclutl».-. by the growing ice crystalare marked by arrows, (b) Electon diffractogram of the whole field shown on themicrograph. It represents a single, though distorted hexagonal ice crystal.
They become smaller with increasing cooling speed, thus reducing the structuraldamage suffered by the specimen.
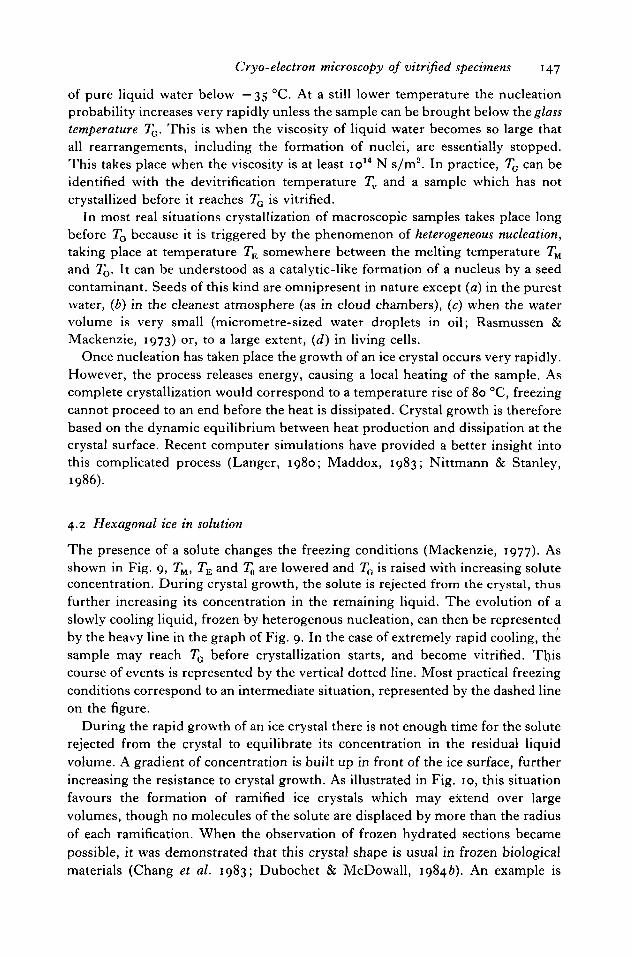
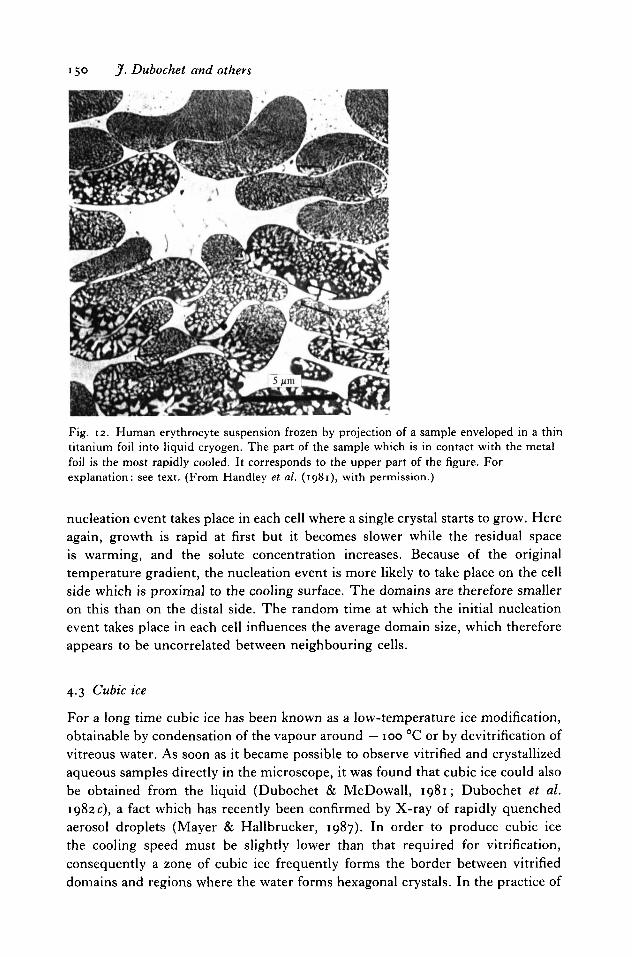
The above description of the freezing process differs from traditionalexplanations. The domains seen in frozen specimens were previously interpretedas being individual ice crystals instead of ramifications from a single large crystal.This misinterpretation is easily understandable because it was based on theobservation of dry remnants of frozen samples in freeze-dried or freeze-substituted preparations. The new understanding allows a more satisfyinginterpretation of the image of frozen biological samples. As an example, we canconsider the freeze-substituted specimen depicted in Fig. 12, which was originallypresented as an illustration of a badly frozen sample (Handley et al. 1981).According to the above knowledge on freezing we can describe this micrograph asfollows: The sample of erythrocytes in saline solution was frozen by projection ona cold surface situated at the upper border of the specimen. As soon the specimenreaches the cold block, its surface is cooled very rapidly and a temperature-gradient forms in the specimen. Shortly after, in a point of the solution, close tothe surface and where the temperature is below zero (but above To), a nucleationevent takes place by heterogeneous nucleation. The growth of the ice crystal in theinterspace is rapid at first and the temperature rises to almost o °C. Crystal growthcontinues more slowly deeper in the specimen because it takes longer to removethe heat of crystallization and the temperature, along the surface of the growingcrystal remains close to o °C. During all this time the cells remain unfrozenbecause they do not contain nucleation seed and because their dense cytoplasmserves as a cryoprotectant. They suffer some dehydration due to the osmotic effectof the increasing salt concentration of the liquid in the interspace. Some of themmay burst. Once crystallization of the solution is terminated, the temperaturebegins to decrease again, from the surface towards the interior of the specimen.Sometimes, after the local temperature has reached To, an homogeneous
150 J. Dubochet and others
Fig. 12. Human erythrocyte suspension frozen by projection of a sample enveloped in a thintitanium foil into liquid cryogen. The part of the sample which is in contact with the metalfoil is the most rapidly cooled. It corresponds to the upper part of the figure. Forexplanation: see text. (From Handley et al. (1981), with permission.)
nucleation event takes place in each cell where a single crystal starts to grow. Hereagain, growth is rapid at first but it becomes slower while the residual spaceis warming, and the solute concentration increases. Because of the originaltemperature gradient, the nucleation event is more likely to take place on the cellside which is proximal to the cooling surface. The domains are therefore smalleron this than on the distal side. The random time at which the initial nucleationevent takes place in each cell influences the average domain size, which thereforeappears to be uncorrelated between neighbouring cells.
4.3 Cubic ice
For a long time cubic ice has been known as a low-temperature ice modification,obtainable by condensation of the vapour around — 100 °C or by devitrification ofvitreous water. As soon as it became possible to observe vitrified and crystallizedaqueous samples directly in the microscope, it was found that cubic ice could alsobe obtained from the liquid (Dubochet & McDowall, 1981; Dubochet et al.1982 c), a fact which has recently been confirmed by X-ray of rapidly quenchedaerosol droplets (Mayer & Hallbrucker, 1987). In order to produce cubic icethe cooling speed must be slightly lower than that required for vitrification,consequently a zone of cubic ice frequently forms the border between vitrifieddomains and regions where the water forms hexagonal crystals. In the practice of

Cryo-electron microscopy of vitrified specimens 151
cryo-electron microscopy, cubic ice is frequently obtained when vitrification isattempted under suboptimal conditions, either because the cryogen is not coldenough or because a less-efficient cryogen, as for example nitrogen slush, isused.
Cubic ice crystals are much smaller than hexagonal crystals. Their dimensionsrange from 30 nm to 1 /«n but not smaller, at least as indicated by directobservations and from the width of the rings of the electron diffractogram. Theformation of cubic ice crystals in solutions or in biological samples also seems toproduce much less structural damage than during the formation of hexagonal ice.As seen in frozen sections, membranes seem to be unaffected when they aresurrounded by cubic ice and, in solution, it does not seem to cause aggregation ofbiological particles. Only one clear case of freezing damage by cubic ice has beendocumented and that is in thick filaments of insect fight-muscle (McDowall et al.1984).
4.4 Vitrification
Vitrification takes place at a still higher cooling rate. It is the state in whichimmobilization is achieved before nucleation. Consequently there is a cleardiscontinuity between the smallest ice crystals which are in the 30 nm range andthe vitrified state, which does not have any crystals. In terms of thermodynamics,this discontinuity is referred to as phase transition. It is wrong to considervitrification as the extreme case when the size of the ice crystals continuouslydecreases as the cooling speed increases. A scheme of the crystal size in relationto the estimated cooling speed is shown in Fig. 13.
A large amount of experimental data has been collected on the properties ofvitreous water obtained by vapour condensation (Sceats & Rice, 1982). Results onvitrified liquid water are now accumulating rapidly (Mayer & Briiggeller, 1982;Dubochet & Lepault, 1984; Mayer, 1985). The density of pure vitrified water hasbeen measured by electron microscopy, in comparison with the known density ofpolystyrenes spheres (Dubochet et al. 1982a). The value found is o-93+o-O2 g/cm3, which is close to that of ice at the same temperature. This low density impliesthat water expands linearly by 2—3 % during vitrification. However, according tosize measurements on catalase crystals made in collaboration with N. Unwin, wefound that the lattice parameters in vitrified samples do not differ by more than0-5 % from those measured by X-ray at room temperature. This could indicatethat water distribution in the crystal changes during cooling or that the density ofvitreous water is not the same in the protein crystal as it is in its surroundings.
For an electron microscopist, the essential question about vitrification iswhether it keeps the original biological structures intact. There is no simpleanswer to this question; the only thing known for sure is that vitrification avoidsice-crystal formation. Other transformations could well be induced during thecooling time, estimated to be equal to about io~4 s in the most favourable case(thin-layer vitrification). In general, this time is short in respect to the timerequired for large rearrangements of biological structures. It is long, however,

152 J. Dubochet and others
U 100 nm
10 nm
1 nm itreous -
Cooling speed
Fig. 13. Relationship between the cooling speed and the size of the ice crystals. The crystalsize is measured by electron diffraction on frozen hydrated specimens. The width of therings of the powder diffractogram gives an estimate of the minimum size of the cubiccrystals. (From Dubochet & McDowall (19846), with permission.)
when compared to rearrangements of the size of one macromolecule or, more so,if the diffusion speed of atoms or of small metabolites is being considered (Hiromi,1979). In practice, however, all observations made up to now have confirmed theexcellent preservation of vitrified specimens. As far as we know, only one case inwhich a rearrangement takes place during vitrification has been documented(Lepault et al. 1985). It concerns lipid vesicles, vitrified from a startingtemperature at which the lipids are in their liquid state (a conformation). Thisconformation is not conserved during vitrification but is transformed into acrystalline /? conformation, still different from /?', the low-temperature equilibriumconformation.
4.5 Cryofixation
Recommendable reviews about cryofixation have been prepared by Plattner &Bachmann (1982), Robards & Sleytr (1985) or Menco (1986). They give a goodpicture of the enormous amount of work which has been devoted to developingmethods for rapid cooling and for obtaining quantitative data on the achievedcooling rate. Most of this work, however, is of limited value for our purposebecause it concerns samples of much larger volumes than those considered forvitrification. Furthermore, the indicator for the quality of cryofixation is, in mostcases, the size of the 'ice crystals', in freeze-substituted, freeze-etched or freeze-dried specimens, which, of course, is inadequate for deciding if a specimen hasbeen vitrified during cooling. The review by Sitte et al. (1987) keeps the need forvitrification closer in view.
Cryo-electron microscopy of vitrified specimens 153
Determining directly whether a sample is vitrified or not is an unambiguousindicator of cooling efficiency. Of course, it is not a very differentiated indicatorbut it tells if a sample is optimally frozen or not, which is ultimately the mostrelevant question that the electron microscopist can ask. No quantitative data onthe cooling speed required for vitrification of pure water is available yet but someextrapolations can be made from measurements made with thin thermocouples ata known distance from the sample surface (Escaig, 1982 a, b). It was found, forexample, that a tissue block cooled by projection on to a cold metal surface reachesa cooling rate of 50000 °C/s at c. 20 /im depth. It seems therefore that a coolingspeed of the order of io6 °C/s could be achieved in a 1 fim thick water layer. Thisvalue probably gives an order of magnitude for the minimum cooling speedrequired for vitrification of pure water. Other lines of thought lead to acomparable result (Mayer, 1985).
The requirements for vitrifying aqueous solutions or biological suspensions arenot as severe because most solutes play the role of a cryo-protectant. The sizeof a sample that can be vitrified can be increased accordingly. For example, afragment of liver or a pellet of typical mammal culture cells can be vitrified to adepth of 10-20/tm. Similar values are obtained with pure 20% sugar solution.Higher sugar concentration is of little use for cryo-electron microscopy because itreduces too much the contrast of most biological structures. However, it is usefulfor other techniques, such as cryosectioning for immunolabelling, where saturatedsucrose solution allows easy sectioning of millimetre-size blocks of vitrified tissues(Tokuyasu, 1980; Griffiths et al. 1983).
In our experience the rapid immersion of a small sample in an efficient cryogeneasily gives good and rapid results (see § 10 below, 'How to operate'). Theimmersion can be done with a plunger, and liquid ethane or propane can be usedas a cryogen. In most cases we do not obtain vitrification if immersion is carriedout directly by hand, though some people seem to be successful (U. Aebi, personalcommunication). We are also unsuccessful when nitrogen slush is used as acryogen, but here again others do not seem to have this limitation (Fujiyoshi et al.1986, personal communication). The cooling efficiency of liquid propane orethane at their melting points seems to be similar. In practice they differ in the waya small amount of cryogen, left on the grid after vitrification, evaporates duringtransfer and in the microscope; ethane (boiling point = — 89 °C) rapidly sub-limates in the cold specimen holder whereas propane (boiling point = — 42 °C)may remain longer and disturb observation.
It is possible to draw some conclusions on the cooling mechanism byconsidering the conditions giving best results and by comparing the effects ofvarious cryogens. In order to be efficient, cooling should take place by directconduction from the liquid cryogen to the liquid film. Liquid ethane or propaneat their fusion temperature are therefore excellent because they can be warmed bynearly 100 °C and can absorb a large enthalpy before significant evaporation takesplace. The process of calefaction, in which a layer of gas prevents good thermalcontact between the sample and the cryogen, is therefore avoided. On the contary,the whole cooling effect of liquid nitrogen at its boiling point takes place through

154 J- Dubochet and others
evaporation. Calefaction is therefore unavoidable. Nitrogen slush can only bewarmed by 14 °C before it reaches its boiling point. This is apparently insufficientfor best cooling efficiency. Another consequence of the poor cooling efficiencythrough a gas layer is that no significant cooling takes place during plunging,before the sample reaches the liquid cryogen.
From the estimated vitrification rate for pure water (io6 °C/s) the vitrificationtime can be deduced to be of about io~4 s. During this time the specimen, fallingwith the plunger described below, moves by only 100 /im. This may seem to bea short distance but it is nevertheless 1000 times more than the thickness of atypical vitrified thin film. At this scale it seems probable that convection of thecryogen on the moving specimen produces an excellent heat exchange.
The cooling process involving direct contact of the liquid cryogen with theliquid film of solution raises the question whether some mixing taking placebetween the two fluids could result in a new solution with more favourableproperties for vitrification. A mixture resembling clathrate hydrate of hydro-carbons could be considered here (Davidson, 1973). One could even argue thatthe vitrified sample is of a different nature to that of the liquid solution andobservations made on the former are not relevant for the latter; fortunately allthe practical experiments with biological specimens refute this argument.Furthermore the similarity between the electron diffractogram of vitrified waterobtained from the liquid and that obtained by vapour condensation suggests thatthe liquid cryogen does not seriously influence the structure of the vitreous film(Dubochet et al. 1983 a). Finally, the presence of liquid cryogen is not arequirement for achieving vitrification of pure liquid water. Cooling on a solidcold surface is equally possible and leads to vitrified water with identicalproperties (Mayer, 1985).
Jet freezing is another method for cooling with liquid cryogen (Miiller et al.1980; Plattner & Knoll, 1984). The advantage is that the specimen is kept out ofdirect contact with the air or with the cryogen. However, the thin metal foil whichencloses the specimen forms a thermal barrier between the specimen and thecryogen. As a result the preparation is also somewhat more demanding. Whethervitrification of dilute solution can also be obtained with this method has not yetbeen established.
Slam freezing, which consists in projecting the specimen directly on to a metalblock cooled by liquid helium or liquid nitrogen (Harreveld et al. 1974;Christensen, 1971; Escaig, 1982 a; Sitte et al. 1987), almost immediately bringsthe very top surface of the sample close to the block temperature. The value of themethod for achieving excellent cryoprotection of the surface has been amplydemonstrated (Heuser et al. 1979). How it compares with the effects of liquidcryogen for deeper cooling is not yet known quantitatively. In our experience, itcan give excellent results and some of the very best specimens we have everobtained were produced by this method. However, it requires adequate solvingof some technical difficulties. In particular the specimen should not be severelysqueezed by the slammer, and bouncing must be avoided. Contamination ofthe cold metal surface also prevents good thermal contact, especially around the

Cryo-electron microscopy of vitrified specimens 155
liquid-helium temperature, where air can also condense on the block. Whether theuse of liquid helium instead of liquid nitrogen offers a real practical advantage isdubious, in view of the minor improvement in cooling speed which has to becompensated by a large increase in cost and in difficulty of operation.
High-pressure cooling (Riehle & Hochli, 1973; Muller & Moor, 1984; Moor,1987) is based on the attractive theoretical idea that TM, To and TE decrease withincreasing presure. The lowest values are reached at 2100 atm, where TM and To
are at —21 and —90 °C respectively. The onset of crystallization during coolingcould be delayed accordingly, though the fact that viscosity of water decreaseswith increasing pressure could have an unfavourable influence. An instrument forjet freezing at this pressure is now commercially available. Results obtained up tonow are promising, though only with poorly defined indicators. The method willprobably also be useful for vitrifying larger samples, but this remains to betested.
5. SECTIONS
5.1 Vitrified sections
In his most enjoyable dream the electron microscopist may imagine cryo-ultramicrotomy: a biological sample is vitrified, cut into thin sections andobserved in a cryo-electron microscope where it reveals all its most subtlestructures. As surprising as it may be, this dream, sometimes, becomes truth. Oneof the first examples is illustrated in Fig. 14 (McDowall et al. 1983). It shows avitrified section from rat liver. The specimen is neither chemically fixed, norstained nor infused by cryoprotectant. Many internal structures of the cell arevisible. On the whole they resemble those observed in conventionally preparedspecimens - a fact which is reassuring for cryo-ultramicrotomists as also for thoseused to conventional embedding methods. The image becomes even moreinteresting when the section is observed closer. An example taken from a musclesample is shown in Fig. 15. The method has been applied with success on anumber of specimens and valuable new results have been obtained (Dubochetet al. 19836; McDowall et al. 1984, 1986). The practical aspects of the methodare described below and in § 10.
Unfortunately it may also happen that an experienced cryo-ultramicrotomistdreams, on the same theme, the most dreadful nightmare. He would see aspecimen without consistency refusing to behave decently for vitrification; hewould see a knife scratching the specimen into unshaped fragments which flyaway as soon he tries to catch one; the climax would arise in the microscope, wherecontamination, charging and bubbling add to create chaos. This dream, also, ispart of the cryo-ultramicrotomy experience.
Cryo-ultramicrotomy was developed a long time ago (Bernhard, 1965) and it isnow in standard use for several techniques, as for example immunolabelling(Tokuyasu, 1973, 1980; Griffiths et al. 1983) or elemental analysis (Gupta & Hall,1981), but, as for many other cryo-electron microscopy methods, it is dryspecimens that are finally observed in the electron microscope. In spite of

J. Dubochet and others
Fig. 14. Section from an untreated fragment of rat liver, vitrified by projection on a coldmetal block. Sectioning temperature: —160 °C. Thickness: 180 nm. N, nucleus; Nu,nucleolus; NuE, nuclear envelope; P, nuclear pore; Ch, chromatin; M, mitochondria; ER,endoplasmic reticulum with ribosomes; V, vacuole; Ih: contaminating hexagonal ice crystals;KM, knife marks; C, chatter. Insert: section from a block of vitreous ice with its electrondiffractogram. The block was obtained by condensation of water vapour at — io"1 Pa for2 hours on a specimen holder kept at liquid nitrogen temperature. Sectioning temperature:—160 °C. The thickness at the point marked by a star is 120 nm. The first separated ring inthe diffractogram corresponds to 037 nm (From: McDowall et al. (1983), with permission.)Fig. 15. Longitudinal cryosection in a vitrified unfixed fibril of glycerinated insect flightmuscle in the relaxed state. Section thickness: 80 nm. (From McDowall et al. (1984), withpermission.)
Cryo-electron microscopy of vitrified specimens 157
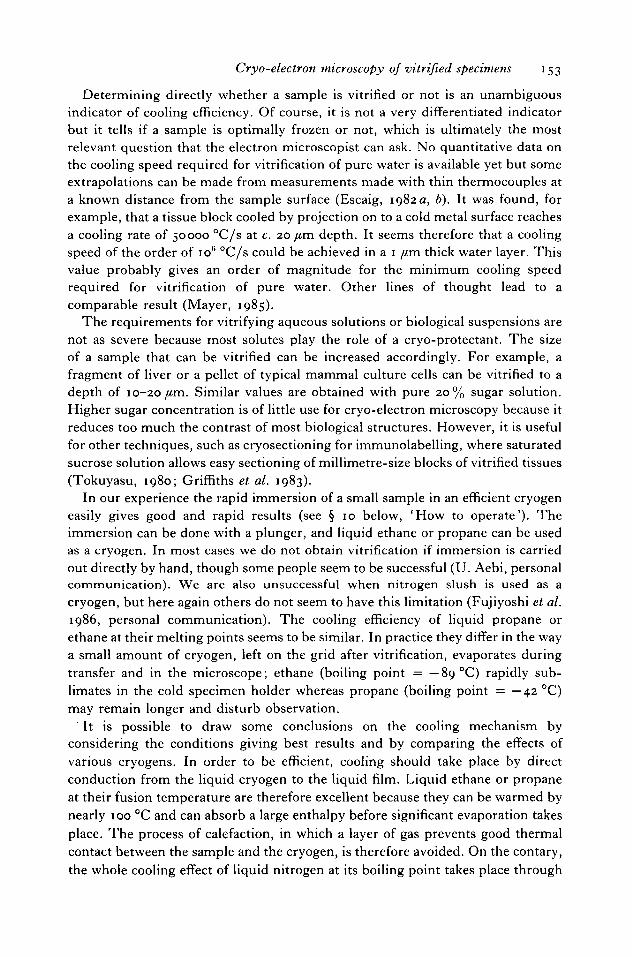
Fig. 16. Longitudinal cryosection of glycerinated insect flight muscle washed in 20%sucrose buffer. This region of the sample was not vitrified, but water was crystallized intocubic ice. (a) Fully hydrated section, (b) Same region as in (a) after freeze drying in themicroscope. A and Z: A and Z bands. (From Dubochet & McDowall, 1984.)
numerous trials, ultrastructural observations on fully hydrated sections had givenfew results (Hutchinson et al. 1974; Gupta & Hall, 1981) until vitrification wasdiscovered. It could then be developed into a practical method (McDowall et al.1983; Dubochet & McDowall, 1984 a) which has since been applied to a numberof specimens (Dubochet et al. 19836; McDowall et al. 1984, 1986). In spite ofthe break-through that vitrified sections could be for ultrastructural research, themethod is not yet in general use. The reason is unfortunately quite clear; themethod is still technically difficult, the yield of good micrographs is low and, inmost sections, the severity of the cutting artifacts is discouraging for many. Mucheffort has been put into understanding and overcoming these difficulties (Changet al. 1983; Frederik et al. 1982, 1984; Griffiths et al. 1984; Zierold, 1982, 1984)but a lot remains to be done.
The cleanest demonstration that cryo-ultramicrotomy of vitrified specimens ispossible is reproduced in insert of Fig. 14. It shows a thin section made from ablock of pure vitreous water, obtained by condensation from the vapour. Itselectron diffractogram confirms that the section is still vitrified. Obviously,sectioning was possible, the sample did not dry during preparation and thevitreous state was conserved during the whole process. The merit of hydratedsections, as compared to freeze-dried or freeze-substituted ones, has also been amatter of debate. As illustrated in Fig. 16, for a sample of washed, glycerinatedinsect flight-muscle the freeze-dried section may at first give a better impressionthan the hydrated specimen because it is more contrasted. Careful observationshows, however, that all the valuable features observed in the freeze-dried section

158 J. Dubochet and others
are also visible in the hydrated one, but many details, present in the hydratedspecimen, are lost during the dehydration process. This effect is common to manypreparations. It was carefully tested on various specimens, including insect flight-muscle (McDowall et al. 1984), collagen (McDowall & Lepault, personnalcommunication) and chromatin (J. M. Smith, personal communication), bycomparing the results from electron and optical diffraction on vitrified sectionswith those from X-ray diffraction of hydrated samples at room temperature.Except for the cutting artifacts, vitrified sections seem to be identical to the nativesample whereas any other preparation method leads to obvious transformations.It must, however, be kept in mind that, if the advantage of vitrified over freeze-dried sections is obvious for ultrastructural observations in the range smaller than100 nm, the situation may be different at lower resolution where a strongamplitude contrast is necessary, or for elemental analysis which may require anirradiation dose that a hydrated specimen cannot tolerate.
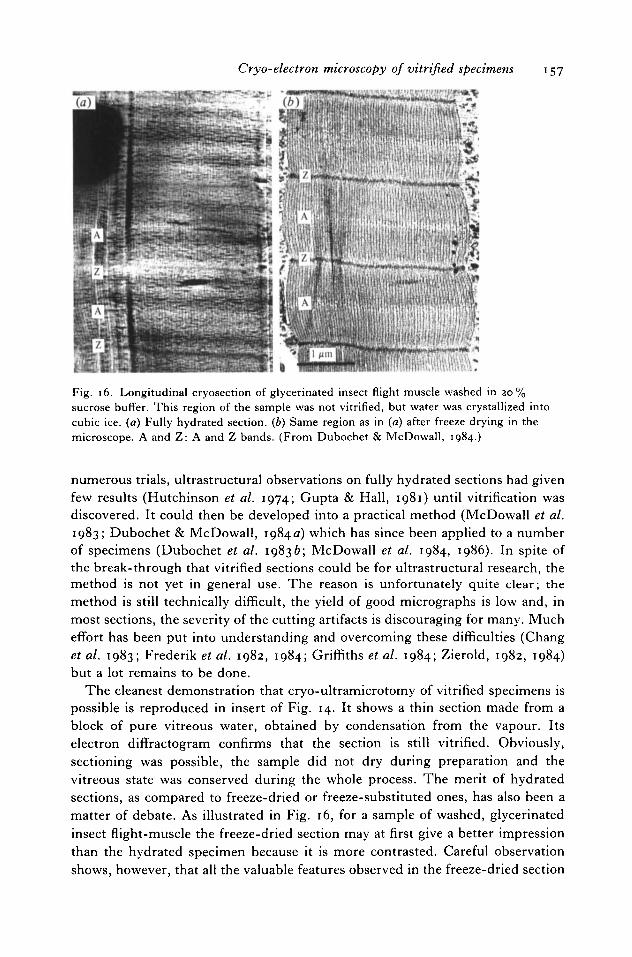
5.2 Cryo-ultramicrotomy
A good cryo-ultramicrotome should provide the same regularity of cut andadvance as a microtome operating at room temperature and it should also allowreasonable ease for manipulation of the sample and the sections. These are severerequirements when they have to be fulfilled under conditions where the operatingtemperature is some 200 °C below room temperature. In fact, ultramicrotomescapable of producing good thin sections of vitrified samples have beencommercially available only since 1980 (Sitte et al. 1980). Their constructionprinciples and operation modes are reviewed in Sitte & Neumann (1983). They aredirectly derived from the standard instrument by placing the specimen and theknife in a thermally isolated chamber cooled by liquid nitrogen. The isolation ofthe chamber is most difficult along the moving arm, where strength and rigiditycannot be reduced, and above the specimen, where a large window is required formanipulation and observation. For technical reasons the primary cooling of thechamber (flow of liquid nitrogen) is not continuous. The chamber is thereforedesigned in such a way as to minimize temperature variations of the knife and ofthe specimen during the cooling cycle. In practice, this stabilization is not perfect.Sufficient cutting regularity is obtained during only part of the cycle. Anothermajor difficulty is to conciliate the requirement for easy access to the specimenchamber with a good protection against contamination by ice crystals formedwhere the humid air of the room comes in contact with the cold air of the specimenchamber. If this is not done correctly the freshly prepared sections rapidly becomeunusable. For this reason the specimen chamber is designed to be protected bya laminar flow of cold gas, pushing away all the ice crystals formed above it.This system is reasonably efficient, though it does not provide full protection.Furthermore, it is perturbed each time the operator carries out a manipulation inthe specimen chamber. As a consequence, optimum sections of vitrified samplescan only be obtained if the operator acts rapidly and minimizes manipulations inthe chamber. This requires skill and experience.

Cryo-electron microscopy of vitrified specimens 159
Mounting the specimen. Specimens used for cryo-ultramicrotomy are small andonly part of them may be vitrified. It is this part that must be correctly positionedand cut. The specimen must be mounted in a secure manner and with goodthermal contact. The operation should be easy and rapid in order to avoidunnecessary manipulation in the cold chamber. After having tried several deviceswe found that the most practical one consists of two jaws, tightly clamped bya screw. A platelet of indium, a soft metal which deforms under pressure,guarantees a good thermal and rigid mechanical contact between the specimen andthe holder. The jaws are well adapted for receiving fragments of the flattenedfrozen specimen obtained from projection on the cold metal block or the pinsupporting the specimen frozen with the plunger.
Sectioning. Sectioning can be carried out with a diamond or a good glass knife.Normal diamond knives designed for room temperature operation must be usedwith caution because the cement holding the diamond is not always made towithstand large temperature variations. Special cryo-knives are commerciallyavailable for cryo-ultramicrotomy. Glass knives of adequate quality can beobtained with the procedure originated by Tokuyasu & Okamura (1959) anddescribed in detail by Griffiths et al. (1983). Their longevity and cutting qualityis improved when they are coated with a thin layer (c. 1 nm) of tungsten (Roberts,!975)- The cutting parameters such as knife and clearance angle, cutting speed andstroke time, temperature of the specimen, of the knife and of the surrounding gasall play a role in the cutting conditions but none of them has been found to havea systematic and decisive influence on the section quality.
Picking up the sections. A major difference between cryo-ultramicrotomy ofvitrified specimens and conventional sectioning is that the cryosections are notfloated on water. They accumulate at the cutting edge, from where they must beremoved before they form an inextractable heap of fragments. This is donemanually, by touching the section with an eyelash and moving it to the grid. Itrequires great skill and unusually favourable cutting conditions to pick up thesections one by one at each successive stroke. In most cases it is only somescratched fragment of several sections which can be picked up. They aretransferred on to the grid, which is held on a special support in the immediatevicinity of the cutting edge. Because of the small size of the section it is helpfulto use grids with a small mesh size coated with a sufficiently resistant carbonsupporting film. The transfer of the section may be helped by the effect of anantistatic pistol. Grids carrying sections are placed on a cooled polished metalblock on which a similar block is pressed by a screw. This helps to flatten thesections and keep them uniformly cooled and protected. They can then be storedindefinitely by keeping the blocks in liquid nitrogen or they can be transferreddirectly to the microscope as for grids prepared from suspensions.
Observation. The sections are generally agglomerated in a few regions of thegrid. They must therefore first be located and selected at low magnification. Thesections also tend to aggregate contaminating ice crystals, in the preparationchamber of the microtome and during transfer. Beginners frequently find that thesections are completely hidden under the ice crystals. These, however, are not

160 Jf. Dubochet and others
tightly bound and most of them can be removed by the electrostatic effects of ashort and strong local illumination. The sections are generally not flat. Theirregularity of the topography is not evident on a single micrograph but it isrevealed on stereo pairs. This effect has to be taken into account when recordingimages with minimum irradiation because it may introduce excessive focus changebetween the focusing and the recording area.
5.3 Cutting artifacts
Most cutting artifacts observed in vitrified sections are well documented fromconventional work with plastic (Hayat, 1970). They are, however, morepronounced. They will be described separately before conclusions on the cuttingmechanism and possible ways of improving section quality are discussed.
Deformation. All sections are deformed by the cutting process. In general, thiscorresponds to 30-60 % reduction of the original dimension along the cuttingdirection whereas the dimensions are conserved in the perpendicular direction, inthe plane of the section. As the volume of an hydrated biological specimen doesnot vary when it is deformed, the reduction of the length along the cuttingdirection must correspond to an increase in the section thickness. The amount ofdeformation varies from place to place and it also depends on the material. It is,for example, more severe than average in lipid droplets and less than average alongmuscle fibres. Deformation does not depend significantly on the sectioning speedand temperature. Some observations have shown that it is less severe in specimensin which the water is in cubic crystals than when it is vitrified. It is also stronglyinfluenced by the thickness of the section; the thinnest sections being the mostdeformed. This effect probably limits the possibility of obtaining ultra-thinsections.
Crevasses. The term ' crevasse' comes from the similarity of the characteristicmicroripple observed on most cryosections and the surface of some glaciers. Anexample is shown in Fig. 17(0), Crevasses appear as a network of lines,approximately parallel to the knife edge - even when the cutting direction is notperpendicular to it. They are found on every non-vitrified section and, to avariable extent, also on vitrified samples. Some materials are more prone tocrevasses than others. Pure water or lipid droplets are among the worst. Regionsrich in soluble biological material are generally crevasse-free. The most heavilycrevassed regions are in the thicker part of the sections. As can be seen in Fig.17 (b), when the section is shadowed with a heavy metal, the surface of the sectionis very irregular in the crevassed area. Fig. 17 (c) shows that the crevasses producediscontinuity in the image of biological structures and therefore must correspondto deep fractures in the sections. We have generally found that crevasses are onlyon one side of the section, probably on the side which was inside the block beforethe section was cut. Zierold has shown that, in some cases at least, the crevassesare on the other side (Zierold, 1984) or on both sides (Zierold, 1987).
Chatter. Chatter is a more or less regular variation of the section thickness dueto vibration of the specimen in respect to the knife. Its period ranges from less

Cryo-electron microscopy of vitrified specimens 161
Fig. i7. Crevasses, (a) Cryosection of a 40% polyethyleneglycol solution, (b) Shadowedsection of the same specimen as in (a). Sectioning temperature: - i6o°C. Section speed-02 mm/s. (c) Section of an unstained catalase crystal. The crystal structure is discontinuousbecause it is fractured by crevasses. (From Chang et al. 1983.)
I111IIit*«»
Fig. 18. Chatter in vitrified sections, (a) Solution of 40% bovine serum albumin Twomodes of vibration with periods of 02 and 4/*m are superimposed. Sectioning temperature--160 _C. Sectioning speed: 6 mm/s. Thickness: > .20 nm. (b) Saw tooth in a section ofpure vitreous water. Sectioning speed: 0-2 mm/s. (c) Representation at the same scale of thethickness of the section shown in (b).
than o-i /im to several micrometres. Examples are shown in Fig. 18. Chatter is dueto an insufficiently tight mounting of the specimen in the holder or to some othermstrumental vibration around the specimen. In some cases, as for example inFig. 18 (6), it is the consequence of the irregular progression of the knife in thespecimen; the knife does not move until the accumulated energy allows a sudden
6QRB 21
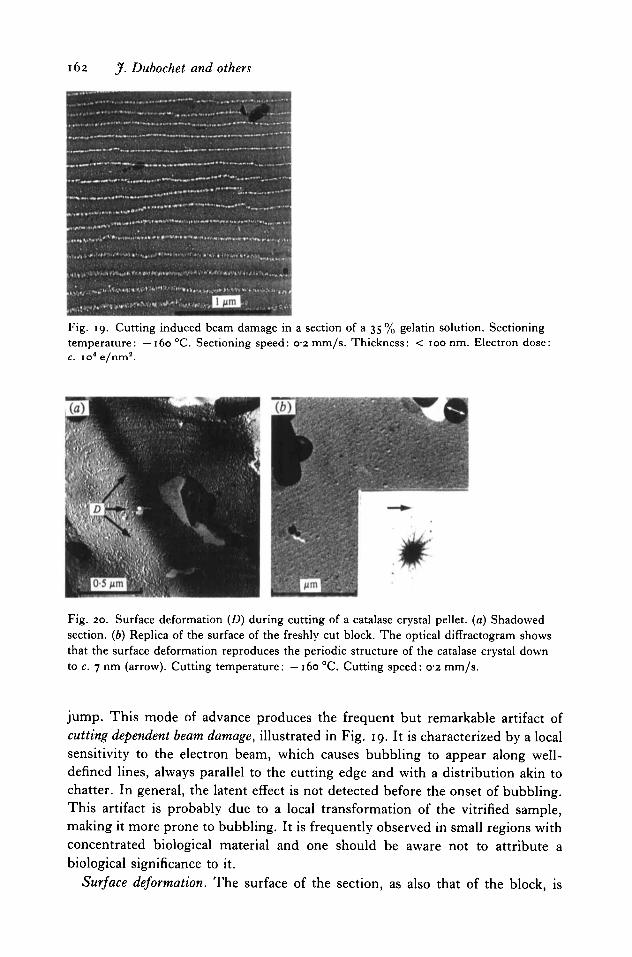
162 J. Dubochet and others
Fig. 19. Cutting induced beam damage in a section of a 35% gelatin solution. Sectioningtemperature: — 160 °C. Sectioning speed: 02 mm/s. Thickness: < 100 nm. Electron dose:c. io4 e/nm2.
Fig. 20. Surface deformation (D) during cutting of a catalase crystal pellet, (a) Shadowedsection, (b) Replica of the surface of the freshly cut block. The optical diffractogram showsthat the surface deformation reproduces the periodic structure of the catalase crystal downto c. 1 nm (arrow). Cutting temperature: —160 °C. Cutting speed: o-2 mm/s.
jump. This mode of advance produces the frequent but remarkable artifact ofcutting dependent beam damage, illustrated in Fig. 19. It is characterized by a localsensitivity to the electron beam, which causes bubbling to appear along well-defined lines, always parallel to the cutting edge and with a distribution akin tochatter. In general, the latent effect is not detected before the onset of bubbling.This artifact is probably due to a local transformation of the vitrified sample,making it more prone to bubbling. It is frequently observed in small regions withconcentrated biological material and one should be aware not to attribute abiological significance to it.
Surface deformation. The surface of the section, as also that of the block, is

Cryo-electron microscopy of vitrified specimens 163
deformed by the cutting process. This effect resembles the plastic deformation infreeze-fracture (Sleytr & Robards, 1977; Lepault & Dubochet, 1980). It is madevisible on shadowed replicas of the section or of the block, where the structure ofthe subjacent biological specimen is revealed. Examples are shown in Fig. 20. Inother sections, or parts of them, the effect is not observed and the surface issmooth. Knife marks are another form of surface deformation. They are generallymore pronounced than in conventional sections because, in most cases, they areonly on one side of the section and therefore are not compensated by thecomplementary relief on the other side. The side on which they are mostfrequently found is that forming the surface of the block. There are also someoccasions where the knife marks are symmetrical on both sides of the section.When this is the case, the two complementary marks appear with opposite contrastand are irregularly shifted, one in respect to the other, thus revealing how muchshift and deformation takes place during sectioning.
5.4 The sectioning process
The cutting artifacts are the most conspicuous features of vitrified sections. Atfirst sight they may seem incomparable with those formed in conventional plasticsections but a more careful examination reveals that they also exist in standardsections. They are, however, more severe in water, not so much because thecutting process produces more damage in frozen material, as because the damagesuffered by conventionally prepared sections is cured by flotation. This fact caneasily be tested when plastic embedded specimens are cut dry at roomtemperature. Their aspect is then not much different from cryosections (Griffithset al. 1984). There is, however, one property in which sections of vitrifiedspecimens differ fundamentally from other materials. Plastic embedded speci-mens, as ice crystals, are all elastic solids in the sense that they cannot deformindefinitely before breaking. Vitrified water, on the contrary, is a liquid ofextremely high viscosity. If a strong enough force is applied for long enough, it candeform to any extent. This fact is probably reflected in the severe deformationobserved in vitrified specimens.
Much has been said on the mechanism of cutting but little is known for sure.Three major theories reviewed in recent papers all have their supporters, (a)Cutting produces a local melting of the specimen. The knife therefore advances ona liquid layer (Thornbury & Mengers, 1957; Sitte et al. 1987). (b) The specimenis broken in front of the knife edge in a process similar to freeze-fracturing(Frederik et al. 1982). (c) The specimen is deformed and rearranged along thecutting edge as is the case in metal machining (Lickfeld, 1985). In addition to thesethree cases, the friction of the newly formed section on the knife face is consideredto play an important role. The confrontation between these various theories andthe observed section is easier in sections of vitrified samples than in conventionalplastic embedded material because the former has not been subsequentlyrearranged by flotation. It then becomes evident that the true phenomenon ofcutting involves something from each of these theories. The severe deformation is
6-2

164 J. Dubochet and others
Knife markBlock
Fig. 21. Tentative schematic drawing of the cutting process during sectioning of vitrifiedsamples.
best compatible with the description of machining. The surface deformation, asalso the crevasses, resemble the effects of fracture. The quality and smoothness ofsome sections together with the fact that vitreous water is a liquid with highviscosity, favour the theory that the knife is gliding on a viscous surface, thoughthe whole section thickness is certainly not liquefied in the common sense of theterm. Also the phase diagram of water shows that, however high the appliedpressure may be, crystalline ice cannot be liquefied below — 22 °C. All these dataare incorporated in Fig. 21, leading to a schematic view of what the cutting processcould be. Other schemes have also been proposed (Zierold, 1987). They certainlyalso contain a part of the truth.
Several avenues can be envisaged in order to improve ultracryomicrotomy ofvitrified samples and reduce cutting artifacts. First of all there is a requirement formore systematic testing of the cutting parameters and, in particular, the role of thetemperature. The domain of very low temperature (below —160 °C) has not yetbeen explored. On the opposite side, the domain of the high temperature, justbelow the actual devitrification temperature of the specimen, has shown somepromise.
Another approach consists of searching for substances which modify theproperties of water, making it more suitable for good sections. It has already beenobserved that many substances make vitreous water more brittle and more proneto crevasses. On the contrary, sucrose has a favourable effect. Other substancescould be even more beneficial.
We have also searched for a liquid, on which the section could be floated.However, those substances which are still liquid below — i2O°C cannot havestrong molecular interaction and have therefore a low surface tension. In all casestested the sections did not float on the liquid but sank in it. Here also we stillsee some chance of finding an adequate solution close to the devitrificationtemperature.
Decreasing the knife angle seems an obvious method of reducing deformationand some other artifacts. The method has been tested with success on plastic

Cryo-electron microscopy of vitrified specimens 165
sections at room temperature (Jesior, 1987). Preliminary tests on vitrified sectionshave not yet yielded encouraging results, even though the knife angle was as smallas 260 (McDowall & Gnagi, private communication).
6. SUSPENSION
The phenomena which take place when liquid suspensions are made into thinfilms for electron-microscopical observation are dominated by surface tension anddiffusion. These effect are very different in the micrometre range from those weare accustomed to observe at human size. A brief refresher could be useful for thecryo-electron microscopist. Some similar considerations are presented in otherarticles (Kellenberger & Kistler, 1979; Kellenberger et al. 19866; Dubochet et al.19826) but the basic material can be found in any textbook on physical chemistry(Tanford, 1961; Eisenberg & Crothers, 1979; Cantor & Schimmel, 1980). Themethod for preparing thin vitrified films of suspension is described in Dubochetet al. (1982 c), Lepault et al. (1983 a), Adrian et al. (1984), Dubochet et al. (1985)and Lepault & Dubochet (1986a).
6.1 Surface tension
Water has a high surface tension because the strong and specific network of bondsestablished between molecules in liquid water is broken at the surface. Morebonds must be broken when the surface area is increased and energy must be putinto the system. This energy is called surface tension, y. In order to minimize itssurface energy, a liquid tends to reduce its surface-to-volume ratio. This is whywater droplets are spherical or why their formation first requires a nucleationevent. The interfacial tension between water and another substance depends onhow water molecules combine to the other substance and this may be smaller thanfor the liquid alone. For example, the interfacial tension between water and octaneis high, because no strong bonds can be established between the two species.Octane is therefore hydrophobic and insoluble whereas n-octyl alcohol, which canform hydrogen bonds with water, has a low interfacial tension and is miscible.Lipid reduce the surface tension of water because their polar heads bond with thewater dipoles whereas their hydrophobic tails, which do not interact with water,tend to form a new surface layer. The interfacial tension between a liquid and asolid also depends on the molecular properties of both substances. The solid issaid to be hydrophilic if water spreads on it, whereas it is hydrophobic if it doesnot. A more quantitative description is schematized in Fig. 22. It considers thesurface tension of the liquid y1 and of the solid ys, as also the interfacial tensionysl. The Young condition gives the equilibrum condition: ysi + yv cos6 = ys.Perfect wetting conditions are obtained when the wetting angle 6 is zero. In fact,wetting is a much more complicated and interesting phenomenon than inferredfrom this simple equation. A very thin precursor film, which may be only a fewmolecules thick, rolls first on the surface, preparing the movement of the bulkliquid. The flow of the precursor film involves large relative velocities and strong

166 J. Dubochet and others
Fig. 22. Interfacial tension of a liquid on a solid. The Young condition states that, atequilibrium, the surface tension of the solid, ys, of the liquid, yl and of the interfacialtension, ysl, are related by the relation ysl + y,.cos 6 = ys, in which 0 is the wetting angle.
Fig. 23. Laborious spreading of a water microdroplet on a partially hydrophilic carbonsupporting film. Microdroplets of pure water were produced in a nebulizer and thespecimen was frozen by immersion in nitrogen slush, 012 s after deposition (FromDubochet et al. (1982c), with permission.)
effects of viscosity. As a consequence, the wetting edge does not advance in astraight line but has a complex progression, looking for the geometry of leastresistance (De Gennes, 1984, 1985) in a manner similar of the growth of an icecrystal in a concentrated solution. An example is shown in Fig. 23.
Some quantitative values help to give an idea of the magnitude of the surfaceeffects. The surface tension of water is 7-2 x io~2 J m~2. The additional pressure,Ap, that surface tension produces in a spherical droplet of radius r is given byAp = zy/r. For a 2 mm drop, Ap corresponds to a mere 14 cm water column, butit becomes 140 bar if the drop has a radius of 10 nm. Similarly, the forces involvedin increasing the surface energy when a film o-1 fim thick is formed correspond toa hyrostatic pressure of 14 bar in the film. The surface energy is also increased bythe order of yS, when a hydrophilic particle of surface S is removed from itsaqueous environment. For a 20 nm particle this corresponds to 13 Mcal/mol. Itmust be kept in mind that this large amount of energy is involved each time wateris removed from a soluble particle, independently of the method used for drying;

Cryo-electron microscopy of vitrified specimens 167
the final energy balance is the same after air-drying, freeze drying or critical-pointpreparation and some form of collapse must also be expected with these methods(Kistler & Kellenberger, 1977).
As compared to surface tension, other forms of energy, which are important ineveryday life, become negligible at microscopic scale. For example, the gravitationforces acting on a o-i /im film are io9 times smaller than those due to surfacetension. Kinetic energy does not produce many effects either. We realized thiswhen trying unsuccessfully to use the kinetic energy of microdroplets to helpspread then on a carbon support (Dubochet et at. 1982 c). We could have sparedthe experiment because a simple calculation shows that the kinetic energy in awater droplet of 2 /im diameter projected at 10 m/s in a nebulizer is only sufficientto increase its surface by o-ooi % !
6.2 Diffusion
Brownian motion and stochastic particle diffusion can be estimated on the basis ofdiffusion theory. The average displacement x, during the time period At is givenby the relation X2 = 6DAt, in which D is the diffusion coefficient. For sphericalparticles of radius r the diffusion coefficient has the value: D = kT/dnyjr, wherek = 13-8 x io~24 J/°C is the Boltzmann constant, T is the temperature and 7f theviscosity, which has a value of around one centipoise (io~2 N s/m) for pure water.It can also be inferred from the sedimentation coefficient 5 using the relation D= RTsfM(i-vp), where R = 831 J/°C mol is the gas constant, Mis the molecularweight, v is the partial specific volume of the particle in solution and p is thesolvent density. From this data the average time T needed by a globular biologicalparticle of radius r to move over its diameter, or to rotate on itself (relaxationtime), can be estimated to be around T = ^nr/r3/'kT', which corresponds to an orderof 3 ns for glucose molecules. 1 /is for a small protein (BSA) and 1 ms for a smallspherical virus. Similarly, these particles are likely to meet the surface of a O'i /tmfilm within 5 /is, 20 /is and 1 ms for the sugar molecule, the small protein and thevirus respectively, if no other surface force is present.
6.3 Preparation on a supporting film
The preparation of the thin liquid film for vitrification is tricky because of theunfavourable surface-to-volume ratio and the rapid evaporation of the liquid.Inexperienced workers tend to obtain specimens which are either dry or too thickfor observation. A good starting point is a perfectly hydrophilic supporting film(contact angle = o°) allowing a regular, thin coverage of the surface. Thisrequirement is, however, more severe than what is generally understood by theword hydrophilic. Spray freezing provides a good test. The method has beendescribed previously (Dubochet et al. 1982 c). It consists in sprayingmicrodroplets from a nebulizer on a supporting film while it is falling towardsthe cryogen. Depending on the surface properties of the support, the dropletsmay remain compact or spread more or less rapidly. Freezing interrupts the

168 J. Dubochet and others
process after a time period ranging from io~3 to i s. Perfect hydrophilicity leadsto microdroplets without visible edge; the thickness of the liquid decreasesuniformly towards zero. A somewhat less effective spreading results in thelaborious development of the film depicted in Fig. 23. Without specialprecautions, most droplets spread even less, leaving a thick layer of uselessaggregates after freezing or drying. Many methods are in current use for obtaininghydrophilic films for conventional preparations (Review in Dubochet et al.19826). They include treatment with surface-active agents, cleaning with asolvent, glow discharge in air, or simply using the films shortly after they havebeen prepared. The requirement for perfect hydrophilicity described aboverequires more caution. Glow discharge is the only practical method we know toachieve it simply and reproducibly. It requires a clean glow-discharge apparatusand its effect lasts only for a period of seconds.
Some of the solutions which have been tried with limited success for preparingthin frozen films of solutions include sandwiching the liquid layer between carbonfilms (Taylor & Glaeser, 1974, 1976; Jaffe & Glaeser, 1984), slowing downevaporation speed by preparing the specimen in a humid chamber (Taylor, 1978)or removing the water excess by partial freeze-drying in the microscope (Heide &Grund, 1974; Taylor et al. 1975). More practical succes was obtained by formingthe film under an oil layer (Hayward et al. 1978; Chang et al. 1985), which helpsto keep the liquid film uniform and reduces its evaporation. It seems likely that thepreparation on carbon films treated by glow discharge in alkylamine, which, in ourhands, gives the best and most reproducible results (see below, How to Operate;Dubochet et al. 1982 c; Lepault et al. 1983 a), also rely on the sandwich principle.In fact, the film treated by glow discharge in alkylamine appears hydrophobic atfirst contact with the water but, after a drop has been forced on to it, it behavesin a hydrophilic manner. Glow discharge probably covers the carbon film with anamphiphilic layer and the water film is stabilized when it is sandwiched betweenit and the carbon film (Dubochet et al. 19826).
6.4 The bare-grid method
It came as a surprise when it was found that the easiest way to obtain a thin waterfilm is to stretch it, without any support, over the holes of a grid or those of aperforated film, otherwise used as support for ultra-thin carbon film (Adrian et al.1984). Obviously, the unsupported water film is not stable. Surface tension andevaporation cause it to break. However, the last phase of the process, when the filmthickness is in the o-i fim range, seems to last for the best part of a second. Thisleaves enough time to form and vitrify the uniform thin film, either by pipettingaway the excess water or by removing it with blotting paper (see §10, 'How tooperate'). Unsupported films can be obtained with pure water on a clean gridbut they are easier to prepare in the presence of additional substances such asdetergents or lipids, probably because they reduce the surface tension at theliquid-air interface. In fact, it seems unlikely that a clean water surface can neverbe obtained in the usual environment of an electron-microscopy laboratory.

Cryo-electron microscopy of vitrified specimens 169
Similarly, most molecules in solution tend to react with the high-energy watersurface. They influence the conditions under which the thin unsupported film canbe prepared. It is not yet clear why the formation of a thin unsupported water filmis at all possible. It has, perhaps, something to do with repulsion forces actingbetween the two surfaces. Furthermore, breaking starts with the fusion of the twoopposing surfaces. The process may be difficult to initiate. It also requires thedisplacement of a relatively large amount of liquid in the thin film, against theresisting action of viscosity.
Biological particles observed in a thin vitrified film of solution are free of allthe classical preparation artifacts, such as those due to chemical fixation,dehydratation, staining and adsorption on to a supporting film. Nevertheless thethin vitrified specimens cannot merely be considered as a faithful representationof the initial solution. Vitrification itself is hardly a disturbing factor but partialevaporation of water during preparation and surface effects can have a profoundinfluence. As a matter of fact, surface effects have been responsible for the mostintriguing observations we have made since the method has been workingroutinely.
6.5 Evaporation
Some evaporation always takes place during the preparation of the specimen.When the liquid film is thin, this leads to a significant increase in soluteconcentration. The water activity decreases accordingly, thus reducingevaporation rate and facilitating the preparation of a thin layer of suspension(Hayward et al 1978; Jaffe & Glaeser, 1984). In principle, this method isanalogous to that introduced in the now classical study of the purple membrane(Unwin & Henderson, 1975), further used with several biological crystals topreserve their 'hydrated state' by the presence of sugar or of other substances(Chiu, 1982; Rachel et al. 1986).
The thin film vitrification method, described in this section, consists in avoidingevaporation as much as possible, not only in order to keep the biological particlessustained by the surrounding water but also to preserve the physical-chemicalproperties of the medium. Some evaporation is, however, difficult to avoid and itproduces an increase in solute concentration during the last phase of specimenpreparation. The effect is important when the specimen is prepared by pipettingor blotting the excess water from the side of a supporting film. The formationof the thin film then takes several seconds and during this time the soluteconcentration in the thinnest parts of the film may reach any value includingcomplete drying. Much better is the situation with unsupported liquid filmsprepared by direct blotting, because the total preparation time is only in the orderof 1 s and the liquid layer is more mobile, thus partially avoiding build-up of localconcentration.
Evaporation can be measured quantitatively. One method consists in comparingthe mass of the thin vitrified layer of a known specimen before and after freeze-drying. The measurements are made from the optical density of the micrographs.

170 J. Dubochet and others
Fig. 24. Solution of lipid vesicles in 100 mM-NaCl. (a) The specimen has been prepared bythe bare-grid method under conditions where part of the water evaporates before the thinfilm is vitrified. Invagination of the vesicles and formation of concentric vesicles reveal theosmotic effect due to the rapidly changing salt concentration in the liquid, (b) The samesample prepared in saturated humidity does not show osmotic effects.
The method is rapid and easy to perform (Euseman et al. 1982; Dubochet et al.19836). It can also be used with unsupported film, provided the concentration ofsolute is high enough to leave a continuous film after drying (around 5 % in mostcases). An alternative method consists in measuring the contrast of knownparticles in a known solution of heavy salt. For example, polystyrene spheres(p = 1-05 g cm"3) have no contrast in a 17% (w/w) solution of caesium chloride(p = 112 g cm"3 at room temperature, corresponding to 1-05 g cm"3 in vitreouswater). They can nevertheless be detected a posteriori by beam-induced bubbling.Deviation of the expected contrast is a measure of the change in concentration. Analternative method consists in using small lipid vesicles as osmometers. When thesalt concentration is rapidly changing in the thin film, just before vitrification, thelipid vesicles adjust by losing water, while practically no salt has time to cross thebilayer. The volume of the vesicle decreases while its surface remains constant.An invagination results which may develop into two concentric vesicles. A typicalcase is shown in Fig. 24. Using these methods it was found (Cyrclaff et al., inpreparation) that evaporation varies from place to place on a specimen, and thatit can easily result in a twofold increase in the concentration of a solution prepared
Cryo-electron microscopy of vitrified specimens 171
on perforated grids as described below (see ' How to Operate'). Evaporation can bereduced in every case to less than 30% by simple measures, as for example ashower of humid air flowing along the guillotine or a device holding blotting-papers against both sides of the specimen until shortly before immersion in thecryogen (Cyrclaff et al., in preparation). A humid chamber has also been testedwith success by Bellare et al. (1986).
6.6 Surface effects
The most severe surface effect takes place when the water surface crosses thebiological particle during drying in conventional specimen preparations. Asdiscussed above, the energy involved is considerable. It corresponds to manyMJ/mole for an average-sized protein. The result, which has been abundantlydocumented, is that dry biological particles are severely flattened and collapsed(Kistler & Kellenberger, 1977; Kellenberger & Kistler, 1979; Kellenberger et al.1982; Kellenberger, 1987). This effect does not exist in vitrified specimens. Nodehydration energy is involved and the water matrix is preserved. All experimentsconfirm the expectation that the shape of the particles is well preserved in the waterfilm (Stewart & Vigers, 1986). This has been tested quantitatively in several cases.For example, no flattening was detected by three-dimensional reconstruction ofspherical viruses (Vogel et al. 1986) or of T4 bacteriophages (Dubochet & Adrian,unpublished). The cylindrical symmetry of the delicate empty polyheads of theT4 bacteriophage, as also some other helical structure, are unaltered (Lepault,1985). Of course, this only holds true where the liquid film is thicker than theparticles. In the example shown in Fig. 25 the T4 polyheads have a well-preservedcylindrical symmetry except where they overlap, at which point the thickness ofthe film is insufficient.
The fact that the aqueous environment is preserved in vitrified specimens doesnot mean that there are no surface effects. Particles in water can interact eitherwith the air/water interface or with the supporting film, should there be one.These effects are known from conventional electron microscopy and they have alsobeen used for a long time. For example, in negatively stained preparations, someparticles adhere more readily than others to the supporting film (Dubochet& Kellenberger, 1972) and others are adsorbed with preferential orientations(van Heel, 1981). The famous Kleinschmidt method for visualizing nucleic acids(Kleinschmidt & Zahn, 1959) and its successors (Brack, 1981) also relies onspecific adsorption on to a layer of surface-denaturated proteins. The surface effectstaking place in the liquid are frequently conspicuous in vitrified specimensbecause they are not hidden by more brutal forces. In particular, the possibilityof preparing specimens in absence of a supporting film, allows much more subtlerearrangements of the mobile particles under the action of the surface forces.Some examples are given below.
The micrograph reproduced in Fig. 26 is an unsupported preparation ofpartially dissociated adenovirus, showing a large number of groups of nine (G9)which, in the virus, form the central part of each face. Depending on their

172 J. Dubochet and others
: * . - • (c)
Fig. 25. Polyheads of the T4 bacteriophage. (a) Prepared in a c. 100 nm thick layer ofvitrified solution. Two particles are flattened at the point where they are superimposed, (b)Optical diffractogram of a particle shown in (a). It is characteristic for a cylindrical particle.(c) Optical diffractogram of a particle embedded in a vitrified layer, much thinner than theparticle diameter. It is characteristic of a flattened particle. (From Lepault (1985), withpermission.)
orientation, the G9 should appear right- or left-handed. Surprisingly enough,only left-handed are visible in the figure. Why is this the case when, at first sight,one would guess that they are in a symmetrical situation between the two surfacesof the thin film ? The only explanation we can propose is schematized in Fig. 27.It implies that the specimen observed in Fig. 26 is not a faithful representation ofthe bulk solution but only of its surface. A similar surface-effect takes place withmost suspensions. As a result the density of particles in the vitrified thin film doesnot correspond to the concentration in the bulk solution. It may be higher if theparticles tend to adsorb to the surface or lower in the opposite case. Discrepanciesby two orders of magnitude are not infrequent. In this respect, lipid vesicles areremarkable. It may be observed, for example, that a high concentration of lipidvesicles are observed in a thin film made from a 10 mg/ml solution but thatpractically no particles are observed at half this concentration. One possibleexplanation is that the vesicles left in the thin film fuse with the freshly formed air/water interface until a monolayer is formed on the surface. Vesicles observed inthe specimen are only those left in the liquid after the surface is fully covered orafter vitrification has put an end on the phenomenon.

Cryo-electron microscopy of vitrified specimens 173
Fig. 26. Thin vitrified layer of a solution of partially disrupted adenovirus. Many groups ofnine (Go) are visible; some have been marked by an arrow. (From Dubochet et al. 1985.)

174 J. Dubochet and others
(a) (!>)
Fig. 27. Schematic explanation for the asymmetry of the Go, observed in Fig. 26.Depending from which side they are observed, the G9 are seen as L or R. When the drop ofsuspension is put on the grid, those G9 which are close to the surface take a fixedorientation (a). Removing most of the drop from one side leaves a sample which onlyrepresents the left-side of the bulk sample (b). (From Dubochet et al. 1985.)
• • •t
*•*?,% tit**•
<f
Fig. 28. Thin vitrified layer of ^29 bacteriophages, prepared on a perforated carbon film.The viruses, rejected from the thinnest central part of the grid hole (above right corner), areconcentrated at the edge where they form a loose hexagonal packing.
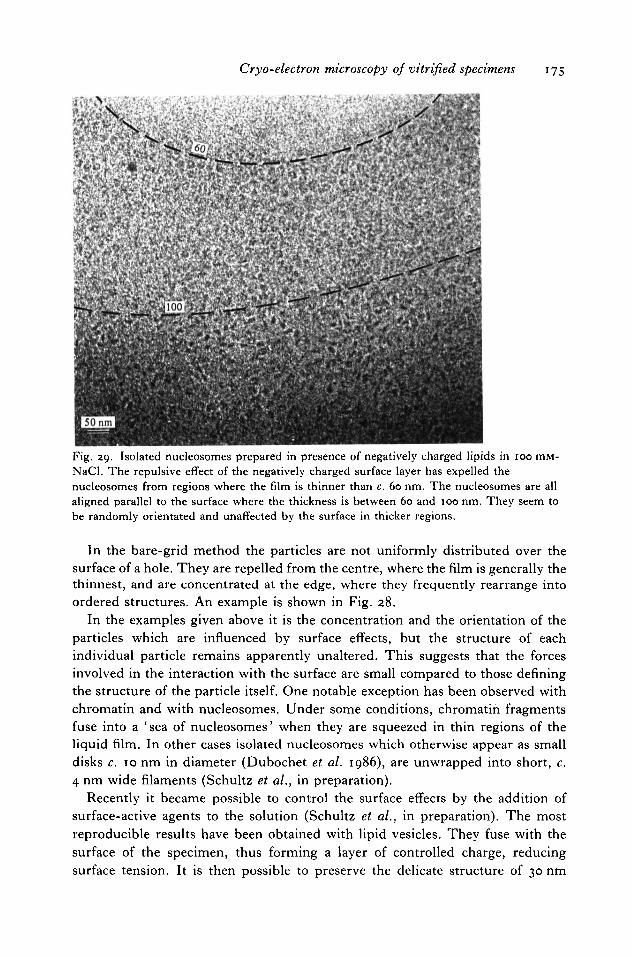
Cryo-electron microscopy of vitrified specimens 175
Fig. 29. Isolated nucleosomes prepared in presence of negatively charged lipids in 100 mM-NaCl. The repulsive effect of the negatively charged surface layer has expelled thenucleosomes from regions where the film is thinner than c. 60 nm. The nucleosomes are allaligned parallel to the surface where the thickness is between 60 and 100 nm. They seem tobe randomly orientated and unaffected by the surface in thicker regions.
In the bare-grid method the particles are not uniformly distributed over thesurface of a hole. They are repelled from the centre, where the film is generally thethinnest, and are concentrated at the edge, where they frequently rearrange intoordered structures. An example is shown in Fig. 28.
In the examples given above it is the concentration and the orientation of theparticles which are influenced by surface effects, but the structure of eachindividual particle remains apparently unaltered. This suggests that the forcesinvolved in the interaction with the surface are small compared to those definingthe structure of the particle itself. One notable exception has been observed withchromatin and with nucleosomes. Under some conditions, chromatin fragmentsfuse into a ' sea of nucleosomes' when they are squeezed in thin regions of theliquid film. In other cases isolated nucleosomes which otherwise appear as smalldisks c. 10 nm in diameter (Dubochet et al. 1986), are unwrapped into short, c.4 nm wide filaments (Schultz et al., in preparation).
Recently it became possible to control the surface effects by the addition ofsurface-active agents to the solution (Schultz et al., in preparation). The mostreproducible results have been obtained with lipid vesicles. They fuse with thesurface of the specimen, thus forming a layer of controlled charge, reducingsurface tension. It is then possible to preserve the delicate structure of 30 nm

176 J. Dubochet and others
chromatin filaments and of nucleosomes by preparing them in the presence ofneutral lipids. Isolated nucleosomes also remain intact when they are preparedbetween two negatively charged surfaces. They are, however, repelled away fromthe surface and are concentrated in the middle of the film. An example is shownin Fig. 29. The nucleosomes have been rejected from the central region of thehole, where the film is the thinnest. In intermediate regions, where the film is60-100 nm thick, the interaction with the surface is still strong enough to orientateall the nucleosomes in the plane of the film. In still thicker regions the nucleosomesare randomly orientated, showing that the energy involved in the interaction withthe surface is not sufficient to hold the nucleosomes in their random thermalmotion.
7. CRYOSPECIMEN HOLDER
The devices for observing cold specimens by electron microscopy are as numerousas they are diverse. Since the first report was published in 1954 (Leisegang, 1954),new systems are presented at every major electron-microscopy conference. Someof them are only simple modifications of standard specimen holders, others are allnew instruments of great cost and complexity (Fernandez-Moran, 1966). Amongthese profuse offers (Heide 1982&) the choice of the best system for practical workwith vitrified biological specimens may seem difficult. This is, however, not so ifthe requirements are clearly set. They are: (a) operation temperature around—160 °C, (b) good resolution, (c) possibility of transfer of vitrified specimens,(d) low contamination, (e) ease and speed of operation, (/) reasonable price.
Several designs of cryospecimen holders fulfil these requirements, others havebeen found unsuitable for the work with vitrified specimens. The choice of thebest system and its optimal use requires a good knowledge of the workingprinciple as also of the technical pitfalls encountered in their construction and use.This is the subject of the present chapter. The discussion is based on a side-entryholder cooled by metal conduction (Fig. 30) as is the case for the Gatan system(Gatan, Pittsburgh, USA). Other systems are discussed by comparison.
7.1 Heat transfer
The temperature of the specimen (T2) in the cryo-specimen holder depicted inFig. 30 results from the cooling effect of liquid nitrogen (T1 = —196 °C) actingthrough a conductive metal rod and of the heat coming from the warmsurrounding (T3) through direct contact, through the surrounding gas or bythermal radiation. The electron beam can also bring a significant amount of heat.The various effects are discussed below.
Conduction through a solid. Heat conduction through a solid, wc, is locallyproportional to the section S and to the temperature gradient: wc = Ac S(dT/dx).The proportionality factor, AC(T), is the thermal conductivity. It depends on thetemperature but for most solids it does not vary by more than a factor of twobetween room and liquid-nitrogen temperature. Some values are given in

Cryo-electron microscopy of vitrified specimens 177
Electrons
Radiation
Fig. 30. Schematic representation of a side-entry cryospecimen holder cooled by conductionin a metal rod. The temperature T2 of the specimen results from the balance between thecooling of the liquid nitrogen at temperature 7j, —196 °C, and the heating from the warmsurrounding, acting by direct contact with surfaces at room temperature, 7̂ , by gasconduction, by radiation and by the energy brought with the electron beam.
Table 3. Thermal conductivity Ac, expressed in W/m.°C, for some solids
Temperature (°C)
Stainless steelCopperBrassGlassTeflonNylon
— 269
0-24240
2
o-i0-046O-OI2
— IOO
9'5°450
47°'50-240 3 1
20
15400
901
0-26o-35
Table 3. The heat flow through the rod of length L and of section 5 can thenbe approximated by: wc = SAC(T2— X^/L.
Gas conduction. Gas transfers energy to the specimen by laminar or by freemolecular conduction, depending on the pressure. At atmospheric pressure it canalso act by convection, which is a form of forced diffusion due to gas movement(wind). This latter effect may be important and it should be avoided by preventingthe flow of air on to the specimen. It is difficult to estimate and will therefore notbe discussed further in this chapter. Laminar or molecular conduction depends onthe mean free path A of the molecules. By definition, A is the average distancetravelled by a molecule between two collisions with other gas molecules. It caneasily be calculated from the perfect gas theory and, for air, it can be expressedby A = 6 x io~3/P, in which A is expressed in metres and P in pascals (1 Torr
= 133 Pa).Laminar conduction takes place when the mean free path is much smaller than
the geometric dimension of the system. This is the case when the specimen is atatmospheric pressure or in the prevacuum of the specimen airlock. Themechanism is illustrated in Fig. 31(0). In a first approximation this mode ofconduction is independent of the pressure. It can be characterized by the

178 J. Dubochet and others
(a) (6)
r, T2 r, T2
Fig. 31. Principle of thermal conduction by laminar (a) and molecular (&) conductionbetween the surfaces at temperature Tt and T2.
coefficient of laminar conduction A1; which for air has the value 2-5 x 10 2 W/m.°Cat room temperature and o-8 x io~2W/m.°C at liquid-nitrogen temperature.
Molecular conduction takes place when A is larger than the geometricaldimension of the system and therefore when the molecules bounce directly betweenthe warm and the cold surface (Fig. 316). An important parameter is then theaccommodation coefficient a, the ratio of the actual average energy deposited bya molecule hitting the cold surface to the energy it could deposit if all its energywere given, a describes therefore how a molecule is effectively cooled when ithits the cold surface. The heat transfer by the gas is then expressed bywm = Sa.P(T1 — T2)/\/M, where M is the molecular weight of the gas. In air,between two fully accommodating surfaces at room and liquid-nitrogentemperature, the energy transfer is 6 W/m2 at io~2 Pa measured at roomtemperature. It decreases linearly with decreasing pressure.
Radiation. The heat transfer from a warm surface to a cold surface by radiationis governed by the T4 relation of the Stefan-Boltzmann Law. For a small coldobject on a large warm container it can be expressed by wT = S2e2o~(Tl-Tl), wherea = 5-67 x io~8 W/m2 K4 is the Stefan-Boltzmann constant, S2 the surface ande2 the emissivity of the cold surface, which corresponds to the proportion ofradiation energy actually received by the surface. It depends sharply on thesurface state; a realistic value for a carbon-coated copper grid at liquid-nitrogentemperature could be around 0-03.
Condensation. It has been observed that vitrified specimens crystallize sometimeduring the rapid condensation of a water layer. This is possibly due to the fact thatthe condensing water molecules come from warmer regions of the microscopecolumn and bring more energy than can be removed by conduction through thespecimen and the holder. For example, the immediate condensation of watermolecules of energy corresponding to room temperature into a layer with a massequal to that of a vitrified specimen at — 160 °C would raise the temperature of thespecimen to —90 °C-far above the devitrification temperature.
7.2 Electron-beam heating
Electrons lose energy when they are inelastically scattered in the specimen. Onaverage, this represents about 20 eV each time an electron crosses 80 nm of

Cryo-electron microscopy of vitrified specimens 179
biological material and this energy appears as heat in the specimen (see below,beam damage). The warming of a thin film has been calculated and the resultstested for various irradiation conditions. It is found to be at most a few degreesfor normal working conditions with vitrified specimens around liquid-nitrogentemperature. The situation may, however, be different for large particles attachedwith bad thermal contact to the supporting film as is frequently the case forcontaminating ice crystals or for the whole specimen grid if it is not well fixed inits holder.
7.3 Quantitative estimation
The system, schematically represented in Fig. 30, is used as an example. Furthercharacteristics are: cryogen temperature, Tx = —196 °C (boiling nitrogen);specimen temperature, T2 = — 183 °C; length of the copper bar, C = 25 cm. Thesurface of the specimen holder is 5 cm2, its emissivity e2 is 0-03 and theaccommodation coefficient a is 1. The copper bar is surrounded by a stainless-steel shroud 20 cm long of 8 mm diameter and o-i mm thickness connecting thespecimen holder to the microscope wall (T3 = 27 °C). The heat transfer from thetip of the holder is negligible. Applying the data given above to this system leadsto the following values:
(1) heat conduction through the shroud: Wc = 37 x io~3 W;(2) heat transfer by radiation: Wr = 450 W/m"2.S, e2 = 7 x io~~3 W;(3) heat transfer by residual gas: Wm = aW/mT2. S, a = 3 x io"3 W.In this case the major part of the heat exchange takes place through the shroud.
Heat exchange by radiation or by the electron beam is not negligible, however, ifthey act on the specimen grid alone as is approximately the case when it is isolatedfrom the rest of the holder by ice crystals. Thus, a 100 kV electron beam of 5 /imdiameter with a flux of 1000 electrons/nm2. s leaves 3 x io~4 W on the grid if it iscompletely intercepted by a grid bar. The copper grid (diameter: 3 mm;thickness: 30 jim) would warm up at the rate of c. 0-5 °C/s. This would haveimportant consequences. However, if the electron beam goes through a thinvitrified film, it loses only a small fraction of its total energy and beam-heatingbecomes negligible again. This calculation also shows that heat transfer byresidual gas or radiation may be important if the grid is not in good thermalcontact with the rest of the specimen holder. A radiation shield, as theanticontaminator may be, and an excellent vacuum are therefore important foroptimal observation conditions.
7.4 Contamination
Contamination with water is a severe problem in cryo-electron microscopy. Thereare several reasons for this: Firstly, the cold specimen is an efficient cryopump forwater and some other substances which are volatile at room temperature.Secondly, the introduction of hydrated specimens in the electron microscopecannot be done without also introducing some additional water in the specimenchamber. Thirdly, ionic pumps which are frequently used for the specimen

180 J, Dubochet and others
(a) . *
Fig. 32. Various forms of contamination on the specimen, (a) Hexagonal ice crystals formedin humid air and deposited during preparation of the specimen (in particular in thecryochamber of the microtome) and during transfer, (b) Agglomerate of hexagonal icecrystals formed by humid air condensing on liquid nitrogen, (c) Layer of vitreous waterdeposited in the microscope, on a thin vitrified film. Hexagonal ice crystals deposited on thespecimen have been shadowed, thus revealing the contaminating layer and demonstratingthat the water molecules came predominantly from one direction, (d) Crystals of cubic iceformed by deposition of water vapour in the microscope in a similar but more rapid waythan in (c).
chamber are poisoned with water and may lose their efficiency. All this may resultin various disturbing effects which are important to diagnose.
Hexagonal ice crystals are formed in the cold air of the preparation chamber orin the liquid nitrogen used for specimen preparation and transfer. They fall downin the air, like snow, and accumulate on the specimen (Fig. 32a). This effect maybe severe in the cryochamber of the microtome where the grids are exposed formany minutes but it also takes place to a lesser extent, during transfer of thespecimen into the electron microscope. The ice crystals formed in liquid ethaneand liquid nitrogen are frequently smaller. As illustrated in Fig. 326, they tendto form large agglomerates with the typical shape of diffusion-limited aggregates(Sander, 1986). The contamination formed during preparation and transfercannot be completely suppressed, but the simple measures described below (see' How to Operate') reduce it to a level where it causes no practical trouble.
More severe, and more difficult to prevent, is the contamination taking place inthe electron microscope by condensation of water vapour. It may originate, inpart, from the usual water source of the microscope and in particular from
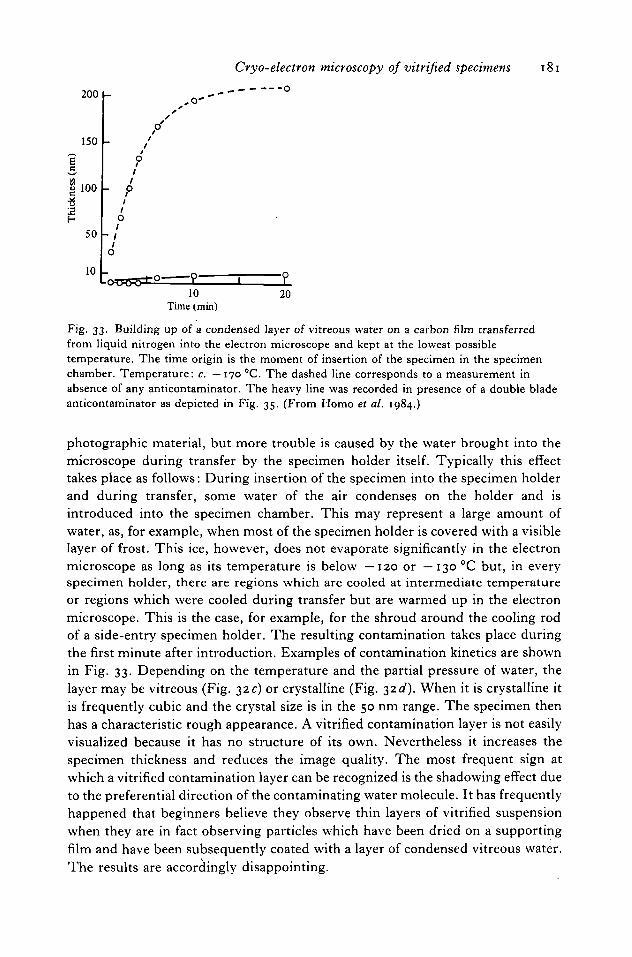
*H
200
150
100
50
10
h P
- Il
o
Cryo-electron microscopy of vitrified specimens 181
o
10Time (.mtn)
20
Fig. 33. Building up of a condensed layer of vitreous water on a carbon film transferredfrom liquid nitrogen into the electron microscope and kept at the lowest possibletemperature. The time origin is the moment of insertion of the specimen in the specimenchamber. Temperature: c. —170 °C. The dashed line corresponds to a measurement inabsence of any anticontaminator. The heavy line was recorded in presence of a double bladeanticontaminator as depicted in Fig. 35. (From Homo et al. 1984.)
photographic material, but more trouble is caused by the water brought into themicroscope during transfer by the specimen holder itself. Typically this effecttakes place as follows: During insertion of the specimen into the specimen holderand during transfer, some water of the air condenses on the holder and isintroduced into the specimen chamber. This may represent a large amount ofwater, as, for example, when most of the specimen holder is covered with a visiblelayer of frost. This ice, however, does not evaporate significantly in the electronmicroscope as long as its temperature is below —120 or —130 °C but, in everyspecimen holder, there are regions which are cooled at intermediate temperatureor regions which were cooled during transfer but are warmed up in the electronmicroscope. This is the case, for example, for the shroud around the cooling rodof a side-entry specimen holder. The resulting contamination takes place duringthe first minute after introduction. Examples of contamination kinetics are shownin Fig. 33. Depending on the temperature and the partial pressure of water, thelayer may be vitreous (Fig. 32c) or crystalline (Fig. 32c?). When it is crystalline itis frequently cubic and the crystal size is in the 50 nm range. The specimen thenhas a characteristic rough appearance. A vitrified contamination layer is not easilyvisualized because it has no structure of its own. Nevertheless it increases thespecimen thickness and reduces the image quality. The most frequent sign atwhich a vitrified contamination layer can be recognized is the shadowing effect dueto the preferential direction of the contaminating water molecule. It has frequentlyhappened that beginners believe they observe thin layers of vitrified suspensionwhen they are in fact observing particles which have been dried on a supportingfilm and have been subsequently coated with a layer of condensed vitreous water.The results are accordingly disappointing.
182 J. Dubochet and others
7.5 Anticontaminator
Water cannot be completely removed from the microscope. In fact, every surfacewhich is not very cold is a source of water. The worst is the immediate vicinity ofthe specimen, where large amounts of water are introduced at each transfer. Theanticontaminators of most modern microscopes are designed to prevent moleculesthat condense at room temperature (as, for example, hydrocarbons from thediffusion pump or solvents used for cleaning) from reaching the specimen. Inorder to leave more space around the specimen they are generally placed at somedistance from it. They are, however, not made to prevent water, originating fromthe specimen chamber, from reaching the specimen.
An adequate anticontaminator for protecting the specimen from watercontamination is described in Figs. 34 and 35. The plans can be provided uponrequest. This device consists of a cold shroud surrounding the specimen in sucha way that, from every point of the specimen, the solid angle through which warmparts of the microscope can be seen is as small as possible but still allows efficientpumping of non-condensing gas around the specimen. Assuming a stickingcoefficient of 1 for the anticontaminator and a temperature low enough to makewater evaporation negligible, only those molecules coming through the solid angleQ will contribute to the contamination on one point of the specimen.Contamination is therefore reduced by the ratio Q/zn (for one side). In fact, thissimple description is not correct because the sticking coefficient, which dependson the temperature, is smaller than one. Molecules approaching with otherdirections may nevertheless reach the specimen after some rebounding. Thetemperature of the anticontaminator must therefore be below that at which waterevaporation becomes negligible (c. — 130 °C), and also below that of the specimenitself. The system shown in Fig. 35 has been found to give good results (Homoet al. 1984). It reaches a temperature of —180 °C. It is independent of the X-Yspecimen movement, thus allowing the whole specimen to be observed, thoughnot on one field. It is retractable in order to leave space for tilting the specimen.This can be done, some minutes after introduction, when the vacuum in thespecimen chamber is restored.
Some manufacturers have added to the specimen holder a cold shutter just atthe top and bottom of the specimen. It protects efficiently during transfer anduntil the vacuum is restored. It can be retracted from the outside for observation,but when this is done the specimen is no longer protected.
7.6 Stability
Most cryospecimen holders are less stable than the corresponding room-temperature holder. In particular they suffer from thermal drift and fromvibration originating in the cryogen. Thermal drift arises from changes indimension of the material when the temperature varies. This effect can beconsiderable, as illustrated by the following example: using the geometry of Fig.30 and assuming that the fixed point at room temperature, T3, is at 15 mm from

Cryo-electron microscopy of vitrified specimens 183
Y/t
ii
\ i\i
• To cryogen
/ \
Fig. 34. Principle of a double-blade anticontaminator. Q is the solid angle in whichcontaminating molecules can reach the specimen.
Withdrawal in x,precise mechanical translationsinx;y andz.
AluminiumVacuum alloy fork
^ WWW) Apertures 500 jim
Copperrod
Liquidnitrogen
. . . , . T h i n stainless-steel Cryo-specimenStamless-steel tube as thermal \L
bellows insulator
Fig. 35. Double-blade anticontaminator for reducing the condensation of water vapourproduced in the vicinity of the specimen. (From Homo et al. 1984.)
the specimen, the thermal contraction during cooling of the holder will displacethe specimen by c. 65 /im if the holder is made of aluminium. In order to reducethis effect, one manufacturer has replaced the connexion at the tip of the specimenholder by a quartz rod, which has a temperature dilatation coefficient 50 timessmaller. Another approach consists of maintaining the specimen at a constanttemperature during observation. This, however, is difficult because thetemperature of the specimen depends on the heat flow coming from the punctualcontact at the tip of the holder. This is a poorly defined thermal contact which mayvary with each movement of the specimen, thus inducing short-term drift.
Vibration is frequently associated with the exchange of energy which is requiredfor cooling the specimen. For example, in the system schematized in Fig. 30 anyforces acting in or on the cryogen recipient, and in particular those due to boilingof the liquid cryogen, propagate along the cooling rod and make the specimenvibrate perpendicularly to the rod. This effect is difficult to suppress because, ifthe specimen holder is made to be more robust, the increased thickness of the

184 J. Dubochet and others
Microscope column
Glass beads
Fig. 36. Schematic view of the gas-cooled cryospecimen holder of the type Philips PW/6591. For a better representation in the drawing, the tip of the holder is rotated by 900 inrespect of the liquid-nitrogen recipient. For explanation, see text.
materials act against good thermal isolation of the specimen. A smart system hasbeen designed in the Gatan cryoholder. It consists of suppressing boiling in theliquid nitrogen be excellent isolation of the container. This minimizes evaporationonce the equilibrium temperature is reached. The internal wall of the recipientvessel is made of thick conductive material to spread the heat along the surface incontact with the liquid nitrogen. The small amount of heat, flowing from the rodis then exchanged at the surface of the liquid nitrogen, which evaporates withoutvisible boiling. The disadvantage of the system is a consequence of its excellentisolation; it takes a long time to reach equilibrium.
7.7 Other side-entry cryospecimen holders
Side-entry specimen holders can also be cooled by a flow of cold gas. This is thecase for the old Philips system PW/6591 (Philips, Eindhoven, The Netherlands),which is unfortunately no longer commercially available. It is schematized in Fig.36. In this system the liquid nitrogen is boiling in a container outside the electronmicroscope, thus building up pressure for blowing cold nitrogen gas through athin pipe to a heat exchanger close to the specimen. The specimen itself ismounted in a small copper support fixed by three glass beads into the tip of thespecimen holder. This system has two specific advantages. Firstly, the borderbetween the cold and the warm region of the specimen is formed by the three glassbeads placed symmetrically around the specimen. In principle, long-rangethermal drift is therefore suppressed. Secondly, cooling by gas flow is very rapidbecause the mass and the size of the cold part is small. Good working conditionscan therefore be reached within minutes of introduction; Cooling by gas flow has,however, the drawback of causing turbulences and therefore vibrations in theimmediate vicinity of the specimen. Experience has shown that, with someprecautions, this effect can be kept within acceptable limits.
An interesting idea developed recently consists in replacing the metal rod for

Cryo-electron microscopy of vitrified specimens 185
Fig. 37. Bubbling on a carbon-coated formvar film c. 10 nm thick, covered with a layer ofcondensed vitreous water. Fields (a)-(h) correspond to irradiations by 5, 20, 40, 80, 120,240, 340 and 450 ke/nm2 respectively. The total thickness of the specimen is 160 nm.
N,0(b)
Fig. 38. Beam-induced formation of nitrous oxide crystals from a carbon-coated collodionfilm covered with a layer of cubic ice. The dose given is 4 ke/nm2 and the temperature is— 160 °C. (a) Direct image. C, Crystals of N2O; P, polystyrene spheres; /h, contaminatinghexagonal ice crystal. (6) Electron diffractogram of the same field showing a powderdiffractogram with the ring of cubic ice and N2O. The (211) reflection of cubic ice Ic
corresponds to 0-224 nm. (From Dubochet et al. 1982 a, with permission.)
thermal conduction by a heat pipe (Jakubowski, 1985). This device transfers heatin closed circuit by capillary flow of a liquid cryogen from a cold source, where theliquid is condensed from the gas phase, to the warm source where it evaporates.As compared to the copper rod of equal sections, a heat pipe is in principle capableof a 600-fold increased thermal conduction. Thermal stability could then bereached very rapidly in the specimen.
7.8 Top entry
A number of top-entry cryospecimen holders have been designed and built.Several are still operating with success. An excellent review is found in Heide
186 J. Dubochet and others
(19826). Compared to side-entry systems, they have the advantage of an in-herently symmetrical temperature gradient and therefore should not be affectedby thermal drift. In some systems it is only the specimen cartridge which isactively cooled and it is thermally isolated from the rest of the electronmicroscope. In other cases - as, for example, in the system installed since 1983 onZeiss electron microscopes - it is the whole specimen table which is cooled. Thecartridge is kept at low temperature by contact with the cold table. This systemoffers excellent conditions for minimizing thermal drift, and also the effect ofexternal vibration is easy to avoid because of the large mass and rigidity of the coldpart.
8. IMAGE FORMATION
A general description of image formation in electron microscopy can be found inseveral textbooks (Heidenreich, 1964; Reimer, 1984; Saxton, 1978). Short butexcellent presentations are also found in articles (Erickson & Klug, 1971; Amoset al. 1982). The wave theory of image formation requires a knowledge of opticswhich can be gained from a standard textbook (Born & Wolf, 1975) or in an easyand didactical form in the Lectures on Physics by Feynman et al. (1965). The caseof image formation by amplitude contrast has been treated in view of quantitativemeasurements on hydrated specimens (Eusemann et al. 1982).
A basic concept of quantum mechanics is that an electron is a particle or a wave,depending on the experiment in which it is participating. A typical experiment inwhich the electron is a particle is schematized in Fig. 39(0). It consists inremoving all the electrons that are scattered by more than a given angle, 60. In theelectron microscope the objective aperture is used for that purpose and 60 isthe objective aperture angle. Contrast arises by the fact that some regions of thespecimen scatter more electrons than others and, consequently, less electronsarrive in the corresponding region of the image.
Completely different is the image in which the electron is a wave. It is thendiffracted in the specimen and made to interfere with the undiffracted part of thewave in the image plane by the optical system. In this mode of image formation,schematized in Fig. 39(6), all the electrons crossing the specimen participate in theimage. Contrast results from the interference of all the individual electrons. Itshould be noted that interferences can equally well be obtained with electrons thathave lost energy in the specimen as with those that have not, but the image isfocused in a different plane.
8.1 Amplitude contrast
Amplitude-contrast bright-field image formation is the dominant mode whenlarge specimens are observed in focus with a small objective aperture. Thecontrast results from the scattering of the electrons by the atom of the specimen.Each atom has its own scattering amplitude. These complex values are tabulatedin the literature (Schafer et al. 1971). By chance, it so happens that, within a useful
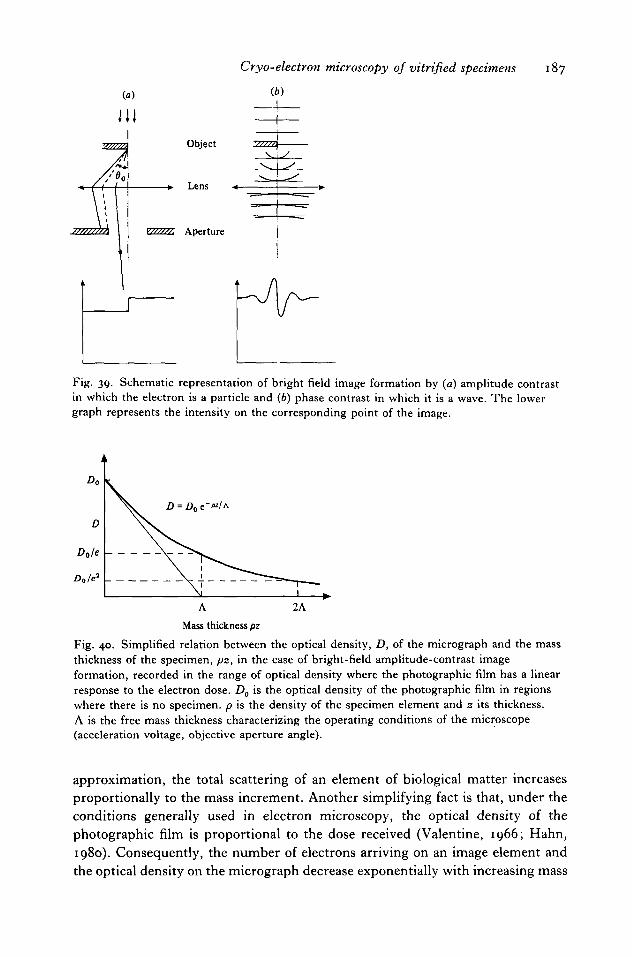
Cryo-electron microscopy of vitrified specimens
(6)
187
Object
Lens
v//////. Aperture
Fig. 39. Schematic representation of bright field image formation by (a) amplitude contrastin which the electron is a particle and (b) phase contrast in which it is a wave. The lowergraph represents the intensity on the corresponding point of the image.
D0/e - \ - - ^
D0/e
Mass thickness pz
Fig. 40. Simplified relation between the optical density, D, of the micrograph and the massthickness of the specimen, pz, in the case of bright-field amplitude-contrast imageformation, recorded in the range of optical density where the photographic film has a linearresponse to the electron dose. Do is the optical density of the photographic film in regionswhere there is no specimen, p is the density of the specimen element and 2 its thickness.A is the free mass thickness characterizing the operating conditions of the microscope(acceleration voltage, objective aperture angle).
approximation, the total scattering of an element of biological matter increasesproportionally to the mass increment. Another simplifying fact is that, under theconditions generally used in electron microscopy, the optical density of thephotographic film is proportional to the dose received (Valentine, 1966; Hahn,1980). Consequently, the number of electrons arriving on an image element andthe optical density on the micrograph decrease exponentially with increasing mass

188 J. Dubochet and others
0-4
0-35
0-3
0-25
0-2
015
-
' U =
-
-
-
i
100 kV
/
i > I i i i
4 6 S 10 12 14 16
Objective aperture (mrad)
Fig. 41. Mean free mass thickness, A, expressed as a function of the objective apertureangle, 60, for bright-field image formation with 100 kV electrons. One mg/m2 corresponds toa thickness of 1 nm at a density of 1 g/cm3. (From Eusemann et al. (1982), withmodifications.)
thickness, pz, of the specimen, in which p is the density and z the thickness. Thisrelation is drawn in Fig. 40. The characteristic parameter, A, is the mean free massthickness, corresponding to the mass thickness producing, on average, onescattering event per electron. The value of A, expressed as a function of theobjective aperture angle, 60, is given in Fig. 41, for 100 keV electrons. For otherenergy it varies with the square root of the voltage. All these data are veryapproximate and they apply only to cases where phase contrast is negligible, whichis not easy to ascertain when small specimens are observed. They are, however,useful for rapid estimation of specimen thickness or particle mass. They can alsobe used to estimate the density of large particles and even the hydration ofspecimens, by comparing the mass thickness before and after freeze drying.Practical examples are given in Dubochet et al. (1982 a, b).
8.2 Phase contrast
Phase-contrast image formation relies on the phase shift, A0, between thediffracted and the undiffracted wave. The first contribution to the phase shift,A0j, is introduced by the specimen itself. It is normally close to TT/Z. The secondcomposant, A^2, is due to the optical system itself, where defocus, Az, andspherical aberration, Cs, both contribute to the shift of the wave of wave length A,according to the equation (Scherzer, 1949).
However, in order to be best expressed in terms of contrast, the additional phaseshift, A02, must also be 77/2 or, more generally, any value like (zn— 1)77/2, in whichn is an integer so that the scattered wave is brought into or out of phase with theunscattered wave, and can thus best interfere. For other values, the contrast is less

Cryo-electron microscopy of vitrified specimens 189
f? t..O'l /im
MX
(e) / Y V V
nm
Fig. 42. Focus series of a vitrified solution of Semliki forest virus recorded at 1-5, 3, 6 and11 /tm underfocus for (a)-{d) respectively, (e) Corresponding phase-contrast transferfunction.

190 J. Dubochet and others
strong, or even completely suppressed for phase shift of nn. The contrast transferfunction, sin A02, expresses this property. Examples are represented in Fig. 42(6),for some values of Az. From these properties, it becomes evident that phasecontrast is an efficient mode of image formation for observing thin structureswhich produce only small amplitudes for the diffracted waves. Besides this, aphase image does not contain the whole information spectrum picked-up by theelectron beam in the specimen. At least two micrographs are needed to fill the gapsof the transfer function and the long-range information is always missing.
8.3 Real image
In practice, both amplitude and phase-contrast contribute to image formation.The situation is especially favourable in typical negatively stained specimens.They can be imaged in a slightly underfocused situation, in such a way as toproduce good phase contrast for the smallest structures that one can reasonablyhope to observe. Amplitude contrast complements this information for largerdimensions where the phase-contrast transfer function becomes very small. It isthus possible to obtain in a single micrograph a good representation of all theinformation provided by the specimen. This favourable situation does not holdtrue for specimens that can be studied at very high resolution (Erickson & Klug,1971) for unstained crystalline objects (Unwin & Henderson, 1975) or, evenworse, for hydrated unstained specimens. In the latter case the contribution ofamplitude contrast is so small that, for most structures, image formation reliesexclusively on phase contrast up to dimensions around 10 or 20 nm. Indeed,structures like bacterial pilis (diameter = 6 nm), intermediate filaments(diameter = 10 nm) and even TMV or small spherical viruses (20 and 25 nmrespectively) are essentially invisible on precisely focused micrographs, whereaseven a single double-strand DNA molecule can be seen if enough phase contrastis produced by a strong defocusing. This effect has been tested quantitatively inT-layers of B. brevis (Lepault & Pitt, 1984), on TMV (Lepault, 1985) and onthe tail of the bacteriophage T4 (Lepault & Leonard, 1985). There is a point,however, where amplitude contrast can no longer be neglected, in particular whenunperiodic objects are observed, for which correction of the transfer function hasto be made up to the origin. In the past the problem has been solved by addinga more or less arbitrarily chosen low-frequency component to the transferfunction (Erickson & Klug, 1971; Unwin, 1972). In principle it could also besolved by using the complex values of the scattering coefficients, as they arecalculated by the scattering theory (Schafer et al. 1971). There are also methodsto measure them directly in the electron microscope (Typke & Radermacher,1982). It seems probable, and this is confirmed by preliminary work on DNA-containing particles, that the problem of quantitative processing of images ofunperiodic, unstained, hydrated biological samples will require a more preciseapproach.
As a consequence of the low contribution of amplitude contrast to imageformation of unstained, hydrated specimens, the retrieval of all the information

Cryo-electron microscopy of vitrified specimens 191
contained in the electron beam relies much more on phase contrast than withconventional, dry, stained specimens. Even for observations limited to aresolution of several nanometres, two or more micrographs need to be recordedfor each specimen. The process is easy to optimize in this range of resolutionbecause the whole information spectrum is concentrated in the very small valuesof the diffraction angle 6. The term in #4 becomes negligible in the Scherzerequation and the first maximum of the transfer function corresponds to adimension d such as. d2 = 2AA2, whereas the first zero corresponds to d2 = AAz.Increasing Az by a factor of two brings the zero of the first image in coincidencewith the first maximum of the second image, thus optimally extending theretrieval of the long-range information. As illustrated in Fig. 42, the process canbe extended over several micrographs. Obviously it should not be done in thereverse order, because beam damage will have destroyed the high-resolutioninformation before the micrograph has been recorded.
Another difference between the image formation in stained and unstainedspecimens comes from the high proportion of inelastically scattered electrons. Ina thin specimen stained by heavy atoms, an image may be formed predominantlybe elastically scattered electrons. This is not the case in unstained hydratedspecimens as the mean free mass thickness for inelastic scattering, correspondingto c. 130 nm, is typically three times smaller than that for elastic scattering and isgenerally in the order of the thickness t of the specimen. The energy of theelectrons participating in the image therefore forms a broad distribution, thecentre of which can roughly be estimated to correspond to an energy loss ofAV = 20 eV x (t117,6). This change in the average electron energy also reduces thefocal length of the objective and places the specimen in a more underfocusedposition by Az = CeAV/2V, in which V is the acceleration voltage of themicroscope and Cc is the coefficient of chromatic aberration (typically = 2 mm).In practice this effect is not seen easily, probably because it is hidden by a moresevere one, the loss of resolution with increasing specimen thickness, caused inpart by the delocalization of the inelastic scattering events, and by the chromaticaberration due to the energy spread of the scattered electrons. The newlydeveloped electron microscope with energy filter could help reduce this lattereffect.
9. BEAM DAMAGE
The electron beam deposits energy in the specimen and causes it to deteriorate.Excellent general reviews of this subject have been written (Isaacson, 1977;Coslett, 1978), but for the specific case of hydrated specimens at low temperaturethe results are still scattered in many different articles (Glaeser & Taylor, 1978;Talmon et al. 1979, 1986; Dubochet etal. 1982 a, b; Talmon, 1982, i984;Lepaultet al. 1983 a, b; Jeng & Chiu, 1984).

192 J. Dubochet and others
9.1 Electron scattering
Elastically scattered electrons carry valuable information about the specimen, butfor acceleration voltage up to 100 kV few of them leave enough energy to displaceeven weakly bound atoms. Inelastically scattered electrons are those causing mostof the damage. They leave a large amount of energy in the specimen, amountingto 5-80 eV for 97 % of the events (Wall et al. 1974). On average, the energy loss,expressed in electronvolts, can be approximated by AE « 6Z, where Z is theatomic number of the scattering atom (Eusemann et al. 1982). For water theaverage energy loss per inelastic event is thus c. 20 eV. The ratio of elastic toinelastic scattering events can be aproximated by the simple equation cre/ai ~ Z/19 (Lenz, 1954; Crewe, 1973). This means that whereas there are about threeelastic for 1 inelastic event in a specimen stained with uranium, the ratio is ingeneral about 1 to 3 for water or biological specimens. A crude estimation of thecross-section for inelastic scattering is also given by the simple equation:CTj x QZ^/V in which V is the accelerating voltage (Lenz, 1954; Crewe, 1973). At100 kV this gives the value of 16 x io~4 nm2 for carbon and 3-6 x io~4 nm! for awater molecule, and the average distance between two inelastic scattering eventsin water (p = 0-92 g/cm3) is calculated to be about 90 nm, which agrees reasonablywell with the value of 132 nm given by a more careful analysis (Eusemann et al.1982).
9.2 The forms of beam damage
Heating. The electron beam heats the specimen. This effect was dramatic inearly microscopes but it is marginal in modern instruments with well-controlledillumination limited to the field of observation. This is particularly true for drybiological specimens observed at low beam current (Isaacson, 1977). Water is apoor heat conductor and vitrified specimens can therefore warm up more easily.Experiment and calculation show, however, that in this case also, heating isgenerally negligible (Talmon & Thomas, 1977 a, b, 1978, 1979). This can easily beconfirmed by observing that the evaporation rate of water is the same in theimmediate vicinity of the irradiated beam as in any other place. Beam heatingeffects are, however, expected when the temperature is close to liquid helium(Kohl et al. 1981) or around liquid nitrogen temperature, when the thermalcontact between specimen and holder is bad. This happens frequently for largecontaminating ice crystals lying on the specimen, sometimes for wholecryosections and rarely for a whole grid when it is thermally isolated from theholder by contaminating ice crystals.
Devitrification into cubic ice can be induced by the electron beam at atemperature where it would not take place naturally (Dubochet et al. 1982 c). Thedose for inducing this effect increases when the temperature decreases below thenatural devitrification temperature Tv. It is about 100 ke/nm2 at — 160 °C. At stilllower temperature all the water in the specimen has generally sublimated beforeit has time to crystallize.

Cryo-electron microscopy of vitrified specimens 193
Contamination. This is another effect caused by the electron beam at roomtemperature. It is due to the calcination of adsorbed carbonaceous moleculesdiffusing, on the specimen surface, into the irradiated area (Hart et al. 1970). It isessentially suppressed when the adsorbed molecules are immobilized by coolingthe specimen and, in general, this already takes place as soon the temperatureis some tens of degrees below zero °C (Leisegang, 1954; Wall et al. 1977).Consequently, beam-induced contamination generally has a negligible effect onvitrified specimens.
Mass loss is also considerably reduced at low temperature (Hall & Gupta, 1974;Dubochet, 1975, Freeman et al. 1980). For dry specimens it seems to have the lowvalue expected from knock-on processes in which surface atoms are directlyejected by the collision with the electron (Dietrich et al. 1978). In practice, it isnegligible for observations under low dose conditions around liquid-nitrogentemperature. The situation is different for hydrated specimens, where beam-induced sublimation and bubbling combine to cause mass loss.
Pure water sublimates under the beam at the approximate rate of 1 molecule forevery 100 electrons (Talmon et al. 1979; Dubochet et al. 1982 c). This representsa loss of 1 nm for a dose of about 3 ke/nm2, corresponding to a typical observation.Sublimation is independent of the thickness of the water layer. It is similarin vitreous, cubic or hexagonal ice. It is only marginally influenced by thetemperature since the measurement between —264 and — 183 °C gives only a 25reduction of the sublimation rate (Heide, 1982 a). Also the flux of the electronbeam seems of little influence, even in the STEM, where it is typically five ordersof magnitude larger than in the CTEM. All these properties suggest thatsublimation is the result of the ejection of surface atoms or small molecules eachtime they suffer an inelastic scattering event. An alternative proposal, the pre-knock-on process (Symons, 1982 b), hypothesises that the shock-wave producedby elastic scattering inside the specimen may free some atoms when it reaches thesurface.
Bubbling. As its name indicates, bubbling is an effect which makes hydratedorganic specimens appear to boil under irradiation by the electron beam. It wasfirst observed on frozen negatively stained specimens (Heide & Grund, 1974),then on catalase crystals in hexagonal ice (Glaeser & Taylor, 1978) and on plasticfilms covered with water (Talmon et al. 1979). Quantitative studies were made onorganic solutions (Dubochet et al. 1982 c), whereupon the name of bubbling wasintroduced, and on various biological particles (Lepault et al. 1983 a, b or c) andpolymers (Talmon, 1984; Talmon et al. 1986). Fig. 37 illustrates the developmentof bubbling on a carbon-coated plastic film covered with condensed vitreouswater. In this case the bubbles appear after an irradiation of c. 10 ke/nm2. At firstthey are numerous and small, but soon they fuse together and continue to grow,causing a large deformation to the specimen. The bubbles break when they reachthe surface and mass loss becomes more rapid. In the presence of only a smallamount of organic material it may happen that further irradiation makes thebubbles disappear again. Observing the development of the bubbles gives a goodidea of the activity that takes place in the specimen during irradiation. The reality
7 QRB 21

194 J. Dubochet and others
of the bubbles is also impressively demonstrated in stereopairs of specimens in anadvanced stage of bubbling.
Bubbling appears in vitrified samples of organic material and also betweenhexagonal ice crystals, where the organic material is concentrated. Specimens inwhich the water is crystallized into cubic ice are resistant to bubbling. It has alsobeen observed in pure water but for very high irradiation and especially alongcrystal defects (Unwin & Muguruma, 1971, 1972). In biological specimens itgenerally starts after an irradiation of 2-10 ke/nm2. This value depends on the sizeof the biological particle and on its density. For example, small viruses (TBSV)take longer to bubble than larger ones (SFV) and in T4 bacteriophages the denseDNA starts bubbling before the less-dense protein capsid. In vitrified sections ofwhole cells it is generally along the membranes and in the nucleus that bubblingstarts. Bubbling seems to depend only marginally on the dose rate, andmeasurements in the STEM give the same value as in the CTEM (W. Tichelaar,Heidelberg, private communication). It is reduced at very low temperature buteven at 4 K it does not seem to be suppressed. If this observation is confirmed, itwould imply that the gas forming the bubbles has truly strange properties.
Drift. This is not usually considered as a form of beam damage but in cryo-electron microscopy and, in particular, for hydrated specimens, the trouble causedby beam-induced displacements in the specimens is so disturbing that it cannotbe ignored. The usual syndrome is drifted micrographs. They give rise to acharacteristic optical diffractogram in which the information is present in onedirection but lost in all the others. Beam-induced drift is due to the forces createdby the accumulation of charges in the poorly conducting specimen. As opposed tothe drift caused by a displacement in the specimen holder, it varies rapidly in timeand over the illuminated area. It is more severe in the absence of a conductingsupporting film. Minimum dose imaging in which the micrograph is taken withthe first electrons crossing the specimen is especially prone to drift as the specimenhas no opportunity to stabilize beforehand. With a well-centered illumination thisresults in a typical pattern of radial drift increasing with the distance to the centreof the micrograph. The drift pattern is also generally influenced by the largeelectron dose which was applied during focusing in the immediate vicinity and justbefore recording the image.
There is no foolproof recipe to prevent beam-induced drift but much can bedone to reduce it by careful use of the electron beam. It is obviously an advantageif the beam is kept as low as possible during observation and that the specimen isleft for a period without irradiation before image recording. Most important isthat the operator always knows where the beam is applied during low-doseoperation in order to choose the optimal place to focus before recording. It is alsoof an advantage that the illuminated area is kept as small as possible. Extrapolatingon this observation, it has also been hypothesized that drift could be overcome bycombining a large number of partial images, each recorded in sequence, on thesame micrograph, with a very small illuminated area (R. Henderson, privatecommunication). Another approach may be derived from the well-knownobservation that specimens break much more readily in the absence than in the
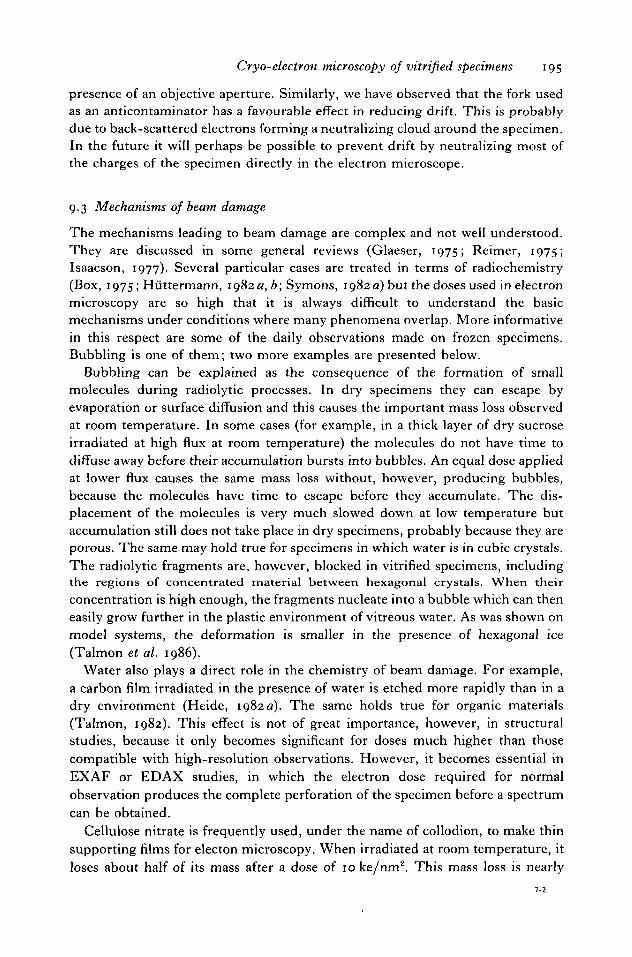
Cryo-electron microscopy of vitrified specimens 195
presence of an objective aperture. Similarly, we have observed that the fork usedas an anticontaminator has a favourable effect in reducing drift. This is probablydue to back-scattered electrons forming a neutralizing cloud around the specimen.In the future it will perhaps be possible to prevent drift by neutralizing most ofthe charges of the specimen directly in the electron microscope.
9.3 Mechanisms of beam damage
The mechanisms leading to beam damage are complex and not well understood.They are discussed in some general reviews (Glaeser, 1975; Reimer, 1975;Isaacson, 1977). Several particular cases are treated in terms of radiochemistry(Box, 1975 ; Huttermann, 1982 a, b; Symons, 1982 a) but the doses used in electronmicroscopy are so high that it is always difficult to understand the basicmechanisms under conditions where many phenomena overlap. More informativein this respect are some of the daily observations made on frozen specimens.Bubbling is one of them; two more examples are presented below.
Bubbling can be explained as the consequence of the formation of smallmolecules during radiolytic processes. In dry specimens they can escape byevaporation or surface diffusion and this causes the important mass loss observedat room temperature. In some cases (for example, in a thick layer of dry sucroseirradiated at high flux at room temperature) the molecules do not have time todiffuse away before their accumulation bursts into bubbles. An equal dose appliedat lower flux causes the same mass loss without, however, producing bubbles,because the molecules have time to escape before they accumulate. The dis-placement of the molecules is very much slowed down at low temperature butaccumulation still does not take place in dry specimens, probably because they areporous. The same may hold true for specimens in which water is in cubic crystals.The radiolytic fragments are, however, blocked in vitrified specimens, includingthe regions of concentrated material between hexagonal crystals. When theirconcentration is high enough, the fragments nucleate into a bubble which can theneasily grow further in the plastic environment of vitreous water. As was shown onmodel systems, the deformation is smaller in the presence of hexagonal ice(Talmon et al. 1986).
Water also plays a direct role in the chemistry of beam damage. For example,a carbon film irradiated in the presence of water is etched more rapidly than in adry environment (Heide, 1982 a). The same holds true for organic materials(Talmon, 1982). This effect is not of great importance, however, in structuralstudies, because it only becomes significant for doses much higher than thosecompatible with high-resolution observations. However, it becomes essential inEXAF or EDAX studies, in which the electron dose required for normalobservation produces the complete perforation of the specimen before a spectrumcan be obtained.
Cellulose nitrate is frequently used, under the name of collodion, to make thinsupporting films for electon microscopy. When irradiated at room temperature, itloses about half of its mass after a dose of 10 ke/nm2. This mass loss is nearly
196 J. Dubochet and others
suppressed and nothing seems to happen when the dry film is irradiated at lowtemperature. As illustrated in Fig. 38, and as reported previously (Dubochet et al.1982a), the situation is very different when the film is in water: during irradiation,a large number of small crystals grow into imbricated thread-like structures; theyreach a maximum size and number after some ke/nm2 and disappear slowly withfurther increasing dose. In the absence of irradiation, the crystals are stable at lowtemperature but they sublimate without remains above c. — i5o°C. Because ofthis low sublimation temperature it can be deduced that the substance forming thecrystals must be of relatively low molecular weight. It can be identified from itselectron diffractogram with the help of tables characterizing the crystal parametersof substances. One such table has been prepared for the special purpose of cryo-electron microscopy (Tatlock, 1982). It reveals that the crystals formed onirradiated collodion are made of nitrous oxide N2O. Obviously, the processleading to the formation of these crystals is complex; molecules of N2O must firstbe formed from the cellulose nitrate and they must then diffuse on the specimenuntil they are trapped on a growing N2O crystal. The role of water in the processis not clear, but without it no crystals are formed.
Pure ice seems to be stable when it is irradiated between liquid-nitrogentemperature and that at which its natural sublimation becomes significant; itscrystalline structure remains unchanged while the crystals slowly sublimate underthe effect of the beam. Below c. — 200 °C the situation is very different; thestructure of the ice crystal is destroyed and it is transformed into an amorphousmass after an irradiation of only 0-5-2 ke/nm2 (Lepault et al. 1983 c; Dubochet &Lepault, 1984). However, this amorphous substance retains some 'memory' of itshistory; upon rewarming above the devitrification temperature, it reforms theoriginal crystal even if it was hexagonal. If the irradiation is larger, correspondingto a dose of more than 2 ke/nm2, the 'memory' is lost and the usual transition,from vitreous to cubic, takes place at the usual temperature, Tv. This seeminglycontradictory property, namely that the sensitivity of ice to the electron beamincreases with decreasing temperature, can be explained by a so-called restorationmechanism: at very low temperature, ice is normally sensitive to beam damage, asare also any biological crystals, and each inelastic scattering event is likely toproduce structural damage. The crystals are therefore destroyed for a dose in therange of 1 ke/nm2; at a higher temperature, however, the unstable structureinduced by the inelastic event in ice is reactive enough for further transformation,but the only stable arrangement it can find is the initial state of the undamagedcrystal.
9.4 Structural damage
For the electron microscopist all these considerations about mass loss, gasformation or radiochemistry are of indirect interest. The only essential point isstructural damage, but of course this is difficult to measure directly at highresolution since any direct micrograph only provides the post-damage observationbut never the initial state (Unwin, 1974). Electron diffraction of crystals istherefore the avenue of choice for measuring structural beam damage to organic

Cryo-electron microscopy of vitrified specimens 197
specimens (Kobayashi & Sakaoku, 1965; Glaeser, 1971). It has also been appliedto vitrified biological specimens (Taylor & Glaeser, 1976; Lepault et al. 1983 a;Lepault & Dobochet, 19866; Jeng & Chiu, 1984). Altogether, the results can beexpressed quite simply by the following rules. (1) beam damage is reduced by afactor of 2—6 around liquid-nitrogen temperature, (2) there is no significantdifference whether the specimen is hydrated or not, (3) the resolution 8 (nm)obtainable on a vitrified specimen around liquid-nitrogen temperature is relatedto the total electron dose D (e/nm2) by the relation 8 = D/1000. This, somewhatoptimistic, rule of thumb, which is valid for a dose smaller than that inducingbubbling, is deduced from the few quantitative studies made by electrondiffraction on protein crystals. It also fits our observations made on viruses or theircomponents. In practice it means that, under usual recording conditions (1 opticaldensity unit, speed = 1 /tm"2), the first micrograph recorded withoutpreirradiation at 30000 times magnification (D = 1 ke/nm2) could recordinformation down to about 1 nm resolution. For each subsequent micrograph ofthe same field, the expected resolution is reduced by 1 nm.
Whether the very low temperature of 4 K, approached in some helium-cooledcryo-electron microscopes, further reduces structural damage has been the subjectof a heated debate (Siegel, 1972; Dietrich et al. 1979; Knapek & Dubochet, 1980;Lamvik et al. 1983 ; Lepault et al. 19836; Wade, 1984). With the conclusion of thestudy made in common by all the groups involved (International Study Group,1986), it now seems to be demonstrated that, under the present workingconditions, there is not much to be gained by liquid-helium cooling, at least as faras beam damage is concerned. The possibility that other observation procedures,specimen preparation methods, microscopes or, still better cooling (Fujiyoshiet al. 1986) may have a favourable effect is still open for discussion, but such claimswill have to be strongly substantiated before becoming accepted in the future.
IO. HOW TO OPERATE
This section describes practical methods to prepare and manipulate vitrifiedspecimens. The procedures have been chosen because they have been abundantlytested in our laboratory and because of their simplicity. Experience has shown thatnone of the operations described in this chapter is difficult in itself. The qualityof the final results depends, however, on their smooth and rapid succession andthey should be practised accordingly. The reader will adapt them to his ownconvenience and to match the specificty of his laboratory and specimens.Complementary information is found in the instruction manual of thecommericial instruments. A list of suppliers has been compiled by Robards& Sleytr (1985).
10.1 Safety
Frost-bite. Liquid propane or ethane are chosen as cryogens because they aremuch more efficient than liquid nitrogen. Whereas it is possible to plunge the handrapidly into boiling nitrogen without harm, the same is out of the question with

198 J. Dubochet and others
the cryogens used for vitrification. Even a small drop falling on naked skin willproduce a blister. The same in the eye would probably cause a serious injury. Suchan accident could easily occur during the preparation of liquid ethane, if the gasflow is too violent. A particularly dangerous situation may develop when arecipient with liquid ethane is completely immersed in liquid nitrogen. A peliculeof ethane solidifies at the surface and seals the residual liquid, which bursts whenthe interior further expands into a solid. This sometimes results in violentprojections. Beginners must therefore perform the whole freezing operation witheye protection.
Liquid nitrogen becomes dangerous when it cannot flow away from the skin.This is the case when clothes are soaked or when it accumulates in the shoes. Thebest way to avoid this type of accident is to have a practical system for pouringliquid nitrogen at the work place. A tip-up container on a mobile support wasfound to be useful.
Fire. Ethane has nearly the same density as air, and propane is heavier. Bothform an explosive mixture in proportions ranging from 2 to 2Ovol.%. Theexplosion can be triggered by electrical apparatus, including a lamp. In mostcountries there are legal requirements concerning the use of these gases. In ourlaboratory we require that all the work is done in a hood.
Suffocation. Large quantities of liquid nitrogen are frequently used for freezingand for cryo-ultramicrotomy. Each litre of the liquid produces 700 litres of gas.There is a risk of suffocation when oxygen concentration in the air is reduced byhalf its normal value. This can take place in a small and poorly ventilated room,as microtomy locals frequently are.
Poisoning. Alkylamines used for the treatment of carbon film by glow dischargeare violently poisonous for lungs and skin. The maximum permittedconcentration is 5 ppm, corresponding to about 20 mg/m3 for amylamine.Consequently the exhaust of the glow discharge machine must be outside thelaboratory. Fortunately, the smell of these compounds is so nauseous that theycannot accumulate unnoticed.
10.2 Bulk specimens
10.2.1 FreezingMaterial. The freezing apparatus developed at EMBL is a simple plunger -
versatile, portable and easily assembled, not to mention inexpensive. It is shownin Fig. 43 (a). A slightly more elaborate model, for which the plans are availableupon request, is depicted in Fig. 43(6). The plunger is formed by a weighted,friction-reduced rod, propelled with elastic bands. A shock adsorbing foam conereceives the rod as the specimen enters the cryogen. Cryogen is prepared in a20 ml flat-bottomed metal cap sitting in a polystyrene container of liquidnitrogen. It is stirred with a 1 cm magnet, driven by a water-propelled (becauseof explosion risk) magnetic stirrer mounted on an adjustable support. Thespecimen holder is fixed on the plunger rod in the same manner as a disposable

(a)
Cryo-electron microscopy of vitrified specimens 199
(b)
Fig. 43. Plunger for freezing, (a) Simple apparatus equipped here for freezing bulkspecimens. (1) Retort stand clamps; (2) liquid nitrogen and ethane dewars; (3) water-drivenmagnet; (4) plunger with elastic band propulsion; (5) specimen support, (b) A more elegantfreezing apparatus equipped for preparing thin vitrified layers of suspensions. (1) Tweezerholding the specimen support grid; (2) humidified air outlet.
TmmWiTnTiF
Fig. 44. Fig. 45.
Fig. 44. Specimen supports for cooling bulk samples for cryosectioning. (1) Parallel pinssuitable for mounting fibres; (2) pin source; electronic wrapping strips; (3) single pins forpelleted suspensions; (4) pin source; electronic wrapping strips; (5) other commerciallyproduced specimen supports.Fig. 45. Specimen pin mounted in microtome chuck. (1) Clamped specimen support isembedded in indium metal base plate. (2) Chuck head. (3) Microtome bridge.

200 J. Dubochet and others
hypodermic needle. A binocular helps in viewing the specimen pin and samplemounting. The plunger is released by removal of the locating pin (Fig. 43 a).
The specimen support must be easy to mount and to remove. For cryosections,it must also be compatible with the cryo-ultramicrotome. A simple system consistsof electronic wrapping pins pushed in the tip of a disposable micropipette (Fig. 44(3)). The tip of the pin is flattened in order to form a surface of 100-500 /imdiameter, suitable for receiving a microdrop of a viscous sample. Alternatively,two parallel pins can be used to mount a stretched fibre.
Operation. Before starting the operation make sure that (a) the sample pin is inthe field of view of the binocular; (b) the pin is in line with the cryogen pot; (e)there is enough cryogen (liquid ethane or propane) in the cap, maintained in asemi-solid state by vigorous stirring (we use freshly made ethane, although it is notimportant that the cryogen is kept very clean and free of contaminating ice, as thesurface of the sample block will be removed during sectioning); (d) after releasingthe plunger rod the specimen pin reaches the cryogen and stays in it; (e) the pinis loose enough to be easily removed from the micropipette tip in the cryogen.
Bulky suspensions of cells, of large particles or the like, can be pelletted bycentrifugation into a sealed disposable micropipette tip. After partially slicing offthe extremity of the tip, a very small volume of the semi-solid sample can beapplied directly to the pin. It must be kept in mind that most specimens arevitrified only to a depth of some 10 fim and that all the residual volume is waste.Any excess supernatant remaining on the specimen is removed at the last momentbefore the plunger is released. After freezing, the specimen holder is removedfrom the plunger and transferred to liquid nitrogen. At this stage it is advisable tocheck the aspect of the specimen with a good stereo-microscope, but still keepingit under liquid nitrogen. It frequently happens that the specimen is displacedduring immersion and is not suitable for further processing. The specimens on themetal pins can be stored for indefinite periods, in small bottles, not tightly closed,immersed in liquid nitrogen.
Fibrous bulk samples (as, for example, isolated muscle, collagen fibres or highlyviscous liquids) can be mounted on a double support (Fig. 44(1)) and kept in abuffered solution. It is transferred at the very last moment to the freezingapparatus, where the excess solution is removed before plunging.
Tissues or large bulk samples are best frozen by projection on a cold metalblock. The practical aspects of the method are described elsewhere (Sitte et al.1987).
10.2.2 SectioningMaterial. The cryo-ultramicrotome must be capable of operating in a
thermally stable mode, with specimen, knife and chamber atmosphere at atemperature <—140 °C. The cryo-chamber must be large enough forcomfortable manipulation of accessories, such as the grid-holding device, knifeassembly, grid press, sample bottles and an anti-static device. The workingchamber must be illuminated by a strong and adjustable light which should notproduce heat.

Cryo-electron microscopy of vitrified specimens 201
Fig. 46. (a) Modified grid boxes for long-term storage under liquid nitrogen of gridscontaining vitrified specimens, (b) Cryosection press. (1) Polished inside surfaces; (2)specimen grids; (3) screw top on assembled unit.
The knives can be diamond or glass. The former must be mounted on a specialholder capable of withstanding the stress of frequent and rapid temperaturechanges. These special knives are commercially available. The sharpness of glassknives is of the utmost importance and their preparation requires great care. Wefound that the method of balance-breaking of Tokuyasu & Okamura (1959) andGriffiths et al. (1983) gave the best results. Tungsten coating of the freshlyprepared knives greatly improves their quality and life expectancy (Roberts,1975)-
Specimen-supporting grids must be of small mesh size. We use hexagonal orsquare 600- to 1000-mesh grids, coated with carbon, floated from freshly cleavedmica. The grids are held with a special holder, as close as possible to the knifeedge. A grid-press in which two polished metal surfaces can be pressed togetherwith a screw (Fig. 466(3)) is also put in the cryo-chamber. Grid boxes are adaptedfor long-term storage in liquid nitrogen for grids and sections (Fig. 46 a).
Operation. Before starting, the cryo-chamber must be carefully dried tominimize water contamination. The chamber, together with the various toolswhich will be used subsequently, are cooled and left to equilibrate at the workingtemperature (typically —160 °C). The pin holding the specimen is then broughtinto the chamber in a cup filled with liquid nitrogen. With cooled forceps the pinis inserted in the microtome-head and firmly screwed against the indium plate(Fig. 45(1). Other types of supports are available for cryo-microtomes (Fig.44(5)). In general they are suitable for larger specimens than those which can bevitrified.
Trimming of the specimen should be avoided, as only the very surface is vitrifiedand trimming removes the best frozen volume. In general, it is not necessary ifthe sample was well concentrated and free of liquid excess.
202 J. Dubochet and others
Slow cutting speed (o-2-O'4 mm/s) gives good results but the strokes must bedone in rapid succession in order to counteract any irregular advance of themicrotome. This irregularity means that cutting should be done only during themost stable phase of the cooling cycle (not during or shortly after liquid-nitrogenrefilling) and that the section thickness setting is not representative of the actualsection thickness. It is best adjusted during cutting, according to the aspect of thesections. It is therefore of advantage to start cutting by manual movement untildecent sections start to appear, after which the instrument may be switched to theautomatic mode. One or a few groups of sections are accumulated on the knifeedge before they are collected. Normally a 15 min period of cutting providessufficient sections for 1-2 grids. The filling cycle of liquid nitrogen can beactivated while the sections are collected.
To assist in section collection the field of view seen through the binocularshould include the specimen, the knife edge and the grid. Sections are transportedto the central area of the grid with a fine pointed hair mounted on a flexible plasticapplicator (a plastic straw) which is kept outside the cryo-chamber until it is used.The aim is to collect the sections using only the tip of the hair. Difficulty will beexperienced if the sections attach away from the tip of the hair. In the event thatsections are repelled from the hair by static charges, an air-ionizing instrumentmay be used to modify static charges in the area of the grids and sections. Ingeneral, the sections attach correctly to the hair tip if it has just been introducedinto the cryo-chamber.
When sufficient sections have been transferred, the grids are retracted from theknife edge. The top half of the press is removed exposing the ice-free polishedsurface of the lower platform, where the grids are placed. The top half of the pressis relocated without disturbing the grids. For short-term storage the completepress and grids may be kept in liquid nitrogen ready for direct transfer to themicroscope cryo-holder. Otherwise grids with sections can be stored for longerperiods in liquid nitrogen, in modified grid boxes (Fig. 46a).
10.3 Thin layer of vitrified suspension
Material. The concentration of the suspension observed in unsupported thinfilms must be high so that sufficient particles are present in the small volume offilm. This range is typically between 1 and 10 mg/ml but it can vary considerably,depending on the particles and on the surface properties of the film and itsinteraction with the particles.
The plunger for preparing thin layers of vitrified suspension on a perforatedsupporting film is similar to that shown in Fig. 43 b. It differs from the one usedfor freezing bulky specimens by the fact that a much smaller volume of liquidethane is used and that the specimen is mounted on a grid held by tweezers (Fig.436(1)). The latter must be treated (Teflonated) in order to prevent the solutionfrom rising by capillary action and it can be fixed by a rapid clamping system tothe plunger rod.

Cryo-electron microscopy of vitrified specimens 203
A perforated supporting film can be prepared by the method of Fukami &Adachi (1965) and Fukami et al. (1972) which gives a thin perforated plastic filmof c. 5 /(m average hole size. The preparation must take place in a very humidatmosphere (80%) and the plastic solution must be sufficiently diluted (e.g.0-1-0-4% in ethylacetate). The thickness of the plastic must be small compared tothe hole size in order to form clean holes. The plastic film is coated on one sidewith a thick layer (c. 20 nm) of evaporated carbon. Most of the plastic is thenremoved by dissolution but some residue, bubbling under the beam, is useful forfocusing. It is advisable to control the performated film with some stereo-micrographs.
Liquid ethane is prepared from the gas in a 2 ml aluminium recipient insertedin a styrofoam container of liquid nitrogen. Liquid ethane must be very pure andfree of water because a small amount of cryogen usually remains on the specimenwhere it evaporates, either during transfer or in the microscope. This would leaveany impurity as a contaminant on the specimen. It is therefore convenient toprepare liquid ethane fresh for each specimen.
Operation. A drop of suspension (2-5 /A) is put on the grid. Liquid ethane isprepared by flowing a stream of ethane gas through a thin plastic pipe (diam. 2 mm)into the liquid nitrogen cooled recipient. This operation requires precautions andsome training: too little pressure results in a block of solid ethane that obstructsthe pipe; too much pressure blows all the cryogen away and may be dangerous.When the undercooled ethane is close to becoming solid and is therefore ready forvitrification, most of the drop of suspension is removed from the specimen bypressing it firmly, by hand, between two double layers of blotting paper(Whatman no. 1, qualitative) for 1-2 s and immediately releasing the guillotine.With the geometry shown in Fig. 436) the free falling time is icT1 s and thevitrification time probably around icT4 s. The specimen is then raised slowly,leaving time for liquid ethane to flow away from the tweezers and grid, but notenough to rewarm it, and it is reimmersed in the liquid nitrogen of thesurrounding recipient. The grid is detached from the tweezers to which it is fixedby frozen solution, by forcing a piece of cold metal (tweezer tip or scalpel) into thetweezers. The specimen is left to fall in a recipient (a small bottle cup) in the liquidnitrogen. The container for liquid ethane and the tweezers are removed and leftto warm and dry. The specimen can be transported in liquid nitrogen, covered forprotection against water contamination, or it can be put in a special grid box (Fig.46 a) for indefinite storage in clean liquid nitrogen.
Partial evaporation of the water in the thin film can be reduced by minimizingthe time the thin liquid film is left in contact with air. More efficient is to bringa stream of air, humidified by bubbling in water, slowly flowing from a large pipe(diam. 3 cm), directly on to the grid. (Fig. 436(2)).
Surface forces, acting in the thin film, on the particles of the specimen, can becontrolled to a large extent by coating the surface with a lipid layer (Schultz et al.,in preparation). For this purpose, a 2 mg/ml solution of polydisperse liposomes ofneutral lipids (phosphatidyl choline) is prepared by simple dissolution of the pure

2O4 Jf- Dubochet and others
Fig. 47. Thin crystal of hexagonal ice obtained by freezing of a water drop while it wasspreading on the partially hydrophilic carbon support. Bend contours due to Braggreflexions of the deformed crystal are clearly seen.
lipid in the desired buffer. An equal volume of this solution is added to the dropon the grid. The negative lipid phosphatidyl glycerol can also be used to producespecial surface effects, as for example repulsion of negatively charged particles.
An alternative preparation procedure is the 'bare grid method' (Adrian et al.1984) in which the unsupported liquid film is prepared over the holes of a clean200- or 400-mesh grid in absence of any supporting film. Instead of usingblotting papers, most of the liquid of the drop is removed with a pipette. Themoment at which the guillotine is released is best determined, after someexperience, by observing the forming film with a binocular. The bare-grid methodincreases the possibilities for interactions between particles in the liquid layer butis prone to cencentration-induced artifacts due to the partial evaporation of thewater in the thin film.
Vitrified specimens can also be prepared on a continuous supporting filmrendered hydrophilic by glow discharge in air or, for more reproducible results,treated by glow discharge in amylamine (10 s at 100 V/cm in 10 Pa). Afteradsorption of the material to the support, most of the liquid is removed with ablotting paper, as for negative staining, and the guillotine immediately released.This method does not allow the particles of the suspension to interact in the liquidfilm and causes some flattening artifacts due to adsorption to the supporting film.On the other hand, it generally allows one to work with lower concentrations ofbiological material than with specimens which are prepared without support.

Cryo-electron microscopy of vitrified specimens 205
&•: • #
Fig. 48. Thin layer of nearly pure water in which hexagonal (h) and cubic (c) ice coexistwith vitreous water (v). The thinnest region of the film is vitreous whereas the thickerregions, close to the grid bars, are crystallized.
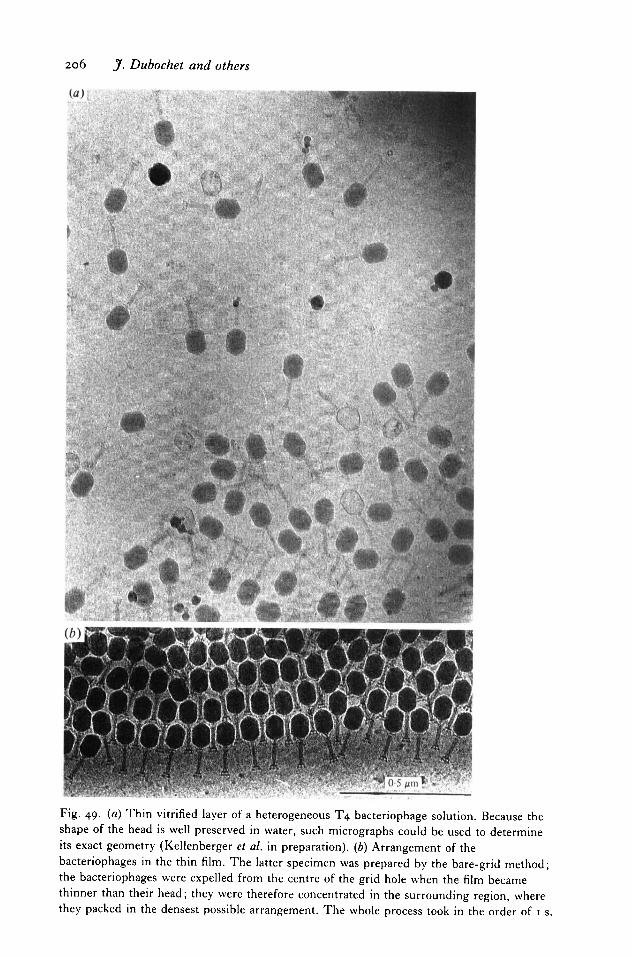
206 y. Dubochet and others
Fig. 49. (a) Thin vitrified layer of a heterogeneous T4 bacteriophage solution. Because theshape of the head is well preserved in water, such micrographs could be used to determineits exact geometry (Kellenberger et al. in preparation), (b) Arrangement of thebacteriophages in the thin film. The latter specimen was prepared by the bare-grid method;the bacteriophages were expelled from the centre of the grid hole when the film becamethinner than their head; they were therefore concentrated in the surrounding region, wherethey packed in the densest possible arrangement. The whole process took in the order of 1 s.

Cryo-electron microscopy of vitrified specimens 207
Hvl."-»p«>, - . . • • .<i ',s,
• •>' : <: « > ;
• • ' • • ' ' .
•HtVHP
' a *
V,
C
i1 v.v
%
• • ,
Fig. 50. A bacteriophage imaged under conditions best revealing the packaging of the DNAin the head. Small, randomly orientated domains are visible in which the DNA seems to bearranged with crystalline order.
10.4 Transfer and observation
Commerical cryo-specimen holders are equipped with a device for transferringthe frozen specimen into the electron microscope without undue rewarming andcontamination. Complete protection would, however, require a counter-productive heavy and complicated system. It is of advantage to look for acompromise in which simplicity of the transfer procedure requires that it is maderapidly and under clean conditions. To achieve this it is important that all thematerial used for the transfer is carefully dried before starting. In particular, allthe liquid nitrogen which may come in contact with the specimen and thespecimen rod must be free from ice crystals. Also, contact of any cold surface with

j . Dubochet and others
• v
Fig. 51. Thin layer of brome grass virus prepared by the bare-grid method. The packing ofthe virus becomes more ordered as the layer thins from top right to bottom left of theimage.

Cryo-electron microscopy of vitrified specimens 209
(fl)
f i *
Fig. 52. Crystal of the N-terminal cleaved fibre protein of adenovirus type 2. (a)Conventional negative staining with uranyl acetate, (b) Vitrified layer prepared by theperforated grid method. (Material: courtesy Ch. Devaux, Grenoble.)
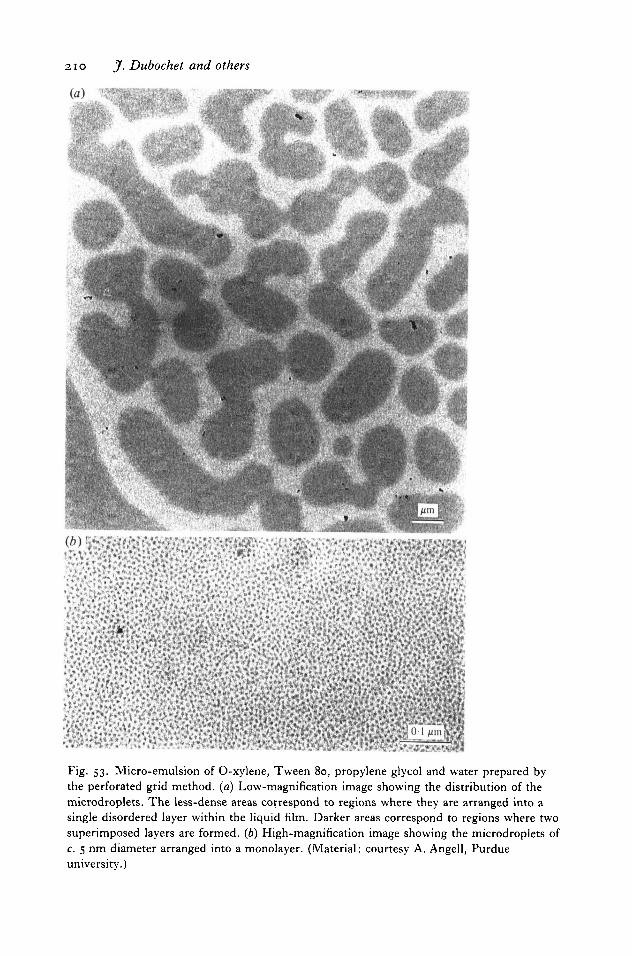
210 J. Dubochet and others
(a) • • "
' A \~
Fig. 53. Micro-emulsion of O-xylene, Tween 80, propylene glycol and water prepared bythe perforated grid method, (a) Low-magnification image showing the distribution of themicrodroplets. The less-dense areas correspond to regions where they are arranged into asingle disordered layer within the liquid film. Darker areas correspond to regions where twosuperimposed layers are formed, (b) High-magnification image showing the microdroplets ofc. s nm diameter arranged into a monolayer. (Material: courtesy A. Angell, Purdueuniversity.)
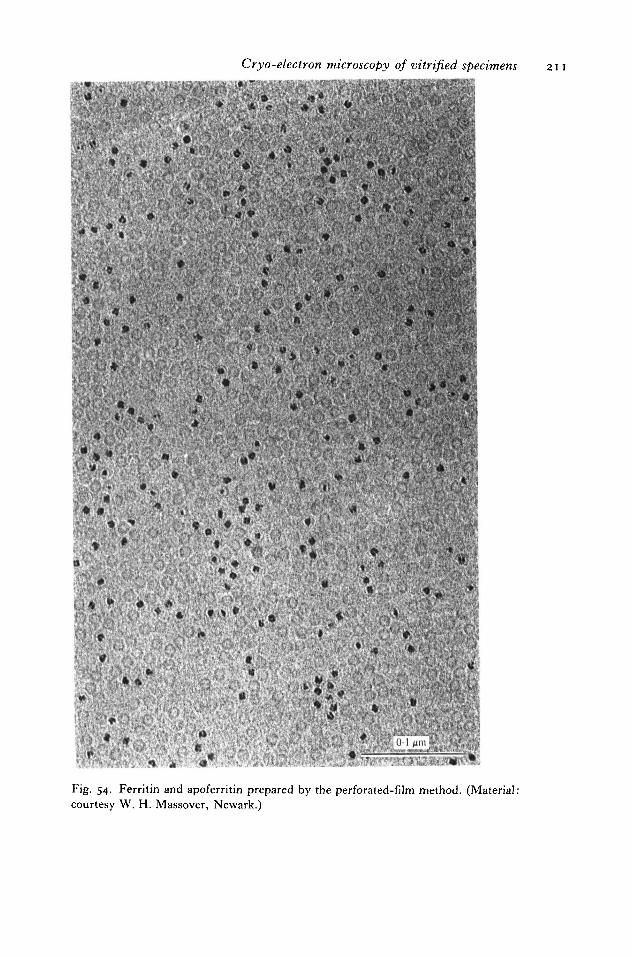
Cryo-electron microscopy of vitrified specimens 211
Fig. 54. Ferritin and apoferritin prepared by the perforated-film method. (Material:courtesy W. H. Massover, Newark.)

212 J. Dubochet and others
• » T - ' * ' ** * " J t / ^^» < C ' H P M -*k I *. * h 0-] jim
Fig- 55- Virosomes formed by lipid vesicules containing spike proteins of vesicularstomatitis virus (Material: courtesy K. Metsikko, Heidelberg.)

Cryo-electron microscopy of vitrified specimens 213
Fig. 56. (a) Chicken erythrocyte chromatin prepared by the perforated-grid method in 10mM-NaCl. The individual nucleosomes are clearly visible along the zig-zaging filaments, (b)Turnip yellow mosaic virus RNA prepared by the perforated-film method in 125 mM-NaCl.(Material: courtesy J. Witz, Strasbourg.)
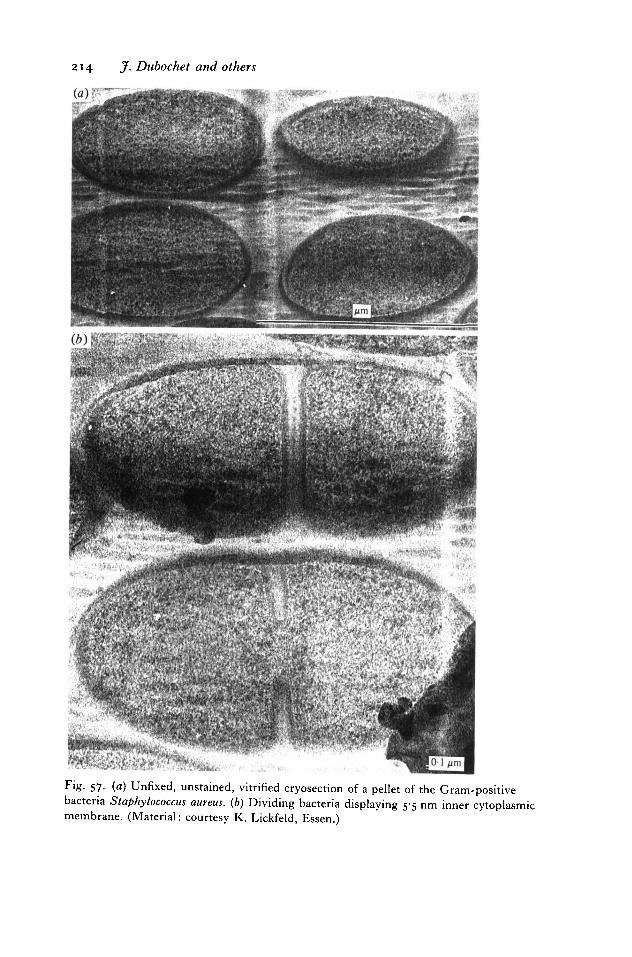
2i4 y. Dubochet and others
F'g- 57- (a) Unfixed, unstained, vitrified cryosection of a pellet of the Gram-positivebacteria Staphylococcus aureus. (b) Dividing bacteria displaying 5-5 nm inner cytoplasmicmembrane. (Material: courtesy K. Lickfeld, Essen.)

Cryo-electron microscopy of vitrified specimens 215
Fig. 58. Unfixed, unstained, vitrified cryosection of culture cells (normal rat kidney). Nm,nuclear membrane; Ch, chromatin; Cyt, cytoskeleton; R, ribosomes; Ret, reticularstructure, /h, hexagonal ice contaminant.
Fig. 59. Purified clathrin cages in vitreous ice. (Courtesy G. Vigers, Boulder, Colorado.)

216 J. Dubochet and others
ft '. V*'V»* • , '* . ' ' \ • ]
Fig. 6o. Actin filaments in vitreous ice (courtesy R. Milligan, San Diego).
the humid air of the laboratory must be minimized. Covering liquid-nitrogensurfaces and the wearing of a breathing mask may help. The rule that the qualityof a transfer is inversely proportional to its duration has been abundantly confirmedby experience. The successful microscopist plans his movements accordingly.
Once the specimen is in the microscope it is best to protect it, as much aspossible, from the evaporating water introduced during the transfer. The shieldinstalled on most commercial systems is efficient for this purpose. It should onlybe open when the water pressure, judged from the contamination speed on thespecimen, is negligible.
The specimen drifts and vibrates as long as the temperature of the cryo-specimen holder is not stabilized. This effect can be observed directly at highmagnification on the carbon film, after the water layer has been removed by astrong irradiation and, with some experience, the moment when the specimen isready for recording high-resolution micrographs can be determined.
Low-dose image recording is essential with vitrified specimens and this shouldbe done in such a way as to minimize beam-induced drift of the specimen. For thispurpose it is advantageous to focus at a relatively large distance from the recordedarea - for example, in an adjacent hole. In most modern electron microscopes, thebuilt-in method for low-dose image recording is not designed for independent and

Cryo-electron microscopy of vitrified specimens 217
Fig. 61. Actin filaments labelled with Si myosin molecules, often referred to as 'decorated'actin, embedded in vitreous ice. (Courtesy R. Milligan, San Diego.)
Fig. 62. Eukaryotic ribosome tetramers in vitreous ice. (Courtesy R. Milligan, San Diego.)
rapid selection of both the place to record and the place to focus. The followingmethod was found to be useful by many users:
(a) After the operator has decided the magnification and the exposure time forrecording the micrograph, he defines two positions of the condensor setting, R andS. R provides the correct illumination for recording the image at the chosen
218 J. Dubochet and others
magnificantion and exposure time. In order to minimize the stress induced on thespecimen by the electron beam, the total beam current is also chosen for onlyilluminating the recorded area. In the other setting, S, the beam is spread in sucha way as to provide the minimum illumination necessary for localizing the selectedregion. In general this corresponds to a 20- to 100-fold smaller flux than forrecording the image.
(b) The area to be recorded and an adjacent area for focusing are selected at lowmagnification.
(c) The image is focused on the sleeted area in such a way that the first maximumof the transfer function corresponds to the expected significant resolution.
(d) Illumination is put on S and the specimen is moved to the area selected forrecording.
(e) The beam is blanked for some seconds in order to let the specimen stabilizeand the micrograph is recorded without further pre-irradiation.
(/) Another or more micrographs with a defocus two or three times larger canbe recorded for a better retrieval of the long-range information of the image.
I I. SOME RESULTS
Fig. 47 to 62 are selected illustrations of the possibilities of the method.
12. REFERENCES
ADRIAN, M., DUBOCHET, J., LEPAULT, J. & MCDOWALL, A. W. (1984). Cryo-electronmicroscopy of viruses. Nature 308, 32—36.
AMOS, L. A., HENDERSON, R. & UNWIN, P. N. T. (1982). Three-dimensional structuredetermination by electron microscopy of two-dimensional crystals. Prog. Biophys.molec. Biol. 39, 183-231.
ANGELL, C. A. (1983). Supercooled water. A. rev. phys. Chem. 34, 593-630.ANGELL, C. A. & CHOI, Y. (1986). Crystallization and vitrification in aqueous systems.
J. Microsc. 141, 251-261.BELLARE, J. R., DAVIS, H. T., SCRIVEN, L. E. & TALMON, Y. (1986). An improved
controlled-environment vitrification system (CEVS) for cryofixation of hydratedTEM samples. In Proc. Xlth Int. Conf. Elec. Microsc, Kyoto, vol. 11 (ed. T. Imura,S. Maruse and T. Suzuki), pp. 367-368.
BERNAL, J. D. & FOWLER, R. H. (1933). A theory of water and ionic solution withparticular reference to hydrogen and hydroxyl ions. y. chem. Phys. 1, 515-548.
BERNHARD, W. (1965). Ultramicrotomie a basse temperature. Anne'e biol. 4, 5-19.BERRY, R. S., RICE, S. A. & Ross, J. (1980). Physical Chemistry. New York: Wiley.BORN, M. & WOLF, E. (1975). Principles of Optics, 5th ed.Oxford: Pergamon Press.Box, H. C. (1975). Cryoprotection of irradiated specimens. In Physical Aspects of
Electron Microscopy and Microbeam Analysis (ed. B. M. Siegel and D. R. Beaman),pp. 279-285. New York: Wiley.
BRACK, C. (1981). DNA electron microscopy. Crit. Rev. Biochem. 10, 113-169.BRUGGELLER, P. & MAYER, E. (1980). Complete vitrification in pure liquid water and
dilute aqueous solutions. Nature 288, 569-571.

Cryo-electron microscopy of vitrified specimens 219
BURTON, E. F. & OLIVER, W. F. (1935). The crystal structure of ice at low temperature.Proc. R. Soc. Lond. A 153, 166-172.
CANTOR, C. R. & SCHIMMEL, R. P. (1980). Biophysical Chemistry, vol. 1-3. SanFrancisco: Freeman.
CHANG, C.-F., OHNO, T. & GLAESER, R. M (1985). The fatty acid monolayer techniquefor preparing frozen hydrated specimens, jf. elec. Microsc. Techn. 2, 59-65.
CHANG, J.-J., MCDOWALL, A. W., LEPAULT, J., FREEMAN, R., WALTER, C. A.& DUBOCHET, J. (1983). Freezing, sectioning and observation artefacts of frozenhydrated sections for electron microscopy. J. Microsc. 132, 109-123.
CHIU, W. (1982). High resolution electron microscopy of unstained hydrated proteincrystals. In Electron Microscopy of Proteins, vol. 2 (ed. J. R. Harris), pp. 233-259.London: Academic Press.
CHIU, W. (1986). Electron microscopy of frozen, hydrated biological specimens. A. Rev.Biophys. Chem. 15, 237-257.
CHRISTENSEN, A. K. (1971). Frozen thin sections of fresh tissue for electron microscopy,with a description of pancreas and liver. J. Cell Biol. 51, 772-804.
CLEGG, J. S. (1982). Alternative views on the role of water in cell function. In Biophysicsof Water (ed. F. Franks and S. Mathias), pp. 365-383. Chichester: Wiley.
COSLETT, V. E. (1978). Radiation damage in the high resolution electron microscopy ofbiological materials: a review. J. Microsc. 113, 113-129.
CREW, A. V. (1973). Considerations of specimen damage for the transmission electronmicroscope, conventional versus scanning. J. molec. Biol. 80, 315-325.
DAVIDSON, D. W. (1973). Clathrate hydrates. In Water: A Comprehensive Treatise, vol.2, (ed. F. Franks), pp. 115-234. New York: Plenum Press.
DAVY, J. D. & BRANTON, D. (1970). Subliming ice surfaces: freeze-etch electronmicroscopy. Science 163, 1216—1218.
DIETRICH, I., FORMANEK, H., FOX, F., KNAPEK, E. & WEYL, R. (1979). Reduction ofradiation damage in an electron microscope with superconducting lens system. Nature277, 380-381.
DIETRICH, I., Fox, F., HEIDE, H. G., KNAPEK, E. & WEYL, R. (1978). Radiation damagedue to knock-on processes on carbon foils cooled to liquid helium temperature.Ultramicroscopy 3, 185-189.
DOWELL, L. G. & RINFRET, A. P. (i960). Low-temperature forms of ice as studied byX-ray diffraction. Nature 188, 1144-1148.
DUBOCHET, J. (1975). Carbon loss during irradiation of T4 bacteriophages and E. colibacteria in electron microscopes. J. Ultrastruct. Res. 52, 276-288.
DUBOCHET, J., ADRIAN, M., LEPAULT, J. & MCDOWALL, A. W. (1985). Cryo-electronmicroscopy of vitrified biological specimens. Trends in Biochem. Sci. 10, 143-146.
DUBOCHET, J., ADRIAN, M., SCHULTZ, P. & OUDET, P. (1986). Cryo-electron microscopyof vitrified SV40 minichromosomes. The liquid drop model. EMBO J. 5, 519-528.
DUBOCHET, J., ADRIAN, M., TEIXEIRA, J., KADIYALI, R. K., ALBA, C. M., MACFARLANE,
D. R. & ANGELL, C. A. (1984). Glass-forming microemulsions: vitrification of simpleliquids and electron microscope probing of droplet packing modes. J. phys. Chem. 88,6727-6732.
DUBOCHET, J., ADRIAN, M. & VOGEL, R. H. (1983a). Amorphous solid water obtainedby vapour condensation or by liquid cooling: a comparison. Cryo-Letters 4, 233-240.
DUBOCHET, J., CHANG, J.-J., FREEMAN, R., LEPAULT, J. & MCDOWALL, A. W. (1982a).Frozen aqueous suspensions. Ultramicroscopy 10, 55-62.
DUBOCHET, J., GROOM, M. & MULLER, NEUTEBOOM, S. (19826). The mounting of

220 J. Dubochet and others
macromolecules for electron microscopy. In Advances in Optical and ElectronMicroscopy, vol. 8 (ed. V. E. Cosslett and R. Barer), pp. 107-135. London: Academic *.Press.
DUBOCHET, J. & KELLENBERGER, E. (1972). Selective adsorption of particles to thesupporting film and its consequences on particle counts in electron microscopy. <Microscopica Ada 72, 119-130.
DUBOCHET, J. & LEPAULT, J. (1984). Cryo-electron microscopy of vitrified waterJ. Physics 45, C7/85-94. ^
DUBOCHET, J., LEPAULT, J., FREEMAN, R., BERRIMAN, J. A. & HOMO, J . - C L . (1982c).Electron microscopy of frozen water and aqueous solutions. J. Microsc. 128,219-237. <
DUBOCHET, J. & MCDOWALL, A. W. (1981). Vitrification of pure water for electronmicroscopy, y. Microsc. 124, RP3-4. "•""
DUBOCHET, J. & MCDOWALL, A. W. (1984a). Frozen hydrated sections. In Science of ,.Biological Specimen Preparation, pp. 147-152. Chicago: SEM Inc., AMF O'Hare.
DUBOCHET, J. & MCDOWALL, A. W. (19846). Cryo-ultramicrotomy: study of ice crystalsand freezing damage. In Proc. 8th Eur. Congr. Elec. Microsc, Budapest (ed. *.A. Csanady, P. Rohlich and D. Szabo), vol. 2, pp. 1407-1410. Budapest: Progr.Committee. *"
DUBOCHET, J., MCDOWALL, A. W., MENGE, B., SCHMID, E. N & LICKFELD, K. G. .,
(19836). Electron microscopy of frozen-hydrated bacteria. .7. Bact. 155, 381—390.EISENBERG, D. & CROTHERS, D. (1979). Physical Chemistry with Applications to the Life
Sciences. Menlo Park, CA.: Benjamin/Cumming. _,EISENBERG, D. & KAUZMANN, W. (1969). The Structure and Properties of Water. Oxford
University Press.ERICKSON, H. P. & KLUG, A. (1971). Measurement and compensation of defocusing and >
aberrations by Fourrier processing of electron microgrpahs. Phil. Trans. R. Soc. Lond.B 261, 105-118. "*
ESCAIG, J. (1982a). New instruments which facilitate rapid freezing at 83 K and 6 K. <y. Microsc. 126, 221-229.
ESCAIG, J. (19826). Ultra-rapid freezing of cells and cellular material: a review ofmethods. In Proc. 10th Int. Congr. Elec. Microsc, Hamburg, vol. 3, pp. 169-176. #
Frankfurt: Deutsche Ges. fur Elecktronenmikroskopie, e.V.EUSEMANN, R., ROSE, H. & DUBOCHET, J. (1982). Electron scattering in ice and organic
materials, y. Microsc. 128, 239-249. ,FAHY, G. M., MACFARLANE, D. R., ANGELL, C. A. & MERYMAN, H. T. (1984).
Vitrification as an approach to cryo-preservation., Cryobiology 21, 407-426. *FERNANDEZ-MORAN, H. (i960). Low temperature preparation techniques for electron
microscopy of biological specimens based on rapid freezing with liquid helium II.Ann. N. Y. Acad. Sci. 85, 689-713. «
FERNANDEZ —MORAN, H. (1966). High-resolution electron microscopy with super- ,conducting lenses at liquid helium temperatures. Proc. Natn. Acad. Sci. U.S.A. 56,801-808.
FERNANDEZ-MORAN, H. (1985). Cryo-electron microscopy and ultramicrotomy: Remi-niscences and reflections. In Advances in Electronics and Electron Physics, supplement16, pp. 167-223. New York: Academic Press. •
FEYNMAN, R. P., LEIGHTON, R. B. & SANDS, M. (1965). Lectures on Physics, vol. i-m. «Reading, Massachusetts: Addision-Wesley.

Cryo-electron microscopy of vitrified specimens 221
FINNEY, J. L. (1986). The role of water perturbations in biological process. In Water andAqueous Solutions (ed. G. W. Neilson and J. E. Enderby), pp. 227-244. Bristol:Hilger.
FRANK, H. S. (1970). The structure of ordinary water. Science 169, 635-641.FRANKS, F. (1972-82). Water: A Comprehensive Treatise, vol. 1-7 (ed. F. Franks). New
York: Plenum Press.FRANKS, F. (1982). The properties of aqueous solutions at subzero temperatures. In
Water: A Comprehensive Treatise, vol. 7 (ed. F. Franks), pp. 215-338. New York:Plenum Press.
FREDERIK, P. M., BUSING, W. M. & PERSSON, A. (1982). Concerning the nature of thecryosectioning process. .7. Microsc. 125, 167-175.
FREDERIK, P. M., BUSING, W. M. & PERSSON, A. (1984). Surface defects on thincryosections. In Scanning Electron Microscopy, vol. 1, pp. 433-443. Chicago: SEMInc., AMF O'Hare.
FREEMAN, R., LEONARD, K. R. & DUBOCHET, J. (1980). The temperature dependence ofbeam damage to biological samples in the scanning transmission electron microscope(STEM). Proc. jth. Eur. Congr. Elec. Microsc, The Haag, vol. 2 (ed. P. Brederoo andG. Boom), pp. 640-641. Leiden: The 7th. Eur. Congr. Foundation.
FUJIYOSHI, Y., UYEDA, N., YAMAJISHI, H., MORIKAWA, K., MIZUSAKI, T., AOKI, Y.,
KIHARA, H. & HARADA, Y. (1986). Biological marcromolecules observed with highresolution cryo-electron microscope. In Proc. Xlth Int. Cong. Elec. Microsc, Kyoto,vol. in (ed. T. Imura, S. Maruse and T. Susuki), pp. 1829-1832. Tokyo: Jap. Soc.Elec. Microsc.
FUKAMI, A. & ADACHI, K. (1965). A new method of preparation of a self-perforatedmicro-plastic grid and its application. J. Elec. Microsc. {Japan) 14, 112-118.
FUKAMI, A., ADACHI, K. & KATOH, M. (1972). Micro grid techniques (continued) andtheir contribution to specimen preparation techniques for high resolution work.J. Elec. Microsc {Japan) 21, 99-108.
FULLER, S. D. (1987). The T = 4 envelope of Sindbis virus is organized by interactionswith a complementary T = 3 ^psid. Cell 48, 923-934.
FULLER, S. D. & ARGOS, P. (1987). Is Sindbis a simple picornavirus with an evelope ?EMBO J. 26, 1503-1511.
GEIGER, A., MAUSBACH, P. & SCHNITKER, J. (1986). Computer simulation study of thehydrogen-bond network in metastable water. In Water and Aqueous Solutions (ed.G. W. Neilson and J. E. Enderby), pp. 31-40. Bristol: Adam Hilger.
DE GENNES, P. G. (1984). Comment s'etale une goutte. Pour la Science 79, 88-96.DE GENNES, P. G. (1985). Wetting: statistics and dynamics. Rev. mod. Phys. {USA) 57,
827-863.GHORMLEY, J. A. & HOCHANADEL, C. J. (1971). Amorphous ice: density and reflectivity.
Science 171, 62-64.GLAESER, R. M. (1971). Limitation to significant information in biological electron
microscopy as a result of radiation damage. J. Ultrastruct. Res. 36, 466-482.GLAESER, R. M. (1975). Radiation damage and biological electron microscopy. In
Physical Aspects of Electron Microscopy and Microbeam Analysis (ed. B. M. Siegel andD. R. Bearman), p. 205. New York: Wiley.
GLAESER, R. M. & TAYLOR, K. A. (1978). Radiation damage relative to transmissionelectron microscopy of biological specimens at low temperature: a review. J. Microsc.112, 127-138.
222 J. Dubochet and others
GRIFFITHS, G., MCDOWAIX, A. W., BACK, R. & DUBOCHET, J. (1984). On the preparationof cryosections for immunocrytochemistry. J. Ultrastruct. Res. 89, 65-78.
GRIFFITHS, G., SIMONS, K., WARREN, G. & TOKUYASU, K. T. (1983). Immunoelectronmicroscopy using thin, frozen sections: application to studies of the intracellulartransport of Semliki forest virus spike glycoproteins. Meth. Enzymol. 96, 435-450.
GUPTA, B. L. & HALL, T. A. (1981). The X-ray microanalysis of frozen-hydratedsections in scanning electron microscopy: an evaluation. Tissue Cell 13, 623-643.
HAHN, M. (1980). Properties of commerical films for electron microscopy. In ElectronMicroscopy and Molecular Dimensions (ed. W. Baumesiter and W. Vogell), pp.200-207. Heidelberg: Springer-Verlag.
HALL, T. A. & GUPTA, B. L. (1974). Beam-induced loss of organic mass under electronmicroscope conditions. J. Microsc. 100, 177-188.
HANDLEY, D. A., ALEXANDER, J. T. & CHIEN, S. (1981). The design and use of a simple -••*device for rapid quench-freezing of biological samples. J. Microsc. 121, 273—282.
v. HARREVELD, A., TRUBATCH, J. & STEINER, J. (1974). Rapid freezing and electronmicroscopy for the arrest of physiological processes, jf. Microsc. 100, 189-198.
HART, R. K., KASSNER, T. F. & MAURIN, J. K. (1970). Contamination of surfaces duringhigh-energy electron radiation. Phil. Mag. 21, 453-467.
HAYAT, M. A. (1970). Principles and Techniques of Electron Microscopy. BiologicalApplications, vol. 1. London: Van Nostrand Reinhold.
HAYWARD, S. B., GRANO, D. A., GLAESER, R. M. & FISHER, K. A. (1978). Molecularorientation of bacteriorhodopsin within the purple membrane of halobacteriumhalobium. Proc. natn. Acad. Sci. U.S.A. 75, 4320-4324.
VAN HEEL, M. & FRANK, J. (1981). Use of multivariate statistics in image analysing theimages of biological macromolecules. Ultramicroscopy. 6, 187-194.
HEIDE, H. G. (1982 a). On the irradiation of organic samples in the vicinity of ice.Ultramicroscopy. 7, 299-300.
HEIDE, H. G. (19826). Design and operation of cold stages. Ultramicroscopy. 10,
125-154-HEIDE, H. G. & GRUND, S. (1974). Eine Tiefkuhlkette zum Uberfiihren von
wasserhaltigen biologischen Objekten im Elektronenmikroskop. J. Ultrastruct. Res.48, 259-268.
HEIDE, H. G. & ZEITLER, E. (1985). The physical behaviour of solid water at lowtemperatures and the embedding of electron microscopical specimens. Ultra-microscopy 16, 151—160.
HEIDENREICH, R. R. (1964). Fundamentals of Transmission Electron Microscopy. NewYork: Interscience Publ.
HEUSER, J. E., REESE, T. S., DENNIS, M. J., JAN, Y., JAN, L. & EVANS, L. (1979).
Synaptic vesicle exocytosis captured by quick freezing and correlated with quantaltransmitter release. J. Cell Biol. 81, 275-300.
HIROMI, K. (1979). Kinetics of Fast Enzyme Reactions. Theory and Practice. KodanshaScientific Books. New York: Wiley.
HOBBS, P. V. (1974). Ice Physics. Oxford: Clarendon Press.HOMO, J . -CL. , BOOY, F., LABOUESSE, P., LEPAULT, J. & DUBOCHET, J. (1984). Improved
anticontaminator for cryo-electron microscopy with Philips EM 400. J. Microscopy136, 337-340.
HUTCHINSON, T. E., BACANER, M., BRODHURST, J. & LILLEY, J. (1974). Electronmicroscopy of frozen biological tissue. Rev. scient. Instrum. 45, 252-255.

Cryo-electron microscopy of vitrified specimens 223
HUTTERMANN, J. (1982a). Physical mechanisms of electron interaction with organicsolids. Ultramicroscopy. 10, 7-14.
HUTTERMANN, J. (19826). Solid-state radiation chemistry of DNA and its constituents.Ultramicroscopy. io, 25-40.
INTERNATIONAL EXPERMENTAL STUDY GROUP (1986). Cryoprotection in electronmicroscopy. J . Microsc. 141, 385-391.
ISAACSON, M. S. (1977). Specimen damage in the electron microscope. In Principles andTechniques of Electron Microscopy. Biological Applications, vol. 7 (ed. M. A. Hayat),pp. 1-78. New York: Van Nostrand Reinhold.
JAFFE, J. S. & GLAESER, R. M. (1984). Preparation of frozen-hydrated specimens for highresolution electron microscopy. Ultramicroscopy 13, 373-378.
JAKUBOWSKI, U. (1985). Can heat pipes solve the problems of drift and vibration ofcryoholders ? Ultramicroscopy. 17, 379—382.
JENG, T.-W. & CHIU, W. (1984). Quantitative assessment of radiation damage in a thinprotein crystal. J. Microsc. 136, 35-44.
JESIOR, J . - C L . (1987). How to avoid compression. II. The influence of sectioningconditions. J. Ultrastruct. Res. (In the Press.)
JOHARI, G. P. (1977). On the heat capacity, entropy and glass transition of vitreous ice.Phil. Mag. 35 (4), 1077-1090.
KELLENBERGER, E. (1987). The response of biological macromolecules and supra-molecular structures to the physics of cryo-specimen preparation. In Cryotechniquesin Biological Electron Microscopy (ed. R. A. Steinbrecht and K. Zierold, pp. 35-63.Heidelberg: Springer-Verlag.
KELLENBERGER, E., CARLEMALM, E. & VILLIGER, W. (19866). Physics of the preparationand observation of specimens that involve cryoprocedure. In Science of BiologicalSpecimen Preparation (ed. M. Miiller, R. Becker, A. Boyde and J. Wolosewick), pp.1-20. Chicago: SEM Inc., AMF O'Hare.
KELLENBERGER, E., HANER, M. & WURTZ, M. (1982). The wrapping phenomenon in air-dried and negatively stained preparations. Ultramicroscopy. 9, 139-150.
KELLENBERGER, E. & KISTLER, J. (1979). The physics of specimen preparation. InAdvances in Structure Research by Diffraction Methods, vol. vm (ed. W. Hoppe andR. Mason), pp. 49-79. Wiesbaden: Friedr. Vieweg.
KISTLER, J. & KELLENBERGER, E. (1977). Collapse phenomena in freeze-drying.J. Ultrastruct. Res. 59, 70-75.
KLEINSCHMIDT, A. K. & ZAHN, R. K. (1959). Uber Deoxyribonucleinsaure-Molekulenin Protein-Mischfilmen. Z. Naturf. 14b, 770-779.
KNAPEK, E. & DUBOCHET, J. (1980). Beam damage to organic crystals is considerablyreduced in cryo-electron microscopy. J. molec. Biol. 141, 147-161.
KOBAYASHI, K. & SAKAOKU, K. (1965). Irradiation changes in organic polymers atvarious acceleration voltages. Lab. Investigation 14, 1097—1114.
KoNiG, H. (1943). Eine kubische Eismodification. Z. Kristallogr. 105, 279-286.KOHL, H., ROSE, H. & SCHNABL, H. (1981). Dose-rate effect at low temperatures in
FBEM and STEM due to object-heating. Optik 58, 11-24.LANGER, J. S. (1980). Growth of ice crystals. Rev. mod. Phys. 52, 1-28.LAMVIK, M. K., KOPF, D. A. & ROBERTSON, J. D. (1983). Radiation damage in L-valine
at liquid helium temperature. Nature 301, 332-334.LEISEGANG, S. (1954). Zur Erwarmung elektronenmikroskopischer Objekte bei kleinem
Strahlquerschnitt. In. Proc. 3rd Int. Conf. Elec. Microsc, London, pp. 176-188.
224 J- Dubochet and others
LENZ, S. (1954). Zur Streuung mittelschneller Elektronen in kleinste Winkel. Z. Naturf.ga, 185-204.
LEPAULT, J. (1985). Cryo-electron microscopy of helical particles TMV and T4polyheads. jf. Microsc. 140, 73-80.
LEPAULT, J., BOOY, F. P. & DUBOCHET, J. (1983a). Electron microscopy of frozenbiological suspensions. J. Microsc. 129, 89-102.
LEPAULT, J. & DUBOCHET, J. (1980). Freezing, fracturing and etching artefacts inparticulate suspensions. J. Ultrastruct. Res. 72, 223—233.
LEPAULT, J. & DUBOCHET, J. (1986a). Electron microscopy of frozen hydratedspecimens: preparation and characteristics.In Meth. Enzymol. 127, 719—730.
LEPAULT, J. & DUBOCHET, J. (19866). Beam damage and frozen-hydrated specimens. InProc. Xlth Int. Cong. Elec. Microsc, Kyoto, vol. 1 (ed. T. Imura, S. Maruse andT. Suzuki), pp. 25-28. Tokyo: Japanese Society for Electron Microscopy.
LEPAULT, J., DUBOCHET, J., BASCHONG, W. & KELLENBERGER, E. (1987). Organization ofdouble-stranded DNA in bacteriophages: a study by cryo-electron microscopy ofvitrified samples. EMBO J. 6, 1507-1512.
LEPAULT, J., DUBOCHET, J., DIETRICH, I., KNAPEK, E. & ZEITLER, E. (19836).Amendment to: Electron beam damage to organic specimens at liquid heliumtemperature. J. molec. Biol. 163, 511.
LEPAULT, J., FREEMAN, R. & DUBOCHET, J. (1983c). Electron beam induced 'vitrifiedice'. J . Microsc. 132, RP3-RP4.
LEPAULT, J. & LEONARD, K. (1985). Three-dimensional structure of unstained frozen-hydrated extended tails of bacteriophage T4. J. molec. Biol. 182, 431-441.
LEPAULT, J., PATTUS, F. & MARTIN, N. (1985). Cryo-electron microscopy of artificialbiological membranes. Biochim. biophys. Ada 820, 315-318.
LEPAULT, J. & PITT, T. (1984). Projected structure of unstained, frozen-hydratedT-layer of Bacillus brevis. EMBO J. 3, 101-105.
LICKFELD, K. G. (1985). Ein Beitrag zur Frage welche Krafte und FaktorenDiinnschneiden bewirken. J. Ultrastruct. Res. 93, 101—115.
LUYET, B. J. & GEHENIO, P. M. (1940). Life and Death at Low Temperatures. Normandy,Missouri: Biodynamica.
MACKENZIE, A. P. (1977). Non equilibrium freezing behaviour of aqueous systems. Phil.Trans. R. Soc. Lond. B 278, 167-189.
MADDOX, J. (1983). Snowflakes are far from simple. Nature 306, 13.MANDELKOW, E.-M., RAPP, R. & MANDELKOW, E. (1986). Microtubule structure
studied by quick freezing: cryo-electron microscopy and freeze fracture. J. Microsc.141, 36i-373-
MAYER, E. (1985). Vitrification of pure liquid water. J. Microsc. 140, 3-15.MAYER, E. & BRUGGELLER, P. (1982). Vitrification of pure liquid water by high pressure
jet freezing. Nature 298, 715-718.MAYER, E. & BRUGGELLER, P. (1983). Devitrification of glassy water. Evidence for a
discontinuity of states. J. phys. Chem. 87, 4744-4749.MAYER, E. & HALLBRUCKER, A. (1987). Cubic ice from liquid water. Nature 325,
601-602.MAZUR, P. (1970). Cryobiology: the freezing of biological systems. Science 168,
939-949.MAZUR, P. (1984). Freezing of living cells: Mechanisms and implications. Am. J.
Physiol. 247, C125-C142.

Cryo-electron microscopy of vitrified specimens 225
MCDOWALL, A. W., CHANG, J.-J., FREEMAN, R., LEPAULT, J., WALTER, C. A. &DUBOCHET, J. (1983). Electron microscopy of frozen hydrated sections of vitreous iceand vitrified biological samples. J . Microsc. 131, 1-9.
MCDOWALL, A. W., HOFMANN, W., LEPAULT, J., ADRIAN, M. & DUBOCHET, J. (1984).Cryo-electron microscopy of vitrified insect flight muscle. J. molec. Biol. 178,105-111.
MCDOWALL, A. W., SMITH, J. M. & DUBOCHET, J. (1986). Cryo-electron microscopy ofvitrified chromosomes in situ. EMBO J. 5, 1395-1402.
MENCO, B. P. M. (1986). A survey of ultra-rapid cryofixation methods with particularemphasis on applications to freeze-fracturing, freeze-etching, and freeze-substitution.J. Elec. Microsc. Techn. 4, 177-240.
MILLIGAN, R. & FLICKER, J. (1987). J. Cell Biol. 105, 29-39.MISHIMA, O., CALVERT, L. D. & WHALLEY, E. (1984). 'Melting ice' I at 77K and
ioKbar: a new method of making amorphous solids. Nature 310, 393-395.MOOR, H. (1987). Theory and practice of high pressure freezing. In Cryotechniques in
Biological Electron Microscopy (ed. A. Steinbrecht and K. Zierold). Heidelberg:Springer Verlag, (in the Press).
MULLER, M.( MEISTER, N. & MOOR, H. (1980). Freezing in a propane jet and itsapplication in freeze-fracturing. Mikroskopie {Vienna) 36, 129-140.
MULLER, M. & MOOR, H. (1984). Cryofixation of thick specimens by high pressurefreezing. In Science of Biological Specimen Preparation, vol. 2 (ed. J.-P. Revel,T. Barnard and G. H. Haggis), pp. 131-138. Chicago: SEM Inc., AMF O'Hare.
NARTEN, A. H. & LEVY, H. A. (1969). Observed diffraction pattern and proposed modelsof liquid water. Science 165, 447-454.
NEILSON, G. W. & ENDERBY, J. E. (eds.) (1986). Water and Aqueous Solutions. Bristol& Boston: A. Hilger.
NITTMANN, J. & STANLEY, H. E. (1986). Tip splitting without interfacial tension anddendritic growth patterns arising from molecular anisotropy. Nature 321, 663-668.
PARSEGIAN, V. A. (1975). Long range van der Waals forces. In Physical Chemistry:Enriching Topics from Colloid and Surface Science (ed. H. V. Olphen & K. J.Mysels), pp. 27-72. Serie IUPAC.
PARSONS, D. F. (1974). Structure of wet specimens in electron microscopy. Science 186,407-414.
PAULING, L. (1970). General Chemistry, 3rd ed. San Francisco: Freeman.PLATTNER, H. & BACHMANN, L. (1982). Cryofixation: A tool in biological ultrastructural
research. Int. Rev. Cytol. 79, 237-304.PLATTNER, H. & KNOLL, G. (1984). Cryofixation of biological materials for electron
microscopy by the methods of spray-, sandwich-, cryogen-jet- and sandwich-cryogen-jet-freezing: A comparison of techniques. In Science of Biological SpecimenPreparation, vol. 2 (ed. J.-P. Revel, T.Barnard and G. H. Haggis), pp. 139-146.Chicago: SEM Inc., AMF O'Hare.
POLGE, C , SMITH, A. U. & PARKES, A. S. (1949). Revival of spermatozoa aftervitrification and dehydration at low temperatures. Nature 164, 666-667.
POLIAN, A. & GRIMSDITCH, M. (1984). New high pressure phase of H2O: Ice X. Phys.Rev. Lett. 52, 1312-1314.
RACHEL, R., JAKUBOWSKI, U., TIETZ, H., HEGERL, R. & BAUMEISTER, W. (1986).
Projected structure of the surface protein of deinococcus radiodurans determined to8A resolution by cryomicroscopy. Ultramicroscopy, 20, 305-316.
8 QRB 21

226 J. Dubochet and others
RAHMAN, A., & STILLINGER, F. H. (1971). Molecular dynamics study of liquid water.J. chetn. Phys. 55, 3336-3359-
RASMUSSEN, D. H. (1982). Ice formation in aqueous systems. J. Microsc. 128, 167-174.RASMUSSEN, D. H. & MACKENZIE, A. P. (1973). Clustering in supercooled water. J. chem.
Phys. 59, 5003-5013.REIMER, L. (1975). Review of the radiation damage problem of organic specimens in
electron microscopy. In Physical Aspects of Electron Microscopy and MicrobeamAnalysis (ed. B. M. Siegel and D. R. Beaman), pp. 231-245. New York: Wiley.
REIMER, L. (1984). Electron microscopy. Heidelberg: Springer Verlag.RIEHLE, U. (1968). Schnellgefrieren organischer Praparate fur die Elektronen-
Mikroskopie. Chemie-Ing. Techn. 40, 213—218.RIEHLE, U. & HOCHLI, M. (1973). The theory and technique of high pressure freezing.
In Freeze-Etching Techniques and Applications (ed. E. L. Benedetti and P. Farvard),pp. 31—61. Paris: Societe Francaise de Microscopie Electronique.
ROBARDS, A. W. & SLEYTR, U. B. (1985). Low Temperature Methods in BiologicalElectron Microscopy. New York: Elsevier.
ROBERTS, I. M. (1975). Tungstein coating — a method of improving glass microtomeknives for cutting ultrathin sections, y. Microsc. 103, 113-119.
SANDER, C. M. (1986). Fractal growth processes. Nature 322, 789-793.SAXTON, W. O. (1978). Computer Techniques for Image Processing in Electron Microscopy.
Academic Press.SCEATS, M. G. & RICE, S. A. (1982). Amorphous solid water and its relationship to
liquid water: A random network model for water. In Water: A Comprehensive Treatise(ed. F. Franks), pp. 83-214. New York: Plenum Press.
SCHAFER, L., YATES, A. C , BONHAM, R. A. (1971). New values for the partial waveelectron scattering factor for the elements 1 ̂ Z < 57 and 72 ^ Z ^ 90 for incidentelectron energies of 10, 40, 70 and 100 keV. y. chem. Phys. 55, 3055-3056.
SCHERZER, O. (1949). The theoretical resolution limit of the electron microscope, y. appl.Phys. 20, 20-29.
SIEGEL, G. (1972). The influence of very low temperature on the radiation damage oforganic crystals irradiated by 100 kV electrons. Z. Naturf. A 27, 325-332.
SITTE, H., EDELMANN, L. & NEUMANN, K. (1987). Cryofixation without pretreatment atambient pressure. In Cryotechniques in Biological Electron Microscopy (ed. R. A.Steinbrecht and K. Zierold, pp. 87-113). Heidelberg: Springer Verlag.
SITTE, H. & NEUMANN, K. (1983). Beitrag 1. 1. 2. In Methodensammlung derElektronenmikroskopie (ed. G. Schimmel and W. Vogell), pp. 1-248. Stuttgart: Wiss.Verlag GmbH.
SITTE, H., NEUMANN, K., HASSIG, H., KLEBER, H. & KAPPL, G. (1980). FC4cryochamber for Reichert OmU4-ultramicrotome Ultracut. In Proc. yth Eur. Congr.Elec. Microsc, The Hague, vol. 2 (ed. P. Brederoo and G. Boom), pp. 540-541.Leiden: Eur. Congr. Fundation.
SLEYTR, U. B. & ROBARDS, A. W. (1977). Plastic deformation during freezing-cleavage:a review, y. Microsc. n o , 1-25.
STANLEY, H. E. & TEIXEIRA, J. (1980). Interpretation of the unusual behaviour of H2Oand D2O at low temperatures: tests of a percolation model, y. chem. Phys. 73,3404-3422.
STEWART, M. & VIGERS, G. (1986). Electron microscopy of frozen-hydrated biologicalmaterial. Nature 319, 631-636.

Cryo-electron microscopy of vitrified specimens 227
STILLINGER, F. H. (1980). Water revisited. Science 309, 451-457.STILLINGER F. H. & WEBER, T. A. (1984). Packing structures and transitions in liquids
and solids. Science 225, 983-989.SYMONS, M. C. R. (1982 a). Chemical aspects of electron beam interactions in the solid
state. Ultramicroscopy 10, 15—24.SYMONS, M. C. R. (19826). The pre knock-on concept. Ultramicroscopy 10, 41-44.TALMON, Y. (1982). Thermal and radiation damage to frozen hydrated specimens.
J. Microsc. 125, 227-237.TALMON, Y. (1984). Radiation damage to organic inclusions. Ultramicroscopy 14,
305-316.TALMON, Y., ADRIAN, M. & DUBOCHET, J. (1986). Electron beam damage to organic
inclusions in vitreous, cubic and hexagonal ice. J. Microsc. 141, 375-384.TALMON, Y., DAVIS, H. T., SCRIVEN, L. E, & THOMAS, E. L. (1979). Mass loss and
etching of frozen hydrated specimens. J. Microsc. 117, 321—332.TALMON, Y. & THOMAS, E. L. (1977a). Beam heating of a moderately thick cold stage
specimen in the SEM/STEM. J. Microsc. m , 151-164.TALMON, Y. & THOMAS, E. L. (19776). Temperature rise and sublimation of water from
this frozen hydrated specimens in cold stage microscopy. Scanning Elec. Microsc. 1,265-272.
TALMON, Y. & THOMAS, E. L. (1978). Electron beam heating temperature profiles inmoderately thick cold stage STEM/SEM specimens. J. Microsc. 113, 69-75.
TALMON, Y. & THOMAS, E. L. (1979). Open system microthermometry - a technique forthe measurement of local specimen temperature in the electron microscope. J. Mater.Sci. 14, 1647-1650.
TANFORD, C. (1961). Physical Chemistry of Macromolecules. New York: Wiley.TATLOCK, G. J. (1982). Solid gases. Ultramicroscopy 10, 87-96.TAYLOR, K. A. (1978). Structure determination of frozen, hydrated, crystalline
biological specimens. J. Microsc. 112, 15-125.TAYLOR, K. A. & GLAESER, R. M. (1974). Electron diffraction of frozen, hydrated
protein crystals. Science 106, 1036-37.TAYLOR, K. A. & GLAESER, R. M. (1976). Electron microscopy of frozen hydrated
biological specimens. J. Ultrastruct. Res. 55, 448-456.TAYLOR, K. J., CHANZY, H. & MARCHESSAULT, R. H. (1975). Electron diffraction for
hydrated crystalline biopolymers: Nigeran. J. molec. Biol. 92, 165-167.TEIXEIRA, J., STANLEY, E., BOTTINGA, Y. & RICHET, P. (1983). Application of a
percolation model to supercooled liquids with a tetrahedral structure. Bull. Mineral.106, 99-i°5-
THORNBURY, W. & MENGERS, P. E. (1957). An analysis of frozen section techniques. I.Sectioning of fresh-frozen tissues. J. Histochem. Cytochem. 5, 47-52.
TOKUYASU, K. T. (1973). A technique for ultracryotomy of cell suspensions and tissues.j . Cell Biol. 57, 551-565.
TOKUYASU, K. T. (1980). Immunochemistry of ultrathin frozen sections. Histochem. J.12, 381-403.
TOKUYASU, K. T. & OKAMURA, S. (1959). A new method for making glass knives for thinsectioning. J. Biophys. Biochem. Cytol. 6, 305-308.
TRINICK, J., COOPER, J., SEYMOUR, J. & EGELMAN, E. H. (1986). Cryo-electronmicroscopy and three-dimensional reconstruction of actin filaments. J. Microsc. 141,349-360.
8-2

228 J. Dubochet and others
TYPKE, D. & RADERMACHER, M. (1982). Determination of the phase of complex atomicscattering amplitudes from light-optical diffractograms of electron microscope images.Ultramicroscopy 9, 131-138.
UNWIN, P. N. T. (1972). Electron microscopy of biological specimens by means of anelectrostatic phase plate. Proc. R. Soc. London A 329, 327-359.
UNWIN, P. N. T. (1974). Electron microscopy of the stacked dish aggregate of TobaccoMosaic Virus protein. II. The influence of electron irradiation on the staindistribution, jf. molec. Biol. 87, 657-670.
UNWIN, P. N. T. & HENDERSON, R. (1975). Molecular structure determination byelectron microscopy of unstained crystalline specimens. J. molec. Biol. 94, 425-440.
UNWIN, P. N. T. & MUGURUMA, J. (1971). Transmission electron microscopy of ice.J. appl. Phys. 42, 3640-3641.
UNWIN, P. N. T. & MUGURUMA, J. (1972). Electron microscope observations on thedefect structure of ice. Physica status solidi (a) 14, 207-216.
VALENTINE, R. C. (1966). Response of photographic materials to electrons. In Advancesin Optical and Electron Microscopy, vol. 1 (ed. R. Barer and V. E. Cosslett), pp.180—202. London: Academic Press.
VIGERS, G. P. A., CROWTHER, R. A. & PEARSE, B. M. F. (1986a). Three-dimensionalstructure of clathrin cages in ice. EMBO J. 5, 529-534.
VIGERS, G. P. A., CROWTHER, R. A. & PEARSE, B. M. F. (19866). Location of theiookD-sokD accessory proteins in clathrin coats. EMBO J. 5, 2079-2085.
VOGEL, R. H., PROVENCHER, S. W., VON BONSDORFF, C.-H., ADRIAN, M. & DUBOCHET,
J. (1986). Envelope structure of Semliki forest virus reconstructed from cryo-electronmicrographs. Nature 320, 533~535-
WADE, R. H. (1984). The temperature dependence of radiation damage in organic andbiological material. Ultramicroscopy 14, 265-270.
WALL, J., BITTNER, J. W. & HAINFELD, J. (1977). Contamination at low temperature. InProc. 35th Ann. EMSA Meeting, Boston, pp. 558-559.
WALL, J., ISAACSON, M. & LANGMORE, J. (1974). The collection of scattered electrons indark-field electron microscopy. II. Inelastic scattering. Optik 39, 359—374.
WILSON, D. (1979). Supercold: An Introduction to Low Temperature Technology, London& Boston: Faber & Faber.
ZIEROLD K. (1982). Preparation of biological cryosections for analytical electronmicroscopy. Ultramicroscopy 10, 45-54.
ZIEROLD, K. (1984). The morphology of ultrathin cryosections. Ultramicroscopy 14,201-209.
ZIEROLD, K. (1987). Cryoultramicrotomy. In Cryotechniques in Biological ElectronMicroscopy (ed. A. Steinbrecht and K. Zierold, pp. 132-148). Heidelberg: SpringerVerlag.