The vitrified Bronze Age fortification of Bernstorf (Bavaria, Germany) – an integrated...
8
25 European Geologist 38 | November 2014 V itrified forts are phenomena which appear throughout Europe during early- and pre-historic times. According to Youngblood et al. (1978) these ramparts were burned and due to high temperatures were vitrified (partly molten). ey were first described by Pen- nant (1771) in Scotland. For a long time it was supposed that they were peculiar to Scotland; but they also occur in Ireland, France, Germany, Hungary and Sweden, built out of different geological rocks such as calcite, sandstone or even igneous rock. Kresten (1996) published a compilation of all existing structures, more than 1,000 of them in Sweden. Since the late 18 th century vitrified forts have been under discussion concerning the causes of vitrification. Kresten & Ambro- The vitrified Bronze Age fortification of Bernstorf (Bavaria, Germany) – an integrated geoarchaeological approach Astrid Röpke* and Carlo Dietl *Institut für Archäologische Wissenschaften, Goethe Universität, Frankfurt am Main, [email protected] frankfurt.de “Vitrified forts” are phenomena which appear throughout Europe during prehistoric times. The burnt 1.6 km rampart of the vitrified Bronze Age fortification of Bernstorf is an invaluable example for studying burning temperatures, because it displays temperature zoning with various heat- ing features that are recognisable in thin section and suitable for the development of micromor- phological criteria to identify burning processes such as reddening, vitrification and melting. We use semi-quantitative mineral analytical meth- ods (XRD, EDS and magnetic susceptibility) and compare our results with those of Gebhard et al. (2004). Combining these data we get a broader picture of the burning conditions and are able to relate micromorphological burning features to temperature regimes, information which can be used to reconstruct past human fire activities. Les “Forteresses vitrifiées” sont des curiosités qui apparaissent en Europe pendant les temps préhistoriques. La fortification vitrifiée de Bern- storf, datant de l’Age de Bronze, est l’une des plus imposantes, en partie nord des Alpes. Elle fut com- plétement brûlée et détruite sur une longueur de 1.6 km. Le rempart calciné constitue un exem- ple inestimable pour l’étude des températures de combustion parce qu’il offre une zonation de températures avec différentes caractéristiques de chauffe. Cette zonation au sein de sédiments altérés structurellement est reconnaissable en lame mince et permet la mise en valeur de critères micro-morphologiques pour identifier les proces- sus de combustion tels que le rougissement, la vitrification et la fusion. Ces informations peuvent servir pour reconstituer les activités humaines liées au feu. Nous appuyons et confirmons nos résultats à partir de méthodes semi- quantitatives d’analyse des minéraux, appelées XRD, EDS et mettant en œuvre la susceptibilité magnétique. Dans une étape suivante, nous comparons nos résultats avec les études plus anciennes de Geb- bard et al. (2004). La mise en commun de ces données permet d’obtenir une perception plus large des conditions de combustion et de relier les caractéristiques micro-morphologiques de combustion aux régimes thermiques. “Fortalezas vitrificadas” son fenómenos que occurrieron en toda Europa durante la época prehistórica. La muralla quemada del fuerte vitri- ficado de Bernstorf es da la Edad de Bronce y tiene un dide Bro de 1,6 km. Es un ejemplo muy valioso para estudiar las temperaturas de combustión de lso terraplenes, porque la fortaleza expone una zonificación de rasgos de calentamiento. Del exterior al interior se percibe una zona de enro- jecimiento, una de vitrificación y una de fusión. En cortes delgados observábamos características micromorfológicas para estas tres zonas. Con her- ramientas avanzadas, tales como DRX (difracción de rayos X), SDE (espectroscopia dispersiva para energía) y la susceptibilidad magnética, podrla su definir temperaturas y procesos de combustión. Nuestros resultados están de acuerdo con los de Gebhard et al. (2004). Nuestros datos comple- tados con los textos (de la literatura) dan infor- maciones importantes para poder reconstruir el uso (y abuso) del fuego en tiempos prehistóricos. Figure 1: Map of the study site including excavation areas (Bayerische Denkmalpflege, Goethe University, Frankfurt) (Bernstorf-Project, Goethe University). Topical - Geoarchaeology
Transcript of The vitrified Bronze Age fortification of Bernstorf (Bavaria, Germany) – an integrated...
25European Geologist 38 | November 2014
Vitrified forts are phenomena which appear throughout Europe during early- and pre-historic times.
According to Youngblood et al. (1978) these ramparts were burned and due to high temperatures were vitrified (partly molten). They were first described by Pen-nant (1771) in Scotland. For a long time it was supposed that they were peculiar to Scotland; but they also occur in Ireland, France, Germany, Hungary and Sweden, built out of different geological rocks such as calcite, sandstone or even igneous rock. Kresten (1996) published a compilation of all existing structures, more than 1,000 of them in Sweden.
Since the late 18th century vitrified forts have been under discussion concerning the causes of vitrification. Kresten & Ambro-
The vitrified Bronze Age fortification of Bernstorf (Bavaria, Germany) – an integrated geoarchaeological approachAstrid Röpke* and Carlo Dietl
*Institut für Archäologische Wissenschaften, Goethe Universität, Frankfurt am Main, [email protected]
“Vitrified forts” are phenomena which appear throughout Europe during prehistoric times. The burnt 1.6 km rampart of the vitrified Bronze Age fortification of Bernstorf is an invaluable example for studying burning temperatures, because it displays temperature zoning with various heat-ing features that are recognisable in thin section and suitable for the development of micromor-phological criteria to identify burning processes such as reddening, vitrification and melting. We use semi-quantitative mineral analytical meth-ods (XRD, EDS and magnetic susceptibility) and compare our results with those of Gebhard et al. (2004). Combining these data we get a broader picture of the burning conditions and are able to relate micromorphological burning features to temperature regimes, information which can be used to reconstruct past human fire activities.
Les “Forteresses vitrifiées” sont des curiosités qui apparaissent en Europe pendant les temps préhistoriques. La fortification vitrifiée de Bern-storf, datant de l’Age de Bronze, est l’une des plus imposantes, en partie nord des Alpes. Elle fut com-plétement brûlée et détruite sur une longueur de 1.6 km. Le rempart calciné constitue un exem-ple inestimable pour l’étude des températures de combustion parce qu’il offre une zonation de températures avec différentes caractéristiques de chauffe. Cette zonation au sein de sédiments altérés structurellement est reconnaissable en lame mince et permet la mise en valeur de critères micro-morphologiques pour identifier les proces-sus de combustion tels que le rougissement, la vitrification et la fusion. Ces informations peuvent servir pour reconstituer les activités humaines liées au feu. Nous appuyons et confirmons nos résultats à partir de méthodes semi- quantitatives d’analyse des minéraux, appelées XRD, EDS et mettant en œuvre la susceptibilité magnétique. Dans une étape suivante, nous comparons nos résultats avec les études plus anciennes de Geb-bard et al. (2004). La mise en commun de ces données permet d’obtenir une perception plus large des conditions de combustion et de relier les caractéristiques micro-morphologiques de combustion aux régimes thermiques.
“Fortalezas vitrificadas” son fenómenos que occurrieron en toda Europa durante la época prehistórica. La muralla quemada del fuerte vitri-ficado de Bernstorf es da la Edad de Bronce y tiene un dide Bro de 1,6 km. Es un ejemplo muy valioso para estudiar las temperaturas de combustión de lso terraplenes, porque la fortaleza expone una zonificación de rasgos de calentamiento. Del exterior al interior se percibe una zona de enro-jecimiento, una de vitrificación y una de fusión. En cortes delgados observábamos características micromorfológicas para estas tres zonas. Con her-ramientas avanzadas, tales como DRX (difracción de rayos X), SDE (espectroscopia dispersiva para energía) y la susceptibilidad magnética, podrla su definir temperaturas y procesos de combustión. Nuestros resultados están de acuerdo con los de Gebhard et al. (2004). Nuestros datos comple-tados con los textos (de la literatura) dan infor-maciones importantes para poder reconstruir el uso (y abuso) del fuego en tiempos prehistóricos.
Figure 1: Map of the study site including excavation areas (Bayerische Denkmalpflege, Goethe University, Frankfurt) (Bernstorf-Project, Goethe University).
Topical - Geoarchaeology

26
siani (1992) summarise the best established theories for burning of defense construc-tions: (1) incidental by natural causes, (2) constructive to make it more durable and (3) destructive by warfare. In addition Bähr et al. (2012) suggest ritual reasons for the Bernstorf fortification.
The Bernstorf rampart was discovered in 1904 by the local historian Josef Wenzel and recently rediscovered in 1990 (Fig. 1). According to dendrochronological and radiocarbon data the ca. 1.6 km long ram-part was constructed during the Middle to Late Bronze Age. Its construction is based on sandy loam and wood. The fortification enclosed a settlement area. Preserved rem-nants of building structures are also burnt (Bähr et al., 2012). The vitrified fortification of Bernstorf is an invaluable example for studying burning temperatures, because the construction is almost preserved in situ and displays a temperature zoning with various heating features.
Previous studies have investigated other parts of the fortification and made assump-tions about their burning temperatures. Kresten (1998) using electron microprobe analysis and Unger (2001) by macroscopic inspection postulate burning temperatures around 1300 °C. Gebhard et al. (2004), using Mössbauer spectroscopy and X-ray powder diffraction analysis (XRD), sug-gest a temperature regime around 1200 °C. In this respect, Bernstorf is already well investigated and therefore an unusual case, because normally fire-affected soils and sediments are a neglected by-product of archaeological investigations (Berna et al., 2007).
In this study we use this favourable situa-tion of the Bernstorf fortification to extend the research with further methods and to try to create a “geoarchaeological thermo-
A substantial part of the rampart was destroyed by gravel quarrying during the last 50 years. Geologically the Bernstorf hill site consists stratigraphically of rocks from the Upper Freshwater Mollasse, namely of fine to coarse sand underlain by marl and silt (Unger, 2001). The geomagnetic survey (carried out by Terrana Geophysik) and archaeological excavations by the Bay-erisches Landesamt für Denkmalpflege (Bavarian Monument Conservation) and the Goethe University Frankfurt document that the fortification was burnt along its entire length (Bähr et al., 2012) (Fig. 1). Apart from that, Bronze Age and Iron Age archaeological sites were excavated within the fortification.
Materials and methods
To study burning conditions and ther-mal zoning of the fortification we applied a two-fold approach: we collected burnt archaeological samples from different zones of the rampart and compared them with untreated samples from the vicinity of the fortification, which we used for burn-ing experiments (Fig. 2, Table 1). Accord-ing to grain size distribution the texture of Bernstorf samples consists of sandy loam. Four samples were taken from the rampart of Section III3 (Goethe Univer-sity, 2010). Samples DS 3 and DS 4 come from the rim and DS1 and 81 belong to the centre. As archaeological reference, B-M34 and B-M44 from Section 1 (Bay-erisches Landesamt für Denkmalpflege) were included. The experimental samples (BT2-23, BT2-42, BT2-04) were heated in a muffle furnace for 24 hours in oxygen atmosphere at 600 °C, 1000 °C, 1200 °C and 1400 °C. In the latter case three hours
meter”. To receive more detailed information about the burning conditions, heat-affected changes and observable features in thin section we applied a multi-methodological approach using micromorphology, X-ray powder diffraction analysis (XRD), energy dispersive spectroscopy (EDS) and magnetic susceptibility (MS). Not only samples from the rampart itself but also samples of experi-mentally heated loam from the Bernstorf site were included in the reconstruction.
The site of Bernstorf and the Bronze Age fortification
The fortification of Bernstorf is situated on a hill site above the valley of the river Amper north of Munich (Germany). The Bernstorf rampart is the largest middle Bronze Age fortification north of the Alps, with a total length of 1.645 km which encompasses an area of 12.8 hectare (Bähr et al., 2012).
Figure 2: Section III3 burnt sediments of the rampart in Bernstorf (Bavaria, Germany) (Bernstorf-Project, Goethe University).
Sample Material Location Micromor-phology
XRD EDS MS κ(T)
BT-EW06 Reference, unburnt soil material Section III3 x x - x x
DS3 Reddened rampart material, outer part
Section III3 x x x x x
DS4 reddened rampart material, outer part Section III3 x - - - -
DS1 Slightly vitrified rampart material, centre Section III3 x x x x x
81 Vitrified rampart material Section III3 x x x x x
B-M34 Vitrified rampart material Section 1 - x - - -
B-M44 Vitrified rampart material Section 1 - x - - -
BT-600 Experimentally weakly reddened (at 600 °C) Section III3 x x - - -
BT2-23 Experimentally intensively red-dened (1000 °C) Section III3 x x x x x
BT2-42 Experimentally vitrified (at 1200 °C) Section III3 x x x x x
BT2-04 Experimentally melted (at 1400 °C) Section III3 x x x x x
Table 1: Archaeological and experimental sample description from Bernstorf (Bavaria, Germany).
27European Geologist 38 | November 2014
were sufficient to melt the entire sample. BT-EW06 remained unheated.
Micromorphology
Nine samples were prepared accord-ing to micromorphological standards: freeze-dried, impregnated by epoxy-resin, made into thin section and polished at the preparation laboratory of the Earth Sci-ence Department of Goethe University. They were investigated under a polarising microscope at a magnification of up to x 800. The description mainly follows the terminology of Stoops (2003), MacKenzie et al. (1982) and Tröger (1982) form the base for the geological description.
X-Ray powder diffraction analysis (XRD)
Since clays are the most temperature sensitive components in sediments, sam-ples were sieved and merely the clay frac-
tion was used for analysis. In particular, Al-bearing silicates are of interest to our study, because they are very sensitive to temperature changes. These minerals can be identified by characteristic X-ray dif-fraction patterns in pulverised samples. Six powdered samples (DS3, DS1, 81, BT2-23, BT2-42) were investigated as to their min-eralogical composition within the two-theta range from 2.5 to 90. The clay fraction was used for analysis. XRD helps to identify mineral phases in fine material.
Energy dispersive spectroscopy (EDS)
EDS analyses were applied to six samples (thin sections) with a Cameca SEM (EDS by Oxford Instruments) at the Archaeology Department of University College London. We focussed on the oxide phases as well as the matrix composition of the very fine grained material. EDS, in contrast to WDS, is very suitable for area scans.
Sample Micromorphological description
DS3/4 DS3/4 consists of porhyric cf (cf denotes coarse vs. fine) with few pores, reddened matrix with an anthropogenic flow fabric, probably the result of brick making. Quartz and feldspar are the two main phases within the reddened matrix; mica is also present (Fig 3D).
DS1 DS1 is rich in vesicles and of grey colour. Vitrified material, appearing isotropic under crossed polarisers, indicates the presence of sintered or even melted material (Figs. 3I, 3G). Quartz is the only visible silicate phase.
81 81 is rich in vesicles. The bridges between the vesicles consist mainly of glass, i.e. former melt, plus some quartz.
BT-EW06 BT-EW06 consists of a porphyric cf-related distribution with clay coatings. The coarse frac-tion is sand-sized quartz, mica and feldspar (Fig. 3A). Charcoal is evidenced.
BT 600 BT 600 is weakly reddened with a similar composition. Mainly clay coating in pores and around grains were ferruginised. Mica was not yet affected by heat (Fig. 3B).
BT2-23 BT2-23 shows strong reddening. Clay minerals within the matrix mostly vanished. Chlorite is evidenced (Fig. 3D).
BT2-42 BT2-42 shows vitrification and partial melting. The sample is stained gray. Besides quartz with some microcracks almost no other minerals can be identified within the vesicle-rich glassy matrix (Fig. 3E).
BT2-04 BT2-4 was entirely molten. Finely dispersed iron oxide (probably magnetite according to XRD and MS) forms schlieren within the glass. Quartz with microcracks is the only remaining mineral (Fig. 3H).
Sample Quartz Albite Calcite/ dolomite
Three-layer Mica
Clinochlor / chlorite
Sillimanit / mullite
Cordier-ite
Indialite Cristo-balite low
Spinel group
Hema-tite / ilmenite
BT-EW 06 48,5 12,1 9,1 7,1 15,2 8 0 0 0 0 0 0
DS3 62 5 18 0 15 0 0 0 0 0 0 0
DS1 90,9 4 0 0 0 0 0 1 0 0 4,1 0
81 76,8 5,1 2 0 2 0 2,9 1 5,1 0 5,1 0
B-M34 87 5 4 0 3 0 0 0 0 1 0 0
B-M44 92 0 0 0 0 0 4 1 1 1 0 1
BT- 600 74,2 10,5 7,1 0,5 7,7 0 0 0 0 0 0 0
BT2-23 51 9 24 0 0 0 6 0 0 0 5 5
BT2-42 33,3 0 0 0 0 0 42,4 12,1 5,1 1 0 6,1
BT2_04 68 0 0 0 0 0 23 0 0 5 4 0
Table 2: Micromorphological description of archaeological and experimental samples of Bernstorf.
Table 3: Data of XRD measurements of archaeological and experimental samples of Bernstorf.
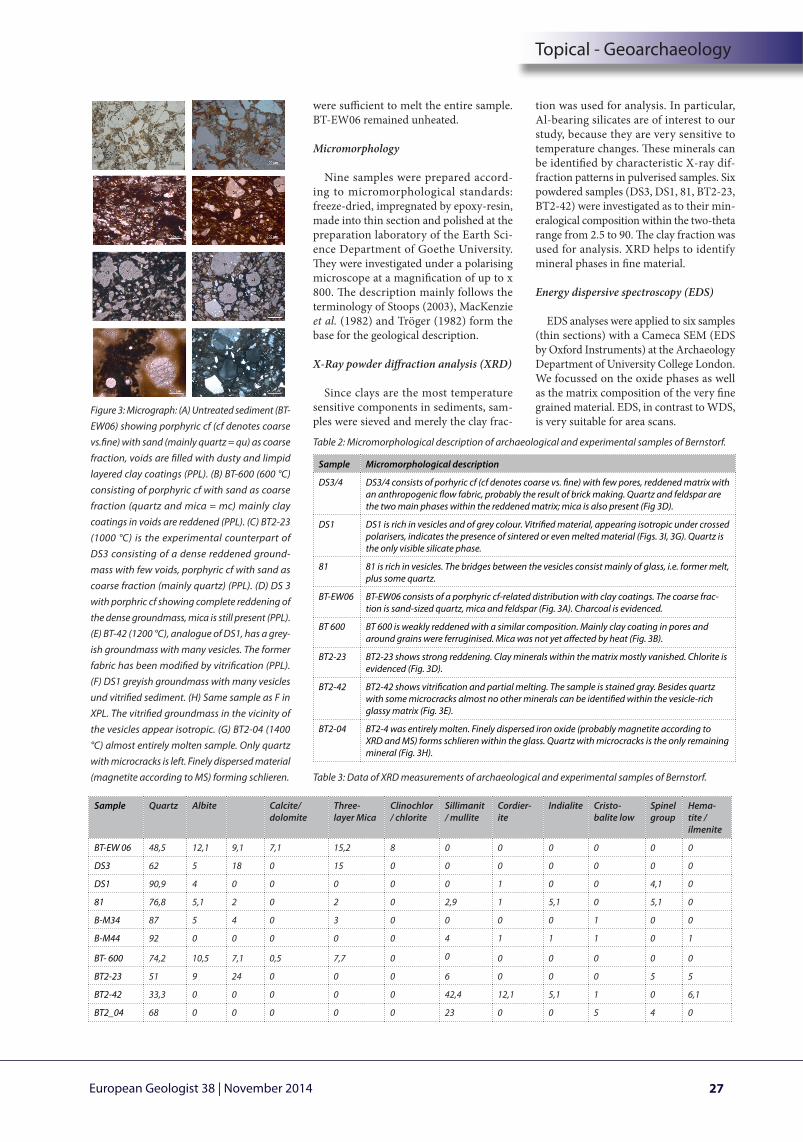
Figure 3: Micrograph: (A) Untreated sediment (BT-EW06) showing porphyric cf (cf denotes coarse vs.fine) with sand (mainly quartz = qu) as coarse fraction, voids are filled with dusty and limpid layered clay coatings (PPL). (B) BT-600 (600 °C) consisting of porphyric cf with sand as coarse fraction (quartz and mica = mc) mainly clay coatings in voids are reddened (PPL). (C) BT2-23 (1000 °C) is the experimental counterpart of DS3 consisting of a dense reddened ground-mass with few voids, porphyric cf with sand as coarse fraction (mainly quartz) (PPL). (D) DS 3 with porphric cf showing complete reddening of the dense groundmass, mica is still present (PPL). (E) BT-42 (1200 °C), analogue of DS1, has a grey-ish groundmass with many vesicles. The former fabric has been modified by vitrification (PPL). (F) DS1 greyish groundmass with many vesicles und vitrified sediment. (H) Same sample as F in XPL. The vitrified groundmass in the vicinity of the vesicles appear isotropic. (G) BT2-04 (1400 °C) almost entirely molten sample. Only quartz with microcracks is left. Finely dispersed material (magnetite according to MS) forming schlieren.
Topical - Geoarchaeology
28
Magnetic susceptibility (κ / χ)
Measurements of κ and χ are frequently used in a geoarchaeological context to evidence burning conditions (Macphail &
Goldberg, 2006). We measured κ and cal-culated the mass dependent susceptibility χ in order to evaluate the magnetic character of the individual samples (paramagnetic: χ in the range of 10-7 to 10-8; ferrimagnetic:
χ in the range of 10-6). Moreover, we car-ried out thermomagnetic measurements to decipher the main carrier of κ. Six samples were investigated (see Table 1). Measure-ments were undertaken at the magnetic laboratory of the Department of Geology and Geosciences of Friedrich-Alexander-Universität Erlangen-Nürnberg
Results
Micromorphology
The micromorphological descriptions of the archaeological and experimental sam-ples are presented in Table 2. In the micro-graph (Fig. 3) photographs of substantial features regarding reddening, vitrification and melting are documented.
XRD measurements
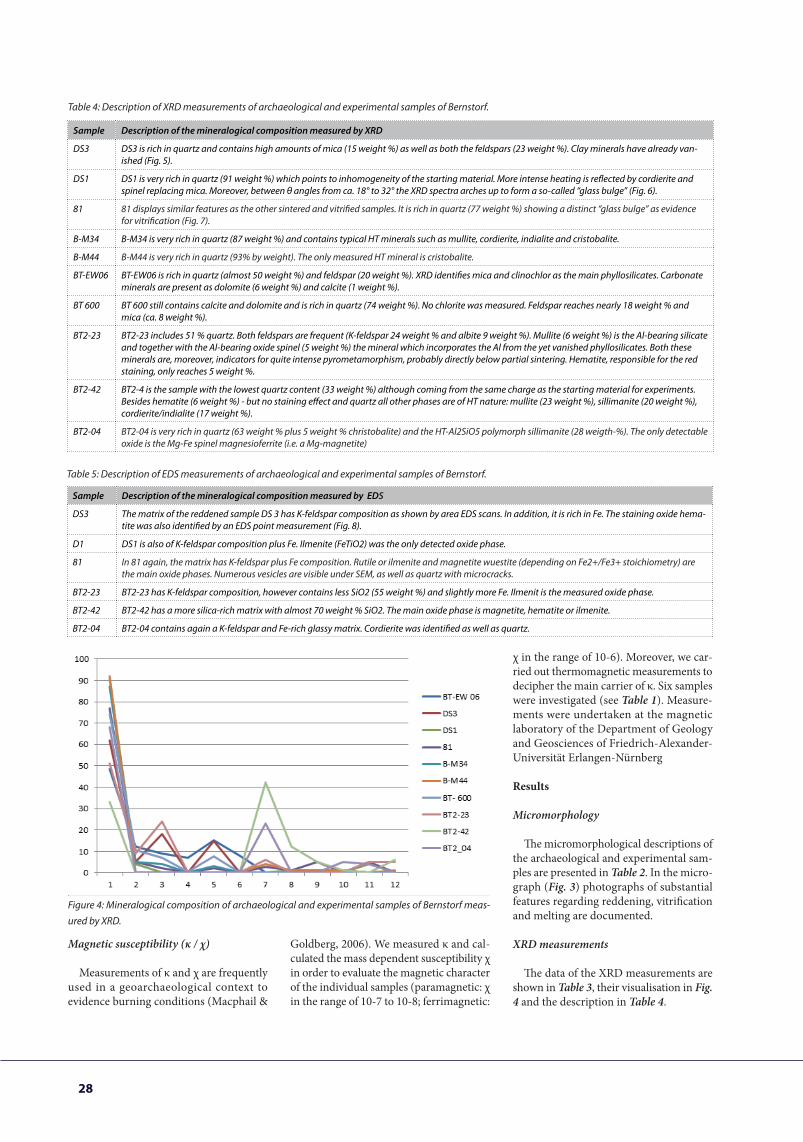
The data of the XRD measurements are shown in Table 3, their visualisation in Fig. 4 and the description in Table 4.
Sample Description of the mineralogical composition measured by XRD
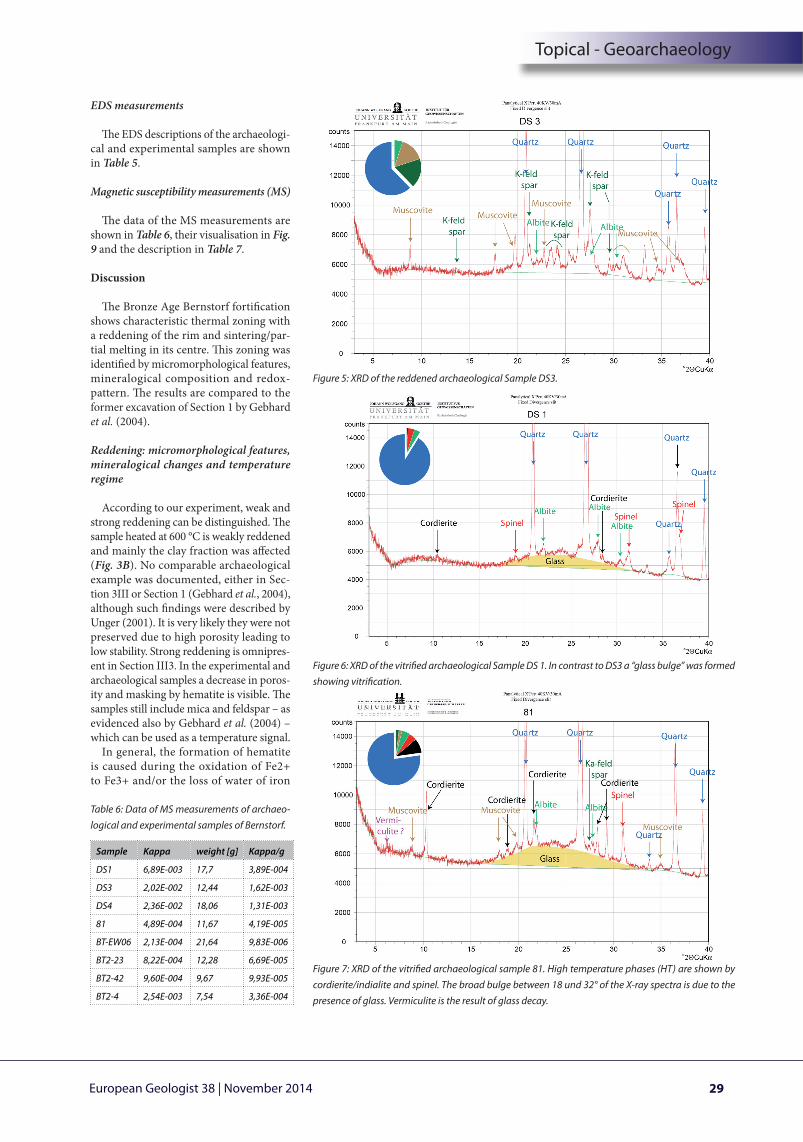
DS3 DS3 is rich in quartz and contains high amounts of mica (15 weight %) as well as both the feldspars (23 weight %). Clay minerals have already van-ished (Fig. 5).
DS1 DS1 is very rich in quartz (91 weight %) which points to inhomogeneity of the starting material. More intense heating is reflected by cordierite and spinel replacing mica. Moreover, between θ angles from ca. 18° to 32° the XRD spectra arches up to form a so-called “glass bulge” (Fig. 6).
81 81 displays similar features as the other sintered and vitrified samples. It is rich in quartz (77 weight %) showing a distinct “glass bulge” as evidence for vitrification (Fig. 7).
B-M34 B-M34 is very rich in quartz (87 weight %) and contains typical HT minerals such as mullite, cordierite, indialite and cristobalite.
B-M44 B-M44 is very rich in quartz (93% by weight). The only measured HT mineral is cristobalite.
BT-EW06 BT-EW06 is rich in quartz (almost 50 weight %) and feldspar (20 weight %). XRD identifies mica and clinochlor as the main phyllosilicates. Carbonate minerals are present as dolomite (6 weight %) and calcite (1 weight %).
BT 600 BT 600 still contains calcite and dolomite and is rich in quartz (74 weight %). No chlorite was measured. Feldspar reaches nearly 18 weight % and mica (ca. 8 weight %).
BT2-23 BT2-23 includes 51 % quartz. Both feldspars are frequent (K-feldspar 24 weight % and albite 9 weight %). Mullite (6 weight %) is the Al-bearing silicate and together with the Al-bearing oxide spinel (5 weight %) the mineral which incorporates the Al from the yet vanished phyllosilicates. Both these minerals are, moreover, indicators for quite intense pyrometamorphism, probably directly below partial sintering. Hematite, responsible for the red staining, only reaches 5 weight %.
BT2-42 BT2-4 is the sample with the lowest quartz content (33 weight %) although coming from the same charge as the starting material for experiments. Besides hematite (6 weight %) - but no staining effect and quartz all other phases are of HT nature: mullite (23 weight %), sillimanite (20 weight %), cordierite/indialite (17 weight %).
BT2-04 BT2-04 is very rich in quartz (63 weight % plus 5 weight % christobalite) and the HT-Al2SiO5 polymorph sillimanite (28 weigth-%). The only detectable oxide is the Mg-Fe spinel magnesioferrite (i.e. a Mg-magnetite)
Sample Description of the mineralogical composition measured by EDS
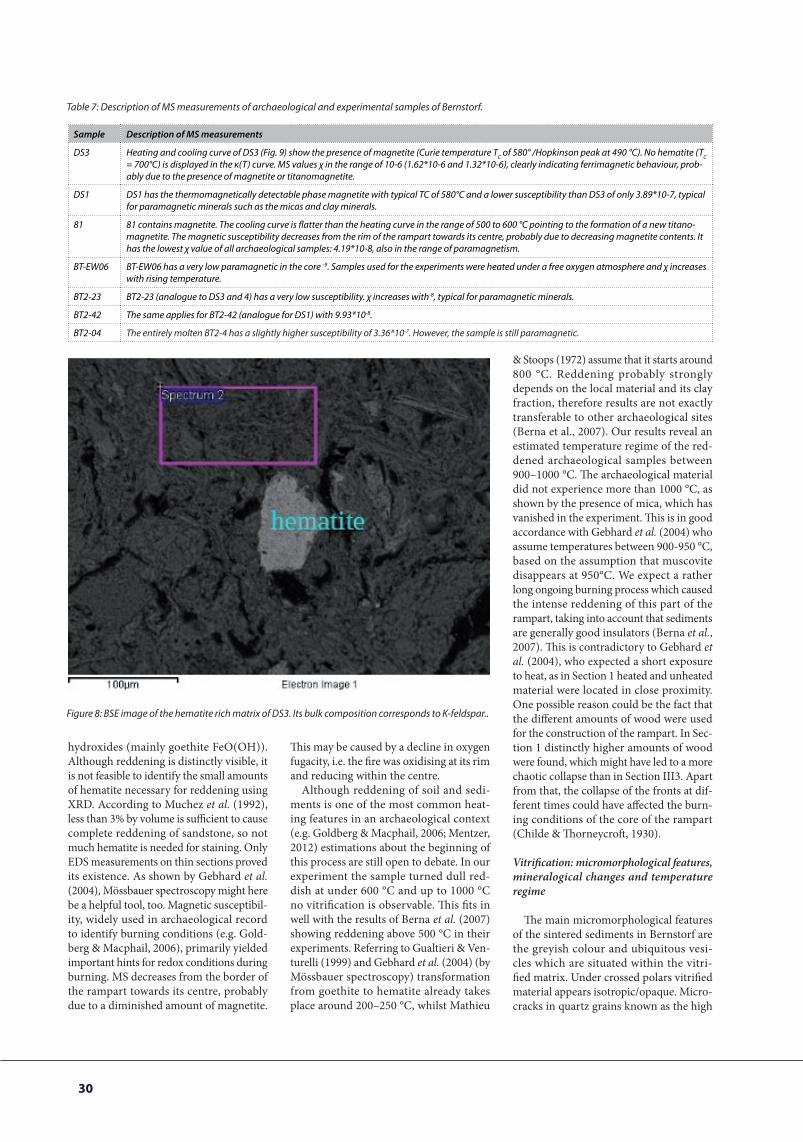
DS3 The matrix of the reddened sample DS 3 has K-feldspar composition as shown by area EDS scans. In addition, it is rich in Fe. The staining oxide hema-tite was also identified by an EDS point measurement (Fig. 8).
D1 DS1 is also of K-feldspar composition plus Fe. Ilmenite (FeTiO2) was the only detected oxide phase.
81 In 81 again, the matrix has K-feldspar plus Fe composition. Rutile or ilmenite and magnetite wuestite (depending on Fe2+/Fe3+ stoichiometry) are the main oxide phases. Numerous vesicles are visible under SEM, as well as quartz with microcracks.
BT2-23 BT2-23 has K-feldspar composition, however contains less SiO2 (55 weight %) and slightly more Fe. Ilmenit is the measured oxide phase.
BT2-42 BT2-42 has a more silica-rich matrix with almost 70 weight % SiO2. The main oxide phase is magnetite, hematite or ilmenite.
BT2-04 BT2-04 contains again a K-feldspar and Fe-rich glassy matrix. Cordierite was identified as well as quartz.
Table 4: Description of XRD measurements of archaeological and experimental samples of Bernstorf.
Table 5: Description of EDS measurements of archaeological and experimental samples of Bernstorf.
Figure 4: Mineralogical composition of archaeological and experimental samples of Bernstorf meas-ured by XRD.
29European Geologist 38 | November 2014
EDS measurements
The EDS descriptions of the archaeologi-cal and experimental samples are shown in Table 5.
Magnetic susceptibility measurements (MS)
The data of the MS measurements are shown in Table 6, their visualisation in Fig. 9 and the description in Table 7.
Discussion
The Bronze Age Bernstorf fortification shows characteristic thermal zoning with a reddening of the rim and sintering/par-tial melting in its centre. This zoning was identified by micromorphological features, mineralogical composition and redox-pattern. The results are compared to the former excavation of Section 1 by Gebhard et al. (2004).
Reddening: micromorphological features, mineralogical changes and temperature regime
According to our experiment, weak and strong reddening can be distinguished. The sample heated at 600 °C is weakly reddened and mainly the clay fraction was affected (Fig. 3B). No comparable archaeological example was documented, either in Sec-tion 3III or Section 1 (Gebhard et al., 2004), although such findings were described by Unger (2001). It is very likely they were not preserved due to high porosity leading to low stability. Strong reddening is omnipres-ent in Section III3. In the experimental and archaeological samples a decrease in poros-ity and masking by hematite is visible. The samples still include mica and feldspar – as evidenced also by Gebhard et al. (2004) – which can be used as a temperature signal.
In general, the formation of hematite is caused during the oxidation of Fe2+ to Fe3+ and/or the loss of water of iron
Figure 5: XRD of the reddened archaeological Sample DS3.
Figure 6: XRD of the vitrified archaeological Sample DS 1. In contrast to DS3 a “glass bulge” was formed showing vitrification.
Figure 7: XRD of the vitrified archaeological sample 81. High temperature phases (HT) are shown by cordierite/indialite and spinel. The broad bulge between 18 und 32° of the X-ray spectra is due to the presence of glass. Vermiculite is the result of glass decay.
Sample Kappa weight [g] Kappa/g
DS1 6,89E-003 17,7 3,89E-004
DS3 2,02E-002 12,44 1,62E-003
DS4 2,36E-002 18,06 1,31E-003
81 4,89E-004 11,67 4,19E-005
BT-EW06 2,13E-004 21,64 9,83E-006
BT2-23 8,22E-004 12,28 6,69E-005
BT2-42 9,60E-004 9,67 9,93E-005
BT2-4 2,54E-003 7,54 3,36E-004
Table 6: Data of MS measurements of archaeo-logical and experimental samples of Bernstorf.
Topical - Geoarchaeology
30
Table 7: Description of MS measurements of archaeological and experimental samples of Bernstorf.
Figure 8: BSE image of the hematite rich matrix of DS3. Its bulk composition corresponds to K-feldspar..
& Stoops (1972) assume that it starts around 800 °C. Reddening probably strongly depends on the local material and its clay fraction, therefore results are not exactly transferable to other archaeological sites (Berna et al., 2007). Our results reveal an estimated temperature regime of the red-dened archaeological samples between 900–1000 °C. The archaeological material did not experience more than 1000 °C, as shown by the presence of mica, which has vanished in the experiment. This is in good accordance with Gebhard et al. (2004) who assume temperatures between 900-950 °C, based on the assumption that muscovite disappears at 950°C. We expect a rather long ongoing burning process which caused the intense reddening of this part of the rampart, taking into account that sediments are generally good insulators (Berna et al., 2007). This is contradictory to Gebhard et al. (2004), who expected a short exposure to heat, as in Section 1 heated and unheated material were located in close proximity. One possible reason could be the fact that the different amounts of wood were used for the construction of the rampart. In Sec-tion 1 distinctly higher amounts of wood were found, which might have led to a more chaotic collapse than in Section III3. Apart from that, the collapse of the fronts at dif-ferent times could have affected the burn-ing conditions of the core of the rampart (Childe & Thorneycroft, 1930).
Vitrification: micromorphological features, mineralogical changes and temperature regime
The main micromorphological features of the sintered sediments in Bernstorf are the greyish colour and ubiquitous vesi-cles which are situated within the vitri-fied matrix. Under crossed polars vitrified material appears isotropic/opaque. Micro-cracks in quartz grains known as the high
Sample Description of MS measurements
DS3 Heating and cooling curve of DS3 (Fig. 9) show the presence of magnetite (Curie temperature TC of 580° /Hopkinson peak at 490 °C). No hematite (TC = 700°C) is displayed in the κ(T) curve. MS values χ in the range of 10-6 (1.62*10-6 and 1.32*10-6), clearly indicating ferrimagnetic behaviour, prob-ably due to the presence of magnetite or titanomagnetite.
DS1 DS1 has the thermomagnetically detectable phase magnetite with typical TC of 580°C and a lower susceptibility than DS3 of only 3.89*10-7, typical for paramagnetic minerals such as the micas and clay minerals.
81 81 contains magnetite. The cooling curve is flatter than the heating curve in the range of 500 to 600 °C pointing to the formation of a new titano-magnetite. The magnetic susceptibility decreases from the rim of the rampart towards its centre, probably due to decreasing magnetite contents. It has the lowest χ value of all archaeological samples: 4.19*10-8, also in the range of paramagnetism.
BT-EW06 BT-EW06 has a very low paramagnetic in the core -9. Samples used for the experiments were heated under a free oxygen atmosphere and χ increases with rising temperature.
BT2-23 BT2-23 (analogue to DS3 and 4) has a very low susceptibility. χ increases with-8, typical for paramagnetic minerals.
BT2-42 The same applies for BT2-42 (analogue for DS1) with 9.93*10-8.
BT2-04 The entirely molten BT2-4 has a slightly higher susceptibility of 3.36*10-7. However, the sample is still paramagnetic.
hydroxides (mainly goethite FeO(OH)). Although reddening is distinctly visible, it is not feasible to identify the small amounts of hematite necessary for reddening using XRD. According to Muchez et al. (1992), less than 3% by volume is sufficient to cause complete reddening of sandstone, so not much hematite is needed for staining. Only EDS measurements on thin sections proved its existence. As shown by Gebhard et al. (2004), Mössbauer spectroscopy might here be a helpful tool, too. Magnetic susceptibil-ity, widely used in archaeological record to identify burning conditions (e.g. Gold-berg & Macphail, 2006), primarily yielded important hints for redox conditions during burning. MS decreases from the border of the rampart towards its centre, probably due to a diminished amount of magnetite.
This may be caused by a decline in oxygen fugacity, i.e. the fire was oxidising at its rim and reducing within the centre.
Although reddening of soil and sedi-ments is one of the most common heat-ing features in an archaeological context (e.g. Goldberg & Macphail, 2006; Mentzer, 2012) estimations about the beginning of this process are still open to debate. In our experiment the sample turned dull red-dish at under 600 °C and up to 1000 °C no vitrification is observable. This fits in well with the results of Berna et al. (2007) showing reddening above 500 °C in their experiments. Referring to Gualtieri & Ven-turelli (1999) and Gebhard et al. (2004) (by Mössbauer spectroscopy) transformation from goethite to hematite already takes place around 200–250 °C, whilst Mathieu

31European Geologist 38 | November 2014
Figure 9: MS decreases from the border of the rampart towards its centre probably due to a diminishing amount of magnetite.
temperature (HT) pattern are evidenced in the experimental sample but not in the archaeological counterpart. We therefore assume a slightly lower temperature regime for the archaeological samples. The change in colour from red to grey is the result of processes under reducing conditions. Hem-atite is replaced by magnetite. The reducing atmosphere is also well reflected by mag-netic susceptibility. XRD measurements suggest that a sample heated at 1000 °C evi-dences a transitional state from reddening to vitrification. It still shows reddening but it also contains HT minerals such as mullite, indicating vitrification.
All vitrified archaeological samples match very well in mineralogical composition with the experimental sample heated at 1200 °C. They all include some of the common HT minerals such as mullite, cordiertite, indialite and cristobalite. Additionally they display a glass bulge, indicating incipient melting. This is in good agreement with the results of Gebhard et al. (2004), who observe a first appearance of mullite and cristobalite in the experimental sample at 1100 °C and a distinct increase at 1200 °C accompanied with indialite. Their archaeo-logical analogies also include indialite. The major difference between the two sections lies in the higher amount of vitrified mate-rial in Section 1. One reason could be the varying amount of wood used for the con-struction. Section 1 reveals distinctly more wood beams, causing reducing conditions and high temperatures during the process of charcoal formation, whereas in Section III3
only the inner part was affected by reducing conditions.
According to our experiment, sintering of Bernstorf sediment starts at temperatures above 1000 °C with distinct occurrence at 1200 °C. This can be very well applied to our archaeological samples, which resemble a similar micromorphological and mineral-ogical composition; the results correspond to those of Gebhard et al. (2004). Compa-rable results can be found in the literature: Kresten & Ambrosiani (1992) report partial melting of amphibolite from the Broborg fort (Sweden) at 1130 °C; Baitinger and Kresten (2012) describe melting of basalt from the Glauberg fortification (Germany) at around 1200 °C; and Mathieu and Stoops (1972) report sintering form a Carolingian kiln at 1100 °C.
Melting: micromorphological features, min-eralogical changes and temperature regime
Heating to 1400 °C led to melting. The former structural composition was com-pletely dissolved, only quartz remained. The melt turns isotropic in XPL. Later alterations might lead to the growth of tightly intergrown minerals at the expense of an unstable glass phase, a phenomenon well known from volcanic glasses (e.g. Velde, 1995). Newly-crystallizing phases form dendritic individuals. They contain dendritic magnetite grains overgrown by fayalite, features which are often described within the context of production processes (Goldberg & Macphail, 2006). No archaeo-
logical analogy has been identified from Section 1 so far, coinciding with the study of Gebhard et al. (2004). Only Kresten (1998), using a microprobe, postulates a higher temperature from the Bernstorf rampart of around 1300 °C. As demonstrated before, local inhomogeneities of the 1.6 km long rampart are to be considered.
Conclusion
The Bronze Age fortification of Bernstorf is a good site to study heat affected archaeo-logical remains, because it shows charac-teristic thermal zoning with a reddening of the rim and sintering/partial melting in its centre. Micromorphology proved to be useful in differentiating reddened, sintered and melted materials in an archaeological context. XRD turned out to be a helpful method to determine temperature-sensitive phases (e.g. cordierite, indialite) and to doc-ument burning temperatures: the rim of the rampart was exposed to less than 1000 °C whereas the centre was subject to tempera-tures up to 1200 °C. Without EDS the red-dish matrix could not be detected, because low hematite contents are able to mask the coarse fraction. MS was not very useful for temperature estimations; increasing temperature does not always imply higher MS, but it was able to provide important information in regard to redox conditions.
It emerges from this second extensive study in Bernstorf that it is not only com-plicated to transfer temperature estimations from one archaeological site to another, but also distinct differences in burning condi-tions and temperature regime can occur within one fortification. We assume that in this case variation in construction details, in particular the amount of wood, was essen-tial to the processes of burning and collapse.
Acknowledgements
The research project Bernstorf of the Goethe University was founded by the DFG and by the “Fokus“ program of Goethe University, Frankfurt. We are grateful to R. Petschick, R. Krause and V. Bähr (Goethe University), H. de Wall and S. Schobel (Uni-versity Erlangen), as well as to K. Reeves and R. Macphail (UCL) for their support in analytics and discussion. We would also like to thank Holger Baitinger for the help-ful review.
Topical - Geoarchaeology
32
References
Bähr, V., Krause, R., Gebhard, R. 2012. Neue Forschungen zu den Befestigungen auf dem Bernstorfer Berg bei Kranzberg, Landkreis Freising, Oberbayern(New results from the rampart of the Bernstorf Berg of Kranzberg, county Freising, Bavaria). Bayerische Vorgeschichtliche Blätter, 77. 5-41.
Baitinger, H. & Kresten, P. 2012. Geoarchäologie zweier hessischer „Schlackenwälle“ Glauberg und Altkönig (Geoarchaeology of two Hessian „vitrified ramparts“ of Glauberg and Altkönig. Archäologisches Korrespondenzblatt, 42. 493-507.
Berna. F., Behar. A., Shahack-Gross, R., Berg, J., Boaretto, E., Gilboa, A., Sharon, I., Shalev, S., Shilstein, S., Yahalom-Mack, N., Zorn, J.R. & Weiner, S. 2007. Sediments exposed to high temperatures: reconstructing pyrotechnological processes in Late Bronze and Iron Age Strata at Tel Dor (Israel). Journal of Archaeological Science, 34. 358-373. DOI: 10.1016/j.jas.2006.05.011
Childe, V.G.W. & Thorneycroft, W. 1937/38. The experimental Production of the Phenomena distinctive of Vitrified Forts. Proceed-ings Society of Antiquaries of Scotland, 72. 44–55.
Gebhard, R., Häusler, W., Moosauer, M. & Wagner, U. 2004. Remnants of a Bronze Age Rampart in Upper Bavaria: A Mössbauer Study. Hyperfine Interactions, 154. 181–197.
Goldberg, P. & Macphail, R. I. 2006. Practical and Theoretical Geoarchaeology. Malden, Blackwell.
Gualtieri, A.F. & Venturelli, P. 1999. In situ study of the goethite-hematite phase transformation by real time synchrotronpowder diffraction. American Mineralogist, 84. 895-904.
Kresten, P. 1996. Hill-forts with vitrified or calcined ramparts: Index and reference list. Research report R02-1996, Geoarchaeo-logical Laboratory, UV-Uppsala.
Kresten, P. 1998. Analyse des Schlackenramparts von Bernstorf, Bayern (GER015) – Projekt “Vitrified Hill-Forts”. Zentralamt für Denkmalschutz, Abteilung für Archäologische Untersuchungen UV-Uppsala (Sweden).
Kresten, P. & Ambrosiani, B. 1992. Swedish vitrified forts – a reconnaissance study. Fronwännen, 87. 1-18.
MacKenzie, W.S., Donaldson, C.H. & Gilford, C. 1982. Atlas of Igneous Rocks and their Textures. New York, Longman.
Mathieu, C. & Stoops, G. 1972. Observations pétrographiques sur la paroi d’un four à chaux carolingien creuse en sol limoneux. Extrait d’archéologie médiévale, II. 347-354.
Mentzer, S. M. 2014. Microarchaeological Approaches to the Identification and Interpretation of Combustion Features in Pre-historic Archaeological Sites. Journal of Archaeological Method and Theory, 21(3). 616-668. DOI 10.1007/s10816-012-9163-2
Muchez, P., Viaene, W. & Dusar, M. 1992. Diagenetic control on secondary porosity in flood plain deposits: an example of the Lower Triassic of northeastern Belgium. Sedimentary Geology, 78, 285-298.
Pennant, T. 1771. A Tour in Scotland. 1769. Chester, John Monk.
Stoops, G., 2003. Guidelines for Analysis and Description of Soil and Regolith Thin Sections, Madison, WI, Soil Science Society of America.
Tröger, W.E.; 1982. Optische Bestimmung der gesteinsbildenden Minerale; Teil 1 (Bestimmungstabellen) (Optical determination of petrogenetic minerals, Part 1 (Tables of determination)), 5th ed. Whitten, D.G.A., Brooks, J.R.V. (Eds.), The Penguin Dictionary of Geology. Harmondsworth, Penguin.
Unger, H.-J., 2001. Grabung Bernstorf – Topographie and Geologie. Documenta naturae, 134. 1-10.
Velde, B. 1995. Origin and Mineralogy of Clays: Clays and the environment. New York, Springer.
Youngblood, E., Frederiksson, B.J., Kraut, F. & Frederiksson, K. 1978. Celtic vitrified forts: Implications of a chemical-petrological study of glasses and source rocks. Journal of Archaeological Science, 5. 99-121.