Soil organic carbon stocks in southeast Germany (Bavaria) as affected by land use, soil type and...
13
Soil organic carbon stocks in southeast Germany (Bavaria) as affected by land use, soil type and sampling depth MARTIN WIESMEIER*, PETER SPO ¨ RLEIN † , UWE GEUß † , EDZARD HANGEN † , STEPHAN HAUG ‡ , ARTHUR REISCHL † , BERND SCHILLING † , MARGIT VON LU ¨ TZOW* andINGRID KO ¨ GEL-KNABNER* § *Chair of Soil Science, Department of Ecology and Ecosystem Management, Technische Universita ¨t Mu ¨ nchen, D-85350, Freising- Weihenstephan, Germany, †Bayerisches Landesamt fu ¨ r Umwelt (LfU), D-95030, Hof, Germany, ‡TUM|Stat, Zentrum Mathematik, Technische Universita ¨t Mu ¨ nchen, D-85748, Garching, Germany, §Institute for Advanced Study, Technische Universita ¨t Mu ¨ nchen, Lichtenbergstr. 2a, D-85748, Garching, Germany Abstract Precise estimations of soil organic carbon (SOC) stocks are of decided importance for the detection of C sequestration or emission potential induced by land use changes. For Germany, a comprehensive, land use–specific SOC data set has not yet been compiled. We evaluated a unique data set of 1460 soil profiles in southeast Germany in order to cal- culate representative SOC stocks to a depth of 1 m for the main land use types. The results showed that grassland soils stored the highest amount of SOC, with a median value of 11.8 kg m 2 , whereas considerably lower stocks of 9.8 and 9.0 kg m 2 were found for forest and cropland soils, respectively. However, the differences between exten- sively used land (grassland, forest) and cropland were much lower compared with results from other studies in cen- tral European countries. The depth distribution of SOC showed that despite low SOC concentrations in A horizons of cropland soils, their stocks were not considerably lower compared with other land uses. This was due to a deepening of the topsoil compared with grassland soils. Higher grassland SOC stocks were caused by an accumulation of SOC in the B horizon which was attributable to a high proportion of C-rich Gleysols within grassland soils. This demon- strates the relevance of pedogenetic SOC inventories instead of solely land use–based approaches. Our study indi- cated that cultivation-induced SOC depletion was probably often overestimated since most studies use fixed depth increments. Moreover, the application of modelled parameters in SOC inventories is questioned because a calculation of SOC stocks using different pedotransfer functions revealed considerably biased results. We recommend SOC stocks be determined by horizon for the entire soil profile in order to estimate the impact of land use changes precisely and to evaluate C sequestration potentials more accurately. Keywords: carbon sequestration, land use change, pedotransfer function, soil organic matter, topsoil deepening Received 22 February 2012; revised version received 22 February 2012 and accepted 16 March 2012 Introduction Soil organic matter is not only the key component for sustainable soil fertility and productivity but has become increasingly important as the largest terrestrial C pool in view of climate change. Accurate estimation of soil organic carbon (SOC) stocks is thus essential for the cal- culation of future climate scenarios and to detect the potential for C sequestration or emission. In this context, land use changes are of vital importance as a conversion of natural or extensively used areas (e.g. grassland, for- est) to intensively used croplands (e.g. for production of food and energy crops) is reported to be followed by a strong decline of SOC and vice versa (Guo & Gifford, 2002; Murty et al., 2002; Houghton & Goodale, 2004; Eglin et al., 2010; Poeplau et al., 2011). The importance of a precise estimation of SOC stocks is recognized by most countries and several institutions: for instance, the European Union (Stolbovoy et al., 2007) and the Intergov- ernmental Panel on Climate Change (IPCC, 2000, 2003). However, most attempts to calculate SOC stocks have failed to include the entire soil profile. Although the amount of SOC stored in subsoils (below the top 30 cm) exceeds 50% in most ecosystems (Batjes, 1996; Jobbagy & Jackson, 2000; Harrison et al., 2011; Rumpel & Ko ¨ gel-Knabner, 2011), the majority of SOC studies and inventories only incorporate the first 30 cm of the soils (e.g. IPCC, 2003; Janssens et al., 2005; Jones et al., 2005; Smith et al., 2005; Stolbovoy et al., 2007). From another point of view, subsoil SOC stocks become addi- tionally important because they primarily constitute the Correspondence: Martin Wiesmeier, tel. + 49 0 8161 71 3679, fax + 49 0 8161 71 4466, e-mail: [email protected] © 2012 Blackwell Publishing Ltd 1 Global Change Biology (2012), doi: 10.1111/j.1365-2486.2012.02699.x
Transcript of Soil organic carbon stocks in southeast Germany (Bavaria) as affected by land use, soil type and...
Soil organic carbon stocks in southeast Germany(Bavaria) as affected by land use, soil type and samplingdepthMART IN WIE SME I ER * , P ETER SP ORLE IN † , UWE GEUß † , EDZARD HANGEN † ,
S T EPHAN HAUG ‡ , ARTHUR RE I SCHL † , B ERND SCH ILL ING † , MARG IT V ON L U TZOW*
and INGRID KOGEL-KNABNER*§
*Chair of Soil Science, Department of Ecology and Ecosystem Management, Technische Universitat Munchen, D-85350, Freising-
Weihenstephan, Germany, †Bayerisches Landesamt fur Umwelt (LfU), D-95030, Hof, Germany, ‡TUM|Stat, Zentrum
Mathematik, Technische Universitat Munchen, D-85748, Garching, Germany, §Institute for Advanced Study, Technische
Universitat Munchen, Lichtenbergstr. 2a, D-85748, Garching, Germany
Abstract
Precise estimations of soil organic carbon (SOC) stocks are of decided importance for the detection of C sequestration
or emission potential induced by land use changes. For Germany, a comprehensive, land use–specific SOC data set
has not yet been compiled. We evaluated a unique data set of 1460 soil profiles in southeast Germany in order to cal-
culate representative SOC stocks to a depth of 1 m for the main land use types. The results showed that grassland
soils stored the highest amount of SOC, with a median value of 11.8 kg m�2, whereas considerably lower stocks of
9.8 and 9.0 kg m�2 were found for forest and cropland soils, respectively. However, the differences between exten-
sively used land (grassland, forest) and cropland were much lower compared with results from other studies in cen-
tral European countries. The depth distribution of SOC showed that despite low SOC concentrations in A horizons of
cropland soils, their stocks were not considerably lower compared with other land uses. This was due to a deepening
of the topsoil compared with grassland soils. Higher grassland SOC stocks were caused by an accumulation of SOC
in the B horizon which was attributable to a high proportion of C-rich Gleysols within grassland soils. This demon-
strates the relevance of pedogenetic SOC inventories instead of solely land use–based approaches. Our study indi-
cated that cultivation-induced SOC depletion was probably often overestimated since most studies use fixed depth
increments. Moreover, the application of modelled parameters in SOC inventories is questioned because a calculation
of SOC stocks using different pedotransfer functions revealed considerably biased results. We recommend SOC
stocks be determined by horizon for the entire soil profile in order to estimate the impact of land use changes
precisely and to evaluate C sequestration potentials more accurately.
Keywords: carbon sequestration, land use change, pedotransfer function, soil organic matter, topsoil deepening
Received 22 February 2012; revised version received 22 February 2012 and accepted 16 March 2012
Introduction
Soil organic matter is not only the key component for
sustainable soil fertility and productivity but has become
increasingly important as the largest terrestrial C pool in
view of climate change. Accurate estimation of soil
organic carbon (SOC) stocks is thus essential for the cal-
culation of future climate scenarios and to detect the
potential for C sequestration or emission. In this context,
land use changes are of vital importance as a conversion
of natural or extensively used areas (e.g. grassland, for-
est) to intensively used croplands (e.g. for production of
food and energy crops) is reported to be followed by a
strong decline of SOC and vice versa (Guo & Gifford,
2002; Murty et al., 2002; Houghton & Goodale, 2004;
Eglin et al., 2010; Poeplau et al., 2011). The importance of
a precise estimation of SOC stocks is recognized by most
countries and several institutions: for instance, the
European Union (Stolbovoy et al., 2007) and the Intergov-
ernmental Panel on Climate Change (IPCC, 2000, 2003).
However, most attempts to calculate SOC stocks have
failed to include the entire soil profile. Although the
amount of SOC stored in subsoils (below the top
30 cm) exceeds 50% in most ecosystems (Batjes, 1996;
Jobbagy & Jackson, 2000; Harrison et al., 2011; Rumpel
& Kogel-Knabner, 2011), the majority of SOC studies
and inventories only incorporate the first 30 cm of the
soils (e.g. IPCC, 2003; Janssens et al., 2005; Jones et al.,
2005; Smith et al., 2005; Stolbovoy et al., 2007). From
another point of view, subsoil SOC stocks become addi-
tionally important because they primarily constitute theCorrespondence: Martin Wiesmeier, tel. + 49 0 8161 71 3679,
fax + 49 0 8161 71 4466, e-mail: [email protected]
© 2012 Blackwell Publishing Ltd 1
Global Change Biology (2012), doi: 10.1111/j.1365-2486.2012.02699.x
intermediate and passive soil organic matter pool (von
Lutzow et al., 2008). Under global warming, the tem-
perature dependence of these pools will be decisive for
SOC stock changes (von Lutzow & Kogel-Knabner,
2009). Hence, an accurate estimate of the size of these
pools under different land uses is required.
A further shortcoming of many SOC inventories is
that soil parameters, which are necessary to calculate
SOC stocks (SOC concentration, bulk density, stone
content), are often estimated (using pedotransfer func-
tions and regression analyses) and not measured
because large-scale soil inventories are time-consuming
and hence are conducted with soil augers instead of by
sampling soil profiles. Due to the high variability of
these parameters, direct measurements are essential for
unbiased SOC estimations (Schrumpf et al., 2011).
For Germany, only regional SOC inventories with a
limited amount and quality of data have been available
until now. In their review of the status quo of organic car-
bon in soils of Germany, Prechtel et al. (2009) also point to
a lack of SOCdata, particularly for agricultural soils. They
further suggest incorporating subsoil SOC stocks in
future soil inventories. The accuracy of available studies
is limited because only mean values for important soil
parameters were used (Neufeldt, 2005) or soil samples
were taken within constant depth increments (Baritz &
Strich, 2000) instead of sampling soil horizons that may
lead to inaccurate results if only few depth increments
with high thicknesses are used (Gruneberg et al., 2010).
Due to these reasons, precise, land use–specific estima-
tions of total SOC stocks are missing for Germany as well
as formany other European countries.
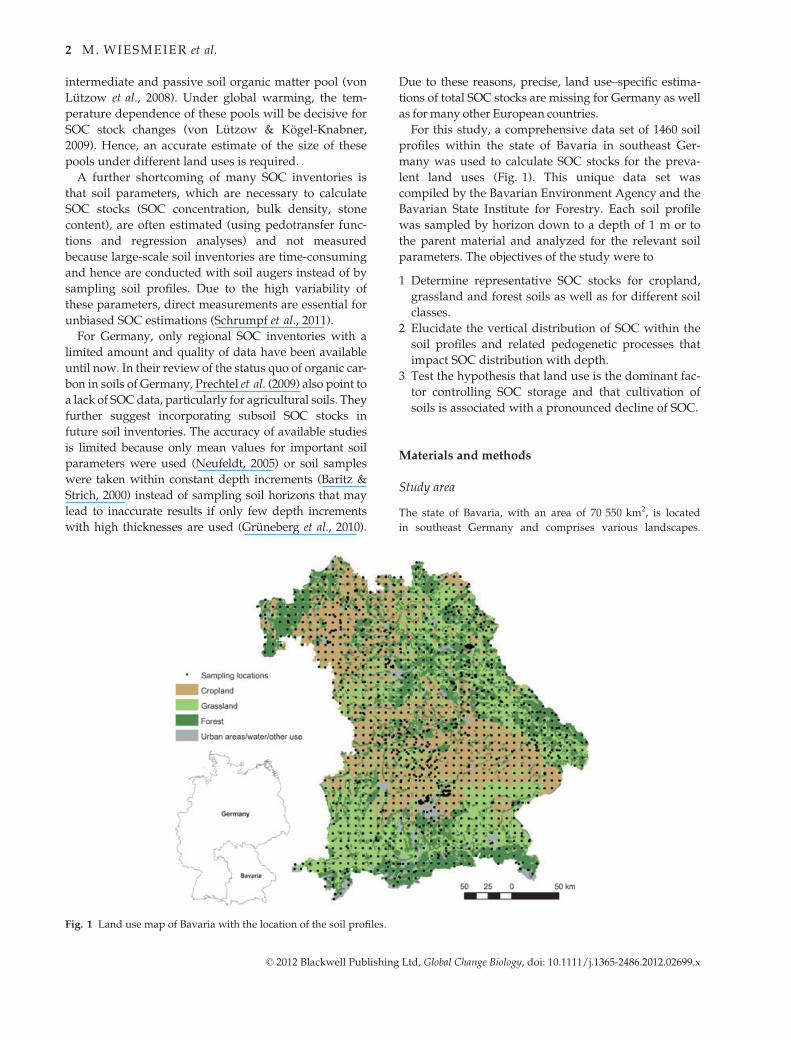
For this study, a comprehensive data set of 1460 soil
profiles within the state of Bavaria in southeast Ger-
many was used to calculate SOC stocks for the preva-
lent land uses (Fig. 1). This unique data set was
compiled by the Bavarian Environment Agency and the
Bavarian State Institute for Forestry. Each soil profile
was sampled by horizon down to a depth of 1 m or to
the parent material and analyzed for the relevant soil
parameters. The objectives of the study were to
1 Determine representative SOC stocks for cropland,
grassland and forest soils as well as for different soil
classes.
2 Elucidate the vertical distribution of SOC within the
soil profiles and related pedogenetic processes that
impact SOC distribution with depth.
3 Test the hypothesis that land use is the dominant fac-
tor controlling SOC storage and that cultivation of
soils is associated with a pronounced decline of SOC.
Materials and methods
Study area
The state of Bavaria, with an area of 70 550 km2, is located
in southeast Germany and comprises various landscapes.
Fig. 1 Land use map of Bavaria with the location of the soil profiles.
© 2012 Blackwell Publishing Ltd, Global Change Biology, doi: 10.1111/j.1365-2486.2012.02699.x
2 M. WIESMEIER et al.
The northwestern part of Bavaria is dominated by the south-
ern German escarpment landscape that adjoins low mountain
ranges of the Bohemian Massif in the east. Southwards the
Molasse basin ascends to the mountain range of the Alps at
the southern border of Bavaria. Elevation ranges between 107
and 2962 m above sea level. Due to its location in central
Europe, Bavaria exhibits a suboceanic climate that is charac-
terized by a transitional situation between a maritime climate
in the northwest and subcontinental influences in the east.
Mean annual temperature and precipitation from the escarp-
ment landscape in the northwest to the Alps in the south
range between 9° and 4° C and 550 and 2500 mm, respec-
tively. Dominant soil classes are soils with well-developed B
horizons (Cambisols) at 45% of the total area, soils with initial
soil formation (Leptosols, Regosols) with 14% and soils with
water stagnation (Stagnosols, Albeluvisols, Planosols) with
13% according to the German soil systematic (AD-HOC AG
Boden, 2005) and the equivalent Reference Soil Groups of the
WRB system (IUSS Working Group WRB, 2006). Cropland
accounts for 34% of the total land area of Bavaria, grassland
for 16%, forest for 35% and other uses for 15% (Fig. 1).
Selection of SOC data
Available data from different soil surveys and permanent soil
observation sites in Bavaria overseen by the Bavarian Environ-
ment Agency (LfU) and the Bavarian State Institute for
Forestry (LWF) were screened in order to compile a represen-
tative SOC data set. Sampling locations were incorporated
only where soil profiles were sampled by horizon down to the
parent material or to least 1 m depth and then analyzed for
SOC, bulk density (BD) and stone content (SC). The minimum
requirement for SOC analysis was a determination by dry
combustion using a CN elemental analyzer. Generally, only
soil data collected after 1990 were included in order to reduce
temporal SOC changes.
The selected sampling locations that fulfilled all require-
ments comprised a data set of 1460 soil profiles (Fig. 1). The
main land uses were adequately represented, with 384 locations
(26% of the data) as cropland (34% of the total area), 333 loca-
tions (23%) as grassland (16%) and 596 locations (41%) as forest
(35%). The remaining locations were composed of 68 and 79
sites (10%) for bogs and other land uses (15%), respectively.
The main part of the data constituted a grid sampling with
1077 sites (Joneck et al., 2006). Between 2000 and 2004, soil
profiles were sampled using grids of 8 9 8 km within
Bavaria. For each soil profile a representative location was
selected within a radius of 1500 m around the grid node to
achieve a homogeneous sampling area in terms of vegetation,
relief, soil type and parent material and a central position in
the particular land use type. Anthropogenic disturbances in
the subsoil were excluded in a pre-exploratory survey using a
soil auger. For top- and subsoil horizons down to a depth of
about 35 cm, soil material was collected as a composite sam-
ple from eight sub-locations around the main soil profile in
order to cover the small-scale heterogeneity of the soils.
Samples below 35 cm were taken from the main soil profile.
The remaining 383 soil profiles were from permanent soil
monitoring sites (Schubert, 2002) and other regional soil
surveys. With regard to the total area of Bavaria, a sampling
density of one location per 48 km2 was obtained. The main
land uses cropland, grassland and forest had sampling densi-
ties of one location per 63, 34 and 41 km2, respectively.
Determination of SOC stocks and other soil properties
For the calculation of SOC stocks, BD of soil horizons was
quantified in all soil surveys from the mass of the oven-dry
soil (105° C) divided by the volume of the soil cores (Hartge &
Horn, 1989). For 1.8% of organic and subsoil horizons, BD
could not be analyzed directly due to high amounts of stones
in C horizons or low thickness of O horizons. In these cases,
BD was estimated based on BD values from adjacent sites with
similar land use, soil type and parent material. Stone contents
were estimated visually in the soil profiles according to
(AD-HOC AG Boden, 2005). All SOC concentrations were
determined by dry combustion with a CN elemental analyzer.
Samples that contained CaCO3 were heated to 500° C for 4 h
to remove organic carbon, and the concentration of inorganic
C of the residual material was determined by dry combustion.
The SOC content was calculated by subtracting inorganic
C from the total C concentration of the untreated material.
SOC stocks for each soil profile were calculated using the
following equation:
SOChz ¼ Rhzz SOCi � BDi � hi � 1� SCi
100
� �; ð1Þ
where SOC_{h_{z} is the total SOC stock (kg m�2) of all soil
horizons hz SOCi is the SOC concentration (mg g�1) of the fine
earth of horizon i,BDi is the BD (g cm�3) of the fine earth of
horizon i, hi is the thickness (cm) of horizon i and SCi is the volu-
metric fraction of rock fragments > 2 mm (%) of horizon i.
In order to evaluate the accuracy of SOC stock estimations
using pedotransfer functions (PTFs), SOC stocks were addi-
tionally calculated with estimated values for BD. Bulk density
was calculated as a function of organic matter (OM) content
and soil texture according to the PTF of Rawls (1983):
PTFBDRawls ¼ 100
OMBDOM
� �þ 100�OM
BDMM
� � ; ð2Þ
where OM is the content of organic matter (%; SOC con-
tent 9 1.72), BDOM is the BD of the OM (0.244 g cm�3) and
BDMM is the BD of the mineral matter (g cm�3). BDMM was
determined for different soil texture classes according to
Rawls (1983). Alternatively, BD was calculated with Eqn (2)
by estimating BDMM as a function of sand content and depth
as proposed by Tranter et al. (2007) (PTFBD Tranter):
BDMM ¼ 1:35þ 0:0045� Sþ 6� 10�5ð44:7� SÞ2 þ 0:06� logðDÞ; ð3Þ
where S is the sand content (%) and D is the depth (cm) of the
soil horizon. Furthermore, a PTF solely based on OM from
Adams (1973) that was modified by De Vos et al. (2005) was
used to calculate BD (PTFBD DE Vos). This PTF is identical to
the approach of Rawls (1983) (Eqn 2) but instead of a texture-
dependent BDMM a constant BD of 1.661 g cm�3 was used
and a different value for BDOM (0.312 g cm�3) was applied.
© 2012 Blackwell Publishing Ltd, Global Change Biology, doi: 10.1111/j.1365-2486.2012.02699.x
SOC STOCKS IN SOUTHEAST GERMANY 3

For all PTF-based SOC stock calculations, the BDPTF of organic
horizons corresponds to the respective BDOM (0.244 g cm�3 or
0.312 g cm�3). SOC stocks were then calculated according to
Eqn (1) using the different values for BDPTF and additionally
without consideration of SC. For an evaluation of the accuracy
of these PTF-based approaches, estimated SOC stocks were
compared to calculated stocks, and mean errors (MEs) as well
as root mean squared errors (RMSEs) were calculated.
Soil texture was determined by wet sieving and sedimenta-
tion according to the method of Kohn (Gee & Bauder, 1986).
Soil pH values were measured in 0.01 M CaCl2 at a soil/solu-
tion ratio of 1 : 2.5 at room temperature. In order to compare
soil horizon–specific properties and to gain insight the distribu-
tion of SOC stocks with depth, soil data from single soil hori-
zons were averaged (BD, SC, SOC concentration, soil texture,
pH) or added (SOC stock, thickness of soil horizon) to master
horizons (O, H = organic horizons; A = topsoil mineral
horizon; B = subsoil mineral horizon; C = parent material).
Statistical analysis
Descriptive statistics were applied to describe the SOC data
set and included mean, minimum/maximum values, median,
interquartile range, extremes and outliers, variance, skewness
and kurtosis. The main aim of the statistical analysis was to
investigate the influence of land use on soil properties. This
was done in the framework of a linear model, where the type
of land use is used as a categorical covariate affecting the
mean level of our data. Due to the spatial dependence in our
data, the model cannot be estimated by ordinary least squares,
as e.g. explained in Lark & Cullis (2004). Therefore we need to
explicitly model the continuous spatial variation by assuming
a basic structure for our variable of interest, denoted by
fSðxÞ : x 2 A � R2g in the following. It is assumed that
fSðxÞ : x 2 A � R2g is a random spatial process over the study
area A (Bavaria). Since it is unrealistic to obtain direct mea-
surements from the signal S, we assume that our measure-
ments, denoted by yi in the following, are realizations from
the model.
Yi ¼ SðxiÞ þ Zi; i ¼ 1; . . .; n; ð4ÞWith Zi being independent and identically distributed N(0, τ2)random variables. The measured response values yik are cate-
gorized into 5 different groups due to land use at location xik,
k = 1, ···, 5, i = 1, ···, nk. The locations are selected in a non ran-
dom way to build a lattice covering the observation region A.
The spatial process S is assumed to be a stationary Gaussian
process with
EðSðxÞÞ ¼ lðxÞ; ð5Þ
VarðSðxÞÞ ¼ r2; ð6Þ
CorrðSðxÞ; SðxÞÞ ¼ qðuÞ;wherejjx� xjj ¼ u; ð7ÞIn our application the Matern correlation function
qðu;/; kÞ ¼ ð2k�1CðkÞÞ�1ðu=/ÞkKkðu=/Þ; ð8Þwhere Г(·) is the usual Gamma function and Kk(·) is a modi-
fied Bessel function of order k = 1.5 showed the best fit to our
data. The spatially varying mean l(xik) of S(xik) is given by the
equation
lðxikÞ ¼ lþ ak0 ; ð9Þwhere l is an overall mean and ak is the effect due to land use
k. Further it is assumed that the conditional distribution of Y
(xik) given S is Gaussian with mean S(xik) and variance τ2
Hence the Yik, k = 1, ···, 5, i = 1, ···, nk are mutually indepen-
dent, conditionally on S. Unfortunately our data does not
fulfill the assumption of having a Gaussian distribution,
conditionally on S. Therefore the Box-Cox transformation Hk
YðkÞðxikÞ :¼ HkðYðxikÞÞ ¼ YkðxikÞ � 1Þk
; ð10Þ
With k = �0.083 is applied to the data to stabilize the variance.
The Gaussian model then is assumed to hold for the trans-
formed observations. For more details on the Gaussian model
for geostatistical data we refer to Diggle & Riberio (2007). All
calculations were performed using R, which is a free software
environment for statistical computing (R Development Core
Team, 2011). The Gaussian linear model was fitted to the data
by restricted maximum likelihood estimation as e.g. explained
in Diggle & Riberio (2007), Chapter 5.4. In R this was done by
using routines from the contributed R package geoR (Riberio
& Diggle, 2001). The residual analysis showed a satisfactory fit
to the data. In a second step all pairwise comparisons for the
different levels of land use were computed. The null hypothe-
ses of no difference between two levels of land use, were
tested using a Wald statistic as e.g. explained in Lark & Cullis
(2004). The p-values were adjusted for multiple comparisons
by a simple Bonferroni correction.
Results
Basic soil characteristic of land use types
In order to characterize the selected soil profiles of the
main land use types, basic soil properties (soil texture,
pH, soil thickness) were calculated (Table 1). No signif-
icant differences were found for the total thickness of
the soil profiles between the different land use types
with depths from 84 to 96 cm. For cropland, grassland
and other land uses soil texture was comparable along
all horizons with proportions of 31–42% for sand, 30–46% for silt and 23–29% for clay. Sand contents
increased slightly with soil depth, whereas silt contents
decreased accordingly. Forest sites show slightly higher
sand contents of 42–47% and lower proportions of clay
(15–21%). Soil pH values ranged from 6.0 to 6.8 for
cropland and other land uses, whereas considerably
lower values of 3.7–5.8 were detected in organic as well
as top- and subsoil mineral horizons for grassland and
forest soils.
All investigated soil profiles were classified into soil
classes according to the AD-HOC AG Boden (2005);
Table 2). In general, soils with well-developed B hori-
zons (Cambisols) were the most abundant soil class
© 2012 Blackwell Publishing Ltd, Global Change Biology, doi: 10.1111/j.1365-2486.2012.02699.x
4 M. WIESMEIER et al.

within cropland, grassland and forest sites with pro-
portions of 37–55%. At sites with other land uses,
soils with initial soil formation (Leptosols, Regosols)
and Cambisols dominated, and natural bogs and fens
(Histosols) and groundwater soils (Gleysols) were the
most abundant soil classes for bog areas. Despite the
dominance of Cambisols, Gleysols played an impor-
tant role at grassland sites, accounting for 19% of all
investigated soil profiles. For cropland and forest,
soils with initial soil formation (Leptosols, Regosols)
and soils with water stagnation (Stagnosols, Albeluvi-
sols, Planosols) had considerable proportions of 20%
and 17%, respectively.
Calculated and estimated SOC stocks for different landuses
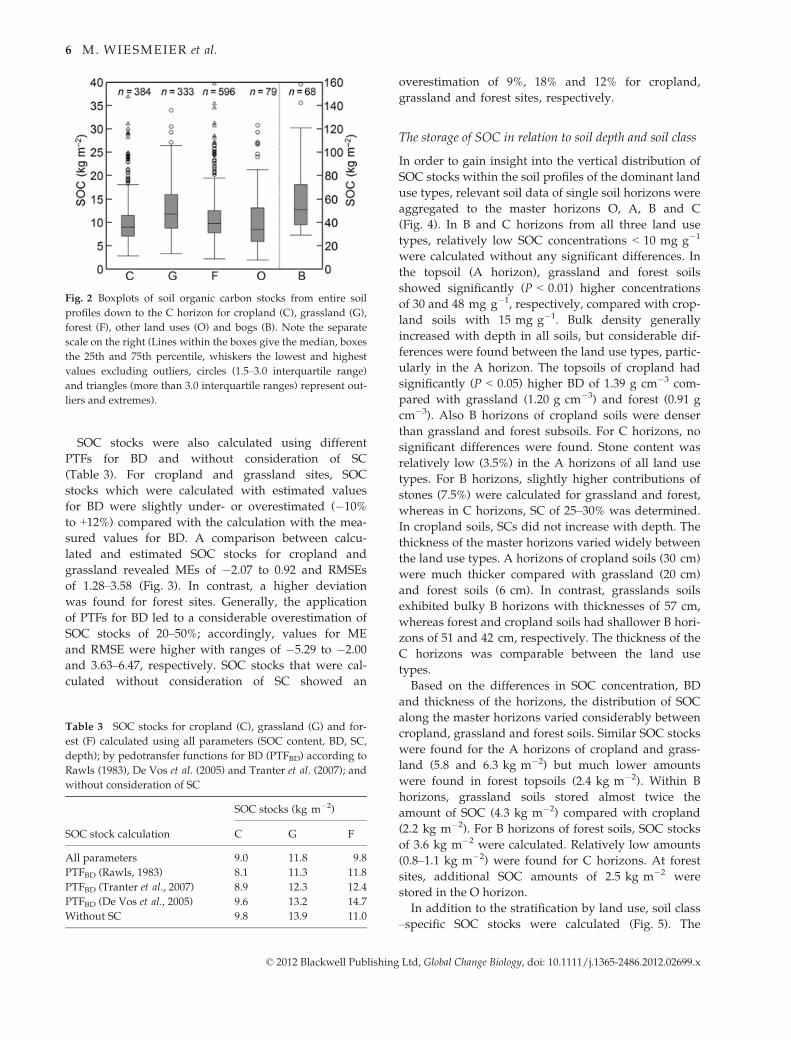
Soil organic carbon stocks down to the parent material
for different land uses are shown in Fig. 2. Grassland
soils showed significantly (P < 0.01) higher SOC stocks
of 11.8 kg m�2 compared with forest and cropland
soils. For forest soils, slightly but significantly
(P < 0.05) higher SOC stocks of 9.8 kg m�2 were deter-
mined compared to cropland soils with 9.0 kg m�2.
The highest amounts of SOC were found for bogs with
51.1 kg m�2 and for other uses SOC stocks of
8.5 kg m�2 were determined.
Table 1 Basic properties (soil texture, pH, soil thickness) of soils under different land use (mean values with standard deviation)
Land use n Horizon Sand (%) Silt (%) Clay (%) pH (CaCl2) Depth (cm)
Cropland (C) 384 A 30.7 ± 23.0 46.0 ± 18.4 23.3 ± 11.4 6.3 ± 0.8 93 ± 22
B 31.4 ± 25.4 39.9 ± 17.2 28.7 ± 15.5 6.2 ± 0.9
C 32.3 ± 28.6 43.2 ± 24.4 24.6 ± 16.5 6.7 ± 1.1
Grassland (G) 333 A 34.6 ± 20.1 40.2 ± 13.3 25.1 ± 13.0 5.7 ± 0.9 94 ± 19
B 34.9 ± 22.2 37.5 ± 13.9 27.7 ± 16.2 5.8 ± 1.0
C 41.2 ± 28.5 30.2 ± 15.0 28.6 ± 18.8 6.6 ± 1.2
Forest (F) 596 O – – – 3.7 ± 0.9 93 ± 25
A 43.0 ± 22.7 41.8 ± 18.2 15.2 ± 8.5 3.8 ± 1.1
B 41.8 ± 22.2 36.9 ± 14.7 21.4 ± 12.5 4.4 ± 0.9
C 46.8 ± 26.1 32.0 ± 14.6 21.4 ± 17.7 5.6 ± 1.6
Other uses (O) 79 A 33.1 ± 25.9 41.0 ± 17.1 26.2 ± 16.5 6.2 ± 1.1 84 ± 27
B 37.9 ± 28.2 34.4 ± 15.6 27.9 ± 17.9 6.0 ± 1.1
C 41.8 ± 25.6 34.6 ± 16.2 23.9 ± 15.0 6.8 ± 1.1
Bog (B) 68 H – – – 5.5 ± 1.7 96 ± 20
A 14.3 ± 2.8 51.5 ± 9.3 34.1 ± 10.9 6.5 ± 1.2
B 39.9 ± 26.5 40.3 ± 19.6 19.7 ± 18.9 6.8 ± 1.3
C – – – 7.5 ± 0.1
Table 2 Number and relative percentage of soil classes under different land uses according to the German soil systematic
(AD-HOC AG Boden, 2005) and the equivalent Reference Soil Groups of the WRB (IUSS Working Group WRB, 2006): C = soils
from limestone weathering residues (Cambisols, Luvisols); S = soils with water stagnation (Stagnosols, Albeluvisols, Planosols);
L = soils with clay migration (Luvisols); B = soils with well-developed B horizons (Cambisols); D = clay-rich soils (Vertisols, Vertic
Cambisols); P = Podzols; R = soils with initial soil formation (Leptosols, Regosols); Y = anthropogenic soils (Anthrosols, Cambi-
sols); A = alluvial soils (Fluvisols, Gleysols and Reference Soil Groups in combination with Gleyic qualifier); G = groundwater soils
(Gleysols); H = natural bogs and fens (Histosols)
Land use C S L B D P R Y A G H Total
Cropland (n) 5 39 26 171 15 1 76 20 21 10 – 384
(%) 1.3 10.2 6.8 44.5 3.9 0.3 19.8 5.2 5.5 2.6 – 100
Grassland (n) 3 35 2 122 13 – 47 12 35 64 – 333
(%) 0.9 10.5 0.6 36.6 3.9 – 14.1 3.6 10.5 19.2 – 100
Forest (n) 9 103 30 329 9 38 51 – 13 14 – 596
(%) 1.5 17.3 5.0 55.2 1.5 6.4 8.6 – 2.2 2.3 – 100
Other uses (n) 1 5 – 29 2 – 30 3 2 7 – 79
(%) 1.3 6.3 – 36.7 2.5 – 38.0 3.8 2.5 8.9 – 100
Bog (n) – 1 – – – – 3 – 1 28 35 68
(%) – 1.5 – – – – 4.4 – 1.5 41.2 51.5 100
© 2012 Blackwell Publishing Ltd, Global Change Biology, doi: 10.1111/j.1365-2486.2012.02699.x
SOC STOCKS IN SOUTHEAST GERMANY 5
SOC stocks were also calculated using different
PTFs for BD and without consideration of SC
(Table 3). For cropland and grassland sites, SOC
stocks which were calculated with estimated values
for BD were slightly under- or overestimated (�10%
to +12%) compared with the calculation with the mea-
sured values for BD. A comparison between calcu-
lated and estimated SOC stocks for cropland and
grassland revealed MEs of �2.07 to 0.92 and RMSEs
of 1.28–3.58 (Fig. 3). In contrast, a higher deviation
was found for forest sites. Generally, the application
of PTFs for BD led to a considerable overestimation of
SOC stocks of 20–50%; accordingly, values for ME
and RMSE were higher with ranges of �5.29 to �2.00
and 3.63–6.47, respectively. SOC stocks that were cal-
culated without consideration of SC showed an
overestimation of 9%, 18% and 12% for cropland,
grassland and forest sites, respectively.
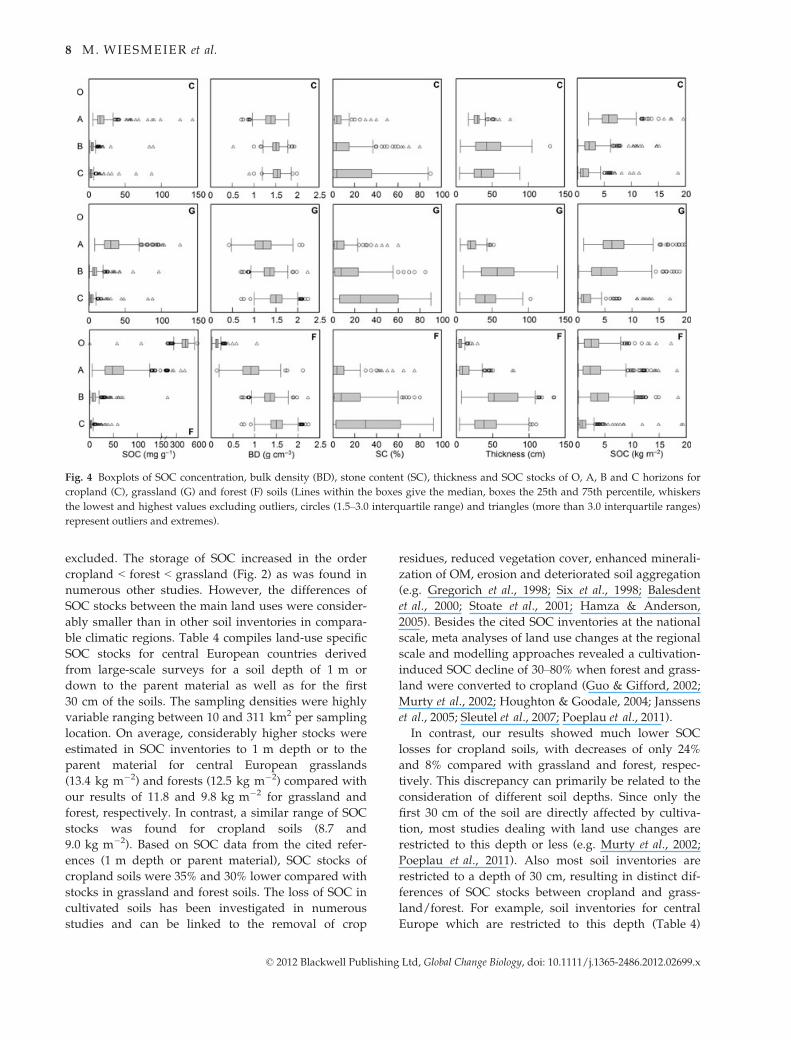
The storage of SOC in relation to soil depth and soil class
In order to gain insight into the vertical distribution of
SOC stocks within the soil profiles of the dominant land
use types, relevant soil data of single soil horizons were
aggregated to the master horizons O, A, B and C
(Fig. 4). In B and C horizons from all three land use
types, relatively low SOC concentrations < 10 mg g�1
were calculated without any significant differences. In
the topsoil (A horizon), grassland and forest soils
showed significantly (P < 0.01) higher concentrations
of 30 and 48 mg g�1, respectively, compared with crop-
land soils with 15 mg g�1. Bulk density generally
increased with depth in all soils, but considerable dif-
ferences were found between the land use types, partic-
ularly in the A horizon. The topsoils of cropland had
significantly (P < 0.05) higher BD of 1.39 g cm�3 com-
pared with grassland (1.20 g cm�3) and forest (0.91 g
cm�3). Also B horizons of cropland soils were denser
than grassland and forest subsoils. For C horizons, no
significant differences were found. Stone content was
relatively low (3.5%) in the A horizons of all land use
types. For B horizons, slightly higher contributions of
stones (7.5%) were calculated for grassland and forest,
whereas in C horizons, SC of 25–30% was determined.
In cropland soils, SCs did not increase with depth. The
thickness of the master horizons varied widely between
the land use types. A horizons of cropland soils (30 cm)
were much thicker compared with grassland (20 cm)
and forest soils (6 cm). In contrast, grasslands soils
exhibited bulky B horizons with thicknesses of 57 cm,
whereas forest and cropland soils had shallower B hori-
zons of 51 and 42 cm, respectively. The thickness of the
C horizons was comparable between the land use
types.
Based on the differences in SOC concentration, BD
and thickness of the horizons, the distribution of SOC
along the master horizons varied considerably between
cropland, grassland and forest soils. Similar SOC stocks
were found for the A horizons of cropland and grass-
land (5.8 and 6.3 kg m�2) but much lower amounts
were found in forest topsoils (2.4 kg m�2). Within B
horizons, grassland soils stored almost twice the
amount of SOC (4.3 kg m�2) compared with cropland
(2.2 kg m�2). For B horizons of forest soils, SOC stocks
of 3.6 kg m�2 were calculated. Relatively low amounts
(0.8–1.1 kg m�2) were found for C horizons. At forest
sites, additional SOC amounts of 2.5 kg m�2 were
stored in the O horizon.
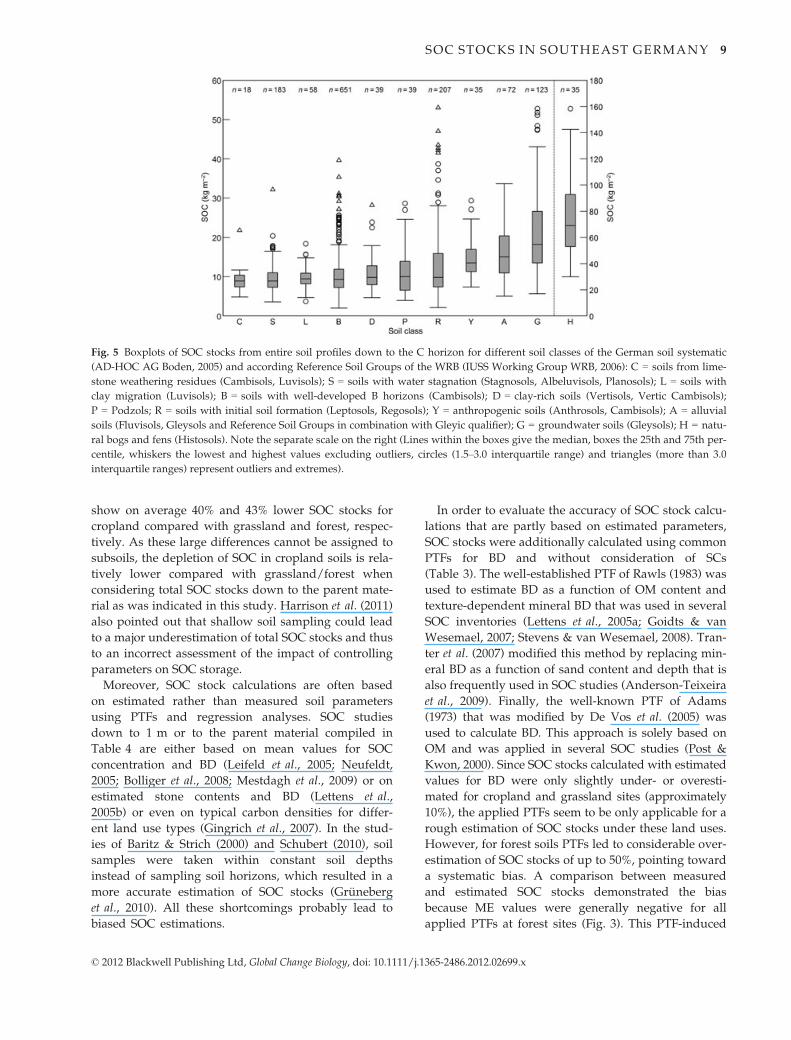
In addition to the stratification by land use, soil class
–specific SOC stocks were calculated (Fig. 5). The
Fig. 2 Boxplots of soil organic carbon stocks from entire soil
profiles down to the C horizon for cropland (C), grassland (G),
forest (F), other land uses (O) and bogs (B). Note the separate
scale on the right (Lines within the boxes give the median, boxes
the 25th and 75th percentile, whiskers the lowest and highest
values excluding outliers, circles (1.5–3.0 interquartile range)
and triangles (more than 3.0 interquartile ranges) represent out-
liers and extremes).
Table 3 SOC stocks for cropland (C), grassland (G) and for-
est (F) calculated using all parameters (SOC content, BD, SC,
depth); by pedotransfer functions for BD (PTFBD) according to
Rawls (1983), De Vos et al. (2005) and Tranter et al. (2007); and
without consideration of SC
SOC stock calculation
SOC stocks (kg m�2)
C G F
All parameters 9.0 11.8 9.8
PTFBD (Rawls, 1983) 8.1 11.3 11.8
PTFBD (Tranter et al., 2007) 8.9 12.3 12.4
PTFBD (De Vos et al., 2005) 9.6 13.2 14.7
Without SC 9.8 13.9 11.0
© 2012 Blackwell Publishing Ltd, Global Change Biology, doi: 10.1111/j.1365-2486.2012.02699.x
6 M. WIESMEIER et al.

classes of soils from limestone weathering residues
(Cambisols, Luvisols), soils with water stagnation
(Stagnosols, Albeluvisols, Planosols), soils with clay
migration (Luvisols), Cambisols, clay-rich soils (Verti-
sols, Vertic Cambisols), Podzols and soils with initial
soil formation (Leptosols, Regosols) showed compara-
ble SOC stocks of 8.9–10.0 kg m�2. For anthropogenic
soils (Anthrosols, Cambisols), alluvial soils (Fluvisols,
Gleysols and Reference Soil Groups with Gleyic quali-
fier) and Gleysols, significantly (P < 0.05) higher stocks
of 13.5, 15.1 and 18.2 kg m�2 were calculated, respec-
tively. The highest amounts of SOC were stored in
natural bogs and fens (Histosols) with 69.1 kg m�2.
Discussion
SOC stocks as influenced by land use and sampling depth
The calculation of SOC stocks down to 1 m or to the
parent material for Bavarian soils seems to confirm our
hypothesis that the storage of SOC is strongly con-
trolled by land use. Except for bogs, where the accumu-
lation of SOC is caused by permanent water saturation,
land use clearly affects the storage of SOC within the
soil profile. Since the mean thickness of the soil profiles
was similar for all land use types (Table 1), an effect of
different total soil depths on SOC storage could be
Fig. 3 Comparison between calculated and estimated SOC stocks for cropland (C), grassland (G) and forest (F) using pedotransfer
functions (PTFBD) according to Rawls (1983), De Vos et al. (2005) and Tranter et al. (2007) with mean errors (ME) and root mean squared
errors (RMSE).
© 2012 Blackwell Publishing Ltd, Global Change Biology, doi: 10.1111/j.1365-2486.2012.02699.x
SOC STOCKS IN SOUTHEAST GERMANY 7
excluded. The storage of SOC increased in the order
cropland < forest < grassland (Fig. 2) as was found in
numerous other studies. However, the differences of
SOC stocks between the main land uses were consider-
ably smaller than in other soil inventories in compara-
ble climatic regions. Table 4 compiles land-use specific
SOC stocks for central European countries derived
from large-scale surveys for a soil depth of 1 m or
down to the parent material as well as for the first
30 cm of the soils. The sampling densities were highly
variable ranging between 10 and 311 km2 per sampling
location. On average, considerably higher stocks were
estimated in SOC inventories to 1 m depth or to the
parent material for central European grasslands
(13.4 kg m�2) and forests (12.5 kg m�2) compared with
our results of 11.8 and 9.8 kg m�2 for grassland and
forest, respectively. In contrast, a similar range of SOC
stocks was found for cropland soils (8.7 and
9.0 kg m�2). Based on SOC data from the cited refer-
ences (1 m depth or parent material), SOC stocks of
cropland soils were 35% and 30% lower compared with
stocks in grassland and forest soils. The loss of SOC in
cultivated soils has been investigated in numerous
studies and can be linked to the removal of crop
residues, reduced vegetation cover, enhanced minerali-
zation of OM, erosion and deteriorated soil aggregation
(e.g. Gregorich et al., 1998; Six et al., 1998; Balesdent
et al., 2000; Stoate et al., 2001; Hamza & Anderson,
2005). Besides the cited SOC inventories at the national
scale, meta analyses of land use changes at the regional
scale and modelling approaches revealed a cultivation-
induced SOC decline of 30–80% when forest and grass-
land were converted to cropland (Guo & Gifford, 2002;
Murty et al., 2002; Houghton & Goodale, 2004; Janssens
et al., 2005; Sleutel et al., 2007; Poeplau et al., 2011).
In contrast, our results showed much lower SOC
losses for cropland soils, with decreases of only 24%
and 8% compared with grassland and forest, respec-
tively. This discrepancy can primarily be related to the
consideration of different soil depths. Since only the
first 30 cm of the soil are directly affected by cultiva-
tion, most studies dealing with land use changes are
restricted to this depth or less (e.g. Murty et al., 2002;
Poeplau et al., 2011). Also most soil inventories are
restricted to a depth of 30 cm, resulting in distinct dif-
ferences of SOC stocks between cropland and grass-
land/forest. For example, soil inventories for central
Europe which are restricted to this depth (Table 4)
Fig. 4 Boxplots of SOC concentration, bulk density (BD), stone content (SC), thickness and SOC stocks of O, A, B and C horizons for
cropland (C), grassland (G) and forest (F) soils (Lines within the boxes give the median, boxes the 25th and 75th percentile, whiskers
the lowest and highest values excluding outliers, circles (1.5–3.0 interquartile range) and triangles (more than 3.0 interquartile ranges)
represent outliers and extremes).
© 2012 Blackwell Publishing Ltd, Global Change Biology, doi: 10.1111/j.1365-2486.2012.02699.x
8 M. WIESMEIER et al.
show on average 40% and 43% lower SOC stocks for
cropland compared with grassland and forest, respec-
tively. As these large differences cannot be assigned to
subsoils, the depletion of SOC in cropland soils is rela-
tively lower compared with grassland/forest when
considering total SOC stocks down to the parent mate-
rial as was indicated in this study. Harrison et al. (2011)
also pointed out that shallow soil sampling could lead
to a major underestimation of total SOC stocks and thus
to an incorrect assessment of the impact of controlling
parameters on SOC storage.
Moreover, SOC stock calculations are often based
on estimated rather than measured soil parameters
using PTFs and regression analyses. SOC studies
down to 1 m or to the parent material compiled in
Table 4 are either based on mean values for SOC
concentration and BD (Leifeld et al., 2005; Neufeldt,
2005; Bolliger et al., 2008; Mestdagh et al., 2009) or on
estimated stone contents and BD (Lettens et al.,
2005b) or even on typical carbon densities for differ-
ent land use types (Gingrich et al., 2007). In the stud-
ies of Baritz & Strich (2000) and Schubert (2010), soil
samples were taken within constant soil depths
instead of sampling soil horizons, which resulted in a
more accurate estimation of SOC stocks (Gruneberg
et al., 2010). All these shortcomings probably lead to
biased SOC estimations.
In order to evaluate the accuracy of SOC stock calcu-
lations that are partly based on estimated parameters,
SOC stocks were additionally calculated using common
PTFs for BD and without consideration of SCs
(Table 3). The well-established PTF of Rawls (1983) was
used to estimate BD as a function of OM content and
texture-dependent mineral BD that was used in several
SOC inventories (Lettens et al., 2005a; Goidts & van
Wesemael, 2007; Stevens & van Wesemael, 2008). Tran-
ter et al. (2007) modified this method by replacing min-
eral BD as a function of sand content and depth that is
also frequently used in SOC studies (Anderson-Teixeira
et al., 2009). Finally, the well-known PTF of Adams
(1973) that was modified by De Vos et al. (2005) was
used to calculate BD. This approach is solely based on
OM and was applied in several SOC studies (Post &
Kwon, 2000). Since SOC stocks calculated with estimated
values for BD were only slightly under- or overesti-
mated for cropland and grassland sites (approximately
10%), the applied PTFs seem to be only applicable for a
rough estimation of SOC stocks under these land uses.
However, for forest soils PTFs led to considerable over-
estimation of SOC stocks of up to 50%, pointing toward
a systematic bias. A comparison between measured
and estimated SOC stocks demonstrated the bias
because ME values were generally negative for all
applied PTFs at forest sites (Fig. 3). This PTF-induced
Fig. 5 Boxplots of SOC stocks from entire soil profiles down to the C horizon for different soil classes of the German soil systematic
(AD-HOC AG Boden, 2005) and according Reference Soil Groups of the WRB (IUSS Working Group WRB, 2006): C = soils from lime-
stone weathering residues (Cambisols, Luvisols); S = soils with water stagnation (Stagnosols, Albeluvisols, Planosols); L = soils with
clay migration (Luvisols); B = soils with well-developed B horizons (Cambisols); D = clay-rich soils (Vertisols, Vertic Cambisols);
P = Podzols; R = soils with initial soil formation (Leptosols, Regosols); Y = anthropogenic soils (Anthrosols, Cambisols); A = alluvial
soils (Fluvisols, Gleysols and Reference Soil Groups in combination with Gleyic qualifier); G = groundwater soils (Gleysols); H = natu-
ral bogs and fens (Histosols). Note the separate scale on the right (Lines within the boxes give the median, boxes the 25th and 75th per-
centile, whiskers the lowest and highest values excluding outliers, circles (1.5–3.0 interquartile range) and triangles (more than 3.0
interquartile ranges) represent outliers and extremes).
© 2012 Blackwell Publishing Ltd, Global Change Biology, doi: 10.1111/j.1365-2486.2012.02699.x
SOC STOCKS IN SOUTHEAST GERMANY 9
bias is probably responsible for higher forest SOC
stocks reported in several SOC inventories (e.g. studies
in Table 4). Generally, the applicability of PTFs could
probably be improved, if distinct PTFs would be used
for different land uses, soil types and soil depths (top-
soil/subsoil).
To summarize, the long-term effect of different land
uses on SOC storage can only be detected satisfacto-
rily when SOC stocks are determined down to the
parent material and all soil parameters are measured
as was done in this study. Our results indicated that
cultivation was not followed by a strong decline of
SOC in southeast Germany, because only slightly
smaller SOC stocks were detected in cropland soils
compared with forest soils. Moreover, grassland soils
showed considerably higher SOC stocks compared
with forest soils, which indicates in turn an additional
accumulation of SOC.
Distribution of SOC stocks with depth
The distribution of total SOC stocks to master soil hori-
zons provided a more detailed view of the controlling
parameters of SOC storage with depth (Fig. 4). A hori-
zon-based approach was used instead of a designation
of SOC stocks to depth increments since differences of
SOC storage between the land use types are more pro-
nounced and pedogenetic processes that control SOC
storage can be detected (Gruneberg et al., 2010). Gener-
ally, much lower SOC concentrations in the A horizon
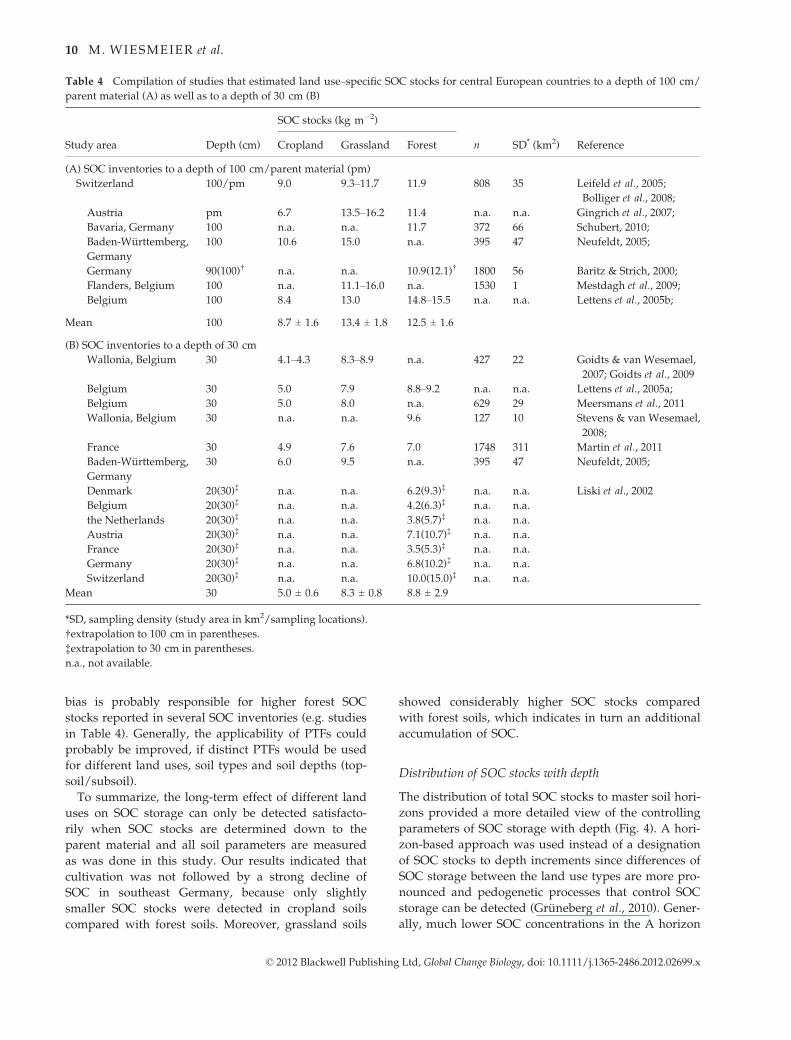
Table 4 Compilation of studies that estimated land use–specific SOC stocks for central European countries to a depth of 100 cm/
parent material (A) as well as to a depth of 30 cm (B)
Study area Depth (cm)
SOC stocks (kg m�2)
n SD* (km2) ReferenceCropland Grassland Forest
(A) SOC inventories to a depth of 100 cm/parent material (pm)
Switzerland 100/pm 9.0 9.3–11.7 11.9 808 35 Leifeld et al., 2005;
Bolliger et al., 2008;
Austria pm 6.7 13.5–16.2 11.4 n.a. n.a. Gingrich et al., 2007;
Bavaria, Germany 100 n.a. n.a. 11.7 372 66 Schubert, 2010;
Baden-Wurttemberg,
Germany
100 10.6 15.0 n.a. 395 47 Neufeldt, 2005;
Germany 90(100)† n.a. n.a. 10.9(12.1)† 1800 56 Baritz & Strich, 2000;
Flanders, Belgium 100 n.a. 11.1–16.0 n.a. 1530 1 Mestdagh et al., 2009;
Belgium 100 8.4 13.0 14.8–15.5 n.a. n.a. Lettens et al., 2005b;
Mean 100 8.7 ± 1.6 13.4 ± 1.8 12.5 ± 1.6
(B) SOC inventories to a depth of 30 cm
Wallonia, Belgium 30 4.1–4.3 8.3–8.9 n.a. 427 22 Goidts & van Wesemael,
2007; Goidts et al., 2009
Belgium 30 5.0 7.9 8.8–9.2 n.a. n.a. Lettens et al., 2005a;
Belgium 30 5.0 8.0 n.a. 629 29 Meersmans et al., 2011
Wallonia, Belgium 30 n.a. n.a. 9.6 127 10 Stevens & van Wesemael,
2008;
France 30 4.9 7.6 7.0 1748 311 Martin et al., 2011
Baden-Wurttemberg,
Germany
30 6.0 9.5 n.a. 395 47 Neufeldt, 2005;
Denmark 20(30)‡ n.a. n.a. 6.2(9.3)‡ n.a. n.a. Liski et al., 2002
Belgium 20(30)‡ n.a. n.a. 4.2(6.3)‡ n.a. n.a.
the Netherlands 20(30)‡ n.a. n.a. 3.8(5.7)‡ n.a. n.a.
Austria 20(30)‡ n.a. n.a. 7.1(10.7)‡ n.a. n.a.
France 20(30)‡ n.a. n.a. 3.5(5.3)‡ n.a. n.a.
Germany 20(30)‡ n.a. n.a. 6.8(10.2)‡ n.a. n.a.
Switzerland 20(30)‡ n.a. n.a. 10.0(15.0)‡ n.a. n.a.
Mean 30 5.0 ± 0.6 8.3 ± 0.8 8.8 ± 2.9
*SD, sampling density (study area in km2/sampling locations).
†extrapolation to 100 cm in parentheses.
‡extrapolation to 30 cm in parentheses.
n.a., not available.
© 2012 Blackwell Publishing Ltd, Global Change Biology, doi: 10.1111/j.1365-2486.2012.02699.x
10 M. WIESMEIER et al.

of cropland soils compared with grassland and forest
soils points at first sight toward a strong depletion of
SOC due to cultivation. However, SOC stocks deter-
mined for cropland A horizons are only slightly lower
(�8%) than grassland stocks and are even more than
twice as high as for forest A horizon. This is due to BD
being considerably higher in cropland A horizons
because cultivation leads to soil compaction, particu-
larly in the plow pan (Hamza & Anderson, 2005).
Moreover, the thickness of cropland A horizons is con-
siderably higher, indicating a vertical deepening of the
A horizon of 10 cm due to tillage. For cropland soils of
northwestern Germany, Nieder & Richter (1986) calcu-
lated that topsoil deepened 10 cm on average, which
coincided with our results, and estimated that a poten-
tial SOC enrichment of 1.4–1.7 kg m�2 could thereby be
achieved. Obviously, soil cultivation is leading not only
to SOC depletion but also to relocation of OM from the
topsoil into deeper soil regions and correspondingly,
the amount of mineralized OM is probably often over-
estimated. In studies with constant depth increments
this ‘dilution effect’ of SOC cannot be detected.
Hence, the differences of SOC stocks between crop-
land and grassland/forest can only partly be related
to cultivation-induced depletion of SOC in the topsoil.
Instead, large differences of SOC stocks were found
for B horizons. Grassland B horizons stored almost
twice the amount of SOC as cropland subsoils,
although BD is even lower in grassland subsoils. A
distinctly higher thickness of grassland B horizons as
well as higher SOC concentrations is responsible for
this strong accumulation of SOC. The total stock dis-
crepancy between grassland and cropland is largely
related to this difference in the subsoil. In forest soils,
small A horizon stocks are compensated for by higher
subsoil SOC stocks and additionally by considerable
amounts in the O horizons.
The importance of soil type–specific SOC storage
The high amount of SOC stored in B horizons of
grassland soils could be related to different processes.
On one hand, grassland species with high root-to-
shoot ratios have a high belowground net primary
productivity associated with a deep OM input in
grassland soils (Jobbagy & Jackson, 2000; Rumpel &
Kogel-Knabner, 2011). On the other hand, Jackson
et al. (1996) showed that in temperate grasslands, 83%
of the root biomass is found in the first 30 cm of the
soils. Pedogenetic processes probably provide further
explanation for the accumulation of SOC in the sub-
soil of grasslands. Despite Cambisols being the most
abundant soil class, Gleysols also played an important
role, with a proportion of almost 20% within
grassland soils (Table 2). In cropland and forest soils,
Gleysols had negligible proportions of 2.6% and 2.3%
due to this groundwater dominated soil class being
only partially usable for cultivation. The permanent
water saturation in the subsoil of Gleysols is associ-
ated with a distinct accumulation of OM. The relation
of SOC stocks to soil classes clearly showed this, since
Gleysols were the most SOC-rich soil class besides
Histosols with stocks of 18.2 kg m�2 (Fig. 5). High
SOC stocks in grassland B horizons can thus be
related to the preferential use of Gleysols as grass-
land, where high groundwater levels lead to an accu-
mulation of OM in the subsoil.
These results cause the importance of land use to be
questioned as the most important factor controlling the
storage of SOC in the soil region studied and highlight
the relevance of pedogenetic properties in terms of soil
classes. However, it should be noted that parameters,
which influence SOC storage, are generally not indepen-
dent from each other and often correlated and thus, their
explanatory power is partly related to other variables.
Since certain soil classes seem to be correlated to specific
land use types, we calculated land use–specific SOC
stocks separately for the most abundant soil class Cam-
bisols (Fig. 6). Within the Cambisol data set, consider-
ably lower grassland SOC stocks (10.3 kg m�2) in
the range of forest stocks (10.0 kg m�2) showed that
Fig. 6 Boxplots of SOC stocks for cropland (C), grassland (G)
and forest (F) within the soil class Cambisols (Lines within the
boxes give the median, boxes the 25th and 75th percentile, whis-
kers the lowest and highest values excluding outliers, circles
(1.5–3.0 interquartile range) and triangles (more than 3.0
interquartile ranges) represent outliers and extremes).
© 2012 Blackwell Publishing Ltd, Global Change Biology, doi: 10.1111/j.1365-2486.2012.02699.x
SOC STOCKS IN SOUTHEAST GERMANY 11

SOC-rich Gleysols are responsible for high grassland
stocks determined for the entire data set. The detrimen-
tal effect of cultivation on SOC storage in cropland soils
was still visible, but with only 20% and 18% lower stocks
compared with grassland and forest explicitly lower
than was reported in studies for other central European
countries (Table 4).
Recommendations for future SOC inventories
The reported land use–specific and soil class–specificSOC stocks are regarded as representative for central
Europe, due to the high sampling density and the fact
that all relevant soil parameters (SOC concentration,
BD, SC) were determined by horizon down to the
parent material. The incorporation of subsoil SOC
stocks revealed that land use may not be the main
controlling factor for SOC storage and highlighted the
importance of pedogenetic properties, particularly in
grassland soils. We recommend that pedogenetic soil
information (soil classes, for example) should be
included in SOC stock estimations as well as in C
sequestration studies. Our results further indicate that
SOC depletion in cropland soils due to cultivation is
probably often overestimated because tillage-induced
deepening of the topsoil was ignored by studies with
fixed depths. The application of modelled parameters
in SOC inventories is generally questioned, because
SOC stocks, calculated with pedotransfer functions,
were systematically biased, particularly for forest
soils. Therefore, we propose that in future SOC inven-
tories, soils should be sampled down to the parent
material and completely analyzed by horizon instead
of depth increments in order to increase the accuracy
of SOC stock estimations and to elucidate pedogenetic
effects on SOC storage. Possible overestimations of a
cultivation-induced SOC depletion prompt further
questioning of the accuracy of C emission scenarios
from soils caused by land use changes and probably
also impact the decision-making in policy related to
land use. A quantification of functional SOC pools
with different turnover times according to different
land uses, soil types and climatic conditions would
make it possible to estimate the future development
of SOC stocks under a changing climate. In this
respect, the data set presented here provides a unique
basis for studies on future SOC changes.
Acknowledgements
We thank Alfred Schubert from the Bavarian State Institute forForestry for providing forest soil data. Peter Schad is acknowl-edged for the allocation of soil classes to the WRB system. Weare grateful to the Bavarian State Ministry of the Environment
and Public Health for funding the project ‘Der Humuskorperbayerischer Boden im Klimawandel – Auswirkungen und Po-tentiale’.
References
Adams WA (1973) The effect of organic matter on the bulk and true densities of some
uncultivated podzolic soils. Journal of Soil Science, 24, 10–17.
AD-HOC AG Boden (2005) Bodenkundliche Kartieranleitung. Bundesanstalt fur Geowis-
senschaften und Rohstoffe (Ed.). E. Schweizerbart′sche Verlagsbuchhandlung,
Stuttgart.
Anderson-Teixeira KJ, Davis SC, Masters MD, Delucia EH (2009) Changes in soil
organic carbon under biofuel crops. Global Change Biology Bioenergy, 1, 75–96.
Balesdent J, Chenu C, Balabane M (2000) Relationship of soil organic matter dynamics
to physical protection and tillage. Soil & Tillage Research, 53, 215–230.
Baritz R, Strich S (2000) Forests and the national greenhouse gas inventory of Ger-
many. Biotechnology, Agronomy, Society and Environment, 4, 267–271.
Batjes NH (1996) Total carbon and nitrogen in the soils of the world. European Journal
of Soil Science, 47, 151–163.
Bolliger J, Hagedorn F, Leifeld J, Bohl J, Zimmermann S, Soliva R, Kienast F (2008)
Effects of land-use change on carbon stocks in Switzerland. Ecosystems, 11, 895–907.
De Vos B, Van Meirvenne M, Quataert P, Deckers J, Muys B (2005) Predictive quality
of pedotransfer functions for estimating bulk density of forest soils. Soil Science
Society of America Journal, 69, 500–510.
Diggle PJ, Riberio PJ Jr (2007) Model-based Geostatistics. Springer, New York.
Eglin T, Ciais P, Piao SL et al. (2010) Historical and future perspectives of global soil
carbon response to climate and land-use changes. Tellus Series B-Chemical and Phys-
ical Meteorology, 62, 700–718.
Gee GW, Bauder JW(1986) Particle-size analysis. In: Methods of Soil Analysis, Part 1,
Physical and Mineralogical Methods (ed. Page AL), pp. 383–411. Soil Science Society
of America, Wisconsin.
Gingrich S, Erb KH, Krausmann F, Gaube V, Haberl H (2007) Long-term dynamics of
terrestrial carbon stocks in Austria: a comprehensive assessment of the time period
from 1830 to 2000. Regional Environmental Change, 7, 37–47.
Goidts E, van Wesemael B (2007) Regional assessment of soil organic carbon changes
under agriculture in Southern Belgium (1955–2005). Geoderma, 141, 341–354.
Goidts E, van Wesemael B, Van Oost K (2009) Driving forces of soil organic carbon
evolution at the landscape and the regional scale using data from a stratified soil
monitoring. Global Change Biology, 15, 2981–3000.
Gregorich EG, Greer KJ, Anderson DW, Liang BC (1998) Carbon distribution and
losses: erosion and deposition effects. Soil & Tillage Research, 47, 291–302.
Gruneberg E, Schoning I, Kalko EKV, Weisser WW (2010) Regional organic carbon
stock variability: a comparison between depth increments and soil horizons. Geo-
derma, 155, 426–433.
Guo LB, Gifford RM (2002) Soil carbon stocks and land use change: a meta analysis.
Global Change Biology, 8, 345–360.
Hamza MA, Anderson WK (2005) Soil compaction in cropping systems – a review of
the nature, causes and possible solutions. Soil & Tillage Research, 82, 121–145.
Harrison RB, Footen PW, Strahm BD (2011) Deep soil horizons: contribution and
Importance to soil carbon pools and in assessing whole-ecosystem response to
management and global change. Forest Science, 57, 67–76.
Hartge KH, Horn R (1989) Die physikalische Untersuchung von Boden. Enke Verlag,
Stuttgart.
Houghton RA, Goodale C (2004) Effects of land-use change on the carbon balance of
terrestrial ecosystems. In: Ecosystems and land use change (ed. DeFries R, Asner G,
Houghton RA), pp. 85–98. American Geophysical Union, Washington, DC.
IPCC (2000) Land Use, Land-Use Change, and Forestry. Intergovernmental Panel on Cli-
mate Change (IPCC), Geneva.
IPCC (2003) Good Practice Guidance for Land Use, Land-Use Change and Forestry. Inter-
governmental Panel on Climate Change (IPCC), Geneva.
IUSS Working Group WRB 2006. World reference base for soil resources 2006. World
Soil Resources Reports No. 103, FAO, Rome.
Jackson RB, Canadell J, Ehleringer JR, Mooney HA, Sala OE, Schulze ED (1996)
A global analysis of root distributions for terrestrial biomes. Oecologia, 108,
389–411.
Janssens IA, Freibauer A, Schlamadinger B et al. (2005) The carbon budget of ter-
restrial ecosystems at country-scale – a European case study. Biogeosciences, 2,
15–26.
Jobbagy EG, Jackson RB (2000) The vertical distribution of soil organic carbon and its
relation to climate and vegetation. Ecological Applications, 10, 423–436.
© 2012 Blackwell Publishing Ltd, Global Change Biology, doi: 10.1111/j.1365-2486.2012.02699.x
12 M. WIESMEIER et al.

Joneck M, Hangen E, Martin W et al. (2006) Wissenschaftliche Grundlagen fur den
Vollzug der Bodenschutzgesetze in Bayern (GRABEN) – ein Projekt stellt sich vor.
Bodenschutz, 2, 32–38.
Jones RJA, Hiederer R, Rusco E, Montanarella L (2005) Estimating organic carbon in
the soils of Europe for policy support. European Journal of Soil Science, 56, 655–671.
Lark RM, Cullis BR (2004) Model-based analysis using REML for inference from sys-
tematically sampled data on soil. European Journal of Soil Science, 55, 799–813.
Leifeld J, Bassin S, Fuhrer J (2005) Carbon stocks in Swiss agricultural soils predicted
by land-use, soil characteristics, and altitude. Agriculture Ecosystems & Environ-
ment, 105, 255–266.
Lettens S, van Orshoven J, van Wesemael B, Muys B, Perrin D (2005a) Soil organic
carbon changes in landscape units of Belgium between 1960 and 2000 with refer-
ence to 1990. Global Change Biology, 11, 2128–2140.
Lettens S, Van Orshovena J, van Wesemael B, De Vos B, Muys B (2005b) Stocks and
fluxes of soil organic carbon for landscape units in Belgium derived from hetero-
geneous data sets for 1990 and 2000. Geoderma, 127, 11–23.
Liski J, Perruchoud D, Karjalainen T (2002) Increasing carbon stocks in the forest soils
of Western Europe. Forest Ecology and Management, 169, 159–175.
von Lutzow M, Kogel-Knabner I (2009) Temperature sensitivity of soil organic
matter decomposition-what do we know? Biology and Fertility of Soils, 46,
1–15.
von Lutzow M, Kogel-Knabner I, Ludwig B et al. (2008) Stabilization mechanisms of
organic matter in four temperate soils: development and application of a concep-
tual model. Journal of Plant Nutrition and Soil Science, 171, 111–124.
Martin MP, Wattenbach M, Smith P, Meersmans J, Jolivet C, Boulonne L, Arrouays D
(2011) Spatial distribution of soil organic carbon stocks in France. Biogeosciences, 8,
1053–1065.
Meersmans J, van Wesemael B, Goidts E, van Molle M, De Baets S, De Ridder F
(2011) Spatial analysis of soil organic carbon evolution in Belgian croplands and
grasslands, 1960–2006. Global Change Biology, 17, 466–479.
Mestdagh I, Sleutel S, Lootens P et al. (2009) Soil organic carbon-stock changes in
Flemish grassland soils from 1990 to 2000. Journal of Plant Nutrition and Soil Science,
172, 24–31.
Murty D, Kirschbaum MUF, McMurtrie RE, McGilvray A (2002) Does conversion of
forest to agricultural land change soil carbon and nitrogen? a review of the litera-
ture. Global Change Biology, 8, 105–123.
Neufeldt H (2005) Carbon stocks and sequestration potentials of agricultural soils in
the federal state of Baden-Wurttemberg, SW Germany. Journal of Plant Nutrition
and Soil Science, 168, 202–211.
Nieder R, Richter J (1986) C- und N-Festlegung in Boden Sudostniedersachsens nach
Krumenvertiefung. Journal of Plant Nutrition and Soil Science, 149, 189–201.
Poeplau C, Don A, Vesterdal L, Leifeld J, Van Wesemael B, Schumacher J, Gensior A
(2011) Temporal dynamics of soil organic carbon after land-use change in the tem-
perate zone – carbon response functions as a model approach. Global Change Biol-
ogy, 17, 2415–2427.
Post WM, Kwon KC (2000) Soil carbon sequestration and land-use change: processes
and potential. Global Change Biology, 6, 317–327.
Prechtel A, von Lutzow M, Schneider BU, Bens O, Bannick CG, Kogel-Knabner I,
Huttl RF (2009) Organic carbon in soils of Germany: status quo and the need for
new data to evaluate potentials and trends of soil carbon sequestration. Journal of
Plant Nutrition and Soil Science, 172, 601–614.
R Development Core Team 2011. R: A Language and Environment for Statistical Comput-
ing. R Foundation for Statistical Computing, Vienna. Available at: http://www.
r-project.org/ (accessed 15 February 2012).
Rawls WJ (1983) Estimating soil bulk-density from particle-size analysis and organic-
matter content. Soil Science, 135, 123–125.
Riberio . PJ Jr, Diggle PJ (2001) geoR: a package for geostatistical analysis. R-News, 1,
15–18.
Rumpel C, Kogel-Knabner I (2011) Deep soil organic matter-a key but poorly under-
stood component of terrestrial C cycle. Plant and Soil, 338, 143–158.
Schrumpf M, Schulze ED, Kaiser K, Schumacher J (2011) How accurately can soil
organic carbon stocks and stock changes be quantified by soil inventories? Biogeo-
sciences, 8, 1193–1212.
Schubert A (2002) Bayerische Waldboden-Dauerbeobachtungsflachen – Bodenuntersuchun-
gen. WissenschaftszentrumWeihenstephan fur Ernahrung, Landnutzung und Um-
welt der Technischen Universitat Munchen and Bayerische Landesanstalt fur
Wald und Forstwirtschaft, Freising.
Schubert A (2010) Organisch gebundener Kohlenstoff im Waldboden. LWF Waldfors-
chung aktuell, 78, 11–14.
Six J, Elliott ET, Paustian K, Doran JW (1998) Aggregation and soil organic matter
accumulation in cultivated and native grassland soils. Soil Science Society of America
Journal, 62, 1367–1377.
Sleutel S, De Neve S, Hofman G (2007) Assessing causes of recent organic carbon
losses from cropland soils by means of regional-scaled input balances for the case
of Flanders (Belgium). Nutrient Cycling in Agroecosystems, 78, 265–278.
Smith J, Smith P, Wattenbach M et al. (2005) Projected changes in mineral soil carbon of
European croplands and grasslands, 1990–2080. Global Change Biology, 11, 2141–2152.
Stevens A, van Wesemael B (2008) Soil organic carbon dynamics at the regional scale
as influenced by land use history: a case study in forest soils from southern
Belgium. Soil Use and Management, 24, 69–79.
Stoate C, Boatman ND, Borralho RJ, Carvalho CR, de Snoo GR, Eden P (2001) Ecologi-
cal impacts of arable intensification in Europe. Journal of Environmental Manage-
ment, 63, 337–365.
Stolbovoy V, Montanarella L, Filippi N, Jones A, Gallego J, Grassi G (2007) Soil Sam-
pling Protocol to Certify the Changes of Organic Carbon Stock in Mineral Soil of the
European Union. Office for Official Publications of the European Communities,
Luxembourg.
Tranter G, Minasny B, McBratney AB, Murphy B, McKenzie NJ, Grundy M, Brough
D (2007) Building and testing conceptual and empirical models for predicting soil
bulk density. Soil Use and Management, 23, 437–443.
© 2012 Blackwell Publishing Ltd, Global Change Biology, doi: 10.1111/j.1365-2486.2012.02699.x
SOC STOCKS IN SOUTHEAST GERMANY 13