No Differences in Soil Carbon Stocks Across the Tree Line in the Peruvian Andes
13
No Differences in Soil Carbon Stocks Across the Tree Line in the Peruvian Andes Michael Zimmermann, 1 * Patrick Meir, 1 Miles R. Silman, 2 Anna Fedders, 2 Adam Gibbon, 3 Yadvinder Malhi, 3 Dunia H. Urrego, 4 Mark B. Bush, 4 Kenneth J. Feeley, 2 Karina C. Garcia, 2,5 Greta C. Dargie, 1 Wiliam R. Farfan, 2,5 Bradley P. Goetz, 2 Wesley T. Johnson, 2 Krystle M. Kline, 2 Andrew T. Modi, 2 Natividad M. Q. Rurau, 5 Brian T. Staudt, 2 and Flor Zamora 5 1 School of Geosciences, University of Edinburgh, Edinburgh EH8 9XP, UK; 2 Department of Biology, Wake Forest University, 1834 Wake Forest Rd., Winston Salem, North Carolina 27106, USA; 3 Environmental Change Institute, School of Geography and the Environment, University of Oxford, Oxford OX1 3QY, UK; 4 Department of Biological Sciences, Florida Institute of Technology, 150 West University Boulevard, Melbourne, Florida 32901, USA; 5 Universidad San Antonio Abad, Cusco, Peru ABSTRACT Reliable soil organic carbon (SOC) stock measure- ments of all major ecosystems are essential for predicting the influence of global warming on global soil carbon pools, but hardly any detailed soil survey data are available for tropical montane cloud forests (TMCF) and adjacent high elevation grasslands above (puna). TMCF are among the most threatened of ecosystems under current pre- dicted global warming scenarios. We conducted an intensive soil sampling campaign extending 40 km along the tree line in the Peruvian Andes between 2994 and 3860 m asl to quantify SOC stocks of TMCF, puna grassland, and shrubland sites in the transition zone between the two habitats. SOC stocks from the soil surface down to the bedrock averaged (±standard error SE) 11.8 (±1.5, N = 24) kg C/m 2 in TMCF, 14.7 (±1.4, N = 9) kg C/m 2 in the shrublands and 11.9 (±0.8, N = 35) kg C/m 2 in the grasslands and were not significantly different (P > 0.05 for all comparisons). However, soil pro- file analysis revealed distinct differences, with TMCF profiles showing a uniform SOC distribution with depth, shrublands a linear decrease, and puna sites an exponential decrease in SOC densities with soil depth. Organic soil layer thickness reached a maximum (70 cm) at the upper limit of the TMCF and declined with increasing altitude toward puna sites. Within TMCF, no significant increase in SOC stocks with increasing altitude was observed, probably because of the large variations among SOC stocks at different sites, which in turn were correlated with spatial variation in soil depth. Key words: soil carbon stocks; tropical montane cloud forest; puna; tree line. INTRODUCTION Soils are recognized as large stores of carbon (C), and play a key role in the global C cycle (Houghton 2003; Janzen 2004). The size of the SOC stock is determined by the input of plant-derived C Received 10 July 2009; accepted 20 October 2009; published online 14 November 2009 Author Contributions: PM, MRS, AG, KJF, MBB, MZ designed the study; MRS, AF, AG, DHU, MBB, KJF, KCG, GCD, WRF, BPG, WTJ, KMK, ATM, NMQR, BTS, FZ, MZ performed the research; MZ, PM, MRS, AF, AG, YM, DHU analyzed the data; and MZ, PM wrote the paper. *Corresponding author; e-mail: [email protected] Ecosystems (2010) 13: 62–74 DOI: 10.1007/s10021-009-9300-2 ȑ 2009 Springer Science+Business Media, LLC 62
-
Upload
independent -
Category
Documents
-
view
1 -
download
0
Transcript of No Differences in Soil Carbon Stocks Across the Tree Line in the Peruvian Andes

No Differences in Soil Carbon StocksAcross the Tree Line in the Peruvian
Andes
Michael Zimmermann,1* Patrick Meir,1 Miles R. Silman,2 Anna Fedders,2
Adam Gibbon,3 Yadvinder Malhi,3 Dunia H. Urrego,4 Mark B. Bush,4
Kenneth J. Feeley,2 Karina C. Garcia,2,5 Greta C. Dargie,1 Wiliam R. Farfan,2,5
Bradley P. Goetz,2 Wesley T. Johnson,2 Krystle M. Kline,2 Andrew T. Modi,2
Natividad M. Q. Rurau,5 Brian T. Staudt,2 and Flor Zamora5
1School of Geosciences, University of Edinburgh, Edinburgh EH8 9XP, UK; 2Department of Biology, Wake Forest University, 1834
Wake Forest Rd., Winston Salem, North Carolina 27106, USA; 3Environmental Change Institute, School of Geography and the
Environment, University of Oxford, Oxford OX1 3QY, UK; 4Department of Biological Sciences, Florida Institute of Technology,150 West University Boulevard, Melbourne, Florida 32901, USA; 5Universidad San Antonio Abad, Cusco, Peru
ABSTRACT
Reliable soil organic carbon (SOC) stock measure-
ments of all major ecosystems are essential for
predicting the influence of global warming on
global soil carbon pools, but hardly any detailed soil
survey data are available for tropical montane
cloud forests (TMCF) and adjacent high elevation
grasslands above (puna). TMCF are among the
most threatened of ecosystems under current pre-
dicted global warming scenarios. We conducted an
intensive soil sampling campaign extending 40 km
along the tree line in the Peruvian Andes between
2994 and 3860 m asl to quantify SOC stocks of
TMCF, puna grassland, and shrubland sites in the
transition zone between the two habitats. SOC
stocks from the soil surface down to the bedrock
averaged (±standard error SE) 11.8 (±1.5, N = 24)
kg C/m2 in TMCF, 14.7 (±1.4, N = 9) kg C/m2 in
the shrublands and 11.9 (±0.8, N = 35) kg C/m2 in
the grasslands and were not significantly different
(P > 0.05 for all comparisons). However, soil pro-
file analysis revealed distinct differences, with
TMCF profiles showing a uniform SOC distribution
with depth, shrublands a linear decrease, and puna
sites an exponential decrease in SOC densities with
soil depth. Organic soil layer thickness reached a
maximum (�70 cm) at the upper limit of the TMCF
and declined with increasing altitude toward puna
sites. Within TMCF, no significant increase in SOC
stocks with increasing altitude was observed,
probably because of the large variations among
SOC stocks at different sites, which in turn were
correlated with spatial variation in soil depth.
Key words: soil carbon stocks; tropical montane
cloud forest; puna; tree line.
INTRODUCTION
Soils are recognized as large stores of carbon (C),
and play a key role in the global C cycle (Houghton
2003; Janzen 2004). The size of the SOC stock
is determined by the input of plant-derived C
Received 10 July 2009; accepted 20 October 2009;
published online 14 November 2009
Author Contributions: PM, MRS, AG, KJF, MBB, MZ designed the
study; MRS, AF, AG, DHU, MBB, KJF, KCG, GCD, WRF, BPG, WTJ,
KMK, ATM, NMQR, BTS, FZ, MZ performed the research; MZ, PM, MRS,
AF, AG, YM, DHU analyzed the data; and MZ, PM wrote the paper.
*Corresponding author; e-mail: [email protected]
Ecosystems (2010) 13: 62–74DOI: 10.1007/s10021-009-9300-2
� 2009 Springer Science+Business Media, LLC
62

entering the soil matrix, the potential to sequester
C through physical and chemical stabilization pro-
cesses, and the release of C through decomposition
and leaching (Trumbore and others 2006). The
most important environmental factors influencing
the SOC stock are temperature and moisture,
which also affect biomass production and respira-
tion (Shaver and others 2000; Raich and others
2006). Because of this, SOC stocks in ecosystems
within different climatic regions react differently to
changes in climate (Walther and others 2002;
Norby and Luo 2004).
Estimates of the nature and size of current SOC
stocks are needed to parameterize models used to
estimate net C changes in different biomes (Post
and others 2001). However, extensive data sets of
SOC stocks are not available for some ecosystems,
and this is a source of uncertainty in model pre-
dictions of future global and regional SOC stocks.
One such understudied ecosystem lacking detailed
SOC stock estimates is Neotropical TMCF. These
forests are typically found between 1000 and
3500 m above sea level (asl) with mean annual
temperatures similar to regions in temperate zones
but with very weak (or no) seasonality, and they
tend to receive much larger amounts of precipita-
tion in the form of rain and fog (Arteaga and others
2008). Here we focus on the Andean TMCFs, in
which biodiversity and endemism is among the
highest in the world and which are also among the
most threatened of all ecosystems under predicted
warming scenarios (Foster 2001).
At higher elevations in the tropical Andes
(3000 m asl and above, depending on anthropo-
genic activity) there is a transition from TMCF first
to open woody vegetation dominated by shrubs
which we refer to here as ‘shrubland’, and then to
grassland (‘puna’ or ‘paramo’). With a predicted
warming of 4�C for the tropical land surface over
the twenty-first century (Cramer and others 2004),
TMCF may migrate upwards, occupying land for-
merly dominated by shrubs and grasses (Bush and
others 2004; Colwell and others 2008). Thus, to
make a first-order estimate of the effects of a the-
oretical altitudinal shift in vegetation on SOC
stocks, detailed SOC quantifications are needed.
Soil C-stocks were shown to change with altitude
(Townsend and others 1995) and vegetation type
(Sombroek and others 1993). Furthermore, climate
and vegetation also influence soil C-distributions
with depth (Jobbagy and Jackson 2000), which
lead to the assumption that soil C-stocks might
change significantly across altitudinal vegetation
transects. In the present study, we collected soil
samples from TMCF, shrubland, and grassland sites
above the tree line in the Peruvian Andes, as these
vegetation types around the tree line may experi-
ence the most marked alterations under global
warming scenarios. The questions we addressed
were: (1) What is the size of SOC stocks within
these three vegetation types; and 2) Is the SOC
stock distributed differently within the soil profiles
in each of these zones. This information is needed
to estimate how SOC stock might change if TMCF
expanded to shrubland and grassland sites because
of predicted warming and, or, land use. The aim of
the present study was to provide SOC stock mea-
surements across the tree line in Andean TMCF for
prospective SOC simulations.
MATERIALS AND METHODS
Sampling Sites and Soil Description
Soil samples were collected along the western
border of the Manu National Park in Peru at alti-
tudes between 2994 and 3860 m asl (�13�00¢S/71�40’ W¢). The study site comprised an area
40 km along the watershed separating the dry hilly
Andean highlands and the wet and steep eastern
flank of the Andes (Figure 1), in which the average
Figure 1. Sampling sites in the Peruvian Andes. Triangles
are forest sites, squares are shrubland sites, and circles are
grassland sites. The black line marks the Manu National
Park border. Dark colors display forested areas, with the
lowland tropical forests in the direction of the NE corner
of the main map. The inset map of South America shows
the location of the Manu National Park in Peru.
SOC Stocks Across Tree Line in Peru 63

tree line was at about 3450 m asl. The mean annual
temperature at this altitude is about 11�C and the
annual rainfall 2500 mm. Diurnal variations in
temperature are more pronounced than seasonal
differences.
In general, the TMCF soils in the study region
were characterized by an organic forest floor layer
(Oh) of about 20 cm, but which could be as thick as
70 cm. This layer consisted mainly of a dense fine-
root mesh and partly decomposed plant litter. The
Oh layers typically overlaid organic-rich humic Ah
layers of about 10 cm and purely mineral B layers
of up to 70 cm thickness. Various forest sites con-
tained mixed mineral layers with high stone con-
tents as result of ancient landslides, which are
common in this steep terrain. The full soil depth in
the TMCF varied between 20 and 120 cm. Shrub-
land soils were slightly shallower and had only
a thin Oh layer of about 2–5 cm, followed by a
10–20 cm thick A(h) layer. In this transition zone,
soils were normally between 20 and 50 cm deep.
Grassland soils in the puna had no Oh layers at all
and consisted mainly of dark, organic-rich A layers
of about 20 cm thickness and stony B/C layers.
These soils were normally about 30 cm deep.
Although very patchy, some peat-bog soils in the
puna were deeper than 100 cm.
Soil Sampling Methods and Analysis
In total, 596 soil samples were taken along eleva-
tion transects traversing the TMCF, the shrubland
vegetation in the transition zone and the grasslands
in the puna above, and from various predefined
sampling points. Coordinates of transect locations
and sampling points were generated randomly but
stratified to adequately represent regional variation
in micro-meteorology and topography. Samples
were collected from a total of 68 sites assigned to
the three vegetation types (forest, shrubland, and
grassland; Table 1). At each site, soil cores from
five soil profiles were taken, with a central soil
core being surrounded by four additional cores,
positioned randomly 1–5 m away, in orthogonal
directions. The slope at each site was measured
with a clinometer and the coordinates and altitudes
recorded with a GPS. All sites were inspected
visually for any evidence of cattle (dung, grazing)
and recent burns, whether natural or human-in-
duced.
Soil cores from all profiles were taken between
July and August 2008 using metal tubes of 50 mm
diameter and 10 or 20 cm length. At all sites, the
soil surfaces were cleared of leaf litter and plants,
and the top soils collected with the 10 cm tubes,
and all deeper soil layers down to the bedrock with
the 20 cm tubes. Total soil depths were measured
with an iron rod inserted to the bedrock, and the
sampling depth adjusted accordingly. Additionally,
the soil profiles were inspected visually for charcoal
residues, and the thicknesses of the organic, humic
and mineral layers were measured.
All soil samples were oven-dried at 60�C to
constant mass, and the dry mass quantified. The
samples were then crushed and sieved to 2 mm
to remove all stones, and measured again. A sub-
sample of every core was ground and C and
nitrogen (N) concentrations determined after dry
combustion with a Carlo Erba Elemental Analyzer
(Milano, Italy) at the University of Edinburgh, UK.
All soil samples were carbonate free.
Bulk soil densities (soil particles < 2 mm) were
quantified using the stone-free dry weights and the
sampling tube volumes corrected for the stone
volumes. The density of a composite stone sample
was quantified by displacement in a water bath and
averaged 2.62 g/cm3. Soil C and N stocks were then
calculated according to the soil densities for each 10
or 20 cm soil layer, and SOC stocks of the single
profiles summarized to average site values. Carbon
densities as g C/cm3 were calculated to compare soil
layers of different thicknesses. Missing analytical
values were interpolated according to correlations
between bulk soil density and C concentration,
distinguished among the three biome types as
described in the ‘‘Results’’ section.
Table 1. Number of Samples and Sampling Site Descriptions
Dominant
vegetation
Sites Profiles Samples Lowest
altitude
Highest
altitude
Mean
altitude
Typical vegetation
Forest 24 89 229 2994 3625 3370 Clusiaceae, Melastomataceae,
Cunoniaceae, Symplocaceae
Shrubland 9 31 80 3283 3620 3454 Escalloniaceae, Myrsinaceae, Ericaceae,
Loranthaceae, Clethraceae
Grassland 35 133 287 3348 3860 3547 Asteraceae, Poaceae, Pterydophyta
All 68 253 596 2994 3860 3470
64 M. Zimmermann and others

Statistical Analysis
The significance of the relationships among soil
properties was tested using the Pearson’s product
moment correlation test (R) and regressions cal-
culated with the function resulting in the highest
coefficient of determination (r2). A t-test was used
to test for between-vegetation type differences if
the data were normally distributed and had similar
variances; otherwise a Mann–Whitney rank sum
test was run (using a significance level of P = 0.05).
More than two groups were compared with a
one-way ANOVA if they were normally distributed
and had similar variances; otherwise tests were
performed with a Kruskal–Wallis one-way ANOVA
of ranks. Mean values for sites or properties are
always given with ±1 SE.
RESULTS AND DISCUSSIONS
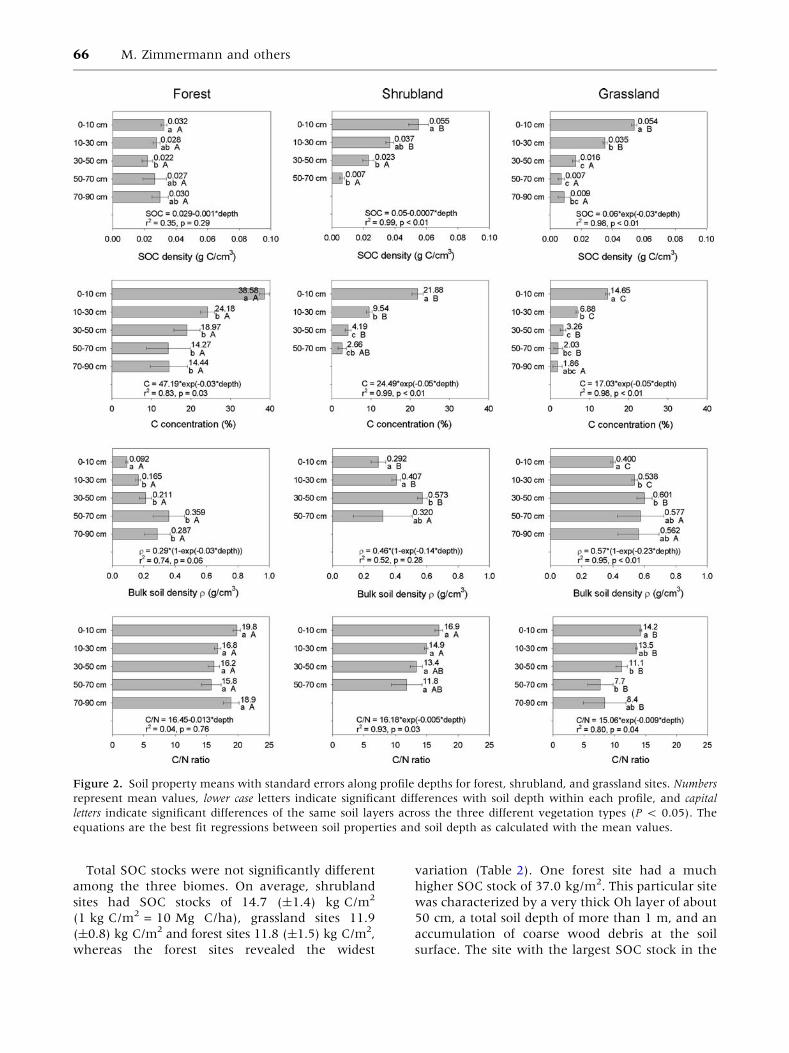
Soil Profile Data
Soil organic carbon densities (the amount of C per
cm3 soil) in forest soil profiles (N = 89) varied little
with depth, but this pattern masked an exponential
reduction in C concentrations and an increase in
bulk density with depth (Figure 2). These patterns
were caused by the typical organic forest floor
layers in this biome containing large amounts of
fine roots and plant debris. Surprisingly, the C:N
ratio (an indicator of the degree of decomposition
(Schrumpf and others 2001)) did not change sig-
nificantly with depth in forest soil profiles. Shrub-
land soil profiles (N = 31) showed a linear decrease
in SOC density with depth, with the SOC densities
in the top 30 cm being significantly higher than in
deeper layers. The C concentration decreased
exponentially with soil depth, but the bulk soil
densities showed no significant trend. The C:N ratio
decreased exponentially from 16.2 in the top 10 cm
to 11.8 at 50 cm to 70 cm, but these differences
were not significant at P = 0.05. The grassland soil
profiles (N = 133) showed a distinct exponential
decrease in SOC density with depth, mainly caused
by decreasing C concentration along the profiles
coupled with scarcely significant differences in bulk
soil densities.
Comparisons between the three different biomes
showed that differences were more pronounced in
the top 30 cm than in deeper soil layers. In gen-
eral, forest soil profiles had higher C concentra-
tions and lower bulk soil densities in the top
30 cm than the other two vegetation types.
Grassland soil profiles showed the strongest
decrease in SOC density with depth and the lowest
C:N ratios, and the properties of most shrubland
vegetation profiles were between the values of the
two other systems.
The changes in SOC densities with depth for the
shrubland and grassland soil profiles were very
similar to global grassland and shrubland sites as
presented in Jobbagy and Jackson (2000), who
used 3 datasets with more than 2700 profiles to
calculate SOC distributions with depth. However,
none of the presented soil profiles in that study
featured such a uniform SOC density distribution
along the entire profile as measured here for the
TMCF sites.
Correlations Between Soil Densitiesand C Concentrations
Correlations between C concentrations and bulk
soil densities have been reported elsewhere
(Heuscher and others 2005; Leifeld and others
2005) and C concentrations in combination with
other soil parameters have been used to estimate
bulk soil densities (Calhoun and others 2001).
Here, we separated our dataset into the three veg-
etation types to calculate regression functions
between C concentration and bulk soil density
(Figure 3). For all three vegetation types, expo-
nential functions returned the largest coefficients of
determination between C concentration and bulk
soil density (r2 between 0.48 and 0.57). These
functions were then used to calculate missing val-
ues for any samples that were lost during sample
processing (N = 47).
The coefficients of determination observed here
are in the same range as in Heuscher and others
(2005), who calculated regression functions taking
into account C concentration, soil moisture, particle
size distribution, and soil depth for 47,000 soil
samples from the USA (r2 = 0.45). In other studies,
sample sets were separated by soil depth to calculate
regression functions between C and soil density
(Bernoux and others 1998; Leifeld and others 2005),
but as C concentration was correlated with soil
depth in our data, we did not separate our dataset
further to keep the sample number (N) large.
Differences Among Forest, ShrubVegetation, and Grassland Sites
Summarized SOC stocks, C concentrations, bulk
soil densities, C:N ratios, soil depths, and slopes for
all sites distinguished among the three vegetation
types are given as box plots in Figure 4 with the 10,
25, 75, 90 percentiles, medians and outliers (out-
side ± 95% confidence interval).
SOC Stocks Across Tree Line in Peru 65
Total SOC stocks were not significantly different
among the three biomes. On average, shrubland
sites had SOC stocks of 14.7 (±1.4) kg C/m2
(1 kg C/m2 = 10 Mg C/ha), grassland sites 11.9
(±0.8) kg C/m2 and forest sites 11.8 (±1.5) kg C/m2,
whereas the forest sites revealed the widest
variation (Table 2). One forest site had a much
higher SOC stock of 37.0 kg/m2. This particular site
was characterized by a very thick Oh layer of about
50 cm, a total soil depth of more than 1 m, and an
accumulation of coarse wood debris at the soil
surface. The site with the largest SOC stock in the
Figure 2. Soil property means with standard errors along profile depths for forest, shrubland, and grassland sites. Numbers
represent mean values, lower case letters indicate significant differences with soil depth within each profile, and capital
letters indicate significant differences of the same soil layers across the three different vegetation types (P < 0.05). The
equations are the best fit regressions between soil properties and soil depth as calculated with the mean values.
66 M. Zimmermann and others

grasslands (24.0 kg C/m2) was within a peat-bog
close to a small lake. Although sites like this might
store large amounts of SOC, no other sampled puna
site was within a peat-bog despite the intensity
of the sampling protocol. Carbon concentrations
decreased in order from forest to shrubland to
grassland sites, and bulk soil densities showed the
reverse trend (Figure 2). Forest sites had signifi-
cantly higher C concentrations than grassland sites,
whereas the C concentrations of shrubland sites
were not significantly different from the two other
biomes. Comparing soil bulk density for each veg-
etation type, shrubland and grassland soils had
significantly larger bulk density values than the
forest soils, but were not significantly different
from each other.
Although total SOC stocks were not significantly
different among vegetation types, the degree
of decomposition among the three vegetation
types—as reflected by the C:N ratio—showed that
the organic matter in the grassland sites was more
strongly altered (C:N = 13.9) from litter input
(C:N = 25.3; Zimmermann and others 2009a)
compared to forest and shrubland sites with C:N
ratios of 17.2 and 15.9, respectively. Schawe and
others (2007) reported C:N ratios between 20 and
28 for the top 1 m of Bolivian forest sites above
2700 m asl, and Schrumpf and others (2001)
measured C:N ratios greater than 30 for high
Andean root soil layers in Ecuador (>2800 m asl),
concluding that decomposition rates at high ele-
vations might not only be suppressed by low tem-
peratures but also by low N supply. However, as the
C:N ratios measured here are much smaller and
the forests had on average smaller N stocks
than the higher elevation shrub and grasslands
(Figure 4), such processes appear to be much less
significant in our study region.
Sombroek and others (1993) compared global
SOC stocks of different ecosystems, and estimated
SOC stocks of 14.5 kg C/m2 for tropical forests and
12.4 kg C/m2 for grasslands, which are in the range
of the SOC stocks reported here. In contrast, Job-
bagy and Jackson (2000) reported higher SOC
stocks for lowland tropical forest sites (18.6 kg C/m2)
for the top 1 m, which could be caused by the
different depth of soil sampling in their dataset and
the general differences between lowland and
montane rainforests, as tropical forests appear to
allocate relatively more C belowground with
increasing altitude (Soethe and others 2007).
Schrumpf and others (2001) quantified SOC stocks
of upper montane rain forests in Ecuador from
1850 to 2650 m asl and measured on average
21.5 kg C/m2. Schawe and others (2007) even
reported SOC stocks of 36.2 kg C/m2, as averaged
for 7 upper montane cloud forest sites between
2700 and 3300 m asl in Bolivia, which is 3 times as
high as observed here. Jobbagy and Jackson (2000)
also reviewed global SOC stocks in the top 1 m of
Figure 3. Correlations and regression functions between
bulk soil densities and C concentrations calculated for all
soil samples, separated into forest (filled circle), shrubland
(open circle), and grassland (inverted filled triangle) sites.
SOC Stocks Across Tree Line in Peru 67

grassland sites (13.2 kg C/m2), which were similar
to grasslands in the puna as measured here. But as
the puna soils here were on average only 32.5 cm
deep, puna SOC densities were about threefold
higher than the global average for grasslands. The
puna SOC stocks were also more than twice as large
as SOC stocks in pasture sites in montane Ecuador
(5.7 kg C/m2; Tian and others (1995)). In contrast,
Schrumpf and others (2001) measured SOC stocks
of 11.1 kg C/m2 in Ecuadorian grassland sites from
Figure 4. Box plots of
soil properties over total
soil depth of all sites
showing 10, 25, 75, and
90 percentiles, medians
and outliers for the
different vegetation types.
Capital letters indicate
significant differences
among groups (Kruskal–
Wallis one-way ANOVA
of ranks, P < 0.05).
Table 2. Comparison of Means, Standard Errors, and Variations Within Profiles of the Sampling Sites andAmong All Sites as Calculated from Coefficients of Variation
Property Biome Mean SE CV among
sites
CV within
sites
95% Confidence interval
within sites
SOC stock (kg/m2) Forest 11.83 1.49 0.33 0.41 0.30–0.51
Shrubland 14.7 1.44 0.34 0.35 0.25–0.43
Puna 11.91 0.79 0.36 0.37 0.30–0.42
C concentration (%) Forest 24.47 2.06 0.37 0.41 0.24–0.51
Shrubland 14.28 2.68 0.43 0.36 0.30–0.57
Puna 10.19 0.43 0.38 0.37 0.32–0.44
Bulk soil
density (g/cm3)
Forest 0.186 0.023 0.51 0.52 0.40–0.61
Shrubland 0.427 0.033 0.33 0.32 0.15–0.52
Puna 0.480 0.021 0.24 0.25 0.19–0.29
N stock (kg/m2) Forest 0.699 0.085 0.41 0.45 0.30–0.53
Shrubland 0.955 0.096 0.35 0.35 0.25–0.45
Puna 0.879 0.057 0.42 0.41 0.29–0.54
C/N Forest 17.2 0.7 0.13 0.13 0.10–0.17
Shrubland 15.9 0.5 0.08 0.08 0.05–0.10
Puna 13.9 0.2 0.08 0.08 0.05–0.11
Soil depth (cm) Forest 43.5 4.3 0.30 0.39 0.20–0.40
Shrubland 36.0 3.5 0.34 0.37 0.20–0.48
Puna 32.5 2.8 0.41 0.43 0.34–0.48
If the CV among the sites was outside of the 95% confidence interval of the CV for the individual profile sites, then the variability among sites was considered significantly larger.
68 M. Zimmermann and others

2845 to 3050 m asl, which are more similar to our
observations.
The large variance among SOC stocks suggest
that regional variations are substantial in Andean
TMCF, and in the absence of additional local spatial
information, single point measurements will have
limited use for large-scale interpolations of total
SOC stocks. Importantly, the measurements pre-
sented here sample steep areas of the landscape
which are often missed in other sampling protocols
and are probably more reliable estimates for mean
values in TMCF and puna grassland than the
studies reported above, simply because we sampled
a much larger area.
Variability of Soil Properties
To test whether the variability of soil profiles
within single sampling sites was different from the
variability among all sampled sites in one vegeta-
tion type, we analyzed the coefficients of variation
(CV) within and among sites. If the CV among the
sites was outside of the 95% confidence interval of
the average CV within the single sites, then the
variability among the sites was considered signifi-
cantly different from the variability of the soil
profiles within the sites. In all cases, CV values
among and within sites were not significantly dif-
ferent, but forest soils tended to have a larger CV
within the profiles of the single sites than among all
averaged sites (Table 2).
The larger variation within forest profiles might
be explained by micro-climatic and site-specific
characteristics such as slope and exposure (Schulp
and others 2008). We do not have climatic records
for each sampling site, but we measured the topo-
graphical site characteristics soil depth and slope.
Soil depth defines the maximal volume of SOC, and
the slope affects mainly the water supply for
vegetation and consequently biomass production.
The average soil depths for the three vegetation
types, forest, shrubland, and grassland were 43.5,
36, and 32.5 cm. Forest sites were steeper (average
relative slope 58 ± 7%) than the shrubland
(42 ± 6%) or grassland (33 ± 4%) sites, which is
typical of the entire study region with its steep
TMCF thinning out in the flatter puna. The SOC
and N stocks of all three vegetation types were
positively correlated with soil depth (r2 from 0.33
to 0.67, P < 0.05), but showed no significant
trends with slope (P values from 0.38 to 0.93)
(Table 3); soil depths and slopes at the sampling
sites were not correlated (r2 = 0.02, P = 0.28). The
correlations between soil depth and SOC stock
showed that soil depth was probably responsible for
the large variability in SOC stocks, and further soil
sampling campaigns should take into account the
greater depth of soils in forests to adapt the number
of sampling sites accordingly.
Altitudinal Changes in Soil Properties
Altitudinal variations integrate various environ-
mental parameters like temperature, moisture,
atmospheric pressure, radiation, and soil weath-
ering (Korner 2007), all of which influence the
input and accumulation of C in soils. Several
studies have demonstrated an increase in SOC
stocks across altitudinal ranges of about 1000 m in
tropical forests (Townsend and others 1995; Schr-
umpf and others 2001; Grafe and others 2008).
Larger SOC stocks at higher elevations were gen-
erally attributed to lower temperatures decelerating
soil organic matter decomposition more than
Table 3. Correlations Between SOC Stocks and Site Characteristics Soil Depths and Slopes
Soil depth (cm) Slope (%)
Regression SEE r2 P Regression SEE r2 P
SOC stock (kg/m2)
Forest SOC = 1.39 + 0.24*depth 5.34 0.49 <0.01 SOC = 8.78 + 0.062*slope 9.21 0.06 0.42
Scrubland SOC = 4.44 + 0.28*depth 3.34 0.47 0.04 SOC = 13.01 + 0.041*slope 4.55 0.03 0.68
Grassland SOC = 5.15 + 0.21*depth 3.21 0.55 <0.01 SOC = 12.00 - 0.003*slope 4.75 <0.01 0.93
All SOC = 4.55 + 0.21*depth 4.28 0.45 <0.01 SOC = 11.46 + 0.025*slope 5.97 0.01 0.38
N stock (kg/m2)
Forest N = 0.208 + 0.011*depth 0.347 0.33 <0.01 N = 0.481 + 0.004*slope 0.512 0.07 0.38
Scrubland N = 0.212 + 0.021*depth 0.203 0.56 0.02 N = 0.865 + 0.002*slope 0.305 0.02 0.74
Grassland N = 0.336 + 0.017*depth 0.198 0.67 <0.01 N = 0.860 + 0.001*slope 0.344 <0.01 0.81
All N = 0.391 + 0.012*depth 0.303 0.34 <0.01 N = 0.82 + 0.001*slope 0.386 <0.01 0.69
SEE standard errors of estimates.
SOC Stocks Across Tree Line in Peru 69

biomass production (Raich and others 2006;
Zimmermann and others 2009b). In contrast, the
forest SOC stocks reported here did not show any
significant change in altitude (Figure 5). This is
consistent with Schawe and others (2007) who
also did not detect any trend in SOC stocks with
Figure 5. Average site properties with standard errors in relation to altitude. The regression functions are also supplied,
and, where significant (P < 0.05*), the regression lines (long dashed lines for forests, mid-dashed lines for shrub, dotted lines
for grasslands, and solid lines for all data points).
70 M. Zimmermann and others
elevation in TMCF in Bolivia between 2700 and
3300 m asl. The reason for this observation might
be that the large variation in SOC stocks among
different micro-sites discussed above was larger
than any trend in SOC stocks with altitude.
Furthermore, the TMCF sampled here traversed
only 650 m in elevation, probably not enough to
reveal any trend with altitude.
The only vegetation type showing a significant
change in SOC stocks with elevation was the
grassland. This trend could be explained by the
decrease in soil depth with elevation, limiting plant
growth, rooting depth, and the potential to accu-
mulate SOC. Although soil depth in the forest also
correlated with altitude, SOC stocks were not cor-
related with elevation and thus soil depth is prob-
ably a correlating but not limiting factor in TMCF.
Surprisingly, soil depth in the shrubland vegetation
showed a significant inverse trend with altitude.
Carbon concentration, bulk soil density, and C:N
ratios were not correlated with altitude for forest or
grassland sites. The only significant increase with
altitude in bulk soil density was found in the
shrubland. Overall C concentration, bulk soil den-
sity, and C:N ratios were significantly correlated
with altitude, but these shifts with altitude were
because of changes in the dominant vegetation
rather than because of changes in elevation per se,
as the average values for each vegetation type were
significantly different (Figure 4).
As the reductions in soil depth with altitude were
similar for forests and grasslands, there was no
strong evidence for a strong impact of the presence
of vegetation on the development of soil depth. By
contrast, however, the vegetation played a major
role in affecting the character of the soil profile
below it, because the loss of woody vegetation
coincided with the disappearance of the Oh layer.
With the exception of peat bogs, Oh layers were
only found in forest and shrub-dominated sites.
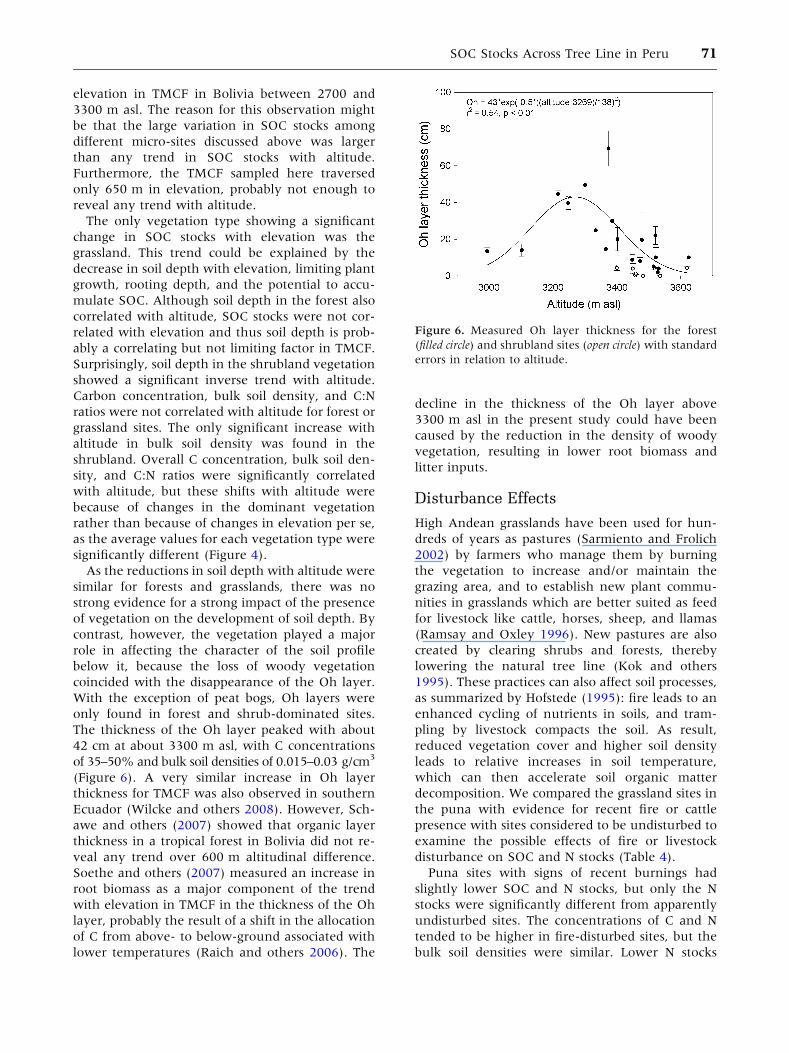
The thickness of the Oh layer peaked with about
42 cm at about 3300 m asl, with C concentrations
of 35–50% and bulk soil densities of 0.015–0.03 g/cm3
(Figure 6). A very similar increase in Oh layer
thickness for TMCF was also observed in southern
Ecuador (Wilcke and others 2008). However, Sch-
awe and others (2007) showed that organic layer
thickness in a tropical forest in Bolivia did not re-
veal any trend over 600 m altitudinal difference.
Soethe and others (2007) measured an increase in
root biomass as a major component of the trend
with elevation in TMCF in the thickness of the Oh
layer, probably the result of a shift in the allocation
of C from above- to below-ground associated with
lower temperatures (Raich and others 2006). The
decline in the thickness of the Oh layer above
3300 m asl in the present study could have been
caused by the reduction in the density of woody
vegetation, resulting in lower root biomass and
litter inputs.
Disturbance Effects
High Andean grasslands have been used for hun-
dreds of years as pastures (Sarmiento and Frolich
2002) by farmers who manage them by burning
the vegetation to increase and/or maintain the
grazing area, and to establish new plant commu-
nities in grasslands which are better suited as feed
for livestock like cattle, horses, sheep, and llamas
(Ramsay and Oxley 1996). New pastures are also
created by clearing shrubs and forests, thereby
lowering the natural tree line (Kok and others
1995). These practices can also affect soil processes,
as summarized by Hofstede (1995): fire leads to an
enhanced cycling of nutrients in soils, and tram-
pling by livestock compacts the soil. As result,
reduced vegetation cover and higher soil density
leads to relative increases in soil temperature,
which can then accelerate soil organic matter
decomposition. We compared the grassland sites in
the puna with evidence for recent fire or cattle
presence with sites considered to be undisturbed to
examine the possible effects of fire or livestock
disturbance on SOC and N stocks (Table 4).
Puna sites with signs of recent burnings had
slightly lower SOC and N stocks, but only the N
stocks were significantly different from apparently
undisturbed sites. The concentrations of C and N
tended to be higher in fire-disturbed sites, but the
bulk soil densities were similar. Lower N stocks
Figure 6. Measured Oh layer thickness for the forest
(filled circle) and shrubland sites (open circle) with standard
errors in relation to altitude.
SOC Stocks Across Tree Line in Peru 71

were thus significantly related to the presence of
fire, but not to grazing by cattle (Table 4); the N
and SOC stocks and the bulk soil densities were
similarly unaffected by the presence of cattle. These
observations are consistent with those of Harris and
others (2007) who showed in Argentinean grass-
lands that fire and grazing altered the N stocks, but
not the SOC stocks. They explained this effect by
fire- and grazing-induced changes in plant tissue
chemistry, which were then incorporated in the
plant–soil biomass cycle. However, other studies
have shown that grazing can decrease SOC stocks
in grasslands through shifts in soil temperature,
bulk soil density, and moisture content (Hofstede
1995), with faster annual shoot turnover leading to
a redistribution of SOC within the plant–soil cycle
(Reeder and Schuman 2002), or alterations in soil
aggregate stabilities through cattle trampling (Li
and others 2007). It is thus likely that grazing
intensity is a determining factor, suggesting further
that the puna sites in our study region might not be
overgrazed in terms of SOC accumulation. Fur-
thermore, the presence of cattle was not correlated
with burning, although this may be because of
small sample size or also because of the detection
method used (visual observation without known
historical grazing intensity).
Charcoal residues within soil profiles were only
found at 3 sampling sites in the forest. The average
SOC stock at the sites with charcoal was large, at
23.1 kg C/m2, significantly higher (Mann–Whitney
rank sum test, P = 0.04) than the average SOC
stocks in charcoal-free forest sites (10.2 kg C/m2).
However, SOC stocks in charcoal-free forest sites
were still not significantly different from SOC
stocks in shrubland or grassland sites (P > 0.05).
Two of the 3 sites where charcoal was found were
above 3300 m asl, which could mean that they
were burnt in the past to lower the tree line. Most
of the upper TMCF tree lines in the Andes are
thought to have been influenced in the medium-
term past (centuries) by human-induced fires
(Sarmiento and Frolich 2002). A reason for the
relative lack of large charcoal pieces in the sampled
soil profiles may be that hardly any wood was
charred during the fires. Ramsay and Oxley (1996)
showed that soil temperatures during fires in An-
dean grasslands were below 65�C, which does not
lead to charring of wood. Furthermore, wood from
forests might have been harvested as a fuel source
before fires were induced, reducing the overall
charcoal output from the burning process (Kok and
others 1995). In any case, a higher density of
charred residues from the roots of trees or shrubs
Table 4. Puna Sites Grouped According to Fire or Cattle Evidence, and Comparisons Between Means andStandard Errors as Calculated with t-Tests
Property Effect Mean SE N P
SOC stock (kg/m2) Fire 9.58 1.10 9 0.13
No fire 12.34 1.05 21
N stock (kg/m2) Fire 0.717 0.077 9 0.02*
No fire 0.920 0.082 21
C concentration (%) Fire 11.32 0.80 9 0.05
No fire 9.46 0.50 21
N concentration (%) Fire 0.84 0.06 9 0.15
No fire 0.68 0.04 21
C/N ratio Fire 13.5 0.3 9 0.29
No fire 13.9 0.3 21
Bulk soil density (g/cm3) Fire 0.474 0.035 9 0.93
No fire 0.496 0.030 21
SOC stock (kg/m2) No cattle 12.39 1.36 10 0.46
Cattle 11.09 1.00 21
N stock (kg/m2) No cattle 0.93 0.12 10 0.45
Cattle 0.83 0.07 21
C concentration (%) No cattle 9.60 0.80 10 0.42
Cattle 10.39 0.54 21
N concentration (%) No cattle 0.750 0.074 10 0.48
Cattle 0.756 0.040 21
Bulk soil density (g/cm3) No cattle 0.486 0.032 10 0.69
Cattle 0.485 0.031 21
*Significant differences (P < 0.05).
72 M. Zimmermann and others

might have been expected, suggesting that the
collection of charcoal samples solely by visual
inspection of soil profiles may not be a reliable
predictor for determining the extent of fires and its
effect on lowering the tree lines. Further scrutiny of
the soil samples for microscopic charcoal might
reveal more detailed information about the fire
history in the study area.
SUMMARY
Total SOC stock as determined from 596 soil cores
from 68 sites ranging from 2994 to 3860 m asl
across the tree line in the Peruvian Andes were
not significantly different among forest, shrub-
land, and grassland sites. The forest soils showed a
uniform distribution of SOC within the soil pro-
file, whereas the density of SOC in the grassland
decreased exponentially with depth. Variations in
SOC stocks among sampling sites could be partly
attributed to differences in soil depth, which may
also have masked any biophysical effects of ele-
vation. The stocks of SOC in TMCF and shrubland
vegetation were not correlated with altitude.
Organic layers reached a maximum thickness at
3300 m asl, where TMCF began to thin in terms
of stem density, and grade toward shrub-domi-
nated vegetation. Therefore, the expansion of
TMCF into former shrubland and grassland sites
might change the SOC distribution through al-
tered vegetation rooting and plant litter inputs
within soil profiles, but probably not the total
amount of SOC sequestered in these systems. The
presence of cattle and occurrence of fire appeared
to have no significant impact on the stocks of
SOC in the puna, and this may reflect low-
intensity agricultural land use in the region.
However, warming might lead to higher decom-
position rates of SOC and effect soils under all
three vegetation types.
ACKNOWLEDGMENTS
This study is a product of the ABERG consortium
(http://www.andesconservation.org). We thank
the Blue Moon Fund and the Gordon and Betty
Moore Foundation ‘Andes to Amazon’ Programme
for support. We especially thank Manu National
Park and the Peruvian Instituto Nacional de
Recursos National (INRENA) and the Amazon
Conservation Association (ACCA) for allowing ac-
cess to their sites. Luis Imunda Gonzales and stu-
dents from Wake Forest University and the
Universidad San Antonio de Abad, Cusco were
essential for the completion of this project.
REFERENCES
Arteaga A, Calderon GNE, Krasilnikov PV, Sedov SN, Targulian
VO, Velazquez RN. 2008. Soil altitudinal sequence on base-
poor parent material in a montane cloud forest in Sierra
Juarez, southern Mexico. Geoderma 144:593–612.
Bernoux M, Cerri C, Arrouays D, Jolivet C, Volkoff B. 1998.
Bulk densities of Brazilian Amazon soils related to other soil
properties. Soil Sci Soc Am J 62:743–9.
Bush MB, Silman MR, Urrego DH. 2004. 48,000 years of climate
and forest change in a biodiversity hotspot. Science 303:
827–9.
Calhoun FG, Smeck NE, Slater BL, Bigham JM, Hall GF. 2001.
Predicting bulk density of Ohio soils from morphology, genetic
principles, and laboratory characterization data. Soil Sci Soc
Am J 65:811–19.
Colwell RK, Brehm G, Cardelus CL, Gilman AC, Longino JT.
2008. Global warming, elevational range shifts, and lowland
biotic attrition in the wet tropics. Science 322:258–61.
Cramer W, Bondeau A, Schaphoff S, Lucht W, Smith B, Sitch S.
2004. Tropical forests and the global carbon cycle: impacts of
atmospheric carbon dioxide, climate change and rate of
deforestation. Tellus B 359:331–43.
Foster P. 2001. The potential negative impacts of global climate
change on tropical montane cloud forests. Earth Sci Rev
55:73–106.
Grafe S, Hertel D, Leuschner C. 2008. Estimating fine root
turnover in tropical forests along an elevational Transect using
minirhizotrons. Biotropica 40:536–42.
Harris WN, Moretto AS, Distel RA, Boutton TW, Boo RM. 2007.
Fire and grazing in grasslands of the Argentine Caldenal: effects
on plant and soil carbon and nitrogen. Acta Oecol 32:207–14.
Heuscher SA, Brandt CC, Jardine PM. 2005. Using soil physical
and chemical properties to estimate bulk density. Soil Sci Soc
Am J 69:51–6.
Hofstede RGM. 1995. The effects of grazing and burning on soil
and plant nutrient concentrations in Colombian paramo
grasslands. Plant Soil 173:111–32.
Houghton RA. 2003. Revised estimates of the annual net flux of
carbon to the atmosphere from changes in land use and land
management 1850–2000. Tellus B 55:378–90.
Janzen HH. 2004. Carbon cycling in earth systems—a soil sci-
ence perspective. Agric Ecosyst Environ 104:399–417.
Jobbagy EG, Jackson RB. 2000. The vertical distribution of soil
organic carbon and its relation to climate and vegetation. Ecol
Appl 10:423–36.
Kok K, Verweij PA, Beukema H. 1995. Effects of cutting and
grazing in Andean treeline vegetation. In: Churchill S, Balslev
H, Forero E, Luteyn JL, Eds. Biodiversity and conservation of
neotropical Monatne forests. New York: New York Botanical
Garden. p 527–39.
Korner C. 2007. The use of altitude in ecological research.
Trends Ecol Evol 22:569–74.
Leifeld J, Bassin S, Fuhrer J. 2005. Carbon stocks in Swiss
agricultural soils predicted by land-use, soil characteristics,
and altitude. Agric Ecosyst Environ 105:255–66.
Li XG, Wang ZF, Ma QF, Li FM. 2007. Crop cultivation and
intensive grazing affect organic C pools and aggregate stability
in arid grassland soil. Soil Tillage Res 95:172–81.
Norby RJ, Luo Y. 2004. Evaluating ecosystem responses to rising
atmospheric CO2 and global warming in a multi-factor world.
New Phytol 162:281–93.
SOC Stocks Across Tree Line in Peru 73

Post WM, Izaurralde RC, Mann LK, Bliss N. 2001. Monitoring
and verifying changes of organic carbon in soil. Clim Change
51:73–99.
Raich JW, Russell AE, Kitayama K, Parton WJ, Vitousek PM.
2006. Temperature influences carbon accumulation in moist
tropical forests. Ecology 87:76–87.
Ramsay PM, Oxley ERB. 1996. Fire temperatures and postfire
plant community dynamics in Ecuadorian grass paramo. Plant
Ecol 124:129–44.
Reeder JD, Schuman GE. 2002. Influence of livestock grazing on
C sequestration in semi-arid mixed-grass and short-grass
rangelands. Environ Pollut 116:457–63.
Sarmiento FO, Frolich LM. 2002. Andean cloud forest tree lines:
naturalness, agriculture and the human dimension. Mt Res
Dev 22:278–87.
Schawe M, Glatzel S, Gerold G. 2007. Soil development along an
altitudinal transect in a Bolivian tropical montane rainforest:
podzolization vs. hydromorphy. Catena 69:83–90.
Schrumpf M, Guggenberger G, Valrezo C, Zech W. 2001.
Development and nutrient status along an altitudinal gradient
in the south Ecuadorian Andes. Die Erde 132:43–59.
Schulp CJE, Nabuurs GJ, Verburg PH, de Waal RW. 2008. Effect
of tree species on carbon stocks in forest floor and mineral soil
and implications for soil carbon inventories. For Ecol Manag
256:482–90.
Shaver GR, Canadell J, Chapin FS, Gurevitch J, Harte J, Henry
G, Ineson P, Jonasson S, Melillo J, Pitelka L, Rustad L. 2000.
Global warming and terrestrial ecosystems: a conceptual
framework for analysis. Bioscience 50:871–82.
Soethe N, Lehmann J, Engels C. 2007. Carbon and nutrient
stocks in roots of forests at different altitudes in the Ecuado-
rian Andes. J Trop Ecol 23:319–28.
Sombroek WG, Nachtergaele FO, Hebel A. 1993. Amounts,
dynamics and sequestering of carbon in tropical and sub-
tropical soils. Ambio 22:417–26.
Tian G, Brussaard L, Kang BT. 1995. Breakdown of plant resi-
dues with contrasting chemical compositions under humid
tropical conditions: effects of earthworms and millipedes. Soil
Biol Biochem 27:277–80.
Townsend AR, Vitousek PM, Trumbore SE. 1995. Soil organic
matter dynamics along gradients in temperature and land-use
on the island of Hawaii. Ecology 76:721–33.
Trumbore S, da Costa ES, Nepstad DC, de Camargo PB, Martinelli
L, Ray D, Restom T, Silver W. 2006. Dynamics of fine root
carbon in Amazonian tropical ecosystems and the contribution
of roots to soil respiration. Glob Change Biol 12:217–29.
Walther GR, Post E, Convey P, Menzel A, Parmesan C, Beebee
TJC, Fromentin JM, Hoegh-Guldberg O, Bairlein F. 2002. Eco-
logical responses to recent climate change. Nature 416:389–95.
Wilcke W, Oelmann Y, Schmitt A, Valarezo C, Zech W, Homeier
J. 2008. Soil properties and tree growth along an altitudinal
transect in Ecuadorian tropical montane forest. J Plant Nutr
Soil Sci 171:220–30.
Zimmermann M, Meir P, Bird MI, Malhi Y, Ccahuana A. 2009a.
Litter contribution to diurnal and annual soil respiration in a
tropical montane cloud forest. Soil Biol Biochem 41:1338–40.
Zimmermann M, Meir P, Bird MI, Malhi Y, Ccahuana A. 2009b.
Climate dependence of heterotrophic soil respiration from a
soil translocation experiment along a 3000 m altitudinal
tropical forest gradient. Eur J Soil Sci. doi:10.1111/j.1365-
2389.2009.01175.x.
74 M. Zimmermann and others