
2007-2008AnnualReport.pdf - Achievement Centers for Children

Impacts of Radio-Identification on Cryo-Conservation Centers
Sylvain HOUSSEMAN
Nabil ABSI Stéphane DAUZERE-PERES
Dominique FEILLET
Ecole des Mines de Saint-Etienne CMP - Site Georges Charpak 880, Avenue de Mimet
F-13541 Gardanne France
November 2009
Working paper ENSM-SE CMP WP 2009/15
This paper deals with using simulation as a decision support tool for estimating the
impact of Radio Frequency IDentication (RFID) technologies within biological sample
storage areas (called biobanks). Several indicators, including inventory reliability or
human resource utilization, are compared and discussed for different scenarios of use
of the technologies. A special emphasis is put on the so-called re-warehousing activity,
which RFID makes possible and consists in reassigning tubes to empty sockets when
boxes are emptied. For this particular activity, optimization algorithms are developed
and embedded in the simulator. Results demonstrate the potential interest of RFID in
biobanks and the value of simulation for estimating and optimizing such complex
socio-technical systems.
CMP
GEORGES CHARPAK
CENTRE MICROELECTRONIQUE DE PROVENCE SITE GEORGES CHARPAK

pdfauthor
IMPACTS OF RADIO-IDENTIFICATION ONCRYO-CONSERVATION CENTERS
Sylvain Housseman, Nabil Absi,Dominique Feillet and
Stephane Dauzere-PeresEcole des Mines de Saint-Etienne
CMP Georges CharpakF-13541, Gardanne, France.
[housseman, absi, feillet, dauzere-peres] at emse.fr
This paper deals with using simulation as a decision support tool for estimating the impact ofRadio Frequency IDentification (RFID) technologies within biological sample storage areas (called
biobanks). Several indicators, including inventory reliability or human resource utilization, are
compared and discussed for different scenarios of use of the technologies. A special emphasis isput on the so-called re-warehousing activity, that RFID makes possible and which consists in reas-
signing tubes to empty places when boxes are emptied. For this particular activity, optimization
algorithms are developed and embedded in the simulator. Results demonstrate the potential inter-est of RFID in biobanks and the value of simulation for estimating and optimizing such complex
socio-technical systems.
Categories and Subject Descriptors: L.N1.N2 [Category]: Category and Categoriz—documentation; L.N1.N2[Information Systems Applications]: General; I.7.2 [Text Processing]: Document Preparation—languages;photocomposition
General Terms: Documentation, Languages
Additional Key Words and Phrases: RFID, Healthcare, Simulation, Biobanks
1. INTRODUCTION
Trying to estimate the impact of introducing auto-IDentification technologies in a logisticprocess is a complex topic. The possibilities offered by these technologies may indeed af-fect the process in many different ways, at several decision levels, sometimes even allowingfor drastic changes. Simulation offers a practical tool for addressing these questions with-out referring to costly and very focused pilot studies. This paper proposes to use simulationto estimate the impact of introducing Radio Frequency IDentification (RFID) technologieswithin biobanks. This study is part of the so-called MISTRALS project, involving in-dustrial companies (Tagsys, IBM, Psion Teklogics and SPS); two French health structuresdeveloping a biobank activity: the Institute Paoli-Calmettes (IPC), in Marseilles, and theteaching hospital of Nice (CHU-N); and two research departments of the Ecole NationaleSuperieure des Mines de Saint-Etienne.
Pilot plants and demonstrators, which can be considered as real-life simulators, are cer-tainly the best way to assess the behavior of a contactless communication system within aparticular environment, even though they are expensive, potentially risky and hardly exten-sible [Royston 1999]. Furthermore, they are able to provide very precise information onthe system (e.g., times captured by RFID) that can help defining acute parameters for sim-ulating relatively similar processes [Boginski et al. 2007]. In the case of the MISTRALSproject, the development of a demonstrator is scheduled. Unfortunately, at this stage of the
ACM: Transactions on Modeling and Computer Simulation, Vol. ?, No. ?, ?? 20??, Pages 1–25.

2 · S.Housseman, N.Absi, D. Feillet and S. Dauzere-Peres
project, the demonstrator is still not available. As a consequence, the use case presented inthis paper is based on forecasted and estimated values.
1.1 What is Radio IDentification
RFID is the generic acronym for Radio Frequency IDentification (or Radio FrequencyIdentification Devices). Smart objects are assets that are tagged with an RFID transponder(or tag), and thus can transfer and record information without any human action. Induc-tively coupled RFID systems work as follows: a base-station antenna sends electromag-netic waves that are captured by the RFID tag’s antenna. These waves allow empoweringthe tag’s chip, which modifies the signal. The reader’s antenna decrypts the modificationsand thus deduces the information embedded in the tag [Hedgepeth 2007]. Depending onthe technology, different frequency bands, ranging from Low Frequency (125 kHz) to Su-per High Frequencies (5.8 GHz), can be used, with different data transfer rates and readingcapabilities. New generations of RFID tags, readers and protocols allow for large amountof data (a few kilobytes), multiple reading and writing, on-chip sensors to be added [Mileset al. 2008] and allow objects to communicate with each other. The use of RFID is grow-ing fast. IDTechEx [IDTechEx 2009] estimates that 2.35 billion tags will be sold in 2009,versus 1.97 billion in 2008, 1.74 billion in 2006 and 1.02 billion in 2005. The appearanceof standards and protocols, the improvement of the technologies and manufacturing tech-niques and the large spectrum of applications in many different domains boost demands,thus reducing price of RFID technologies.
1.2 Uses and impact studies of RFID
A prominent domain of application for RFID technologies is supply chain management.Applications are numerous including simple display of information, recording of statisticsfor planning and scheduling, traceability, inventory management, order verification andquality control. RFID is however applied to many other domains and new applicationsappear at a very high rate, notably in healthcare contexts. The pressure for a better trace-ability in this domain (though already of obvious importance) is growing fast for severalreasons: new legislations in France force a new drug pedigree using at least DataMatrixcodes, the Activity Based Costing (ABC) principle starts being effective in French pub-lic hospitals (FHF, 2008), the USA are facing their third malpractice crisis, physiciansstruggling to acquire malpractice affordable insurances [Dalton et al. 2008] while a bettertraceability could reduce medical errors and improve the tracking of their causes. In thiscontext, crossing the technological pitch of using smart objects is clearly an issue. In 2008,10 millions of tags were used for drugs, and 15 millions for other healthcare applications.Many obvious possibilities have already been addressed like: automatic verification of thecompliance to prescription, automatic checking of use-by dates or sterilization processing,detection, management and sharing of devices. The database of IDTechEx contained 217use cases in October 2009. Recently RFID technology was adapted allowing tags to resistgamma ray sterilization [Andrechak and Wiens 2006], which may allow more applications,like tagging standard cryotubes and re-sterilizing them afterwards. One should also men-tion and insist on the role that RFID could play against drug counterfeit. The medical areaaccuses a high counterfeit proportion, attaining the alarming rate of 70% in certain regionsof the world, while the overall proportion could be more than 10%, representing a mar-ket supposed to attain 75 billion USD in 2010 [WorldHealthOrganization 2006] [IMPACT2006]. RFID tagging is advanced as a solution to avoid or significantly reduce ”grey mar-ACM: Transactions on Modeling and Computer Simulation, Vol. ?, No. ?, ?? 20??.

Impacts of Radio-Identification on Cryo-Conservation Centers through Simulation · 3
ket” and counterfeit reselling, notably compared with the different kinds of data-matrices.
Many studies try to estimate the impacts of RFID technologies in retail stores and supplychains, including the possibility of reducing the stocks (thanks to inventory accuracy inreal time [de Kok et al. 2007]), the bullwhip effect or shoplifting [Rekik 2006] [Sarac et al.2008]. Some studies are based on analytical models while others use simulation. One ofthe main difficulties is due to the complexity of the systems, the presence of unpredictableevents and the many device and organizational configurations. Other important difficulties,raised for example by [Gaukler et al. 2007], are that some parts of the systems can be usedfor other applications, that information can be beneficial for different stakeholders and thatthe costs should be shared in consequences.
Finally, we can read in a recent paper [Lin 2009] that ”the efforts for a complete adoptionof RFID technology are usually underestimated and the real benefits are optimisticallyoverestimated”; this is in this context that we propose a re-configurable simulation modelthat aims at estimating the impacts of implementing RFID within a biobank.
1.3 RFID and biobanks
Biobanks, or more generally Biological Resource Centers, have to operate the tasks of re-ceiving, transforming, storing and making available biological (human) samples and theirderivatives. The biobanks considered in this study stock samples at very low temperatures(-196 ◦C), in nitrogen tanks. Samples are intended to be used within research programsand for diagnosing or evaluating the risk to develop cancer. Biobank activities can be re-garded as intermediate between stock management and health delivery. Like most of thehealth production systems, many human manipulations happen. Traceability is undoubt-edly of importance for biobanks and smart objects are natural candidates for contributingto improvements in this direction.Those observations make the biobank case interesting asit reflects the possibilities RFID can bring in more general contexts.The RFID technology we want to test needs tagged cryotubes to be read individually, with-out endangering the patient’s privacy and with the possibility to read and write data. Thecryotubes will be put into boxes, themselves stocked in nitrogen tanks. Low-range (HighFrequency, 13.56MHz) technology was chosen as a prerequisite. There are no a prioriproofs that the information written on the tags will be kept if stocked for years in a nitro-gen tank. [Bettendorf et al. 2008] however show that an RFID tag stocked at a very lowtemperature for 18 months can still be read. Accelerated physical and thermal aging tests[Cauchois 2008] are currently being conducted at the Ecole des Mines de Saint-Etienne.Tags are attached to cryotubes and tested conserved for the equivalent of 10 year storage ata very low temperature. The tests include reading tests, where it has been observed that thetags can be read a few seconds after they are pulled out from the nitrogen freezers, theirawaking temperature being -158.5◦C.
Another important issue is the impact of electromagnetic interferences on medical ma-chines and human cells. [Togt et al. 2008] point that incompatibility problems can makesome material configurations impossible. [Hohberger and Tsirline 2009] show that longterm exposure of red blood cells and platelets to the 13,56MHz RFID technology has noadverse impact. [Arumugam and Engels 2009] conducted tests showing that the absorptionrate of a Ultra High Frequency RFID at 10 cm is above the allowed limits for safe expo-sure to RF radiation in public as allowed by the Federal Communications Commission.Wireless technologies still lever ethical and health related questions, but the application of
ACM: Transactions on Modeling and Computer Simulation, Vol. ?, No. ?, ?? 20??.

4 · S.Housseman, N.Absi, D. Feillet and S. Dauzere-Peres
HF-RFID in biobanks is technically conceivable.
In biobanks, one can see at least two possible advantages of implementing RFID. First,automatic, acute and ubiquitous traceability of initial and finished products, devices, andmayhap persons could help reducing the number of miss-identification incidents and re-trieval problems. Secondly, RFID could allow a better use of the storage area. In manybiobanks (and true for the two biobanks involved in the project), sockets left empty becauseof handover requests are not reused and many boxes of cryotubes in nitrogen tanks tendto contain more and more empty sockets. It is indeed considered that re-warehousing istoo risky as it might expose samples to repetitive and uncontrolled changes of temperature.RFID should support this process. This possibility is all the more interesting given that theactivity of biobanks seems bound to increase in the next few years. The number of cancersis indeed growing as the population is getting older and because some recent technologiesand habits may be triggering factors. Also, the number of handover requests may increasebecause of new techniques like toxicogenomics, the use of progenitor cells and cord-blood,or the appearance of on-line sample catalogs [e cancer.fr 2007].
The number of possible device configurations and resulting organizational scenarios islarge, thus justifying the use of simulation for testing some of them. The dynamic aspectof health production systems, its importance in the appearance of errors, as pictured by the”Swiss cheese model” of system failures [Reason ], and the fact that RFID technologies canbring up new activities, are other reasons that led us to use an approach based on discreteevent dynamic simulation (DEDS). The virtual system can thus include the appearance ofincidents and a possibility for them to be rectified before accidents happen.
The originality of this study lies in:
—the studied production system, a complex socio-technical system where errors may oc-cur,
—its modeling permitting the implementation of different material and organizational sce-narios including smart objects,
—the study of a new activity, namely re-warehousing, allowed by RFID,
—the combination of optimization and simulation for scenarios including re-warehousingactivity.
This article is decomposed as follows: Section 2 describes precisely biobank processes,insisting on the possible malfunctions and some RFID-related forecasted improvements,including the description of the re-warehousing activity. Section 3 presents the simulationapproach for this study, describes the tested scenarios and the optimization algorithm forthe new activity, and presents the considered performance indicators. Section 4 describesour computational experiments, presents the parameters of the simulation and dicusses theresults. The last section is a conclusion leveraging future research perspectives.
2. BIOBANK FLOW DESCRIPTION AND RFID RELATED IMPROVEMENTS
In this section we describe the mains steps undergone by a biological sample in biobanks,from the sampling to the shipment to final users. This description is generic, it includesACM: Transactions on Modeling and Computer Simulation, Vol. ?, No. ?, ?? 20??.

Impacts of Radio-Identification on Cryo-Conservation Centers through Simulation · 5
transformation protocols (like DNA extraction), transitory and final storages. These pro-cesses were defined in common with the IPC and the CHU-N. In these processes, papersheets are associated with samples. Besides this description, we emphasize the problemsthat might occur during a sample processing and the potential improvements that could beachieved when introducing RFID technologies.
Interest area
(inside the biobank)
Transitory
box is full?
Sampling of a biological specimen:
Packaging and identification
Reception in a biobank:
state and datasheet checking
Transformations:
multiple aliquots
Storage in a
transitory box of cryotubes
Handover processing (samples
and their related datasheets)
Reception of the
ordered samples
Transport
Transport
Reception of a
handover request
Inventory of the
concerned box(es)
Database fulfilment Storage in the "definitive"
fridge or tank
2 3 4
5
6
Execute the re-
warehousing algorithm
A box can be
dispatched?
Dispatch the box
Use a security rack
and acquire a new one
1
Weekly planned
re-warehousing activity
Yes
Yes
Yes
No
No
No Storage
area is full?
Fig. 1: Biobanks processes diagram
The main advantages for using RFID technologies instead of bar-codes are: no needof direct line of sight, simultaneous data capture, data storage potential, longer distanceof reading, and a possible resistance to harsh environments. These two last points arecontroversial since some environments (metal, water) could prevent radio communication;for these cases special tags and packagings are required, and the reading distance highlydepends on the technology and devices that are used.
Six main steps were identified during a sample life as depicted in Figure 1. The firstone is the act of sampling (1), including the preparation of needed tools and containers.It does not necessary take place inside the biobanks but samples have to be linked to pa-tient identity. The first process inside the biobank is the reception of the original sample(2). This sample is transformed (3), cut out or separated into multiple samples calledaliquots in the sequel. Aliquots are conserved (4) generally at a very low temperature, andsometimes inside paraffin or formalin, depending on the type of sample. The next step is
ACM: Transactions on Modeling and Computer Simulation, Vol. ?, No. ?, ?? 20??.

6 · S.Housseman, N.Absi, D. Feillet and S. Dauzere-Peres
the processing of a handover request (5) that can be dedicated to a diagnosis process ora research experiment. The last process (6) is the reception of the requested aliquots bythe end-user. These aliquots must be linked to the patient’s information but not his identity.
In the following subsection, we jointly describe in detail all the processes and the im-pacts that RFID could have at the operational level. The new activity of re-warehousingallowed whith RFID technologies will be described in Subsection 2.2.
2.1 Detailed description of the processes
The transportation of a biological sample (Step 1) must observe specific conditions re-garding transportation time, packaging and temperature. This sample can arrive through apneumatic transportation device or be carried by a human. The current information sys-tem does not allow important information to be retrieved, such as transportation duration,physical shocks, and cold chain failure. The data associated with the sample are also gen-erally handwritten and are sometimes received after the biological piece, which can lead toidentification errors. RFID technologies can secure this process. They allow capturing thetemperature from a sensor directly linked to the sample during the transportation process.The automatic read/write function allows the traceability of the sample and then reproduc-ing the transportation conditions (temperature, shocks, duration, etc.). A common databaseupdate allows information related to the sample to be modified even if it has already beensent.
When a sample is received in the biobank (Step 2) a storage ID is assigned and its stateand associated data are checked. Then, the required protocols and transformations intoaliquots are performed by anatomopathologist physicians and technicians (Step 3). Thetransformation protocols retained for modeling are DNA and RNA extractions, white-cells(that are also part of the previous ones), blood serum, plasma, and viable cells. Some ofthese protocols are different whether the arriving sample is blood or marrow. Transforma-tions may take several days (e.g., in case of cellular culture) which may create identificationerrors, especially as the manipulator may change. One of the only ways for differentiatingpathological and healthy aliquots is based on the color of the tube caps. We note that tubecaps could be inverted, and then create diagnosis errors that could have been avoided bysaving the data directly on a transponder or in the linked database.
Once transformed and correctly packaged, the sample’s aliquots are stored (Step 4). Inthis study, we only consider the very low temperature conservation case. The packagesgenerally used are cryotubes, stocked in boxes of variable capacity. For the time being,technicians manually input the data related to the sample and its aliquots into the infor-mation system (IS), which is also an error prone process. Automatic information transferusing auto-ID technologies could reduce errors. At every check point, data could be sentto the IS and then provide a better traceability of the cryotubes, including timestamps thatcan validate the respect of the cold chain. With regard to Step 4, aliquots are first stockedin temporary boxes classed by organs and/or pathology types. Once full, these boxes areinventoried by two employees. The position of every cryotube (and of the sample it con-tains) is copied from the box’s information sheet to the IS. This process can take up to 40man-minutes. It is important to note that even if the tubes are barcoded, employees preferACM: Transactions on Modeling and Computer Simulation, Vol. ?, No. ?, ?? 20??.

Impacts of Radio-Identification on Cryo-Conservation Centers through Simulation · 7
to transcribe information, notably because of the frost on cryotubes. With an RFID reader,the reading time can be reduced to 6 seconds, even though a basic RFID reader cannot de-fine the position of the cryotubes in the box. Nevertheless, new prototypes (so-called X/Yantennas) allow determining the position of each cryotube and thus transferring the relatedinformation directly to the IS. Such a reader would automate the manual copy of infor-mation from the datasheet to the IS and avoid copy errors. This reader has been observedinventorying boxes in 30 seconds. X/Y antennas also give an opportunity for a new activitywithin the biobank, consisting in the re-use of emptied sockets. Indeed, this activity needsshort and effective inventory processes. This new activity will be detailed in Subsection2.2.
The accuracy of the IS is especially important when a handover request is processed(Step 5). If an error in a cryotube location occurs, the employee has to look for the miss-ing cryotube at ambient temperature, which will slowly deteriorate the cryotubes. At theend-user reception point (Step 6), it is important to associate every cryotube sent with itsinformation datasheet. An error during this process may distort the pharmaceutical re-search or make the diagnosis wrong and lead to reverse medical treatments. At the presenttime, the double checking principle is used at different steps to reduce all these errors. Thisprinciple reduces significantly error probabilities [Bonnabry 2007]. Inserting an RFID tagto every cryotube could make the biological samples and their related information insepa-rable. In this study, we focus on this way to use tags. Among the diverse possibilities ofintroducing RFID in biobank processes, we thus consider that tags are associated with allthe tubes, including the arriving samples (Step 1) and cryotubes (Step 4), when aliquotsare stored. The information leafs can be replaced by on-screen information, shall it be ona Wireless RFID reader or a workstation monitor. Recall that our study only considers theHF-RFID technology, as explained in Subsection 1.3.
All these observations make the biobank case interesting as it reflects the possibilitiesRFID can bring in more general contexts. The next subsection presents an activity enabled,or at least highly improved, by contactless technologies.
2.2 A new activity: re-warehousing
Despite the fact that the purpose of storing cryotubes in biobanks is eventually to use themin the future, and thus that their sockets can be expected to be cleared one day, reusingthese sockets is not necessarily anticipated in biobanks. Actually, this possibility was notconsidered in the two biobanks involved in this study. A first reason was that the requestsof cryotubes finally remained relatively unfrequent in these biobanks. A second reason wasthe reluctance to handle cryotubes and therefore expose them to ambient temperature. Theforecasted increases both in the number of cryotubes to store and in the number of samplerequests impose a better management of the storage capacity. Reusing emptied socketsthen might become a necessity.
By improving the reliability of the information system and by allowing quick recogni-tion of samples, RFID gives the possibility of reassigning safely tubes in sockets whenneeded. In this section, we investigate this issue. First, we describe the constraints to con-sider. Then, we discuss procedures to follow for this process.
ACM: Transactions on Modeling and Computer Simulation, Vol. ?, No. ?, ?? 20??.

8 · S.Housseman, N.Absi, D. Feillet and S. Dauzere-Peres
The main constraint, StayFrozen, deals with the time limit that a sample can be leftout of its fridge. This constraint is the main reason why biobanks do not reallocate theemptied sockets for the time being. Indeed, without an effective technology, the durationof the inventory process and, consequently, the risks of deteriorating samples and makingmistakes, are high. We denote TMAX the maximum acceptable time of exposure to ambienttemperature for a cryotube. When this time is spent, the temperature of the sample iscritical and it has to be stored back at low temperature immediately. Note that severalassumptions are made here. First, we consider that the time limit TMAX does not dependon the sample type. Secondly, we do not take into account the fact that a cryotube doesnot recover its temperature immediately when stored back. Indeed, it is clear that timelimit TMAX is excessive if a sample that has just been stored back is taken out again. Withthis assumption, we consider that the chances that a cryotube will repeatedly be taken inand out are very limited in an optimized process. Note that while this assumption seemsreasonable for simulation, it certainly has to be carefully reconsidered for the real process.
A second constraint described by the practitioners, consists in maintaining the aliquotsof a sample in the same box side by side. This constraint follows from existing organi-zational processes that ensure keeping at least one aliquot for a patient diagnosis. Whenintroducing auto-ID technologies, the information system is however supposed to be suf-ficiently accurate to detect this case. For a better optimization of the storage capacity, werelax this constraint.
The third constraint is very similar to the previous one. The inventory is managed so thatboxes only contain samples of a same type. This policy allows samples to be found easilywhen they are in transitory boxes. It allows also manipulating less boxes when numeroussamples of the same kind are requested. Contrary to the previous constraint, RFID does notnecessarily remove this constraint. As a consequence, it will be considered in our modeland be called BoxesPerKind.
The last constraint is related to the maximum level of nitrogen in the room. When tanksare opened for storing or unstoring boxes, nitrogen evaporates. When a given level of ni-trogen in the storage room is reached, an alarm warns the staff to evacuate. This constraintcould be converted into a maximum number of boxes that could be stored or unstored whenreassigning cryotubes in sockets. This constraint seems however rather marginal as longas the complete (or at least a large part of the) bank is not re-optimized. Consequently, wedo not include it in our model.
Considering the above constraints, we propose the following scenario to perform there-warehousing activity. It sounds secure and acceptable for health professionals:
—All boxes from/in which cryotubes will be removed/inserted are first taken out of thefridges by an employee;
—The employee then performs the moves of cryotubes that empty the maximum numberof boxes, considering the StayFrozen and BoxesPerKind constraints; every move comeswith an inventory update;
—Once finished, non-empty boxes are stored in the fridges;
Note that this procedure should also limit the evaporation of nitrogen and prevent frommanipulating repeatedly some boxes in and out (as assumed when modeling in a simplifiedmanner the StayFrozen constraint).ACM: Transactions on Modeling and Computer Simulation, Vol. ?, No. ?, ?? 20??.

Impacts of Radio-Identification on Cryo-Conservation Centers through Simulation · 9
Besides deciding how to proceed when the decision is taken to optimize the storage area,one has to define how this activity is triggered. We propose to apply the two followingrules:
(1) A certain amount of time is scheduled in the week for this activity, e.g., every Tuesdayevening (trigger 1, or also Planned trigger);
(2) All the tanks are full and the system needs to empty some boxes in order to accept newcryotubes (trigger 2, or also Emergency trigger).
Other possibilities would have been for example to consider the average level of fragmen-tation of the boxes, to detect complementary pairs of boxes (in the sense that the two boxescontain a total number of tubes of same type that precisely corresponds to the size of onebox), to schedule re-warehousing in idle time periods, etc.
The literature on similar activities is very limited and only concerns the storage of prod-ucts in industrial warehouses. According to [Garfinkel 2005], [Sadiq 1993] proposes theonly approach addressing the problem of periodically reassigning stock items to storagelocations. The author develops a heuristic method called ”Stock Location Assignment Al-gorithm”, based on the so-called HYCLUS clustering algorithm. The scarcity of literatureon this subject can be explained by the fact that products are generally not identified atthe item level. Furthermore (and consequently) a location is assigned for a long periodof time to a category of products, products are picked up with policies like First In FirstOut (FIFO). Actually, storage locations mainly change with the arrival of new types ofproducts. Decisions are then taken manually, without any decision-support tool.
3. SIMULATION APPROACH
Biobanks can be described as particular inventory management systems, happening in acomplex environment, involving important reliability and safety issues as well as humanoperations. Incident recovery and alarm possibilities, automated control processes, samplearrival variability are dynamic parts of the system we must be able to model and observe.The presence of repetitive human operations also leads to a particular interest in Perfor-mance Shaping Factors (PSFs) modeling.
[Kleijnen 2005] distinguishes four kinds of simulation approaches that could be usedfor supply chain management and optimization: spreadsheet simulation, system dynamics,discrete event dynamic systems (DEDS) and business (or management) games. In the faceof the difficulties to be tackled, DEDS appears as the most appropriate candidate for ourstudy. [Kleijnen 2005] suggests that DEDS permits a more acute modeling than SystemDynamics. Its abilities for including individual events and incorporating uncertainties arecertainly attractive features considering our case study. [Borshchev and Filippov 2004]also suggest that DEDS is appropriate for mesoscopic studies of a system, like supplychains, call centers or emergency departments, even though it is not the only possibility.
A complementary possibility for studying the introduction of RFID in biobanks wouldhave been to use Multi-Agent Systems, as different individual profiles can lead to differentreactions, perception of alerts and processing adaptations. The importance of the interac-tions between employees is however relatively limited in the system we study and the effortrequired to develop a Multi-Agent System would not necessarily have been significantlyrewarded compared to the use of DEDS only.
ACM: Transactions on Modeling and Computer Simulation, Vol. ?, No. ?, ?? 20??.

10 · S.Housseman, N.Absi, D. Feillet and S. Dauzere-Peres
3.1 Process modeling
Every process is described with a set of three subprocesses:
—The most important subprocess is the ’Medical act’ (manipulation, cutting-off, transfor-mation of samples, handover preparations, etc.).
—The second subprocess concerns the ’Information assets’. It consists for example inwriting the status (date and hour), the type and the ID of the sample, the aliquot num-ber, etc. The use of auto-ID technology will modify these subprocesses impacting theprocessing time and error probabilities.
—The last process is called ’Control’. Errors are the most critical problems in health-related production systems. As a consequence, most of the processes include control,generally through double checking: additional employees are requested to superviseerror-prone activities. This multiple checking is supposed avoiding 85% of the incidents[Bonnabry 2007]. With RFID technologies, control subprocesses completely change,as double checking can be removed. Human resource utilization can be reduced andpercentage of errors decreased.
These subprocesses are interconnected through precedence and coordination rules. Forexample, the ’Inventory box’ process, happening when a transitory box is full and aboutto be stored, contains an ’Information assets’ subprocess that consists in sending the in-ventory leaf to be written in the IS. Before starting, this subprocess needs the inventoryprocess to be finished for the specified box. The ’Control’ subprocess consists in doublechecking, which must be simultaneous to the ’Medical act’.
3.2 Scenarios
The model developed is designed to simply and automatically modify parameters whenevaluating multiple scenario configurations. The following material scenarios are tested:
—”Current scenario” (Curr.Scenar), where paper sheets are associated with samples. NoRFID technology is used. This scenario corresponds to the existing situation at the IPCand at the CHU-N.
—”RNA Automaton” (RNA Auto.), where we added an RNA extraction machine. Withoutthis machine, RNA extraction requires 3 hours of manual labor, outside the clean areaof the biobank. The machine, that can be installed in the clean area, takes the sametime but requires human actions only when launching the process, using 20 minutes ofhuman time for 6 to 12 sample transformations. While not related to RFID, this scenariois implemented as a part of the validation of the simulation modeling. Indeed, the IPChas recently introduced these machines and is evaluating their impact.
—”Smart cryotubes and pen-size antenna”(RFID & penRder), where RFID tags are at-tached to the tubes. Data sheet information are then accessible from the RFID labels,and the information are transmitted to the IS without manual copy. The pen-size an-tenna allows the inventory of boxes by pointing the cryotubes one by one. We estimatedthat the average time needed is reduced from 24 to 8 minutes, with one human resourceinstead of two.
—”Matrix reader’s antenna” (RFID & 2DRdr), which consists of using the X/Y antennainstead of the pen-size antenna. Inventory of a whole box is then allowed in 2 minutes,
ACM: Transactions on Modeling and Computer Simulation, Vol. ?, No. ?, ?? 20??.

Impacts of Radio-Identification on Cryo-Conservation Centers through Simulation · 11
including the time to set the box parameters in the appropriate software and inventorythe box.
3.3 Re-warehousing activity
In this subsection we describe the re-warehousing activity. This activity being new, wehave to entirely define its process. As explained in Section 2, it consists in three steps:taking out the selected boxes, moving tubes between boxes in order to empty boxes whileupdating the database information, and stocking the non-empty boxes in their tanks. Thisprocess involves three kinds of decisions for which we are going to define rules. The firsttype is to select the boxes to be taken out and their ordering. The second type is to definethe set of tube movements. The last type is the ordering of non-empty boxes when stockingthem back.
Let us first consider the box selection and ordering decisions. We consider that a givenconstant time tbox is needed to destock or restock a box.
PROPERTY 3.1. An optimal solution exists where boxes that will receive tubes are de-stocked before boxes that will be emptied.
PROOF. First note that there is no interest in together adding and removing tubes from abox. Note also that removing tubes from a box is only interesting if it permits to empy thebox. Boxes that are destocked thus either are emptied or receive new tubes (keeping thetubes initially present). For the sake of clarity, we introduce some notation. The destockingand restocking times of a box b in a solution are denoted td and tr, respectively. A pair(t, t ′) is said to be a pair of compatible dates if destocking a box at date t and restocking itat date t ′ is valid against the StayFrozen constraint (considering the tubes initially presentin this box). We draw the reader’s attention on the fact that if a box bi receives tubes froma box b j, then (td
j , tri ) must be a pair of compatible dates.Consider an optimal solution and
suppose that there exists two boxes bi and b j, such that bi is emptied, and b j receives tubes.Suppose also that bi is destocked just before b j (td
i = tdj − tbox). In what follows, we will
show that b j can be destocked before bi without deteriorating the initial solution. Fourcases have to be considered,
(1) if tubes from box bi are moved into box b j then switching boxes bi and b j does notinvalidate the initial solution (tr
j does not have to be modified).(2) if tubes from box bi are moved into a box bk that is destocked after b j, then switching
bi and bk does not invalidate the initial solution.
If all tubes of bi are moved into boxes that are destocked before bi, then two situations haveto be considered:
(3) if the time between destocking and restocking box b j is lower than or equal to TMAX −tbox then box bi and box b j can be switched without invalidating the initial solution.
(4) if the time between destocking and restocking box b j is equal to TMAX , then thereexists a box bk such that td
k > tdj , which is restocked just before b j. Then switching the
destocking order of boxes bi and b j is possible, as soon as trj and tr
k can be inverted,and does not invalidate the solution.
By repeating this procedure we conclude that starting with boxes that receive tubes doesnot prevent from obtaining an optimal solution.
ACM: Transactions on Modeling and Computer Simulation, Vol. ?, No. ?, ?? 20??.

12 · S.Housseman, N.Absi, D. Feillet and S. Dauzere-Peres
PROPERTY 3.2. There exists an optimal solution where the destocking/stocking order-ings follow a FOFI (First Out First In) rule.
PROOF. Consider an optimal solution with the boxes to be emptied closing the destock-ing sequence. Suppose there exists two boxes bi and b j such that bi is destocked beforeb j (td
i < tdj ) and is restocked after (tr
j < tri ). Dates td
i and tri are compatible and thus are
dates (tdi , tr
j) and dates (tdj , t
ri ). Also for every emptied box bk (from which tubes might
have been added to bi or b j), tdk > td
j , which implies that (tdk , tr
j) and (tdk , tr
i ) also form pairsof compatible dates. From these inequalities, one can see that bi and b j can be invertedin the restocking sequence. Property 3.2 follows by repeating this mechanism until therestocking sequence repeats the destocking ordering.
So as to define sensible rules for the tube movements and to compute an upper bound,we analyze the simplified case where the time to manipulate the boxes is neglected. Wedefine ttub the time needed to move a tube between two boxes (including the inventoryupdate), which is also assumed to be constant. With these assumptions, the StayFrozenconstraint can be expressed as a limit on the number of tube movements. The problem toconsider is then to find a set of moves such that a maximal number of boxes is emptied,with constraints limiting the number of movements (StayFrozen constraint) and implyingthat moves only concern boxes of the same type.
We propose to apply the following algorithm. At every iteration of the algorithm, a boxis emptied, until the limit on the number of moves and/or the loading rate of the boxesprevent from emptying any additional box. The box selected to be emptied is the one withthe minimal number of tubes among the boxes that can be emptied. A box can be emptiedwhen there exist boxes of the same type that are able to receive the tubes. The tubes arethen moved to these boxes, in the decreasing order of their loading rate.
PROPERTY 3.3. Under the assumptions we made in the preceding paragraph, the abovealgorithm is optimal.
PROOF. Let consider an optimal solution and note B− the set of boxes that have beenemptied and B+ the set of boxes where tubes have been added. Note qi the initial numberof tubes in a box. Let us assume that there exists a box bi ∈ B− and a box b j ∈ B+ of thesame type with q j < qi. Another optimal solution can be constructed by removing q j tubesfrom box b j and qi−q j from box bi, instead of qi tubes from box bi, and by adding tubesto box bi instead of box b j. Box b j will then be emptied and box bi will be able to receivethe new tubes as its load once the tubes are removed becomes q j. Note that the solutionshould still be modified to avoid adding and removing tubes from box bi, which can besimply done by removing the intermediary transit to box bi.
Repeating this mechanism, we obtain a solution where tubes are removed from boxeswith minimal loading rates only. The solution can then easily be transformed so that thetubes are only moved to the boxes with the maximal loading rate. Note that this last partof the policy does not minimize the number of boxes involved in the process: choosingthe non emptied boxes with minimal loading rates would allow less boxes to be involved.However, it might help to empty new boxes later on.
Let us now return to the case where box manipulation times are not neglected. Since itsolves a relaxation, the above algorithm provides an upper bound on the number of boxesACM: Transactions on Modeling and Computer Simulation, Vol. ?, No. ?, ?? 20??.

Impacts of Radio-Identification on Cryo-Conservation Centers through Simulation · 13
that can be emptied in one execution of the activity. To find a feasible solution that maxi-mizes the efficiency of the process, we proceed as follows. We empty boxes as detailed inthe algorithm but the boxes selected for receiving the tubes are the following ones in the or-der of increasing loading rate. This policy minimizes the number of boxes to be destockedand optimizes the chances that the solution is feasible regarding the StayFrozen constraint.The feasibility of the solution is then evaluated. If feasible, the solution is returned. Other-wise, a solution with one less emptied box is investigated. The tube movements that emptythe last box to be emptied are canceled, and this box become a target box. The algorithmis repeated until a feasible solution is found. Being rather intuitive and copying what prac-titioners might tend to execute, this algorithm is subsequently called ”Intuitive” algorithm.This algorithm is carried out every time re-warehousing is planned (trigger 1). When re-warehousing is done in emergency (trigger 2), the process is different. We only considerthe subset of tube movements that empty the first box. We then construct the correspondingsolution and evaluate its feasibility. If feasible, we empty the box and stop. Otherwise, anemergency rack starts being used and a new rack is ordered. In this case, a certain execu-tion time Tshortage is defined for the administrative work.
Though being the most efficient for one occurrence of re-warehousing, the Intuitive al-gorithm might not have the best results in the long run, as leveraged in the proof of Property3.3. Moving tubes to the non-full boxes having a maximal number of tubes as proposedcould however be a little bit too extreme as the number of boxes involved might becomedetrimental. We rather propose the following scheme, coined as the ”Long Term” algo-rithm. First, the set B1 of boxes that would be emptied relaxing the Stayfrozen constraintis computed. Boxes of B1 then represent boxes from which tubes could be removed, whilethe complementary set of boxes, B2, represent boxes where tubes could be added. Thealgorithm then manages to empty a box of B1 with a maximal number of tubes to boxes ofB2 with maximal numbers of tubes. Note that a single box is emptied with this algorithm.Intuitively, this algorithm is designed so that opportunities for emptying boxes in the nextemergency re-warehousings are maximized.
3.4 Performance indicators
Evaluating the performance of a health service is a complex issue [Minvielle et al. 2007].The main points to consider are:
—The safety of patients and employees;—Patient satisfaction;—Financial impact;—Employee reluctance and/or understanding.
For our study, we considered the set of following indicators:
Number of errors. This indicator is split in two parts: number of computation errors,number of inventory errors.
Fastness of processing times. Three indicators are defined with regard to processingtimes. A first indicator, IS Fulfillment delay, provides the amount of time spent betweenthe reception of the sample and the computerization of its related information. In our study,improving this indicator might accelerate the time of obtaining analysis results, which is
ACM: Transactions on Modeling and Computer Simulation, Vol. ?, No. ?, ?? 20??.

14 · S.Housseman, N.Absi, D. Feillet and S. Dauzere-Peres
important for the safety of the patients. Transformation time is the second indicator, givingthe time between the reception of the samples and the computerization of their transformedaliquots. The third indicator, Throughput time, provides the time between the reception ofthe samples and the time when their transformed aliquots are put in the fridge.
Human utilization. This indicator gives the number of man-minutes required by theprocesses. It does not only reflect a financial impact, but also working conditions for theemployees. Biobank activities are indeed not really satisfying for employees, as they do notcall for their specific abilities ([Swedberg 2009], for example, describes a case where themotivation of trained employees increases when machines are used to automate repetitivetasks that do not require high qualifications).
Storage racks bought. This indicator gives the number of storage racks that must bebought to follow the evolution of the biobank activity. This indicator could be translatedto a financial indicator, by taking different parameters into account, such as rack costs,storage costs, storage room capacity, tank capacity, etc.
Note that no indicator is specifically dedicated to the financial impacts, as they can bevery dependent on the structure. Health structures indeed may have different policies re-garding the development of their storage area; some of the devices we are considering areprototypes that may force biobanks to invest in whole proprietary solutions; the workforcecosts are highly variable depending on the region of the world; the costs of emerging tech-nologies are not stabilized yet...
4. EXPERIMENTATIONS
4.1 Implementation
To implement our model, we use the Arena software, described by [Law and Kelton 2000]as a general purpose simulation software, allowing the creation of customized modules,templates, and user friendly front ends. It can be easily connected with other softwaresthrough ActiveX [Seppanen 2000], and encodes user functions through VBA blocks. Theuse of Dynamic Link Library (DLL) is useful to plug-in external algorithms that may bereused elsewhere, like in real health structures for example.
The employees are modeled using simple resources, which can be ’Available’, ’Busy’or ’Unreachable’. VBA blocks are user defined blocks used to fill the databases and assignrandom generated attributes like errors, process durations, number of aliquots in samples,arrival or demand of samples, etc. We use these blocks to improve the way the resourcesare modeled and for inventory management. We also implement a basic PSF based on thenumber of samples waiting to be carried out. We consider that a large amount of pendingjobs increases the error rate by 5%.
Most of the specific functions are implemented in VBA as recommended by [G.F.Kalsdorf2006]. Our goal being to compare material and organizational configurations, we use aspreadsheet to define the scenarios, that is, device behaviors, process lengths and errorprobabilities. For example, introducing an RFID reader at the reception point will reduceprocessing times of some of its subprocesses and error probabilities. Other dysfunctionsthan human failures are implemented; device or network crashes are possible, even if theACM: Transactions on Modeling and Computer Simulation, Vol. ?, No. ?, ?? 20??.
Impacts of Radio-Identification on Cryo-Conservation Centers through Simulation · 15
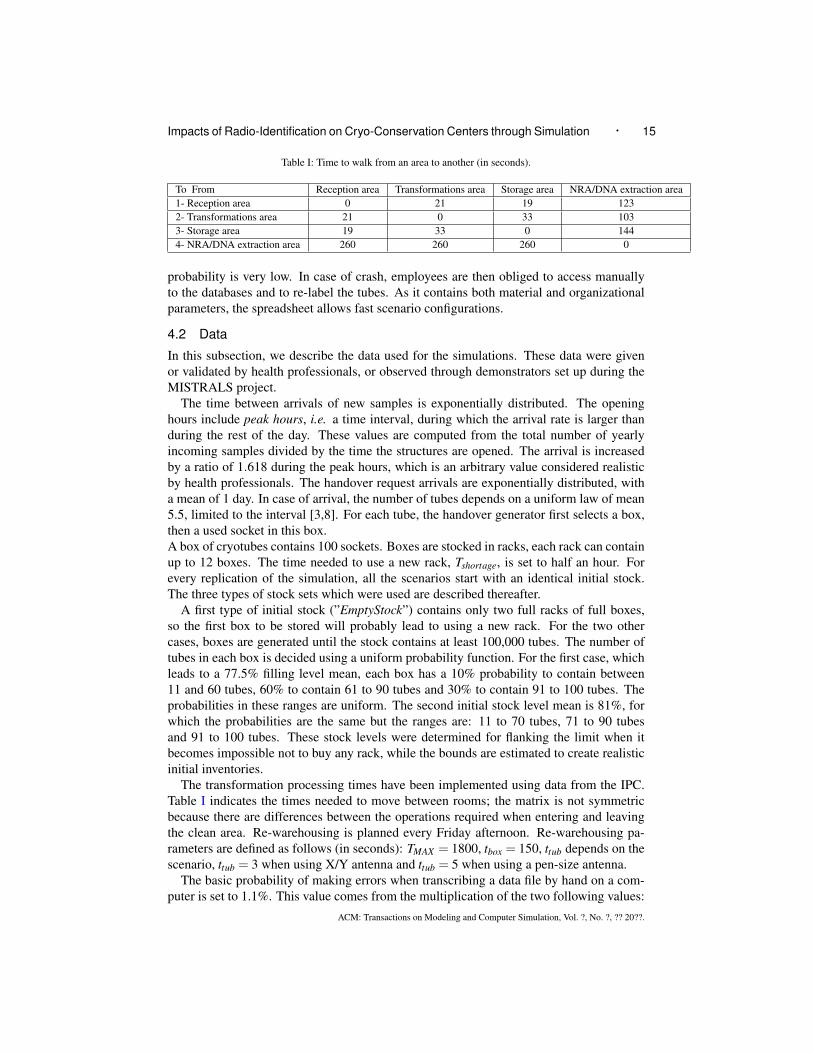
Table I: Time to walk from an area to another (in seconds).
To From Reception area Transformations area Storage area NRA/DNA extraction area1- Reception area 0 21 19 1232- Transformations area 21 0 33 1033- Storage area 19 33 0 1444- NRA/DNA extraction area 260 260 260 0
probability is very low. In case of crash, employees are then obliged to access manuallyto the databases and to re-label the tubes. As it contains both material and organizationalparameters, the spreadsheet allows fast scenario configurations.
4.2 Data
In this subsection, we describe the data used for the simulations. These data were givenor validated by health professionals, or observed through demonstrators set up during theMISTRALS project.
The time between arrivals of new samples is exponentially distributed. The openinghours include peak hours, i.e. a time interval, during which the arrival rate is larger thanduring the rest of the day. These values are computed from the total number of yearlyincoming samples divided by the time the structures are opened. The arrival is increasedby a ratio of 1.618 during the peak hours, which is an arbitrary value considered realisticby health professionals. The handover request arrivals are exponentially distributed, witha mean of 1 day. In case of arrival, the number of tubes depends on a uniform law of mean5.5, limited to the interval [3,8]. For each tube, the handover generator first selects a box,then a used socket in this box.A box of cryotubes contains 100 sockets. Boxes are stocked in racks, each rack can containup to 12 boxes. The time needed to use a new rack, Tshortage, is set to half an hour. Forevery replication of the simulation, all the scenarios start with an identical initial stock.The three types of stock sets which were used are described thereafter.
A first type of initial stock (”EmptyStock”) contains only two full racks of full boxes,so the first box to be stored will probably lead to using a new rack. For the two othercases, boxes are generated until the stock contains at least 100,000 tubes. The number oftubes in each box is decided using a uniform probability function. For the first case, whichleads to a 77.5% filling level mean, each box has a 10% probability to contain between11 and 60 tubes, 60% to contain 61 to 90 tubes and 30% to contain 91 to 100 tubes. Theprobabilities in these ranges are uniform. The second initial stock level mean is 81%, forwhich the probabilities are the same but the ranges are: 11 to 70 tubes, 71 to 90 tubesand 91 to 100 tubes. These stock levels were determined for flanking the limit when itbecomes impossible not to buy any rack, while the bounds are estimated to create realisticinitial inventories.
The transformation processing times have been implemented using data from the IPC.Table I indicates the times needed to move between rooms; the matrix is not symmetricbecause there are differences between the operations required when entering and leavingthe clean area. Re-warehousing is planned every Friday afternoon. Re-warehousing pa-rameters are defined as follows (in seconds): TMAX = 1800, tbox = 150, ttub depends on thescenario, ttub = 3 when using X/Y antenna and ttub = 5 when using a pen-size antenna.
The basic probability of making errors when transcribing a data file by hand on a com-puter is set to 1.1%. This value comes from the multiplication of the two following values:
ACM: Transactions on Modeling and Computer Simulation, Vol. ?, No. ?, ?? 20??.

16 · S.Housseman, N.Absi, D. Feillet and S. Dauzere-Peres
[Marcellis-Warin 2003] reports that 10% of the operations in hospitals are subject to errorsand that 11% of these errors are due to retranscriptions. This probability is reduced to0.01% when tubes are tagged as data are automatically transferred.
The probability that an error occurs while manually inventorying a full box of cryotubesis set to 3%. This value was estimated after discussing the results of [Garnerin et al. 2007]with health professionals. This value is set to 0.01% when the employees use an RFIDpen-size antenna to perform the inventory.
These probabilities are divided by the employee Performance Level. The performancelevel is identical for every employee during a replication of the simulation; the values areeither 0.5, 1, or 2. Comparing different values of this cursor allows us to observe the rela-tive impact of RFIDs depending on the qualification level of employees, the lack of trainingthat can happen in some institutes / countries, or the use of third-party resources. It wouldbe interesting, for future research, to vary this level throughout the day and/or from oneday to another, depending on factors such as fatigue or psychological profile modifications.
Table II gives the values of the scenario main parameters (scenarios are described page10):
—times of the ”Information asset” subprocess (I ProcessName).
—times of the ”Control asset” subprocess (C ProcessName);
—error probabilities (Perror TaskName);
—number of resources required for certain processes (HumRess TaskName);
—characteristics of DNA/RNA operations;
Table II: Scenario main parameters.
Scenario / Parameters Curr.Scenar RNA Auto. RFID & penRdr RFID & 2DRdrIReceptTime (min.) 0.75 0.75 0.25 0.25ITransformation (min.) 1 1 0.5 0.5CInventory (min.) 20 20 0 0HumRessCInventory 1 1 0 0PerrorSampleLeaf 1.1% 1.1% 0.001% 0.001%PerrorInventory 3% 3% 0.1% 0.01%HumRessComputerizeLeaf 1 1 0 0HumRessTransportLeaf 1 1 0 0AreaRNAProcess 4 2 2 2SetupRNA (min.) 170 20 20 20WaitRNAProcess (min.) 0 60 60 60FinishRNA (min.) 0 20 20 20ttub (sec.) N/A N/A 5 3
Unless the contrary is explicitly stated, the experiments are conducted with an employeePerformance Level of 1 and the ”Empty stocks” scenario for initial stock levels. The timehorizon defined for the simulations is 52 working weeks.ACM: Transactions on Modeling and Computer Simulation, Vol. ?, No. ?, ?? 20??.

Impacts of Radio-Identification on Cryo-Conservation Centers through Simulation · 17
4.3 Results
The number of replications was determined following the recommendation dispensed by[Kelton et al. 2007]. The half-width of the resource Human utilization observed after 25replications led to a recommendation of 48 replications to be sure at 95% that this valuewould vary for less than 0.2%.We decided to run 50 replications. Results are given in ta-bles III, IV and V.
The notation corresponding to the scenarios in the result tables is as follows: Curr.Scenar is the case with no RFID nor RNA automaton. In RNA Automaton, a DNA/RNAautomaton was added, which is also present in all scenario including RFID. Pen-Rder and2DRder correspond respectively to the use of a pen-size antenna or an X/Y antenna duringthe inventory process. The non-RFID scenarios do not include the re-warehousing activity.The Re-Wa argument corresponds to the case when the emergency trigger is enabled aswell as a weekly planned trigger. In this case, boxes must contain only tubes of the samekind; the ”No BPK” argument explicits that this constraint is removed. The Emergencyonly argument corresponds to the case when there is no scheduled re-warehousing. Thealgorithm used for re-warehousing is the Intuitive Algorithm described in Section 3.3,unless lengTerm is assed and the long term algorithm is used.
Table III focuses on the results regarding the main configurations. It compares the non-rewarehousing scenarios: ”Curr.Scenar”, ”RNA Auto.”, ”RFID & penRder & No re-Wa”,”2DRder & No re-Wa”. It also shows the results of the referent re-warehousing scenario:”2DRder & Re-Wa” and its variation while using a pen-reader antenna: ”penRder & Re-Wa”. These scenarios are compared through the Fastness of processing times, Number oferrors, Human utilization and Storage racks bought.
Table III: Performance indicators for main configurations.
Scenario Processing Times Errors # Racks Hum. Ress.description IS Fulfillment Transformation Throughput Computerization Inventory Bought UsedCurr.Scenar 3.06h 5.94h 2.09h 1.1% 3.03% 24.09 51.74%
RNA Automaton 2.69h 5.27h 1.71h 1.15% 2.96% 24.24 45.21%Pen-Rder & No re-Wa 0.35h 1.63h 1.61h 0.01% 0.15% 24.19 32.37%2DRder & No re-Wa 0.35h 1.62h 1.61h 0.01% 0.01% 24.12 31.61%pen-Rder & Re-Wa 0.35h 1.63h 1.61h 0.01% 0.06% 19.86 32.61%2DRder & Re-Wa 0.35h 1.62h 1.61h 0.01% 0.01% 19.84 31.93%
The percentage of Human Resource Utilization in the initial scenario Curr.Scenar is51.74%, which can be explained considering that employees spend a large amount of timeworking for other services and that the amount of work depends on the arrival rate, whichis generally irregular. Slightly more than 10% of this time is saved when adding the RNAautomaton in the clean area (Human Resource Utilization of 45.21%). The introduction ofRFID has still more impact on this indicator with an additional decrease of almost 31%.Introducing the re-warehousing activity has the opposite effect; the additionnal time spentfor this activity appears however very limited (less than 0.5%) and is largely conterbal-anced with the savings in rack utilizations (decrease of 20%). Table V will analyze furtherthis latter indicator showing that even more significant results can be obtained with differ-ent initial stock levels.With regard to Processing Times, similar results can be observed. IS Fulfillment delays are
ACM: Transactions on Modeling and Computer Simulation, Vol. ?, No. ?, ?? 20??.

18 · S.Housseman, N.Absi, D. Feillet and S. Dauzere-Peres
specially reduced with RFID, as initially consisting mainly in handwriting, data keyboard-ing and information leaf transportation that can almost entirely be removed. Note that thisreduction is all the more interesting that these tasks are far from the core competences ofthe employees. Throughput times reveal that the savings in time also result in acceleratedhandling operations for incoming samples, which is also an important indicator for qual-ity matters. A final worth-mentioning point about processing times is the small influenceof the type of RFID reader (pen or X/Y antenna) that does not make significant differences.
Table IV analyses the effect of the employee Performance Level (EPL) on inventory andcomputerization errors. Scenarios involving re-warehousing are not included here as errorrates are not significantly affected by this activity.
Table IV: Observed errors on the non-rewarehousing scenarios, depending on Employee Performance Level(EPL).
Scenario Inventory error Computerization errorMaterial configuration EPL Avg. Min. Max. Avg. Min. Max.Curr.Scenar 0.5 6.02% 3.45% 9.54% 2.23% 1.81% 2.65%Curr.Scenar 1 3.03% 0.72% 4.98% 1.1% 0.81% 1.39%Curr.Scenar 2 1.51% 0.35% 3.46% 0.57% 0.37% 0.8%RNA Automaton 0.5 6.27% 2.91% 10.14% 2.3% 1.96% 2.64%RNA Automaton 1 2.96% 1.06% 5.28% 1.16% 0.94% 1.49%RNA Automaton 2 1.5% 0% 3.16% 0.57% 0.41% 0.79%RFID & pen-Rder 0.5 0.25% 0% 1.03% 0.02% 0% 0.06%RFID & pen-Rder 1 0.15% 0% 1.05% 0.01% 0% 0.05%RFID & pen-Rder 2 0.1% 0% 0.7% ≤ 0.01% 0% 0.03%RFID & 2DRder 0.5 0.1% 0% 0.36% 0.02% 0% 0.08%RFID & 2DRder 1 0.01% 0% 0.35% 0.01% 0% 0.05%RFID & 2DRder 2 ≤ 0.01% 0% 0.35% ≤ 0.01% 0% 0.06%
The table shows the high impact of the employees Performance Level when RFID isnot present (Curr.Scenar, RNA Automaton). Improvements are less significant when auto-ID technologies are introduced as many critical processes like handwritings or manualcomputerizations are removed. This result is important as it shows that RFID technologiesare more profitable to organizations where the staff is less qualified (or overloaded), thatis, most likely, the ones that cannot afford these technologies.
Table V focuses on the impacts of re-warehousing decisions. The scenarios evaluatedin this table all derive from a single scenario, the so-called referent scenario, namely2DRder & Re-Wa. Every scenario is obtained by modifying exactly one aspect of thereferent scenario: change the XY antenna to a pen-reader, relax the BoxesPerKind con-straint (thus allowing different types of tubes in a same box), disable the weekly plannedre-warehousings, use the Long Term algorithm while applying re-warehousing. In this lastcase, the effect of changing from a weekly planned re-warehousing to a daily planned re-warehousing is also investigated. The results for all these scenarios are reported for thethree initial stock levels detailed in Section 4.2. They include:
—The average number of emergency triggers launched (Number Launched) and the aver-age number of times when it did not permitted to empty a box (# Failed), as well as the
ACM: Transactions on Modeling and Computer Simulation, Vol. ?, No. ?, ?? 20??.

Impacts of Radio-Identification on Cryo-Conservation Centers through Simulation · 19
standard deviation for this indicator. The average value for # Failed is written in bold asit exactly indicates the number of racks that had to be bought.
—The average number of boxes emptied during planned re-warehousings (# Free Boxes)and the number of scheduled re-warehousing that were canceled since no box couldbe emptied; in this case it is important to understand that the processing time for there-warehousing was then saved.
ACM: Transactions on Modeling and Computer Simulation, Vol. ?, No. ?, ?? 20??.

20 · S.Housseman, N.Absi, D. Feillet and S. Dauzere-Peres
Tabl
eV
:Res
ults
onre
-war
ehou
sing
.
Initi
alst
ock:
Em
pty
Stoc
k77
.5%
81%
Scen
ario
nam
eE
mer
genc
yTr
igge
rPl
anne
dE
mer
genc
yTr
igge
rPl
anne
dE
mer
genc
yTr
igge
rPl
anne
dN
umbe
r#
Faile
d(→
New
Rac
k)#F
reeB
oxes
#Can
cele
dN
umbe
r#
Faile
d(→
New
Rac
k)#F
reeB
oxes
#Can
cele
dN
umbe
r#
Faile
d(→
New
Rac
k)#F
reeB
oxes
#Can
cele
dla
unch
edA
vg.
σla
unch
edA
vg.
σla
unch
edA
vg.
σ
2DR
der&
Re-
Wa
40.5
219
.84
0.51
27.7
624
.24
101.
040
016
9.2
014
5.06
0.98
0.55
122.
420.
88
Pen-
Rde
r&R
e-W
a39
.74
19.8
60.
5327
.86
24.1
412
9.86
00
141.
610
160.
11.
60.
6410
7.4
1.52
2DR
der&
Re-
Wa
35.6
220
0.49
33.6
418
.36
109.
140
016
4.94
014
8.52
1.14
0.45
125.
541.
24N
oB
PK
2DR
der&
Em
erge
ncy
only
68.4
219
.86
0.57
N/A
270.
140
0N
/A27
1.68
1.14
0.15
N/A
2DR
der&
Re-
Wa
40.7
419
.84
0.55
28.6
23.4
218.
610
052 0
225.
720.
780.
5851
.26
0.74
&lo
ngTe
rm2D
Rde
r&R
e-W
a22
.69
19.8
370.
4747
.06
211.
9413
.65
00
259 0
22.2
40.
020.
1425
8.9
0.1
&lo
ngTe
rm(d
aily
)
ACM: Transactions on Modeling and Computer Simulation, Vol. ?, No. ?, ?? 20??.

Impacts of Radio-Identification on Cryo-Conservation Centers through Simulation · 21
A first tendency drawn by Table V concerns the impact of the initial stock levels. What-ever the scenario, about 20 new racks are needed for the Empty stock case, while no racksneed to be bought for the ”77.5%” initial level and a very limited number of racks (varyingaround 1) are bought in the ”81%” case. ”Empty stock” corresponds to the worst situationfor re-warehousing, where every box is full at the beginning of the simulation (or sam-ples in boxes are not tagged yet). With an initial level of ”77.5%” on the contrary, emptyplaces in the boxes are sufficiently numerous so that buying new racks is never needed. Aninitial stock level of ”81%” defines a compromise between these two extreme situations.Note that these values of course depend on the sample arrival and handover request ratesthat were defined for the simulation. An important phenomenon is however not explicitlyshown in the table: the initial stock level scarcely impacts the number of new tracks neededwhen no re-warehousing policy is implemented. Indeed, empty places present in the stor-age area can no longer be exploited in this latter case (which actually corresponds to theactual situation). Whatever the initial stock level, the number of new racks needed wouldapproximately attain 24, as shown by Table III. In the long term, once a significant numberof tubes are tagged in the biobank and as long as sample arrivals and handover requestsexist, Table V demonstrates that re-warehousing is unavoidable and successful for limitingthe growth of the biobank without pruning sample sets.The comparisons of the different scenarios against the referent scenario also show interest-ing results.With regard to the readers (2DRder & Re-Wa against Pen-Rder & Re-Wa), by allowinginventorying boxes more quickly than a pen-reader, X/Y antennas permit to empty moreboxes while performing re-warehousing. As a consequence, emergency re-warehousingsalso happen less frequently. However, the effect on the number of needed racks remainsrather limited.Removing the BoxPerKind constraint (2DRder & Re-Wa against 2DRder & Re-Wa NoBPK) has a surprising effect at first sight. While one would expect more effectiveness, re-sults are at best slightly improved and sometimes deteriorated. The reason for this counter-intuitive result stands in the fact that a single transitory box is used in this case (comparedto a transitory box per type otherwise).When re-warehousing is only triggered in emergency (2DRder & Re-Wa against 2DRder& emergency only), the number of emergencies largely increases, as expected. In the worstcase for example (”77.5%” intitial stock level), emergencies pass approximately from 2 perweek to 5 per week. At the same time, this trigger appears to be sufficiently effective tolimit the number of new tracks needed. Intuitively, one can understand that the use of thestorage area can be optimized rather equivalently with the two triggers, but the moments intimes where the optimization happens are different: a relatively long time every week withthe planned trigger, numerous unpredictable short times with the emergency trigger.The last scenario investigated concerns a modification of the algorithm used for re-warehousing(2DRder & Re-Wa against 2DRder & Re-Wa & long Term). As explained in Section 3.3,the Intuitive algorithm has a myopic view on the optimization: many boxes might tend tobe half empty while a collection of almost empty and almost full boxes would be prefer-able. The Long Term algorithm is designed to amend this behavior. With this algorithm,less boxes are emptied (1 box per planned re-warehousing instead of more than 2 or 3,on average, with the Intuitive algorithm for the ”81%” and ”77.5%” stock level scenarios,respectively), the number of emergencies increases, but the re-assignment of tubes is more
ACM: Transactions on Modeling and Computer Simulation, Vol. ?, No. ?, ?? 20??.

22 · S.Housseman, N.Absi, D. Feillet and S. Dauzere-Peres
effective and less additional racks are needed. A daily planning of the re-warehousingactivity still highlights the impact of the Long Term algorithm, keeping nearly always 1emptied box per planned re-warehousing but also allowing removing most of the emergen-cies and almost avoiding purchasing any rack.
4.4 Discussion
Our results do not include a formal financial part. The following indicators: Human utiliza-tion variation, Number of racks bought, number of smart-tubes used, costs of new devicemaintenance, are the most significant variable costs, while the readers, antennas and theirinstallation costs, IS update, hardware, software and consulting are fixed costs. The stafftraining requires an initial investment, but their efficiency using new technologies will any-way evolve over time, as for example the ”double labeling” will not be given up at first.Staff members will require an initial training for these technologies but this is already thecase with barcodes, although the manipulation of mobile readers may require a short timeof adaptation and the processing times may evolve with their experience with new tech-nologies (tactile interface, graphical interface, etc.).
The use of RFID technologies leads to significantly reduce the number of racks that hadto be used when considering that the whole stock was previously tagged. The ”Empty-Stock” scenarios show that, according to the handover arrival implemented, an importantproportion of racks can be saved in the first year of use. The handover requests should,to validate this results, evolve over time, and depend on the stock content. This parameteralso depends on the policy biobank managers want to apply and on the easiness to convincepatients to give their authorization for using their samples.
It is important to remind that some observations of the studied system are needed tovalidate our assumptions. This part of our work will only be possible after the pilot planthave been observed long enough to become stabilize. On a technical part, the probabilitiesof sample misreading, chip failure and for the tube to lose its chip will have to be observedin their real condition of use to validate the assumptions. Concerning the estimated timesfor re-warehousing, we will be able to precisely observe the times for manipulating tubesand inventorying boxes. The boxes manipulation time (storing or unstoring) could also bebetter defined but it would require one additional manipulation or device integration (fortracking the employees position, for example). Other parameters may impact the data usedin this study, like the temperature in the storage area impacting TMAX . We also point outthe fact that some solutions for tagging cryotubes may not be applicable to existing banks.
The assumptions concerning errors probabilities cannot be observed afterwards and willstay theoretical as the comparisons between database information and the physical stockwould require a large number of observation to be relevant. The values of device failureand manipulation times will be observed when the pilot plant is operational. An interestingobservation will be the employee adaptation time where we may observe a first transitionwhen employees use the devices more easily. Then a second phase could come, duringwhich urgent needs and daily emergencies may jeopardize the robustness of the system.
5. CONCLUSION
In this paper, we estimated the impact of RFID technologies in a particular healthcare ap-plication using discrete-event simulation as a decision support tool. Our study quantifiesthe benefits of integrating new auto-ID technologies and devices, addressing the possibilityACM: Transactions on Modeling and Computer Simulation, Vol. ?, No. ?, ?? 20??.

Impacts of Radio-Identification on Cryo-Conservation Centers through Simulation · 23
to enable new activities. We proposed a modeling approach which could be transposed inother (health) production systems.
The results show that, according to the parameters, auto-ID technologies may consid-erably improve the performances of biobanks when taking into account the percentagesof errors as well as the reduction of used resources and processing times as performanceindicators.
The proposed model should allow us to model other biobanks and/or material configura-tions quite quickly, including organ sample arrivals. This can be made using the same basicmodel file and only modifying the specific configuration file. These types of tools couldbe very helpful when auditing and expertizing facilities that must adopt new technologiesbecause of new legislations, or because their maximum capacity is reached for example.
This paper addresses the re-warehousing activity, which may become a necessity insome facilities. We compared some policies concerning a possibly new activity whichaims at optimizing the stock. Though the algorithm and scheduling of this activity couldbe improved, our observations show its implementation can lead to high savings.
Improving this study could consist in taking into account more constraints and trig-gers for the re-warehousing processing, defining an optimal planning considering the han-dover requests probabilities, or more manipulation scenarios (several technicians collabo-rating). A graphical user interface could allow biobank managers to model themselves theirbiobank; and enable the possibility of investigating the impacts of a global adoption of thistechnology. Improving the way human resources are modeled, using a multi-agent systemand adding Performance Shaping Factors and trying different psychological profiles forexample, would also be very interesting.
ACKNOWLEDGMENTS
This study is partially financed by the Conseil General 13 of the Bouches du Rhone. MIS-TRALS was labelled by the PAC-ID cluster and is funded by the DGE/MINEFI. The au-thors gratefully thank all the collaborators of the MISTRALS project who always answeredquickly and carefully the questions, and particularly Lise-Marie Daufresne, from the IPC,and Olivier Bordonne, from the CHU-N. The authors also thank the reviewers for theiracute observations and propositions that improved the quality of this paper.
REFERENCES
ANDRECHAK, G. AND WIENS, R. A. 2006. Hitachi -chip rfid technology compatible with gamma steriliza-tion. Available via http://www.mds.nordion.com/ [accessed April 6, 2009].
ARUMUGAM, D. AND ENGELS, D. 2009. Specific absorption rates in the human head and shoulder forpassive uhf rfid systems. Int. J. Radio Frequency Identification Technology and Applications 2, 1, 1–26.
BETTENDORF, E., MALENFANT, C., AND CHABANNON, C. 2008. RFID technologies and electronic tags toidentify cryopreserved materials.
BOGINSKI, V., MUN, I., Y. WU, K. M., AND ZHANG, C. 2007. Simulation and analysis of hospital opera-tions and resource utilization using RFID data. In IEEE International Conference on RFID, Grapevine, Texas,USA, pp 199-204.
BONNABRY, P. 2007. How can the labelling and the packaging of drugs impact on the drug safety? InSwissmedic, Bern, Suisse.
ACM: Transactions on Modeling and Computer Simulation, Vol. ?, No. ?, ?? 20??.

24 · S.Housseman, N.Absi, D. Feillet and S. Dauzere-Peres
BORSHCHEV, A. AND FILIPPOV, A. 2004. From system dynamics and discrete event to practical agent basedmodeling: Reasons, techniques, tools. In Proceedings of The 22nd International Conference of the SystemDynamics Society, July 25- 29, Oxford, England.
CAUCHOIS, R. 2008. Developpement de tests de vieillissment accelere de puces rfid conservees pour appli-cation en biobanques. Tech. Rep. ENSM-SE CMP WP 2008/01, Ecole des Mines de Saint-Etienne.DALTON, G. D., SAMAROPOULOS, X. F., AND DALTON, A. C. 2008. Improvements in the safety of patientcare can help end the medical malpractice crisis in the united states. 86, 153–162.DE KOK, A., VAN DONSELAAR, K., AND VAN WOENSEL, T. 2007. A break-even analysis of rfid technologyfor inventory sensitive to shrinkage. Int. Journal of Production Economics 112, 2, 521–531.E CANCER.FR. 2007. http://www.e-cancer.fr/ [accessed october 30, 2009].GARFINKEL, M. 2005. Minimizing multi-zone orders in the correlated storage assignment problem. Ph.D.thesis, Georgia Institute of Technology.GARNERIN, P., PELLET-MEIER, B., CHOPARD, P., PERGENER, T., AND BONNABRY, P. 2007. Measuringhuman-error probabilities in drug preparation : a pilot study. Eur J. Clin Pharmacol 63, 769–776.GAUKLER, G., SEIFERT, R. W., , AND HAUSMAN, W. 2007. Item-level rfid in the retail supply chain. 16,65–76.G.F.KALSDORF, C. 2006. Clinical supply chain simulation. Ph.D. thesis, Karlsruhe University of AppliedSciences.HEDGEPETH, W. O. 2007. RFID Metrics. CRC Press.HOHBERGER, C. P. AND TSIRLINE, Y. 2009. Design of a 13,56mhz segmented helmholtz coil for rf ex-posure testing of biologics to simulated rfid readers. Int. J. Radio Frequency Identification Technology andApplications 2, 1/2, 65–92.IDTECHEX. 2009. http://www.idTechEx.com/. Last Access: 06.01.2009.IMPACT. 2006. Counterfeit medicines: an update on estimates - 15 november 2006. Available viahttp://www.who.int/ [accessed April 6, 2009].KELTON, W. D., SADOWSKI, R. P., AND STURROCK, D. T. 2007. Simulation with Arena, 4th ed. McGraw-Hill, Inc, New York.KLEIJNEN, J. 2005. Supply chain simulation tools and techniques: a survey. 1, 1.LAW, A. AND KELTON, W. 2000. Simulation Modeling and Analysis. Mc Graw Series in industrial engineer-ing and management science.LIN, L. 2009. An integrated framework for the development of radio frequency identification technology inthe logistics supply chain management. In Computers & Industrial Engineering, to appear.MARCELLIS-WARIN, N. D. 2003. Les risques hospitaliers. 40.MILES, S. B., SARMA, S. E., AND WILLIAMS, J. R. 2008. RFID Technology and Applications. CambridgeUniversity Press.MINVIELLE, E., SICOTTE, C., CHAMPAGNE, F., CONTANDRIPOULOS, A.-P., JEANTET, M., PREAUBERT,N., BOURDIL, A., AND RICHARD, C. 2007. Hospital performance: Competing or shared values? 87, 8–19.REASON, J. Human errors: Models and management.REKIK, Y. 2006. The impact of the rfid technology in improving performance of inventory systems subject toinaccuracies. Ph.D. thesis, Ecole CENTRALE Paris.ROYSTON, G. 1999. Trials versus modelling in appraising screening programmes. In British Medical journal.Vol. 318. 360–361.SADIQ, M. 1993. A hybrid clustering algorithm for reconfiguration of dynamic order picking systems. Ph.D.thesis, University of Arkansas.SARAC, A., ABSI, N., AND DAUZERE-PERES, S. 2008. A simulation approach to evaluate the impact ofintroducing rfid technologies in a three-level supply chain. In Proceedings of the 2008 Winter SimulationConference, Miami, U.S.A. 2741–2749.SEPPANEN, M. 2000. Developing industrial strength simulations models using visual basic for applications.In Proceedings of the 32nd Conference on Winter simulation, Orlando, Florida, USA, pp 77-82.SWEDBERG, C. 2009. Rfid helps st. joseph’s keep an eye on cold storage. RFID Journal - Last Access:06.01.2009.
ACM: Transactions on Modeling and Computer Simulation, Vol. ?, No. ?, ?? 20??.

Impacts of Radio-Identification on Cryo-Conservation Centers through Simulation · 25
TOGT, R. V. D., VAN LIESHOUT, E., HENSBROEK, R., BEINAT, E., BINNEKADE, J., AND BAKKER, P.2008. Electromagnetic interferences from radio frequency identification including hazardous incidents incritical care medical equipment. In Journal of American Medical Association. Vol. 299. 2884–2890.WORLDHEALTHORGANIZATION. 2006. Counterfeit medicines: Fact sheet. Available viahttp://www.who.int/[accessed April 6, 2009].
Received June 2009; November 2009; accepted Notyet 2009...
ACM: Transactions on Modeling and Computer Simulation, Vol. ?, No. ?, ?? 20??.

Copyright © 2022 FDOKUMEN