Model-driven coordinated management of data centers
25
Model-driven Co-ordinated Management of Data Centers 1 Tridib Mukherjee, Ayan Banerjee, Georgios Varsamopoulos, Sandeep K. S. Gupta * Impact Lab School of Computing, Informatics, and Decision Systems Engineering Arizona State University Tempe, Arizona, USA Abstract Management of computing infrastructure in data centers is an important and challenging problem, that needs to: i) ensure availabil- ity of services conforming to the Service Level Agreements (SLAs); and ii) reduce the Power Usage Efficiency (PUE), i.e. the ratio of total power, up to half of which is attributed to data center cooling, over the computing power to service the workloads. The cool- ing energy consumption can be reduced by allowing higher-than-usual thermostat set temperatures while maintaining the ambient temperature in the data center room within manufacturer-specified server redline temperatures for their reliable operations. This paper proposes: i) a Coordinated Job, Power, and Cooling Management (JPCM) policy, which performs: a) job management so as to allow for an increase in the thermostat setting of the cooling unit while meeting the SLA requirements, b) power management to reduce the produced thermal load, and c) cooling management to dynamically adjust the thermostat setting; and ii) a Model-driven coordinated Management Architecture (MMA), which uses a state-based model to dynamically decide the correct management policy to handle events, such as new workload arrival or failure of a cooling unit, that can trigger an increase in the ambient tem- perature. Each event is associated with a time window, referred to as the window-of-opportunity, after which the temperature at the inlet of one or more servers can go beyond the redline temperature if proper management policies are not enforced. This window-of-opportunity non-linearly decreases with increase in the incoming workload. The selection of the management policy depends on their potential energy benefits and the conformance of the delays in their actuation to the window-of-opportunity. Simulations based on actual job traces from the ASU HPC data center show that the JPCM can achieve up to 18% energy-savings over separated power or job management policies. However, high delay to reach a stable ambient temperature (in case of cooling management through dynamic thermostat setting) can violate the server redline temperatures. A management decision chart is developed as part of MMA to autonomically employ the management policy with maximum energy-savings without violating the window-of-opportunity, and hence the redline temperatures. Further, a prototype of the JPCM is developed by configuring the widely used Moab cluster manager to dynamically change the server priorities for job assignment. Key words: Data Center; Coordinated Management; Job Management; Power Management; Cooling Management. 1. Introduction Computing infrastructures are increasingly deployed as clusters in current data centers for both scientific and web- based applications. With the boom of Internet-based mass services of this decade, from massive multi-player games * Corresponding author. Email address: [email protected] (Sandeep K. S. Gupta). URL: http://impact.asu.edu/ (Sandeep K. S. Gupta). 1 This work was funded in parts by NSF (CNS#0649868, CNS#0855277, and CSR#0834797), SFAz and Intel. Preprint submitted to Elsevier 19 August 2010
-
Upload
independent -
Category
Documents
-
view
3 -
download
0
Transcript of Model-driven coordinated management of data centers

Model-driven Co-ordinated Management of Data Centers 1
Tridib Mukherjee, Ayan Banerjee, Georgios Varsamopoulos, Sandeep K. S. Gupta ∗Impact Lab
School of Computing, Informatics, and Decision Systems EngineeringArizona State University
Tempe, Arizona, USA
Abstract
Management of computing infrastructure in data centers is an important and challenging problem, that needs to: i) ensure availabil-ity of services conforming to the Service Level Agreements (SLAs); and ii) reduce the Power Usage Efficiency (PUE), i.e. the ratioof total power, up to half of which is attributed to data center cooling, over the computing power to service the workloads. The cool-ing energy consumption can be reduced by allowing higher-than-usual thermostat set temperatures while maintaining the ambienttemperature in the data center room within manufacturer-specified server redline temperatures for their reliable operations. Thispaper proposes: i) a Coordinated Job, Power, and Cooling Management (JPCM) policy, which performs: a) job management so asto allow for an increase in the thermostat setting of the cooling unit while meeting the SLA requirements, b) power management toreduce the produced thermal load, and c) cooling management to dynamically adjust the thermostat setting; and ii) a Model-drivencoordinated Management Architecture (MMA), which uses a state-based model to dynamically decide the correct managementpolicy to handle events, such as new workload arrival or failure of a cooling unit, that can trigger an increase in the ambient tem-perature. Each event is associated with a time window, referred to as the window-of-opportunity, after which the temperature at theinlet of one or more servers can go beyond the redline temperature if proper management policies are not enforced.
This window-of-opportunity non-linearly decreases with increase in the incoming workload. The selection of the managementpolicy depends on their potential energy benefits and the conformance of the delays in their actuation to the window-of-opportunity.Simulations based on actual job traces from the ASU HPC data center show that the JPCM can achieve up to 18% energy-savingsover separated power or job management policies. However, high delay to reach a stable ambient temperature (in case of coolingmanagement through dynamic thermostat setting) can violate the server redline temperatures. A management decision chart isdeveloped as part of MMA to autonomically employ the management policy with maximum energy-savings without violating thewindow-of-opportunity, and hence the redline temperatures. Further, a prototype of the JPCM is developed by configuring thewidely used Moab cluster manager to dynamically change the server priorities for job assignment.
Key words: Data Center; Coordinated Management; Job Management; Power Management; Cooling Management.
1. Introduction
Computing infrastructures are increasingly deployed as clusters in current data centers for both scientific and web-
based applications. With the boom of Internet-based mass services of this decade, from massive multi-player games
∗ Corresponding author.Email address: [email protected] (Sandeep K. S. Gupta).URL: http://impact.asu.edu/ (Sandeep K. S. Gupta).
1 This work was funded in parts by NSF (CNS#0649868, CNS#0855277, and CSR#0834797), SFAz and Intel.
Preprint submitted to Elsevier 19 August 2010

to web-based email and personal pages, along with the increase of corporate server farms and data storage facilities,
there has been a great growth of data centers [1–4]. This paper focuses on autonomic management of data centers.
1.1. Motivation and Requirements
The demand of the users from the data centers mainly involves availability of the computing services contingent to a
pre-defined Service Level Agreement (SLA) for the workload (e.g. throughput, turnaround time and number of jobs
violating deadline). The workload can be a set of scientific jobs for High Performance Computing (HPC) data centers
or a set of transactional requests for data centers serving web-applications, financial institutions, or data retrieval
and mining. From here on, the term job will be used to refer to any workload. SLAs can be defined in terms of the
jobs turn-around times, i.e. the time from the submission of a job in the data center to its completion, or throughput,
i.e. the number of jobs serviced per unit time. Reliable operations of the computing equipment is essential to ensure
service availability. As such, it is imperative to maintain data center operating temperatures within the manufacturer-
specified redline temperatures for reliable operation. On the other hand, the Total Cost of Ownership (TCO) of the
data centers can be enormous because of a large amount of recurring energy cost, about half of which can be attributed
to cooling [5].
The energy used in data centers has been increasing; an IDC IT Experts Survey estimated that data centers will
consume 3% of the total USA’s power budget in this year. Moreover, the power density increases: the energy efficiency
doubles every two years, while the performance of ICs triples in the same period. Hence, hardware power efficiency is
offset by the increasing miniaturization and density of equipment [1]; consequently, power draw at-the-plug will only
increase [2]. Processors will keep increasing their number of cores. Altogether, this means that we will see more and
hotter data centers in the near future. Toward enforcing energy efficiency, the United States Congress passed a bill in
2006 to ask government agencies to investigate the energy efficiency of data centers as well as industry’s efforts to
develop energy-efficient technologies.
Many existing data centers are doing very little to be energy efficient: power management software is disabled [6],
cooling is over-provisioned, and some still use low-efficiency power supplies; all these result in a high Power Usage
Efficiency (PUE) 2 . In a recent survey of the Uptime Institute, about 46% of the data center operators do not use power-
save features and 38% do not turn off unused or under-used servers. The most popular reasons given were “lack of
person-hours to catalog applications and analyze impacts” and “fear of unknown impacts on critical applications”,
with “lack of support or mandate from more senior executives” being the third most popular. It is therefore important
to perform a study on the benefits and impact of the different management policies and develop a novel management
architecture that dynamically regulates the data center operation in terms of cooling, job execution, and server power
levels while ensuring the following:
(i) Dependability: The data center management has to be dependable ensuring uninterrupted service without
much failures. To this effect, data center management needs to facilitate two principal sub-properties: i) equip-
ment reliability, i.e. maintaining safe operational temperature (usually within the manufacturer-specified redline
2 PUE is the ratio of total power consumption over the computing power consumption to service the jobs in a data center.
2

t i m e
c o o l i n g
t i m e
c o o l i n g
c o o l i n gn e e d
c o o l i n gr e s p o n s e
a r e a o fc r i t i c a l e x p o s u r e
a r e a o fi ne f f i c i ency
t i m e
c o o l i n g
p r e d i c t i v e / p r o a c t i v e c o o l i n g
t i m e
c o o l i n g
p r e d i c t i v e / p r o a c t i v e c o o l i n g
c o o r d i n a t e d w i t h D V F S
( a ) (b )
(c ) (d )
c o o l i n g a c t u a t e s p r o a c t i v e l y
s ta r t o f j ob e n d o f j o b
p r o c e s s o r s a d j u s t V / F f o r s m o o t h e r h e a t - u p
Fig. 1. Conceptual plots of the cooling delay problem. (a) A reference plot for medium density data center: the thick line shows the need for coolingwhile the thinner line shows the cooling supply; the supply closely follows the need. (b) In highly dense data centers, the equipment heats up fasterand higher; however, the cooling technology is still as slow to respond, creating windows of critical heat exposure and of inefficiency.
temperature) of the servers to avoid failures and any resulting down-times; and ii) serviceability, i.e. meeting
the SLAs usually through timely job execution at the required rate.
(ii) Sustainability: The data center management has to be sustainable ensuring green and energy-efficient op-
eration. Energy consumption can be reduced through increasing the CRAC thermostat and by enforcing low
power modes of server operation. However, both these measures may affect the reliability and serviceability,
respectively, of the data centers. Therefore, the management architecture has to make decisions in a coordinated
manner by making the data center operations sustainable as far as possible without violating the dependability.
The data center management further has to be autonomic in nature to adapt to the dynamic changes in the cooling and
server power requirements depending on the job to service.
1.2. Challenges
The aforementioned requirements reflect the entirety of the data center. This entirety suggests considering the data
center as a Cyber-Physical System, and its operation should be designed from a cyber-physical point of view. We
identify three principal aspects for managing cyber-physical data centers: i) management of the computing entities, e.g.
computing equipment and incoming job; ii) management of physical entities, e.g. cooling unit; and iii) coordination
among the different computing and cooling management policies. The following is the list of challenges:
– Trade-off between energy consumption and SLAs: Computing equipment management principally involve power
management and server provisioning. Power management can incur throttling of the servers; potentially affecting
the SLAs through degradation in throughput and turnaround time. Further, cooling energy has an indirect impact on
the SLAs. Cooling units are normally associated with thermostat set temperatures which determine the operating
temperatures maintained in the room. Increasing the thermostat set temperature increases the temperature output
of (or supplied from) the cooling unit. This increases the coefficient of performance (CoP) 3 , i.e. the ratio of the
removed heat over the energy required to do so, which can reduce the cooling cost. However, increase in supply
temperatures can cause the operating temperatures to go beyond the redline. This may lead to automatic throttling
in much equipment; thus potentially affecting the SLAs.
– Cooling delay problem: In data centers of 500 W/m2 (∼ 50 W/ft2), or about 1.5 KW per chassis, it takes a couple
of minutes before the systems reach critically high temperatures when cooling fails, while in higher densities,
3 CoP has a dependence on the air supply temperature; the cooler the air demanded the worse (lower) the CoP.
3

inadequate cooling can cause the equipment to reach those temperatures in only seconds [7]. At the same time,
it takes a few minutes, depending on the temperature difference, before a cooling unit reaches a desired output
temperature. This means that, in near-future data centers of high density (technology will provide 16-core or 32-
core systems in the next 10 years that can reach or exceed 6 kW/ft2), if servers suddenly increase their power
consumption, cooling will react too slowly to their needs thus possibly causing throttling (Figure 1a and b). We
identify this problem as the cooling delay problem, and we predict that it will become more dominant as the power
density of data centers increases and the cooling works closer to the redline temperatures to save cost. The cooling
delay problem also creates a second effect at the end of the job’s cycle, where the cooling needs cease yet the
cooling system reacts slowly to the end of the need, thus creating a period of inefficiency, i.e. supplies more cooling
than needed (Figure 1b).
– Pro-active vs. reactive management policies: A way to counter the cooling delay phenomenon is to pro-actively
set the thermostat at a lower value such that any temperature increase during the cooling delay would remain below
the redline temperatures. However, such proactive measures will increase the cooling energy consumption [8–10]
and consequently the PUE of the data centers. On the other hand, as mentioned previously any reactive measure of
server throttling when the redlines are reached may possibly violate the SLA requirements.
– Coordinated management decision making: Computing and cooling management decisions need to be coordi-
nated to incur synergistic benefits on the energy consumption. Previous work [9] has focused on thermal-aware
job management, which performs thermal-aware spatio-temporal job scheduling, i.e. decides on when to execute
the jobs and at which equipment in such a way that hot servers are avoided and the cooling demand is reduced.
This reduction in cooling demand is exemplified in Figure 2. In this figure, there are two jobs, Job1 and Job2, to
be assigned to two of the three servers shown. When a job is submitted in the left most server, thermal hot-spots
can generate requiring lower thermostat set temperatures (as shown in Figure 2a for non-thermal-aware job man-
agement). The thermal-aware job management submits the jobs to the two right most servers and avoids the left
most server (Figure 2b). As result the minimum required thermostat set temperatures for all the servers (including
the left most server) increases to 20°C from 18°C in Figure 2a. Coordination of such thermal-aware management
with the cooling unit management can enable dynamic variation of the cooling thermostat set temperatures. Figure
2c shows that such coordination actually enables higher thermostat set temperatures in the cooling unit. However,
the employment of such coordinated management would depend on the time taken for the management policy to
take effect. For example, if the cooling delay is too high, then setting the thermostat to a higher value may lead to
violation of the redlines when there is a sudden increase in the cooling demand (Figure 1) caused by events such as
a sudden burst of job or failure of other cooling units.
1.3. Goal and Contributions
Given the aforementioned management requirements and challenges, the goal of this paper is to study the benefits and
impacts of different management policies and enable autonomic management decision making to employ the right
policy at the right time such that the data center energy consumption is reduced while maintaining the SLAs and the
4

CRAC
Thermostat = 18o C(worst-case settings)
Requires
Thermostat
to be 18o C
Requires
Thermostat
to be 20o C
Requires
Thermostat
to be 22o C
(a) Independent non-thermal-aware job management and cooling management
Hot
server
CRAC
Thermostat = 20o C(dynamic settings)
Requires
Thermostat
to be 22o C
Requires
Thermostat
to be 20o C
Requires
Thermostat
to be 22o C
(c) Coordinated thermal-aware job management and cooling management
Job1
Job2
Job1
Job2
CRAC
Thermostat = 18o C(worst-case settings)
Requires
Thermostat
to be 22o C
Requires
Thermostat
to be 20o C
Requires
Thermostat
to be 22o C
(b) Independent thermal-aware job management and cooling management
Job1
Job2
Fig. 2. Example of data center management for three servers and two jobs where the first (i.e. the left-most) server can create hot-spot if a jobis assigned to it. Integrated job management and cooling management can enable higher CRAC thermostat settings (to reduce cooling energyconsumption).
equipment redline temperatures. To this effect, the contributions of this paper are as follows:
(i) Model-driven Management Architecture (MMA), which makes dynamic management decisions in an autonomic
manner by taking into account the energy-benefits of different management policies as well as the delay for the
policies to take effect;
(ii) Coordinated Job, Power, and Cooling Management (JPCM) Policy, that integrates thermal-aware job manage-
ment with cooling management and power management; and
(iii) Implementation of the coordinated job management, its verification in terms of the energy-benefits and impact
because of cooling delay, and developing management decision chart for a data center based on the impact-
benefit analysis.
This work is a part of the BlueTool research infrastructure project funded by the National Science Foundation (NSF) 4 ,
where a miniature data center test-bed is being developed to test and evaluate different management algorithms.
1.4. Summary of Approaches and Results
The MMA uses workload model, power model, and data center thermal model to predict the impact of the workload,
power, and cooling management decisions. Predictions from these models are then used to make coordinated decisions
on the best management policy to employ among seven different policies: i) Power Management (PM), i.e. run the
servers at the correct power modes [11, 12]; ii) Job Management (JM), i.e. execute the jobs at the correct time and at
correct servers [8], iii) Cooling Management (CM), i.e. set the thermostat at the correct temperature, iv) Coordinated
4 http://www.nsf.gov/awardsearch/showAward.do?AwardNumber=0855277
5

Power and Job Management (PJM) [9], v) Coordinated Power and Cooling Management (PCM), vi) Coordinated Job
and Cooling Management (JCM), and vii) Coordinated Job, Power, and Cooling Management (JPCM) 5 .
There are two steps taken. Firstly, assuming availability of the dynamic thermostat resetting facilities of the cooling
unit, a JPCM policy is developed that integrates the job management decision with power management and cooling
management. To this effect, the jobs are assigned to servers in a way that allows higher thermostat settings for the
cooling unit to reduce energy consumption (as depicted in Figure 2). Simulation results, based on actual job traces
from the ASU HPC data center, show that the JPCM policy can achieve up to 93.4% energy-savings over cooling
over-provisioning, no power management, and simplest job management. Further, this savings can be up to 12%
higher than that of only power management policies. These savings depend on the utilization of the data centers.
A prototype implementation of the JPCM is performed by configuring a widely used cluster management software,
named Moab [13], such that the server priorities for job assignment are dynamically changed.
Secondly, the selection of the best management policy is contingent upon: a) the energy-savings, and b) the delay in
actuating the policy. Given an event (e.g. new job arrival, failure of a cooling unit, and server failure), there is a time
window, referred as the window-of-opportunity, after which the redline temperature is reached. The actuation delay
for any management policy has to be within this window. The aforementioned simulation study shows that for the
ASU HPC data center the window non-linearly decreases with the increase in the incoming workload. A management
decision chart is developed that employs different management policies under different conditions depending on the
conformance to the window-of-opportunity.
1.5. Organization
The rest of the paper is organized as follows. Section 2 presents the related work followed by the background on data
center design and management in Section 3. Sections 4 and 5 present the MMA architecture and the JPCM policy,
respectively. The simulation based verification is presented in Section 6 followed by the prototype implementation in
Section 7. Finally, Section 8 concludes the paper.
2. Related Work
This section presents the related work on data center management. A hierarchical taxonomy of management concepts,
where each concept abstracts and generalizes the ones below it, is depicted in Figure 3. Power management and server
provisioning (including virtualization) can be abstracted to resource management. Job management, which includes
the scheduling and dispatching of jobs in combination with resource management is viewed as cluster management.
Next-generation software that performs a holistic management of a data center facility, e.g. combines cluster man-
agement with cooling management, is considered a greater generalization of data center management. Most research
on data center management has been focusing on how to improve the energy efficiency (reduce the energy con-
sumption). This can be achieved by a combination of server provisioning [14] and power management [11, 15–18]
schemes. Server provisioning refers to allocating servers to a service, whereas power management mostly refers to
5 The letters ‘P’, ‘J’, and ‘C’ stand for ‘Power’, ‘Job’, and ‘Cooling’, respectively. A combination of these letters denote the coordination amongthe corresponding management policies. The letter ‘M’ is used for all the policies to denote ‘management’.
6

cooling management(http:
//www.aperture.com/solutions/vista_cooling.
php)
DVFSmanagement [19]
powermanagement [11,15–18]
server provisioning [14]
�����aaaaa
computing resourcemanagement [25,26]
thermal-aware jobmanagement [27]
job management
�����
hhhhhhhhhh
clustermanagement [23,24,28,29]
((((((((((((((aaaa
integrated facilities management
Fig. 3. Hierarchical taxonomy of research on data center management.
turning servers on or off and dynamic scaling of voltage and frequency [19]. Another approach to energy efficiency is
by managing the jobs to reduce the energy consumption.
It is easy to see that turning a subset of the servers on or off can be viewed as a type of server provisioning. Cooling
management is traditionally tackled as a mechanical engineering problem where Computation Fluid Dynamics (CFD)
simulations of data centers are performed to determine placement of equipment so as to reduce cooling loads [20,21].
Apart from these, cooling has been dynamically provisioned based on the ambient sensor data in the data centers [22].
This paper makes data center management cyber-physical in nature by coordinating cooling management with job and
power management (using concepts from thermodynamics and resource management). In fact, as one moves up the
taxonomy tree and combines separate management concepts to yield a more abstract one, they can combine, integrate,
and coordinate separate management techniques to yield an augmented management technique.
Autopilot [23] is a cluster management software by Microsoft, specialized for the online Windows Live™ services.
The basic requirement is fault tolerance and resilience, with the objective to maximize reliability and availability of
the offered services. A design principle engaged is simplicity so that the system can work well in the large scale. The
cluster management software is thus organized into management service agents: deployment service, provisioning ser-
vice, repair service, watchdog service, and device manager. One of the lessons learned is for the resource management
software to be able to distinguish between failed servers and overloaded servers.
Galaxy [24] is a proposed management framework with an array of communication and management techniques to
work with large-scale enterprise clusters. Lessons learned in addressing high scalability include: (i) take advantage of
the scale, i.e. use HPC algorithms that work in large scale, (ii) counter performance degradation, (iii) avoid server-side
transparency, (iv) do not attempt to solve all problems in the middleware, (v) avoid service transparency.
As opposed to the aforementioned management approaches, this paper focuses on a coordinated management of
the data center resources. In this regard two directions have been taken: i) development of coordinated job, power,
and cooling management policy; and ii) management decision making on what management policy to employ at what
time depending on the data center state, potential energy-savings, and delay of the management policies to take effect.
7

3. Background on Data Center Design and Management
Before getting into the details of the novel management architecture, this section provides a brief overview of the
current state of the art in data center design and management. Contemporary data centers use raised floors and lowered
ceilings for cooling air circulation, with the computing equipment organized in rows of 42U racks arranged in an aisle-
based layout, with alternating cold aisles and hot aisles. The computing equipment is usually in blade-server form,
organized in 7U chassis. Also, in data centers, server racks can have chiller doors, which supplement the CRAC by
cooling down the hot air coming out of the blade servers before it enters the data center room [30]. The cooling of the
data center room is done by the computer room air conditioning (CRAC), also known as the heating and ventilation
air conditioner (HVAC). They supply cool air into the data center through the raised floor vents.
The supply air temperature depends on the thermostat set temperatures of the CRAC. The supply air temperature
increases with increase in the CRAC thermostat set temperature [31]. The supply air flows through the chassis inlet
and gets heated up due to the power consumption of the computing equipment and hot air comes out of the chassis
outlet. The hot air goes to the inlet of the CRAC which cools it down. However, depending on the design of the data
center, parts of the hot air may recirculate within the room affecting the thermal map at various positions including the
inlet of the CRAC and the chassis. As such, different parts of the data center may have different temperatures because
of air recirculation. However, the CRAC modulates its behavior depending upon the temperature at its inlet. For the
simplicity of the analysis we consider that the inlet temperature temperature of the CRAC is equal to the average room
temperature.
From basic thermodynamics, we recall that the rate of temperature change in the room depends on the heat capacity
of the room and the difference between incoming and outgoing heat:
mroomcpdT (t)
dt= ∆P = Pin − Pout , (1)
where mroom is the air mass of the room, cp is the specific heat capacity of the air, T (t) is the temperature “function”
over time, whereas Pin and Pout are the incoming and removed power (i.e. heat rate), respectively. Pin is being intro-
duced by the servers and other equipment, while Pout is being removed by the CRAC. If the room is in an equilibrium,
there is as much heat removed as generated, and therefore there is no temperature change:
mroomcpdT (t)
dt= 0⇒
dT (t)dt
= 0. (2)
Further, for the reliable operation of the computing servers, the operating temperatures of the servers should not
exceed a manufacturer specified redline temperature. The operating temperature of the servers are determined from
an abstract heat recirculation model [8]. In this model, the heat recirculation from one server chassis (A) to the other
(B) is characterized as a coefficient (cAB). cAB is the fraction of air coming out of chassis A going to chassis B.
These coefficients are obtained by performing certain profiling steps [8] in a CFD simulation software. Given this
recirculation coefficient the inlet temperatures T ini for a chassis i can be obtained using the abstract heat flow model
and the power consumption model of the servers.
Management of data centers normally involves management of the computing equipment (i.e. the servers) and
Cooling Oriented management policy (CO). CO policy means properly setting the CRAC thermostat to the correct
8

temperature. Ideally, the thermostat should be set such that Eq. 2 holds and the ambient temperature in the data center
is within the redline. However, a recent study [31] shows that the CRAC operates in multiple modes, where in each
mode the Pout is different and it is not guaranteed to be the same as Pin. As such, the temperature may fluctuate. Most
common practice in the current data centers is to set a very low thermostat temperature for the CRAC, i.e. cooling
over-provisioning, to maintain the server inlet temperatures within the redline temperatures. However, this approach
leads to undesirably high cooling energy consumption; thus increasing the data center PUE. Apart from the CO policy,
there are two types of management performed for the servers, as described below:
(i) Power Oriented management policy (PO): In this management policy, the servers are throttled in terms of
their operating frequency and/or voltage power modes of the servers are adjusted to service the already jobs so
as to reduce the power consumption (and hence the heat generation). When the server inlet temperature exceeds
the redline temperature, the PO policy is normally enforced in a reactive manner. This can cause an undesirable
degradation in the job throughput and turnaround time; thus potentially violating the SLA requirements.
(ii) Job Oriented management policy (JO): In this policy, any new incoming jobs are scheduled and dispatched
for execution. A typical data center job management software, i.e. a cluster management software, consists of
a submission system, a queue system, a scheduler, a resource manager, and the actual resources (computing
servers, storage servers, networks etc). The submission system is the front end providing a service interface to
the cluster’s clients to submit their jobs in the queue. The scheduler usually decides on the order of execution of
the queued jobs. The resource manager has three roles: (i) monitoring of the resources, (ii) preparing and setting
up the resources, and (iii) dispatching the jobs. Examples of scheduling software are Moab [13] and Maui [32].
Examples of resource management software are SLURM [33] and Torque [34].
Many data centers further involve a combination of the aforementioned JO and PO policies, referred as the Coordi-
nated Job and Power Management (JPM), by turning off the servers where no jobs are scheduled to execute. The CO
policy is of individualistic nature in that it is normally enforced without the knowledge of the decision making in the
PO and JO policies. Integration of CO with the JO and PO can incur higher benefits in terms of the cooling energy
as discussed in Section 1 and depicted in Figure 2. Further, such integration can allow pro-active adjustment of the
CRAC thermostat temperature to avoid redline temperature without requiring any undesirable server throttling once
the redline is reached.
The possibility of reaching the redline temperatures normally precedes with events such as starting execution of new
jobs upon their arrival and/or failure of a cooling unit. We refer to such events which may cause the inlet temperature
to go beyond the redline temperatures as the critical events. Upon occurrence of such events, the redline is reached
after some time depending on the power density and the current temperature in the data center. We refer to this
time window as the window-of-opportunity, within which any management policy has to be actuated. For example,
once a critical event occurs, the CO can be employed by reducing the CRAC thermostat set temperature (which will
ensure cooler supply air from the CRAC). However, because of the cooling delay problem (described in Section 1 and
depicted in Figure 1), the cooling can take effect after the window-of-opportunity expires. Thus, the enforcement of
9

Active
Server Pool
Server
Resource
Utilization
Power
Consumpti
on
Temperature
Information
Workload
Trace
Synergistic Model-driven Data
Center Management
Coordinated Platform Power Manager
Data/Information Flow
Control Flow
Ambient Sensor Networks
Data Collection
Plane
ModelingPlane
Physical Plane
Cooling Manager
Workload Manager
Management Plane
Server Rack
CRAC
Data CenterRaised
Floor
Room
Roof
Application
Workload
Model
Power
Model
Thermal
ModelLearning Learning Learning
Fig. 4. Model-driven Management Architecture for Data Centers
the correct management policy when a critical event occurs depend on the energy benefits achieved while meeting the
SLA requirements and the server redline temperatures.
This paper migrates from the individualistic CO, PO, and JO to JPCM policy integrating the job, server power, and
cooling management. Section 5 will present the JPCM policy in further detail. Further, a novel autonomic coordinated
management architecture is developed which can decide on the correct management policy to enforce at the correct
time, as described in the following section.
4. Model-driven Management Architecture (MMA)
Given the data center management background in the previous section, this section presents the coordinated manage-
ment architecture that performs model-driven decision making. Figure 4 shows the management architecture. There
are four different operational planes: i) physical plane, ii) data collection plane, iii) modeling plane, and iv) man-
agement plane. The physical plane includes the physical deployment of the data center, the computing and cooling
equipment, the on-board and ambient sensors. The data collection plane gathers relevant data, e.g. processor utiliza-
tion, in-built temperature and power sensor data, from the physical layer. The data collection plane organizes the
gathered data in such a way that it can be used by the modeling plane for data correlation and model generation.
In this regard, three principal types of model generation are performed: i) thermal model, which requires correlation
10

Can cooling thermostat
dynamically change?
Is there a new
critical event?
Start
Determine the Window-of-opportunity
as per Eq. 8 (in Section 4.2.2.)
Is cooling management delay
< Window-of-opportunity?
Employ Coordinated Job and
Power Management (JPM)
Employ Coordinated Job, Power,
and Cooling Management (JPCM)
Is power management delay
< Window-of-opportunity?
Is job management delay
< Window-of-opportunity?
Employ Coordinated Power and
Cooling Management (PCM)
Is power management delay
< Window-of-opportunity?
Is job management delay
< Window-of-opportunity?
Employ Power Oriented
management (PO)
Is job management delay
< Window-of-opportunity?
Employ Job Oriented
management (JO)
Unmanageable
Situation
Employ Coordinated Job and
Cooling Management (JCM)
Employ Cooling Oriented
management (CO)
YesNo
Yes
Yes
Yes
Yes No
Is job management delay
< Window-of-opportunity?
No
No
No
No
No
No
No
Yes
Yes
Yes
Yes
Fig. 5. Coordinated data center management decision chart.
between the temperature and processor utilization; ii) power model, which requires correlation between power mea-
surement and processor utilization; and iii) workload model, which requires the history of job arrival and processor
utilization. The history is obtained from the job traces when the application submits the jobs for the job manager’s
perusal. Each of the model generation in the modeling plane further consists of a learning component to dynamically
adapt the model according to the changes in the data center behavior and job characteristics. The following subsection
discusses the automated model generation.
4.1. Automated Model Generation from Collected Data
Fast, cost-effective and non-invasive methods are required to generate thermal, workload, and power models. These
methods: i) should use data from built-in and ambient temperature sensors and from OS statistics; and ii) should be
self-managing in nature with dynamic learning capabilities. The main challenge is to eradicate the calibration phases
and any extensive additional hardware requirements. For example, the CRAC settings may be unnecessary, at least
as inputs, because since they are responsive to temperature at the thermostat, the temperature should be a function of
the server utilization with respect to time. If these two factors can successfully be removed we have removed both
the need for administrators to install and network sensors on the CRAC units and the need to extensively measure the
physical layout of the data center. Our previous works have focused on thermal and power model generation from the
data collected [35, 36]. This paper focuses on the management decision making that is driven by these models.
11

4.2. Management Policy Selection
The model-driven coordinated manager gets input from the model regarding the current and predicted behavior of
the data center and the job and makes decisions on the correct policy enforcement whenever there are new jobs to
be serviced or there are failures in any of the CRAC units in the data centers. Seven management policies have been
considered in this regard: i) JO, ii) PO, iii) CO, iv) JPCM, v) JPM, vi) Coordinated Power and Cooling Manage-
ment (PCM), and vii) Coordinated Job and Cooling Management (JCM). The last two management policies are two
different variations of the JPCM policy where the dynamic cooling thermostat setting is integrated with only power
and job management, respectively. Figure 5 shows the decision chart for the synergistic management decision making
component in the management layer of the MMA architecture. As shown in the chart, the data center is monitored
for the critical events. This monitoring can be performed using the data collected from the information from the data
collection and the modeling layers of the MMA architecture. When a critical event is detected, a management policy
is employed depending on the conformance to the window-of-opportunity to avoid reaching redline temperatures. The
selection of the proper management policy depends on a quality metric described in Section 4.2.3.
The data center is considered as a state-based system in which it can be in one of the two states: i) normal, and
ii) critical. In the normal state, all the active equipment (i.e. the equipment which are on and running) can service
all the jobs without any SLA violations and there is no possibility of the ambient temperature to reach the redline
temperatures. The data center is said to be in the critical state when there is a possibility of the ambient temperature
to reach the redline temperatures. Events that cause the data center to transit from the normal state to the critical state
are called the critical events. Following are the critical events in a data center:
– change in workload: these events may increase the load on the active servers both in terms of computation and
power consumptions (possibly causing violations of the redline temperatures).
– cooling unit failures: these events increase the possibility of redline temperature violations especially when there is
high workload in the data center generating high heat.
The aforementioned seven management policies can bring the data center back to the normal state and their em-
ployment depends on the decision chart in Figure 5. Before describing the quality metric for selecting the proper
management policy the following subsection describes impact of the cooling delay on the ambient temperature in the
room. Based on the rate of increase in the ambient temperature, the window-of-opportunity will then be derived in
Section 4.2.2.
4.2.1. Impact of Cooling Delay on Temperature
Cooling equipment responds to heat changes with a delay; this delay is due to the periodic sampling of electronic
sensing circuits (a couple of seconds), the delay of the mechanical parts switching their compression mode (several
seconds), and the delay of saturating the heat capacity of the agent in the internal cooling cycle (several seconds,
perhaps minutes). During this summed delay, if the data center generates heat at a different rate than what is currently
being extracted, it will either heat up or cool down. As shown in the example below, it is possible that if the data center
12

is heating up, the delay may be enough long to let the ambient temperature break the redline limit of the computing
equipment. Whether this delay is enough to potentially cause trouble (i.e. breaking the redline) depends on the value
of delay and how fast the room can heat up in this time. With the increased heat density in data centers and differential
between idle and maximum power consumption, this becomes more and more plausible.
The cooling delay problem arises when all (or enough) servers simultaneously and abruptly maximize their power
consumption. For simplicity, consider that at time t◦, Eq. 2 holds when all the servers are at idle (i.e. all servers are on
and at zero CPU utilization):mroomcp
dT (t◦)dt
= Pidle − Pout = 0⇒ Pout = Pidle. (3)
In the next moment, consider that all servers immediately go to a maximum utilization (because they just received
a large and CPU-intensive job). The heat generated is increased and the room starts heating up. Using Eq. 1, the
heating-up rate is expressed as:mroomcp
dT (t)dt
= Pmax − Pout(3)= Pmax − Pidle (4)
which means that it depends on the difference between the idle and maximum power draw by the equipment. Solving
for dT (t)/dt, and assuming that td is the cooling delay, we have:
dT (t)dt
=Pmax−Pidle
mroomcp⇒
∫ t◦+td
t◦
dT (t)dt
dt =
∫ t◦+td
t◦
Pmax−Pidle
mroomcpdt ⇒ ∆T =
Pmax−Pidle
mroomcptd =
∆Pmax
mroomcptd (5)
Eq. 5 above gives great insights into designing or configuring data centers. First, it suggests that the power differential
(∆P) between idle and maximum power consumption should exceed the responsiveness of the cooling system. Sec-
ondly, it suggests that the thermostat setting should be so low such that the ambient temperature is sufficiently below
the redline (by ∆T degrees). This is required to prevent equipment inlet temperature T ini from surpassing the redline
during cooling delay. Third, the bigger the data center room is with respect to the equipment, and thus the more the
air in it, the lesser is the severity of dependence between the temperature rise and the power rise.
Using Eq. 5, we can find what should be the temperature of the room at time t◦ so that the ambient temperature
does not reach the redline at time t◦+td. The redline is not breached, i.e. the equipment is safe, when the server having
the maximum inlet temperature satisfies the following:
maxi(T ini (t◦ + td)) 6 Tredline
(5)⇒ maxi(T in
i (t◦)) + ∆T 6 Tredline ⇒ maxi(T ini (t◦)) 6 Tredline − ∆T (6)
Therefore, if the thermostat is set to achieve a maximum chassis inlet temperature below Tredline−∆T , then not a single
server will violate the redline temperature.
Further, Eq. 5 finds a relationship between the cooling delay and the heat density. As we know from related arti-
cles [7, 37], multicore technology and consolidation trends increase the heat density of IT equipment, and therefore
the heat density of data centers. EPA projects that data centers can reach up to 6 KW/ft2 (∼60 KW/m2) of heat den-
sity [38]; the standard height of data center rooms is 10-12 feet (∼4 m). Another trend of IT equipment technology is
the linearity of power consumption [11,18,35], which aims to lower the idle power consumption as much as possible.
This means that contemporary or future equipment can exhibit a dynamic power density Φ in the range of 1 KW/ft2
to 6 KW/ft2, that is a maximum power differential ∆Φmax of 5 KW/ft (∼50 KW/m2). Replacing the above information
in Eq. 5, we have:
13

∆T =∆Pmax
mroomcptd =
∆ΦmaxAroom
Hroom Aroom ρair cptd =
∆Φmax
4 m · 1150 gm3 · 1.01 J
g·Ktd ≈
∆Φmax
5000 Jm2K
td (7)
where Aroom and Hroom are the area and the height of the data center room, respectively, and ρair is the air-density
in the room. From the above equation, it can be deduced that for ∆Φmax of 50 KW/m2(=5·104 J/s·m2), ∆T will be
10td. For a cooling delay of only 5 seconds, this means 50 °C. Equation 7 can be used to determine the acceptable
maximum power density differential ∆Φmax in the data center during the cooling delay. The equation can also be used
to determine the rate of increase in the ambient temperature given a change in the power density. Based on this, the
window-of-opportunity to respond to a critical event is derived in the following subsection.
4.2.2. Window-of-opportunity
The window-of-opportunity is determined by the time to reach any server redline temperature when any of the
critical events occur. Eq. 7 can be used for this purpose by extracting the rate of increase in the ambient temperature
and then performing simple algebraic operations to obtain the time to reach the redline temperature. The window-of-
opportunity, W, can then be given as:W =
(Hroomρair cp
) ∆T∆Φmax
(8)
Any management policy that can be successfully completed within W can be selected to respond to the critical events.
In case of multiple such policies, the proper selection of the management policy would depend on a evaluation metric
that can capture the quality of the policies.
4.2.3. Decision Evaluation Metric
The quality of a management policy depends on two aspects: i) energy consumptions; and ii) equipment redline
temperature violations. The last aspect is essential to bring the data center back to the normal state. The window-of-
opportunity of the response actions would be dependent on the time to violate the equipment redline temperatures.
The first aspect is essential to determine the best response policy among the ones that do not violate the equipment
redlines. An optimal policy would be one which minimizes the energy consumption in the normal state without the
aforementioned violations; however, such a policy would be time-consuming and would not satisfy the responsiveness
to the critical events. The job scheduling problem, itself, is NP-complete in nature [9, 39] and for the ASU HPC
data center it takes hours of operation to determine the optimal thermal-aware job scheduling and placement [9].
Augmentation of power-management and cooling management would further increase the complexity of the policy
decision making. In this section, we propose a quality metric for the decision making that can determine how bad the
decision can be with respect to the optimal. The metric is given by:
Qpol =
data center energy consumption for policy pol
data center energy consumption for optimal policy opt =Epol
crac+∑
∀i∈Nεiβ
poli υ
poli
Eoptcrac+∑
∀i∈Nεiβ
opti υ
opti
tpold 6 W
∞ tpold > W
(9)
where tpold is the delay to complete the response using policy pol (note that for the cooling management policies
this is the cooling delay td in Eq. 5), Epolcrac and Eopt
crac are the energy consumptions of the CRAC unit when pol and
opt policies are employed, respectively, N is the set of all the computing server in the data center, εi is the energy
consumption of server i at the highest power level and at full utilization, βpoli and βopt
i are the power level of server
i when policies pol and opt are employed, respectively, and υpoli and υopt
i are the processor utilization of server i for
14

policies pol and opt, respectively. Qpol is referred to as the quality metric of a policy pol. Note that Qpol > 1 and any
decision at a critical state needs to select a policy with the minimum Qpol. The energy consumption expressions on the
numerator and denominator of Equation 9 considers the cooling (CRAC) energy, the power levels of the individual
servers, and the processor utilization in each servers. As such, the ratio is applicable to cooling management, server
power management, and job management policies or any combination of these policies.
Based on this metric, the decision chart in Figure 5 is obtained from the verification results on the energy consump-
tion in Section 6.3. As shown in the decision chart, when the delays for all the cooling, power, and job management
policies are within the window-of-opportunity, the JPCM policy is employed since it has the lowest Qpol among all the
other policies (Section 6.3). The following section describes the coordinated management policies in further detail.
5. Coordinated Management Techniques
This section presents the coordinated management policies for data centers. The selection of the exact policy for
the data center can be performed based on the decision chart in Figure 5. For coordinated management, a three tier
architecture is proposed. The following three paragraphs further describe the tiers.
Power Management (PM) tier: This is the first tier of the management architecture, which is responsible for
selecting the set of active servers to serve a given workload. This selection is done based on static server ranking.
Three types of static ranking are considered:
(i) Thermostat Setting Based (TSB), where the servers are ranked in a descending order of the maximum allowable
thermostat setting required to keep the server inlet temperature within their respective redline (Equation 6),
(ii) Recirculated Heat Based (RHB), where the servers are ranked in ascending order of the amount of heat recircu-
lated from it to other servers, and
(iii) Default, i.e. a random ranking set by data center operator. Further, the decision to turn the idle servers on or off
is also taken in this tier.
Job Management (JM) tier: The second tier is the JM tier, which performs the thermal-aware temporal scheduling
and spatial placement of the jobs. Two approaches are employed for the temporal scheduling:
(i) the Earliest Deadline First (EDF) approach for HPC data centers where the user-specified jobs’ estimated exe-
cution time is used as the jobs’ deadlines; and
(ii) the First Come First Serve (FCFS) approach for data centers where the SLAs involve jobs’ throughput.
Employing these strategies for temporal scheduling ensures that the management policies do not compromise jobs’
SLAs, which may include meeting of job deadlines or achieving the highest throughput. The assignment of the sched-
uled jobs to the servers is performed using the same ranking mechanisms described in the PM tier.
Cooling Management (CM) tier: The third tier is the CM tier, which is responsible for setting the CRAC ther-
mostat. The management policies can either keep a constant thermostat setting for the entire data center operation
(henceforth referred as Constant Cooling) or may vary it according to the incoming workload (referred as the Coor-
dinated Cooling). The thermostat setting is to be determined such that the redline constraints are satisfied at all times
during the data center operation. To determine a constant thermostat setting, the maximum utilization in the data cen-
15

ter is considered. Given the job placement obtained in the first tier, the thermostat setting requirements for each server
is computed and the minimum setting is kept to avoid redline violation. For coordinated cooling, the job placement
is performed using the thermostat setting based ranking of servers. With every critical event, the thermostat setting is
re-evaluated based on the job placement and is set to the new value.
Critical events involve change in data center utilization that can cause servers to violate redline constraints. Three
types of critical events are considered :
– Arrival Event: when a job arrives, i.e. a job is submitted by the user, the incoming jobs are queued up and orders
them in EDF or FCFS order. After this ordering, if some job is projected to finish after its deadline, then it is
scheduled to execute at an earlier time, thus having the data center run multiple jobs at the same time.
– Start Event: two decisions are involved when a job is scheduled to start execution: 1) determination of the place-
ment of the job, which is done based on the static server ranking; and 2) determination of the thermostat setting of
the CRAC, which depends on the job placement. In this regard, the high thermostat setting of the CRAC, T thhigh, is
set to an upper bound such that the inlet remains within the redline temperature.
– End Event: when a job finishes execution, the placement changes since the job is removed from the server. As
such, the CRAC thermostat has to be set to a higher value without violating the redline temperature.
As shown in Figure 5, on occurrence of a critical event, the MMA first determines the window-of-opportunity and
then selects the appropriate management policy, which can bring the data center to a normal state. Upon a job arrival
the job queue is searched to find a proper start time of the job. This has a worst case complexity of O(Nh), where
Nh is the total number of jobs in the event period. For spatial scheduling, since the static server ranking is used, it is
only required to place the job in the required number of servers, which has a complexity of O(n), where n is number
of chassis. The complexity of the algorithm for an event period h is given by O(Nh(n + Nh)
)since scheduling and
placement decisions are performed for Nh jobs in the event period.
In the case of resetting the thermostat, the managing software computes two things: i) the excess over the redline
with respect to the current ambient temperature, Texcess; and ii) the time it takes to reach the temperature Tredline +
Texcess, starting from Tredline. For (i), it is Texcess = maxi(T ini (t◦)) + ∆T − Tredline. For (ii), it is texcess = Texcess
∆T td. After
computing the above, the managing software will lower the thermostat by Texcess and delay the dispatch of the job by
texcess time.
We consider combinations of the above mentioned tiers to develop several coordinated management policies apart
from the PO, JO and CO described in Section 3:
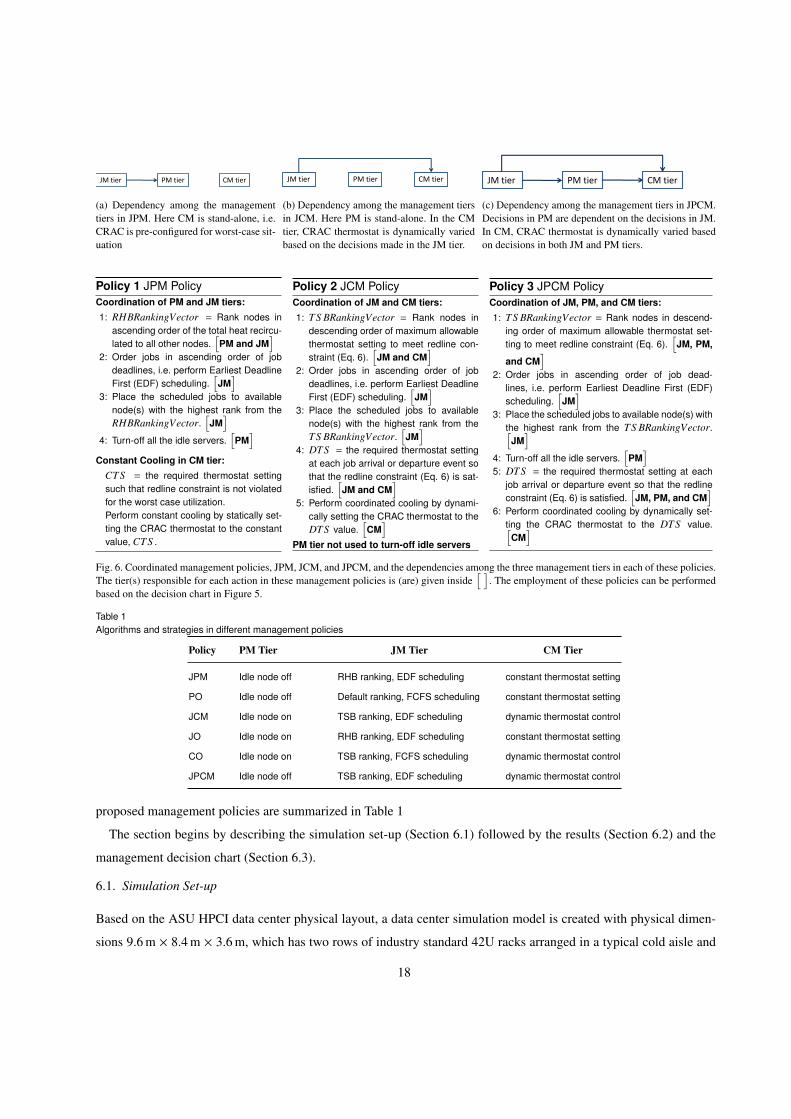
(i) Coordinated Job and Power Management (JPM): In this strategy, the first two tiers, PM and JM, are coordinated.
Policy 1 in Figure 6 shows the different management decisions made in JPM. Figure 6(a) further shows the
dependencies among the different management tiers in JPM. As shown in the Policy 1, jobs are scheduled based
on EDF approach (line 2, Policy 1, Figure 6). The decision is made in the JM tier. The scheduled jobs are then
assigned to servers based on the RHB server ranking (lines 1 and 3, Policy 1, Figure 6) to ensure minimum heat
recirculation in the data center. Such server assignment also determines which servers are idle (i.e. not utilized),
16

hence allowing the PM to turn off these servers (in line 4, Policy 1, Figure 6). The dependency of PM tier on
JM tier is shown Figure 6(a). Since CM tier is not coordinated with the PM and JM tiers, it is shown to be
stand-alone in Figure 6(a). In such a case, constant cooling is employed in the CM tier, i.e. the thermostat is set
to a constant value, Constant Thermostat Setting (CTS). CTS is determined from the worst case requirement on
the supply air temperature to keep all the servers within their redline when they are fully utilized.
(ii) Coordinated Job and Cooling Management (JCM): In this strategy, the JM and CM policies are coordinated.
Policy 2 in Figure 6 shows the different management decisions made in JCM. The dependencies among the
different management tiers in JCM are shown in Figure 6(b). Similar to the JPM policy, JCM uses the JM tier
to schedule jobs based on EDF approach (line 2, Policy 2, Figure 6). The jobs are assigned to the servers in
accordance with the TSB ranking (lines 1 and 3, Policy 2, Figure 6). The PM tier is not used and the idle servers
are always kept on, and hence the PM tier is shown to be stand-alone in Figure 6(b). Coordinated cooling is
performed (line 5, Policy 2, Figure 6) in the CM tier by dynamically resetting the thermostat set temperature of
the CRAC to a value, Dynamic Thermostat Setting (DTS). DTS is determined (line 4, Policy 2, Figure 6) based
on the required CRAC supply air temperature to satisfy the redline constraint (in Equation 6) for the TSB job
assignment performed in the JM tier. The dependency of CM tier on JM tier is shown Figure 6(b).
(iii) Coordinated Job, Power and Cooling Management (JPCM): This policy coordinates all the three tiers of JM,
PM, and CM. Policy 3 Figure 6 shows the different management decisions made in JPCM. This policy enhances
the JCM by using the PM tier to turn off the idle servers (line 4, Policy 3, Figure 6). The dependency of PM tier
on the JM tier is shown in Figure 6(c).Further, the determination of DTS is based on the required CRAC supply
air temperature to satisfy the redline constraint (in Equation 6) for the TSB job assignment performed in the JM
tier and idle server turn-off performed in the PM tier. The dependencies of CM tier on both PM and JM tiers are
shown Figure 6(c).
6. Simulation Analysis of Synergistic Data Center Management
Given the different management policies presented in the previous section, this section presents a simulation based
analysis of these policies in terms of the energy-savings, window-of-opportunity, and the actuation delay. Based on the
results, the management decision chart is developed as per the MMA architecture to employ the correct management
policy at the correct time that: i) maximizes energy-savings, and ii) conforms to the window-of-opportunity to avoid
reaching the redline temperatures. Apart from the coordinated management strategies, we also simulate the stand
alone job oriented (JO), power oriented (PO) and cooling oriented (CO) management policies in order to demonstrate
the effectiveness of the coordination. The JO policy employs the EDF scheduling algorithm, places jobs at the server
with lowest recirculated heat, keeps idle servers on and sets the CRAC thermostat to a constant value. The PO policy
employs the FCFS scheduling algorithm, places jobs at the first available server ranked arbitrarily by the data center
operator (Default), keeps idle servers off and sets the CRAC thermostat to a constant value. The CO policy employs
the FCFS scheduling algorithm, places jobs at the server with highest allowed thermostat setting, keeps idle servers
on and dynamically adjusts CRAC thermostat setting. The algorithms and strategies used in the different tiers for the
17
JM tier PM tier CM tier JM tier PM tier CM tier JM tier PM tier CM tier
(a) Dependency among the managementtiers in JPM. Here CM is stand-alone, i.e.CRAC is pre-configured for worst-case sit-uation
(b) Dependency among the management tiersin JCM. Here PM is stand-alone. In the CMtier, CRAC thermostat is dynamically variedbased on the decisions made in the JM tier.
(c) Dependency among the management tiers in JPCM.Decisions in PM are dependent on the decisions in JM.In CM, CRAC thermostat is dynamically varied basedon decisions in both JM and PM tiers.
Policy 1 JPM PolicyCoordination of PM and JM tiers:
1: RHBRankingVector = Rank nodes inascending order of the total heat recircu-lated to all other nodes.
[PM and JM
]2: Order jobs in ascending order of job
deadlines, i.e. perform Earliest DeadlineFirst (EDF) scheduling.
[JM]
3: Place the scheduled jobs to availablenode(s) with the highest rank from theRHBRankingVector.
[JM]
4: Turn-off all the idle servers.[
PM]
Constant Cooling in CM tier:
CTS = the required thermostat settingsuch that redline constraint is not violatedfor the worst case utilization.Perform constant cooling by statically set-ting the CRAC thermostat to the constantvalue, CTS .
Policy 2 JCM PolicyCoordination of JM and CM tiers:
1: TS BRankingVector = Rank nodes indescending order of maximum allowablethermostat setting to meet redline con-straint (Eq. 6).
[JM and CM
]2: Order jobs in ascending order of job
deadlines, i.e. perform Earliest DeadlineFirst (EDF) scheduling.
[JM]
3: Place the scheduled jobs to availablenode(s) with the highest rank from theTS BRankingVector.
[JM]
4: DTS = the required thermostat settingat each job arrival or departure event sothat the redline constraint (Eq. 6) is sat-isfied.
[JM and CM
]5: Perform coordinated cooling by dynami-
cally setting the CRAC thermostat to theDTS value.
[CM]
PM tier not used to turn-off idle servers
Policy 3 JPCM PolicyCoordination of JM, PM, and CM tiers:
1: TS BRankingVector = Rank nodes in descend-ing order of maximum allowable thermostat set-ting to meet redline constraint (Eq. 6).
[JM, PM,
and CM]
2: Order jobs in ascending order of job dead-lines, i.e. perform Earliest Deadline First (EDF)scheduling.
[JM]
3: Place the scheduled jobs to available node(s) withthe highest rank from the TS BRankingVector.[
JM]
4: Turn-off all the idle servers.[
PM]
5: DTS = the required thermostat setting at eachjob arrival or departure event so that the redlineconstraint (Eq. 6) is satisfied.
[JM, PM, and CM
]6: Perform coordinated cooling by dynamically set-
ting the CRAC thermostat to the DTS value.[CM]
Fig. 6. Coordinated management policies, JPM, JCM, and JPCM, and the dependencies among the three management tiers in each of these policies.The tier(s) responsible for each action in these management policies is (are) given inside
[ ]. The employment of these policies can be performed
based on the decision chart in Figure 5.
Table 1Algorithms and strategies in different management policies
Policy PM Tier JM Tier CM Tier
JPM Idle node off RHB ranking, EDF scheduling constant thermostat setting
PO Idle node off Default ranking, FCFS scheduling constant thermostat setting
JCM Idle node on TSB ranking, EDF scheduling dynamic thermostat control
JO Idle node on RHB ranking, EDF scheduling constant thermostat setting
CO Idle node on TSB ranking, FCFS scheduling dynamic thermostat control
JPCM Idle node off TSB ranking, EDF scheduling dynamic thermostat control
proposed management policies are summarized in Table 1
The section begins by describing the simulation set-up (Section 6.1) followed by the results (Section 6.2) and the
management decision chart (Section 6.3).
6.1. Simulation Set-up
Based on the ASU HPCI data center physical layout, a data center simulation model is created with physical dimen-
sions 9.6 m × 8.4 m × 3.6 m, which has two rows of industry standard 42U racks arranged in a typical cold aisle and
18

0 50 100 150 2000
200
400
600
800
1000
1200
Num
ber
of C
ores
Time Index (in number of 30 min time slots from start)
(a) 40 jobs, 25014 core-hours (peak utilization =5%)
50 100 150 2000
200
400
600
800
1000
1200
Num
ber
of C
ores
Time Index (in number of 30 min time slots from start)
(b) 120 jobs, 16039 core-hours (peak utilization= 40%)
0 50 100 150 2000
200
400
600
800
1000
1200
Num
ber
of C
ores
Time Index (in number of 30 min time slots from start)
(c) 174 jobs, 45817 core-hours (peak utilization= 80%)
Fig. 7. Two-dimensional Gantt-like plots of three submission log snapshots of the ASU HPC data center used as simulation scenarios. Each job isdepicted as a rectangle with the arrival time as the abscissa of its lower left corner, the estimated execution time as its length, and the requestednumbers of processors as its height (source: [9]).
hot aisle layout. The cold air is supplied by one computer room air conditioner, with the flow rate 8 m3/s. The cold air
rises from raised floor plenum through vent tiles, and exhausted hot air returns to the air conditioner through ceiling
vent tiles. There are ten racks and each rack is equipped with five 7U (12.25-inch) chassis. There are two different
types of computing equipment in the data center. Among the fifty chassis, there are thirty Dell PowerEdge 1955 (i.e.
three racks) and twenty Dell PowerEdge 1855 chassis.
6.1.1. Equipment Power Consumption
Power measurements of Dell Power Edge 1855 and 1955 blade servers were performed using the DUALCOM [40]
power meter from CyberSwitching Inc. Using the power measurements and performing linear regressions on the
data, the idle chassis power consumption (ω) and the single fully-utilized server power consumption (α) values were
computed to be 1820 and 72 Watts, respectively, for Dell Power Edge 1855 and 2420 and 175 Watts, respectively,
for Dell Power Edge 1955 [8, 36]. Further, these systems have only two power modes (β): i) turn on (β = 1), and ii)
turn off (β = 0). The simulations assume that the jobs are CPU-intensive. The estimated power consumption of the
resulting linear function has an error of 0.4–9% from the actual measurements. For a different utilization υ < 100%
the power consumption was scaled following a linear equation: P = ωβ + (υ/100)αβ.
6.1.2. Data center job profile
We used the ASU data center job traces of around one and half year for the simulation. The job traces provide: i)
the job arrival times, ii) their corresponding deadlines, iii) the number of processors required, and iv) the job start and
finish times. From this job log, a set of time-contiguous jobs are selected for each simulation run based on the peak
utilization during that interval. The SLA involves completion of the jobs within their respective deadlines. Figure 7
shows the distribution of the job arrival, and their deadlines. We further estimate the job execution times on the data
center equipment based on the actual execution times (calculated by taking a difference between the finish times and
the corresponding start times) in the ASU job traces.
6.1.3. CRAC cooling model
The CRAC had two operating modes. The temperature difference between the high and the low threshold is kept
at a constant value of 15 °C. The power consumption of the CRAC at the high mode was 350 KW which is greater
19

93.4% 92.4%
86.7%
6.4%3.2%
0.4%
74.01%
67.3%
61.9%
7.2%5.8%
0.8%
49.1%
44.1%
31.4%
6.1%4.9%
0.7%
5 40 800
2
4
6
8
10
12
14
16x 10
10
Utilization (%)
En
erg
y S
avin
gs (
Jo
ule
s)
Coordinated Job, Power, and Cooling Management (JPCM)
Coordinated Job and Power Management (JPM)
Power Oriented Management (PO)
Coordinated Job and Cooling management (JCM)
Job Oriented management (JO)
Cooling Oriented management (CO)
93.4% 92.4%
86.7%
6.4%3.2%
0.4%
74.01%
67.3%
61.9%
7.2%5.8%
0.8%
49.1%
44.1%
31.4%
6.1%4.9%
0.7%
Fig. 8. Energy savings (and percentage energy savings) of differentpolicies under different data center utilization.
0 0.5 1 1.5 2 2.5 3 3.5 4
x 105
46.5
47
47.5
48
48.5
49
49.5
50
50.5
Time (seconds)
The
rmosta
t S
et Tem
pera
ture
s (
de
gre
e C
)
JPCM
JPM
PO
JCM
JO
CO
Fig. 9. CRAC thermostat set temperatures with respect to time whendifferent management policies are employed (peak utilization = 80%, asshown in Figure 7(c)).
0 2 4
x 105
0
5
10
15
20
25
30
35
40
45
Time (seconds)
Job, Power, and Cooling Management (JPCM)
0 2 4
x 105
0
5
10
15
20
25
30
35
40
45
Time (seconds)
Job and Power Management (JPM)
0 2 4
x 105
0
5
10
15
20
25
30
35
40
45
Time (seconds)
Cooling Oriented management (CO)
Maxim
um
Chassis
Inle
t Tem
pera
ture
(degre
e C
)
Redline Temperature Redline Temperature Redline Temperature
Fig. 10. Maximum chassis inlet temperature for 80 % utilization under linear cooling model for different energy management policies. Only CM,JPM, and JPCM as representative of non-coordinated cooling, no cooling management, coordinated cooling management, respectively. JPCMallows highest maximum inlet temperatures temperatures (without violating the redline) among all the policies.
than the maximum computing power of the data center. The power consumption in the low mode was kept at 100 KW
which is equal to the idle power consumption of the data center considered. The switching time between the CRAC
modes was kept at 3 seconds.
6.2. Results
This section presents the simulation results in terms of the benefits and overhead of the management decision policies.
As described in Section 4, the benefits are calculated as the energy-savings incurred by the management decisions over
cooling over-provisioning, no power management and no thermal-aware job management. The impact of the manage-
ment policies is analyzed in terms of the conformance to the window-of-opportunity (i.e. successfully maintaining the
temperature within the redline temperature) when a burst of jobs arrives.
Figure 8 shows the energy-savings of different decision making policies described in Section 4 for 5%, 40%, and
80% utilization of the data center. It can be seen from Figure 8 that among the individual management policies, the
bulk of the energy savings comes from the PM (as high as 86.7% at low utilization and 31.4% at high utilization).
20

0 10 20 30 40 50 60 70 800
200
400
600
800
1000
Incoming Workload (%)
Win
dow
−of
−O
ppor
tuni
ty (
sec)
Fig. 11. Variation of window-of-opportunity w.r.t. incoming workload inthe ASU HPC data center.
10 20 30 40 50 60 70 800
20
40
60
80
100
120
Incoming Workload (%)
Ro
om
Te
mp
era
ture
(d
eg
ree
C)
Cooling Delay = 3 sec
Cooling Delay = 24 sec
Cooling Delay = 97 sec
Cooling Delay = 170 sec
Redline Temperature
Fig. 12. Variation of ambient temperature for different cooling delayw.r.t. incoming workload in the ASU HPC data center.
Energy-efficient JM can give energy savings of up to 5.8% at medium utilization (40%) while CM provides a benefit of
up to 0.8%. However, if the job and cooling management are performed in a coordinated manner, then the savings are
more than when they are performed individually (7.2%). Further, if the servers are turned off in a coordinated manner
along with job and cooling management, the benefits are greater than any of the individual management policies.
Figures 9 and 10 show the CRAC thermostat set-point and the maximum chassis inlet temperatures, respectively,
for highest data center utilization (i.e. 80 %) simulated. It can be observed that the JPCM policy allows the highest
thermostat set-point and manages to run the data center at the highest temperature without any chassis exceeding the
redline temperature. This enables energy efficiency in the data center by reducing the cooling requirements.
The time taken for the management policies to take effect is the cost of these policies. If the time for management
decision exceeds the window-of-opportunity then there is a risk of server inlet temperature exceeding the redline.
As suggested in Eq. 8, the window-of-opportunity depends on the change in the power density and on how far the
maximum inlet temperature is from the redline temperature (i.e. ∆Φ and ∆T in Eq. 8, respectively). Figure 11 gives the
variation of the window-of-opportunity with respect to the amount of incoming load. Here ∆T was set to Tred − Tinit,
where Tinit is the maximum inlet temperature before arrival of the incoming load (Tinit depends on the already existing
load) and ∆φ is the excess amount of load that arrives. As the incoming load increases the power density in the
data center rises and hence the rate of rise in the inlet temperature increases. This can cause the inlet temperature to
reach the redline faster, hence decreasing the window-of-opportunity. The delay in each individual management tier
is discussed as follows:
(i) CM Delay: It is the time taken by the cooling unit to bring the current ambient temperature to a specified set
point. Figure 12 gives the rise in ambient temperature for a given cooling delay. It can be seen from the figure
that if cooling delay is less than the minimum window of opportunity then the ambient temperature does not
exceed redline. However, if cooling delay is increased by 70 seconds the ambient temperature reaches redline
(before cooling begins) on arrival of 35% load. Thus it shows that with an increase in cooling delay by 70
seconds the amount of load potentially serviced (serviceability) decreases by 45%. This relation between the
21

cooling delay and serviceability can aide data center designers in choosing cooling units (based on the cooling
delay) given incoming load statistics.
(ii) PM delay: It is the time taken to change power modes (switching on and off in case of the Dell PowerEdge
servers) of the required number of servers to service the incoming load. The average time to turn on the servers
in ASU data center is approximately 120 seconds [41].
(iii) JM delay: It is the time taken for making the job management decision. This is determined by executing the
management algorithms in a high end computer using the Matlab 7.0 software. The Matlab clock was used to
obtain the execution time of the algorithms. The worst case time for the JM is around 300 milliseconds. Clearly,
JM has the minimum impact in terms of delay compared to the other management policies.
In JPCM policy, the job, power, and cooling management actions can be performed in parallel after the decision is
made as per Policy 3 in Figure 6. Thus, the maximum of the individual management delays is the delay for JPCM.
6.3. Summary of Results
As described in Section 4.2.3, the management policy with the minimum value of Qpol (Eq. 9) needs to be employed
for minimum energy consumption without violating the window-of-opportunity (and hence the redline temperatures).
The JPCM has the maximum energy-savings (Figure 8), i.e. it has the minimum total energy consumption among
the other management policies. This means that the numerator of the right hand side of Eq. 9 is minimum for the
JPCM policy when the actuation delay (i.e. the maximum of cooling delay, delay in changing power modes, and delay
in job scheduling and dispatching) is within the window-of-opportunity. Hence the Qpol is minimum for the JPCM
policy making it the best choice in an ideal case. However, depending on the conformance of the actuation delay of
the management policies to the window-of-opportunity, the management policy employment may be restricted since
the Qpol goes to ∞ when the actuation goes over the window-of-opportunity. Further, the dynamic resetting of the
the CRAC thermostat may not be viable in which case the JPM can be a good approximation since it has the second
best energy-savings among all the policies and its energy-savings can go within 1% of that of JPCM policy. The
decision chart in Figure 5 shows when these management policies can be employed. The management policy with the
minimum Qpol that conforms to the window-of-opportunity is usually selected. For example, as shown in Figure 5,
JPCM is employed if all the job, power, and cooling management can be performed within the window-of-opportunity.
7. Implementation using Moab Cluster Management
We used the Moab scheduler to configure thermal awareness into it. There are two components of the Moab scheduler:
1) Moab Server (MS), and 2) Moab Cluster Manager (MCM). MS is a central server while MCM is a client that can
be remotely run. The MCM connects to the server and shows the status of the jobs and the nodes of the cluster
controlled by the MS. For resource management of the servers MS uses an underlying resource management software
such as LSF, TORQUE/PBS. Figure 13 depicts the schematic view of the Moab software architecture along with the
feedback-control connection required for the dynamic and synergistic node allocation and job scheduling mechanisms.
The implementation of synergistic job management has two major steps:
22

Data Center Cluster
Resource Management(Torque)
Moab Server
Moab ClusterManagement GUI
The
rmal
-aw
aren
ess
in F
eedb
ack-
Con
trol
Fig. 13. Software structure of Moab.
MCM Server history in webpage
Moab Scheduler
TORQUE ResourceManager Server
History ofSensor Reading
SNMP ScriptTORQUE Resource
Manager Client
Visualization Tool
Moab GMETRIC Data
Remote Client
Central ServerIntel 64-bit Xeon EM64TDual-processor Servers
Local Desktop
Fig. 14. Software Architecture for implementing thermal-aware scheduling.
(i) Configuring the server ranking mechanism to generate server priorities; and
(ii) Configuring priority-based server allocation mechanism.
To perform the first step, Moab allows the use of a native resource manager which can report any generic metrics such
as temperature information. A generic metrics file (in any format such as .html, .txt, .perl), containing the required
information, needs to be maintained and updated in this regard. The path to the generic metrics is required to be
specified in the Moab configuration in order to enable it to be the native resource manager. This provision in the
Moab cluster manager makes it ideal for the implementation of any synergistic job management. The priority-based
server allocation mechanism can also be configured using the Moab configuration file. Figure 14 presents the overall
software architecture. The visualization tool extracts raw sensor data from the sensor history as updated by the SNMP
query script in the central server and shows it in a graphical form. Further, it updates the gmetric file for the Moab
server in appropriate format so that Moab can be configured for dynamic server ranking. This tool can be executed in
any local desktop provided its location is properly supplied into the Moab configuration.
To summarize the software architecture we identify three basic modules for the thermal aware scheduler as de-
picted in Figure 15. The Job Submission and Scheduling Module is responsible for assigning newly submitted jobs
to the appropriate nodes depending on the Moab scheduling configuration. It also pre-empts any jobs in nodes when
certain thermal threshold is reached which activates triggers configured in the Moab scheduling decisions. The Moab
Scheduler Configuration module is an one-time process that configures the Moab scheduling as described previously.
Finally, Sensor data collection and visualization module is responsible for on-line collection and aggregation of sensor
data. Such a facility can enable dynamic server ranking apart from the static ranking described in Section 5.
8. ConclusionsThis paper dealt with the problem of computing infrastructure management in the modern data centers. In this regard,
this paper migrates from the state-of-art on individual management policies (e.g. power management, job manage-
23

start
New IncomingJob?
Check Moab Schedulingconfiguration to decide forany pre-emption and which
node to allocate jobs
Moab SchedulingUse TORQUE to submitjob to appropriate node
Yes
start
Set Priority Driven Node Allocation inMoab ConfigurationSet temperature data as generic metrics
Set the generic metrics file as the Native ResourceManagerSet Node priority as a function of generic metricsSet job pre-emption triggers based on thermalthresholds
start
Collect and aggregateSensor Data
Update Moab genericmetricsUpdate Visualization
Is thresholdreached?
Job Submission and Scheduling Moab Scheduler Configuration Sensor data collectionand visualization
No
Yes No
Fig. 15. Three principal modules for the thermal aware scheduler. The thick arrows are used to depict how different modules affect the Moabscheduling and vice versa.
ment, and cooling management) to a Coordinated Job, Power, and Cooling Management (JPCM) policy. Simulation
results, based on actual job traces from the ASU HPC data center, showed that the JPCM policy can achieve up to
93.4% energy-savings over cooling over-provisioning, no power management, and simplest job management. The
savings can go up to 18% when compared to Power Oriented management (PO) policy, which have the maximum sav-
ings among the individual management policies. A prototype of the JPCM was developed by configuring the Moab
cluster management software to dynamically change the server priorities for job assignment.
Additionally, the MMA architecture was designed that decides on the correct management policy to employ de-
pending on the data center state, energy-savings, and delay for the policies to take effect. To this effect, a state-based
model is used where a data center is said to be in critical state when some critical events, e.g. new job arrival and
failure of a cooling unit, occur that can result in violations of redline temperatures. A management policy is employed
provided that the energy-savings are maximized without violating the window-of-opportunity, which is the time to
reach the redline temperatures. Results showed that the window-of-opportunity non-linearly decreases with the in-
crease in the incoming workload. A management decision chart was developed that employs different management
policies under different conditions depending on the conformance to the window-of-opportunity. For example, results
showed that with around 70 seconds increase in the cooling delay, the maximum incoming load that can be serviced
without reaching redline temperatures can reduce by 45%. This relation between cooling delay and maximum work-
load to be serviced can be useful in the employment of the correct management policies when combined with the
workload models that can predict the future incoming workload.
References
[1] K. G. Brill, “2005-2010 heat density trends in data processing, computer systems, and telecommunications equipment,” Uptime Institute, Inc.,Tech. Rep., Oct. 2006.
[2] ——, “The invisible crisis in the data center: the economic meltdown of Moore’s law,” Uptime Institute, Tech. Rep., July 2007.
24

[3] R. Mullins, “HP service helps keep data centers cool,” IDG News Service, Tech. Rep., July 2007. [Online]. Available:http://www.pcworld.com/article/id,135052/article.html
[4] K. Kant, “Data center evolution: A tutorial on state of the art, issues, and challenges,” Computer Networks, vol. 53, no. 17, pp.2939 – 2965, 2009, virtualized Data Centers. [Online]. Available: http://www.sciencedirect.com/science/article/B6VRG-4XR8XJX-3/2/
69dd764243e9e1146aa4e90ef773614a[5] R. Sawyer, “Calculating total power requirements for data centers,” White Paper, American Power Conversion, 2004.[6] D. Tennant, “The greening of IT,” Computerworld, July 2007.[7] S. Robert et al, “Cooling techniques that meet ”24 by forever” demands of your data center,” Uptime Institute, Inc., Tech. Rep., Jan. 2006.[8] Q. Tang et al, “Energy-efficient thermal-aware task scheduling for homogeneous high-performance computing data centers: A cyber-physical
approach,” IEEE TPDS, vol. 19, no. 11, pp. 1458–1472, 2008.[9] T. Mukherjee et al, “Spatio-temporal thermal-aware job scheduling to minimize energy consumption in virtualized heterogeneous data
centers,” Computer Networks, June 2009.[10] T. Qinghui et al, “Thermal-aware task scheduling for data centers through minimizing peak inlet temperature,” IEEE Transactions on Parallel
and Distributed Systems, Special Issue on Power-Aware Parallel and Distributed Systems (TPDS/PAPADS), vol. to appear, 2008.[11] P. Ranganathan et al, “Ensemble-level power management for dense blade servers,” in (ISCA’06), Boston, MA, May 2006, pp. 66–77.[12] J. Hikita et al, “Saving 200 kw and $200 k/year by power-aware job/machine scheduling,” in IPDPS 2008., April 2008, pp. 1–8.[13] “Moab grid suite of ClusterResources Inc.” http://www.clusterresources.com/. [Online]. Available: http://www.clusterresources.com/
[14] N. Sunil et al, “On honey bees and dynamic server allocation in internet hosting centers,” Adaptive Behavior - Animals, Animats, SoftwareAgents, Robots, Adaptive Systems, vol. 12, no. 3-4, pp. 223–240, 2004.
[15] B. Ricardo et al, “Power and energy management for server systems,” Computer, vol. 37, no. 11, pp. 68–76, Nov. 2004.[16] K. Bithika et al, “Autonomic power and performance management for computing systems,” Cluster Computing, vol. 11, no. 2, pp. 167–181,
June 2008.[17] L. Mastroleon et al, “Automatic power management schemes for internet servers and data centers,” in Global Telecommunications Conference,
2005. GLOBECOM ’05. IEEE, vol. 2, Nov.-2 Dec. 2005, pp. 5 pp.–.[18] H. Taliver et al, “Mercury and Freon: temperature emulation and management for server systems,” in ASPLOS-XII: Proceedings of the 12th
international conference on Architectural support for programming languages and operating systems. New York, NY, USA: ACM Press,2006, pp. 106–116.
[19] C. Yiyu et al, “Managing server energy and operational costs in hosting centers,” in Proceedings of the 2005 ACM SIGMETRICS InternationalConference on Measurement and Modeling of Computer Systems. New York, NY, USA: ACM Press, 2005, pp. 303–314.
[20] A. E. N. P. B. Aperture, “Cooling management in the data center,” http://www.aperture.com/solutions/vista cooling.php.[21] Monem H. Beitelmal and Chandrakant D. Patel, “Thermo-fluids provisioning of a high performance high density data center,” Hewlett Packard
(HP) Laboratories, Tech. Rep., 2004.[22] C. Bash, C. Patel, and R. Sharma, “Dynamic Thermal Management of Air-Cooled Datacenters,” in ASME/IEEE ITherm, 2006.[23] M. Isard, “Autopilot: automatic data center management,” SIGOPS Operating Systems Review, vol. 41, no. 2, pp. 60–67, 2007.[24] V. Werner et al, “An overview of the galaxy management framework for scalable enterprise cluster computing,” in Proceedings of IEEE
International Conference on Cluster Computing, 2000, pp. 109–118.[25] X. Jing et al, “On the use of fuzzy modeling in virtualized data center management,” in Autonomic Computing, 2007. ICAC ’07. Fourth
International Conference on, June 2007, pp. 25–25.[26] S. Kumar et al, “vmanage: loosely coupled platform and virtualization management in data centers,” in ICAC ’09: Proceedings of the 6th
international conference on Autonomic computing. New York, NY, USA: ACM, 2009, pp. 127–136.[27] K. S. Ratnesh et al, “Balance of power: dynamic thermal management for internet data centers,” Internet Computing, IEEE, vol. 9, no. 1, pp.
42–49, Jan.-Feb. 2005.[28] R. Eric et al, “Turning cluster management into data management: A system overview,” Computing Research Repository (CoRR), vol.
abs/cs/0612137, 2006.[29] B. S. Cline et al, “Phoenix: A self adaptable monitoring platform for cluster management,” Cluster Computing, vol. 5, no. 1, pp. 75–85, Jan.
2002.[30] S. LaPlante et al, “Liquid cooling of a high density computer cluster,” [online], 2006. [Online]. Available: http://www.electronics-cooling.
com/articles/2006/2006 nov a1.php[31] G. Varsamopoulos et al, “Energy efficiency of thermal-aware job scheduling algorithms under various cooling models,” in IC3 ’2009, Noida,
India, Aug.[32] “Maui cluster scheduler,” http://www.clusterresources.com/products/maui-cluster-scheduler.php.[33] “Slurm: A highly scalable resource manager,” https://computing.llnl.gov/linux/slurm/.[34] “Torque resource manager,” http://www.clusterresources.com/products/torque-resource-manager.php.[35] Q. Tang et al, “Sensor-based fast thermal evaluation model for energy efficient high-performance datacenters,” in (ICISIP2006), Dec 2006.[36] T. Mukherjee et al, “Measurement-based power profiling of data center equipment,” in Cluster 2007, GreenCom’07 Workchop, Austin, TX,
Sept. 2007.[37] R. F. Sullivan, “Alternating cold and hot aisles provides more reliable cooling for server farms,” White Paper, Uptime Institute, 2000.[38] U. E. P. Agency, “Report to congress on server and data center energy efficiency public law 109-431, ENERGY STAR Program,” 2007.[39] K. Thoney et al, “Satisfying due-dates in large multi-factory supply chains,” in IIE Transactions Design and Manufacturing, vol. 34, 2002,
pp. 803–811.[40] Cyber Switching, “DUALCOM user manual,” [online], http://www.cyberswitching.com/pdf/DualcomManual.pdf.[41] “Out-of-box comparison between dell and hp blade servers,”
http://www.dell.com/downloads/global/products/pedge/en/dellhpbladeserveroob.pdf.
25