Analysis on degree distribution of tumor signaling networks
15
Network Biology, 2012, 2(3):95-109 IAEES www.iaees.org Article Analysis on degree distribution of tumor signaling networks JingQiu Huang 1 , WenJun Zhang 1,2 1 School of Life Sciences, Sun Yat-sen University, Guangzhou 510275, China; 2 International Academy of Ecology and Environmental Sciences, Hong Kong E-mail: [email protected], [email protected] Received 7 June 2012; Accepted 20 July 2012; Published online 1 September 2012 IAEES Abstract Tumorigenesis is a multi-factorial and multi-step process, among which the changes in cell signaling pathways play a key role. Up till now there are fewer studies on network structure of tumor signaling pathways. In present study the degree distribution was analyzed based on thirty kinds of tumor signaling networks, including VEGF-pathway, JNK-pathway, p53-signaling, etc. The results showed that almost all of them were scale-free complex networks. Key metabolites in some tumor networks were also described. Keywords tumor; cancer; signaling pathway; network; degree distribution. 1 Introduction Tumorigenesis is a multi-factorial and multi-step process. Among them, the changes in cell signaling pathways play a key role. Complex signaling pathways in a human body cell include a large number of ligands, receptors, signaling proteins, and other links, which result in a complex network. Metabolism of tumor signaling is also true. Complex signaling pathways constitute different networks and thus affect the metabolic processes of the tumor. Tumor signaling pathways are mainly divided into six categories: JAK-STAT signaling pathway, p53 signaling pathway, NF-κB signaling pathway, Ras, PI3K and mTOR signaling pathway, Wnt NF-κB signaling pathway and BMP signaling pathway. There are dozens of ligands, receptors and signaling proteins associating with the six signaling pathways, and each of them has its own complex metabolic signaling pathways. All of them shape a complex and directed network, similar to the various networks reported (Ibrahim et al., 2011; Goemann et al., 2011; Kuang and Zhang, 2011; Martínez-Antonio, 2011; Paris and Bazzoni, 2011; Rodriguez and Infante, 2011; Tacutu et al., 2011; Zhang, 2011, 2012c) JAK-STAT signaling pathway is primarily made of receptor tyrosine kinases, tyrosine kinases JAK and transcription factor STAT that involve in cell proliferation, differentiation, apoptosis, immune regulation and other important biological processes (Marrer, 2005). p53 signaling pathway is a signaling metabolic process based on the gene p53 which has the closest relationship with cancer. p53 gene is regulated by a variety of signaling factors (Ho et al., 2006). In the NF-κB signaling pathway, NF-κB (Nuclear Factor-kappa B) will specifically bind to the enhancer B sequence GGGACTTTCC of kappa light-chain gene of immunoglobulin, and promote the expression of κ light-chain gene, thus affect the metabolism of tumor. For Ras, PI3K and mTOR signaling way, the key regulatory factors in the Ras and PI3K signaling
Transcript of Analysis on degree distribution of tumor signaling networks

Network Biology, 2012, 2(3):95-109
IAEES www.iaees.org
Article
Analysis on degree distribution of tumor signaling networks
JingQiu Huang1, WenJun Zhang1,2 1School of Life Sciences, Sun Yat-sen University, Guangzhou 510275, China; 2International Academy of Ecology and
Environmental Sciences, Hong Kong
E-mail: [email protected], [email protected]
Received 7 June 2012; Accepted 20 July 2012; Published online 1 September 2012
IAEES
Abstract
Tumorigenesis is a multi-factorial and multi-step process, among which the changes in cell signaling pathways
play a key role. Up till now there are fewer studies on network structure of tumor signaling pathways. In
present study the degree distribution was analyzed based on thirty kinds of tumor signaling networks,
including VEGF-pathway, JNK-pathway, p53-signaling, etc. The results showed that almost all of them were
scale-free complex networks. Key metabolites in some tumor networks were also described.
Keywords tumor; cancer; signaling pathway; network; degree distribution.
1 Introduction
Tumorigenesis is a multi-factorial and multi-step process. Among them, the changes in cell signaling
pathways play a key role. Complex signaling pathways in a human body cell include a large number of
ligands, receptors, signaling proteins, and other links, which result in a complex network. Metabolism of
tumor signaling is also true. Complex signaling pathways constitute different networks and thus affect the
metabolic processes of the tumor.
Tumor signaling pathways are mainly divided into six categories: JAK-STAT signaling pathway, p53
signaling pathway, NF-κB signaling pathway, Ras, PI3K and mTOR signaling pathway, Wnt NF-κB
signaling pathway and BMP signaling pathway. There are dozens of ligands, receptors and signaling proteins
associating with the six signaling pathways, and each of them has its own complex metabolic signaling
pathways. All of them shape a complex and directed network, similar to the various networks reported
(Ibrahim et al., 2011; Goemann et al., 2011; Kuang and Zhang, 2011; Martínez-Antonio, 2011; Paris and
Bazzoni, 2011; Rodriguez and Infante, 2011; Tacutu et al., 2011; Zhang, 2011, 2012c)
JAK-STAT signaling pathway is primarily made of receptor tyrosine kinases, tyrosine kinases JAK and
transcription factor STAT that involve in cell proliferation, differentiation, apoptosis, immune regulation and
other important biological processes (Marrer, 2005).
p53 signaling pathway is a signaling metabolic process based on the gene p53 which has the closest
relationship with cancer. p53 gene is regulated by a variety of signaling factors (Ho et al., 2006).
In the NF-κB signaling pathway, NF-κB (Nuclear Factor-kappa B) will specifically bind to the enhancer
B sequence GGGACTTTCC of kappa light-chain gene of immunoglobulin, and promote the expression of κ
light-chain gene, thus affect the metabolism of tumor.
For Ras, PI3K and mTOR signaling way, the key regulatory factors in the Ras and PI3K signaling

Network Biology, 2012, 2(3):95-109
IAEES www.iaees.org
pathway undergone significant mutations (Kolch, 2002), which affect the metabolism of the downstream
regulation molecule mTOR and lead to disorders of cell growth and the generation of tumor cells (Stauffer et
al., 2005).
Wnt metabolism has a crucial role in early development and organ formation of animal embryos, and
tissue regeneration and other physiological processes. Mutations of key proteins in the signaling pathway will
lead to abnormal activation of signaling and likely induce the occurrence of cancer (Katoh, 2005).
BMP (Bone Morphogenetic Protein) is an important member in the superfamily of TGF-β
(Transforming Growth Factor-β). It controls many biological processes, such as tumorigenesis, by regulating
the activity of a series of downstream genes (Moustakas et al., 2002).
So far, most studies on tumorigenesis have focused on single metabolic process, mutation induced
signaling abnormality and tumorigenesis, and key ligands, receptors, signaling proteins in cancer signaling
pathways. However, there were fewer studies on network structures of tumor signaling pathways (Zeitoun et
al., 2012).
Fig. 1 VEGF-pathway (Source: www.sabiosciences.com)
The most important aspect for network structure is the degree distribution of network (Butts, 2009).
Degree distribution depicts the extent of complexity of a network. In random networks, the degree distribution
is binomial distribution and its limit is the Poisson distribution. In a random network, most nodes have the
same or similar number of connections. In complex networks, the degree distribution is typically a power law
distribution. These networks are scale-free networks (Barabasi and Albert, 1999; Barabasi, 2009). A property
of the scale-free network is that the structure and the evolution of network are inseparable. Scale-free networks
96

Network Biology, 2012, 2(3):95-109
IAEES www.iaees.org
constantly change because of the arrival of nodes and links (Barabasi and Albert, 1999). In general, the degree
of a network can be described with various distribution models, like binomial distribution, Poisson distribution,
exponential distribution, power law distribution, etc (Zhang and Zhan, 2011; Zhang, 2012b).
In present study, network structure, including network size, degree distribution (Dunne et al., 2002) and
network type, of 30 tumor signaling networks was analyzed using network type detection algorithm in order
to provide a deep insight on tumorigenesis and tumor treatment.
Fig. 2 The graph for VEGF-pathway
1.Src 2.PIP2 3.VEGFR
2
4.PLCy-
P
5.MKK3/6
17.Focal
Adhesion
Turnover
19.Cell
Migration
21.Ras
23.Raf
1
25.ERK1/2
27.IP3 6.PI3K-
P
8. PIP3
10.Akt/PK
B
12.P
16.Caspase
9-P
18.eNOS
-HSP90
20.Cell
35.DAG
22.NO
productio
n
24.MEK1/2
26.PKC
31.Actin
Reorganizat
ion
32.Gene
Expressio
n
28.Ca++
34.Vascular
Cell
Permeability
30.cPLA
14.BAD-
P
33.Prostagia
ndin
Production
29.ANGIO
GENESIS
7.FAK-
Paxill
9.GRB2-
SHC-SOS
11.p38
13.MAP
KAPK2/
3
15.HSP2
7
97
Network Biology, 2012, 2(3):95-109
IAEES www.iaees.org
2 Material and Methods
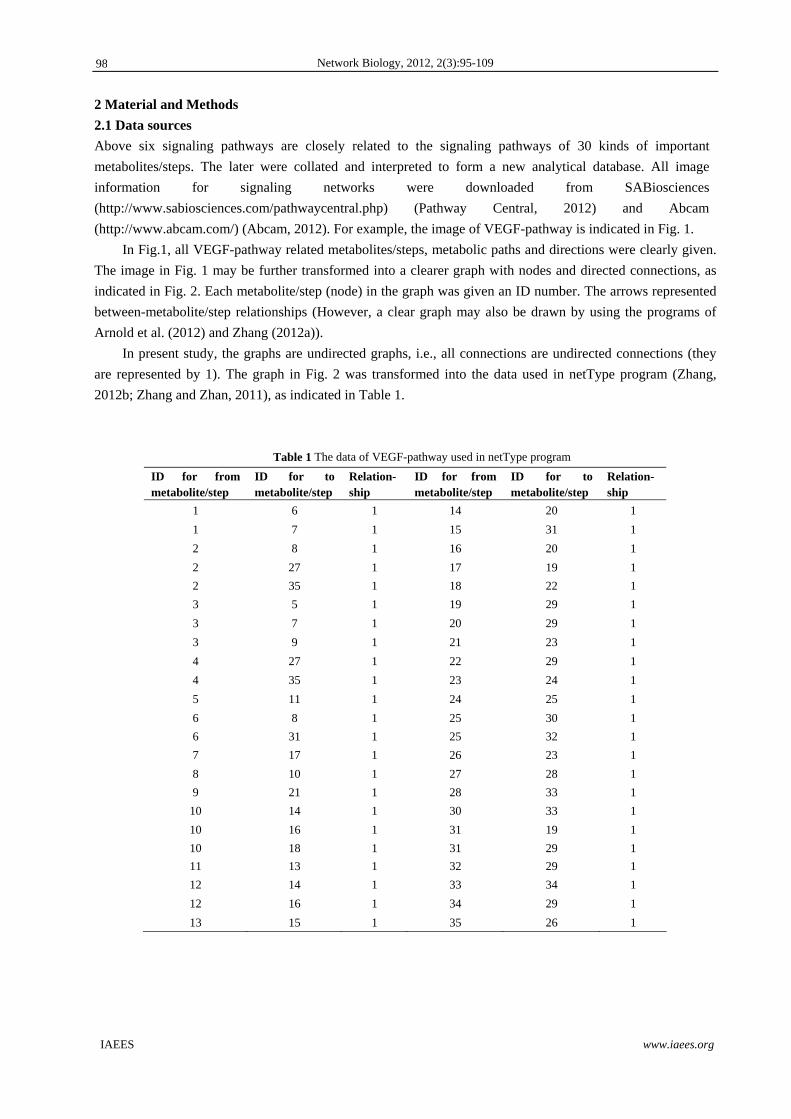
2.1 Data sources
Above six signaling pathways are closely related to the signaling pathways of 30 kinds of important
metabolites/steps. The later were collated and interpreted to form a new analytical database. All image
information for signaling networks were downloaded from SABiosciences
(http://www.sabiosciences.com/pathwaycentral.php) (Pathway Central, 2012) and Abcam
(http://www.abcam.com/) (Abcam, 2012). For example, the image of VEGF-pathway is indicated in Fig. 1.
In Fig.1, all VEGF-pathway related metabolites/steps, metabolic paths and directions were clearly given.
The image in Fig. 1 may be further transformed into a clearer graph with nodes and directed connections, as
indicated in Fig. 2. Each metabolite/step (node) in the graph was given an ID number. The arrows represented
between-metabolite/step relationships (However, a clear graph may also be drawn by using the programs of
Arnold et al. (2012) and Zhang (2012a)).
In present study, the graphs are undirected graphs, i.e., all connections are undirected connections (they
are represented by 1). The graph in Fig. 2 was transformed into the data used in netType program (Zhang,
2012b; Zhang and Zhan, 2011), as indicated in Table 1.
Table 1 The data of VEGF-pathway used in netType program
ID for from metabolite/step
ID for to metabolite/step
Relation-ship
ID for from metabolite/step
ID for to metabolite/step
Relation- ship
1 6 1 14 20 1
1 7 1 15 31 1
2 8 1 16 20 1
2 27 1 17 19 1
2 35 1 18 22 1
3 5 1 19 29 1
3 7 1 20 29 1
3 9 1 21 23 1
4 27 1 22 29 1
4 35 1 23 24 1
5 11 1 24 25 1
6 8 1 25 30 1
6 31 1 25 32 1
7 17 1 26 23 1
8 10 1 27 28 1
9 21 1 28 33 1
10 14 1 30 33 1
10 16 1 31 19 1
10 18 1 31 29 1
11 13 1 32 29 1
12 14 1 33 34 1
12 16 1 34 29 1
13 15 1 35 26 1
98

Network Biology, 2012, 2(3):95-109
IAEES www.iaees.org
Following Fig. 2 and Table 1, in total 30 signaling networks were organized into the data required. Table
2 shows the other 28 signaling pathway networks used in present study, besides JNK-pathway and
VEGF-pathway networks discussed in the following analysis.
Table 2 Twenty-eight signaling pathway networks (Source: www.sabiosciences.com)
akt-signaling BRCA1-pathway
TNF-Signaling Caspase-Cascade
ppar-pathway Androgen-Signaling
p53-signaling PTEN-Pathway
STAT3-pathway MAPK-Signaling
PI3K signaling mTOR-Pathway
Ras Pathway JAK-STAT-Pathway
Mitochondrial-Apoptosis HIF1Alpha-Pathway
ErbBfamily-Pathway IGF1R_Signaling
TGF-Beta pathway Fas-Signaling
EGF-pathway ERK_Signaling
Inerferon-Pathway cAMP-Dependent
Estrogen-Pathway Cellular_Apoptosis
HGF-pathway Cyclins+Cell_Cycle_Regulatio
2.2 Methods
Methods used in present study came from Zhang (2012b), Zhang and Zhan (2011). Suppose that the portion of
nodes with k-degree is pk, the degree will thus be a random variable and its distribution is degree distribution.
In present algorithm, in addition to power law distribution, binomial distribution, Poisson distribution,
and exponential distribution, some other indices and methods were also used to detect network type (Zhang
and Zhan, 2011; Zhang, 2012b):
(1) Coefficient of variation. In a random network, the majority of nodes have the same degree as the
average. The coefficient of variation, H, can be used to describe the type of a network (Zhang and Zhan, 2011;
Zhang, 2012b):
H=s2/ū, ū=∑di/v, s2=∑(di-ū)2/(v-1),
where ū, s2: mean and variance of degree; v: number of nodes; di: the degree of node i, i=1,2,...,v. The network
is a random network, if H≤1. Calculate χ2=(v-1)H, and if χ1-α2(v-1)<χ2<χα
2(v-1), the network is a complete
random network. It is a complex network, if H>1, and to some extent, network complexity increases with H.
As defined in Zhang and Zhan (2011), E=s2-ū, is the entropy of network. A more complex network has
the larger entropy. If E≤0 the network is a random network and it is a complex network if E>0.
(2) Aggregation index. Network type can be determined by using the following aggregation index (Zhang
and Zhan, 2011; Zhang, 2012b):
H=v*∑di(di-1)/[∑di(∑di-1)].
The network is a random network, if H≤1. Calculate χ2=H(∑di-1)+v-∑di, and if χ2<χα2(v-1), the network is a
complete random network. It is a complex network if H>1, and network complexity increases with H.
The Java algorithm, netType (http://www.iaees.org/publications/software/index.asp, BioNetAnaly), was
used to calculate degree distribution and detect network type.
99

Network Biology, 2012, 2(3):95-109
IAEES www.iaees.org
3 Results
3.1 VEGF-pathway (Matsumoto and Claesson-Welsh, 2001)
From the statistics in Table 3, we found that ANGIO GENESIS has the most connections. It is likely the most
significant metabolite/step in VEGF-pathway, seconded by Akt/PKB and Actin Reorganization.
Table 3 Degree distribution statistics of VEGF-pathway (collated from Table 1)
Rank Metabolite
/step Degree Rank
Metabolite/step
Degree
1 29 6 19 4 2
2 10 4 20 5 2
3 31 4 21 9 2
4 2 3 22 11 2
5 3 3 23 12 2
6 6 3 24 13 2
7 7 3 25 15 2
8 8 3 26 17 2
9 14 3 27 18 2
10 16 3 28 21 2
11 19 3 29 22 2
12 20 3 30 24 2
13 23 3 31 26 2
14 25 3 32 28 2
15 27 3 33 30 2
16 33 3 34 32 2
17 35 3 35 34 2
18 1 2
Use the data in Table 1, and run the netType as the following:
C:\ BioNetAnaly\bin>java netType VEGF
We thus obtained the results for degree distribution and network type as follows:
Aggregation index of the network: 0.7274247491638796 It is a random network. Variation coefficient H of the network: 0.2704603580562659 Entropy E of the network: -1.9176470588235297 It is a random network. Binomial distribution Chi-square=82.10062003702488 Binomial p=0.12063492063492064 It is likely not a random network Poisson distribution chi-square=119.20494737910627 Poisson lamda=2.6285714285714286 It is likely not a random network Exponential distribution lamda=0.3804347826086957 It is not an exponential network Power law distribution KS D value=0.0 Degrees are power law distributed, it is A scale-free complex network Power law alpha=NaN Power law xmin=6
100

Network Biology, 2012, 2(3):95-109
IAEES www.iaees.org
It can be found that the VEGF-pathway network is a random network in terms of aggregation index,
coefficient of variation and network entropy. Binomial and Poisson distribution fitting results showed that this
network does not meet the above two distribution patterns. In general, the degree is power law distributed and
the VEGF-pathway network is most likely a scale-free complex network.
3.2 JNK-pathway (Himes et al., 2006)
Following the above procedures, JNK-pathway in Fig. 2 was finally transformed into the data used in netType
program after each metabolite/step was given an ID (Table 4), as shown in Table 5.
Fig. 2 JNK-pathway (Source: www.sabiosciences.com)
101

Network Biology, 2012, 2(3):95-109
IAEES www.iaees.org
Table 4 IDs for metabolite/steps in JNK-pathway
ID Metabolite/Step ID Metabolite/Step
1 TRAF2 25 MLKs
2 CrkL 26 MEKK4/7
3 HPK 27 JNKs
4 TAK1 28 M3/6
5 Ras-GTP 29 MKPs
6 GCKR 30 IRS1
7 CDC42 31 BCL2
8 ASK1 32 TCF
9 c-Raf 33 DCX
10 GCK 34 MAP1B
11 Rac 35 Spir
12 GLK 36 MAP2B
13 MKK1 37 HSF1
14 HGK 38 DPC4
15 PAK 39 Paxillin
16 MLK3 40 c-Jun
17 GRB2-SOS-SHC 41 ATF2
18 GPCR 42 ELK1
19 PI3K 43 SMAD4
20 UV and other stress 44 p53
21 MEKK4 45 NFAT1
22 POSH 46 NFAT4
23 p115RhoGEF 47 STAT4
24 RhoA 48 Gene Expression
Table 5 The data of JNK-pathway used in netType program
ID for from metabolite/step
ID for to metabolite/step
Relation-ship
ID for from metabolite/step
ID for to metabolite/step
Relation-ship
1 6 1 20 11 1
1 8 1 21 26 1
1 10 1 22 26 1
1 12 1 24 13 1
1 14 1 24 21 1
2 3 1 23 24 1
3 4 1 26 27 1
5 6 1 27 30 1
5 9 1 27 31 1
5 7 1 27 32 1
5 11 1 27 33 1
5 19 1 27 34 1
6 13 1 27 35 1
7 13 1 27 36 1
102

Network Biology, 2012, 2(3):95-109
IAEES www.iaees.org
7 15 1 27 37 1
7 16 1 27 38 1
7 21 1 27 39 1
7 22 1 27 40 1
7 11 1 27 41 1
7 25 1 27 42 1
8 13 1 27 43 1
9 8 1 27 44 1
10 13 1 27 45 1
11 13 1 27 46 1
11 15 1 27 47 1
11 16 1 28 27 1
11 21 1 29 27 1
11 22 1 35 48 1
11 25 1 36 48 1
12 13 1 37 48 1
13 26 1 38 48 1
14 13 1 39 48 1
15 13 1 40 48 1
16 26 1 41 48 1
17 5 1 42 48 1
18 7 1 43 48 1
18 11 1 44 48 1
18 23 1 45 48 1
19 5 1 46 48 1
19 11 1 47 48 1
20 7 1
From the statistics in Table 6, we found that JNKs has the most connections. JNKs is likely the most
significant metabolite/step in JNK-pathway.
Table 6 Degree distribution statistics of JNK-pathway (collated from Table 5)
Rank Metabolite
/step Degree Rank
Metabolite/step
Degree
1 27 21 25 25 2
2 48 13 26 35 2
3 11 11 27 36 2
4 7 10 28 37 2
5 13 10 29 38 2
6 5 7 30 39 2
7 1 5 31 40 2
8 26 5 32 41 2
9 21 4 33 42 2
10 6 3 34 43 2
11 8 3 35 44 2
12 15 3 36 45 2
103

Network Biology, 2012, 2(3):95-109
IAEES www.iaees.org
13 16 3 37 46 2
14 18 3 38 47 2
15 19 3 39 2 1
16 22 3 40 4 1
17 24 3 41 17 1
18 3 2 42 28 1
19 9 2 43 29 1
20 10 2 44 30 1
21 12 2 45 31 1
22 14 2 46 32 1
23 20 2 47 33 1
24 23 2 48 34 1
Use the data in Table 5 and run the netType. We obtained the results for degree distribution and network
type as the follows:
Aggregation index of the network: 1.950943396226415 It is a complex network. Variation coefficient H of the network: 4.2170212765957515 Entropy E of the network: 10.723404255319172 It is a complex network. Binomial distribution Chi-square=1703.3646822209705 Binomial p=0.0763888888888889 It is likely not a random network Poisson distribution chi-square=564.9845392902733 Poisson lamda=3.3333333333333335 It is likely not a random network Exponential distribution lamda=0.3 It is not an exponential network Power law distribution KS D value=0.0 Degrees are power law distributed, it is A scale-free complex network Power law alpha=NaN Power law xmin=21
The results showed that JNK-pathway network is most likely A scale-free complex network.
3.3 Results for other 28 signaling metabolic networks
Table 7 indicates the results of network type detection for remaining 28 signaling networks.
Table 7 Summary of results for network type detection of 28 signaling networks
akt-signaling TNF-Signaling ppar-pathway p53-signaling
Aggregation index of the network
4.52621596 0.892721519 0.728186145 1.951279528
Variation coefficient H of the network
8.485475985 0.7175 0.362282878 3.368872549
Entropy E of the network
15.74531155 -0.729032258 -1.464387464 5.83107089
104

Network Biology, 2012, 2(3):95-109
IAEES www.iaees.org
Binomial distribution Chi-square (χ2)
7.550775793 185.2217856 61.78265951 636313.367
Binomial p 0.007662835 0.279569892 0.283950617 0.051282051
Poisson distribution Chi-square (χ2)
356.3078645 41.45697612 56.839442 316.086834
Poisson λ 2.103448276 2.580645161 2.296296296 2.461538462
Exponential distribution λ
0.475409836 0.3875 0.435483871 0.40625
Power law distribution K-S D value
0 0 0 0
Power law α NaN Infinity Infinity NaN
Power law xmin 32 6 4 17
Type of degree distribution
Power law Power law Power law Power law
Network type A scale-free complex network
A scale-free complex network
A scale-free complex network
A scale-free complex network
STAT3-pathway PI3K signaling Ras Pathway Mitochondrial-Apoptosis
Aggregation index of the network
0.868778 1.124764151 1.05614035 1.054945055
Variation coefficient H of the network
0.70903 1.354241071 1.12383901 1.146520147
Entropy E of the network
-0.630435 0.994360902 0.26890756 0.384615385
Binomial distribution Chi-square (χ2)
41.00305 31.8895742 2.24869397 50.1063552
Binomial p 0.157407 0.276803119 0.1015873 0.155555556
Poisson distribution Chi-square (χ2)
25.78968 8.993995609 29.3818551 51.19489909
Poisson λ 2.166667 2.807017544 2.17142857 2.625
Exponential distribution λ
0.461538 0.35625 0.46052632 0.380952381
Power law distribution K-S D value
0 0 0 0
Power law α Infinity Infinity NaN NaN
Power law xmin 5 9 10 10
Type of degree distribution
Power law Power law Power law Power law
Network type A scale-free complex network
A scale-free complex network
A scale-free complex network
A scale-free complex network
ErbBfamily Pathway
TGF-Beta pathway EGF-pathway Inerferon Pathway
Aggregation index of the network
0.769231 0.915662651 1.18505218 0.664335664
Variation coefficient H of the network
0.382353 0.810810811 1.45577667 0.239819005
105

Network Biology, 2012, 2(3):95-109
IAEES www.iaees.org
Entropy E of the network
-1.623529 -0.418207681 1.11043771 -1.694117647
Binomial distribution Chi-square (χ2)
82.68389 1497.027453 4.67977985 112.6795217
Binomial p 0.320635 0.239766082 0.04646465 0.380952381
Poisson distribution Chi-square (χ2)
62.14559 120.87115 257.481508 208.9204611
Poisson λ 2.628571 2.210526316 2.43636364 2.228571429
Exponential distribution λ
0.380435 0.452380952 0.41044776 0.448717949
Power law distribution K-S D value
0 0 0 0
Power law α Infinity NaN NaN NaN
Power law xmin 5 6 14 4
Type of degree distribution
Power law Power law Power law Power law
Network type A scale-free complex network
A scale-free complex network
A scale-free complex network
A scale-free complex network
Estrogen Pathway
HGF-pathway BRCA1-pathway Caspase-Cascade
Aggregation index of the network
2.139322 0.972972973 1.98043326 2.199460916
Variation coefficient H of the network
3.650161 0.943629344 3.07851852 3.862349914
Entropy E of the network
6.089732 -0.115873016 4.31692308 6.742424242
Binomial distribution Chi-square (χ2)
15.90759 8414.563824 0.23396135 56.05705936
Binomial p 0.026005 0.101851852 0.01282051 0.017283951
Poisson distribution Chi-square (χ2)
264.2854 40.13860056 125.876825 315.0779746
Poisson λ 2.297872 2.055555556 2.07692308 2.355555556
Exponential distribution λ
0.435185 0.486486486 0.48148148 0.424528302
Power law distribution K-S D value
0 0 0 0
Power law α NaN NaN NaN NaN
Power law xmin 20 8 14 21
Type of degree distribution
Power law Power law Power law Power law
Network type A scale-free complex network
A scale-free complex network
A scale-free complex network
A scale-free complex network
Androgen-Signaling PTEN-Pathway MAPK-Signaling mTOR-Pathway
Aggregation index of the network
1.079193 1.126506024 1.30956625 0.987677371
Variation coefficient H of the network
1.237579 1.328125 1.83094099 0.971794872
Entropy E of the network
0.695767 0.835227273 2.20629159 -0.063768116
106

Network Biology, 2012, 2(3):95-109
IAEES www.iaees.org
Binomial distribution Chi-square (χ2)
5.065875 71.87522136 197056.514 75.54143044
Binomial p 0.178571 0.141414141 0.16475096 0.128019324
Poisson distribution Chi-square (χ2)
23.78943 29.71517195 100.314801 39.29714189
Poisson λ 2.928571 2.545454545 2.65517241 2.260869565
Exponential distribution λ
0.341463 0.392857143 0.37662338 0.442307692
Power law distribution K-S D value
0 0 0 0
Power law α NaN NaN NaN NaN
Power law xmin 10 10 11 9
Type of degree distribution
Power law Power law Power law Power law
Network type A scale-free complex network
A scale-free complex network
A scale-free complex network
A scale-free complex network
JAK-STAT-Pathway
HIF1Alpha-Pathway IGF1R-Signaling Fas-Signaling
Aggregation index of the network
0.982304 2.090909091 0.81334445 1.47242921
Variation coefficient H of the network
0.953231 3.210526316 0.54787879 2.120861459
Entropy E of the network
-0.121816 4.421052632 -1.0811594 2.629713424
Binomial distribution Chi-square (χ2)
306.7507 12.46450871 49.8289811 4.708626886
Binomial p 0.165375 0.022792023 0.19323671 0.051282051
Poisson distribution Chi-square (χ2)
45.76475 170.5548778 35.2204129 314.8308315
Poisson λ 2.604651 2 2.39130435 2.346153846
Exponential distribution λ
0.383929 0.5 0.41818182 0.426229508
Power law distribution K-S D value
0 0 0 0
Power law α NaN NaN NaN NaN
Power law xmin 9 16 7 13
Type of degree distribution
Power law Power law Power law Power law
Network type A scale-free complex network
A scale-free complex network
A scale-free complex network
A scale-free complex network
ERK-Signaling cAMP-Dependent Cellular-Apoptosis
Cyclins+Cell_ Cycle-Regulation
Aggregation index of the network
2.061591 2.025092672 1.13825609 1.296023564
Variation coefficient H of the network
4.004843 3.593795094 1.38308458 1.844537815
Entropy E of the network
8.413559 6.503844414 1.04761905 2.364705882
107
Network Biology, 2012, 2(3):95-109
IAEES www.iaees.org
Binomial distribution Chi-square (χ2)
23231.23 845.7420426 58.8993924 8474.914866
Binomial p 0.046296 0.019900498 0.17006803 0.193650794
Poisson distribution Chi-square (χ2)
462.1018 595.3938607 57.7338769 102.7538674
Poisson λ 2.8 2.507462687 2.73469388 2.8
Exponential distribution λ
0.357143 0.398809524 0.36567164 0.357142857
Power law distribution K-S D value
0 0 0 8
Power law α NaN NaN NaN Infinity
Power law xmin 23 23 11 8
Type of degree distribution
Power law Power law Power law Power law
Network type A scale-free complex network
A scale-free complex network
A scale-free complex network
A scale-free complex network
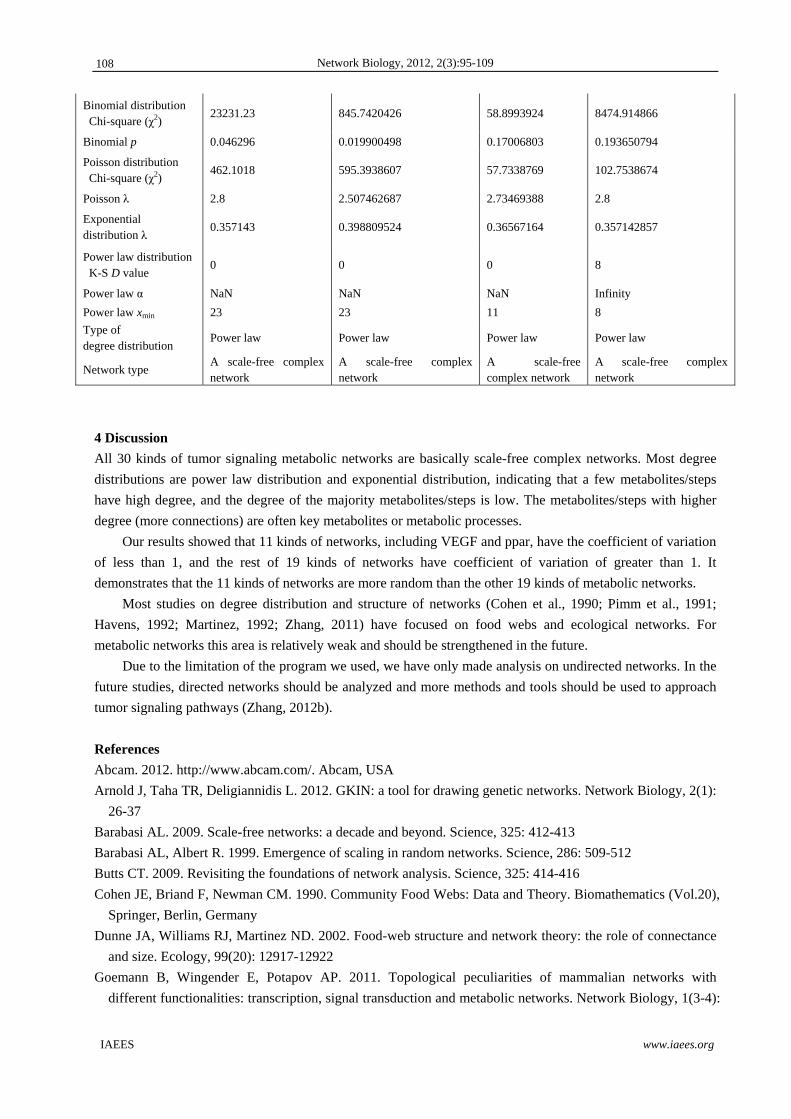
4 Discussion
All 30 kinds of tumor signaling metabolic networks are basically scale-free complex networks. Most degree
distributions are power law distribution and exponential distribution, indicating that a few metabolites/steps
have high degree, and the degree of the majority metabolites/steps is low. The metabolites/steps with higher
degree (more connections) are often key metabolites or metabolic processes.
Our results showed that 11 kinds of networks, including VEGF and ppar, have the coefficient of variation
of less than 1, and the rest of 19 kinds of networks have coefficient of variation of greater than 1. It
demonstrates that the 11 kinds of networks are more random than the other 19 kinds of metabolic networks.
Most studies on degree distribution and structure of networks (Cohen et al., 1990; Pimm et al., 1991;
Havens, 1992; Martinez, 1992; Zhang, 2011) have focused on food webs and ecological networks. For
metabolic networks this area is relatively weak and should be strengthened in the future.
Due to the limitation of the program we used, we have only made analysis on undirected networks. In the
future studies, directed networks should be analyzed and more methods and tools should be used to approach
tumor signaling pathways (Zhang, 2012b).
References
Abcam. 2012. http://www.abcam.com/. Abcam, USA
Arnold J, Taha TR, Deligiannidis L. 2012. GKIN: a tool for drawing genetic networks. Network Biology, 2(1):
26-37
Barabasi AL. 2009. Scale-free networks: a decade and beyond. Science, 325: 412-413
Barabasi AL, Albert R. 1999. Emergence of scaling in random networks. Science, 286: 509-512
Butts CT. 2009. Revisiting the foundations of network analysis. Science, 325: 414-416
Cohen JE, Briand F, Newman CM. 1990. Community Food Webs: Data and Theory. Biomathematics (Vol.20),
Springer, Berlin, Germany
Dunne JA, Williams RJ, Martinez ND. 2002. Food-web structure and network theory: the role of connectance
and size. Ecology, 99(20): 12917-12922
Goemann B, Wingender E, Potapov AP. 2011. Topological peculiarities of mammalian networks with
different functionalities: transcription, signal transduction and metabolic networks. Network Biology, 1(3-4):
108

Network Biology, 2012, 2(3):95-109
IAEES www.iaees.org
134-148
Havens KE, Bull LA, Warren GL. 1996. Food web structure in a subtropical lake ecosystem. Oikos, 75(1):
20-32
Himes SR, Sester DP, Ravasi T, et al. 2006. The JNK are important for development and survival of
macrophages. Journal of Immunology, 176(4): 2219-2228
Ho CC, Siu WY, Lau A, et al. 2006. Stalled replication induces p53 accumulation through distinct mechanisms
from DNA damage checkpoint pathways. Cancer Research, 66(4): 2233-2241
Ibrahim SS, Eldeeb MAR, Rady MAH. 2011. The role of protein interaction domains in the human cancer
network. Network Biology, 1(1): 59-71
Katoh M. 2005. WNT/PCP signaling pathway and human cancer. Oncology Reports, 14(6): 1583-1588
Kolch W. 2002. Ras/Raf signalling and emerging pharmacotherapeutic targets. Expert Opinion on
Pharmacotherapy, 3(6): 709-718
Kuang WP, Zhang WJ. 2011. Some effects of parasitism on food web structure: a topological analysis.
Network Biology, 1(3-4): 171-185
Marrero MB. 2005. Introduction to JAK/STAT signaling and the vasculature. Vascular Pharmacology, 43(5):
307-309
Martinez ND. 1992. Constant connectance in community food webs. American Naturalist, 139: 1208-1218
Martínez-Antonio A. 2011. Escherichia coli transcriptional regulatory network. Network Biology, 1(1): 21-33
Matsumoto T, Claesson-Welsh L. 2001. VEGF receptor signal transduction. Science’s STKE, 112: RE21
Moustakas A, Pardali K, Gaal A, et al. 2002. Mechanisms of TGF-beta signaling in regulation of cell growth
and differentiation. Immunology Letters, 82(1-2): 85-91
Paris L, Bazzoni G. 2011. The polarity sub-network in the yeast network of protein-protein interactions.
Network Biology, 1(3-4): 149-158
Pathway Central. 2012. http://www.sabiosciences.com/pathwaycentral.php. SABiosciences, QIAGEN, USA
Pimm SL. 1991. The balance of nature? Ecological issues in the conservation of species and communities.
University of Chicago Press, USA
Rodriguez A, Infante D. 2011. Characterization in silico of flavonoids biosynthesis in Theobroma cacao L.
Network Biology, 1(1): 34-45
Stauffer F, Holzer P, Garcia-Echeverria C. 2005. Blocking the PI3K/PKB pathway in tumor cells. Current
Medicinal Chemistry-Anti-Cancer Agents, 5(5): 449-462
Tacutu R, Budovsky A, Yanai H, et al. 2011. Immunoregulatory network and cancer-associated genes:
molecular links and relevance to aging. Network Biology, 1(2): 112-120
Zeitoun AH, Ibrahim SS, Bagowski CP. 2012. Identifying the common interaction networks of amoeboid
motility and cancer cell metastasis. Network Biology, 2(2): 45-56
Zhang WJ. 2011. Constructing ecological interaction networks by correlation analysis: hints from community
sampling. Network Biology, 1(2): 81-98
Zhang WJ. 2012a. A Java software for drawing graphs. Network Biology, 2(1): 38-44
Zhang WJ. 2012b. Computational Ecology: Graphs, Networks and Agent-based Modeling. World Scientific,
Singapore
Zhang WJ. 2012c. How to construct the statistic network? An association network of herbaceous plants
constructed from field sampling. Network Biology, 2(2): 57-68
Zhang, WJ, Zhan CY. 2011. An algorithm for calculation of degree distribution and detection of network type:
with application in food webs. Network Biology, 1(3-4): 159-170
109