
An orally bioavailable small-molecule inhibitor of Hedgehog signaling inhibits tumor initiation and...
18
Orally bioavailable small-molecule inhibitor of transcription factor Stat3 regresses human breast and lung cancer xenografts Xiaolei Zhang a,1 , Peibin Yue b,1 , Brent D. G. Page c , Tianshu Li a , Wei Zhao a , Andrew T. Namanja d , David Paladino b , Jihe Zhao a , Yuan Chen d , Patrick T. Gunning c , and James Turkson a,b,2 a Burnett School of Biomedical Sciences, University of Central Florida College of Medicine, Orlando, FL 32827; b Cancer Biology and Experimental Therapeutics Programs, University of Hawaii Cancer Center, Honolulu, HI 96813; c Department of Chemistry, University of Toronto at Mississauga, Mississauga, ON, Canada, L5L 1C6; and d Department of Molecular Medicine, Beckman Research Institute of the City of Hope, Duarte, CA 91010 Edited by James E. Darnell, The Rockefeller University, New York, NY, and approved April 13, 2012 (received for review January 4, 2012) Computer-aided lead optimization derives a unique, orally bioavail- able inhibitor of the signal transducer and activator of transcription (Stat)3 Src homology 2 domain. BP-1-102 binds Stat3 with an affin- ity (K D ) of 504 nM, blocks Stat3–phospho-tyrosine (pTyr) peptide interactions and Stat3 activation at 4–6.8 μM, and selectively inhib- its growth, survival, migration, and invasion of Stat3-dependent tumor cells. BP-1-102–mediated inhibition of aberrantly active Stat3 in tumor cells suppresses the expression of c-Myc, Cyclin D1, Bcl-xL, Survivin, VEGF, and Krüppel-like factor 8, which is identified as a Stat3 target gene that promotes Stat3-mediated breast tumor cell migration and invasion. Treatment of breast cancer cells with BP-1-102 further blocks Stat3–NF-κB cross-talk, the release of gran- ulocyte colony-stimulating factor, soluble intercellular adhesion molecule 1, macrophage migration-inhibitory factor/glycosylation- inhibiting factor, interleukin 1 receptor antagonist, and serine pro- tease inhibitor protein 1, and the phosphorylation of focal adhe- sion kinase and paxillin, while enhancing E-cadherin expression. Intravenous or oral gavage delivery of BP-1-102 furnishes micro- molar or microgram levels in tumor tissues and inhibits growth of human breast and lung tumor xenografts. S ignal transducer and activator of transcription (STAT) pro- teins mediate responses to cytokines and growth factors (1). Recruitment via the Src homology 2 (SH2) domain to receptor phospho-tyrosine (pTyr) peptide motifs facilitates STAT phos- phorylation on a key tyrosyl residue by growth factor receptors and the Janus kinase (Jak) and Src kinase families. Phosphory- lation induces STAT–STAT dimerization through a reciprocal pTyr–SH2 domain interaction. The active dimers in the nucleus induce gene transcription by binding to specific DNA-response elements in the promoters of target genes. The aberrant activation of Stat3 occurs in many human can- cers (2) and promotes tumor progression. The mechanisms of Stat3-mediated tumorigenesis include dysregulation of gene ex- pression that leads to uncontrolled growth and survival of tumor cells, enhanced tumor angiogenesis, and metastasis (3, 4). Tumor cell-associated constitutively active Stat3 also regulates proin- flammatory cytokine expression, including RANTES (regulated upon activation normal T cell expressed and secreted) and CXC motif chemokine 10 (CXCL10)/IFN-γ–induced protein 10 (IP- 10), and the induction of VEGF, interleukin 10 (IL-10), and other soluble factors, which in turn activate Stat3 in dendritic cells and inhibit their maturation. These events suppress tumor- immune surveillance (5). Reports also show Stat3–NF-κB cross- talk that supports the malignant phenotype (6, 7). Given its importance to cancer, Stat3 is the focus of drug discovery efforts, and the SH2 domain–pTyr interaction has gained much attention (2, 8–14). Although several dimerization- disrupting small-molecule Stat3 inhibitors have been reported (8, 9, 13–16), thus far none has reached the clinic for several reasons, including the suitability of the scaffolds and pharma- cokinetic issues. The leading dimerization-disrupting agent, S3I- 201.1066 (17), was subjected to computer-aided lead optimiza- tion. We describe the derivation and characterization of the analog, BP-1-102, an orally bioavailable Stat3 SH2 domain li- gand that inhibits Stat3 activation and functions in vitro and in vivo, and thereby inhibits growth of mouse xenografts of human breast and non–small-cell lung cancers. Results Computer-Aided Design of BP-1-102 as an Analog of S3I-201.1066. Analysis of the structural composition and topology of the Stat3 SH2 domain-binding “hotspot” shows three solvent-accessible subpockets on the protein surface, including the key pTyr705- binding region, which are accessed by S3I-201.1066 and most of the reported Stat3 inhibitors. BP-1-102 (Fig. 1A) has appendages that promote interactions with all three subpockets (Fig. 1B). Synthesis, chemical characterization, and detailed structural in- formation and further discussion are presented in SI Results, SI Materials and Methods, and Scheme S1. Inhibition of Stat3 Signaling and Function. BP-1-102 binds Stat3 with a K D of 504 nM, determined by surface plasmon resonance (SPR) analysis (Fig. S1A). It preferentially disrupts Stat3 binding to phosphorylated, native high-affinity, IL-6R/gp130 peptide (pTyr, pY904), with an IC 50 of 4.1 μM(Fig. S1B), as determined by fluorescence polarization (FP) assay, compared with its weaker activity against Stat1 binding to the IFN-γ receptor peptide (GpYDKPHVL-NH 2 ) or Stat5 binding to the erythropoietin re- ceptor peptide (GpYLVLDKW-NH 2 ), with an IC 50 of 25–30 μM (Fig. S1C). Isothermal titration calorimetry (ITC) was further used to examine BP-1-102 effects on the interaction between pY904 and Stat3 (Fig. S1D). ITC experiments in the absence and presence of BP-1-102 were conducted using identical sample concentrations and conditions (SI Materials and Methods). Pre- complexing Stat3 with BP-1-102 dramatically alters the pY904 profile, with significantly reduced enthalpic contribution by ∼6 kcal/mol (Fig. S1D, Left vs. Right, respective y-axis intercepts). This result indicates a direct interference of pY904 binding to the SH2 domain. Similarly, the reverse ITC titration of BP-1-102 into free or pY904-bound Stat3 (Fig. S1E, Left and Right, respectively) Author contributions: X.Z., P.Y., B.D.G.P., A.T.N., J.Z., Y.C., P.T.G., and J.T. designed re- search; X.Z., P.Y., B.D.G.P., T.L., W.Z., A.T.N., and D.P. performed research; J.Z., Y.C., P.T.G., and J.T. contributed new reagents/analytic tools; X.Z., P.Y., B.D.G.P., W.Z., A.T.N., J.Z., Y.C., P.T.G., and J.T. analyzed data; and X.Z., P.Y., A.T.N., Y.C., P.T.G., and J.T. wrote the paper. The authors declare no conflict of interest. This article is a PNAS Direct Submission. Freely available online through the PNAS open access option. 1 X.Z. and P.Y. contributed equally to this work. 2 To whom correspondence should be addressed. E-mail: [email protected]. This article contains supporting information online at www.pnas.org/lookup/suppl/doi:10. 1073/pnas.1121606109/-/DCSupplemental. www.pnas.org/cgi/doi/10.1073/pnas.1121606109 PNAS Early Edition | 1 of 6 PHARMACOLOGY CHEMISTRY
-
Upload
independent -
Category
Documents
-
view
1 -
download
0
Transcript of An orally bioavailable small-molecule inhibitor of Hedgehog signaling inhibits tumor initiation and...
Orally bioavailable small-molecule inhibitor oftranscription factor Stat3 regresses humanbreast and lung cancer xenograftsXiaolei Zhanga,1, Peibin Yueb,1, Brent D. G. Pagec, Tianshu Lia, Wei Zhaoa, Andrew T. Namanjad, David Paladinob,Jihe Zhaoa, Yuan Chend, Patrick T. Gunningc, and James Turksona,b,2
aBurnett School of Biomedical Sciences, University of Central Florida College of Medicine, Orlando, FL 32827; bCancer Biology and Experimental TherapeuticsPrograms, University of Hawaii Cancer Center, Honolulu, HI 96813; cDepartment of Chemistry, University of Toronto at Mississauga, Mississauga, ON, Canada,L5L 1C6; and dDepartment of Molecular Medicine, Beckman Research Institute of the City of Hope, Duarte, CA 91010
Edited by James E. Darnell, The Rockefeller University, New York, NY, and approved April 13, 2012 (received for review January 4, 2012)
Computer-aided lead optimization derives a unique, orally bioavail-able inhibitor of the signal transducer and activator of transcription(Stat)3 Src homology 2 domain. BP-1-102 binds Stat3 with an affin-ity (KD) of 504 nM, blocks Stat3–phospho-tyrosine (pTyr) peptideinteractions and Stat3 activation at 4–6.8 μM, and selectively inhib-its growth, survival, migration, and invasion of Stat3-dependenttumor cells. BP-1-102–mediated inhibition of aberrantly active Stat3in tumor cells suppresses the expression of c-Myc, Cyclin D1, Bcl-xL,Survivin, VEGF, and Krüppel-like factor 8, which is identified as aStat3 target gene that promotes Stat3-mediated breast tumor cellmigration and invasion. Treatment of breast cancer cells withBP-1-102 further blocks Stat3–NF-κB cross-talk, the release of gran-ulocyte colony-stimulating factor, soluble intercellular adhesionmolecule 1, macrophage migration-inhibitory factor/glycosylation-inhibiting factor, interleukin 1 receptor antagonist, and serine pro-tease inhibitor protein 1, and the phosphorylation of focal adhe-sion kinase and paxillin, while enhancing E-cadherin expression.Intravenous or oral gavage delivery of BP-1-102 furnishes micro-molar or microgram levels in tumor tissues and inhibits growth ofhuman breast and lung tumor xenografts.
Signal transducer and activator of transcription (STAT) pro-teins mediate responses to cytokines and growth factors (1).
Recruitment via the Src homology 2 (SH2) domain to receptorphospho-tyrosine (pTyr) peptide motifs facilitates STAT phos-phorylation on a key tyrosyl residue by growth factor receptorsand the Janus kinase (Jak) and Src kinase families. Phosphory-lation induces STAT–STAT dimerization through a reciprocalpTyr–SH2 domain interaction. The active dimers in the nucleusinduce gene transcription by binding to specific DNA-responseelements in the promoters of target genes.The aberrant activation of Stat3 occurs in many human can-
cers (2) and promotes tumor progression. The mechanisms ofStat3-mediated tumorigenesis include dysregulation of gene ex-pression that leads to uncontrolled growth and survival of tumorcells, enhanced tumor angiogenesis, and metastasis (3, 4). Tumorcell-associated constitutively active Stat3 also regulates proin-flammatory cytokine expression, including RANTES (regulatedupon activation normal T cell expressed and secreted) and CXCmotif chemokine 10 (CXCL10)/IFN-γ–induced protein 10 (IP-10), and the induction of VEGF, interleukin 10 (IL-10), andother soluble factors, which in turn activate Stat3 in dendriticcells and inhibit their maturation. These events suppress tumor-immune surveillance (5). Reports also show Stat3–NF-κB cross-talk that supports the malignant phenotype (6, 7).Given its importance to cancer, Stat3 is the focus of drug
discovery efforts, and the SH2 domain–pTyr interaction hasgained much attention (2, 8–14). Although several dimerization-disrupting small-molecule Stat3 inhibitors have been reported(8, 9, 13–16), thus far none has reached the clinic for severalreasons, including the suitability of the scaffolds and pharma-cokinetic issues. The leading dimerization-disrupting agent, S3I-
201.1066 (17), was subjected to computer-aided lead optimiza-tion. We describe the derivation and characterization of theanalog, BP-1-102, an orally bioavailable Stat3 SH2 domain li-gand that inhibits Stat3 activation and functions in vitro and invivo, and thereby inhibits growth of mouse xenografts of humanbreast and non–small-cell lung cancers.
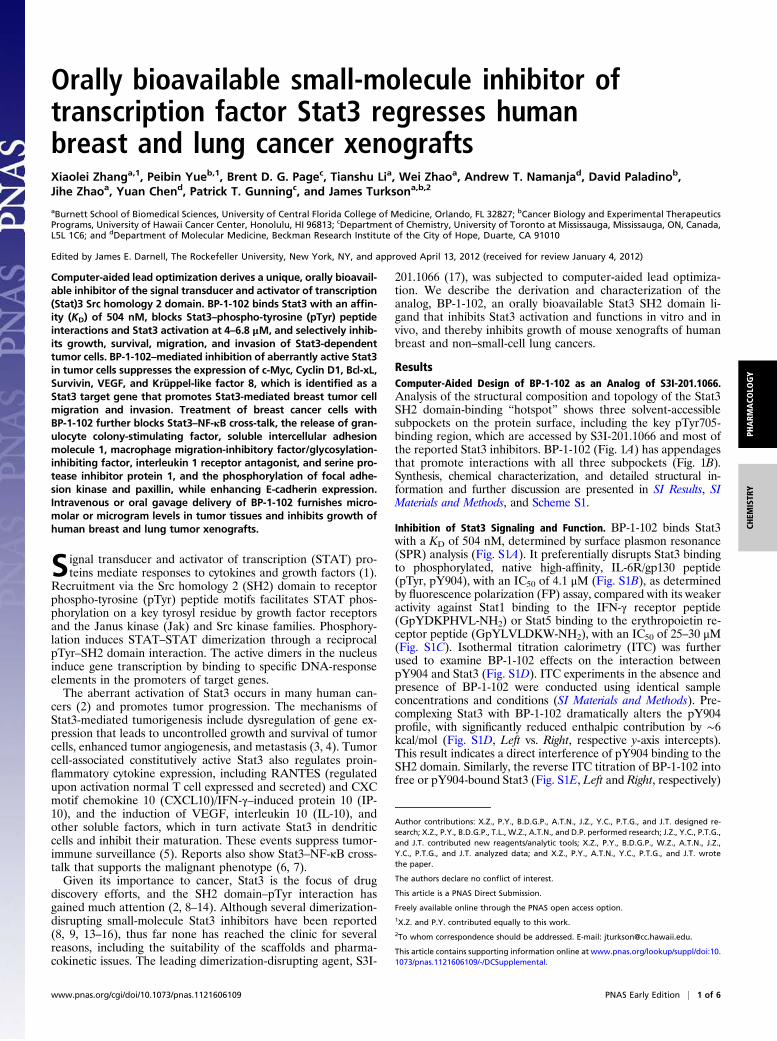
ResultsComputer-Aided Design of BP-1-102 as an Analog of S3I-201.1066.Analysis of the structural composition and topology of the Stat3SH2 domain-binding “hotspot” shows three solvent-accessiblesubpockets on the protein surface, including the key pTyr705-binding region, which are accessed by S3I-201.1066 and most ofthe reported Stat3 inhibitors. BP-1-102 (Fig. 1A) has appendagesthat promote interactions with all three subpockets (Fig. 1B).Synthesis, chemical characterization, and detailed structural in-formation and further discussion are presented in SI Results, SIMaterials and Methods, and Scheme S1.
Inhibition of Stat3 Signaling and Function. BP-1-102 binds Stat3with a KD of 504 nM, determined by surface plasmon resonance(SPR) analysis (Fig. S1A). It preferentially disrupts Stat3 bindingto phosphorylated, native high-affinity, IL-6R/gp130 peptide(pTyr, pY904), with an IC50 of 4.1 μM (Fig. S1B), as determinedby fluorescence polarization (FP) assay, compared with its weakeractivity against Stat1 binding to the IFN-γ receptor peptide(GpYDKPHVL-NH2) or Stat5 binding to the erythropoietin re-ceptor peptide (GpYLVLDKW-NH2), with an IC50 of 25–30 μM(Fig. S1C). Isothermal titration calorimetry (ITC) was furtherused to examine BP-1-102 effects on the interaction betweenpY904 and Stat3 (Fig. S1D). ITC experiments in the absence andpresence of BP-1-102 were conducted using identical sampleconcentrations and conditions (SI Materials and Methods). Pre-complexing Stat3 with BP-1-102 dramatically alters the pY904profile, with significantly reduced enthalpic contribution by ∼6kcal/mol (Fig. S1D, Left vs. Right, respective y-axis intercepts).This result indicates a direct interference of pY904 binding to theSH2 domain. Similarly, the reverse ITC titration of BP-1-102 intofree or pY904-bound Stat3 (Fig. S1E, Left and Right, respectively)
Author contributions: X.Z., P.Y., B.D.G.P., A.T.N., J.Z., Y.C., P.T.G., and J.T. designed re-search; X.Z., P.Y., B.D.G.P., T.L., W.Z., A.T.N., and D.P. performed research; J.Z., Y.C., P.T.G.,and J.T. contributed new reagents/analytic tools; X.Z., P.Y., B.D.G.P., W.Z., A.T.N., J.Z.,Y.C., P.T.G., and J.T. analyzed data; and X.Z., P.Y., A.T.N., Y.C., P.T.G., and J.T. wrotethe paper.
The authors declare no conflict of interest.
This article is a PNAS Direct Submission.
Freely available online through the PNAS open access option.1X.Z. and P.Y. contributed equally to this work.2To whom correspondence should be addressed. E-mail: [email protected].
This article contains supporting information online at www.pnas.org/lookup/suppl/doi:10.1073/pnas.1121606109/-/DCSupplemental.
www.pnas.org/cgi/doi/10.1073/pnas.1121606109 PNAS Early Edition | 1 of 6
PHARM
ACO
LOGY
CHEM
ISTR
Y
confirms that these two ligands interfere with each other’s bindingat the SH2 domain. In fact, titration of BP-1-102 to pY904-boundStat3 shows an increasing endothermic profile (heat absorption),consistent with BP-1-102 displacing pY904 from Stat3. Takentogether, these results suggest direct competition of the ligandsto the same binding site on the SH2 domain.The R2 relaxation filter NMR approach (18) was used to study
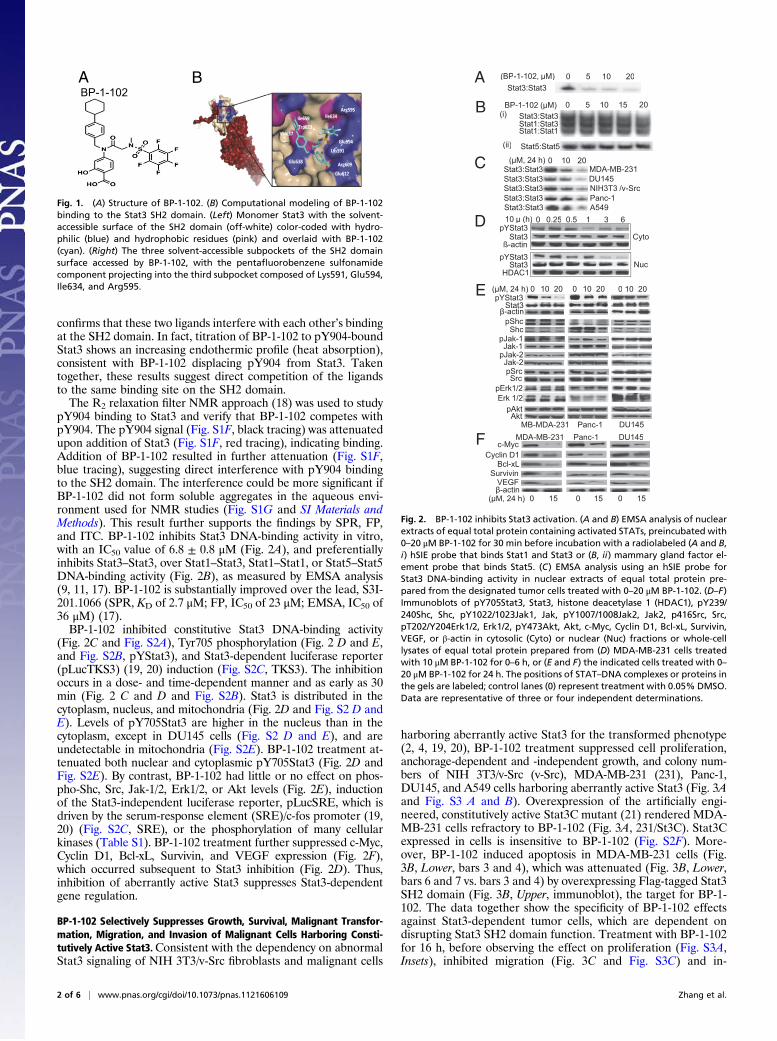
pY904 binding to Stat3 and verify that BP-1-102 competes withpY904. The pY904 signal (Fig. S1F, black tracing) was attenuatedupon addition of Stat3 (Fig. S1F, red tracing), indicating binding.Addition of BP-1-102 resulted in further attenuation (Fig. S1F,blue tracing), suggesting direct interference with pY904 bindingto the SH2 domain. The interference could be more significant ifBP-1-102 did not form soluble aggregates in the aqueous envi-ronment used for NMR studies (Fig. S1G and SI Materials andMethods). This result further supports the findings by SPR, FP,and ITC. BP-1-102 inhibits Stat3 DNA-binding activity in vitro,with an IC50 value of 6.8 ± 0.8 μM (Fig. 2A), and preferentiallyinhibits Stat3–Stat3, over Stat1–Stat3, Stat1–Stat1, or Stat5–Stat5DNA-binding activity (Fig. 2B), as measured by EMSA analysis(9, 11, 17). BP-1-102 is substantially improved over the lead, S3I-201.1066 (SPR, KD of 2.7 μM; FP, IC50 of 23 μM; EMSA, IC50 of36 μM) (17).BP-1-102 inhibited constitutive Stat3 DNA-binding activity
(Fig. 2C and Fig. S2A), Tyr705 phosphorylation (Fig. 2 D and E,and Fig. S2B, pYStat3), and Stat3-dependent luciferase reporter(pLucTKS3) (19, 20) induction (Fig. S2C, TKS3). The inhibitionoccurs in a dose- and time-dependent manner and as early as 30min (Fig. 2 C and D and Fig. S2B). Stat3 is distributed in thecytoplasm, nucleus, and mitochondria (Fig. 2D and Fig. S2 D andE). Levels of pY705Stat3 are higher in the nucleus than in thecytoplasm, except in DU145 cells (Fig. S2 D and E), and areundetectable in mitochondria (Fig. S2E). BP-1-102 treatment at-tenuated both nuclear and cytoplasmic pY705Stat3 (Fig. 2D andFig. S2E). By contrast, BP-1-102 had little or no effect on phos-pho-Shc, Src, Jak-1/2, Erk1/2, or Akt levels (Fig. 2E), inductionof the Stat3-independent luciferase reporter, pLucSRE, which isdriven by the serum-response element (SRE)/c-fos promoter (19,20) (Fig. S2C, SRE), or the phosphorylation of many cellularkinases (Table S1). BP-1-102 treatment further suppressed c-Myc,Cyclin D1, Bcl-xL, Survivin, and VEGF expression (Fig. 2F),which occurred subsequent to Stat3 inhibition (Fig. 2D). Thus,inhibition of aberrantly active Stat3 suppresses Stat3-dependentgene regulation.
BP-1-102 Selectively Suppresses Growth, Survival, Malignant Transfor-mation, Migration, and Invasion of Malignant Cells Harboring Consti-tutively Active Stat3.Consistent with the dependency on abnormalStat3 signaling of NIH 3T3/v-Src fibroblasts and malignant cells
harboring aberrantly active Stat3 for the transformed phenotype(2, 4, 19, 20), BP-1-102 treatment suppressed cell proliferation,anchorage-dependent and -independent growth, and colony num-bers of NIH 3T3/v-Src (v-Src), MDA-MB-231 (231), Panc-1,DU145, and A549 cells harboring aberrantly active Stat3 (Fig. 3Aand Fig. S3 A and B). Overexpression of the artificially engi-neered, constitutively active Stat3C mutant (21) rendered MDA-MB-231 cells refractory to BP-1-102 (Fig. 3A, 231/St3C). Stat3Cexpressed in cells is insensitive to BP-1-102 (Fig. S2F). More-over, BP-1-102 induced apoptosis in MDA-MB-231 cells (Fig.3B, Lower, bars 3 and 4), which was attenuated (Fig. 3B, Lower,bars 6 and 7 vs. bars 3 and 4) by overexpressing Flag-tagged Stat3SH2 domain (Fig. 3B, Upper, immunoblot), the target for BP-1-102. The data together show the specificity of BP-1-102 effectsagainst Stat3-dependent tumor cells, which are dependent ondisrupting Stat3 SH2 domain function. Treatment with BP-1-102for 16 h, before observing the effect on proliferation (Fig. S3A,Insets), inhibited migration (Fig. 3C and Fig. S3C) and in-
BP-1-102A B
Fig. 1. (A) Structure of BP-1-102. (B) Computational modeling of BP-1-102binding to the Stat3 SH2 domain. (Left) Monomer Stat3 with the solvent-accessible surface of the SH2 domain (off-white) color-coded with hydro-philic (blue) and hydrophobic residues (pink) and overlaid with BP-1-102(cyan). (Right) The three solvent-accessible subpockets of the SH2 domainsurface accessed by BP-1-102, with the pentafluorobenzene sulfonamidecomponent projecting into the third subpocket composed of Lys591, Glu594,Ile634, and Arg595.
0(BP 1 102 μM) 5 10 200(BP-1-102, μM) 5 10 20Stat3:Stat3
0BP-1-102 (μM) 5 10 15Stat3:Stat3Stat1:Stat3Stat1:Stat1
20
Stat5:Stat5
(i)
(ii)
0 0 25 3 60 5 110 μ (h)
0(μM, 24 h)
DU145NIH3T3 /v-Src Panc-1
Stat3:Stat3
Stat3:Stat3Stat3:Stat3
Stat3:Stat3
10 20
Stat3:Stat3 A549
Stat5:Stat5( )
pYStat3Stat3
pYStat3Stat3
HDAC1
ß-actin
0 0.25 3 60.5 1
Nuc
Cyto
10 μ (h)
(μM, 24 h) 0 10 20 0 10 20 0 10 20pYStat3
β-actinStat3
ShcpShc
Jak-1pJak-1
(μM, 24 h) 0 10 20 0 10 20 0 10 20
Jak-2pJak-2
MDA MB 231 DU145P 1
SrcpSrc
Erk 1/2pErk1/2
MB-MDA-231 Panc-1 DU145
pAktAkt
Jak-2
c-MycCyclin D1
Bcl-xLSurvivin
VEGFβ-actin
MDA-MB-231 DU145
510)h42,Mμ( 15 0
Panc-1
0 15
A
B
C
D
E
F
MDA-MB-231
Fig. 2. BP-1-102 inhibits Stat3 activation. (A and B) EMSA analysis of nuclearextracts of equal total protein containing activated STATs, preincubated with0–20 μM BP-1-102 for 30 min before incubation with a radiolabeled (A and B,i) hSIE probe that binds Stat1 and Stat3 or (B, ii) mammary gland factor el-ement probe that binds Stat5. (C) EMSA analysis using an hSIE probe forStat3 DNA-binding activity in nuclear extracts of equal total protein pre-pared from the designated tumor cells treated with 0–20 μM BP-1-102. (D–F)Immunoblots of pY705Stat3, Stat3, histone deacetylase 1 (HDAC1), pY239/240Shc, Shc, pY1022/1023Jak1, Jak, pY1007/1008Jak2, Jak2, p416Src, Src,pT202/Y204Erk1/2, Erk1/2, pY473Akt, Akt, c-Myc, Cyclin D1, Bcl-xL, Survivin,VEGF, or β-actin in cytosolic (Cyto) or nuclear (Nuc) fractions or whole-celllysates of equal total protein prepared from (D) MDA-MB-231 cells treatedwith 10 μM BP-1-102 for 0–6 h, or (E and F) the indicated cells treated with 0–20 μM BP-1-102 for 24 h. The positions of STAT–DNA complexes or proteins inthe gels are labeled; control lanes (0) represent treatment with 0.05% DMSO.Data are representative of three or four independent determinations.
2 of 6 | www.pnas.org/cgi/doi/10.1073/pnas.1121606109 Zhang et al.

vasiveness (Fig. 3D and Fig. S3D) of Stat3-dependent tumorcells. By contrast, BP-1-102 had little or no similar antitumor celleffects on a range of nontarget cells, including normal NIH 3T3(3T3), mouse thymus stromal epithelial cells, TE-71, Stat3-nullmouse embryonic fibroblasts (−/−MEFs), NIH 3T3/v-Ras (v-Ras),or A2780S cells that do not harbor aberrantly active Stat3 (Fig. 3A and C and Fig. S3 A–C). These effects are consistent with thedown-regulation of known Stat3-inducible genes (Fig. 2F) (1, 3, 4).
BP-1-102 Modulates Factors That Regulate Cell Adhesion, Cell–CellInteractions, Motility, Migration, and Invasion. Except for Stat3 as-sociation with phospho-paxillin, focal adhesion kinase (FAK),and Src (22), little is known about the Stat3-dependent molec-
ular events that promote tumor progression. BP-1-102–treatedbreast cancer MDA-MB-231 cells showed decreased phosphor-ylation of paxillin and FAK and increased E-cadherin expression(Fig. 3E). To exclude nonspecific effects, ovarian cancer A2780Scells that do not harbor aberrantly active Stat3 were treated withBP-1-102. No changes in p-FAK or p-paxillin levels were ob-served (Fig. 3E). The data that Stat3 inhibition occurs as early as30 min (Fig. 2D), when FAK and paxillin are little affected (Fig.S4), suggest that the decreased p-FAK and p-paxillin levels at24 h (Fig. 3E) are secondary events to Stat3 inhibition. BP-1-102further suppressed Snail expression (Fig. 3E), a Stat3-regulatedgene that controls E-cadherin expression.FAK promotes Krüppel-like factor (KLF)8 induction (23).
KLF8 and the tumor–stroma interaction factor, epithelial–stro-mal interaction 1 (EPSTI1) protein, promote tumor cell spreadand invasiveness (24, 25). BP-1-102–treated breast cancer cellsshowed reduced KLF8 and EPSTI1 levels (Fig. 3F, i), which wasvalidated by Stat3 knockdown by siRNA (Fig. 3F, ii). Further-more, in normal NIH 3T3 fibroblasts, transiently cotransfectedwith the KLF8 promoter-driven luciferase reporter (pLucKLF8)and v-Src vector, the activation of Stat3 by v-Src (20) inducedplucKLF8 expression by over twofold, which was repressed byBP-1-102 (Fig. S5A). The KLF8 promoter has three putativeStat3 binding sites (Fig. S5B, i). Site-specific mutation in thenucleotide sequence −253/−245 (site 1) severely impaired themutant pLucKLF8/−253T/G reporter induction (Fig. S5A, com-pare bars 2 and 5). In vitro DNA-binding/EMSA analysis furthershowed a strong Stat3 binding to an oligonucleotide probe in-corporating site 1 (−253/−245), compared with the standard high-affinity sis-inducible element (hSIE) probe, which was diminishedby blocking anti-Stat3 antibody in a supershift assay (Fig. S5B,ii). No Stat3 binding was observed to site 2 or 3 (Fig. S5B, ii),although we do not exclude the possibility they contribute to Stat3responsiveness. Thus, Stat3 directly induces the KLF8 gene.To further study KLF8 importance, we evaluated BP-1-102
effects on cell motility and invasiveness in a KLF8 overexpressionor knockdown background. By contrast to inhibition of invasive-ness of the wild-type cells (Fig. 3 D and G, bar 2), KLF8 over-expression (24) in MDA-MB-231 cells abolished BP-1-102 effects(Fig. 3G, bars 3–5). Further, studies using tetracycline-inducibleKLF8 shRNA (24) in MDA-MB-231-K8ikd cells show that KLF8knockdown, as expected, suppressed cell migration (Fig. S5C,compare bar 2 vs. 5) and invasiveness (Fig. S5D, compare bar2 vs. 5) and in turn minimized the BP-1-102–induced effectthat is otherwise observed in the wild-type, uninduced cells (Fig.S5 C and D, compare the relative change between bars 2 and 3 tothat of bars 5 and 6). Thus, KLF8 expression is one of the un-derlying mechanisms of Stat3-mediated tumor cell migration andinvasiveness.
BP-1-102 Represses Stat3–NF-κB Cross-Talk and the ExtracellularProduction of Soluble Factors. Stat3 cross-talks with factors suchas NF-κB in the tumor microenvironment (6, 7) that redirectinflammation signal for oncogenic functions. BP-1-102–mediatedattenuation of nuclear and cytoplasmic pY705Stat3 and of nu-clear total Stat3 led to decreased nuclear pRelA and total RelAlevels (Fig. 3H), whereas cytoplasmic RelA and pRelA levelsappeared unchanged. To investigate the concurrent decline innuclear RelA, we focused on the pStat3–pRelA complex (26),which is detected in the nucleus by coimmunoprecipitation anal-ysis (Fig. 3I, lane 1) and as colocalization in immunofluorescence/confocal microscopy (Fig. S6A, control, merged). BP-1-102 treat-ment diminished the pStat3–pRelA interaction (Fig. 3I, lane 2and Fig. S6A, compare 25 μM, 16 h to control), which was val-idated by Stat3 knockdown by siRNA (Fig. 3J). By contrast, BP-1-102 treatment had no effect on IκB–RelA interactions (Fig.S6B). Per the published report (26) that nuclear Stat3–NF-κBcomplex promotes nuclear NF-κB retention, BP-1-102–mediated
0 μM 10 μM 20 μM 30 μM
Cel
lson
trol)
75100
***** **** ***BP-1-102 (μM, 24 h)
0 10 15
68
s X
10
x 10
2
2 0
BP-1-102(μM, 16 h)
TE-71 3T3 DU145A2780S -/-MEFs v-Src A549
Via
ble
(% o
f co
v-Ras Panc-1 23102550
40s
231/St3C
BP-1-102 (μM, 16 h)
30***
St3 SH2MockFlag
DU145v-Src 0
10
20
****2
4
6
0**
**
Panc-1 231
2
4
6
0
*
**
0
10
20
v-Ras# of
mig
rate
d ce
lls
****
# of
inva
ded
cells
x
0
1
2 10 15
0
20
40
% A
popt
osi
10
30
(μM, 48 h)
St3 SH2- 15
**
0
10
20
30**
20-
BP 1 102 BP 1 102
-15 20Mock
BP-1-102
**
pFAKFAK
pPaxillinPaxillin
E-cadherinβ-actin
0 10 15
KLF80
0.5
1.0***
BP 1 102- + + +-
Inva
sive
ness
(fold
cha
nge)KLF8
Stat3
β-actin
(ii)
Stat3 - +siRNA
EPSTI10
KLF8EPSTI1
15
(i)
β-actin
BP-1-102(μM, 24 h)
BP-1-102(μM, 24 h)
0 10 15
BP-1-102(μM, 24 h)
A2780S
S il
pStat3Stat3
pRelARelA
BP-1-102 (μM, 24 h)0 150 150 15
** **0 00.40.60.81.0
*
0 10
Arb
itrar
y le
vels
Stat3pRelARelA
β-actinStat3 - +siRNA
BP-1-102 0 510- 10(μM, 16 h)
IP: Stat3Stat3RelA
0 15
Stat3RelA
Blot:
Blot:
BP-1-102(μM, 24 h)MDA-MB-231
Snailβ-actin
β-actinRelA
NucCytoWCHDAC1
0.0Nuc
IP: RelARelA
A
B
E F G
H
C D
KJ
I
Fig. 3. BP-1-102 induces antitumor cell effects in vitro and suppresses tu-mor-supporting factors. (A) Cultured MDA-MB-231, DU145, Panc-1, and NIH3T3/v-Src cells harboring aberrantly active Stat3 and NIH 3T3, NIH 3T3/v-Ras, mouse thymus stromal epithelial cells, TE-71, Stat3-null mouse embry-onic fibroblasts (Stat3−/− MEFs), cisplatin-sensitive ovarian cancer cells,A2780S cells that do not, were treated once with 0–30 μM BP-1-102 and sub-jected to CyQUANT cell proliferation assay. (B) Annexin V/flow cytometryanalysis of MDA-MB-231 cells transfected with pcDNA-3 (mock) or Flag-tagged Stat3 (St3) SH2 domain and treated with 0–15 μM BP-1-102 (Lower);Flag immunoblot (Upper). (C) Cultured malignant cells were treated with BP-1-102, wounded, and allowed to migrate into a denuded area. (D) Numberof invaded MDA-MB-231 cells in a BioCoat invasion chamber assay and theeffects of BP-1-102. (E and F) Immunoblotting analysis of whole-cell lysatesprepared from MDA-MB-231 cells (E and F, i) treated with 0–15 μM BP-1-102or (F, ii) transfected with control (−) or Stat3 siRNA (+) and probing for FAK,pY576/577FAK, paxillin, pY118paxillin, E-cadherin, Snail, KLF8, EPSTI1, orβ-actin. (G) Number of invaded MDA-MB-231 cells in a BioCoat invasionchamber assay and the impact of KLF8 overexpression on BP-1-102 effects.(H–J) Immunoblotting analysis of (H) whole-cell (WC), nuclear (Nuc), or cy-tosolic (Cyto) lysates, (I) immunecomplexes of Stat3 (Upper) or RelA (Lower)prepared from MDA-MB-231 cells treated with 0–15 μM BP-1-102, or (J)whole-cell lysates of MDA-MB-231 cells transfected with control (−) or Stat3siRNA (+) and probing for pY705Stat3, Stat3, pS536RelA, RelA, β-actin, orHDAC1. (K) G-CSF, sICAM, and MIF/GIF levels assayed in conditioned mediumfrom cultures of MDA-MB-231 cells treated for 48 h with BP-1-102. Positionsof proteins in the gel are shown. Data are representative of three or fourindependent determinations. Values, mean ± SD, n = 4 or 9. *P < 0.05, **P <0.01, ***P < 0.005.
Zhang et al. PNAS Early Edition | 3 of 6
PHARM
ACO
LOGY
CHEM
ISTR
Y
inhibition of activated Stat3 diminishes nuclear Stat3 that in turndown-regulates nuclear pNF-κB.To explore further the BP-1-102 effect on Stat3 cross-talks, we
examined the production of soluble factors by tumor cells. Cul-ture medium from BP-1-102–treated MDA-MB-231 cells showedlower granulocyte colony-stimulating factor (G-CSF), soluble in-tercellular adhesion molecule (sICAM) 1, and macrophage migra-tion-inhibitory factor (MIF)/glycosylation-inhibiting factor (GIF)levels (Fig. 3K). Moreover, treatment of cells with exogenous G-CSF further induced Stat3 and RelA phosphorylation aboveconstitutive levels (Fig. S6C, compare lanes 1 and 3) and conse-quently blocked the BP-1-102–repressive effect (Fig. S6C, com-pare lanes 2 and 4). Thus, BP-1-102 inhibits the production ofsoluble factors by tumor cells.
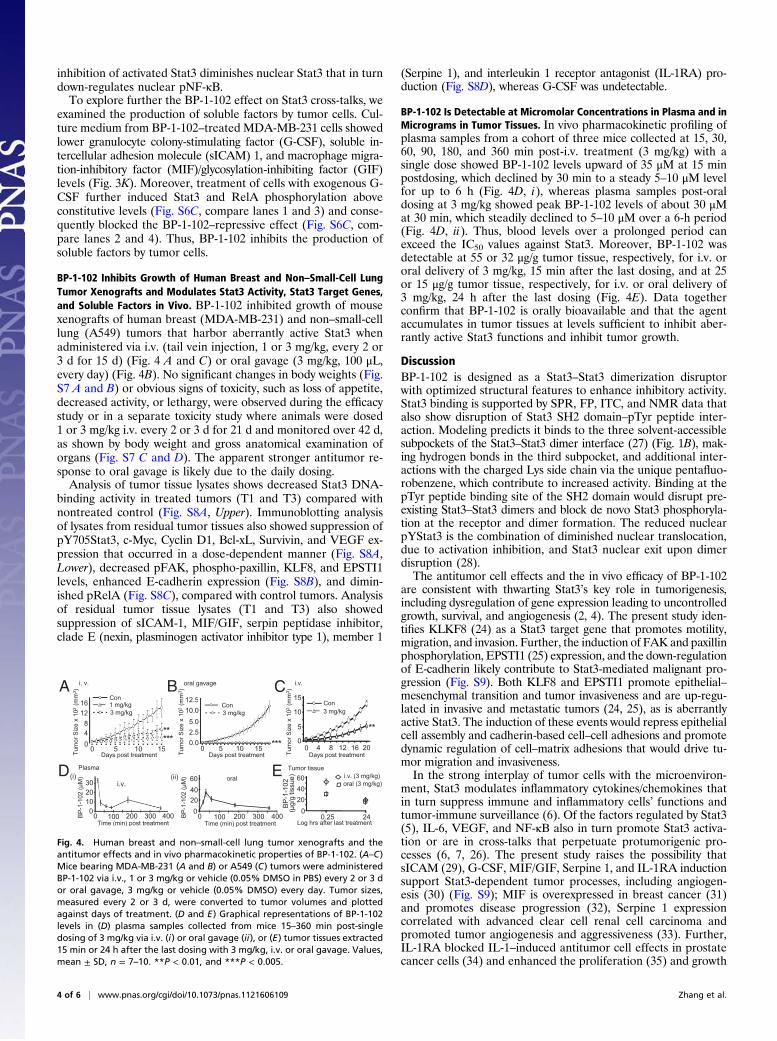
BP-1-102 Inhibits Growth of Human Breast and Non–Small-Cell LungTumor Xenografts and Modulates Stat3 Activity, Stat3 Target Genes,and Soluble Factors in Vivo. BP-1-102 inhibited growth of mousexenografts of human breast (MDA-MB-231) and non–small-celllung (A549) tumors that harbor aberrantly active Stat3 whenadministered via i.v. (tail vein injection, 1 or 3 mg/kg, every 2 or3 d for 15 d) (Fig. 4 A and C) or oral gavage (3 mg/kg, 100 μL,every day) (Fig. 4B). No significant changes in body weights (Fig.S7 A and B) or obvious signs of toxicity, such as loss of appetite,decreased activity, or lethargy, were observed during the efficacystudy or in a separate toxicity study where animals were dosed1 or 3 mg/kg i.v. every 2 or 3 d for 21 d and monitored over 42 d,as shown by body weight and gross anatomical examination oforgans (Fig. S7 C and D). The apparent stronger antitumor re-sponse to oral gavage is likely due to the daily dosing.Analysis of tumor tissue lysates shows decreased Stat3 DNA-
binding activity in treated tumors (T1 and T3) compared withnontreated control (Fig. S8A, Upper). Immunoblotting analysisof lysates from residual tumor tissues also showed suppression ofpY705Stat3, c-Myc, Cyclin D1, Bcl-xL, Survivin, and VEGF ex-pression that occurred in a dose-dependent manner (Fig. S8A,Lower), decreased pFAK, phospho-paxillin, KLF8, and EPSTI1levels, enhanced E-cadherin expression (Fig. S8B), and dimin-ished pRelA (Fig. S8C), compared with control tumors. Analysisof residual tumor tissue lysates (T1 and T3) also showedsuppression of sICAM-1, MIF/GIF, serpin peptidase inhibitor,clade E (nexin, plasminogen activator inhibitor type 1), member 1
(Serpine 1), and interleukin 1 receptor antagonist (IL-1RA) pro-duction (Fig. S8D), whereas G-CSF was undetectable.
BP-1-102 Is Detectable at Micromolar Concentrations in Plasma and inMicrograms in Tumor Tissues. In vivo pharmacokinetic profiling ofplasma samples from a cohort of three mice collected at 15, 30,60, 90, 180, and 360 min post-i.v. treatment (3 mg/kg) with asingle dose showed BP-1-102 levels upward of 35 μM at 15 minpostdosing, which declined by 30 min to a steady 5–10 μM levelfor up to 6 h (Fig. 4D, i), whereas plasma samples post-oraldosing at 3 mg/kg showed peak BP-1-102 levels of about 30 μMat 30 min, which steadily declined to 5–10 μM over a 6-h period(Fig. 4D, ii). Thus, blood levels over a prolonged period canexceed the IC50 values against Stat3. Moreover, BP-1-102 wasdetectable at 55 or 32 μg/g tumor tissue, respectively, for i.v. ororal delivery of 3 mg/kg, 15 min after the last dosing, and at 25or 15 μg/g tumor tissue, respectively, for i.v. or oral delivery of3 mg/kg, 24 h after the last dosing (Fig. 4E). Data togetherconfirm that BP-1-102 is orally bioavailable and that the agentaccumulates in tumor tissues at levels sufficient to inhibit aber-rantly active Stat3 functions and inhibit tumor growth.
DiscussionBP-1-102 is designed as a Stat3–Stat3 dimerization disruptorwith optimized structural features to enhance inhibitory activity.Stat3 binding is supported by SPR, FP, ITC, and NMR data thatalso show disruption of Stat3 SH2 domain–pTyr peptide inter-action. Modeling predicts it binds to the three solvent-accessiblesubpockets of the Stat3–Stat3 dimer interface (27) (Fig. 1B), mak-ing hydrogen bonds in the third subpocket, and additional inter-actions with the charged Lys side chain via the unique pentafluo-robenzene, which contribute to increased activity. Binding at thepTyr peptide binding site of the SH2 domain would disrupt pre-existing Stat3–Stat3 dimers and block de novo Stat3 phosphoryla-tion at the receptor and dimer formation. The reduced nuclearpYStat3 is the combination of diminished nuclear translocation,due to activation inhibition, and Stat3 nuclear exit upon dimerdisruption (28).The antitumor cell effects and the in vivo efficacy of BP-1-102
are consistent with thwarting Stat3’s key role in tumorigenesis,including dysregulation of gene expression leading to uncontrolledgrowth, survival, and angiogenesis (2, 4). The present study iden-tifies KLKF8 (24) as a Stat3 target gene that promotes motility,migration, and invasion. Further, the induction of FAK and paxillinphosphorylation, EPSTI1 (25) expression, and the down-regulationof E-cadherin likely contribute to Stat3-mediated malignant pro-gression (Fig. S9). Both KLF8 and EPSTI1 promote epithelial–mesenchymal transition and tumor invasiveness and are up-regu-lated in invasive and metastatic tumors (24, 25), as is aberrantlyactive Stat3. The induction of these events would repress epithelialcell assembly and cadherin-based cell–cell adhesions and promotedynamic regulation of cell–matrix adhesions that would drive tu-mor migration and invasiveness.In the strong interplay of tumor cells with the microenviron-
ment, Stat3 modulates inflammatory cytokines/chemokines thatin turn suppress immune and inflammatory cells’ functions andtumor-immune surveillance (6). Of the factors regulated by Stat3(5), IL-6, VEGF, and NF-κB also in turn promote Stat3 activa-tion or are in cross-talks that perpetuate protumorigenic pro-cesses (6, 7, 26). The present study raises the possibility thatsICAM (29), G-CSF, MIF/GIF, Serpine 1, and IL-1RA inductionsupport Stat3-dependent tumor processes, including angiogen-esis (30) (Fig. S9); MIF is overexpressed in breast cancer (31)and promotes disease progression (32), Serpine 1 expressioncorrelated with advanced clear cell renal cell carcinoma andpromoted tumor angiogenesis and aggressiveness (33). Further,IL-1RA blocked IL-1–induced antitumor cell effects in prostatecancer cells (34) and enhanced the proliferation (35) and growth
i. v. oral gavage i.v.
m3 )
m3 )
12 5 m3 )
15Con
048
1216
0 5 10 15Days post treatmentTu
mor
Siz
e x
102
(mm
0.02.55.0
10.0
0 5 10 15Days post treatmentTu
mor
Siz
e x
102
(mm 12.5
0
5
10
4 8 12Days post treatmentTu
mor
Siz
e x
102
(mm 15
16 200
Con3 mg/kg
***
*******
Con1 mg/kg3 mg/kg 3 mg/kg
Con
BP
-1-1
02 ( μ
M)
Plasma
0102030 i.v.
100 200 300 400Time (min) post treatment
0.25 24Log hrs after last treatment
204060
0
BP-1
-102
Tumor tissue
oral (3 mg/kg)i.v. (3 mg/kg)
(μg/
g tis
sue)
0204060 oral
0 0BP
-1-1
02 (μ
M)
100 200 300 400Time (min) post treatment
(ii)(i)
Time (min) post treatment Log hrs after last treatmentTime (min) post treatment
A B C
D E
Fig. 4. Human breast and non–small-cell lung tumor xenografts and theantitumor effects and in vivo pharmacokinetic properties of BP-1-102. (A–C)Mice bearing MDA-MB-231 (A and B) or A549 (C) tumors were administeredBP-1-102 via i.v., 1 or 3 mg/kg or vehicle (0.05% DMSO in PBS) every 2 or 3 dor oral gavage, 3 mg/kg or vehicle (0.05% DMSO) every day. Tumor sizes,measured every 2 or 3 d, were converted to tumor volumes and plottedagainst days of treatment. (D and E) Graphical representations of BP-1-102levels in (D) plasma samples collected from mice 15–360 min post-singledosing of 3 mg/kg via i.v. (i) or oral gavage (ii), or (E) tumor tissues extracted15 min or 24 h after the last dosing with 3 mg/kg, i.v. or oral gavage. Values,mean ± SD, n = 7–10. **P < 0.01, and ***P < 0.005.
4 of 6 | www.pnas.org/cgi/doi/10.1073/pnas.1121606109 Zhang et al.
of hepatic and glioblastoma cells (36), and sIL-1RA mRNAexpression correlated with lymph node and hepatic metastases ingastric carcinoma patients (37). BP-1-102–mediated repressionof these tumor-supporting factors likely contributes to its anti-tumor effects.We present a unique Stat3 inhibitor, BP-1-102, that sufficiently
accumulates in tumor tissues and induces antitumor responses inhuman tumor xenografts that harbor aberrantly active Stat3. Theoral bioavailability of BP-1-102 represents a substantial advance-ment in the discovery of small-molecule Stat3 inhibitors as uniqueanticancer agents.
Materials and MethodsCells and Reagents.NIH 3T3, NIH 3T3/v-Src, and NIH 3T3/v-Ras cells, the humanbreast cancer line MDA-MB-231 and counterpart expressing inducible KLF8shRNA (231-K8ikd), and human prostate (DU145), non–small-cell lung (A549),and pancreatic (Panc-1) cancer cells have all been previously reported (11,17, 20, 24). Stat3-dependent (pLucTKS3), Stat3-independent (pLucSRE), andpLucKLF8 luciferase reporters, and the v-Src, β-galactosidase, Stat3 SH2 do-main, Stat3C, and pLVUT-tTR-KRAB-KLF8 vectors have all been reported(9, 19–21, 23, 24). Other reagents are the Human Cytokine Array Kit (R&DSystems), G-CSF (Sigma-Aldrich) used at 100 ng/mL, and Stat1 and Stat5proteins (SignalChem). Primary antibodies used were anti-Stat3, pStat3, pSrc,Src, pErk1/2, Erk1/2, pJak1, Jak1, Jak2, pJak2, pShc, Shc, Cyclin D1, c-Myc, Bcl-xL, Survivin, Akt, pAkt, pRelA, RelA, pFAK, FAK, phospho-paxillin, paxillin,E-cadherin, HDAC1, Snail, and β-actin (Cell Signaling Technology), VEGF(Santa Cruz Biotechnology), Flag and EPSTI1 (Sigma-Aldrich), and KLF8 (24).Cells were grown in DMEM containing 10% (vol/vol) heat-inactivated FBS.
Cloning and Protein Expression. Molecular cloning, expression, and purifica-tion of His-tagged Stat3 have previously been reported (17). The cloning ofthe pXJ-FLAG-Stat3 SH2 domain and mutant KLF8 promoter is described indetail in SI Materials and Methods.
Nuclear Extract Preparation, Gel Shift Assay, and Densitometric Analysis. Stud-ies and analysis were carried out as previously described (9, 20, 28). Details areprovided in SI Materials and Methods.
Immunoprecipitation and Western Blotting Analyses. Studies were performedas previously described (9, 17, 28). Details are provided in SI Materialsand Methods.
Cell Viability, Proliferation, Colony Survival, and Wound-Healing Assays. Studieswere performed as previously reported (17). Details are provided in SIMaterials and Methods.
Transient Transfection of Cells, Luciferase, and Apoptosis Assays. Studies wereperformed as previously reported (9, 20). After seeding for 12–24 h, cellswere transfected with designated plasmid or siRNA, treated or not with BP-1-102, and processed for luciferase, immunoblotting, or Annexin V/flowcytometry analysis. Details of the Stat3 siRNA and studies are provided in SIMaterials and Methods.
Immunostaining with Laser-Scanning Confocal Imaging. Studies are describedin detail in SI Materials and Methods.
Fluorescence Polarization Assay. Assays were conducted as previously repor-ted (17).
Surface Plasmon Resonance Analysis. Studies were performed as previouslyreported (17).
Cell Migration/Invasion Assays. Experiments were carried out and quantifiedas previously reported (9, 24, 28). Details are provided in SI Materialsand Methods.
Cytokine Analysis. The assay is described in detail in SI Materials andMethods.
Tumor Xenografts, Efficacy, and Pharmacokinetic Studies. Studies were per-formed as previously reported (9, 17, 28). BP-1-102 concentrations in mouseplasma and tumor tissue lysates were assayed using a validated analyticalprocedure via HPLCy. Details are provided in SI Materials and Methods.
Statistical Analysis. Statistical analysis was performed on mean values usingPrism (GraphPad Software). The significance of differences between groupswas determined by the paired t test at *P < 0.05, **P < 0.01, and ***P < 0.005.
ACKNOWLEDGMENTS. We thank all colleagues and members of our labora-tories for stimulating discussions, and the Sanford-Burnham Medical ResearchInstitute Pharmacology Core for conducting the pharmacokinetic studies. Thiswork was supported by National Cancer Institute Grants CA106439 (to J.T.),CA128865 (to J.T.), and CA132977 (to J.Z.); the University of Hawaii (J.T.); andthe University of Toronto (P.T.G.).
1. Darnell JE, Jr. (2002) Transcription factors as targets for cancer therapy. Nat RevCancer 2:740–749.
2. Yue P, Turkson J (2009) Targeting STAT3 in cancer: How successful are we? ExpertOpin Investig Drugs 18(1):45–56.
3. Bromberg J, Darnell JE, Jr. (2000) The role of STATs in transcriptional control and theirimpact on cellular function. Oncogene 19:2468–2473.
4. Turkson J (2004) STAT proteins as novel targets for cancer drug discovery. Expert OpinTher Targets 8:409–422.
5. Wang T, et al. (2004) Regulation of the innate and adaptive immune responses byStat-3 signaling in tumor cells. Nat Med 10(1):48–54.
6. Yu H, Pardoll D, Jove R (2009) STATs in cancer inflammation and immunity: A leadingrole for STAT3. Nat Rev Cancer 9:798–809.
7. Grivennikov SI, Karin M (2010) Dangerous liaisons: STAT3 and NF-κB collaboration andcrosstalk in cancer. Cytokine Growth Factor Rev 21(1):11–19.
8. Song H, Wang R, Wang S, Lin J (2005) A low-molecular-weight compound discoveredthrough virtual database screening inhibits Stat3 function in breast cancer cells. ProcNatl Acad Sci USA 102:4700–4705.
9. Siddiquee K, et al. (2007) Selective chemical probe inhibitor of Stat3, identifiedthrough structure-based virtual screening, induces antitumor activity. Proc Natl AcadSci USA 104:7391–7396.
10. Gunning PT, et al. (2007) Isoform selective inhibition of STAT1 or STAT3 homo-di-merization via peptidomimetic probes: Structural recognition of STAT SH2 domains.Bioorg Med Chem Lett 17:1875–1878.
11. Turkson J, et al. (2001) Phosphotyrosyl peptides block Stat3-mediated DNA bindingactivity, gene regulation, and cell transformation. J Biol Chem 276:45443–45455.
12. Turkson J, et al. (2004) Novel peptidomimetic inhibitors of signal transducer andactivator of transcription 3 dimerization and biological activity. Mol Cancer Ther 3:261–269.
13. Mandal PK, et al. (2011) Potent and selective phosphopeptide mimetic prodrugstargeted to the Src homology 2 (SH2) domain of signal transducer and activator oftranscription 3. J Med Chem 54:3549–3563.
14. Mandal PK, Ren Z, Chen X, Xiong C, McMurray JS (2009) Structure-affinity relationshipsof glutamine mimics incorporated into phosphopeptides targeted to the SH2 domainof signal transducer and activator of transcription 3. J Med Chem 52:6126–6141.
15. Chen J, et al. (2010) Structure-based design of conformationally constrained, cell-permeable STAT3 inhibitors. ACS Med Chem Lett 1(2):85–89.
16. Lin L, et al. (2010) Novel STAT3 phosphorylation inhibitors exhibit potent growth-suppressive activity in pancreatic and breast cancer cells. Cancer Res 70:2445–2454.
17. Zhang X, et al. (2010) A novel small-molecule disrupts Stat3 SH2 domain-phosphotyrosineinteractions and Stat3-dependent tumor processes. Biochem Pharmacol 79:1398–1409.
18. Dalvit C, et al. (2002) High-throughput NMR-based screening with competitionbinding experiments. J Am Chem Soc 124:7702–7709.
19. Turkson J, et al. (1999) Requirement for Ras/Rac1-mediated p38 and c-Jun N-terminalkinase signaling in Stat3 transcriptional activity induced by the Src oncoprotein. MolCell Biol 19:7519–7528.
20. Turkson J, et al. (1998) Stat3 activation by Src induces specific gene regulation and isrequired for cell transformation. Mol Cell Biol 18:2545–2552.
21. Bromberg JF, et al. (1999) Stat3 as an oncogene. Cell 98:295–303.22. Silver DL, Naora H, Liu J, Cheng W, Montell DJ (2004) Activated signal transducer and
activator of transcription (STAT) 3: Localization in focal adhesions and function inovarian cancer cell motility. Cancer Res 64:3550–3558.
23. Wang X, Urvalek AM, Liu J, Zhao J (2008) Activation of KLF8 transcription by focal ad-hesion kinase in humanovarianepithelial and cancer cells. J Biol Chem283:13934–13942.
24. Wang X, et al. (2011) KLF8 promotes human breast cancer cell invasion and metastasisby transcriptional activation of MMP9. Oncogene 30:1901–1911.
25. Nielsen HL, Rønnov-Jessen L, Villadsen R, Petersen OW (2002) Identification of EPSTI1,a novel gene induced by epithelial-stromal interaction in human breast cancer. Ge-nomics 79:703–710.
26. Lee H, et al. (2009) Persistently activated Stat3 maintains constitutive NF-κB activity intumors. Cancer Cell 15:283–293.
27. Fletcher S, Turkson J, Gunning PT (2008) Molecular approaches towards the inhibitionof the signal transducer and activator of transcription 3 (Stat3) protein. Chem-MedChem 3:1159–1168.
28. Siddiquee KAZ, et al. (2007) An oxazole-based small-molecule Stat3 inhibitor modulatesStat3 stability andprocessing and induces antitumor cell effects.ACSChemBiol 2:787–798.
29. Kim DH, et al. (2006) Anti-inflammatory effects of 8-hydroxydeoxyguanosine in LPS-induced microglia activation: Suppression of STAT3-mediated intercellular adhesionmolecule-1 expression. Exp Mol Med 38:417–427.
Zhang et al. PNAS Early Edition | 5 of 6
PHARM
ACO
LOGY
CHEM
ISTR
Y

30. Gho YS, Kim PN, Li HC, Elkin M, Kleinman HK (2001) Stimulation of tumor growth byhuman soluble intercellular adhesion molecule-1. Cancer Res 61:4253–4257.
31. Jesneck JL, et al. (2009) Do serum biomarkers really measure breast cancer? BMCCancer 9:164.
32. Abe R, Peng T, Sailors J, Bucala R, Metz CN (2001) Regulation of the CTL response bymacrophage migration inhibitory factor. J Immunol 166:747–753.
33. Zubac DP, Wentzel-Larsen T, Seidal T, Bostad L (2010) Type 1 plasminogen activatorinhibitor (PAI-1) in clear cell renal cell carcinoma (CCRCC) and its impact on an-giogenesis, progression and patient survival after radical nephrectomy. BMC Urol10:20.
34. Hsieh TC, Chiao JW (1995) Growth modulation of human prostatic cancer cells byinterleukin-1 and interleukin-1 receptor antagonist. Cancer Lett 95(1-2):119–123.
35. Yamada Y, Karasaki H, Matsushima K, Lee GH, Ogawa K (1999) Expression of an IL-1receptor antagonist during mouse hepatocarcinogenesis demonstrated by differen-tial display analysis. Lab Invest 79:1059–1067.
36. Oelmann E, et al. (1997) Autocrine interleukin-1 receptor antagonist can supportmalignant growth of glioblastoma by blocking growth-inhibiting autocrine loop ofinterleukin-1. Int J Cancer 71:1066–1076.
37. Iizuka N, et al. (1999) Interleukin-1 receptor antagonist mRNA expression and theprogression of gastric carcinoma. Cancer Lett 142(2):179–184.
6 of 6 | www.pnas.org/cgi/doi/10.1073/pnas.1121606109 Zhang et al.
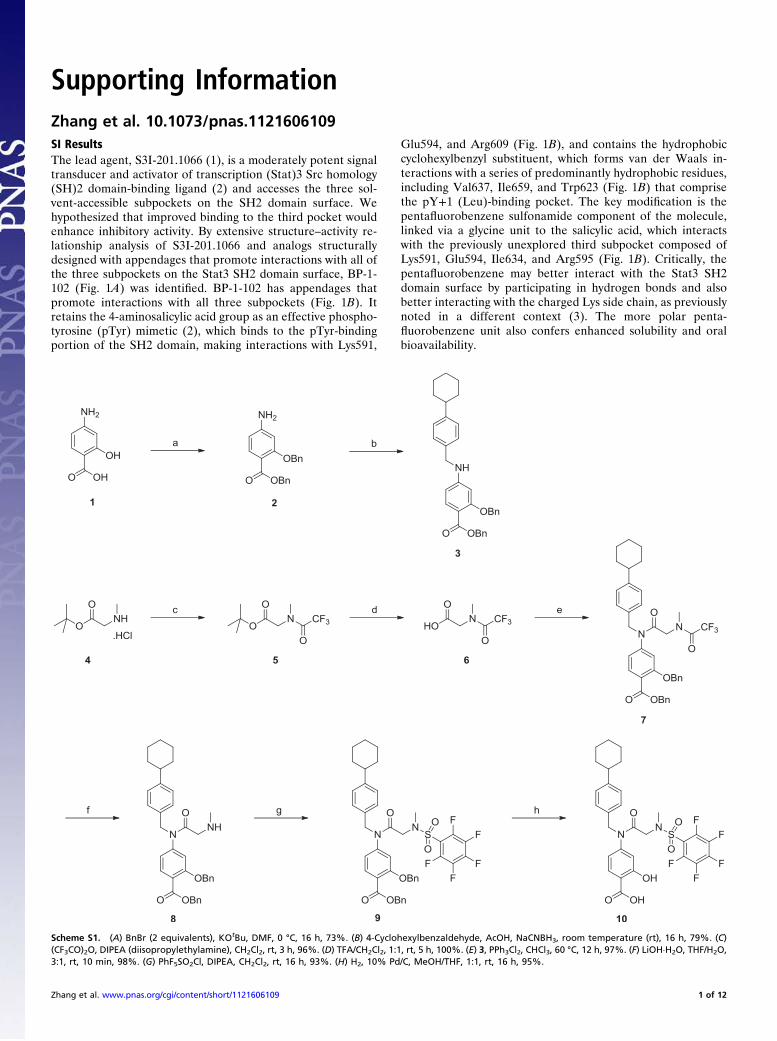
Supporting InformationZhang et al. 10.1073/pnas.1121606109SI ResultsThe lead agent, S3I-201.1066 (1), is a moderately potent signaltransducer and activator of transcription (Stat)3 Src homology(SH)2 domain-binding ligand (2) and accesses the three sol-vent-accessible subpockets on the SH2 domain surface. Wehypothesized that improved binding to the third pocket wouldenhance inhibitory activity. By extensive structure–activity re-lationship analysis of S3I-201.1066 and analogs structurallydesigned with appendages that promote interactions with all ofthe three subpockets on the Stat3 SH2 domain surface, BP-1-102 (Fig. 1A) was identified. BP-1-102 has appendages thatpromote interactions with all three subpockets (Fig. 1B). Itretains the 4-aminosalicylic acid group as an effective phospho-tyrosine (pTyr) mimetic (2), which binds to the pTyr-bindingportion of the SH2 domain, making interactions with Lys591,
Glu594, and Arg609 (Fig. 1B), and contains the hydrophobiccyclohexylbenzyl substituent, which forms van der Waals in-teractions with a series of predominantly hydrophobic residues,including Val637, Ile659, and Trp623 (Fig. 1B) that comprisethe pY+1 (Leu)-binding pocket. The key modification is thepentafluorobenzene sulfonamide component of the molecule,linked via a glycine unit to the salicylic acid, which interactswith the previously unexplored third subpocket composed ofLys591, Glu594, Ile634, and Arg595 (Fig. 1B). Critically, thepentafluorobenzene may better interact with the Stat3 SH2domain surface by participating in hydrogen bonds and alsobetter interacting with the charged Lys side chain, as previouslynoted in a different context (3). The more polar penta-fluorobenzene unit also confers enhanced solubility and oralbioavailability.
Scheme S1. (A) BnBr (2 equivalents), KOtBu, DMF, 0 °C, 16 h, 73%. (B) 4-Cyclohexylbenzaldehyde, AcOH, NaCNBH3, room temperature (rt), 16 h, 79%. (C)(CF3CO)2O, DIPEA (diisopropylethylamine), CH2Cl2, rt, 3 h, 96%. (D) TFA/CH2Cl2, 1:1, rt, 5 h, 100%. (E) 3, PPh3Cl2, CHCl3, 60 °C, 12 h, 97%. (F) LiOH·H2O, THF/H2O,3:1, rt, 10 min, 98%. (G) PhF5SO2Cl, DIPEA, CH2Cl2, rt, 16 h, 93%. (H) H2, 10% Pd/C, MeOH/THF, 1:1, rt, 16 h, 95%.
Zhang et al. www.pnas.org/cgi/content/short/1121606109 1 of 12
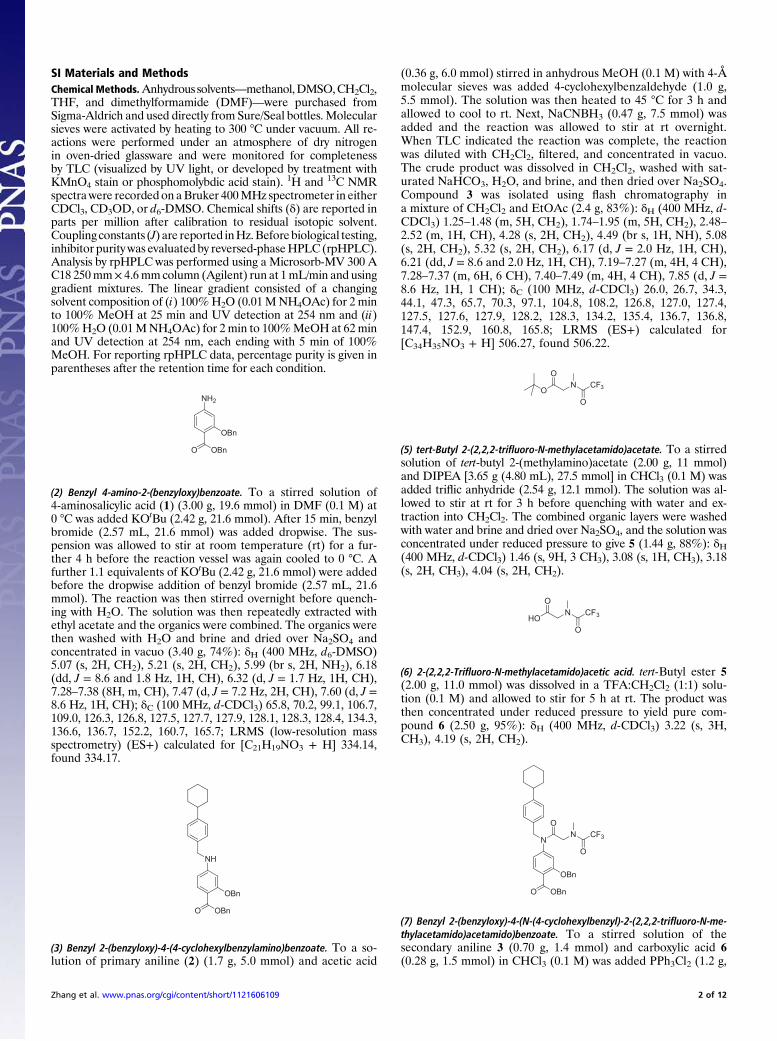
SI Materials and MethodsChemical Methods.Anhydrous solvents—methanol,DMSO,CH2Cl2,THF, and dimethylformamide (DMF)—were purchased fromSigma-Aldrich and used directly from Sure/Seal bottles. Molecularsieves were activated by heating to 300 °C under vacuum. All re-actions were performed under an atmosphere of dry nitrogenin oven-dried glassware and were monitored for completenessby TLC (visualized by UV light, or developed by treatment withKMnO4 stain or phosphomolybdic acid stain). 1H and 13C NMRspectrawere recorded on aBruker 400MHz spectrometer in eitherCDCl3, CD3OD, or d6-DMSO. Chemical shifts (δ) are reported inparts per million after calibration to residual isotopic solvent.Coupling constants (J) are reported inHz.Before biological testing,inhibitor purity was evaluated by reversed-phaseHPLC (rpHPLC).Analysis by rpHPLC was performed using a Microsorb-MV 300 AC18 250mm× 4.6mmcolumn (Agilent) run at 1mL/min and usinggradient mixtures. The linear gradient consisted of a changingsolvent composition of (i) 100%H2O (0.01MNH4OAc) for 2 minto 100% MeOH at 25 min and UV detection at 254 nm and (ii)100%H2O (0.01MNH4OAc) for 2 min to 100%MeOH at 62minand UV detection at 254 nm, each ending with 5 min of 100%MeOH. For reporting rpHPLC data, percentage purity is given inparentheses after the retention time for each condition.
NH2
O OBn
OBn
(2) Benzyl 4-amino-2-(benzyloxy)benzoate. To a stirred solution of4-aminosalicylic acid (1) (3.00 g, 19.6 mmol) in DMF (0.1 M) at0 °C was added KOtBu (2.42 g, 21.6 mmol). After 15 min, benzylbromide (2.57 mL, 21.6 mmol) was added dropwise. The sus-pension was allowed to stir at room temperature (rt) for a fur-ther 4 h before the reaction vessel was again cooled to 0 °C. Afurther 1.1 equivalents of KOtBu (2.42 g, 21.6 mmol) were addedbefore the dropwise addition of benzyl bromide (2.57 mL, 21.6mmol). The reaction was then stirred overnight before quench-ing with H2O. The solution was then repeatedly extracted withethyl acetate and the organics were combined. The organics werethen washed with H2O and brine and dried over Na2SO4 andconcentrated in vacuo (3.40 g, 74%): δH (400 MHz, d6-DMSO)5.07 (s, 2H, CH2), 5.21 (s, 2H, CH2), 5.99 (br s, 2H, NH2), 6.18(dd, J = 8.6 and 1.8 Hz, 1H, CH), 6.32 (d, J = 1.7 Hz, 1H, CH),7.28–7.38 (8H, m, CH), 7.47 (d, J = 7.2 Hz, 2H, CH), 7.60 (d, J =8.6 Hz, 1H, CH); δC (100 MHz, d-CDCl3) 65.8, 70.2, 99.1, 106.7,109.0, 126.3, 126.8, 127.5, 127.7, 127.9, 128.1, 128.3, 128.4, 134.3,136.6, 136.7, 152.2, 160.7, 165.7; LRMS (low-resolution massspectrometry) (ES+) calculated for [C21H19NO3 + H] 334.14,found 334.17.
NH
OBnO
OBn
(3) Benzyl 2-(benzyloxy)-4-(4-cyclohexylbenzylamino)benzoate. To a so-lution of primary aniline (2) (1.7 g, 5.0 mmol) and acetic acid
(0.36 g, 6.0 mmol) stirred in anhydrous MeOH (0.1 M) with 4-Åmolecular sieves was added 4-cyclohexylbenzaldehyde (1.0 g,5.5 mmol). The solution was then heated to 45 °C for 3 h andallowed to cool to rt. Next, NaCNBH3 (0.47 g, 7.5 mmol) wasadded and the reaction was allowed to stir at rt overnight.When TLC indicated the reaction was complete, the reactionwas diluted with CH2Cl2, filtered, and concentrated in vacuo.The crude product was dissolved in CH2Cl2, washed with sat-urated NaHCO3, H2O, and brine, and then dried over Na2SO4.Compound 3 was isolated using flash chromatography ina mixture of CH2Cl2 and EtOAc (2.4 g, 83%): δH (400 MHz, d-CDCl3) 1.25–1.48 (m, 5H, CH2), 1.74–1.95 (m, 5H, CH2), 2.48–2.52 (m, 1H, CH), 4.28 (s, 2H, CH2), 4.49 (br s, 1H, NH), 5.08(s, 2H, CH2), 5.32 (s, 2H, CH2), 6.17 (d, J = 2.0 Hz, 1H, CH),6.21 (dd, J = 8.6 and 2.0 Hz, 1H, CH), 7.19–7.27 (m, 4H, 4 CH),7.28–7.37 (m, 6H, 6 CH), 7.40–7.49 (m, 4H, 4 CH), 7.85 (d, J =8.6 Hz, 1H, 1 CH); δC (100 MHz, d-CDCl3) 26.0, 26.7, 34.3,44.1, 47.3, 65.7, 70.3, 97.1, 104.8, 108.2, 126.8, 127.0, 127.4,127.5, 127.6, 127.9, 128.2, 128.3, 134.2, 135.4, 136.7, 136.8,147.4, 152.9, 160.8, 165.8; LRMS (ES+) calculated for[C34H35NO3 + H] 506.27, found 506.22.
O
OO
N CF3
(5) tert-Butyl 2-(2,2,2-trifluoro-N-methylacetamido)acetate. To a stirredsolution of tert-butyl 2-(methylamino)acetate (2.00 g, 11 mmol)and DIPEA [3.65 g (4.80 mL), 27.5 mmol] in CHCl3 (0.1 M) wasadded triflic anhydride (2.54 g, 12.1 mmol). The solution was al-lowed to stir at rt for 3 h before quenching with water and ex-traction into CH2Cl2. The combined organic layers were washedwith water and brine and dried over Na2SO4, and the solution wasconcentrated under reduced pressure to give 5 (1.44 g, 88%): δH(400 MHz, d-CDCl3) 1.46 (s, 9H, 3 CH3), 3.08 (s, 1H, CH3), 3.18(s, 2H, CH3), 4.04 (s, 2H, CH2).
O
OHO
N CF3
(6) 2-(2,2,2-Trifluoro-N-methylacetamido)acetic acid. tert-Butyl ester 5(2.00 g, 11.0 mmol) was dissolved in a TFA:CH2Cl2 (1:1) solu-tion (0.1 M) and allowed to stir for 5 h at rt. The product wasthen concentrated under reduced pressure to yield pure com-pound 6 (2.50 g, 95%): δH (400 MHz, d-CDCl3) 3.22 (s, 3H,CH3), 4.19 (s, 2H, CH2).
OBn
OBnO
N
ON CF3
O
(7) Benzyl 2-(benzyloxy)-4-(N-(4-cyclohexylbenzyl)-2-(2,2,2-trifluoro-N-me-thylacetamido)acetamido)benzoate. To a stirred solution of thesecondary aniline 3 (0.70 g, 1.4 mmol) and carboxylic acid 6(0.28 g, 1.5 mmol) in CHCl3 (0.1 M) was added PPh3Cl2 (1.2 g,
Zhang et al. www.pnas.org/cgi/content/short/1121606109 2 of 12
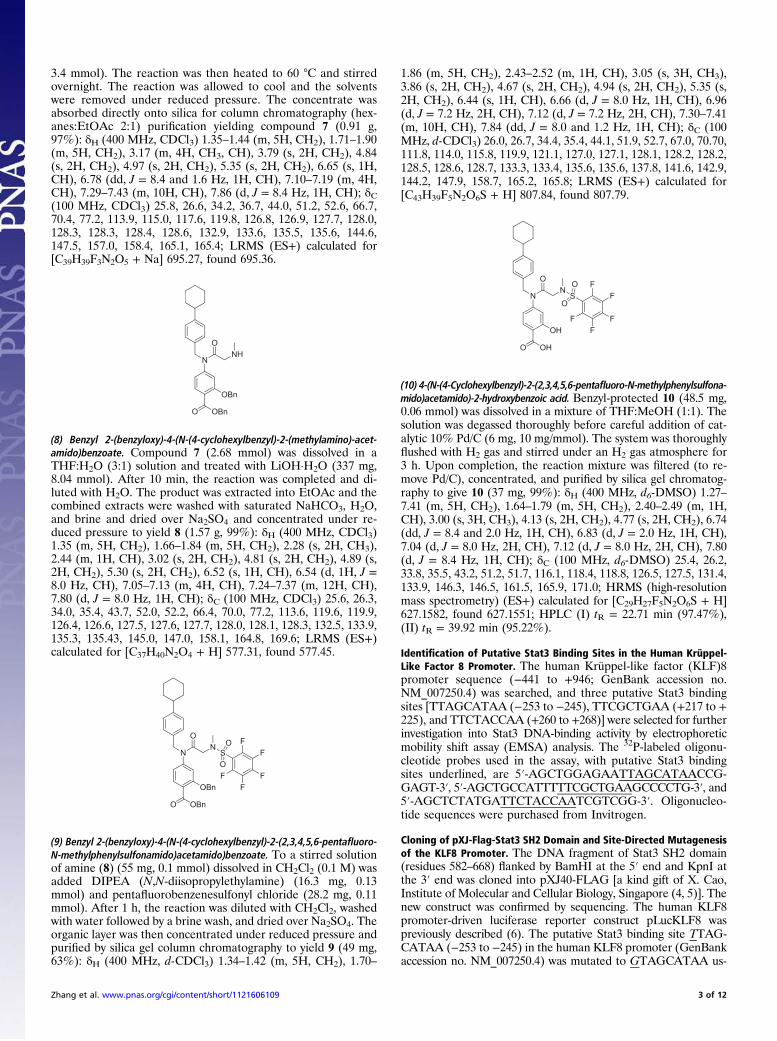
3.4 mmol). The reaction was then heated to 60 °C and stirredovernight. The reaction was allowed to cool and the solventswere removed under reduced pressure. The concentrate wasabsorbed directly onto silica for column chromatography (hex-anes:EtOAc 2:1) purification yielding compound 7 (0.91 g,97%): δH (400 MHz, CDCl3) 1.35–1.44 (m, 5H, CH2), 1.71–1.90(m, 5H, CH2), 3.17 (m, 4H, CH3, CH), 3.79 (s, 2H, CH2), 4.84(s, 2H, CH2), 4.97 (s, 2H, CH2), 5.35 (s, 2H, CH2), 6.65 (s, 1H,CH), 6.78 (dd, J = 8.4 and 1.6 Hz, 1H, CH), 7.10–7.19 (m, 4H,CH), 7.29–7.43 (m, 10H, CH), 7.86 (d, J = 8.4 Hz, 1H, CH); δC(100 MHz, CDCl3) 25.8, 26.6, 34.2, 36.7, 44.0, 51.2, 52.6, 66.7,70.4, 77.2, 113.9, 115.0, 117.6, 119.8, 126.8, 126.9, 127.7, 128.0,128.3, 128.3, 128.4, 128.6, 132.9, 133.6, 135.5, 135.6, 144.6,147.5, 157.0, 158.4, 165.1, 165.4; LRMS (ES+) calculated for[C39H39F3N2O5 + Na] 695.27, found 695.36.
O
O
OBn
OBn
NNH
(8) Benzyl 2-(benzyloxy)-4-(N-(4-cyclohexylbenzyl)-2-(methylamino)-acet-amido)benzoate. Compound 7 (2.68 mmol) was dissolved in aTHF:H2O (3:1) solution and treated with LiOH·H2O (337 mg,8.04 mmol). After 10 min, the reaction was completed and di-luted with H2O. The product was extracted into EtOAc and thecombined extracts were washed with saturated NaHCO3, H2O,and brine and dried over Na2SO4 and concentrated under re-duced pressure to yield 8 (1.57 g, 99%): δH (400 MHz, CDCl3)1.35 (m, 5H, CH2), 1.66–1.84 (m, 5H, CH2), 2.28 (s, 2H, CH3),2.44 (m, 1H, CH), 3.02 (s, 2H, CH2), 4.81 (s, 2H, CH2), 4.89 (s,2H, CH2), 5.30 (s, 2H, CH2), 6.52 (s, 1H, CH), 6.54 (d, 1H, J =8.0 Hz, CH), 7.05–7.13 (m, 4H, CH), 7.24–7.37 (m, 12H, CH),7.80 (d, J = 8.0 Hz, 1H, CH); δC (100 MHz, CDCl3) 25.6, 26.3,34.0, 35.4, 43.7, 52.0, 52.2, 66.4, 70.0, 77.2, 113.6, 119.6, 119.9,126.4, 126.6, 127.5, 127.6, 127.7, 128.0, 128.1, 128.3, 132.5, 133.9,135.3, 135.43, 145.0, 147.0, 158.1, 164.8, 169.6; LRMS (ES+)calculated for [C37H40N2O4 + H] 577.31, found 577.45.
OBn
OBnO
N
ONSO
O FF
FF
F
(9) Benzyl 2-(benzyloxy)-4-(N-(4-cyclohexylbenzyl)-2-(2,3,4,5,6-pentafluoro-N-methylphenylsulfonamido)acetamido)benzoate. To a stirred solutionof amine (8) (55 mg, 0.1 mmol) dissolved in CH2Cl2 (0.1 M) wasadded DIPEA (N,N-diisopropylethylamine) (16.3 mg, 0.13mmol) and pentafluorobenzenesulfonyl chloride (28.2 mg, 0.11mmol). After 1 h, the reaction was diluted with CH2Cl2, washedwith water followed by a brine wash, and dried over Na2SO4. Theorganic layer was then concentrated under reduced pressure andpurified by silica gel column chromatography to yield 9 (49 mg,63%): δH (400 MHz, d-CDCl3) 1.34–1.42 (m, 5H, CH2), 1.70–
1.86 (m, 5H, CH2), 2.43–2.52 (m, 1H, CH), 3.05 (s, 3H, CH3),3.86 (s, 2H, CH2), 4.67 (s, 2H, CH2), 4.94 (s, 2H, CH2), 5.35 (s,2H, CH2), 6.44 (s, 1H, CH), 6.66 (d, J = 8.0 Hz, 1H, CH), 6.96(d, J = 7.2 Hz, 2H, CH), 7.12 (d, J = 7.2 Hz, 2H, CH), 7.30–7.41(m, 10H, CH), 7.84 (dd, J = 8.0 and 1.2 Hz, 1H, CH); δC (100MHz, d-CDCl3) 26.0, 26.7, 34.4, 35.4, 44.1, 51.9, 52.7, 67.0, 70.70,111.8, 114.0, 115.8, 119.9, 121.1, 127.0, 127.1, 128.1, 128.2, 128.2,128.5, 128.6, 128.7, 133.3, 133.4, 135.6, 135.6, 137.8, 141.6, 142.9,144.2, 147.9, 158.7, 165.2, 165.8; LRMS (ES+) calculated for[C43H39F5N2O6S + H] 807.84, found 807.79.
N
ONS
O
O
O OH
OHF
FF
FF
(10) 4-(N-(4-Cyclohexylbenzyl)-2-(2,3,4,5,6-pentafluoro-N-methylphenylsulfona-mido)acetamido)-2-hydroxybenzoic acid. Benzyl-protected 10 (48.5 mg,0.06 mmol) was dissolved in a mixture of THF:MeOH (1:1). Thesolution was degassed thoroughly before careful addition of cat-alytic 10% Pd/C (6 mg, 10 mg/mmol). The system was thoroughlyflushed with H2 gas and stirred under an H2 gas atmosphere for3 h. Upon completion, the reaction mixture was filtered (to re-move Pd/C), concentrated, and purified by silica gel chromatog-raphy to give 10 (37 mg, 99%): δH (400 MHz, d6-DMSO) 1.27–7.41 (m, 5H, CH2), 1.64–1.79 (m, 5H, CH2), 2.40–2.49 (m, 1H,CH), 3.00 (s, 3H, CH3), 4.13 (s, 2H, CH2), 4.77 (s, 2H, CH2), 6.74(dd, J = 8.4 and 2.0 Hz, 1H, CH), 6.83 (d, J = 2.0 Hz, 1H, CH),7.04 (d, J = 8.0 Hz, 2H, CH), 7.12 (d, J = 8.0 Hz, 2H, CH), 7.80(d, J = 8.4 Hz, 1H, CH); δC (100 MHz, d6-DMSO) 25.4, 26.2,33.8, 35.5, 43.2, 51.2, 51.7, 116.1, 118.4, 118.8, 126.5, 127.5, 131.4,133.9, 146.3, 146.5, 161.5, 165.9, 171.0; HRMS (high-resolutionmass spectrometry) (ES+) calculated for [C29H27F5N2O6S + H]627.1582, found 627.1551; HPLC (I) tR = 22.71 min (97.47%),(II) tR = 39.92 min (95.22%).
Identification of Putative Stat3 Binding Sites in the Human Krüppel-Like Factor 8 Promoter. The human Krüppel-like factor (KLF)8promoter sequence (−441 to +946; GenBank accession no.NM_007250.4) was searched, and three putative Stat3 bindingsites [TTAGCATAA (−253 to −245), TTCGCTGAA (+217 to +225), and TTCTACCAA (+260 to +268)] were selected for furtherinvestigation into Stat3 DNA-binding activity by electrophoreticmobility shift assay (EMSA) analysis. The 32P-labeled oligonu-cleotide probes used in the assay, with putative Stat3 bindingsites underlined, are 5′-AGCTGGAGAATTAGCATAACCG-GAGT-3′, 5′-AGCTGCCATTTTTCGCTGAAGCCCCTG-3′, and5′-AGCTCTATGATTCTACCAATCGTCGG-3′. Oligonucleo-tide sequences were purchased from Invitrogen.
Cloning of pXJ-Flag-Stat3 SH2 Domain and Site-Directed Mutagenesisof the KLF8 Promoter. The DNA fragment of Stat3 SH2 domain(residues 582–668) flanked by BamHI at the 5′ end and KpnI atthe 3′ end was cloned into pXJ40-FLAG [a kind gift of X. Cao,Institute of Molecular and Cellular Biology, Singapore (4, 5)]. Thenew construct was confirmed by sequencing. The human KLF8promoter-driven luciferase reporter construct pLucKLF8 waspreviously described (6). The putative Stat3 binding site TTAG-CATAA (−253 to −245) in the human KLF8 promoter (GenBankaccession no. NM_007250.4) was mutated to GTAGCATAA us-
Zhang et al. www.pnas.org/cgi/content/short/1121606109 3 of 12
ing Stratagene’s QuikChange Lightning Site-Directed Mutagene-sis Kit (Agilent Technologies) and following the manufacturer’sinstructions to generate pLucKLF8/−253T/G.
Nuclear Extract Preparation, EMSA, and Densitometric Analysis. Nu-clear extract preparations and EMSA analysis were carried out aspreviously described (1, 7–9). The 32P-labeled oligonucleotideprobes used were hSIE (high-affinity sis-inducible element fromthe c-fos gene, m67 variant, 5′-AGCTTCATTTCCCGTAAAT-CCCTA-3′) that binds Stat1 and Stat3 (8, 10) and the mammarygland factor element from the bovine β-casein gene promoter(sense strand, 5′-AGATTTCTAGFAATTCAA-3′) that bindsStat5 (11, 12). For the direct effect of BP-1-102 on STAT DNA-binding activity, nuclear extracts containing activated STATsprepared from NIH 3T3/v-Src or EGF-stimulated NIH 3T3/hEGFR cells were preincubated with the agent for 30 min atroom temperature before incubation with the radiolabeled probefor 30 min at 30 °C before subjection to EMSA analysis. Whereappropriate, supershift analysis was performed in which nuclearextracts were preincubated with the anti-Stat3 antibody directedagainst Stat3 N-terminal amino acid residues 5–240 (F-2) (SantaCruz Biotechnology) before incubation with the radiolabeledprobe. Bands corresponding to DNA-binding activities for eachconcentration of BP-1-102 were scanned and quantified usingImageQuant (GE Healthcare) and plotted as a percentage ofcontrol (vehicle) against concentration of BP-1-102; IC50 valueswere derived from these plots, as previously reported (13, 14).
Transient Transfection of Cells, Treatment with BP-1-102, and in VitroStudies. Transient transfection and luciferase assays were per-formed as previously reported (9, 15, 16). Transfection was per-formed 18 h following seeding for 3 h using Lipofectamine Plus(Invitrogen) and following the manufacturer’s protocol. For lucif-erase studies, cells in 12-well plates were transiently cotransfectedwith the appropriate plasmids, 100 ng β-galactosidase (internalcontrol vector for normalizing), 900 ng pLucTKS3, pLucSRE,pLucKLF8, or pLucKLF8/−253T/G, and with or without 300 ngpMv-Src. Where appropriate, cells in 96-well plates were trans-fected with Stat3C (0.2 μg) or in 6-well plates were transfectedwith 4 μg Stat3C, Stat3 SH2 domain, or pcDNA3 (mock). Twelvehours after transfection, cells were treated or untreated with BP-1-102 (0–30 μM) for 16–48 h and harvested. Subsequently, cyto-solic extracts were prepared for luciferase assay or nuclear ex-tracts were prepared for EMSA analysis, as previously reported(9, 15), whole-cell lysates were prepared for immunoblottinganalysis, or the cells were processed for CyQUANT cell pro-liferation or Annexin V/flow cytometry analysis.The Stat3 siRNA smart pool Stat3 (M-003544) and the control,
SiGENOME nontargeting siRNA pool (Dharmacon RNAiTechnologies, Thermo Scientific), were transiently transfectedinto cells using Lipofectamine RNAiMAX (Invitrogen) in serum-free Opti-MEM culture medium (5mL) (Invitrogen) according tothe manufacturer’s instructions and using 200 pmol siRNA with10 μL of Lipofectamine.
Immunoprecipitation and Western Blotting Analyses. Whole-celllysates or tumor tissue lysates from pulverized tumor tissue wereprepared in boiling SDS sample loading buffer to extract totalproteins, as reported previously (9, 17, 18). Lysates of equal totalprotein were electrophoresed on an SDS/7.5% (g/vol) poly-acrylamide gel and transferred to a nitrocellulose membrane.Nitrocellulose membranes were probed with primary antibodies,and the detection of horseradish peroxidase-conjugated secondaryantibodies by enhanced chemiluminescence (Amersham) wasperformed. Immunoprecipitation studies were performed aspreviously reported (7) using whole-cell lysates or nuclear extracts(250 μg total protein) and 2 μg of anti-Stat3, anti–NF-κB/p65RelA, or anti-IκB polyclonal antibody (Santa Cruz Bio-
technology) or 5 μL of monoclonal anti-Stat3 antibody (CellSignaling Technology).
CyQUANT Cell Proliferation, Viability, Colony Survival, and Wound-Healing Assays. These studies were performed as previouslyreported (1, 16). Briefly, proliferating cells in 6- or 96-well plateswere treated once with 0–30 μM BP-1-102 for 24 h or with 10 μMBP-1-102 for up to 96 h. Viable cells were counted by trypan blueexclusion/phase-contrast microscopy or assessed by a CyQUANTCell Proliferation Kit, according to the manufacturer’s (Invitro-gen) instructions. For colony-survival studies, cells were seededas a single-cell culture. On the next day following seeding, cellswere treated once or not with BP-1-102 and allowed to cultureuntil large colonies were visible, which were fixed with methanoland stained with crystal violet (Thermo Fisher Scientific) for 2 h.The number of colonies was counted or photomicrographs weretaken under a phase-contrast microscope. For wound-healing as-says, subconfluent cultures of cells in 6-well plates were woundedusing pipette tips and treated with or without BP-1-102 and allowedto migrate into the denuded area over a 16-h period. Themigrationof cells was visualized at a 10×magnification using an Axiovert 200inverted fluorescence microscope (Zeiss), with pictures taken usinga mounted Canon Powershot A640 digital camera. Cells that mi-grated into the denuded area were quantified.
Immunostaining with Laser-Scanning Confocal Imaging. Studies wereperformed as previously reported (19). Briefly, cells were grownon glass coverslips in multiwell plates, fixed with ice-cold meth-anol for 15 min, washed three times with 1× PBS, permeabilizedwith 0.2% Triton X-100 for 10 min, and further washed three orfour times with PBS. Specimens were then blocked in 1% BSAfor 30 min and incubated with anti-pY705Stat3 (Cell Signaling)or anti–pS536NF-κB/p65 (Cell Signaling) antibody at 1:50 di-lution (in 0.1% BSA) at 4 °C overnight. Subsequently, cells wererinsed three times with PBS and incubated with two Alexa Fluorsecondary antibodies, Alexa Fluor 546 (goat anti-mouse) andAlexa Fluor 488 (donkey anti-rabbit) (Molecular Probes, In-vitrogen) for pY705Stat3 and pS536NF-κB/p65 detection, re-spectively, for 1 h at room temperature in the dark. Specimenswere then washed three times with PBS, mounted on slides withVECTASHIELD mounting medium containing DAPI (VectorLabs), and examined immediately under a Leica TCS SP5 con-focal microscope. Images were captured and processed usingLeica TCS SP 5 software.
KLF8 Knockdown and Overexpression and Cell Migration/InvasionAssays. Cell migration/invasion experiments were carried outand quantified as previously reported (7, 8, 20) using BioCoatmigration/invasion chambers (BD Biosciences) of 24-well com-panion plates with cell-culture inserts containing 8-μm pore sizefilters and following the manufacturer’s protocol, with somemodifications. Briefly, for doxycycline (Dox) induction, cells weremaintained uninduced (U; in the absence of Dox) or induced (I;in the presence of Dox) for 3 d. Cells were then resuspended inserum-free medium with or without Dox, transferred to the topchambers of the 24-well transwell plates, and incubated for 16 h toallow the migration or invasion toward the serum-containingmedium in the bottom chamber, and cells on the lower side werethen counted. BP-1-102 (0–10 μM) was added to both the top andbottom chambers during the 16-h incubation. Where appropriate,the migration or invasion rates were normalized to the control, Ucells in the absence of serum and in the bottom chambers.For KLF8 overexpression, lentiviral particles were prepared
and packaged following a published procedure (21) by trans-fecting cultures of HEK293FT cells with tetracycline-inducibleKLF8 expression vector, pLVUT-tTR-KRAB-KLF8 (12 μg), andpsPAX2 (8 μg) and pMD2G (4 μg) packaging system (Addgene)and following the manufacturer’s instructions. For transient in-
Zhang et al. www.pnas.org/cgi/content/short/1121606109 4 of 12
fection, the viral particle-containing HEK293FT cell-culturemedium was added to MDA-MB-231 cells in culture and in-cubated for 48 h at 37 °C. Five nanograms per mL tetracyclinewas added to the culture and further incubated for 24 h. Infectedcells were used in a BioCoat invasion chamber assay, as pre-viously published (7, 8, 22), in the presence or absence of dif-ferent concentrations of BP-1-102.
Cytokine Assay. Cytokine analysis was performed using a HumanCytokine Array Kit and following the manufacturer’s (R&DSystems) instructions. Briefly, following treatment of cells with10 μM BP-1-102 for 48 h, 1-mL samples of conditioned culturemedium or, in the case of tumors, 500 μg of tumor tissue lysatesin RIPA buffer (50 mM Tris·HCl, pH 7.4, 1% (vol/vol) NonidetP-40, 150 mM NaCl, 2 mM EDTA, 0.1% SDS), were mixedwith a mixture of biotinylated detection antibodies. The mixturewas incubated with the array membrane for antibody binding onthe membrane. The membrane was processed for signal de-velopment using streptavidin-HRP and chemiluminescent de-tection reagents and exposed to X-ray films, which were thenprocessed. The relative changes in cytokine levels betweensamples were analyzed by quantitation of pixel density in eachspot of the array with ImageJ (National Institutes of Health).
Fluorescence Polarization Assay. This was conducted as previouslyreported (1, 16). Full-length Stat3 and its peptide probe, the in-terleukin (IL)-6R/gp130 peptide, have been previously reported(1, 16). Stat1 and Stat5 were purchased from SignalChem. Thepeptides, GpYDKPHVL-NH2 and GpYLVLDKW-NH2, usedfor Stat1 and Stat5 fluorescence polarization (FP), respectively,were purchased from CanPeptide.
NMR and Isothermal Titration Calorimetry Studies for Effect of BP-1-102 on IL-6R/gp103 pTyr Peptide Binding to Stat3 SH2 Domain. The1D 1H Carr-Purcell-Meibom-Gill (CPMG) R2 relaxation filterexperiment was conducted at 298K on a Bruker 600-MHzmagnet equipped with a cryoprobe (23). Fifty micromolar gp130phospho-tyrosine peptide (pY904, Ac-pY-LPQTV-NH2) wasdissolved in 20 mM sodium phosphate (pH 3.2), 0.2% DMSO-d6, and 90% (vol/vol) D2O. Binding of pY904 to monomericStat3 (encompassing residues 127–711) was monitored by theattenuation of the peptide signals in the CPMG experiment withaddition of 2 μM Stat3. The CPMG pulse train used a 3-ms in-terpulse delay and a total R2 relaxation time of 72 ms, whichcompletely attenuated the Stat3 signal. For the inhibitor in-terference reaction at the SH2 binding site, 100 μM BP-1-102was added to the Stat3–pY904 complex. Under these sampleconditions, the apparent concentration of soluble and mono-meric BP-1-102 was at least 10 μM as judged by a 1D 1H NMRsolubility test of 200 μM BP-1-102 at varying concentrations ofDMSO-d6 (0.2–40% vol/vol).For the isothermal titration calorimetry (ITC) experiments,
the same buffer conditions used in the NMR experiment weremaintained for 150 μM titrant (pY904 or BP-1-102) and 10 μMSTAT3 in the sample cell of a Microcal VP-ITC calorimeter.Titration of Stat3 ligand-precomplexed samples used equimolaramounts of pY904 or BP-1-102 in the sample cell. Titrant solu-tion (290 μL) was injected at 10-μL increments into a sample cellcontaining 1.4 mL Stat3 at 298K. The heat flow of the titrationreactions was measured at each addition of a pY904 or BP-1-102aliquot to free or ligand-complexed Stat3. Origin software (Mi-crocal) was used to generate the final ITC figures (Fig. S1 D andE). The area under each titration peak in Fig. S1 D and E (Upper)was integrated (Lower) and plotted against the correspondingligand:Stat3 molar ratio. The y intercept of the lower panel plotsrepresents the directly measured enthalpy change (ΔH).
Phospho-Kinase Profiling. Phospho-kinase profiling assay was per-formed using a Human Phospho-Kinase Array Kit according tothe manufacturer’s instructions (R&D Systems). Briefly, DMSOor BP-1-102–treated cells were washed twice with ice-cold PBS,and whole-cell lysates were prepared using the lysis buffer pro-vided in the kit. Array membranes were blocked with array buffer1 and incubated overnight at 4 °C with 400 μg of cell lysate di-luted with array buffer 1. The membranes were washed with washbuffer, incubated with the detection antibodies (provided in thekit), and subjected to detection using streptavidin-HRP, accord-ing to the instructions. After washing, the membranes were de-veloped with Pierce chemiluminescence reagents (Thermo FisherScientific). The developed images were analyzed based on thepixel density of each spot of the array by scanning and quanti-fying, and expressed as the fold change compared with the con-trol group.
Mice and in Vivo Tumor Studies. Six-week-old female athymic nudemice were purchased from Harlan and maintained in institutionalanimal facilities approved by the American Association for Ac-creditation of Laboratory Animal Care. All mice studies wereperformed under an Institutional Animal Care and Use Com-mittee (IACUC)-approved protocol. Athymic nude mice wereinjected s.c. in the left flank area with 1 × 10⁶ human breastcancer MDA-MB-231 or non–small-cell lung cancer A549 cellsin 100 μL PBS. After 5–10 d, tumors of a 30–100 mm3 volumewere established. Animals with established tumors were groupedso that the mean tumor sizes in all groups were nearly identicaland then given BP-1-102 (in 0.05% DMSO in water) at 1 or 3mg/kg (i.v.) every 2 or every 3 d or 3 mg/kg (oral gavage, 100 μL)every day for 15 or 20 d. Animals were monitored every day, andtumor sizes were measured with calipers and body weights weretaken every 2 or 3 d. Tumor volumes were calculated accordingto the formula V = 0.52 × a2 × b, where a is the smallest su-perficial diameter and b is the largest superficial diameter. Foreach treatment group, the tumor volumes for each set of meas-urements were statistically analyzed in comparison with thecontrol (nontreated) group using a paired t test.
Plasma and Tumor Tissue Analysis.BP-1-102 concentrations in mouseplasma and tumor tissue lysates were assayed using a validatedanalytical procedure via HPLCy (Prominence UHPLC; ShimadzuScientific Instruments) and LC/MS/MS (API 4000 linear ion trapmass spectrometer; MDS Sciex). The mass spectrometer was op-erated in a product ion-scanning mode. BP-1-102 solution dilutedin methanol was infused directly into the MS source at a flow rateof 10 μL/min. Tuning was evaluated in both positive and negativeMS modes using both turbo ion spray and atmospheric pressurechemical ionization sources. The chromatography used a Phe-nomenex Kinetex C18 2.1 × 50 mm, 1.7 μ UHPLC column, witha flow rate of 0.300 mL/min using 5 mM ammonium acetate (inwater) and 5 mM ammonium acetate (in acetonitrile) as mobilephases A and B, respectively.
In Vivo Toxicity Studies. Six-week-old female athymic nude micewere purchased from Harlan and maintained in institutionalanimal facilities approved by the American Association for Ac-creditation of Laboratory Animal Care. All mice studies wereperformed under an IACUC-approved protocol. Groups of threeor four healthy mice were administered BP-1-102, i.v. at 1 or 3 mg/kg every 2 or 3 d, as was pursued in the antitumor efficacy studies,for 21 d and monitored for up to 42 d. Body weights weremeasured every 2 or 3 d. Following completion, mice were eu-thanized and surgery was performed to expose the abdominalorgans, which were subsequently removed for visual examinationand imaging by a digital camera.
Zhang et al. www.pnas.org/cgi/content/short/1121606109 5 of 12

1. Zhang X, et al. (2010) A novel small-molecule disrupts Stat3 SH2 domain-phosphotyrosineinteractions and Stat3-dependent tumor processes. Biochem Pharmacol 79:1398–1409.
2. Fletcher S, et al. (2011) Antagonism of the Stat3-Stat3 protein dimer with salicylic acidbased small molecules. ChemMedChem 6:1459–1470.
3. Razgulin AV, Mecozzi S (2006) Binding properties of aromatic carbon-bound fluorine.J Med Chem 49:7902–7906.
4. Ma J, Zhang T, Novotny-Diermayr V, Tan AL, Cao X (2003) A novel sequence in the coiled-coil domain of Stat3 essential for its nuclear translocation. J Biol Chem 278:29252–29260.
5. Zhang T, SeowKT, Ong CT, Cao X (2002) Interdomain interaction of Stat3 regulates its Srchomology 2 domain-mediated receptor binding activity. J Biol Chem 277:17556–17563.
6. WangX,UrvalekAM,Liu J,Zhao J (2008)ActivationofKLF8 transcriptionby focal adhesionkinase in human ovarian epithelial and cancer cells. J Biol Chem 283:13934–13942.
7. Siddiquee KAZ, et al. (2007) An oxazole-based small-molecule Stat3 inhibitormodulates Stat3 stability and processing and induces antitumor cell effects. ACS ChemBiol 2:787–798.
8. Siddiquee K, et al. (2007) Selective chemical probe inhibitor of Stat3, identifiedthrough structure-based virtual screening, induces antitumor activity. Proc Natl AcadSci USA 104:7391–7396.
9. Turkson J, et al. (1998) Stat3 activation by Src induces specific gene regulation and isrequired for cell transformation. Mol Cell Biol 18:2545–2552.
10. Wagner BJ, Hayes TE, Hoban CJ, Cochran BH (1990) The SIF binding element conferssis/PDGF inducibility onto the c-fos promoter. EMBO J 9:4477–4484.
11. Gouilleux F, et al. (1995) Prolactin and interleukin-2 receptors in T lymphocytes signalthrough a MGF-STAT5-like transcription factor. Endocrinology 136:5700–5708.
12. Seidel HM, et al. (1995) Spacing of palindromic half sites as a determinant of selectiveSTAT (signal transducers and activators of transcription) DNA binding and trans-criptional activity. Proc Natl Acad Sci USA 92:3041–3045.
13. Turkson J, et al. (2001) Phosphotyrosyl peptides block Stat3-mediated DNA bindingactivity, gene regulation, and cell transformation. J Biol Chem 276:45443–45455.
14. Turkson J, et al. (2005) A novel platinum compound inhibits constitutive Stat3signaling and induces cell cycle arrest and apoptosis of malignant cells. J Biol Chem280:32979–32988.
15. Turkson J, et al. (1999) Requirement for Ras/Rac1-mediated p38 and c-Jun N-terminalkinase signaling in Stat3 transcriptional activity induced by the Src oncoprotein. MolCell Biol 19:7519–7528.
16. Zhao W, Jaganathan S, Turkson J (2010) A cell-permeable Stat3 SH2 domain mimeticinhibits Stat3 activation and induces antitumor cell effects in vitro. J Biol Chem 285:35855–35865.
17. Turkson J, et al. (2004) Inhibition of constitutive signal transducer and activator oftranscription 3 activation by novel platinum complexes with potent antitumoractivity. Mol Cancer Ther 3:1533–1542.
18. Turkson J, et al. (2004) Novel peptidomimetic inhibitors of signal transducer andactivator of transcription 3 dimerization and biological activity. Mol Cancer Ther 3:261–269.
19. Jaganathan S, et al. (2011) A functional nuclear epidermal growth factor receptor,SRC and Stat3 heteromeric complex in pancreatic cancer cells. PLoS One 6:e19605.
20. Wang X, et al. (2007) Krüppel-like factor 8 induces epithelial to mesenchymaltransition and epithelial cell invasion. Cancer Res 67:7184–7193.
21. Sun N, Lee A, Wu JC (2009) Long term non-invasive imaging of embryonic stem cellsusing reporter genes. Nat Protoc 4:1192–1201.
22. Wang X, et al. (2011) KLF8 promotes human breast cancer cell invasion and metastasisby transcriptional activation of MMP9. Oncogene 30:1901–1911.
23. Dalvit C, et al. (2002) High-throughput NMR-based screening with competitionbinding experiments. J Am Chem Soc 124:7702–7709.
Zhang et al. www.pnas.org/cgi/content/short/1121606109 6 of 12

(a) (b)
3102 8
FP Stat3:GpYLPQTV-NH2
0
1
2
0 200 400 600 800
Res
pons
e un
it x
0.4 μM
4 μM
0
2
4
6
5150 10
% In
hibi
tion
of F
sign
al x
10
BP 1 102 ( M)Time (s) BP-1-102 (μM)
4
hibi
tion
of F
P
igna
l x 1
0
8hi
bitio
n of
FP
ig
nal x
10
(c) )ii()i(
2
6
8
4
10
6
Stat1:GpYDKPHVL-NH2 Stat5:GpYLVLDKW-NH2
(d)0 20 40 60 80 100 120
Time (min)0 20 40 60 80 100 120
Time (min)
0
% In
h si
05010 20BP-1-102 (μM)
40300
2
0 20 60
% In
h si
BP-1-102 (μM)10080
2
40
0
-5
-0.6-0.4
0.0-0.2
0
5
-0.6-0.4
0.0-0.2
μca/
sm
ole
ctan
t
μca/
sol
e ta
nt-15
-10
-5
0 1 2
Time (min)
Molar Ratio (pY904/Stat3)
-15
-10
-5
1.00.0 2.0 3.0
Time (min)(e)
kcal
/mof
inje
c
kcal
/mof
inje
ctpY904
- BP-1-102pY904
+ BP-1-102
Molar Ratio (pY904/Stat3)
0.08
-0.08-0.04
0.040.00
2
0.040.00
0.080.04
0 20 60 80 100 120(e) 0 20 40 60 80 120
μca/
se nt
μca/
s
100 40
0.0 1.0 2.0 3.0
0.0
1.0
-2.0
-1.0
0 1 2 3
0
-2
-1kcal
/mol
eof
inje
ctan
kcal
/mol
e of
inje
ctan
t
BP-1-102- pY904
Molar Ratio (BP-1-102/Stat3)
1
BP-1-102+ pY904
Molar Ratio (BP-1-102/Stat3)
(g)40%
DMSO(f)
1H (ppm)1H (ppm)
8 6 4 2
40%
20%
10%5%2.5%0.2%1.2 1.1 1.0 0.9
Fig. S1. Characterization of Stat3 binding to BP-1-102 compared with the interaction with the tyrosine-phosphorylated IL-6 receptor/glycoprotein (gp)130peptide. (A) Surface plasmon resonance analysis of the binding of increasing concentrations of BP-1-102 to full-length Stat3. (B and C) Fluorescence polari-zation assay of the binding to 10 nM 5-carboxyfluoresceinyl-labeled IL-6R/gp130 peptide (GpYLPQTV-NH2) (B), IFN-γ receptor peptide (GpYDKPHVL-NH2) (C, i),or erythropoietin receptor peptide (GpYLVLDKW-NH2) (C, ii) probe of a fixed amount of purified His-Stat3 (200 nM), Stat1 (120 nM), or Stat5 (105 nM), re-spectively, in the presence of increasing concentrations (0–100 μM) of BP-1-102. Inhibition of FP signal is represented as percent inhibition (of control) vs.concentration of BP-1-102. (D and E) Isothermal titration calorimetry measurements of the binding of (D) pY904 to Stat3 in the absence (Left) and presence(Right) of BP-1-102, or (E) BP-1-102 to Stat3 in the absence (Left) and presence (Right) of pY904. The area under each titration peak (D and E, Upper) is in-tegrated (Lower) and plotted against the corresponding pY904:Stat3 or BP-1-102:pY904 molar ratio. The red line is the fit of the binding isotherm to extractthe thermodynamic parameters using a one-site binding model. (F) Overlay of a section of the 1D 1H R2 CPMG NMR spectra of 50 μM pY904 alone (blacktracing), in the presence of 2 μM Stat3 (red tracing), and together with 100 μM BP-1-102 (blue tracing) at 0.1% DMSO. The CPMG pulse train used a 3-msinterpulse delay and a total R2 relaxation time of 72 ms, which completely attenuated the Stat3 signal. (G) The 1D 1H NMR spectra of 200 μM BP-1-102 atvarious concentrations of DMSO (0.2–40%) showing broadened signal at reduced DMSO. The apparent concentration of monomeric BP-1-102 is reduced to10 μM under completely aqueous conditions. Data are representative of two or three independent determinations.
Zhang et al. www.pnas.org/cgi/content/short/1121606109 7 of 12
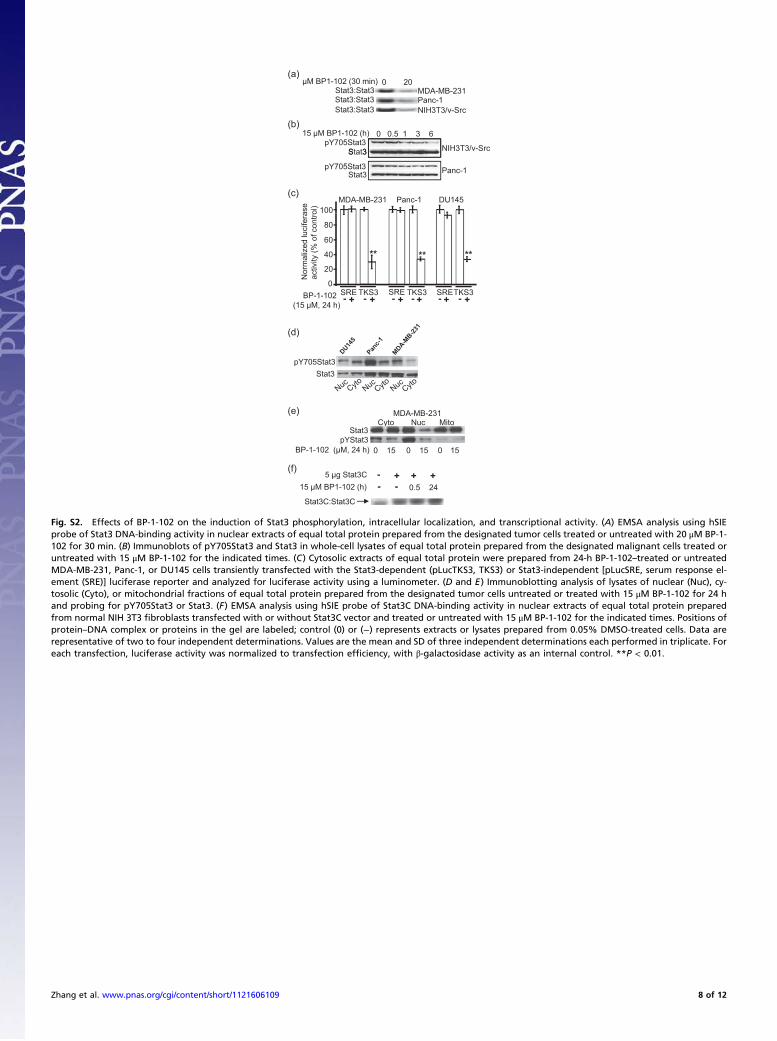
μM BP1-102 (30 min)- -
0 20 (a)
(b)0 0.5 1 3 615 μM BP1-102 (h)
NIH3T3/v-SrcpY705Stat3
Stat3
Stat3:Stat3Stat3:Stat3 Stat3:Stat3
MDA MB 231Panc-1NIH3T3/v-Src
100MDA-MB-231 Panc-1 DU145
se
l)
(c)
pY705Stat3 Stat3 Panc-1
S 3
20
40
60
80
Nor
mal
ized
luci
fera
activ
ity (%
of c
ontro
** ** **
0
-BP-1-102 (15 μM, 24 h) + - + - + - + - + - +
SRE TKS3 SRE TKS3 SRETKS3
(d)
Stat3pY705Stat3
(e)NucCyto
MDA-MB-231Mito
0 15 0 1515 0
Stat3pYStat3
BP-1-102 (μM, 24 h)
5 μg Stat3C-- 240.5+- ++
15 μM BP1-102 (h)
(f)
Stat3C:Stat3C
Fig. S2. Effects of BP-1-102 on the induction of Stat3 phosphorylation, intracellular localization, and transcriptional activity. (A) EMSA analysis using hSIEprobe of Stat3 DNA-binding activity in nuclear extracts of equal total protein prepared from the designated tumor cells treated or untreated with 20 μM BP-1-102 for 30 min. (B) Immunoblots of pY705Stat3 and Stat3 in whole-cell lysates of equal total protein prepared from the designated malignant cells treated oruntreated with 15 μM BP-1-102 for the indicated times. (C) Cytosolic extracts of equal total protein were prepared from 24-h BP-1-102–treated or untreatedMDA-MB-231, Panc-1, or DU145 cells transiently transfected with the Stat3-dependent (pLucTKS3, TKS3) or Stat3-independent [pLucSRE, serum response el-ement (SRE)] luciferase reporter and analyzed for luciferase activity using a luminometer. (D and E) Immunoblotting analysis of lysates of nuclear (Nuc), cy-tosolic (Cyto), or mitochondrial fractions of equal total protein prepared from the designated tumor cells untreated or treated with 15 μM BP-1-102 for 24 hand probing for pY705Stat3 or Stat3. (F) EMSA analysis using hSIE probe of Stat3C DNA-binding activity in nuclear extracts of equal total protein preparedfrom normal NIH 3T3 fibroblasts transfected with or without Stat3C vector and treated or untreated with 15 μM BP-1-102 for the indicated times. Positions ofprotein–DNA complex or proteins in the gel are labeled; control (0) or (−) represents extracts or lysates prepared from 0.05% DMSO-treated cells. Data arerepresentative of two to four independent determinations. Values are the mean and SD of three independent determinations each performed in triplicate. Foreach transfection, luciferase activity was normalized to transfection efficiency, with β-galactosidase activity as an internal control. **P < 0.01.
Zhang et al. www.pnas.org/cgi/content/short/1121606109 8 of 12
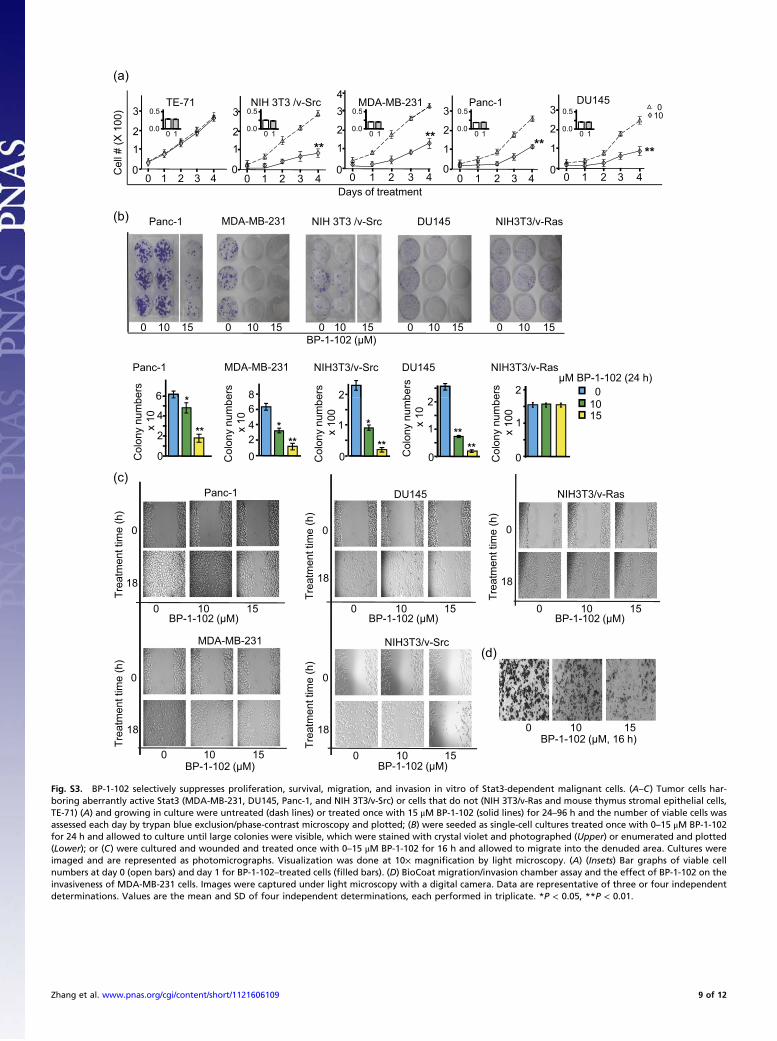
0
DU145Panc-1
0
ent t
ime
(h)
ent t
ime
(h)
NIH3T3/v-Ras
0
ent t
ime
(h)
MDA-MB-231 NIH3T3/v-Src
18 18
Trea
tme
Trea
tme
18
150 10
Trea
tme
15 51010 0 10 BP-1-102 (μM)BP-1-102 (μM)BP-1-102 (μM)
00
8181
150 10 150 10
Trea
tmen
t tim
e (h
)
Trea
tmen
t tim
e (h
)
0 10 15BP-1-102 (μM, 16 h)
15BP-1-102 (μM)
0 10 15BP-1-102 (μM)
0 10
TE-71 NIH 3T3 /v-Src MDA-MB-231 Panc-1 DU145
(a)
3 3
43 3 3 00 5 0 5 0 5 0 5 0 5
0 1 2 3 4 0 1 2 3 4 0 1 2 3 4 0 1 2 3 4 0 1 2 3 40
1
2
3
0
12
3C
ell #
(X 1
00)
Days of treatment
0
1
2
3
0
1
2
3
0
1
2
3
********
010
0.0
0.5
0.0
0.5
0.0
0.5
0.0
0.5
0.0
0.5
1010101010
DU145NIH 3T3 /v-SrcPanc-1 NIH3T3/v-RasMDA-MB-231(b)
(c)
(d)
BP-1-102 (μM)15 51010 0 10 150 10
DU145NIH3T3/v-SrcPanc-1
ers
6 bers
ers
2 0 ers 2
NIH3T3/v-Ras
* ers
8
MDA-MB-231μM BP-1-102 (24 h)
150 10 150 10
Col
ony
num
bex
10
0
2
4
6C
olon
y nu
mb
x 10
0
1
2
Col
ony
num
b ex
100
0
1
21015
Col
ony
num
bex
100
0
1
*
***
******
Col
ony
num
bex
10
0
4
8
***
6
2
Fig. S3. BP-1-102 selectively suppresses proliferation, survival, migration, and invasion in vitro of Stat3-dependent malignant cells. (A–C) Tumor cells har-boring aberrantly active Stat3 (MDA-MB-231, DU145, Panc-1, and NIH 3T3/v-Src) or cells that do not (NIH 3T3/v-Ras and mouse thymus stromal epithelial cells,TE-71) (A) and growing in culture were untreated (dash lines) or treated once with 15 μM BP-1-102 (solid lines) for 24–96 h and the number of viable cells wasassessed each day by trypan blue exclusion/phase-contrast microscopy and plotted; (B) were seeded as single-cell cultures treated once with 0–15 μM BP-1-102for 24 h and allowed to culture until large colonies were visible, which were stained with crystal violet and photographed (Upper) or enumerated and plotted(Lower); or (C) were cultured and wounded and treated once with 0–15 μM BP-1-102 for 16 h and allowed to migrate into the denuded area. Cultures wereimaged and are represented as photomicrographs. Visualization was done at 10× magnification by light microscopy. (A) (Insets) Bar graphs of viable cellnumbers at day 0 (open bars) and day 1 for BP-1-102–treated cells (filled bars). (D) BioCoat migration/invasion chamber assay and the effect of BP-1-102 on theinvasiveness of MDA-MB-231 cells. Images were captured under light microscopy with a digital camera. Data are representative of three or four independentdeterminations. Values are the mean and SD of four independent determinations, each performed in triplicate. *P < 0.05, **P < 0.01.
Zhang et al. www.pnas.org/cgi/content/short/1121606109 9 of 12
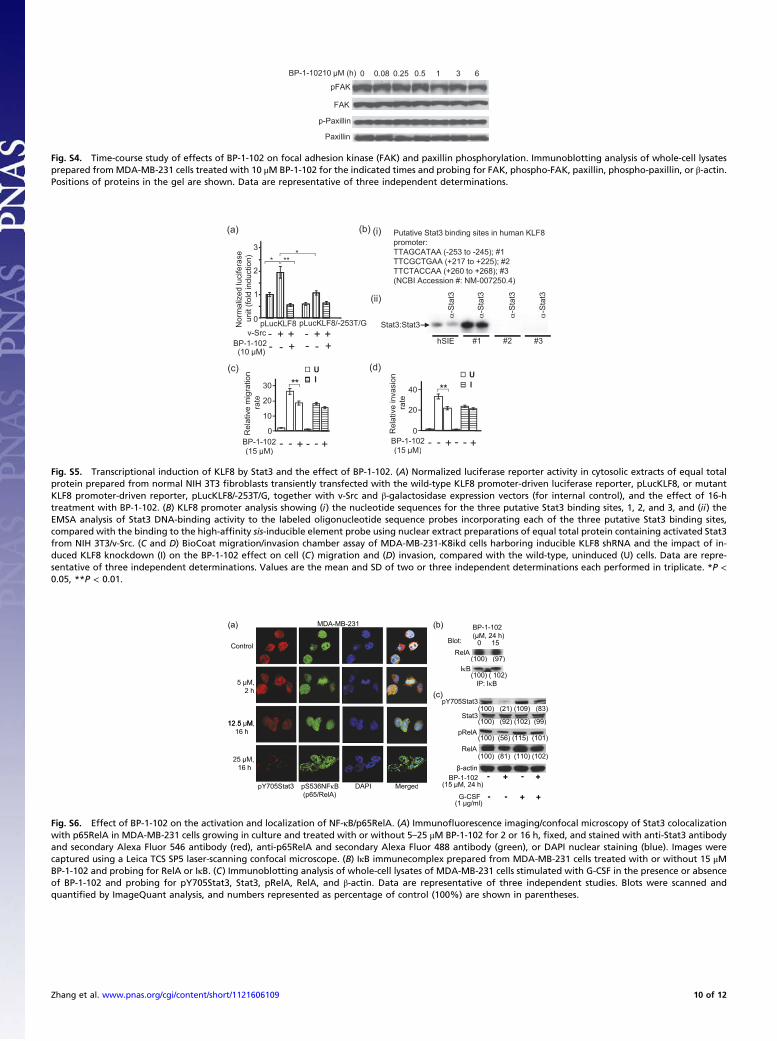
FAK
pFAK
0 0.08 3 60.5 1BP-1-10210 μM (h) 0.25
p-Paxillin
Paxillin
Fig. S4. Time-course study of effects of BP-1-102 on focal adhesion kinase (FAK) and paxillin phosphorylation. Immunoblotting analysis of whole-cell lysatesprepared fromMDA-MB-231 cells treated with 10 μM BP-1-102 for the indicated times and probing for FAK, phospho-FAK, paxillin, phospho-paxillin, or β-actin.Positions of proteins in the gel are shown. Data are representative of three independent determinations.
(a) (b) Putative Stat3 binding sites in human KLF8 promoter:
(i)3
mal
ized
luci
fera
se
it (fo
ld in
duct
ion) ***
1
2
*promoter: TTAGCATAA (-253 to -245); #1TTCGCTGAA (+217 to +225); #2TTCTACCAA (+260 to +268); #3(NCBI Accession #: NM-007250.4)
(ii)
on
UI
(c)
n U(d)
(10 μM)
0 pLucKLF8++-v-Src
Nor
mun
BP-1-102 +--
pLucKLF8/-253T/G++-+--
Stat3:Stat3
hSIE #1 #2 #3
**
0
30
10
20
Rel
ativ
e m
igra
ti ora
te
--BP-1-102(15 μM)
+-+ -
I
0
40
20
**R
elat
ive
inva
sio
rate
--BP-1-102(15 μM)
+-+ -
I
(15 μM) (15 μM)
Fig. S5. Transcriptional induction of KLF8 by Stat3 and the effect of BP-1-102. (A) Normalized luciferase reporter activity in cytosolic extracts of equal totalprotein prepared from normal NIH 3T3 fibroblasts transiently transfected with the wild-type KLF8 promoter-driven luciferase reporter, pLucKLF8, or mutantKLF8 promoter-driven reporter, pLucKLF8/-253T/G, together with v-Src and β-galactosidase expression vectors (for internal control), and the effect of 16-htreatment with BP-1-102. (B) KLF8 promoter analysis showing (i) the nucleotide sequences for the three putative Stat3 binding sites, 1, 2, and 3, and (ii) theEMSA analysis of Stat3 DNA-binding activity to the labeled oligonucleotide sequence probes incorporating each of the three putative Stat3 binding sites,compared with the binding to the high-affinity sis-inducible element probe using nuclear extract preparations of equal total protein containing activated Stat3from NIH 3T3/v-Src. (C and D) BioCoat migration/invasion chamber assay of MDA-MB-231-K8ikd cells harboring inducible KLF8 shRNA and the impact of in-duced KLF8 knockdown (I) on the BP-1-102 effect on cell (C) migration and (D) invasion, compared with the wild-type, uninduced (U) cells. Data are repre-sentative of three independent determinations. Values are the mean and SD of two or three independent determinations each performed in triplicate. *P <0.05, **P < 0.01.
MDA-MB-231
Control
(b)
RelA
Blot:
BP-1-102 (μM, 24 h)
0 15
(a)
(100) (97)
12 5 M
5 μM,2 h
IP: I B
I B
Stat3
pY705Stat3(c)
(100) (21) (109) (83)
(100) (92) (102) (99)
(100) (97)
(100) ( 102)
12.5 μM,16 h
25 μM,16 h
Y705St t3 S536NF B DAPI M d
pRelA
RelA
β-actinBP-1-102 +- +-
(15 μM 24 h)
(100) (92) (102) (99)
(100) (56) (115) (101)
(100) (81) (110) (102)
pY705Stat3 pS536NF B(p65/RelA)
DAPI MergedG-CSF -- ++
(15 μM, 24 h)
(1 μg/ml)
Fig. S6. Effect of BP-1-102 on the activation and localization of NF-κB/p65RelA. (A) Immunofluorescence imaging/confocal microscopy of Stat3 colocalizationwith p65RelA in MDA-MB-231 cells growing in culture and treated with or without 5–25 μM BP-1-102 for 2 or 16 h, fixed, and stained with anti-Stat3 antibodyand secondary Alexa Fluor 546 antibody (red), anti-p65RelA and secondary Alexa Fluor 488 antibody (green), or DAPI nuclear staining (blue). Images werecaptured using a Leica TCS SP5 laser-scanning confocal microscope. (B) IκB immunecomplex prepared from MDA-MB-231 cells treated with or without 15 μMBP-1-102 and probing for RelA or IκB. (C) Immunoblotting analysis of whole-cell lysates of MDA-MB-231 cells stimulated with G-CSF in the presence or absenceof BP-1-102 and probing for pY705Stat3, Stat3, pRelA, RelA, and β-actin. Data are representative of three independent studies. Blots were scanned andquantified by ImageQuant analysis, and numbers represented as percentage of control (100%) are shown in parentheses.
Zhang et al. www.pnas.org/cgi/content/short/1121606109 10 of 12
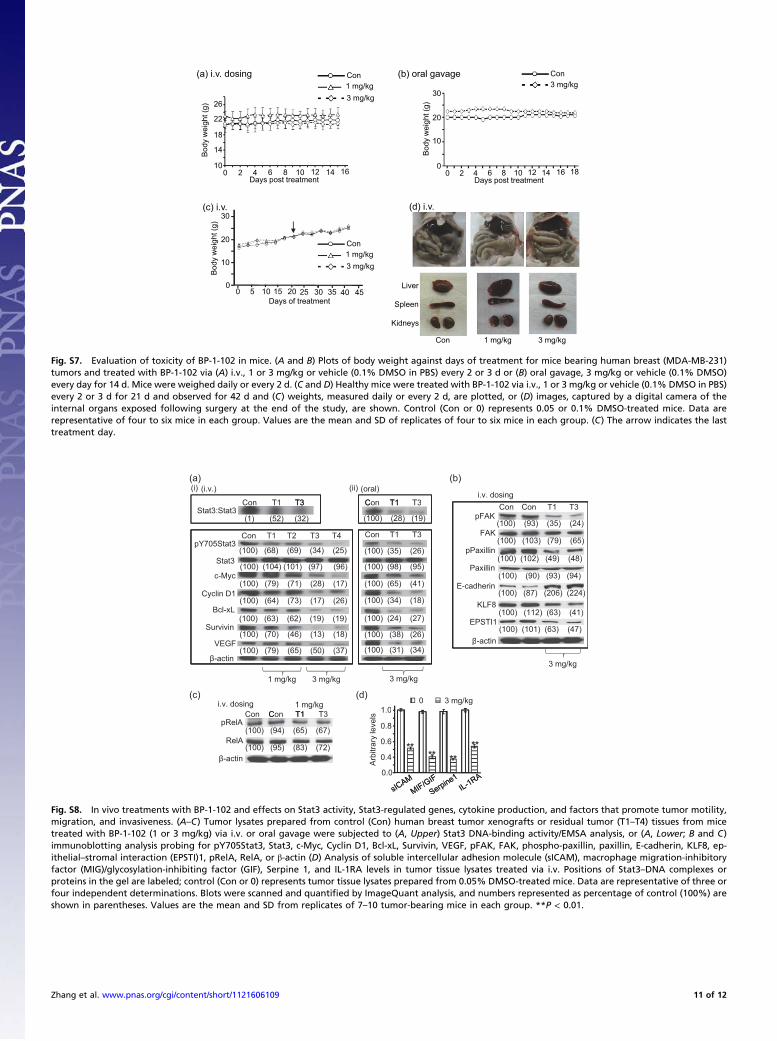
18
22
26
wei
ght (
g)
Con1 mg/kg3 mg/kg
20
30
wei
ght (
g)
egavag laro )b(gnisod .v.i )a( Con3 mg/kg
10
14
18
0 122 4 6 8 10 14 16Days post treatment
Bod
y
0
10
0 122 4 6 8 10 14 16 18Days post treatment
Bod
y
(c) i v (d) i v(c) i.v. (d) i.v.
10
20
30B
ody
wei
ght (
g)
Con1 mg/kg3 mg/kg
Liver
Spleen
Kidneys
Con 1 mg/kg 3 mg/kg
0 5 10 15 20 25 30 35 40 450
Days of treatment
Fig. S7. Evaluation of toxicity of BP-1-102 in mice. (A and B) Plots of body weight against days of treatment for mice bearing human breast (MDA-MB-231)tumors and treated with BP-1-102 via (A) i.v., 1 or 3 mg/kg or vehicle (0.1% DMSO in PBS) every 2 or 3 d or (B) oral gavage, 3 mg/kg or vehicle (0.1% DMSO)every day for 14 d. Mice were weighed daily or every 2 d. (C and D) Healthy mice were treated with BP-1-102 via i.v., 1 or 3 mg/kg or vehicle (0.1% DMSO in PBS)every 2 or 3 d for 21 d and observed for 42 d and (C) weights, measured daily or every 2 d, are plotted, or (D) images, captured by a digital camera of theinternal organs exposed following surgery at the end of the study, are shown. Control (Con or 0) represents 0.05 or 0.1% DMSO-treated mice. Data arerepresentative of four to six mice in each group. Values are the mean and SD of replicates of four to six mice in each group. (C) The arrow indicates the lasttreatment day.
C T1 T3
(i) (i.v.) (ii)
C T1 T3
(oral)(a)
i.v. dosing
(b)
Con T1 T2pY705Stat3
Stat3
Stat3:Stat3Con T1 T3
T3 T4
Con T1 T3
Con T1 T3
pPaxillin
Paxillin
Con Con T1pFAK
FAK
T3
(100) (93) (35) (24)
(100) (102) (49) (48)
(100) (103) (79) (65)(100) (68) (69) (34) (25)
(100) (104) (101) (97) (96)
(1) (52) (32) (100) (28) (19)
(100) (35) (26)
(100) (98) (95)c-Myc
Cyclin D1
Bcl-xL
Survivin
VEGF
E-cadherin
KLF8
EPSTI1
β-actin
(100) (87) (206) (224)
(100) (112) (63) (41)
(100) (101) (63) (47)
(100) (90) (93) (94)(100) (79) (71) (28) (17)
(100) (64) (73) (17) (26)
(100) (63) (62) (19) (19)
(100) (70) (46) (13) (18)
(100) (65) (41)
(100) (34) (18)
(100) (24) (27)
(100) (38) (26)VEGF
β-actin
1 mg/kg 3 mg/kg 3 mg/kg
β act
3 mg/kg
1.0
(d)0 3 mg/kg
(c)
C C T1 T3i.v. dosing 1 mg/kg
(100) (79) (65) (50) (37) (100) (31) (34)
****
0.0
0.4
0.6
0.8
0
****
Arb
itrar
y le
vels
β-actin
pRelA
RelA
Con Con T1 T3
(100) (94) (65) (67)
(100) (95) (83) (72)
Fig. S8. In vivo treatments with BP-1-102 and effects on Stat3 activity, Stat3-regulated genes, cytokine production, and factors that promote tumor motility,migration, and invasiveness. (A–C) Tumor lysates prepared from control (Con) human breast tumor xenografts or residual tumor (T1–T4) tissues from micetreated with BP-1-102 (1 or 3 mg/kg) via i.v. or oral gavage were subjected to (A, Upper) Stat3 DNA-binding activity/EMSA analysis, or (A, Lower; B and C)immunoblotting analysis probing for pY705Stat3, Stat3, c-Myc, Cyclin D1, Bcl-xL, Survivin, VEGF, pFAK, FAK, phospho-paxillin, paxillin, E-cadherin, KLF8, ep-ithelial–stromal interaction (EPSTI)1, pRelA, RelA, or β-actin (D) Analysis of soluble intercellular adhesion molecule (sICAM), macrophage migration-inhibitoryfactor (MIG)/glycosylation-inhibiting factor (GIF), Serpine 1, and IL-1RA levels in tumor tissue lysates treated via i.v. Positions of Stat3–DNA complexes orproteins in the gel are labeled; control (Con or 0) represents tumor tissue lysates prepared from 0.05% DMSO-treated mice. Data are representative of three orfour independent determinations. Blots were scanned and quantified by ImageQuant analysis, and numbers represented as percentage of control (100%) areshown in parentheses. Values are the mean and SD from replicates of 7–10 tumor-bearing mice in each group. **P < 0.01.
Zhang et al. www.pnas.org/cgi/content/short/1121606109 11 of 12
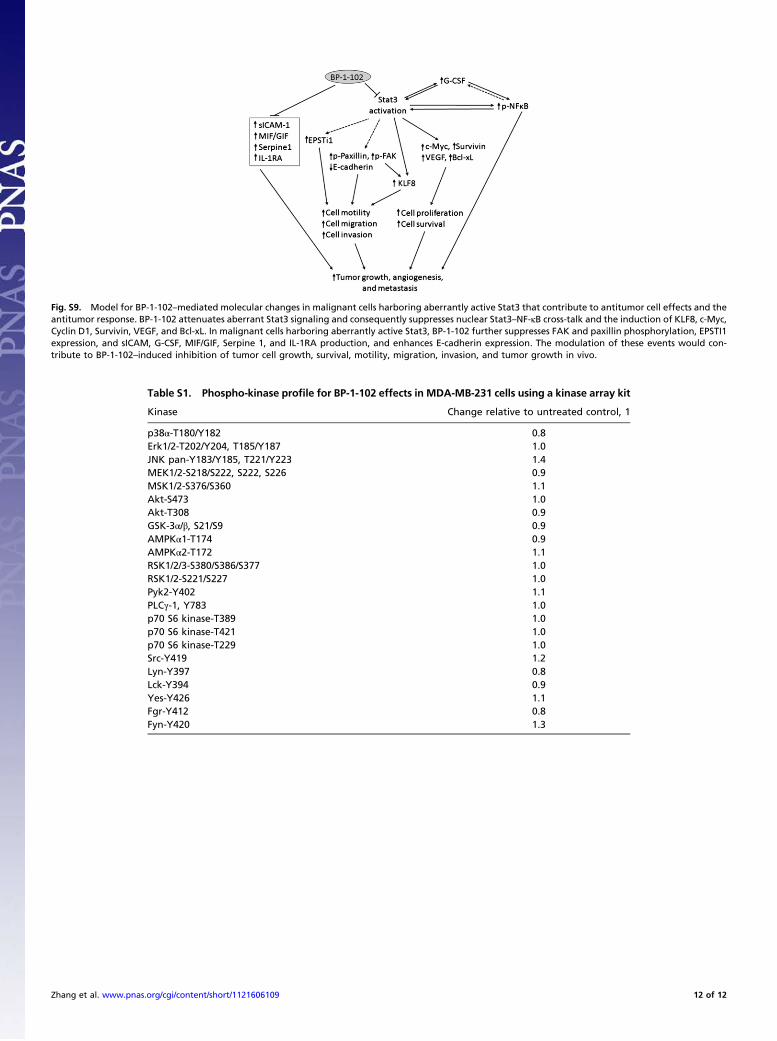
Fig. S9. Model for BP-1-102–mediated molecular changes in malignant cells harboring aberrantly active Stat3 that contribute to antitumor cell effects and theantitumor response. BP-1-102 attenuates aberrant Stat3 signaling and consequently suppresses nuclear Stat3–NF-κB cross-talk and the induction of KLF8, c-Myc,Cyclin D1, Survivin, VEGF, and Bcl-xL. In malignant cells harboring aberrantly active Stat3, BP-1-102 further suppresses FAK and paxillin phosphorylation, EPSTI1expression, and sICAM, G-CSF, MIF/GIF, Serpine 1, and IL-1RA production, and enhances E-cadherin expression. The modulation of these events would con-tribute to BP-1-102–induced inhibition of tumor cell growth, survival, motility, migration, invasion, and tumor growth in vivo.
Table S1. Phospho-kinase profile for BP-1-102 effects in MDA-MB-231 cells using a kinase array kit
Kinase Change relative to untreated control, 1
p38α-T180/Y182 0.8Erk1/2-T202/Y204, T185/Y187 1.0JNK pan-Y183/Y185, T221/Y223 1.4MEK1/2-S218/S222, S222, S226 0.9MSK1/2-S376/S360 1.1Akt-S473 1.0Akt-T308 0.9GSK-3α/β, S21/S9 0.9AMPKα1-T174 0.9AMPKα2-T172 1.1RSK1/2/3-S380/S386/S377 1.0RSK1/2-S221/S227 1.0Pyk2-Y402 1.1PLCγ-1, Y783 1.0p70 S6 kinase-T389 1.0p70 S6 kinase-T421 1.0p70 S6 kinase-T229 1.0Src-Y419 1.2Lyn-Y397 0.8Lck-Y394 0.9Yes-Y426 1.1Fgr-Y412 0.8Fyn-Y420 1.3
Zhang et al. www.pnas.org/cgi/content/short/1121606109 12 of 12


![Optimization of Imidazo[4,5- b ]pyridine-Based Kinase Inhibitors: Identification of a Dual FLT3/Aurora Kinase Inhibitor as an Orally Bioavailable Preclinical Development Candidate](https://static.fdokumen.com/doc/165x107/6345ee68596bdb97a909280b/optimization-of-imidazo45-b-pyridine-based-kinase-inhibitors-identification.jpg)