Analysis of three-dimensional cell imaging obtained with optical microscopy techniques based on...
11
@Copyright 1989 by The Humana Press Inc. All rights of any nature whatsoever reserved. 016.3-4992/89/1503--0189502.20 Analysis of Three-Dimensional Cell Imaging Obtained with Optical Microscopy Techniques Based on Defocusing B. BIANCO *,1.2 AND A. DIASPRO 2 1Department of Biophysical and Electronic Engineering, Via All'Opera Pia 11A, Genova, Italy; and 2Interdepartmental Center for Biomedical and Biophysical Technologies, Viale Benedetto XV 2, Genova, Italy, University of Genoa, Italy Received December 10, 1987; Accepted July 13, 1988 ABSTRACT The properties of an optical microscope are analyzed and analyti- cally evaluated with a simple and effective model in order to under- stand the true meaning, limitations, and real capabilities of a defocus- ing technique. Major emphasis is given to the applications related to microscopic objects of biological interest using fluorescence and absorption light microscopy. A procedure for three-dimensional viewing is analyzed and discussed. Index Entries: Optical sectioning; 3-D cell imaging; Fourier op- tics; fluorescence microscopy; 3-D point spread function. INTRODUCTION "Three-dimensional (3-D) reconstruction" of observed objects and scenes is one of the major tasks of today's imaging science. However, as is often the case with too widely used terms, "3-D reconstruction," or equivalently "3-D imaging," is a term whose meaning is somewhat puzzling, at least for those not involved in imaging problems. *Author to whom all correspondence and reprint requests should be addressed. Cell Biophysics 189 Vol. 15, 1989
Transcript of Analysis of three-dimensional cell imaging obtained with optical microscopy techniques based on...
@Copyright 1989 by The Humana Press Inc. All rights of any nature whatsoever reserved. 016.3-4992/89/1503--0189502.20
Analysis of Three-Dimensional Cell Imaging Obtained with Optical Microscopy Techniques Based on Defocusing
B. BIANCO *,1.2 AND A. DIASPRO 2
1Department of Biophysical and Electronic Engineering, Via All'Opera Pia 11A, Genova, Italy; and 2Interdepartmental
Center for Biomedical and Biophysical Technologies, Viale Benedetto XV 2, Genova, Italy, University of Genoa, Italy
Received December 10, 1987; Accepted July 13, 1988
ABSTRACT
The properties of an optical microscope are analyzed and analyti- cally evaluated with a simple and effective model in order to under- stand the true meaning, limitations, and real capabilities of a defocus- ing technique.
Major emphasis is given to the applications related to microscopic objects of biological interest using fluorescence and absorption light microscopy. A procedure for three-dimensional viewing is analyzed and discussed.
Index Entries: Optical sectioning; 3-D cell imaging; Fourier op- tics; fluorescence microscopy; 3-D point spread function.
INTRODUCTION
"Three-dimensional (3-D) reconstruction" of observed objects and scenes is one of the major tasks of today's imaging science. However, as is often the case with too widely used terms, "3-D reconstruction," or equivalently "3-D imaging," is a term whose meaning is somewhat puzzling, at least for those not involved in imaging problems.
*Author to whom all correspondence and reprint requests should be addressed.
Cell Biophysics 189 Vol. 15, 1989
190 Bianco and Diaspro
In the authors' opinion, the sentence "3-D reconstruction of an ob- ject," through images taken with any technique, is associated with two different situations: (1) To present an observer images of a given object as if it were directly viewed by his eyes from a given point of view, besides possible magnification; and (2) To calculate the actual spatial distribution f(x,y,z) of an intensive physical property of the object itself.
The first situation is usual, for example, in scene analysis performed by stereoscopic methods. If we take a sufficient number of two-dimensional (2-D) views of a scene from some suitable standpoints, then, in principle, it is not a difficult task to reconstruct, with software techniques, "views" of the same scene as seen from other standpoints, provided that one has sufficient a priori knowledge, at different levels, of the objects in the scene. This condition is of major importance: any a priori knowledge (e.g., to know that the objects, architectured in a well-delimited and defined re- gion under a set of weU-known physical constraints, are polyhedra, or spheres and that their surfaces are Lambertian or specular) can complete the information given by a few acquired images. As a result, it is possible to model--theoretically--and to image (e.g., on a computer-controlled monitor) the objects as seen from all possible standpoints.
Another example of the same situation in 3-D imaging is holography (1). This technique yields the so-called 3-D photography of an object in the following way: the human eye looking at an analog or digital recon- structed hologram from any standpoint sees "something" that is identical to the object itself endowed with its 3-D features. Obviously, modest im- age blurring may occur and, on occasion, spurious images (1) may result.
The second situation is quite different, though it can encompass the previous one as a particular case, as will be discussed later on. For this situation, we consider imaging methods allowing the calculation of the spatial distribution f(x,y,z) of some interesting local physical property. A widely known imaging technique of this kind is X-ray tomography: here f(x,y,z) is the X-ray absorption, averaged on the X-ray generators' spectra. A less known example is interferometric tomography, which can yield the spatial distribution of the refractive index of a transparent or semi- transparent object, for the wavelength actually used for illumination.
If f(x,y,z) is the absorption coefficient for some kind of visible light, then the knowledge of this parameter enables the viewing of the object (possibly magnified) as observed by the human eye. Thus, these imaging methods indude the first type discussed.
SOME PRELIMINARY CONSIDERATIONS
The properties of out-of-focus images have been extensively studied in the last decades (for example, see ref. (2)) particularly for the major pur- pose of image restoration of photographs or "electronic" images acquired from satellites or through computerized imaging systems used in citology.
Cell Biophysics Vol. 15, 1989
3.D Cell Imaging 191
In such cases, if the plane of acquisition (e.g., a photographic film or plate, or a TV camera target) is not properly focused, then the relation- ship between the actual image intensity Ii(x,y) and the ideal (in focus) one Iio(X,y) is simply a convolution by some function S(x,y) (2,3):
Ii(x,y) = G(x,y) * S(x,y) (1)
More precisely, Eq. (1) holds if misalignment errors are not present, i.e., if the image plane is perpendicular to the optical z axis. Under these con- ditions, in Eq. (1) x and y are coordinates orthogonal to the z axis; S(x,y) is a function depending upon the particular imaging system used and the amount of defocusing, and it can be calculated or measured to a satisfac- tory accuracy. Once S(x,y) and Ii(x,y) are known, an inverse convolution (possibly corrected for noise effects) gives the required in focus image Iio(X,y) (for mathematical procedure, see (4)). An approach based on a similar philosophy has been applied to the three-dimensional reconstruc- tion of microscopic objects. This technique allows the acquisition of a suf- ficient number of images taken from different standpoints. Each image records the intensity of the light coming from its conjugate plane in the object, though blurred by out-of-focus planes. A deconvolution procedure (described later) is used to restore an "image" without much blurring and, therefore, identical to the original object. A particular reconstruction technique for a 3-D is used to represent chromosomes of Drosophila salivary glands (5).
However, the problem is not so simple as it may appear in the scien- tific literature, where the various methodologies often lack important de- tails. The purpose of the following sections is to analyze a few aspects of the procedure described above to understand its meaning, limitations, and real capabilities. To this end, we first examine the simplified, but effective model of a microscope used for image acquisition.
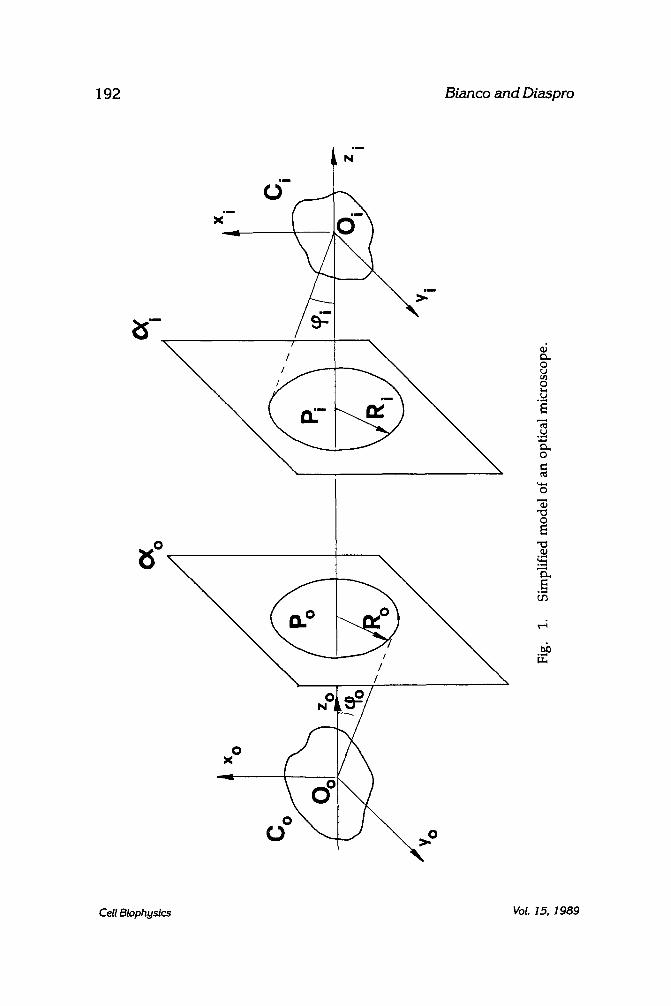
Referring to Fig. 1, a microscope M, diffraction limited (1,6) but ideal in all other respects, is identified by the principal planes, Cr and m, the entrance and exit pupils, Po and Pi, the focuses (not shown in the figure), and the optical axis. Oo and Oi are two conjugate points. Two reference frames are introduced: xo,yo, Zo in the object space and xi, y~,zi in the image space. The object to be examined is placed close to Oo and the target near Oi, where images are formed. In the following, the Fourier optic methods are used (1). The light is supposed monochromatic, and the formal de- pendence e-J wt on time is assumed.
If Oo is regarded as a point source, then, according to geometrical op- tics, a cone of rays, ~i in aperture (Fig. 1), emerges from the exit pupil and converges to Oi. This result is expressed in the following wave terms lan- guage. Let h(xi, yi, zi) be the light around Oi, h(xi, yi,0) is the point-spread function between the conjugate planes zo -- 0 and zi-- 0. The Fourier trans- form of that function, defined as
+ o o
Ho(fX, fy) = J I I h(xi,yi, o) e-2"jr dx dy (2)
Cell Biophysics VoL 15, 1989
192 Bianco and Diaspro
111
. m
X
N
111
X
- 2oo o ..+~ \~o
6 o ~J
o
% ~
o
o
o E
U3
Cell Biophysics Vol. 15, 1989
3.D Cell Imaging 193
is given by (1)
1 if ~/fx 2, + fy2 < Ri/kdi Ho = (3)
O otherwise
Ri being the radius of the exit pupil. Then, according to the general principle of optics (1), the light h(xi, yi, zi)
in the image space is + o o
h(xi, yi, zi) = j j Ho( fx,fv)e2xjr 4(l/X)2-fx2-fy2dfxdfy ) (4) - -Oo
Eq. (4) defines such a light as a superposit ion of plane waves; each couple fx, fy represents a plane wave (of complex amplitude Hodfxdfy) that travels in a direction, t, forming with the axes the angles defined by
cos(t, xi) = Xf• cos(t, yi) = Xfy cos(t,zi) = ~/1 - ( ~ f x ) 2 - ( ~ f y ) 2 (5)
According to (3), such plane waves are confined, in their directions, within an angle (t, zi)~x such that
cos(t, Zi)m~ = ~/1 - R2/d 2 - 1 - R2/2d 2 (6)
from Fig. I one has
COS((pi) = di/~/di2 + R 2 - 1 - R2/2d 2 (7)
or (t, Zi)max = ~ai within the limits of the paraxial rays approximation.
Therefore, the system of plane waves travels in directions making, with the optical axis, an angle at the most equal to the exit aperture ~i. Since the same holds true for the geometrical-optics rays converging to O~, the previous result might seem quite trivial; however, this is not the case, as such rays or pencils have by no means the same properties as the plane waves ment ioned above. The latter are diffused in space; the fact that the light in the xi, yi plane is confined around Oi is explained as an interference phenomenon .
Reciprocally, let us now regard Oi as an ideal image point. It can easily be seen that the light that produces such a point can be decomposed, at the microscope input, as a superposition of plane waves entering the microscope at angles not higher than the input angular aperture ,po. This has remarkable effects on 3-D reconstruction. In fact, let Co be an object placed around Oo, and Ci its image; then suppose that Co is il luminated by a plane wave traveling in the direction zi = Zo, as usual in microscope models. This light is diffused by Co in different directions, but only those with slope < ~ao form the image. Accordingly, Ci consists of a collection of "project ions" of Co, within an angle ~o, and then it is difficult to deduce how Co could be entirely 3-D reconstructed. In fact, if we could perform such 3-D reconstruction, we would be able to obtain, in particular, a pro- jection of Co at any angle > r which is not consistent with the previous discussion.
Cell Biophysics VoL 15, 1989
194 B i a n c o a n d Diaspro
ANALYSIS OF 3-D RECONSTRUCTION
A deeper insight into the above conclusion results from the analysis of the 3-D reconstruction obtained with defocusing techniques (3,5). Let us consider incoherent illumination. Images of the object can be ideally acquired for any zi: this yields a function i(xi, yi, zi). In practice, an adequate number of images are taken at discrete abscissa zi, to identify i(xi, yi, zi) to sufficient accuracy.
Let io(x~,yi, zi) be the ideal 3-D image obtained by taking the image of each point of Co, neglecting the blurring effect owing to other points. Then, io is a 3-D reconstruction of CO since if io is known, the distribution and intensities of the points of CO can be easily recovered, together with their intensities (from the knowledge of the microscope parameters).
Then
i(xi, yi, zi) = io(xi, yi, zi) * s(xi, yi, zi) (8)
where s is the three-dimensional impulse response for incoherent illumina- tion (not to be confused with the previously introduced h, which regards coherent light). If we introduce the 3-D Fourier transforms I, Io, and S of i, io, and s, given by
+ o o
I(fx,fy,fz) = I IJ i(xi, yi, zi)e-2"j(xif•176 dyi dzi (9) -~ similarly for Io and S.
a convolution property (1,4) yields
I =Io. S (10)
An approximate expression for s is
A/z2if x/x 2 + ~ < [zJtan(~ai) S = (11)
0 otherwise
where A is a constant. This expression is obtained by geometrical optics and differs from the
one obtained by physical optics, discussed and used elsewhere (5,6). Equations (10) and (11) disregard diffraction, i.e., state that M is rigorously stigmatic. This is not correct, but the error is a minor one.
One must bear in mind that other expression for s, though more ac- curate, are calculated under hypotheses never realized in actual applica- tions. For example, the 3-D impulse response used in (5), is based on the 2-D one found in (6), but this latter is clearly calculated on the basis of paraxial approximations that are not fulfilled by the large aperture micro- scopes used in acquisitions of biological images. In a paraxial approxima- tion, the impulse response used in (5) and s given by Eq. (11) are almost identical; the difference between them can be treated as an error term, of
Cell Biophysics VoL 15, 1989
3-D Cell Imaging 195
the same order of magni tude of the errors arising from the fact that the ac- tual microscope does not process only paraxial rays. Otherwise stated, the calculations found in (5,6) certainly yield on s slightly more accurate than Eq. (11), but that is a simple refinement in comparison with the heavier errors owing to large apertures.
In this sense, Eq. (11) is not a bad approximation, and the conclusions described later, on the basis of Eq. (11), can be extended in general.
Returning to Eq. (11), S(fx, fy,f~) is not difficult to calculate. However, instead of the specific expression Eq. (11) we consider a general form of the type
S(x,y,z) = 1/z 2 q(a/[zl (12)
where a--n/x 2 + y2 and q is any function such that
q = 0 if q > t a n r (13)
Clearly, q is either A or zero in Eq. (11). The expression Eq. (12) is rather general: it satisfies the requirement of light power conservation and of axial symmetry. Let us introduce the new variables
where
= ( 1 / R o l z l ) ( x f , + yfy)
r = ( l / R o l z l ) ( - X f x + yfy) (14)
Ro =~/f2 + f2
Then, one has
s = I S I 1/z2 q(p/Iz l ) e -2 ,~(~ + yfy + ~f~)dx dy dz
= [I~ q( g24-~--+-~r2)e -2'~R~ e-2"J~f~dg &' dz + c o
= i idtt du q ( ~ 2 ) i e-2"j(slzlR~ + zf~) dz - - 0 0
(15)
The inner integral is evaluated by using 6 (Dirac's) pulses (1) + c o
I e-2~J0dzlR~ = - o o
O + t o
= I e -2~J(-~R~ + I e-2~j0 'R~ = --OO O
= 1/2 6 ~Ro + fz) + 1/2 6~Ro - fz) + 2Rog/j(R2g - ~)
Putt ing this result in Eq. (15), one finds
S = i (l/Ro) x q(~/~/R~ + v 2) dr --GO
(16)
(17)
Cell Biophysics VoL 15, 1989
196 Bianco and Diaspro
\ \
\ tx /
/
/
/ /
/ /
/ /
S = O
f y
I / , r
/ / / / ~ /
I I
I I
/ S r
\ \
i \ I I X I t I - ~ o t
I I
I /
I
I
\ \
\ \
S - O
_ f Z
r
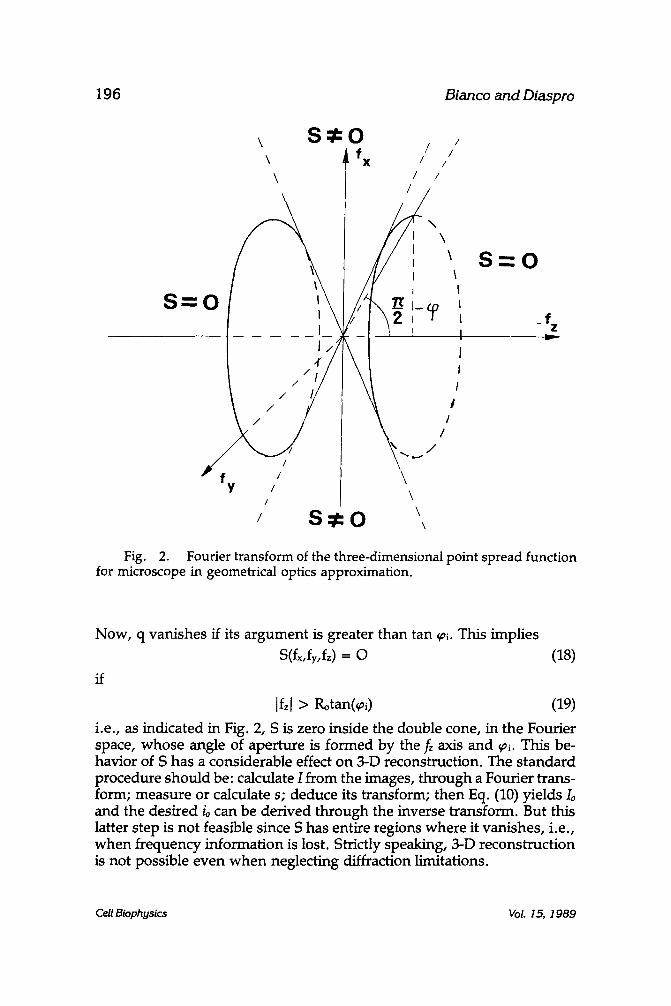
Fig. 2. Fourier transform of the three-dimensional point spread function for microscope in geometrical optics approximation.
Now, q vanishes if its argument is greater than tan (~i. This implies s(fx, fy,fz) = o (18)
if
Ifzl > Rotan(~i) (19)
i.e., as indicated in Fig. 2, S is zero inside the double cone, in the Fourier space, whose angle of aperture is formed by the f= axis and ~ai. This be- havior of S has a considerable effect on 3-D reconstruction. The s tandard procedure should be: calculate I from the images, through a Fourier trans- form; measure or calculate s; deduce its transform; then Eq. (10) yields Io and the desired io can be derived through the inverse transform. But this latter step is not feasible since S has entire regions where it vanishes, i.e., when frequency information is lost. Strictly speaking, 3-D reconstruction is not possible even when neglecting diffraction limitations.
Cell Biophysics Vol. 15, 1989
3.D Cell Imaging 197
DISCUSSION
It must be stressed that though the above conclusion does not apply theoretically to the impulse response used in (5) who accounts for diffrac- tion, in practice does: indeed, it is apparent from the plots given by Stok- seth (6), that this S has very low values in the frequency range given by Eq. (19). (This is correct since Stokseth's expression for the impulse re- sponse is actually a refinement of Eq. (11), as said above). Taking into ac- count that range in 3-D reconstruction, in these authors' opinion means to work with signal comparable in magnitude with noise. It can be hardly assumed that the frequency range Eq. (19) has true significance in 3-D reconstruction.
What is the information that can be retrieved with the described de- focusing technique? First, we point out that the function f(x,y,z) to be re- covered (actually, Io(xi, yi, zi)) is the local absorption or emission coefficient of the object for the wavelength of the illuminating or exciting light, obvi- ously apart from some scaling factor. Nevertheless, we have previously shown that the spatial spectrum of s is zero over a wide frequency space, and the same holds true for the spatial spectrum of I according to Eq. (10).
Regarding the true 3-D imaging possibility, if the impulse response in Eq. (11) is assumed, the previous discussions clearly indicate which is the retrievable information. To do so, one can use the so-called "slice theorem" (3). Let us consider a spatial direction z' making some angle ~< ~i with the optical axis z, and also consider the plane 7r(o) in the frequency space, passing through the origin (fx=f~=f~=0) and such that its normal makes an angle ~ with the fz axis. Now, 7r(a) belongs to the region where Io, the Fourier transform of the object, is known. The slice theorem states that the distribution of the values of Io on ~r(a) is the 2-D Fourier transform of
+OO
I io(Xi,yi, zi) d z' (20) --(3O
which is the projection of the object on the z'-direction. Here, "projec- t ion" is not a mere mathematical term: the integral Eq. (20) is exactly (dis- regarding magnification) the image seen by the human eye looking at the object from the z' direction. Note that if we took a> ~i, ~r(a) belongs to the frequency region where Io is not calculable (S = 0, Ii = o). It is impossible to take "v iews" (projections) of the object at angles greater than that of microscope's aperture. And even if the above conclusion is valid, strictly speaking, for s given by Eq. (11), it should be clear that it is approximately valid for any reasonable form of impulse response.
Moreover, the above statements suggest two considerations. First, that a good test on the performance of any 3-D reconstruction based on defocusing techniques is the observation of the 3-D transform of the re- constructed object before any enhancement based on a pr/or/knowledge: high values of the "energy" of the 3-D transform in the range where the
Cell Biophysics VoL 15, 1989
198 Bianco and Diaspro
transform itself should be zero (according to the previous theory) are suspected.
Second, and more important, the exposed theory can be used as the basis of a sound reconstruction procedure, operating as follows: (1) images at different position of focus are taken; (2) their collection, considered as a 3-D image, is Fourier transformed: this yield Ii (f;,fy, fz); (3) Io =Ii/S is calcu- lated in the allowed frequency range; and (4) for any angle a< ~ai projec- tions of the object are present using the slice theorem, as exposed above.
In this procedure, S is given by Eq. (17). Since q is zero where its argu- ment exceeds tan~ai, one easily finds
S = (2A/Ro)~ / t an2~a i - ~ / 1 ~ (21)
in the range f < R tan~ai (and S = 0 outside that range). Presently, the above procedure is in progress by the authors.
CONCLUSION
The assumptions made in the preceeding sections certainly clarify the limitations of the defocusing method used in 3-D reconstruction and based on the knowledge of limited 2-D information, with the meaning given in the introduction. But such assumptions can also provide important hints regarding the optimal use that can be made of this technique, and a re- construction procedure has been described.
So, even if under optimal conditions in the optical system, it has been unequivocally stated that it is not feasible to obtain a three-dimensional, volumetric reconstruction that provides views of an object at angles higher than the aperture of the optical system used (i.e., microscope objective). As a consequence, no view at 90 ~ can be obtained of an object that is known only on the basis of the information provided by its optical sec- tioning through the optical axis.
It should be stressed that we are interested in investingating semi- transparent biological objects, such as cells and nuclei differently stained or labeled (7). Now for reasons previously explained and mathematically shown, we have given up the " idea" of finding an exact solution through the knowledge of the actual image on each optical section, in restoring out-of-focus images, and we have suggested an approximate method.
The method is fundamentally based on the fact that the contribution of out-of-focus slices, with respect to the plane under examination, can be taken into account only in a well-defined range of spatial frequencies. Concerning the knowledge of S, it is not too restrictive a hypothesis, com- pared to all other implicit or explicit restrictions, to assume that S varies linearly with the degree of defocusing, and that the final out-of-focus dis- tance is slightly more than five times the emitted wavelength.
Moreover, once all the planes have been fully restored as well, the in- formation available is a set of 2-D images that can be correlated in a 3-D
Cell Biophysics VoL 15, ] 989
3.D Cell Imaging 199
fashion using integrative data about the object and a flexible image editor. At this point, it seems possible " to unders t and" the shape of a micro- scopic 3-D object by focusing on its inside, with no pretension of having acquired all the volumetric information.
As a final remark, we like to stress that: even if the angle defining the entrance aperture, equaling the optical aperture for refractive index n = 1 were 90, the rays would not reach the recording target. Therefore, apart from methods recording both the amplitude and phase of light (e.g., ho- lography and a proper combination of phase contrast and absorption microscopy), the only ways of obtaining real 3-D information are the rota- tion of the sample or the optical acquiring system around it, or rather to record information from two objectives placed at 90 ~ to each other (one perpendicular and the other parallel to the z axis).
REFERENCES
1. Goodman, J. W. (1968), Introduction to Fourier Optics, McGraw Hill, New York, NY.
2. Dainty, J. C. and Shaw, R. (1974), Image Science, Academic, London. 3. Castleman, K. R. (1979), Digital Image Processing, Prentice Hall, Englewood
Cliffs, NJ. 4. Schwartz, M. and Shaw, L. (1973), Signal Processing, McGraw Hill, New
York, NY. 5. Agard, D. A. and Sedat, J. W. (1983), Nature 302, 676-681. 6. Stokseth, P. A. (1969), J. Optical Soc. Am. 59, 1314-1321. 7. Arndt-Jovin, D. J., Robert-Nicoud, M., Kaufman, S. J., and Jovin, T. M.
(1985), Science 230, 247-256.
Cell Biophysics VoL 15, 1989