Scanning Electrochemical Microscopy as a Local Probe of Oxygen Permeability in Cartilage
Upload
khangminh22Category
view
1download
0
1
High Pressure Scanning Tunneling Microscopy
Miquel Salmeron,*, †
,‡ and Baran Eren,**
,†
,§
†Materials Sciences Division, Lawrence Berkeley National Laboratory, 1 Cyclotron Road, Berkeley,
California 94720, United States, and
‡ Department of Materials Science and Engineering, University of California, Berkeley, United
States
§Department of Chemical and Biological Physics, Weizmann Institute of Science, 234 Herzl Street,
76100 Rehovot, Israel,
* E-mail: [email protected]
** E-mail: [email protected]
Abstract
This is a Review of recent studies on surface structures of crystalline materials in the presence of gases in
the mTorr to atmospheric pressure range, which brings Surface Science into a brand new direction.
Surface structure is not only a property of the material, but also depends on the environment surrounding
it. This Review emphasizes that high/ambient pressure goes hand-in-hand with ambient temperature,
because weakly interacting species can be densely covering surfaces at room temperature only when in
equilibrium with a sufficiently high gas pressure. At the same time, ambient temperatures help overcome
activation barriers that impede diffusion and reactions. Even species with weak binding energy can have
residence lifetimes on the surface that allow them to trigger reconstructions of the atomic structure. The
consequences of this are far from trivial, because under ambient conditions the structure of the surface
dynamically adapts to its environment and as a result completely new structures are often formed. This
new era of surface science emerged and spread rapidly after the re-tooling of characterization techniques
that happened in the last two decades. This Review is focused on the new surface structures enabled
particularly by one of the new tools: High pressure scanning tunneling microscopy. We will cover several
important surfaces that have been intensely scrutinized, including transition metals, oxides, and alloys.
2
Table of Contents
1. Introduction
1.1 Why High (Ambient) Pressure?
1.2 Why STM?
2. Instrumentation
3. Carbon Monoxide Adsorption Studies on Low Miller-Index Surfaces
4. Adsorption Studies of other Molecules on Low Miller-Index Surfaces
5. Adsorption on Low Miller-Index Surfaces of 'Soft' Metals (Copper and Gold)
5.1 CO on Low Millex-Index Cu Surfaces
5.2 CO on Low Millex-Index Au Surfaces
5.3 Other Gases on Low Millex-Index Cu Surfaces
6. Reaction Studies on Low Miller-Index Surfaces
6.1 CO Oxidation
6.1.1 CO Oxidation on Pt Surfaces
6.1.2 CO Oxidation on Pd Surfaces
6.1.3 CO Oxidation on Rh Surfaces
6.1.4 CO Oxidation on Cu Surfaces
6.2 Ethylene Oxidation on Ag(111)
6.3 NO Reduction
7. Non-reactive Co-adsorption Studies on Low Miller-Index Surfaces
8. Adsorption and Reactions on Vicinal Surfaces
9. Fischer-Tropsch Synthesis on Co Surfaces
10. Metal/Oxide Surfaces
11. Bimetallic Surfaces
12. Conclusions and Outlook
3
1. Introduction
1.1 Why High (Ambient) Pressure?
Surface Science is the field of elucidating the fundamental aspects of chemistry and physics
occurring on the surfaces of materials, with the goal of providing fundamental information to industrially
important fields of heterogeneous catalysis, electrochemistry, corrosion, lubrication, and others.
Traditional Surface Science is carried out in rarefied conditions of ultra-high vacuum (UHV) where the
pressure is usually below 10-9
Torr/mbar, which make it possible to control the sample composition and
cleanliness to within 0.1% of a monolayer (ML) or better. Surface Science, as practiced until the end of
the 20th century, has provided much of our present understanding of solid surfaces.
1-2 This is because an
extensive array of surface-sensitive microscopy and spectroscopy techniques exists that operate in UHV,
and these techniques have revealed the atomic, electronic, and chemical structure of many crystal surfaces
in their ideally pristine state at pressures below 10-6
Torr, and mostly at a sample temperature of room
temperature or below. While these low pressure−low temperature studies have helped us to understand
the structural aspects, thermodynamics, and kinetics of certain model reactions, practical catalytic
reactions typically take place in the presence of gases (or liquids) at much higher pressures and at room
temperature or above.
Our knowledge of surfaces under such realistic conditions is far less extensive than in UHV, because
a few surface-sensitive techniques exist outside the optical domain that can probe surfaces in the presence
of gases at ambient pressure conditions. This lack of knowledge is referred to as the “pressure gap”.
However, it is more accurate to think of this lack of knowledge as made up of three different gaps,
determined by pressure, temperature, and complexity of the system. The pressure gap is due to two
reasons: The first reason is that most surface-sensitive techniques require high vacuum for operation
because probe particles (electrons, ions, etc.), whether incoming or outgoing, have mean free paths below
1 mm at pressures above a few mTorr. A high coverage of adsorbed atoms or molecules on surfaces is the
norm in operating or storage conditions, but in UHV conditions high densities of adsorbed atoms or
molecules can often be obtained only by keeping the surface at low temperatures (typically at liquid
nitrogen temperature (77 K) and below). This requirement for controlling the adsorbed layer is the second
reason for the pressure gap. However, at low temperature, the kinetics of surface processes can be too
slow compared to timescales of an experiment, which is mostly of minutes to hours. The “temperature
gap” therefore is more important because temperature affects kinetics in an exponential way, while
pressure affects the kinetics in a slow power law (e.g., linear for first order processes, quadratic for
second order, etc.). In short, a pressure−temperature gap occurs as a consequence of kinetic hindrances
that might not allow for the thermodynamically favorable structure to form. In addition, entropic effects
also play a role at higher temperatures. Both the pressure−temperature effects and the entropic
4
contributions are difficult to fully take into account when extrapolating experimental results obtained in
UHV to the relevant reaction conditions. Finally there is also a “complexity gap”, related to the fact that
most practical materials are not single-crystals, but are in the form of powders, nanoparticles, porous
media, etc., that add additional barriers to molecular and atomic level characterization.
The approach in Surface Science that we call ‘Ambient Pressure Surface Science’, stems from an
effort to bridge these three gaps between science and technology. The vast majority of studies in this new
research field are conducted within the context of heterogeneous catalysis. This is because catalysts are
the work horses in the refinery, chemical production, and energy conversion processes, and there is a
significant demand for improvements in their activity (the rate at which the reactants are converted to
products) and selectivity (the fraction of the products which are the desired chemical). Furthermore,
chemical process costs can be reduced significantly by replacing precious metal catalysts with others
based on low-cost materials, like transition metals with 3d-valence electrons and their alloys. A condition
for the rational design of improved catalysts is a thorough understanding of the underlying mechanisms
by which the catalyst functions. In particular, the atomic and chemical structure of a catalyst surface plays
a crucial role in its performance in terms of its activity and selectivity towards sought-after products, and
this can change dramatically with reaction conditions. For example, as we will show with examples in this
Review, model single-crystal catalyst surfaces have been observed to restructure dramatically as the
pressure is increased from UHV to the Torr/mbar pressure regime and above, a phenomenon indirectly
predicted more than a century ago by Irving Langmuir, the Founding Father of Surface Science. He
stated:3
“The atoms in the surface of a crystal must tend to arrange themselves so that the total energy will
be a minimum. In general, this will involve a shifting of the positions of the atoms with respect to each
other.”
The amount of experimental observations of this long-anticipated atomic scale phenomenon
increased very significantly with the advent of Scanning Tunneling Microscopy (STM), an imaging
technique capable of resolving single atoms.4 The results presented in this Review were all obtained by
STM, usually in a separate smaller volume chamber connected to the main UHV chamber, at
ambient/high pressure, broadly defined as 1 mTorr and above, hence the name high pressure STM or
simply HPSTM. The scope of HPSTM is limited to bridging the pressure-temperature gap, as atomically
flat single-crystal samples are necessary for imaging with atomic resolution. This trade-off between
atomic-level information and bridging the complexity gap was suggested by Irving Langmuir about a
century ago. In his own words, Langmuir suggested using “checkerboard surfaces” (single-crystals) as
model systems for more complex “porous bodies" (real catalysts like nanoparticles or foils).5
5
There are several surface-sensitive spectroscopy techniques that can also operate under ambient
conditions which provide invaluable information to help to interpret the HPSTM images. One is ambient
pressure x-ray photoelectron spectroscopy (APXPS). XPS relies on the short inelastic mean-free paths
(IMPF) of electrons, and can provide powerful information on chemical composition, but has traditionally
been limited to UHV conditions to minimize gas-phase scattering prior to collection of the photoelectrons
and to prevent deterioration of its electron optics and electron detector components. During the last
decades, APXPS has been developed, extending the operating pressure into the Torr/mbar pressure
regime.6 The current generation of APXPS analyzers utilizes electron optics to focus photoelectrons
through several apertures as part of a multistage, differentially pumped lens system, increasing the
photoelectron collection efficiency and extending the measurement range up Torr/mbar pressure regime.
Another important technique is infrared reflection absorption spectroscopy (IRRAS), which has been used
extensively since the beginning of surface and catalysis science.7 Compared to APXPS, this technique is
superior in determining the chemical state of adsorbates and their adsorption sites, but it is not element
specific and less quantitative than APXPS. An important advantage of IRRAS over APXPS is the
pressure range; by modulating the linear polarization of the infrared light in real-time, it is possible to
investigate surfaces even in the presence of 1 bar of reactant gases. This is because gas-phase species are
randomly dispersed in space and have no polarization dependence, whilst adsorbed species are oriented.
1.2 Why STM?
STM is an atomic-resolution imaging technique (lateral resolution ~100 pm and vertical resolution
~1-3 pm at room temperature) which is best suited for atomically-flat surfaces, due to the finite tip apex
size. STM can operate in ambient gases and air, so there is no limitation on its operation under controlled
gas pressures.
Among the surface characterization tools that are applicable in the presence of gases, STM has one
great advantage: the measurement itself is not invasive, i.e., it does not affect or modify the surface
structure significantly, in contrast to microscopy or spectroscopy techniques that either employ or
produce a high energy and high flux of electrons (e.g., environmental transmission electron microscopy
(e-TEM), APXPS, etc.). The high energy particles ionize the gas phase molecules and they also produce
secondary electrons that are very effective in dissociating the adsorbed molecules. This is called 'beam-
induced chemistry' or 'beam damage', and it is highly undesirable.8 These problems can be circumvented,
but this is an important topic worthy of a separate review. Another practical advantage of HPSTM
instruments is that it can be used by individual research groups, without the need for large and often
remotely located user facilities.
The downside of operating under ambient gas pressures is the possible contamination of the inner
6
walls of the chambers that house the analysis instruments when reactive species are used. Base pressures
of 10-10
Torr/mbar can be restored in several ways, including the conventional baking at over 110 °C for
two days, and by performing a 'plasma cleaning' of the chamber prior to measurements at ambient
pressures. The latter is an efficient way to remove hydrocarbons, water, and other contaminants desorbing
from the chamber walls as they can be displaced by the reactant gases introduced in the chambers.
Another source of potential contamination is the crystal itself, even after the conventional cleaning
procedure of sputtering and annealing cycles. Similar to STM studies in UHV, most research groups
performing HPSTM measurements check the cleanliness of their samples with Auger-Meitner electron
spectroscopy (AES), or with XPS, prior to STM measurements, to confirm that the contaminant level is
below the detection limit of these techniques (<1% of a monolayer). However, even an initially clean
surface may become contaminated again when contaminant species dissolved in the bulk diffuse to the
surface and, in the presence of gases, react and become anchored there.
In traditional Surface Science studies, combination of STM with low energy electron diffraction
(LEED) has proven to be very effective in determining the atomic structure of surfaces. At ambient
pressures, it is not possible to use LEED as it employs low energy electrons as the probe particles.
Instead, various forms of x-ray scattering can be used, including grazing x-ray diffraction, and others that
will not be reviewed here. In addition to the experiment tools, theoretical methods have been developed
that continuously improve, chiefly among them is density functional theory (DFT) for structural and
chemical analysis. In some recent studies, the gas phase chemical potential is included in the calculations,
making them comparable to experimental studies at ambient pressures and temperatures.
This Review article will be devoted solely to HPSTM as the main structural analysis tool, supported
as needed with spectroscopy and theory results for interpretation of the images. Readers may refer to the
original papers for full details of the theoretical and experimental techniques used in determining the
surface structures.
Leading groups in HPSTM are based in Berkeley, Aarhus, Leiden, Berlin, Munich, and increasingly
in many other institutes. Thanks to efforts by research groups in Aarhus University in Denmark,9 and the
University of Leiden in the Netherlands,10
different HPSTM setups that can operate in the presence of
gases are now commercially available. The Leiden HPSTM, for example, quotes that it can operate at 6
bar and ~300°C, reaching the industrial reaction conditions of many important catalytic reactions.
All the transition metals discussed in this Review have a face-centered cubic (fcc) structure, with the
exception of Co which has a hexagonal close-packed (hcp) structure at room temperature.
A final remark is that we use both mbar and Torr throughout this Review, depending on the pressure
unit used in the original paper.
7
2. Instrumentation
Traditional Surface Science experiments are conducted in UHV conditions and it is rather
straightforward today to obtain atomic resolution on crystal surfaces with commercial or custom-built
UHV-STM instruments. There are two ways to adapt any type of Surface Science experiment from UHV
conditions to ambient/high pressures. The first and simpler one is backfilling the UHV chamber with
gases up to 1 bar pressure. STM can work in air, so there are no technical constraints in operating it in the
mbar-bar pressure range. The only consideration should be the possibility of igniting a low-temperature
plasma in the 10-2
-10-3
Torr pressure range triggered by the high voltage applied to the piezoelectric
material of the STM scanners. This problem can easily be dealt with by mixing the reactant gas with
argon and keeping the total pressure higher. The maximum pressure is limited by the viewports of the
UHV setup that cannot sustain higher pressure differences between ambient air and the pressure inside the
vacuum vessel. Therefore, for a safe operation, this approach is limited to 1 bar pressure. The main
advantage of this approach is that it is easy to build and maintain a very robust scanning head, and
therefore it is easier to get atomically resolved images. It is also very easy to exchange tips between
measurements. The main disadvantage is controlling the temperature, as this approach is only applicable
near room temperature because convective heat transfer could also warm the materials in the scanning
head and sample support, causing temperature gradients and thereby thermal drift.
The second way of performing HPSTM experiments is to use a small high-pressure cell inside the
UHV chamber. This approach is technically more difficult, but it has several advantages over the
backfilling approach. First of all, since only a small volume is pressurized, a lot of gas is saved and it is
easier to reach atmospheric pressures. More importantly, it is possible to heat the entire cell and reach
moderate temperatures. Finally, the gas cell will reduce the surface area of the surrounding walls. For
instance, typical contamination at ambient pressure experiments is water molecules emanating from
chamber walls; using a reactor cell with an inert Au-coating might reduce its partial pressure. The
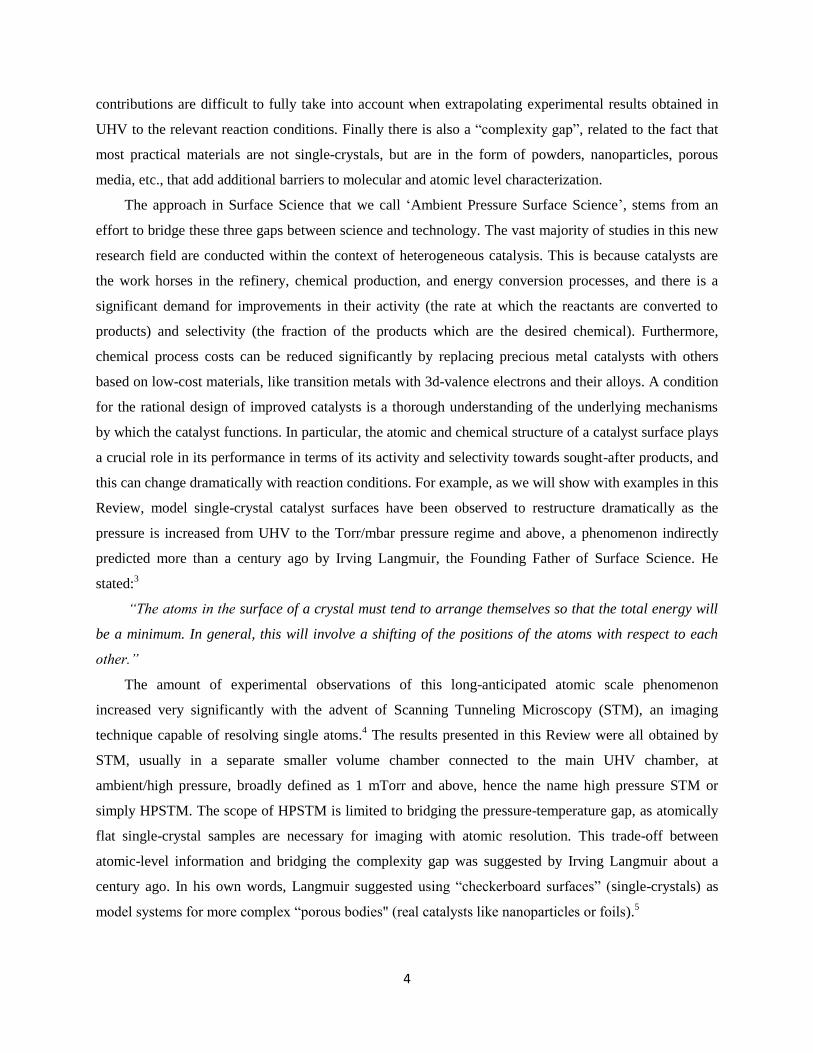
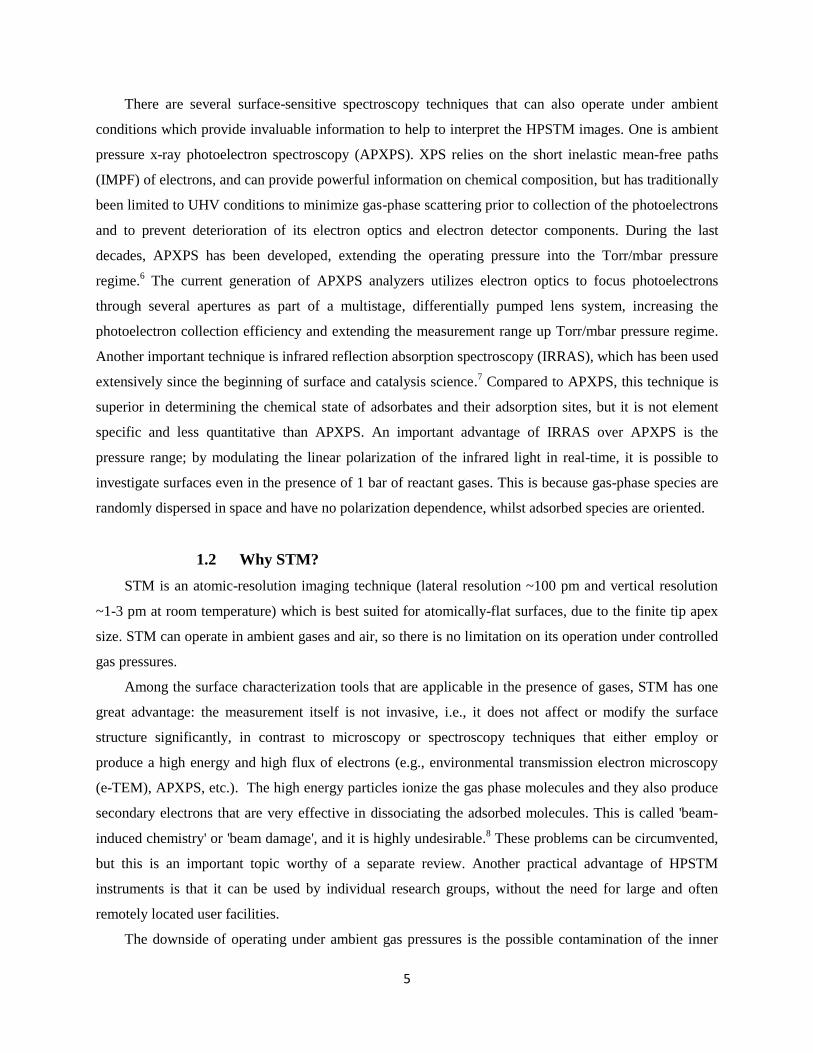
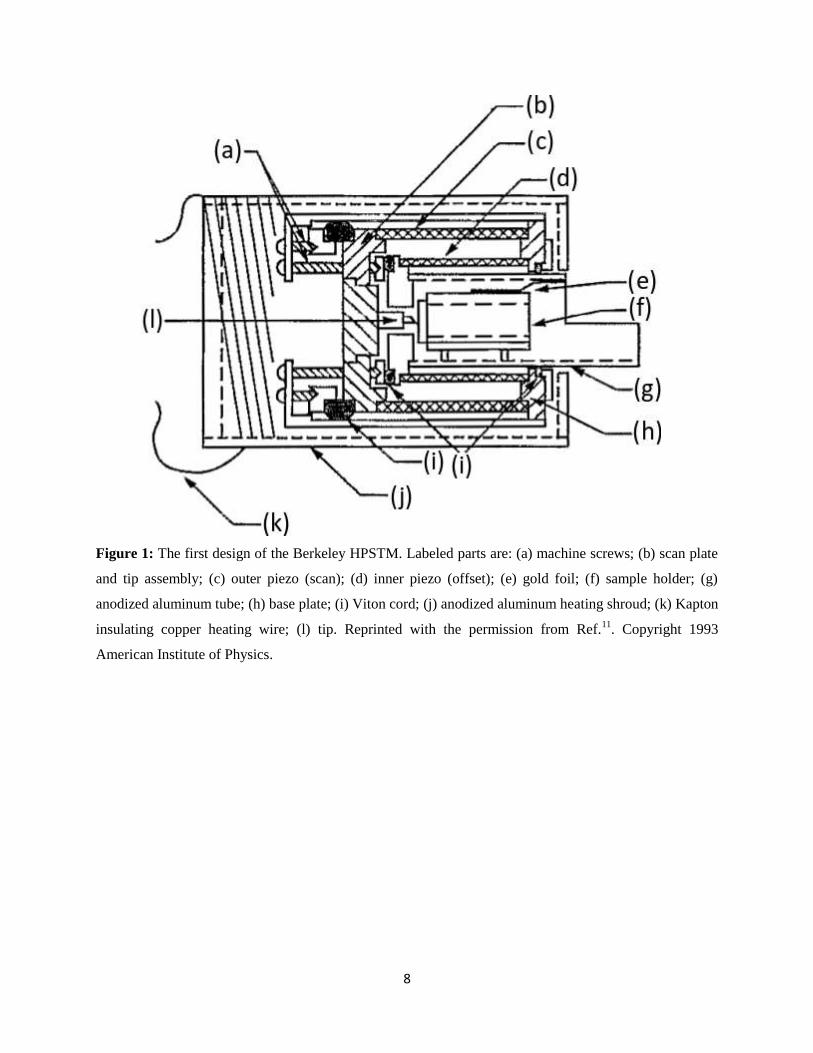
Berkeley HPSTMs and the Aarhus HPSTMs work on this principle.11-13
We show the original designs of
these two HPSTMs in Figures 1 and 2.
8
Figure 1: The first design of the Berkeley HPSTM. Labeled parts are: (a) machine screws; (b) scan plate
and tip assembly; (c) outer piezo (scan); (d) inner piezo (offset); (e) gold foil; (f) sample holder; (g)
anodized aluminum tube; (h) base plate; (i) Viton cord; (j) anodized aluminum heating shroud; (k) Kapton
insulating copper heating wire; (l) tip. Reprinted with the permission from Ref.11
. Copyright 1993
American Institute of Physics.
9
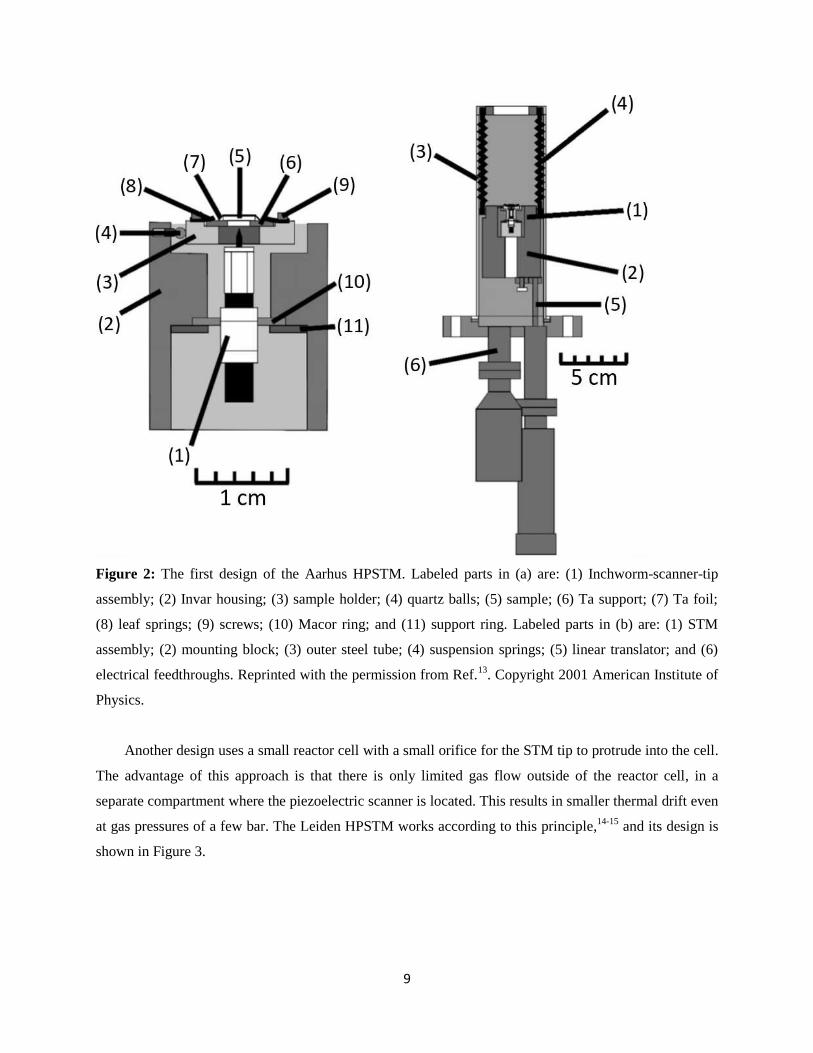
Figure 2: The first design of the Aarhus HPSTM. Labeled parts in (a) are: (1) Inchworm-scanner-tip
assembly; (2) Invar housing; (3) sample holder; (4) quartz balls; (5) sample; (6) Ta support; (7) Ta foil;
(8) leaf springs; (9) screws; (10) Macor ring; and (11) support ring. Labeled parts in (b) are: (1) STM
assembly; (2) mounting block; (3) outer steel tube; (4) suspension springs; (5) linear translator; and (6)
electrical feedthroughs. Reprinted with the permission from Ref.13
. Copyright 2001 American Institute of
Physics.
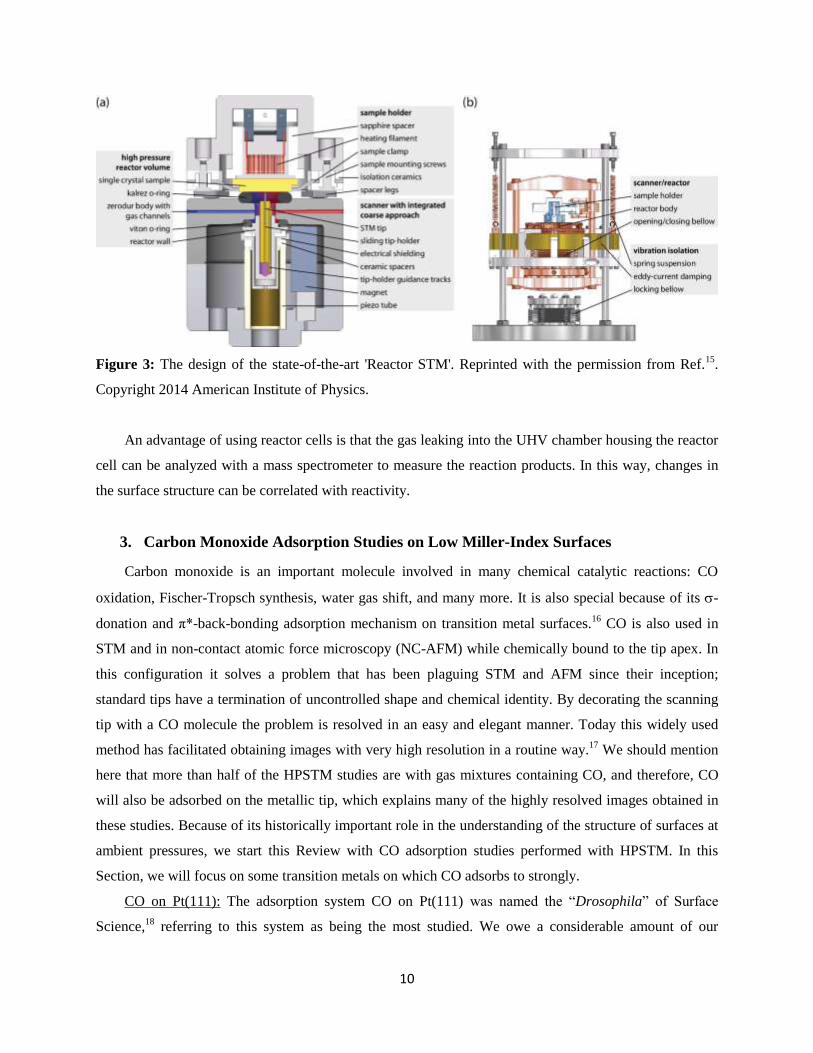
Another design uses a small reactor cell with a small orifice for the STM tip to protrude into the cell.
The advantage of this approach is that there is only limited gas flow outside of the reactor cell, in a
separate compartment where the piezoelectric scanner is located. This results in smaller thermal drift even
at gas pressures of a few bar. The Leiden HPSTM works according to this principle,14-15
and its design is
shown in Figure 3.
10
Figure 3: The design of the state-of-the-art 'Reactor STM'. Reprinted with the permission from Ref.15
.
Copyright 2014 American Institute of Physics.
An advantage of using reactor cells is that the gas leaking into the UHV chamber housing the reactor
cell can be analyzed with a mass spectrometer to measure the reaction products. In this way, changes in
the surface structure can be correlated with reactivity.
3. Carbon Monoxide Adsorption Studies on Low Miller-Index Surfaces
Carbon monoxide is an important molecule involved in many chemical catalytic reactions: CO
oxidation, Fischer-Tropsch synthesis, water gas shift, and many more. It is also special because of its -
donation and π*-back-bonding adsorption mechanism on transition metal surfaces.16
CO is also used in
STM and in non-contact atomic force microscopy (NC-AFM) while chemically bound to the tip apex. In
this configuration it solves a problem that has been plaguing STM and AFM since their inception;
standard tips have a termination of uncontrolled shape and chemical identity. By decorating the scanning
tip with a CO molecule the problem is resolved in an easy and elegant manner. Today this widely used
method has facilitated obtaining images with very high resolution in a routine way.17
We should mention
here that more than half of the HPSTM studies are with gas mixtures containing CO, and therefore, CO
will also be adsorbed on the metallic tip, which explains many of the highly resolved images obtained in
these studies. Because of its historically important role in the understanding of the structure of surfaces at
ambient pressures, we start this Review with CO adsorption studies performed with HPSTM. In this
Section, we will focus on some transition metals on which CO adsorbs to strongly.
CO on Pt(111): The adsorption system CO on Pt(111) was named the “Drosophila” of Surface
Science,18
referring to this system as being the most studied. We owe a considerable amount of our
11
present understanding of the surface-adsorbate interaction, thermodynamics, and kinetics of adsorption to
this specific system. In addition, one of the most impressive structures identified with HPSTM forms
when gas phase CO is in equilibrium with the adsorbed CO molecules on the Pt(111) surface. The
specific binding configurations of adsorbed CO molecules depend on the type of transition metal. In the
case of Pt(111), adsorbed CO takes nonspecific binding positions when the CO pressure is higher than 10-
6 Torr,
19 i.e., the steric repulsion between adjacent chemisorbed CO molecules at a high coverage plays a
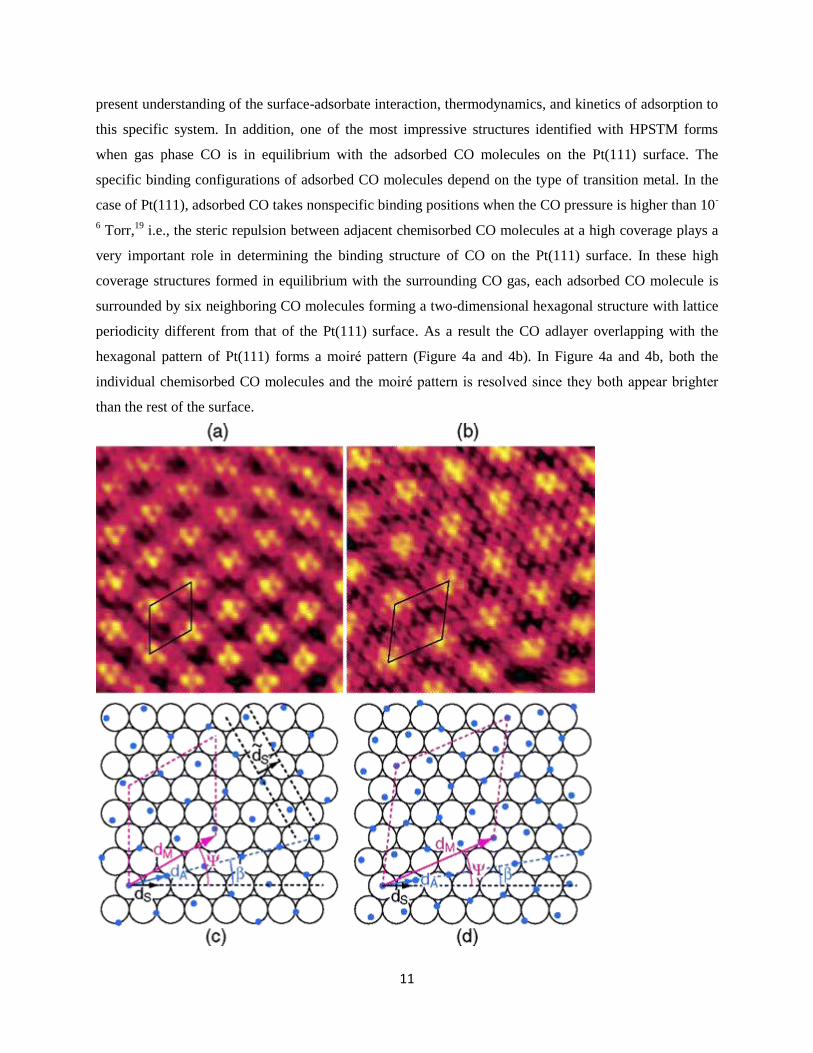
very important role in determining the binding structure of CO on the Pt(111) surface. In these high
coverage structures formed in equilibrium with the surrounding CO gas, each adsorbed CO molecule is
surrounded by six neighboring CO molecules forming a two-dimensional hexagonal structure with lattice
periodicity different from that of the Pt(111) surface. As a result the CO adlayer overlapping with the
hexagonal pattern of Pt(111) forms a moire pattern (Figure 4a and 4b). In Figure 4a and 4b, both the
individual chemisorbed CO molecules and the moire pattern is resolved since they both appear brighter
than the rest of the surface.
12
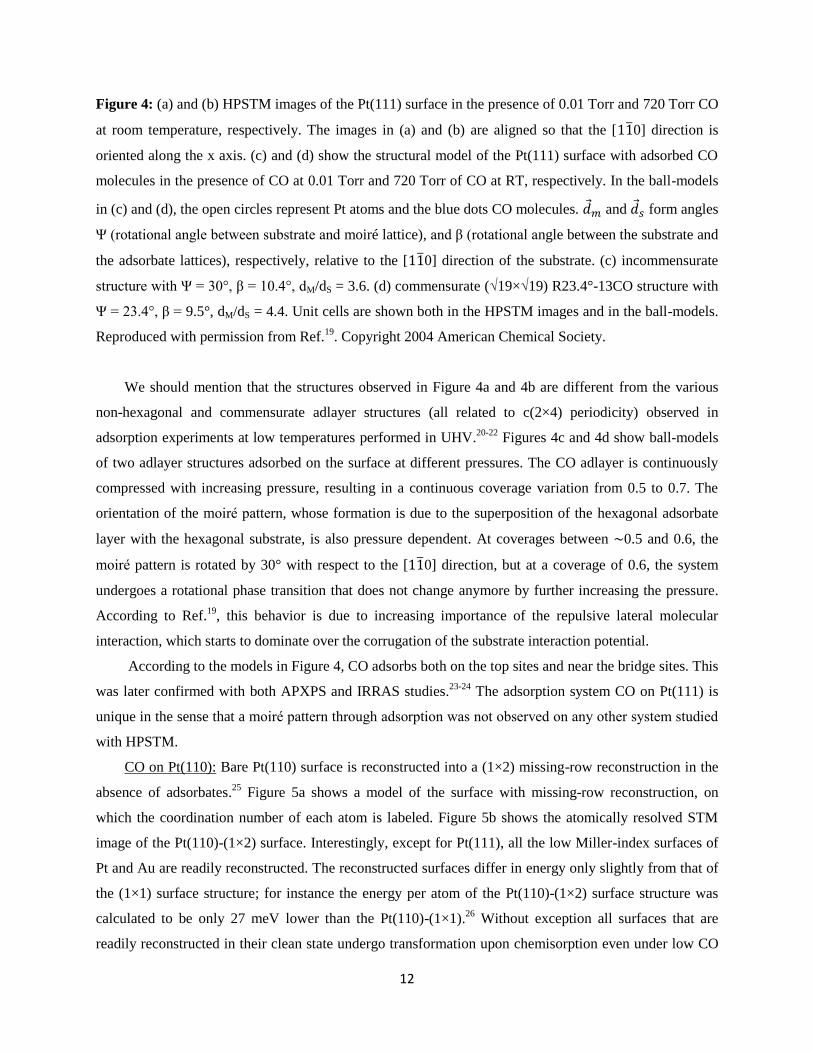
Figure 4: (a) and (b) HPSTM images of the Pt(111) surface in the presence of 0.01 Torr and 720 Torr CO
at room temperature, respectively. The images in (a) and (b) are aligned so that the [110] direction is
oriented along the x axis. (c) and (d) show the structural model of the Pt(111) surface with adsorbed CO
molecules in the presence of CO at 0.01 Torr and 720 Torr of CO at RT, respectively. In the ball-models
in (c) and (d), the open circles represent Pt atoms and the blue dots CO molecules. 𝑑𝑚 and 𝑑𝑠 form angles
Ψ (rotational angle between substrate and moiré lattice), and β (rotational angle between the substrate and
the adsorbate lattices), respectively, relative to the [110] direction of the substrate. (c) incommensurate
structure with Ψ = 30°, β = 10.4°, dM/dS = 3.6. (d) commensurate (√19×√19) R23.4°-13CO structure with
Ψ = 23.4°, β = 9.5°, dM/dS = 4.4. Unit cells are shown both in the HPSTM images and in the ball-models.
Reproduced with permission from Ref.19
. Copyright 2004 American Chemical Society.
We should mention that the structures observed in Figure 4a and 4b are different from the various
non-hexagonal and commensurate adlayer structures (all related to c(2×4) periodicity) observed in
adsorption experiments at low temperatures performed in UHV.20-22
Figures 4c and 4d show ball-models
of two adlayer structures adsorbed on the surface at different pressures. The CO adlayer is continuously
compressed with increasing pressure, resulting in a continuous coverage variation from 0.5 to 0.7. The
orientation of the moire pattern, whose formation is due to the superposition of the hexagonal adsorbate
layer with the hexagonal substrate, is also pressure dependent. At coverages between ∼0.5 and 0.6, the
moire pattern is rotated by 30° with respect to the [110] direction, but at a coverage of 0.6, the system
undergoes a rotational phase transition that does not change anymore by further increasing the pressure.
According to Ref.19
, this behavior is due to increasing importance of the repulsive lateral molecular
interaction, which starts to dominate over the corrugation of the substrate interaction potential.
According to the models in Figure 4, CO adsorbs both on the top sites and near the bridge sites. This
was later confirmed with both APXPS and IRRAS studies.23-24
The adsorption system CO on Pt(111) is
unique in the sense that a moire pattern through adsorption was not observed on any other system studied
with HPSTM.
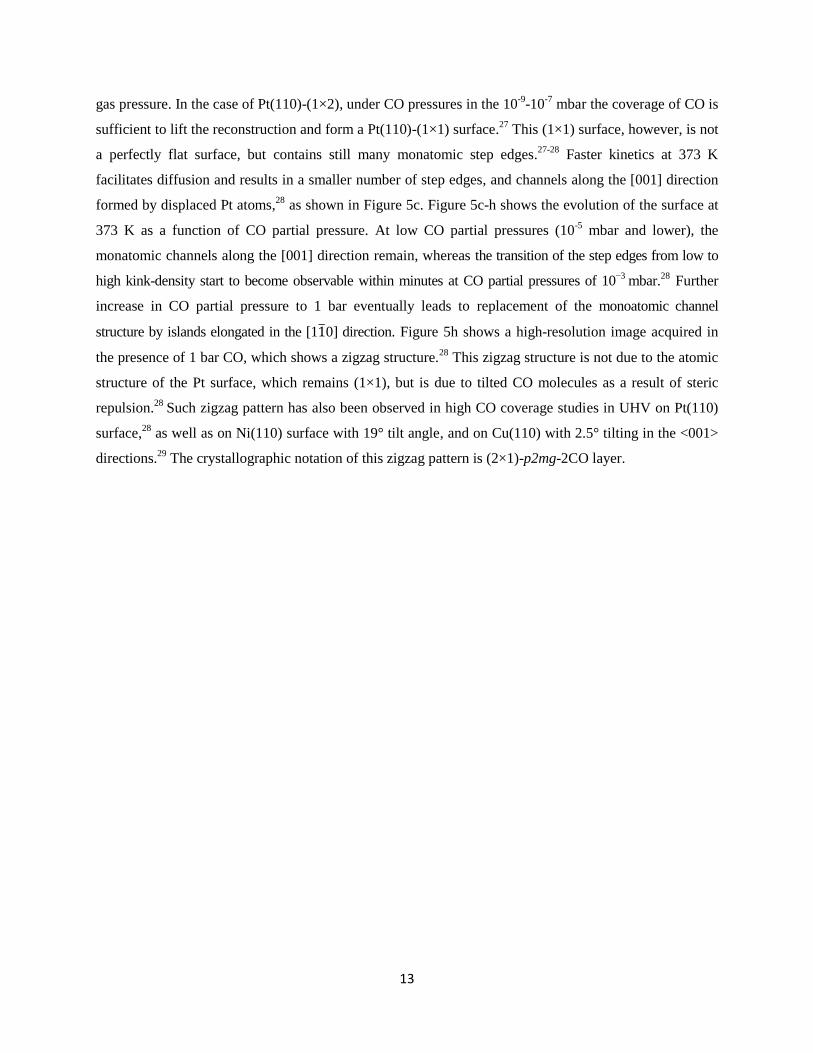
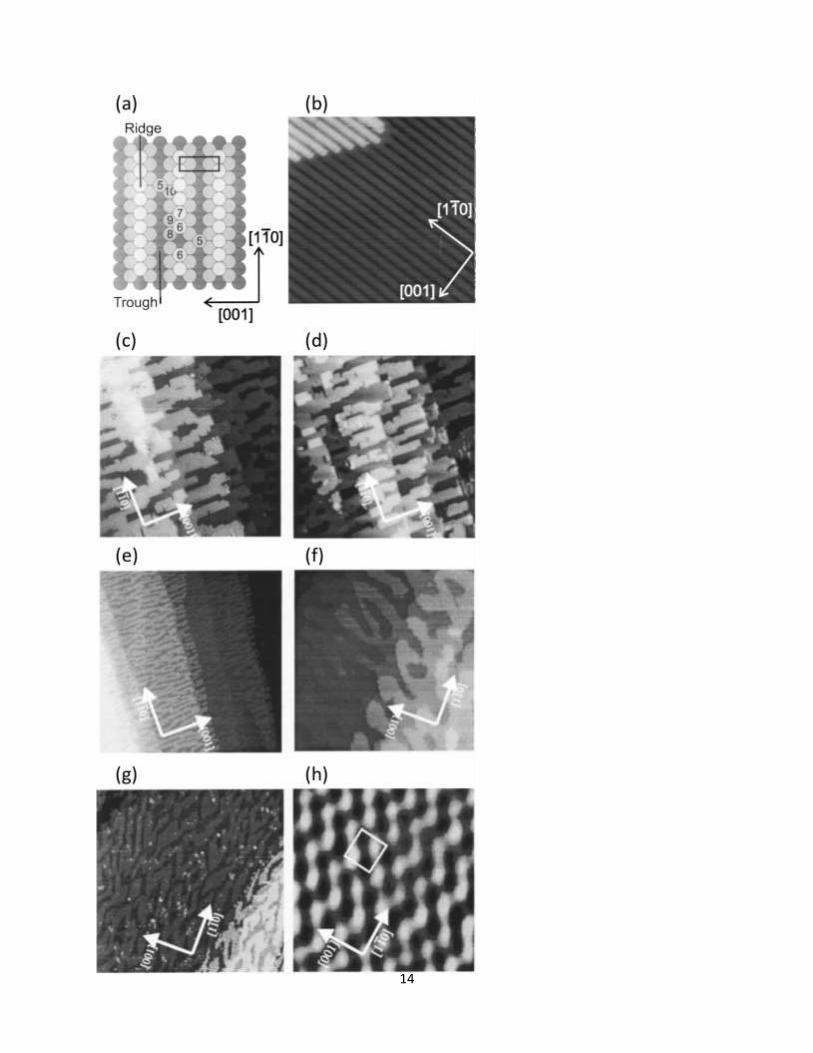
CO on Pt(110): Bare Pt(110) surface is reconstructed into a (1×2) missing-row reconstruction in the
absence of adsorbates.25
Figure 5a shows a model of the surface with missing-row reconstruction, on
which the coordination number of each atom is labeled. Figure 5b shows the atomically resolved STM
image of the Pt(110)-(1×2) surface. Interestingly, except for Pt(111), all the low Miller-index surfaces of
Pt and Au are readily reconstructed. The reconstructed surfaces differ in energy only slightly from that of
the (1×1) surface structure; for instance the energy per atom of the Pt(110)-(1×2) surface structure was
calculated to be only 27 meV lower than the Pt(110)-(1×1).26
Without exception all surfaces that are
readily reconstructed in their clean state undergo transformation upon chemisorption even under low CO
13
gas pressure. In the case of Pt(110)-(1×2), under CO pressures in the 10-9
-10-7
mbar the coverage of CO is
sufficient to lift the reconstruction and form a Pt(110)-(1×1) surface.27
This (1×1) surface, however, is not
a perfectly flat surface, but contains still many monatomic step edges.27-28
Faster kinetics at 373 K
facilitates diffusion and results in a smaller number of step edges, and channels along the [001] direction
formed by displaced Pt atoms,28
as shown in Figure 5c. Figure 5c-h shows the evolution of the surface at
373 K as a function of CO partial pressure. At low CO partial pressures (10-5
mbar and lower), the
monatomic channels along the [001] direction remain, whereas the transition of the step edges from low to
high kink-density start to become observable within minutes at CO partial pressures of 10−3
mbar.28
Further
increase in CO partial pressure to 1 bar eventually leads to replacement of the monoatomic channel
structure by islands elongated in the [110] direction. Figure 5h shows a high-resolution image acquired in
the presence of 1 bar CO, which shows a zigzag structure.28
This zigzag structure is not due to the atomic
structure of the Pt surface, which remains (1×1), but is due to tilted CO molecules as a result of steric
repulsion.28
Such zigzag pattern has also been observed in high CO coverage studies in UHV on Pt(110)
surface,28
as well as on Ni(110) surface with 19° tilt angle, and on Cu(110) with 2.5° tilting in the <001>
directions.29
The crystallographic notation of this zigzag pattern is (2×1)-p2mg-2CO layer.
14
15
Figure 5: (a) The atomic model of the Pt(110)-(2×1) surface. (b) STM image of the Pt(110)-(2×1) surface
in UHV at room temperature (14.1×15.5 nm2). HPSTM images of Pt(110) at different CO pressures: (c)
10-7
mbar CO, (30×30 nm2); (d) 10
-6 mbar CO, (30×30 nm
2); (e) 10
-5 mbar CO, (100×100 nm
2); (f) 10
-2
mbar, (70×70 nm2); (g) 1000 mbar CO (90×90 nm
2); and (h) 1000 mbar CO (2.8×2.8 nm
2). The contrast
in (c-g) originates from the monatomic height differences, whereas the contrast in (h) originates from the
tilted CO molecules on the surface. The images (c)-(h) were obtained at 373 K. Reproduced with
permission from Ref.28
. Copyright 2004 American Institute of Physics.
The authors of Ref.28
explain the structural changes on the surface using DFT calculations, which suggest
that the gain in CO binding energy on a low-coordinated step edge site relative to the high coordination terrace
sites is similar to the formation energy of step edges. Thus, at finite temperatures step edges will form due to the
higher entropy of a stepped surface. At low CO coverage, kink formation is not energetically favorable, while at
a CO coverage close to saturation, CO starts to adsorb also on high-coordinated Pt atoms in the second-layer,
and the energy gained in the kink-free channel structure vanishes. Entropic effects are then manifested as kinked
step edges.
This work on CO/Pt(110) is the first in the literature where roughening of the surface was observed
with atomic-resolution real-space images,28
and therefore carries a significant importance in terms of our
present understanding of the equilibrium structure of surfaces in the presence of gases. The roughening
geometry in this case proceeds via monoatomic channel formation. In the next case, we will see
roughening of the surface by the break-up of the surface layer into two-dimensional nanoclusters.
CO on Pt(100): Similar to the Pt(110) surface, Pt(100) surface is also readily reconstructed in UHV:
Instead of a square (1×1) structure, the surface overlayer forms a quasi-hexagonal structure with 6 Pt
atoms residing on top of 5 Pt atoms of the subsurface layers. In fact, the existence of such a special
surface structure was already suggested more than half a century ego in one of the earliest Surface
Science studies in UHV.30
Figure 6a shows a model of the quasi-hex-Pt(100) surface, and Figure 6b
shows a sample STM image acquired in UHV at room temperature. It is well established that
chemisorption of CO lifts this reconstruction so that the topmost Pt atoms form a square lattice
structure.31-36
Some of these studies were performed using LEED in UHV,32,34-36
which provides
crystallographic information of the ordered part of the surface when the domain dimensions are larger
than the coherence length of the electron beam. Smaller domains, however, would give rise to broadened
diffraction spots, which would make crystallographic analysis of the structure more difficult.
Additionally, in most cases, the surfaces were examined after pumping away the CO gas, which results in
desorption of the more weakly bound CO molecules.
16
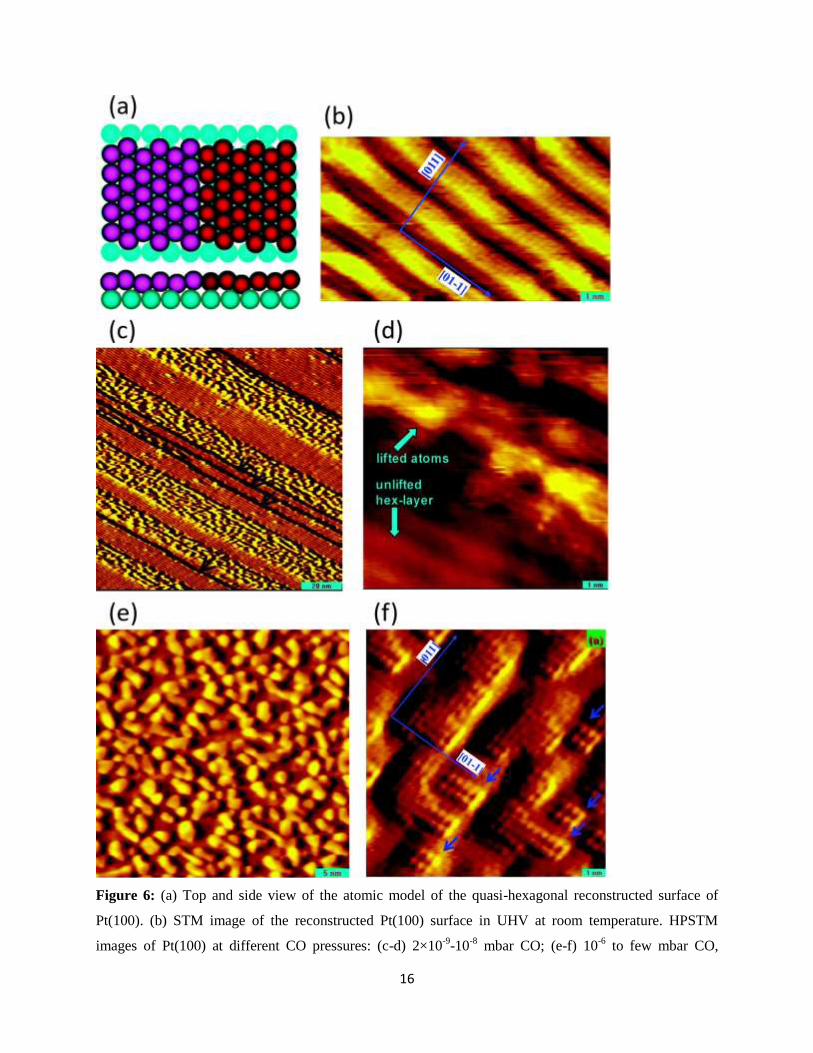
Figure 6: (a) Top and side view of the atomic model of the quasi-hexagonal reconstructed surface of
Pt(100). (b) STM image of the reconstructed Pt(100) surface in UHV at room temperature. HPSTM
images of Pt(100) at different CO pressures: (c-d) 2×10⁻⁹
-10-8
mbar CO; (e-f) 10-6
to few mbar CO,
17
(38×36 nm2) and (10×10 nm
2). Images were obtained at room temperature. While (c) and (d) show the
lifting of the reconstruction, (e) and (f) show formation of Pt clusters on the surface. Reproduced with
permission from Ref.37
. Copyright 2009 American Chemical Society.
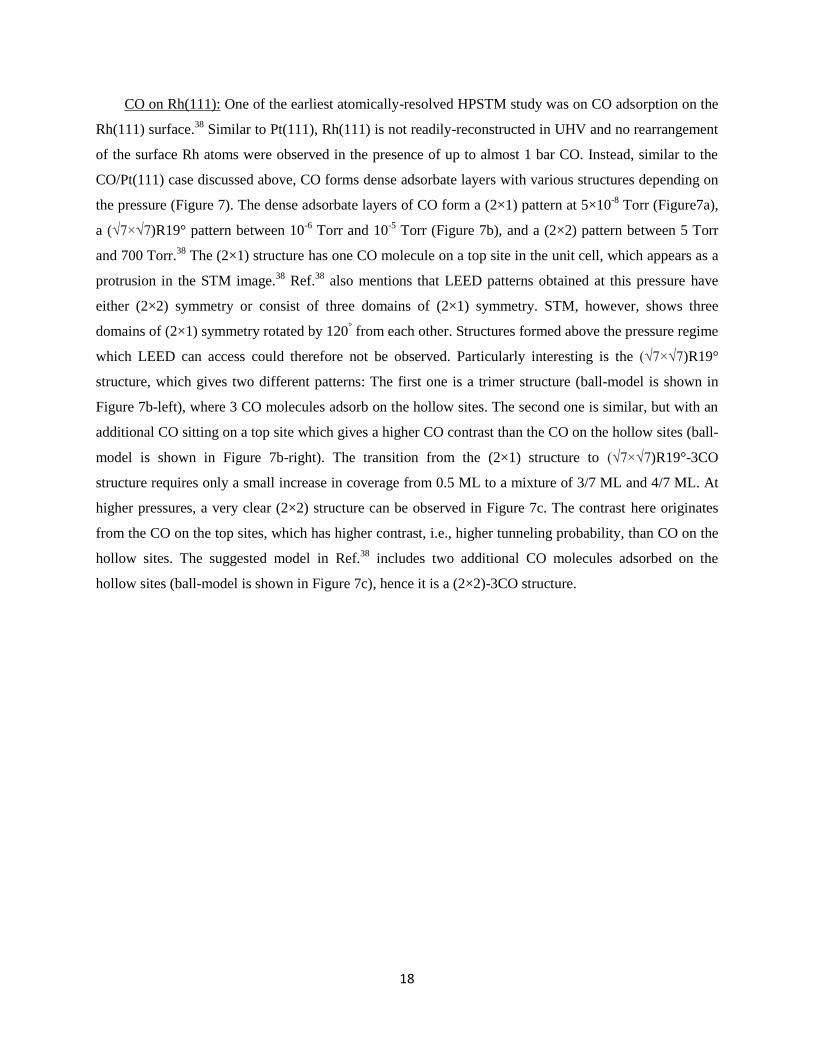
An earlier STM study of the quasi-hex-Pt(100) after dosing a few Langmuir (one Langmuir is equal
to 10-6
Torr·s of exposure) of CO suggested clusters of CO to form on patches of Pt(100)-(1×1).33
The
authors of Ref.33
suggested adsorbed CO to be trapped on the (1×1) patches due to the difference in
stability of CO on Pt(100)-(1×1) and quasi-hex-Pt(100) surfaces. A more recent HPSTM study agrees that
CO lifts the quasi-hex-reconstruction (Figures 6c and 6d), but the authors propose another mechanism
where the 20% extra Pt atoms on the surface diffuse and form rectangular clusters on the surface covered
by CO molecules (Figures 6e and 6f).37
In other words, whilst Ref.33
suggests purely CO clusters, Ref.37
suggests CO covered Pt-clusters on the surface. In the latter model, chemisorbed CO molecules at the
edge of the clusters fan out away from the cluster due to steric hindrance between neighboring CO
molecules. The total number of bright spots in Figure 6f corresponds to 23% of the area, close to the
expected 20% in the model. The total area of the two-dimensional Pt-cluster coverage is 45%, but the
clusters appear larger than they are due to the tilt of the CO molecules on the step edges. More examples
of decoration of cluster edges with tilted CO molecules are seen in other studies discussed later in this
Review.
There is a discrepancy between the proposed model based on HPSTM images, and the (2×2)
structure observed by LEED after exposing the Pt(100) to CO.32,34-36
The structure revealed by LEED
refers to the large coherent domains between the small islands, whereas STM detects the top of the two-
dimensional clusters. These clusters, because of their small size, should contribute mostly to the
background in the diffraction pattern.37
To summarize the CO adsorption experiments on low Miller-index Pt surfaces: on both Pt(100) and
Pt(110), the initially reconstructed surfaces undergo large structural changes in the presence of CO, both
at low and at high pressures (1 mbar and above). The Pt(110) and Pt(100) are readily-reconstructed
surfaces, and one should expect that such reconstructions would be lifted thanks to the energy provided
by the exothermic adsorption of CO molecules on the surface. In fact, no roughening was observed on the
unreconstructed Pt(111) surface consisting of large and flat (111) domains. Instead, a dense adlayer of
adsorbed CO molecules covered the surface. These observations bring into question whether there are
other transition metal surfaces where an unreconstructed and compact (1×1) surface can also undergo
massive transformations in the presence of gases. The answer is yes, as explained in a later section of this
Review.
18
CO on Rh(111): One of the earliest atomically-resolved HPSTM study was on CO adsorption on the
Rh(111) surface.38
Similar to Pt(111), Rh(111) is not readily-reconstructed in UHV and no rearrangement
of the surface Rh atoms were observed in the presence of up to almost 1 bar CO. Instead, similar to the
CO/Pt(111) case discussed above, CO forms dense adsorbate layers with various structures depending on
the pressure (Figure 7). The dense adsorbate layers of CO form a (2×1) pattern at 5×10⁻⁸
Torr (Figure7a),
a (√7×√7)R19° pattern between 10-6
Torr and 10-5
Torr (Figure 7b), and a (2×2) pattern between 5 Torr
and 700 Torr.38
The (2×1) structure has one CO molecule on a top site in the unit cell, which appears as a
protrusion in the STM image.38
Ref.38
also mentions that LEED patterns obtained at this pressure have
either (2×2) symmetry or consist of three domains of (2×1) symmetry. STM, however, shows three
domains of (2×1) symmetry rotated by 120° from each other. Structures formed above the pressure regime
which LEED can access could therefore not be observed. Particularly interesting is the (√7×√7)R19°
structure, which gives two different patterns: The first one is a trimer structure (ball-model is shown in
Figure 7b-left), where 3 CO molecules adsorb on the hollow sites. The second one is similar, but with an
additional CO sitting on a top site which gives a higher CO contrast than the CO on the hollow sites (ball-
model is shown in Figure 7b-right). The transition from the (2×1) structure to (√7×√7)R19°-3CO
structure requires only a small increase in coverage from 0.5 ML to a mixture of 3/7 ML and 4/7 ML. At
higher pressures, a very clear (2×2) structure can be observed in Figure 7c. The contrast here originates
from the CO on the top sites, which has higher contrast, i.e., higher tunneling probability, than CO on the
hollow sites. The suggested model in Ref.38
includes two additional CO molecules adsorbed on the
hollow sites (ball-model is shown in Figure 7c), hence it is a (2×2)-3CO structure.
19
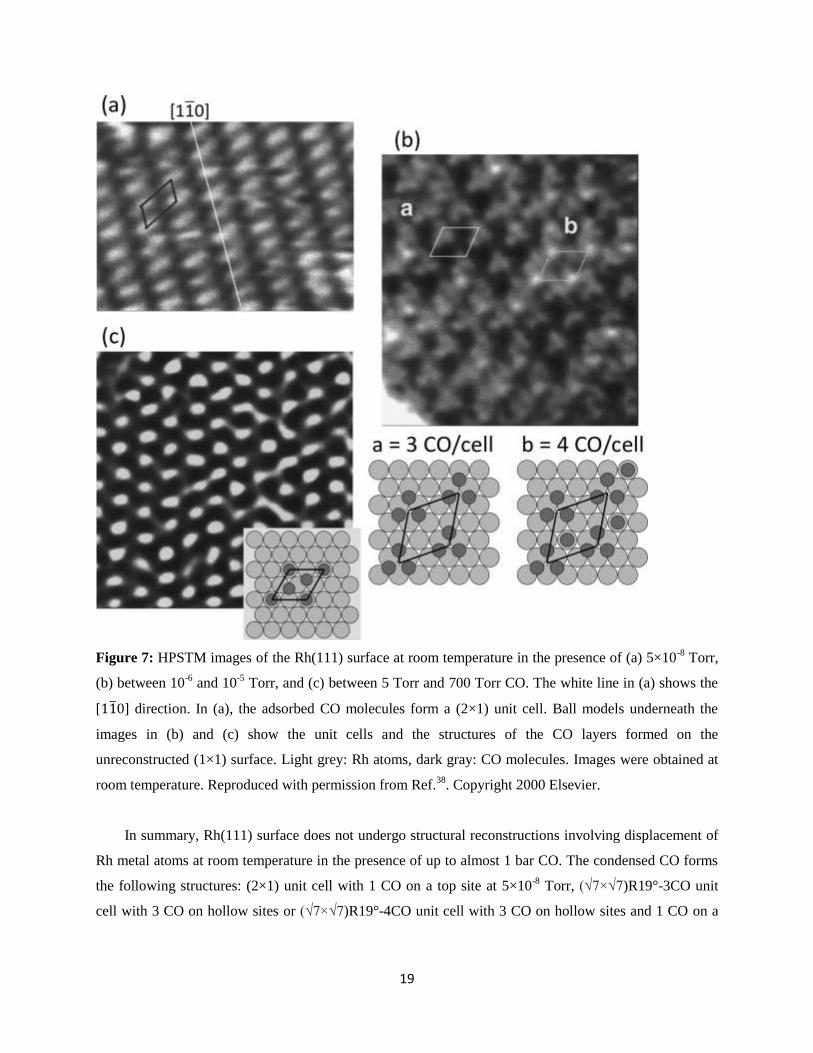
Figure 7: HPSTM images of the Rh(111) surface at room temperature in the presence of (a) 5×10⁻⁸
Torr,
(b) between 10-6
and 10-5
Torr, and (c) between 5 Torr and 700 Torr CO. The white line in (a) shows the
[110] direction. In (a), the adsorbed CO molecules form a (2×1) unit cell. Ball models underneath the
images in (b) and (c) show the unit cells and the structures of the CO layers formed on the
unreconstructed (1×1) surface. Light grey: Rh atoms, dark gray: CO molecules. Images were obtained at
room temperature. Reproduced with permission from Ref.38
. Copyright 2000 Elsevier.
In summary, Rh(111) surface does not undergo structural reconstructions involving displacement of
Rh metal atoms at room temperature in the presence of up to almost 1 bar CO. The condensed CO forms
the following structures: (2×1) unit cell with 1 CO on a top site at 5×10⁻⁸
Torr, (√7×√7)R19°-3CO unit
cell with 3 CO on hollow sites or (√7×√7)R19°-4CO unit cell with 3 CO on hollow sites and 1 CO on a
20
top site at 10-5
Torr-10-6
Torr, and (2×2)-3CO unit cell with 2 CO on hollow sites and 1 CO on a top site
at 5 Torr and above.38
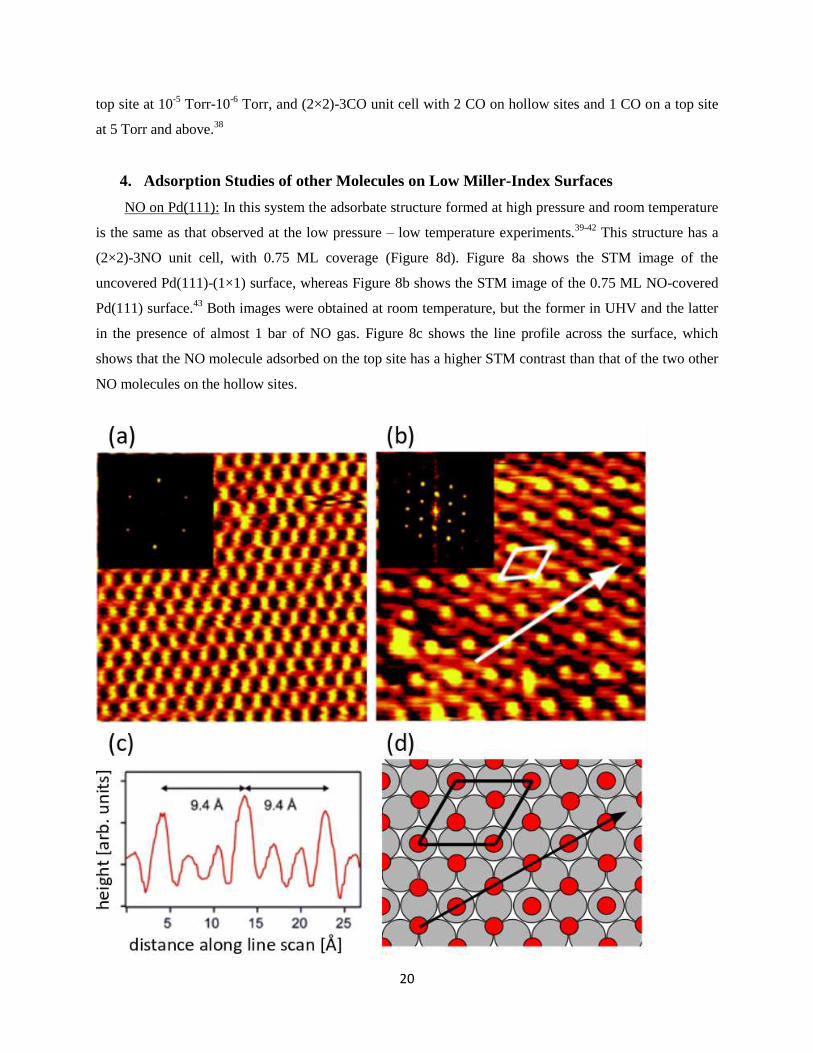
4. Adsorption Studies of other Molecules on Low Miller-Index Surfaces
NO on Pd(111): In this system the adsorbate structure formed at high pressure and room temperature
is the same as that observed at the low pressure – low temperature experiments.39-42
This structure has a
(2×2)-3NO unit cell, with 0.75 ML coverage (Figure 8d). Figure 8a shows the STM image of the
uncovered Pd(111)-(1×1) surface, whereas Figure 8b shows the STM image of the 0.75 ML NO-covered
Pd(111) surface.43
Both images were obtained at room temperature, but the former in UHV and the latter
in the presence of almost 1 bar of NO gas. Figure 8c shows the line profile across the surface, which
shows that the NO molecule adsorbed on the top site has a higher STM contrast than that of the two other
NO molecules on the hollow sites.
21
Figure 8: (a) STM image of the bare Pd(111) surface. (b) HPSTM image of the Pd(111) surface in the
presence of 720 Torr NO. Both images are acquired at room temperature. The surface in (b) exhibits a
(2×2) symmetry originating from the CO molecules attached to the surface, as shown in the ball-model
(Pd: grey, NO: red) in (d). 3 NO molecules reside inside the (2×2) unit cell, 2 of them on the hollow sites
and 1 of them on the top site. Top site NO molecules have a higher tunneling contrast then the NO
molecules in the hollow sites, as shown in (c). Reproduced with permission from Ref.43
. Copyright 2005
American Chemical Society.
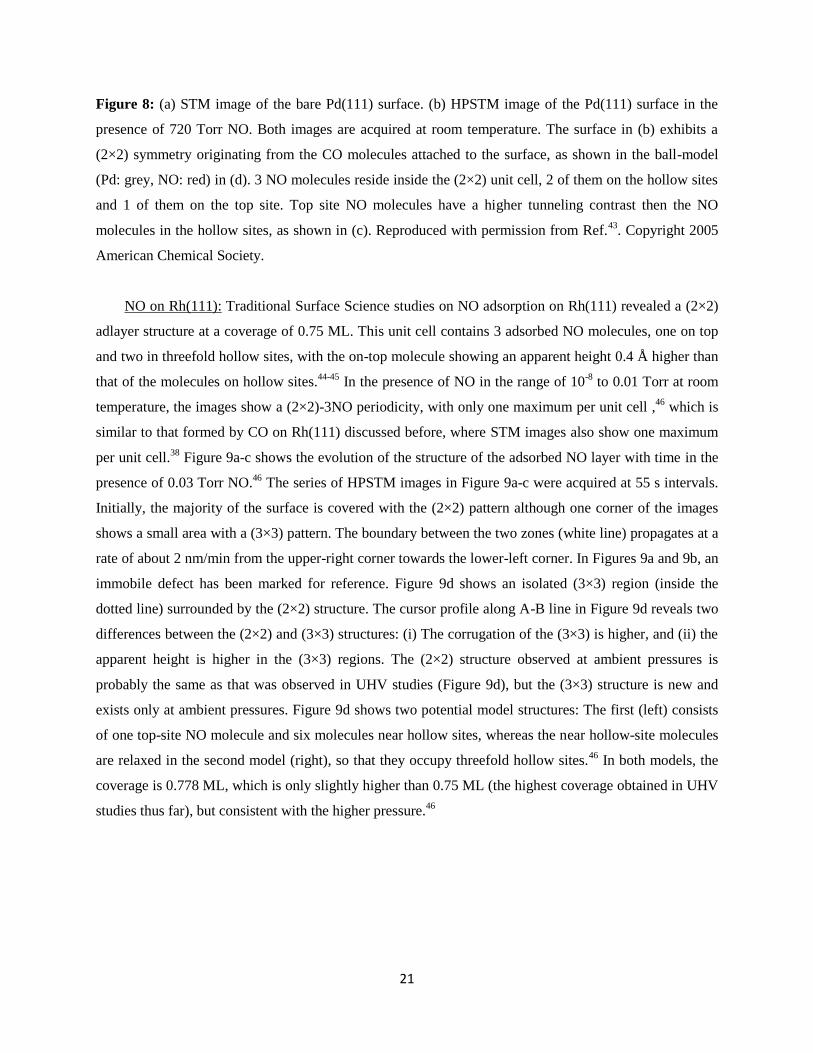
NO on Rh(111): Traditional Surface Science studies on NO adsorption on Rh(111) revealed a (2×2)
adlayer structure at a coverage of 0.75 ML. This unit cell contains 3 adsorbed NO molecules, one on top
and two in threefold hollow sites, with the on-top molecule showing an apparent height 0.4 Å higher than
that of the molecules on hollow sites.44-45
In the presence of NO in the range of 10-8
to 0.01 Torr at room
temperature, the images show a (2×2)-3NO periodicity, with only one maximum per unit cell ,46
which is
similar to that formed by CO on Rh(111) discussed before, where STM images also show one maximum
per unit cell.38
Figure 9a-c shows the evolution of the structure of the adsorbed NO layer with time in the
presence of 0.03 Torr NO.46
The series of HPSTM images in Figure 9a-c were acquired at 55 s intervals.
Initially, the majority of the surface is covered with the (2×2) pattern although one corner of the images
shows a small area with a (3×3) pattern. The boundary between the two zones (white line) propagates at a
rate of about 2 nm/min from the upper-right corner towards the lower-left corner. In Figures 9a and 9b, an
immobile defect has been marked for reference. Figure 9d shows an isolated (3×3) region (inside the
dotted line) surrounded by the (2×2) structure. The cursor profile along A-B line in Figure 9d reveals two
differences between the (2×2) and (3×3) structures: (i) The corrugation of the (3×3) is higher, and (ii) the
apparent height is higher in the (3×3) regions. The (2×2) structure observed at ambient pressures is
probably the same as that was observed in UHV studies (Figure 9d), but the (3×3) structure is new and
exists only at ambient pressures. Figure 9d shows two potential model structures: The first (left) consists
of one top-site NO molecule and six molecules near hollow sites, whereas the near hollow-site molecules
are relaxed in the second model (right), so that they occupy threefold hollow sites.46
In both models, the
coverage is 0.778 ML, which is only slightly higher than 0.75 ML (the highest coverage obtained in UHV
studies thus far), but consistent with the higher pressure.46
22
Figure 9: HPSTM images of the Rh(111) surface in the presence of 0.3 Torr NO at room temperature. (a-
c) shows the evolution of the surface covered initially with a (2×2)-3NO layer, which is replaced by the
(3×3)-7NO. (d) shows an island of the (3×3)-7NO structure inside the (2×2)-3NO zone. The line profile
along the A and B points are also sown, with the (3×3)-7NO zone having a higher corrugation and higher
apparent height compared to the (2×2)-3NO zone. There are two potential arrangements of the NO
molecules on the surface that can result in the observed (3×3) pattern, which are shown in the ball-
models. Light grey: Rh atoms, dark gray: NO molecules. Both in (2×2) and (3×3) patterns, the STM
contrast originates from the NO molecules on the top sites. Reproduced with permission from Ref.46
.
Copyright 2001 American Institute of Physics.
23
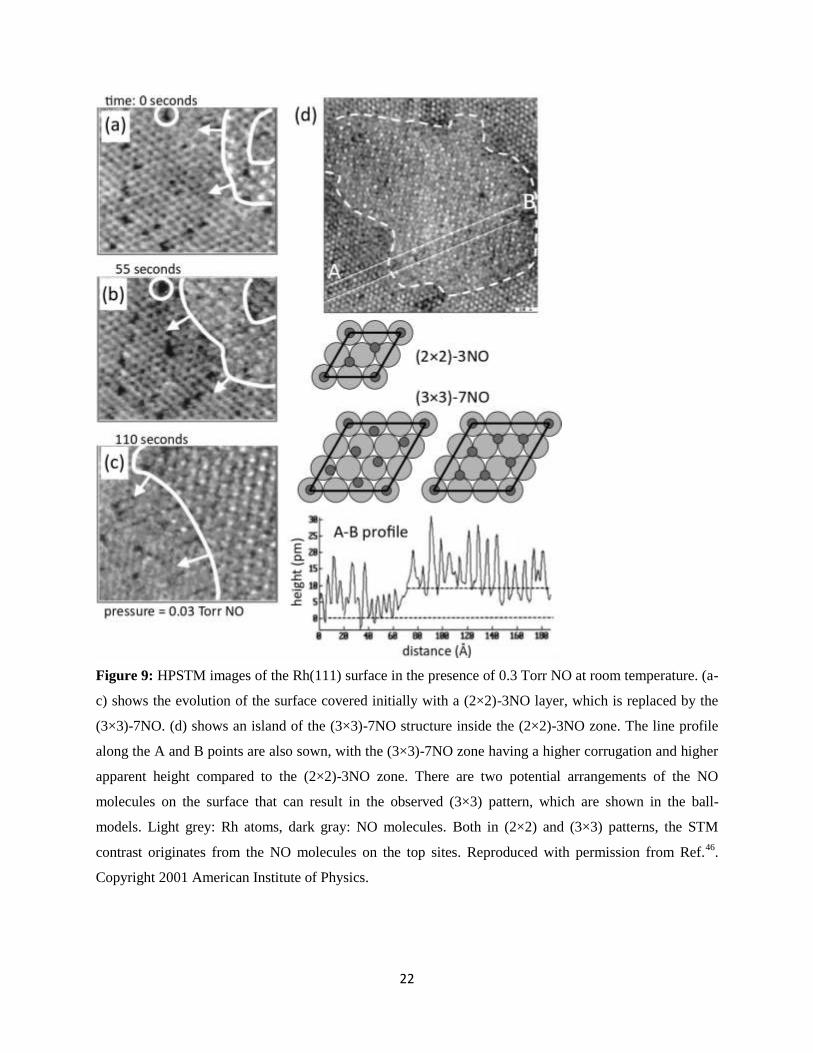
Ethylene on Pt(100): Ethylene hydrogenation is a model reaction for alkene to alkane conversion
studies. On Pt catalysts, this reaction is considered as structure insensitive as the turnover rate is found to
be independent of the Pt catalyst structure.47-48
We will deal with the ethylene and hydrogen co-adsorption
on Pt surfaces in a later section, and here we only focus on the ethylene adsorption. UHV studies of
ethylene adsorption on the quasi-hexagonal Pt(100) surface suggest that at 120 K, C2H4 adsorbs
molecularly as a di-σ-bonded complex, favoring the 3-fold hollow sites at the surface.49
At 350 K, all the
di-σ-bonded ethylene rearranges to ethylidyne that also resides at the 3-fold hollow sites. Vibrational
spectroscopy studies in the presence of 35 Torr ethylene have shown that both ethylidyne and di-σ-
bonded ethylene are present on the Pt(100) surface.50
At catalytically active temperatures and pressures,
the pathway for ethylene hydrogenation involves the π-bonded ethylene species, whereas the
hydrogenation of ethylidyne and di-σ-bonded ethylene occurs relatively slowly.50
Structural studies in
UHV suggest that ethylene adsorption lifts the quasi-hexagonal reconstruction,51-53
just as in the
previously discussed case of CO adsorption lifting this reconstruction both in UHV and at ambient
pressures.28
The HPSTM studies, however, question this interpretation.54
Figure 10a shows the STM
image of the Pt(100) surface in the presence of 5×10⁻⁶
Torr ethylene where the surface appears broken up
into clusters of (1×1) domains, as previous studies predicted. Once the ethylene pressure is increased to 1
Torr, the surface structure remains similar (Figure 10b).54
Interestingly, however, if 1 Torr ethylene is
dosed directly (i.e., without keeping with the sample in the 5×10⁻⁶
Torr ethylene environment), the quasi-
hexagonal structure remains unchanged to a large extent (Figure 10c).54
The discrepancy between the two
observations is attributed to contamination with CO, which as we previously mentioned can lift the quasi-
hexagonal reconstruction of the surface even at very low pressure.28
In the present case, the increase in the
partial pressure of background CO in the UHV chamber after dosing ethylene, is very low but still
sufficient to cause structural changes. However, once a complete layer of ethylidyne and di-σ-bonded
ethylene covers the surface (measured with APXPS spectra in Ref.54
), it prevents the subsequent
adsorption of background CO, thereby preserving the quasi-hexagonal structure.54
24
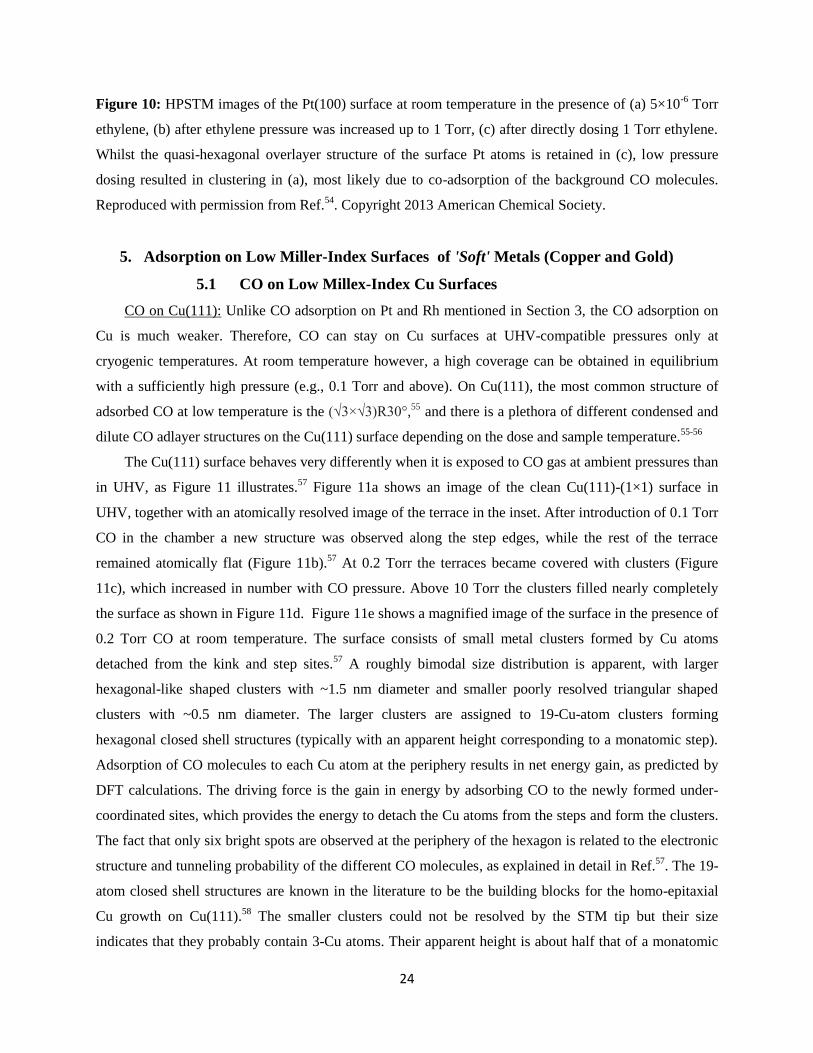
Figure 10: HPSTM images of the Pt(100) surface at room temperature in the presence of (a) 5×10⁻⁶
Torr
ethylene, (b) after ethylene pressure was increased up to 1 Torr, (c) after directly dosing 1 Torr ethylene.
Whilst the quasi-hexagonal overlayer structure of the surface Pt atoms is retained in (c), low pressure
dosing resulted in clustering in (a), most likely due to co-adsorption of the background CO molecules.
Reproduced with permission from Ref.54
. Copyright 2013 American Chemical Society.
5. Adsorption on Low Miller-Index Surfaces of 'Soft' Metals (Copper and Gold)
5.1 CO on Low Millex-Index Cu Surfaces
CO on Cu(111): Unlike CO adsorption on Pt and Rh mentioned in Section 3, the CO adsorption on
Cu is much weaker. Therefore, CO can stay on Cu surfaces at UHV-compatible pressures only at
cryogenic temperatures. At room temperature however, a high coverage can be obtained in equilibrium
with a sufficiently high pressure (e.g., 0.1 Torr and above). On Cu(111), the most common structure of
adsorbed CO at low temperature is the (√3×√3)R30°,55 and there is a plethora of different condensed and
dilute CO adlayer structures on the Cu(111) surface depending on the dose and sample temperature.55-56
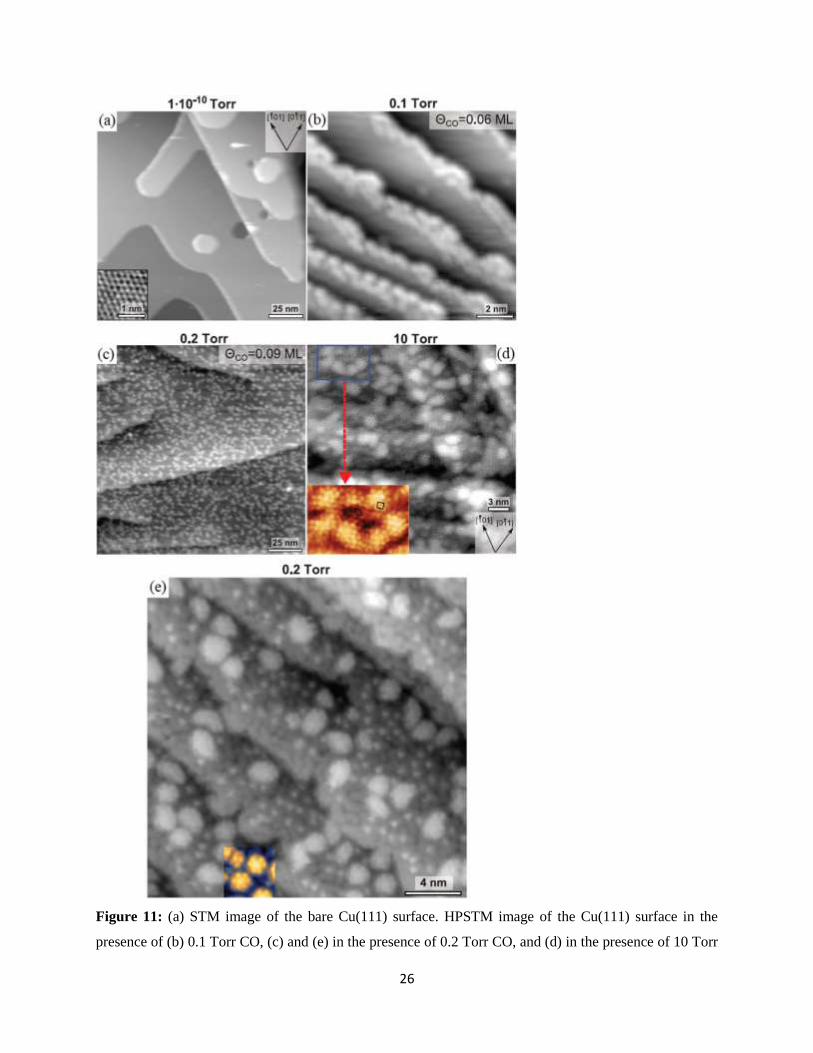
The Cu(111) surface behaves very differently when it is exposed to CO gas at ambient pressures than
in UHV, as Figure 11 illustrates.57
Figure 11a shows an image of the clean Cu(111)-(1×1) surface in
UHV, together with an atomically resolved image of the terrace in the inset. After introduction of 0.1 Torr
CO in the chamber a new structure was observed along the step edges, while the rest of the terrace
remained atomically flat (Figure 11b).57
At 0.2 Torr the terraces became covered with clusters (Figure
11c), which increased in number with CO pressure. Above 10 Torr the clusters filled nearly completely
the surface as shown in Figure 11d. Figure 11e shows a magnified image of the surface in the presence of
0.2 Torr CO at room temperature. The surface consists of small metal clusters formed by Cu atoms
detached from the kink and step sites.57
A roughly bimodal size distribution is apparent, with larger
hexagonal-like shaped clusters with ~1.5 nm diameter and smaller poorly resolved triangular shaped
clusters with ~0.5 nm diameter. The larger clusters are assigned to 19-Cu-atom clusters forming
hexagonal closed shell structures (typically with an apparent height corresponding to a monatomic step).
Adsorption of CO molecules to each Cu atom at the periphery results in net energy gain, as predicted by
DFT calculations. The driving force is the gain in energy by adsorbing CO to the newly formed under-
coordinated sites, which provides the energy to detach the Cu atoms from the steps and form the clusters.
The fact that only six bright spots are observed at the periphery of the hexagon is related to the electronic
structure and tunneling probability of the different CO molecules, as explained in detail in Ref.57
. The 19-
atom closed shell structures are known in the literature to be the building blocks for the homo-epitaxial
Cu growth on Cu(111).58
The smaller clusters could not be resolved by the STM tip but their size
indicates that they probably contain 3-Cu atoms. Their apparent height is about half that of a monatomic
25
step, as found also in other UHV studies.59
The clusters are not static with time, but fluctuate by
coalescing with other clusters or by adding atoms and also splitting in two in time scales of minutes, as
evidenced with time-lapse HPSTM images that could be captured thanks to the slow kinetics of the
process at room temperature. As mentioned above at pressures in the 10–100 Torr range, the Cu(111)
surface was found to be completely covered with clusters that are larger and closer to each other. Figure
11d shows an example of the topography of the surface under 10 Torr CO with clusters densely covering
adjacent terraces separated by monatomic steps. The clusters are densely covered by CO molecules,
imaged as bright spots, separated by distances of √3 and 2 times the atomic periodicity, and aligned in
directions forming 60 and 90 degrees between them, which can be interpreted as arising from atop CO
molecules in local (2×2)-3CO and c(4×2) geometries and coverages of 0.75 and 0.5 ML, respectively.
26
Figure 11: (a) STM image of the bare Cu(111) surface. HPSTM image of the Cu(111) surface in the
presence of (b) 0.1 Torr CO, (c) and (e) in the presence of 0.2 Torr CO, and (d) in the presence of 10 Torr
27
CO. All images were acquired at room temperature. The HPSTM images show the breaking up of the
Cu(111) surface into clusters as a function of CO pressure. The hexagonal 19-atom clusters can be seen in
(e), and they are visually clearer in the two-color contrast used in the inlet. DFT calculations can generate
similar images of the clusters, with their periphery covered with adsorbed CO molecules. Reproduced
with permission from Ref.57
. Copyright 2016 American Association for the Advancement of Science.
CO on Cu(100): The Cu(100) surface behaves very similar to the Cu(111) surface in the presence of
CO gas at room temperature. Whilst adsorption studies in UHV and at cryogenic temperatures show a
dense (√2×√2) adsorbate layer at the highest coverage,60
the surface breaks up into clusters at room
temperature in the mbar pressure range.61
Figure 12a-i shows STM images of the Cu(100) surface in the
presence of 0.25 mbar CO, which appears broken up into rectangular nanoclusters with edges oriented
along <001> directions. The smallest of these clusters consist of 5 atoms, as shown in Figure 12a-ii.
Away from the edges, several terrace regions are seen with the (1×1) periodicity (Figure 12a-iii), whereas
the step edge atoms of nanoclusters and terraces are spaced by √2 times the Cu–Cu distance. As the
pressure is increased to 20 mbar, the clusters increase in size and number (Figure 12b-i). Two structures
can be observed: Some regions on the surface have a local (√2×√2) arrangement of adsorbed CO
molecules, similar to that formed at saturation coverage in UHV at cryogenic temperatures.61
The second
and more dominant structure consists of elongated 3-atom wide nanoclusters (Figure 12b-ii) oriented
along the <001> directions. As the pressure is increased to 115 mbar (Figure 12c-i), the elongated
nanoclusters appear more numerous than at 20 mbar. Both in Figure 12b-ii and in Figure 12c-ii, the bright
spots due to CO form a zigzag pattern along the <001> directions, with the central line of molecules
showing higher contrast than those in adjacent lines. The zigzag originates from CO molecules repelling
each other so that they tilt in opposite directions in neighboring molecules along the chain. This was also
previously found in UHV at high CO coverage29
for CO on Pt(110).28
The higher contrast of the central
line is due to CO molecules pointing upward, whereas CO molecules adsorbed to the adjacent rows are
tilted due to repulsion between neighboring molecules. Most of the one-dimensional nanoclusters are
separated by roughly 1 nm from each other, dictated by steric repulsion. DFT calculations confirm the
formation of the 3-atom wide one-dimensional clusters, and simulated STM images also show both the
higher STM contrast and the zigzagging of the middle row (Figure 12b-iii).
28
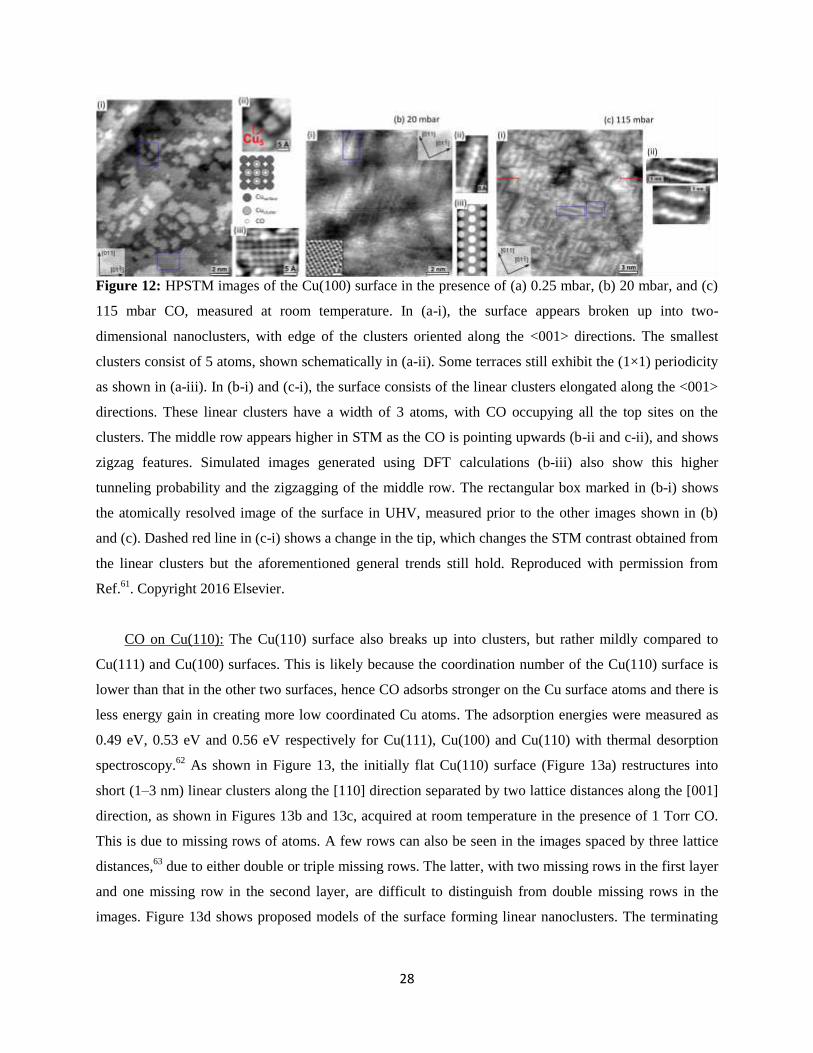
Figure 12: HPSTM images of the Cu(100) surface in the presence of (a) 0.25 mbar, (b) 20 mbar, and (c)
115 mbar CO, measured at room temperature. In (a-i), the surface appears broken up into two-
dimensional nanoclusters, with edge of the clusters oriented along the <001> directions. The smallest
clusters consist of 5 atoms, shown schematically in (a-ii). Some terraces still exhibit the (1×1) periodicity
as shown in (a-iii). In (b-i) and (c-i), the surface consists of the linear clusters elongated along the <001>
directions. These linear clusters have a width of 3 atoms, with CO occupying all the top sites on the
clusters. The middle row appears higher in STM as the CO is pointing upwards (b-ii and c-ii), and shows
zigzag features. Simulated images generated using DFT calculations (b-iii) also show this higher
tunneling probability and the zigzagging of the middle row. The rectangular box marked in (b-i) shows
the atomically resolved image of the surface in UHV, measured prior to the other images shown in (b)
and (c). Dashed red line in (c-i) shows a change in the tip, which changes the STM contrast obtained from
the linear clusters but the aforementioned general trends still hold. Reproduced with permission from
Ref.61
. Copyright 2016 Elsevier.
CO on Cu(110): The Cu(110) surface also breaks up into clusters, but rather mildly compared to
Cu(111) and Cu(100) surfaces. This is likely because the coordination number of the Cu(110) surface is
lower than that in the other two surfaces, hence CO adsorbs stronger on the Cu surface atoms and there is
less energy gain in creating more low coordinated Cu atoms. The adsorption energies were measured as
0.49 eV, 0.53 eV and 0.56 eV respectively for Cu(111), Cu(100) and Cu(110) with thermal desorption
spectroscopy.62
As shown in Figure 13, the initially flat Cu(110) surface (Figure 13a) restructures into
short (1–3 nm) linear clusters along the [110] direction separated by two lattice distances along the [001]
direction, as shown in Figures 13b and 13c, acquired at room temperature in the presence of 1 Torr CO.
This is due to missing rows of atoms. A few rows can also be seen in the images spaced by three lattice
distances,63
due to either double or triple missing rows. The latter, with two missing rows in the first layer
and one missing row in the second layer, are difficult to distinguish from double missing rows in the
images. Figure 13d shows proposed models of the surface forming linear nanoclusters. The terminating
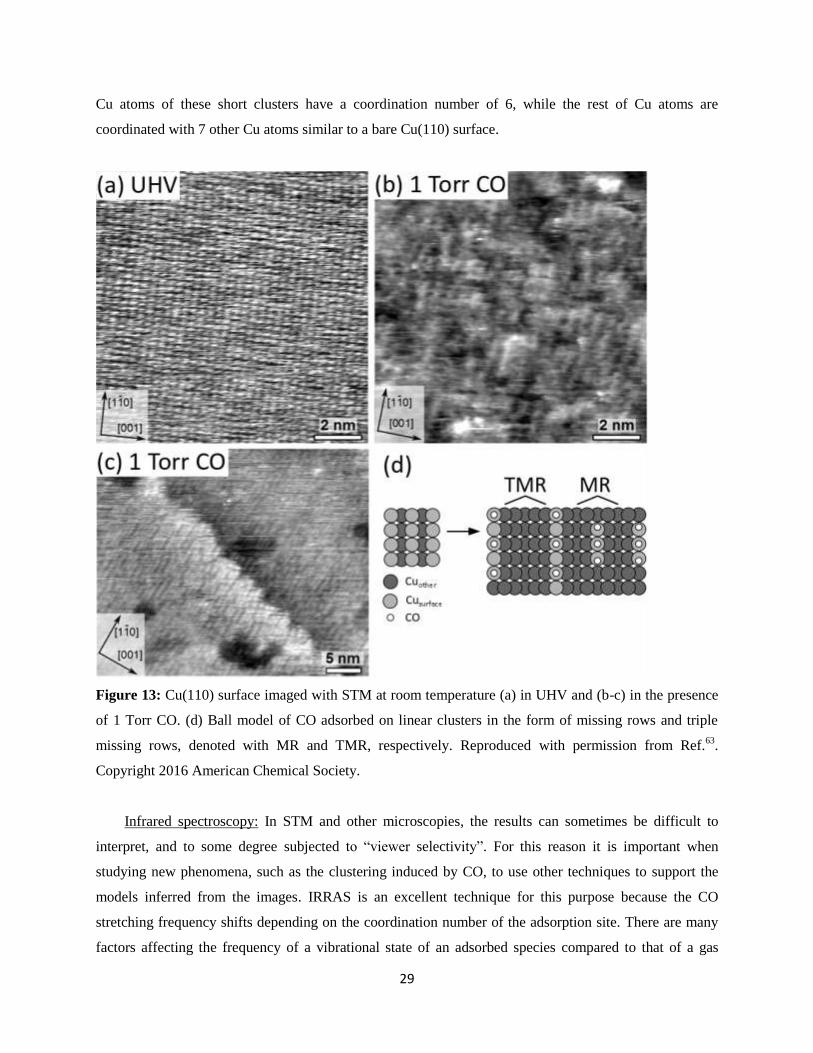
29
Cu atoms of these short clusters have a coordination number of 6, while the rest of Cu atoms are
coordinated with 7 other Cu atoms similar to a bare Cu(110) surface.
Figure 13: Cu(110) surface imaged with STM at room temperature (a) in UHV and (b-c) in the presence
of 1 Torr CO. (d) Ball model of CO adsorbed on linear clusters in the form of missing rows and triple
missing rows, denoted with MR and TMR, respectively. Reproduced with permission from Ref.63
.
Copyright 2016 American Chemical Society.
Infrared spectroscopy: In STM and other microscopies, the results can sometimes be difficult to
interpret, and to some degree subjected to “viewer selectivity”. For this reason it is important when
studying new phenomena, such as the clustering induced by CO, to use other techniques to support the
models inferred from the images. IRRAS is an excellent technique for this purpose because the CO
stretching frequency shifts depending on the coordination number of the adsorption site. There are many
factors affecting the frequency of a vibrational state of an adsorbed species compared to that of a gas
30
phase species: renormalization due to the formation of the M-CO bond (i.e., change in effective mass of
C), interaction of the vibrating dipole with its image in the metal, and chemical effects such as back-
donation which change the C-O bond strength, etc.7 Fortunately, there are many reference works on CO
adsorption on Cu surfaces. They all indicate that the CO stretching frequency increases with decreasing
coordination number of the adsorption site,64
implying that as the surface breaks up into clusters in the
presence of CO, new CO adsorption peaks should appear in the IRRAS spectrum, due to the generation of
lower coordination sites.
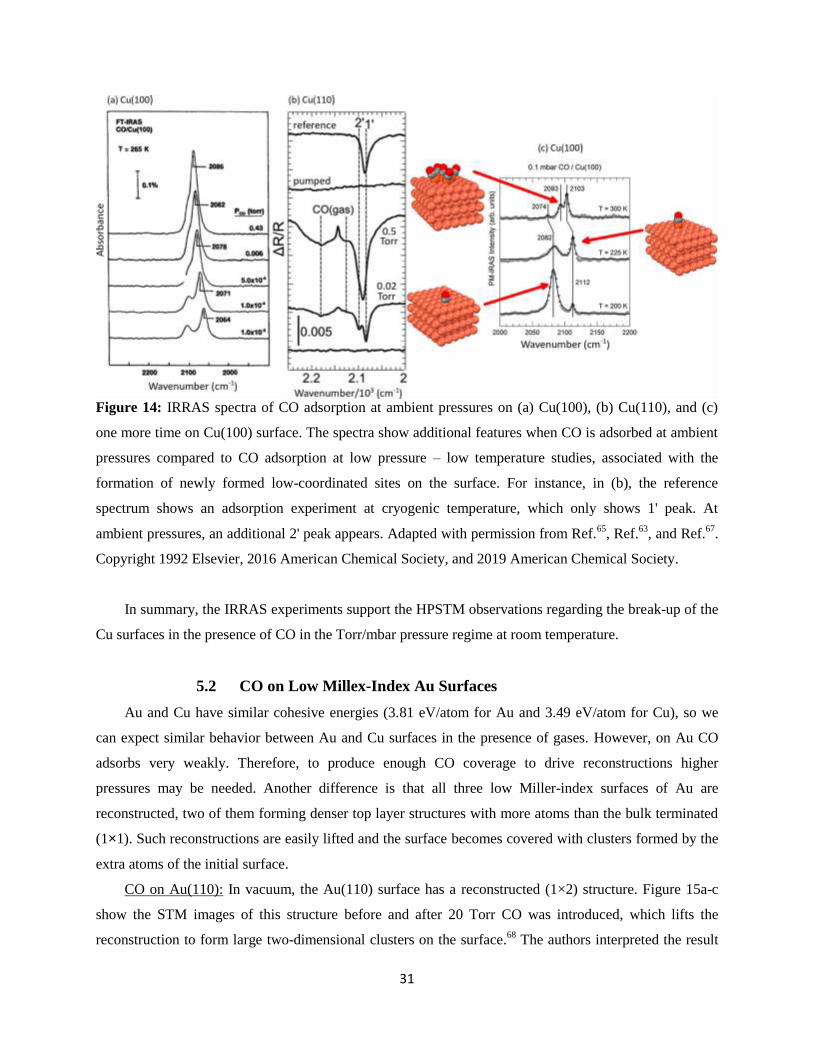
Figure 14 shows IRRAS spectra obtained in three different studies of CO adsorption at ambient
pressures. Figure 14a shows results from CO on Cu(100), where the adsorbed CO stretch features appear
as two peaks at low pressures at 265 K.65
As the pressure increases, the two peaks collapse into one peak,
positioned at 2086 cm−1
, which is a higher wavenumber compared to CO on Cu(100) obtained at low
temperature. There were no HPSTM studies at the time, but now we can attribute this change to the
clustering of the surface, which shows that at 265 K CO could be present both on 8-coordinated metal
sites and on the edges of the newly formed clusters, although there should be fewer clusters at this
temperature compared to room temperature. With fewer clusters the two peaks should collapse into one as
the pressure increases, due to intensity borrowing of the high wavenumber feature from the low
wavenumber feature due to coupling between two vibrational modes. Another example of intensity
borrowing is observed in the CO adsorption on the Pt(533) surface at cryogenic temperatures.66
A more recent study performed on the Cu(110) surface shows that at cryogenic temperatures only a
peak at 2086 cm−1
is visible (reference spectrum at the top), due to CO adsorbing on Cu(110)-(1×1), but
two peaks arise when CO is adsorbed at ambient pressures at around 2084 and 2099 cm−1
, which are
attributed to CO bound to top site Cu atoms with coordination numbers of 7 and 6, respectively (Figure
14b).63
This is in line with the HPSTM observations: The surface breaks up into clusters in the form of
missing rows, with the edge of the clusters having a coordination number of 6. A more recent study was
conducted on Cu(100) in the presence of 0.1 mbar CO, with the temperature increasing from 200 K to 300
K.67
While at 200 K CO adsorbs on 8-coordinated surface Cu atoms of Cu(100)-(1×1), as evidenced by a
single absorption peak at 2082 cm−1
, another peak appears at 2112 cm-1
when the surface temperature is
increased to 225 K (Figure 15c). This new peak is due to ad-atom formation on the surface, facilitated
through CO adsorption which weakens the Cu-Cu bonds and thus facilitates detachment of step and kink
sites atoms.57
Finally, at room temperature, two intense peaks are present at 2093 cm-1
and 2103 cm-1
, due
to CO adsorbed on 5-atom clusters and on single adatoms,67
in accordance with HPSTM experiments
discussed above. A third peak, with much weaker in intensity, is present at 2074 cm-1
, which is assigned
to small amounts of CO on the on the 8-coordinated surface Cu atoms.
31
Figure 14: IRRAS spectra of CO adsorption at ambient pressures on (a) Cu(100), (b) Cu(110), and (c)
one more time on Cu(100) surface. The spectra show additional features when CO is adsorbed at ambient
pressures compared to CO adsorption at low pressure – low temperature studies, associated with the
formation of newly formed low-coordinated sites on the surface. For instance, in (b), the reference
spectrum shows an adsorption experiment at cryogenic temperature, which only shows 1' peak. At
ambient pressures, an additional 2' peak appears. Adapted with permission from Ref.65
, Ref.63
, and Ref.67
.
Copyright 1992 Elsevier, 2016 American Chemical Society, and 2019 American Chemical Society.
In summary, the IRRAS experiments support the HPSTM observations regarding the break-up of the
Cu surfaces in the presence of CO in the Torr/mbar pressure regime at room temperature.
5.2 CO on Low Millex-Index Au Surfaces
Au and Cu have similar cohesive energies (3.81 eV/atom for Au and 3.49 eV/atom for Cu), so we
can expect similar behavior between Au and Cu surfaces in the presence of gases. However, on Au CO
adsorbs very weakly. Therefore, to produce enough CO coverage to drive reconstructions higher
pressures may be needed. Another difference is that all three low Miller-index surfaces of Au are
reconstructed, two of them forming denser top layer structures with more atoms than the bulk terminated
(1×1). Such reconstructions are easily lifted and the surface becomes covered with clusters formed by the
extra atoms of the initial surface.
CO on Au(110): In vacuum, the Au(110) surface has a reconstructed (1×2) structure. Figure 15a-c
show the STM images of this structure before and after 20 Torr CO was introduced, which lifts the
reconstruction to form large two-dimensional clusters on the surface.68
The authors interpreted the result
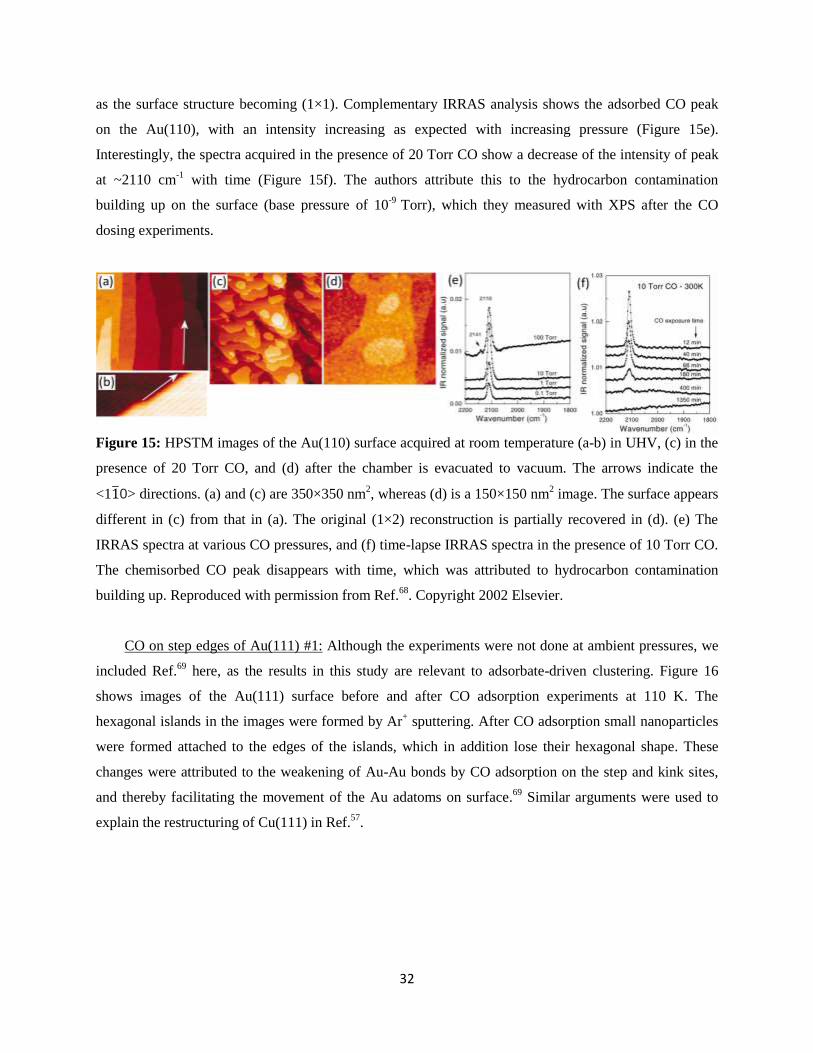
32
as the surface structure becoming (1×1). Complementary IRRAS analysis shows the adsorbed CO peak
on the Au(110), with an intensity increasing as expected with increasing pressure (Figure 15e).
Interestingly, the spectra acquired in the presence of 20 Torr CO show a decrease of the intensity of peak
at ~2110 cm-1
with time (Figure 15f). The authors attribute this to the hydrocarbon contamination
building up on the surface (base pressure of 10-9
Torr), which they measured with XPS after the CO
dosing experiments.
Figure 15: HPSTM images of the Au(110) surface acquired at room temperature (a-b) in UHV, (c) in the
presence of 20 Torr CO, and (d) after the chamber is evacuated to vacuum. The arrows indicate the
<110> directions. (a) and (c) are 350×350 nm2, whereas (d) is a 150×150 nm
2 image. The surface appears
different in (c) from that in (a). The original (1×2) reconstruction is partially recovered in (d). (e) The
IRRAS spectra at various CO pressures, and (f) time-lapse IRRAS spectra in the presence of 10 Torr CO.
The chemisorbed CO peak disappears with time, which was attributed to hydrocarbon contamination
building up. Reproduced with permission from Ref.68
. Copyright 2002 Elsevier.
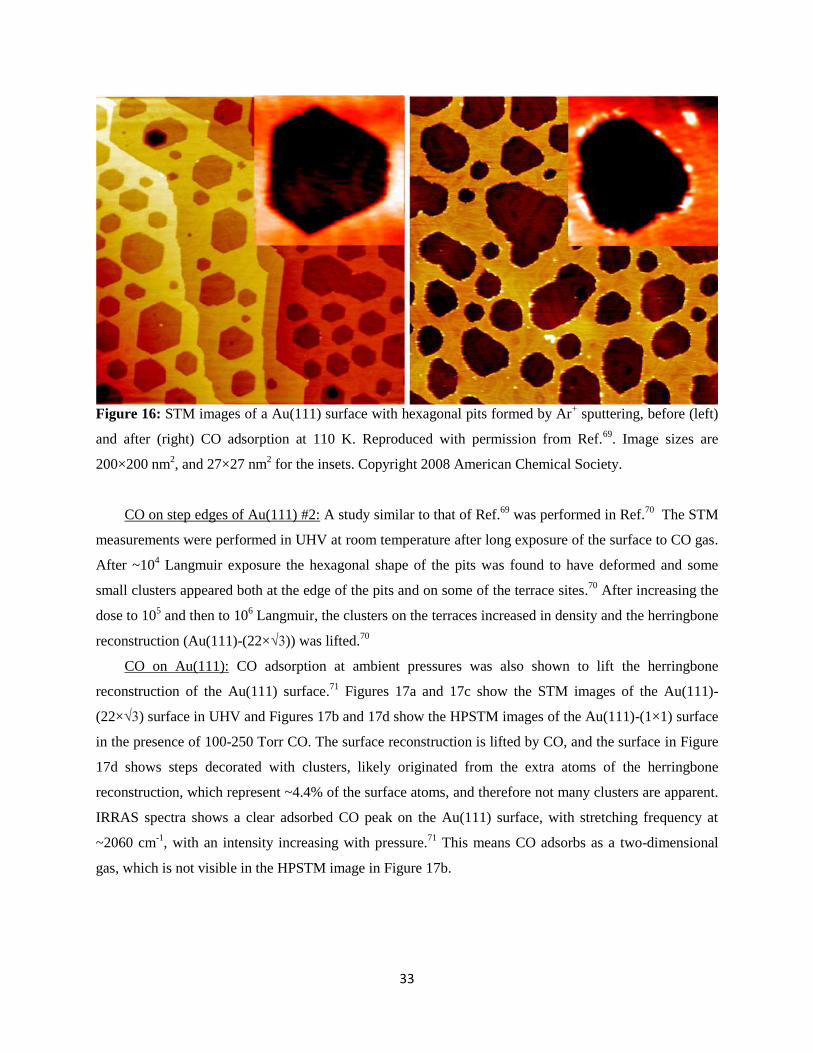
CO on step edges of Au(111) #1: Although the experiments were not done at ambient pressures, we
included Ref.69
here, as the results in this study are relevant to adsorbate-driven clustering. Figure 16
shows images of the Au(111) surface before and after CO adsorption experiments at 110 K. The
hexagonal islands in the images were formed by Ar+ sputtering. After CO adsorption small nanoparticles
were formed attached to the edges of the islands, which in addition lose their hexagonal shape. These
changes were attributed to the weakening of Au-Au bonds by CO adsorption on the step and kink sites,
and thereby facilitating the movement of the Au adatoms on surface.69
Similar arguments were used to
explain the restructuring of Cu(111) in Ref.57
.
33
Figure 16: STM images of a Au(111) surface with hexagonal pits formed by Ar+ sputtering, before (left)
and after (right) CO adsorption at 110 K. Reproduced with permission from Ref.69
. Image sizes are
200×200 nm2, and 27×27 nm
2 for the insets. Copyright 2008 American Chemical Society.
CO on step edges of Au(111) #2: A study similar to that of Ref.69
was performed in Ref.70
The STM
measurements were performed in UHV at room temperature after long exposure of the surface to CO gas.
After ~104 Langmuir exposure the hexagonal shape of the pits was found to have deformed and some
small clusters appeared both at the edge of the pits and on some of the terrace sites.70
After increasing the
dose to 105 and then to 10
6 Langmuir, the clusters on the terraces increased in density and the herringbone
reconstruction (Au(111)-(22×√3)) was lifted.70
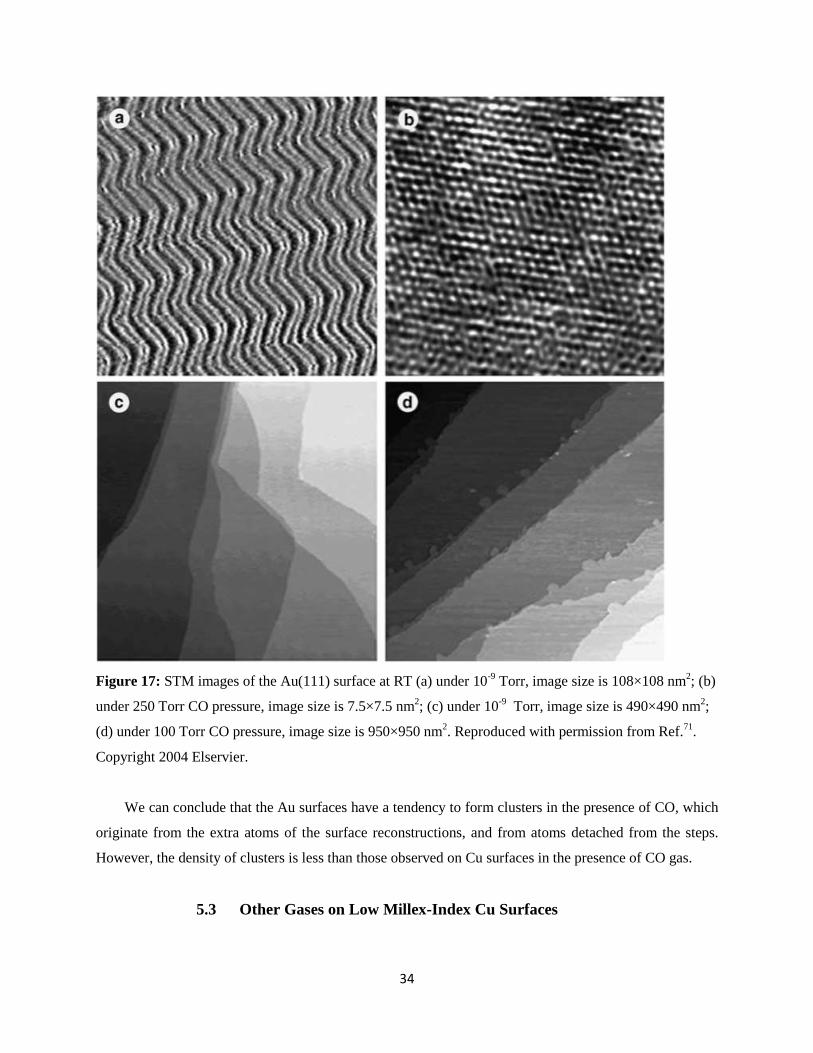
CO on Au(111): CO adsorption at ambient pressures was also shown to lift the herringbone
reconstruction of the Au(111) surface.71
Figures 17a and 17c show the STM images of the Au(111)-
(22×√3) surface in UHV and Figures 17b and 17d show the HPSTM images of the Au(111)-(1×1) surface
in the presence of 100-250 Torr CO. The surface reconstruction is lifted by CO, and the surface in Figure
17d shows steps decorated with clusters, likely originated from the extra atoms of the herringbone
reconstruction, which represent ~4.4% of the surface atoms, and therefore not many clusters are apparent.
IRRAS spectra shows a clear adsorbed CO peak on the Au(111) surface, with stretching frequency at
~2060 cm-1
, with an intensity increasing with pressure.71
This means CO adsorbs as a two-dimensional
gas, which is not visible in the HPSTM image in Figure 17b.
34
Figure 17: STM images of the Au(111) surface at RT (a) under 10-9
Torr, image size is 108×108 nm2; (b)
under 250 Torr CO pressure, image size is 7.5×7.5 nm2; (c) under 10
-9 Torr, image size is 490×490 nm
2;
(d) under 100 Torr CO pressure, image size is 950×950 nm2. Reproduced with permission from Ref.
71.
Copyright 2004 Elservier.
We can conclude that the Au surfaces have a tendency to form clusters in the presence of CO, which
originate from the extra atoms of the surface reconstructions, and from atoms detached from the steps.
However, the density of clusters is less than those observed on Cu surfaces in the presence of CO gas.
5.3 Other Gases on Low Millex-Index Cu Surfaces
35
In Subsection 5.1, we have seen that in the presence of CO gas the low Miller-index Cu surfaces
break up into clusters. As we will show now, this is not the general case. It is important to establish why
clustering happens with certain gases and why it does not with others. We will investigate two other gases
on Cu(100): One is CO2 where the surface breaks up into clusters, the other CH3OH vapor where it
remains intact. We will also review H2 on Cu(111), which also does not induce cluster formation on the
surface.
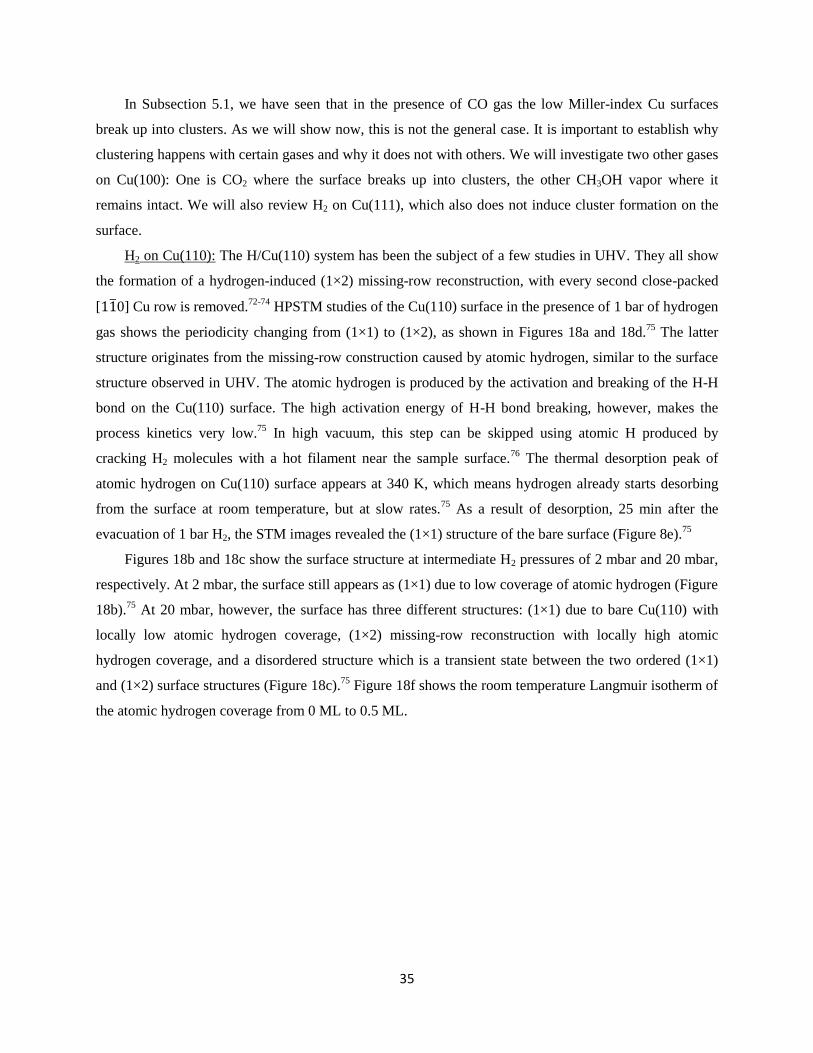
H2 on Cu(110): The H/Cu(110) system has been the subject of a few studies in UHV. They all show
the formation of a hydrogen-induced (1×2) missing-row reconstruction, with every second close-packed
[110] Cu row is removed.72-74
HPSTM studies of the Cu(110) surface in the presence of 1 bar of hydrogen
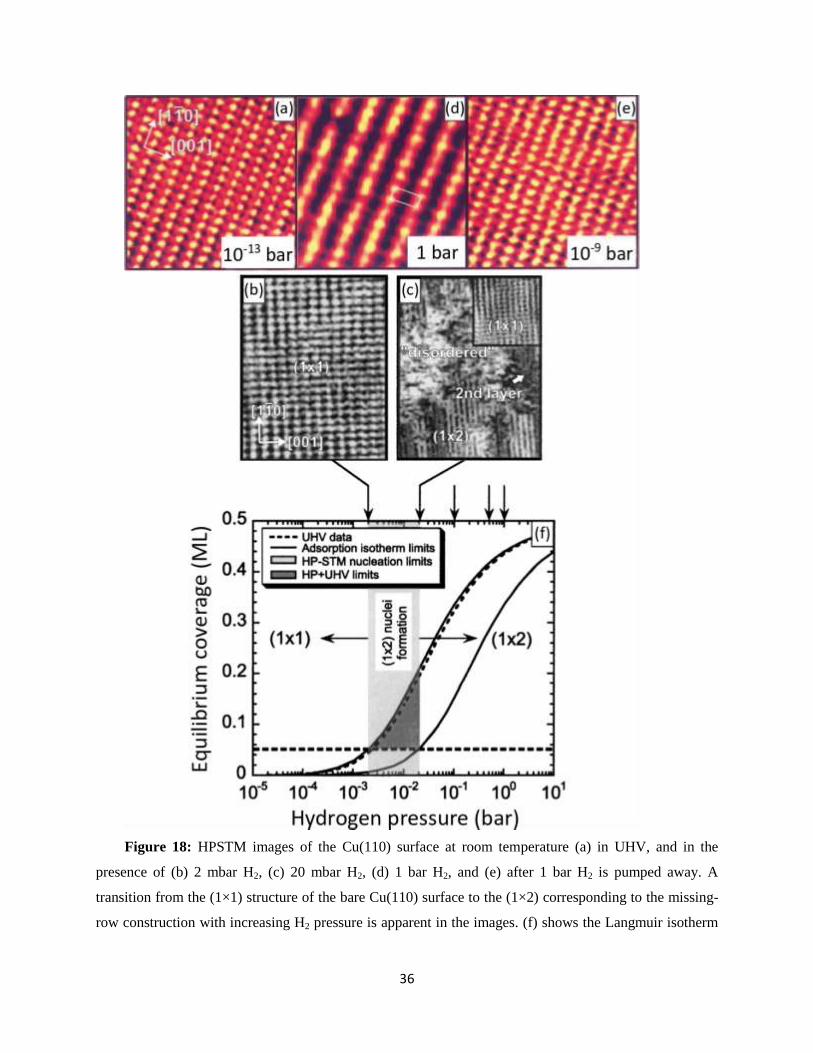
gas shows the periodicity changing from (1×1) to (1×2), as shown in Figures 18a and 18d.75
The latter
structure originates from the missing-row construction caused by atomic hydrogen, similar to the surface
structure observed in UHV. The atomic hydrogen is produced by the activation and breaking of the H-H
bond on the Cu(110) surface. The high activation energy of H-H bond breaking, however, makes the
process kinetics very low.75
In high vacuum, this step can be skipped using atomic H produced by
cracking H2 molecules with a hot filament near the sample surface.76
The thermal desorption peak of
atomic hydrogen on Cu(110) surface appears at 340 K, which means hydrogen already starts desorbing
from the surface at room temperature, but at slow rates.75
As a result of desorption, 25 min after the
evacuation of 1 bar H2, the STM images revealed the (1×1) structure of the bare surface (Figure 8e).75
Figures 18b and 18c show the surface structure at intermediate H2 pressures of 2 mbar and 20 mbar,
respectively. At 2 mbar, the surface still appears as (1×1) due to low coverage of atomic hydrogen (Figure
18b).75
At 20 mbar, however, the surface has three different structures: (1×1) due to bare Cu(110) with
locally low atomic hydrogen coverage, (1×2) missing-row reconstruction with locally high atomic
hydrogen coverage, and a disordered structure which is a transient state between the two ordered (1×1)
and (1×2) surface structures (Figure 18c).75
Figure 18f shows the room temperature Langmuir isotherm of
the atomic hydrogen coverage from 0 ML to 0.5 ML.
36
Figure 18: HPSTM images of the Cu(110) surface at room temperature (a) in UHV, and in the
presence of (b) 2 mbar H2, (c) 20 mbar H2, (d) 1 bar H2, and (e) after 1 bar H2 is pumped away. A
transition from the (1×1) structure of the bare Cu(110) surface to the (1×2) corresponding to the missing-
row construction with increasing H2 pressure is apparent in the images. (f) shows the Langmuir isotherm
37
of atomic hydrogen coverage. Reproduced with permission from Ref.75
. Copyright 2001 American
Institute of Physics
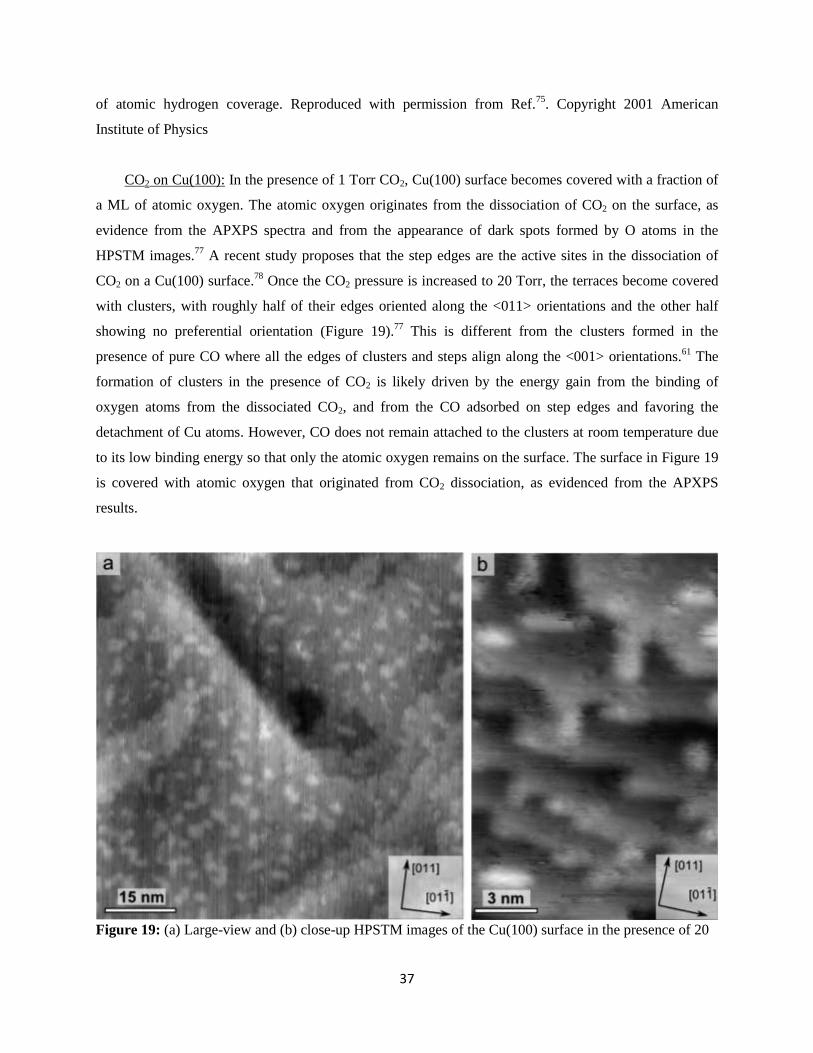
CO2 on Cu(100): In the presence of 1 Torr CO2, Cu(100) surface becomes covered with a fraction of
a ML of atomic oxygen. The atomic oxygen originates from the dissociation of CO2 on the surface, as
evidence from the APXPS spectra and from the appearance of dark spots formed by O atoms in the
HPSTM images.77
A recent study proposes that the step edges are the active sites in the dissociation of
CO2 on a Cu(100) surface.78
Once the CO2 pressure is increased to 20 Torr, the terraces become covered
with clusters, with roughly half of their edges oriented along the <011> orientations and the other half
showing no preferential orientation (Figure 19).77
This is different from the clusters formed in the
presence of pure CO where all the edges of clusters and steps align along the <001> orientations.61
The
formation of clusters in the presence of CO2 is likely driven by the energy gain from the binding of
oxygen atoms from the dissociated CO2, and from the CO adsorbed on step edges and favoring the
detachment of Cu atoms. However, CO does not remain attached to the clusters at room temperature due
to its low binding energy so that only the atomic oxygen remains on the surface. The surface in Figure 19
is covered with atomic oxygen that originated from CO2 dissociation, as evidenced from the APXPS
results.
Figure 19: (a) Large-view and (b) close-up HPSTM images of the Cu(100) surface in the presence of 20
38
Torr CO2 at room temperature. The surface breaks up into clusters, roughly half of them with edges
oriented along the <011> directions. The step edges of the clusters were oriented along the <001>
directions in the presence of CO (Figure 12). Reproduced with permission from Ref.77
. Copyright (2016)
American Chemical Society.
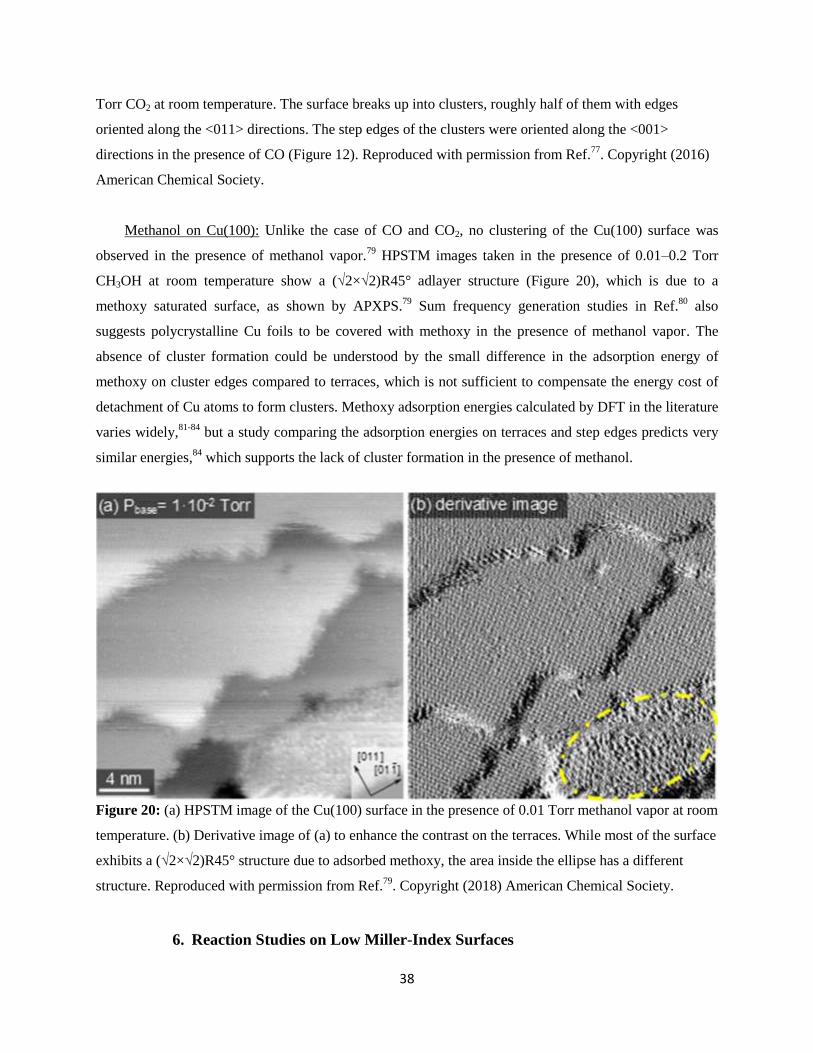
Methanol on Cu(100): Unlike the case of CO and CO2, no clustering of the Cu(100) surface was
observed in the presence of methanol vapor.79
HPSTM images taken in the presence of 0.01–0.2 Torr
CH3OH at room temperature show a (√2×√2)R45° adlayer structure (Figure 20), which is due to a
methoxy saturated surface, as shown by APXPS.79
Sum frequency generation studies in Ref.80
also
suggests polycrystalline Cu foils to be covered with methoxy in the presence of methanol vapor. The
absence of cluster formation could be understood by the small difference in the adsorption energy of
methoxy on cluster edges compared to terraces, which is not sufficient to compensate the energy cost of
detachment of Cu atoms to form clusters. Methoxy adsorption energies calculated by DFT in the literature
varies widely,81-84
but a study comparing the adsorption energies on terraces and step edges predicts very
similar energies,84
which supports the lack of cluster formation in the presence of methanol.
Figure 20: (a) HPSTM image of the Cu(100) surface in the presence of 0.01 Torr methanol vapor at room
temperature. (b) Derivative image of (a) to enhance the contrast on the terraces. While most of the surface
exhibits a (√2×√2)R45° structure due to adsorbed methoxy, the area inside the ellipse has a different
structure. Reproduced with permission from Ref.79
. Copyright (2018) American Chemical Society.
6. Reaction Studies on Low Miller-Index Surfaces
39
6.1 CO Oxidation
CO oxidation reaction is important for the mitigation of the pollutants generated by vehicles, and it
can also be considered prototypical for more complicated oxidation reactions.85
It is also the most studied
reaction with HPSTM, because it involves only two reactant adsorbates and one product, which does not
remain adsorbed on the surface, thus simplifying interpretation of the images.
6.1.1 CO Oxidation on Pt Surfaces
According to Ref.86
, there is a steady increase in the number of papers that deal with CO oxidation
on Pt surfaces between 1975 and 2015, reaching almost 80 papers in 2015, showing that this topic
continues to attract a great deal of interest. We also note that CO oxidation on Pt was one of the topics
discussed in the Nobel Prize in Chemistry Lecture in 2007.2 We can thus consider CO oxidation on Pt the
“Drosophila” of surface chemistry reactions.
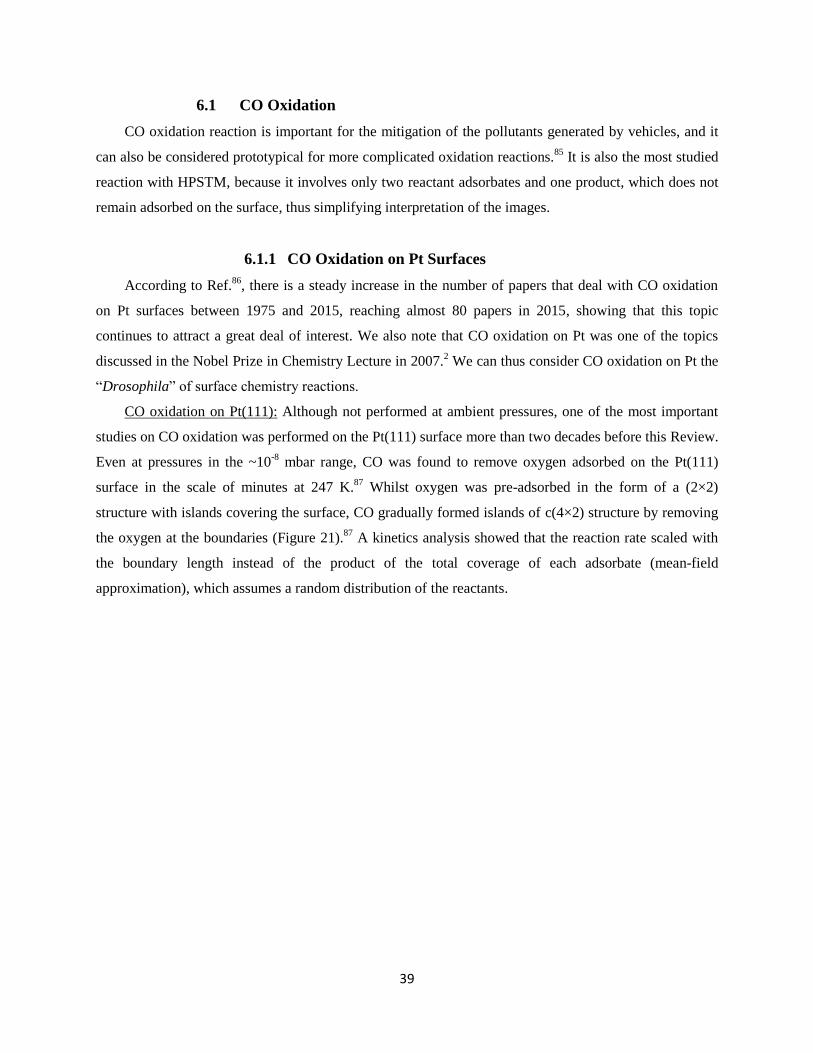
CO oxidation on Pt(111): Although not performed at ambient pressures, one of the most important
studies on CO oxidation was performed on the Pt(111) surface more than two decades before this Review.
Even at pressures in the ~10-8
mbar range, CO was found to remove oxygen adsorbed on the Pt(111)
surface in the scale of minutes at 247 K.87
Whilst oxygen was pre-adsorbed in the form of a (2×2)
structure with islands covering the surface, CO gradually formed islands of c(4×2) structure by removing
the oxygen at the boundaries (Figure 21).87
A kinetics analysis showed that the reaction rate scaled with
the boundary length instead of the product of the total coverage of each adsorbate (mean-field
approximation), which assumes a random distribution of the reactants.
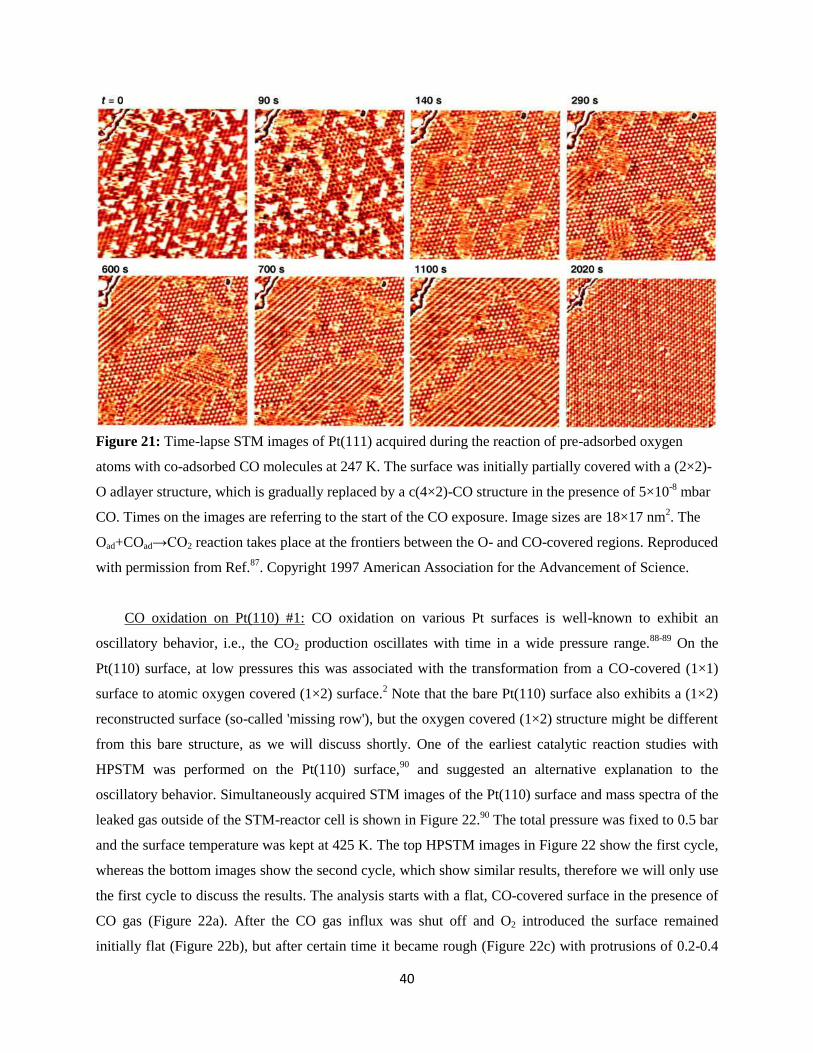
40
Figure 21: Time-lapse STM images of Pt(111) acquired during the reaction of pre-adsorbed oxygen
atoms with co-adsorbed CO molecules at 247 K. The surface was initially partially covered with a (2×2)-
O adlayer structure, which is gradually replaced by a c(4×2)-CO structure in the presence of 5×10⁻⁸
mbar
CO. Times on the images are referring to the start of the CO exposure. Image sizes are 18×17 nm2. The
Oad+COad→CO2 reaction takes place at the frontiers between the O- and CO-covered regions. Reproduced
with permission from Ref.87
. Copyright 1997 American Association for the Advancement of Science.
CO oxidation on Pt(110) #1: CO oxidation on various Pt surfaces is well-known to exhibit an
oscillatory behavior, i.e., the CO2 production oscillates with time in a wide pressure range.88-89
On the
Pt(110) surface, at low pressures this was associated with the transformation from a CO-covered (1×1)
surface to atomic oxygen covered (1×2) surface.2 Note that the bare Pt(110) surface also exhibits a (1×2)
reconstructed surface (so-called 'missing row'), but the oxygen covered (1×2) structure might be different
from this bare structure, as we will discuss shortly. One of the earliest catalytic reaction studies with
HPSTM was performed on the Pt(110) surface,90
and suggested an alternative explanation to the
oscillatory behavior. Simultaneously acquired STM images of the Pt(110) surface and mass spectra of the
leaked gas outside of the STM-reactor cell is shown in Figure 22.90
The total pressure was fixed to 0.5 bar
and the surface temperature was kept at 425 K. The top HPSTM images in Figure 22 show the first cycle,
whereas the bottom images show the second cycle, which show similar results, therefore we will only use
the first cycle to discuss the results. The analysis starts with a flat, CO-covered surface in the presence of
CO gas (Figure 22a). After the CO gas influx was shut off and O2 introduced the surface remained
initially flat (Figure 22b), but after certain time it became rough (Figure 22c) with protrusions of 0.2-0.4
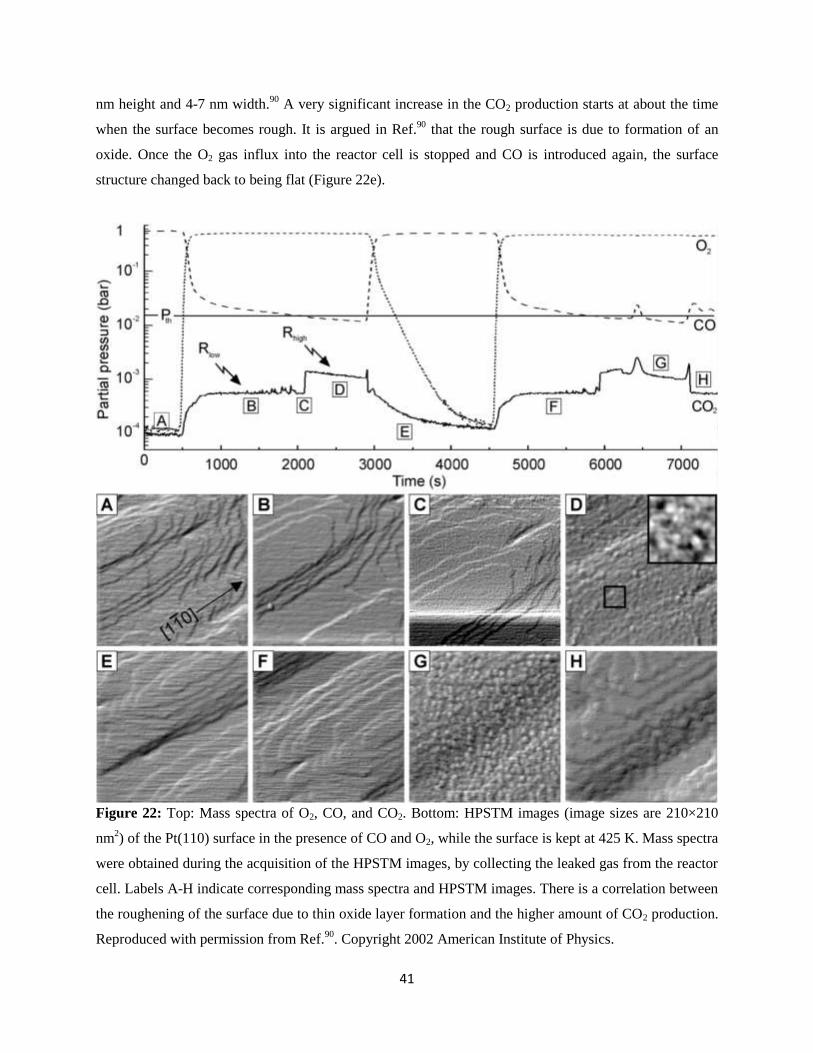
41
nm height and 4-7 nm width.90
A very significant increase in the CO2 production starts at about the time
when the surface becomes rough. It is argued in Ref.90
that the rough surface is due to formation of an
oxide. Once the O2 gas influx into the reactor cell is stopped and CO is introduced again, the surface
structure changed back to being flat (Figure 22e).
Figure 22: Top: Mass spectra of O2, CO, and CO2. Bottom: HPSTM images (image sizes are 210×210
nm2) of the Pt(110) surface in the presence of CO and O2, while the surface is kept at 425 K. Mass spectra
were obtained during the acquisition of the HPSTM images, by collecting the leaked gas from the reactor
cell. Labels A-H indicate corresponding mass spectra and HPSTM images. There is a correlation between
the roughening of the surface due to thin oxide layer formation and the higher amount of CO2 production.
Reproduced with permission from Ref.90
. Copyright 2002 American Institute of Physics.
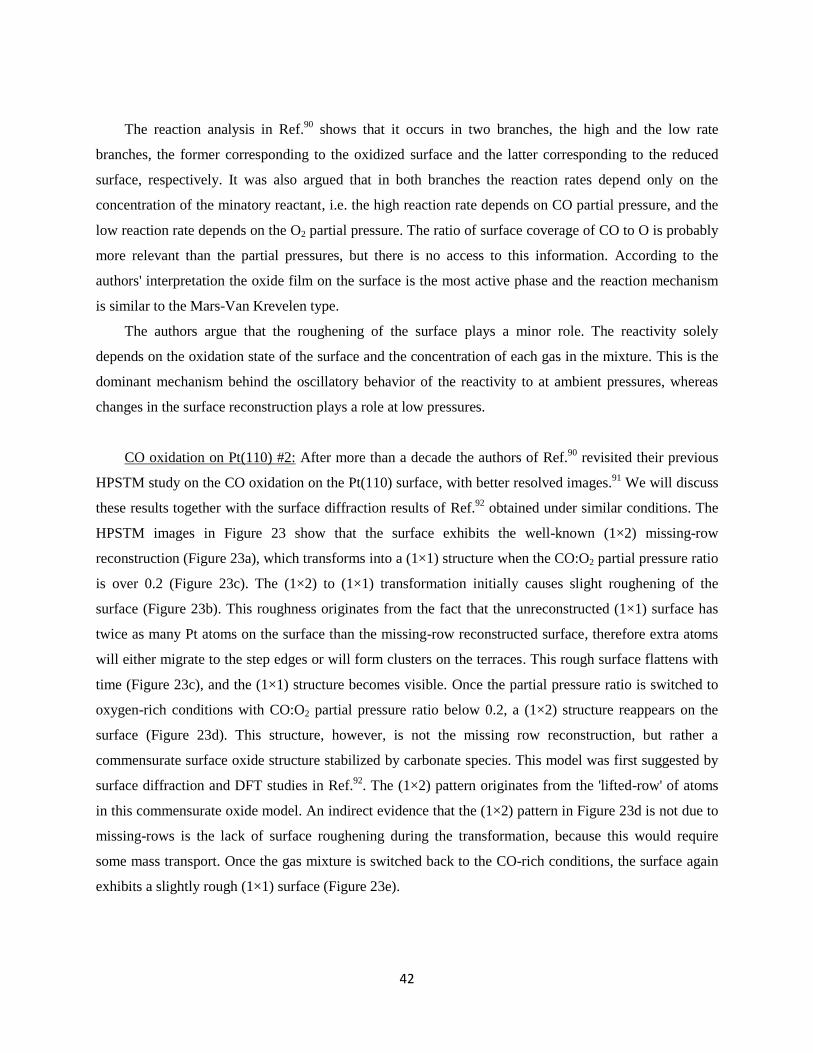
42
The reaction analysis in Ref.90
shows that it occurs in two branches, the high and the low rate
branches, the former corresponding to the oxidized surface and the latter corresponding to the reduced
surface, respectively. It was also argued that in both branches the reaction rates depend only on the
concentration of the minatory reactant, i.e. the high reaction rate depends on CO partial pressure, and the
low reaction rate depends on the O2 partial pressure. The ratio of surface coverage of CO to O is probably
more relevant than the partial pressures, but there is no access to this information. According to the
authors' interpretation the oxide film on the surface is the most active phase and the reaction mechanism
is similar to the Mars-Van Krevelen type.
The authors argue that the roughening of the surface plays a minor role. The reactivity solely
depends on the oxidation state of the surface and the concentration of each gas in the mixture. This is the
dominant mechanism behind the oscillatory behavior of the reactivity to at ambient pressures, whereas
changes in the surface reconstruction plays a role at low pressures.
CO oxidation on Pt(110) #2: After more than a decade the authors of Ref.90
revisited their previous
HPSTM study on the CO oxidation on the Pt(110) surface, with better resolved images.91
We will discuss
these results together with the surface diffraction results of Ref.92
obtained under similar conditions. The
HPSTM images in Figure 23 show that the surface exhibits the well-known (1×2) missing-row
reconstruction (Figure 23a), which transforms into a (1×1) structure when the CO:O2 partial pressure ratio
is over 0.2 (Figure 23c). The (1×2) to (1×1) transformation initially causes slight roughening of the
surface (Figure 23b). This roughness originates from the fact that the unreconstructed (1×1) surface has
twice as many Pt atoms on the surface than the missing-row reconstructed surface, therefore extra atoms
will either migrate to the step edges or will form clusters on the terraces. This rough surface flattens with
time (Figure 23c), and the (1×1) structure becomes visible. Once the partial pressure ratio is switched to
oxygen-rich conditions with CO:O2 partial pressure ratio below 0.2, a (1×2) structure reappears on the
surface (Figure 23d). This structure, however, is not the missing row reconstruction, but rather a
commensurate surface oxide structure stabilized by carbonate species. This model was first suggested by
surface diffraction and DFT studies in Ref.92
. The (1×2) pattern originates from the 'lifted-row' of atoms
in this commensurate oxide model. An indirect evidence that the (1×2) pattern in Figure 23d is not due to
missing-rows is the lack of surface roughening during the transformation, because this would require
some mass transport. Once the gas mixture is switched back to the CO-rich conditions, the surface again
exhibits a slightly rough (1×1) surface (Figure 23e).
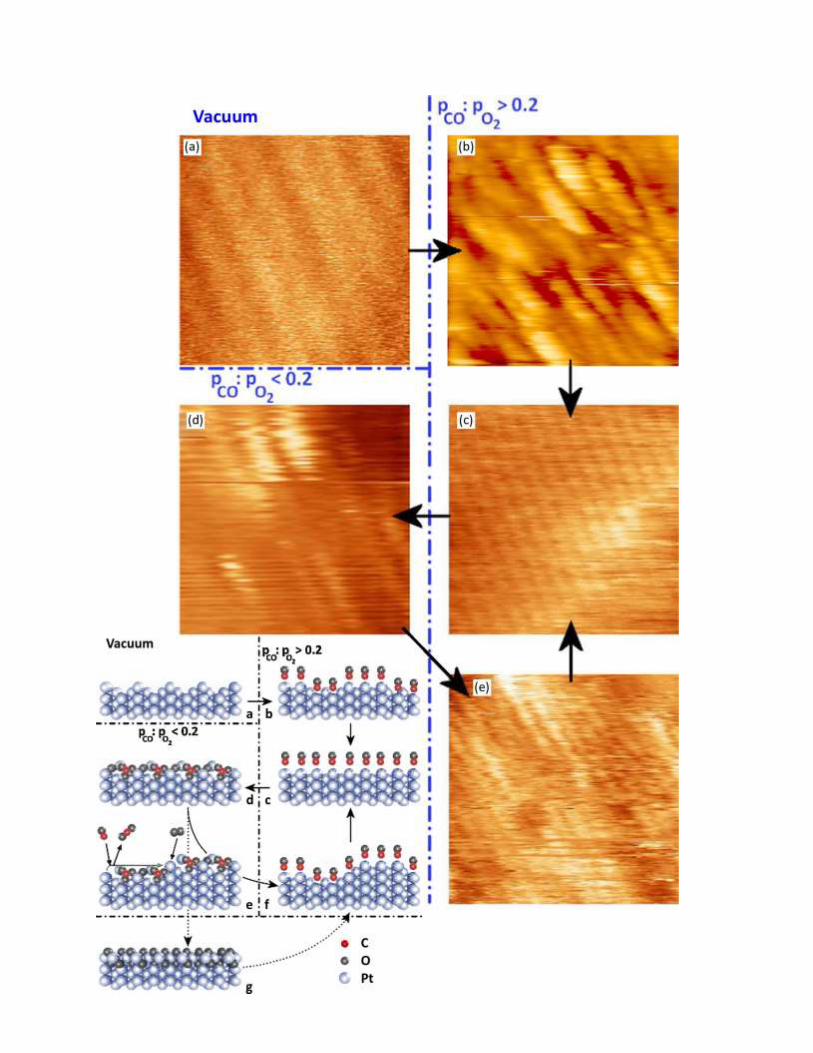
43
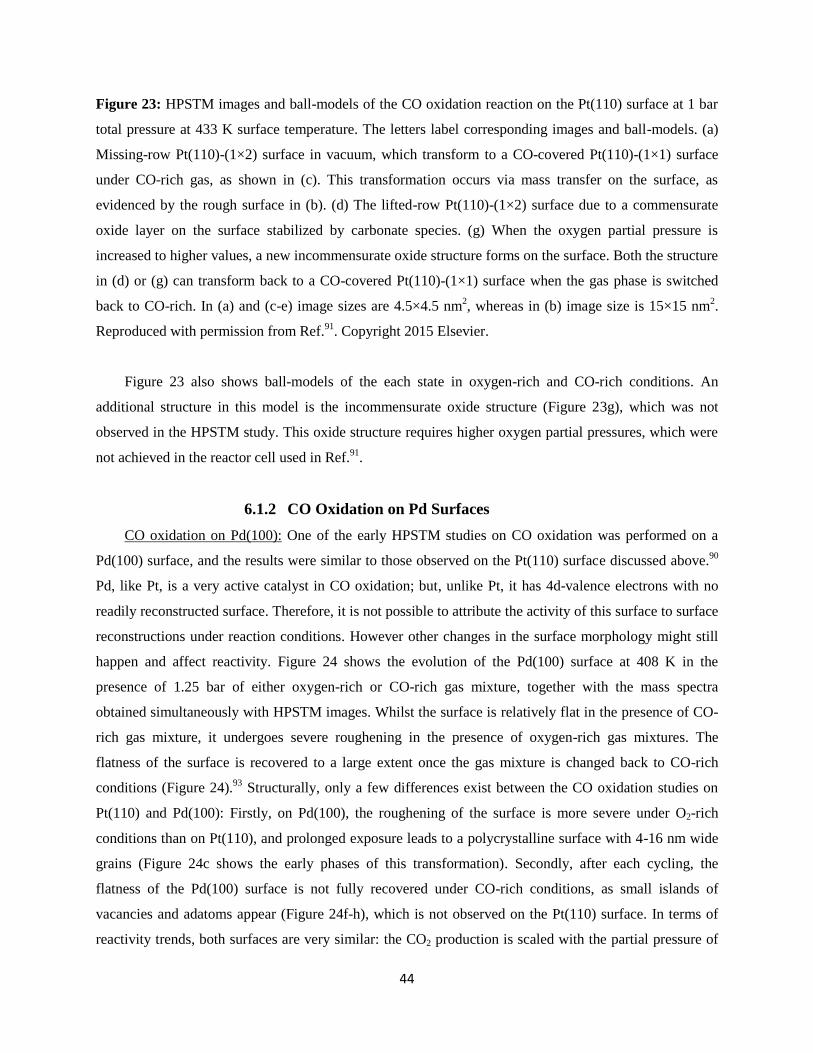
44
Figure 23: HPSTM images and ball-models of the CO oxidation reaction on the Pt(110) surface at 1 bar
total pressure at 433 K surface temperature. The letters label corresponding images and ball-models. (a)
Missing-row Pt(110)-(1×2) surface in vacuum, which transform to a CO-covered Pt(110)-(1×1) surface
under CO-rich gas, as shown in (c). This transformation occurs via mass transfer on the surface, as
evidenced by the rough surface in (b). (d) The lifted-row Pt(110)-(1×2) surface due to a commensurate
oxide layer on the surface stabilized by carbonate species. (g) When the oxygen partial pressure is
increased to higher values, a new incommensurate oxide structure forms on the surface. Both the structure
in (d) or (g) can transform back to a CO-covered Pt(110)-(1×1) surface when the gas phase is switched
back to CO-rich. In (a) and (c-e) image sizes are 4.5×4.5 nm2, whereas in (b) image size is 15×15 nm
2.
Reproduced with permission from Ref.91
. Copyright 2015 Elsevier.
Figure 23 also shows ball-models of the each state in oxygen-rich and CO-rich conditions. An
additional structure in this model is the incommensurate oxide structure (Figure 23g), which was not
observed in the HPSTM study. This oxide structure requires higher oxygen partial pressures, which were
not achieved in the reactor cell used in Ref.91
.
6.1.2 CO Oxidation on Pd Surfaces
CO oxidation on Pd(100): One of the early HPSTM studies on CO oxidation was performed on a
Pd(100) surface, and the results were similar to those observed on the Pt(110) surface discussed above.90
Pd, like Pt, is a very active catalyst in CO oxidation; but, unlike Pt, it has 4d-valence electrons with no
readily reconstructed surface. Therefore, it is not possible to attribute the activity of this surface to surface
reconstructions under reaction conditions. However other changes in the surface morphology might still
happen and affect reactivity. Figure 24 shows the evolution of the Pd(100) surface at 408 K in the
presence of 1.25 bar of either oxygen-rich or CO-rich gas mixture, together with the mass spectra
obtained simultaneously with HPSTM images. Whilst the surface is relatively flat in the presence of CO-
rich gas mixture, it undergoes severe roughening in the presence of oxygen-rich gas mixtures. The
flatness of the surface is recovered to a large extent once the gas mixture is changed back to CO-rich
conditions (Figure 24).93
Structurally, only a few differences exist between the CO oxidation studies on
Pt(110) and Pd(100): Firstly, on Pd(100), the roughening of the surface is more severe under O2-rich
conditions than on Pt(110), and prolonged exposure leads to a polycrystalline surface with 4-16 nm wide
grains (Figure 24c shows the early phases of this transformation). Secondly, after each cycling, the
flatness of the Pd(100) surface is not fully recovered under CO-rich conditions, as small islands of
vacancies and adatoms appear (Figure 24f-h), which is not observed on the Pt(110) surface. In terms of
reactivity trends, both surfaces are very similar: the CO2 production is scaled with the partial pressure of
45
the minority reactant, and the oxide is more active, following a Mars-Van Krevelen-like reaction
mechanism, whereas in the metallic state it follows a Langmuir-Hinshelwood reaction pathway.90,93
In
more recent surface diffraction studies, the same authors discuss the oscillatory behavior and the surface
structure of the Pd(100) surface in more detail.94-95
Figure 24: Top: Mass spectra of O2, CO, and CO2 as a function of time. Bottom: HPSTM 140×140 nm2
images of the Pd(100) surface in the presence of CO and O2, while the surface is kept at 408 K . The mass
spectra were obtained during acquisition of the HPSTM images, by collecting the leaked gas from the
reactor cell. Corresponding labels A-H are indicated in the mass spectra and in the HPSTM images. There
is a correspondence between significant roughening of the surface due to oxide formation and the higher
CO2 production. Reproduced with permission from Ref.93
. Copyright 2004 Elsevier.
6.1.3 CO Oxidation on Rh Surfaces
46
CO oxidation on Rh(110): Many (110) surfaces of fcc metals are known to reconstruct in the form of
missing rows with (1×2) structure, either in UHV or upon adsorption of molecules. One of these is
Rh(110), where the oxygen atoms adsorb forming a (2×2)p2mg structure while changing the substrate
structure from (1×1) to (1×2).96
Interestingly, at room temperature in the presence of CO at 8×10⁻⁸
Torr,
CO molecules replace the adsorbed oxygen atoms (observed using APXPS), likely via the CO2 oxidation
reaction, but they do not lift the missing row reconstruction of the Rh atoms.97
Instead, the CO molecules
adsorb on the remaining rows of the reconstructed surface. At ambient conditions of 0.08 Torr CO and 55
°C temperature however, (1×2) areas of the Rh(110) substrate are slowly replaced by (1×1) areas, as pure
CO adsorption on bare Rh(110) at ambient pressures also exhibits a (1×1) pattern.97
Based on these
observations, a natural question arises: Would the oxygen pre-covered Rh(110) surface retain its (1×2)
structure when both CO and O2 are present in the gas phase, or would the reconstruction be lifted? Figure
25 shows three time-lapse HPSTM images at room temperature under 0.1 Torr gas mixture of 4:1 CO:O2
mixture showing that the (1×2) reconstruction is slowly lifted. According to Ref.97
, this reconstruction
does not lift in the presence of pure CO at room temperature, but it does in the presence of a 4:1 CO:O2
gas mixture. Although this appears counterintuitive, since more CO and less O2 should favor lifting of the
oxygen-induced reconstruction, it could be explained by the exothermic nature of the CO oxidation
reaction where the heat generated facilitates mass transfer on the surface, in a way similar to
reconstruction lifting at 55 °C in the presence of pure CO, which is not observed at room temperature.
Figure 25: HPSTM images of the Rh(110)-(1×2)-O surface at room temperature in the presence of a
mixture of 0.08 Torr CO and 0.02 Torr O2. (a) Initial structure, (b-c) after 25 min, showing that some of
the missing row reconstructions are lifted. Reproduced with permission from Ref.97
. Copyright 2017
American Chemical Society.
6.1.4 CO Oxidation on Cu Surfaces
Cu based catalysts are used in a variety of catalytic reactions, but they suffer from a swift
deactivation during CO oxidation.98
Solving this issue could help replacing expensive Pt catalysts in the
47
catalytic converters of gasoline and diesel engine vehicles. Therefore, CO oxidation on Cu surfaces has
been a topic of interest both in applied catalysis and Surface Science studies. More recently HPSTM has
been used to study the reaction: The first two studies were performed in the presence of CO on two
oxygen pre-covered surfaces. The third study was performed in the presence of both gases.
CO oxidation on Cu(111) #1: In the first study a √73R5.8°×√21R10.9° overlayer structure of Cu-O
was prepared on the Cu(111) surface (Figure 26-top a).99
This overlayer structure is very similar to a layer
of Cu2O, and is often called a surface oxide. However, there is a small but significant difference: the
√73R5.8°×√21R10.9° overlayer structure has lone oxygen atoms directly attached to the Cu(111) surface
which are not present in the Cu2O(111) surface . These atoms are easier to remove than the other oxygen
atoms in the structure. In fact, it was shown with low pressure – high temperature STM studies that
hexagonal and 5-7 rings containing less oxygen form after the removal of oxygen after reacting with
CO.100-101
Afterwards, the CO molecules adsorb on the newly formed Cu sites and remove the rest of the
oxygen from the surface, thereby completely removing the overlayer from the surface.
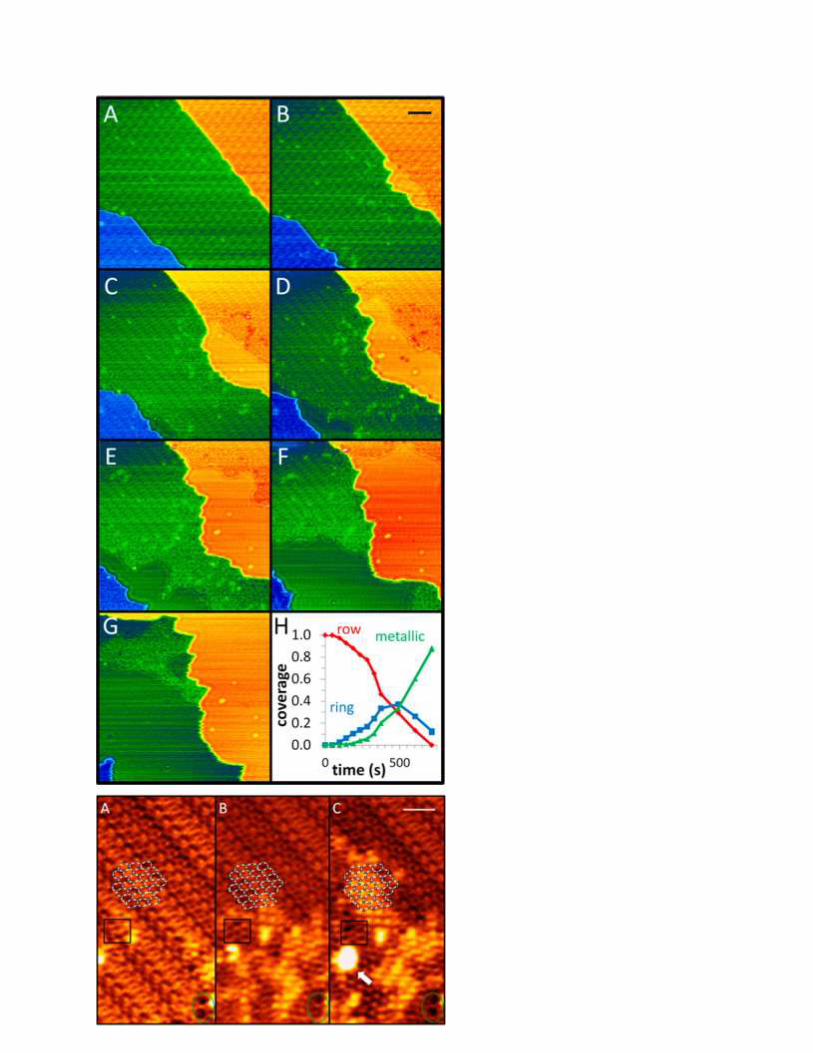
48
49
Figure 26: Time-lapse HPSTM images of the √73R5.8°×√21R10.9° Cu-O overlayer structure on the
Cu(111) surface being removed in the presence of 10-35 mTorr CO at room temperature. Top (scale bar is
5 nm): Near step edges row-like structures due to the √73R5.8°×√21R10.9° overlayer, are first replaced
by a hexagonal and 5-7 ring structure and then completely removed. Bottom (scale bar is 2 nm): Farther
away from the step edges a removal of the√73R5.8°×√21R10.9° Cu-O overlayer structure is observed,
first induced the formation of bright protrusions due to the newly formed hexagonal structure, buckled
due to compression. The arrow shows the formation of a metallic cluster from the released Cu atoms after
the reduction of the overlayer. Reproduced with permission from Ref.102
. Copyright 2013 American
Chemical Society.
Figure 26-top shows removal of the √73R5.8°×√21R10.9° overlayer structure in the presence of 10
mTorr CO at room temperature. The √73R5.8°×√21R10.9° overlayer structure, which appears as rows, is
first replaced by a hexagonal and a 5-7 ring structure and then by a metallic surface.101
In this case, the
reaction starts from the step edges and proceeds further into the terraces. Figure 26-bottom shows the
same reaction taking place directly on terraces, initiated at defects.101
Different from the HPSTM images
near the steps, the hexagonal structure now appears as bright protrusions due to the compressive stress on
this layer in the middle of the terraces.102
The arrow on Figure 26-bottom-c indicates a metallic Cu cluster
created during CO oxidation on step edges. The metallic Cu released during the process is preferentially
transferred to the step edges, which appear as a growing metallic front in Figure 26-top.102
CO oxidation on all three low-index Cu surfaces: Three oxygen-induced overlayer structures were
prepared on the low Miller-index Cu surfaces following preparation recipes in the literature:99,103-104
Cu(111)-√73R5.8°×√21R10.9°-O, Cu(100)-(2√2×√2R45°)-O, and Cu(110)-(2×1)-O. Ball-models and
STM images of these overlayer structures are shown on the left side of Figure 27. On the right side,
images of each surface are shown in the presence of 0.01 Torr CO at room temperature after 0.5-1 hour
since the introduction of the CO in the chamber.105
The overlayer structure remains intact on the Cu(100)
and Cu(110) surfaces, but is completely removed from the Cu(111) surface, in line with Ref.102
. A
kinetics analysis using APXPS peak intensities showed that the activation energy for removal of the
surface oxygen in the overlayer structures by CO oxidation was lowest on the Cu(111) surface and
highest on the Cu(110).105
Although this appears counterintuitive, as the catalytic activity is usually
inversely proportional to the coordination number of the surface atoms, it can be explained by the
difference in adsorption energy of CO and the binding energy of oxygen in the overlayer.105
In other
words, following the Sabatier principle, the catalytic activity is correlated with the high oxygen binding
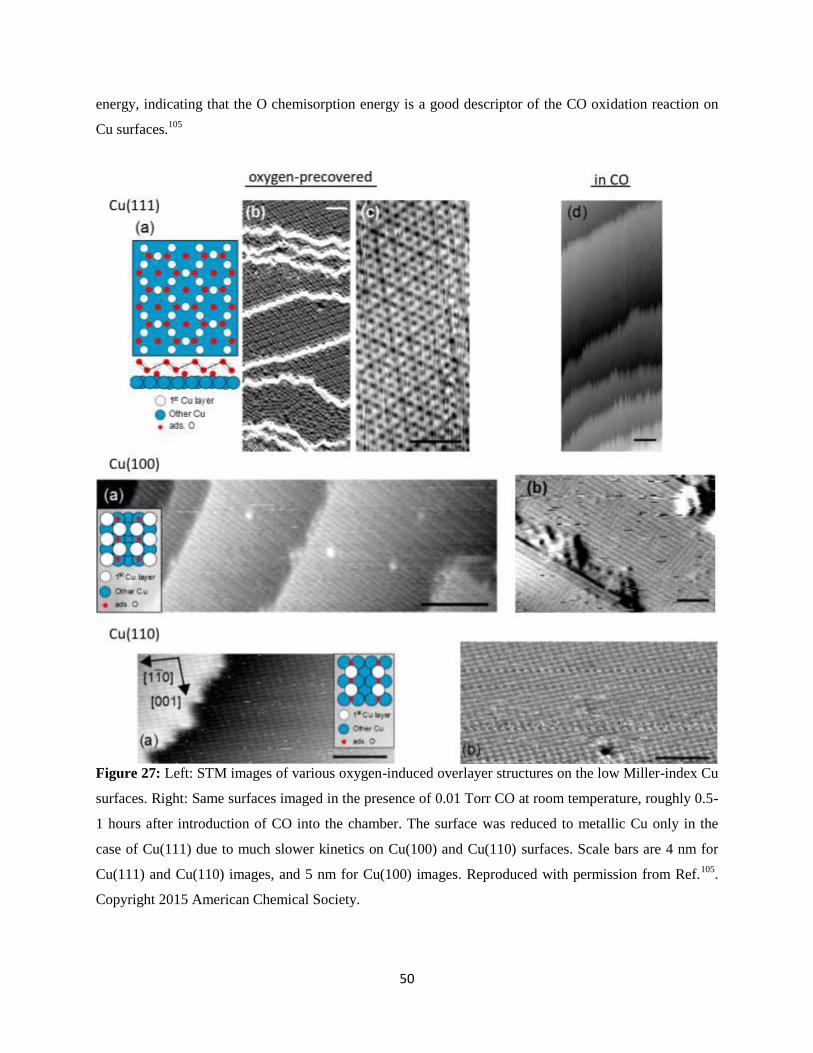
50
energy, indicating that the O chemisorption energy is a good descriptor of the CO oxidation reaction on
Cu surfaces.105
Figure 27: Left: STM images of various oxygen-induced overlayer structures on the low Miller-index Cu
surfaces. Right: Same surfaces imaged in the presence of 0.01 Torr CO at room temperature, roughly 0.5-
1 hours after introduction of CO into the chamber. The surface was reduced to metallic Cu only in the
case of Cu(111) due to much slower kinetics on Cu(100) and Cu(110) surfaces. Scale bars are 4 nm for
Cu(111) and Cu(110) images, and 5 nm for Cu(100) images. Reproduced with permission from Ref.105
.
Copyright 2015 American Chemical Society.
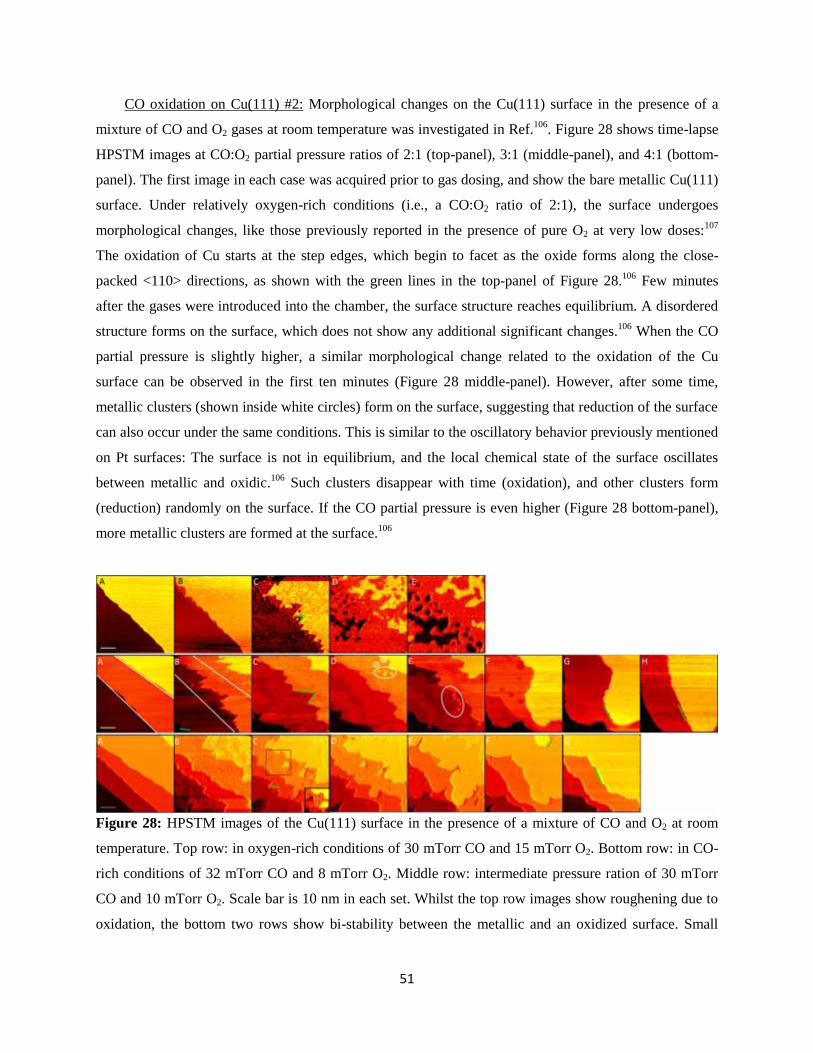
51
CO oxidation on Cu(111) #2: Morphological changes on the Cu(111) surface in the presence of a
mixture of CO and O2 gases at room temperature was investigated in Ref.106
. Figure 28 shows time-lapse
HPSTM images at CO:O2 partial pressure ratios of 2:1 (top-panel), 3:1 (middle-panel), and 4:1 (bottom-
panel). The first image in each case was acquired prior to gas dosing, and show the bare metallic Cu(111)
surface. Under relatively oxygen-rich conditions (i.e., a CO:O2 ratio of 2:1), the surface undergoes
morphological changes, like those previously reported in the presence of pure O2 at very low doses:107
The oxidation of Cu starts at the step edges, which begin to facet as the oxide forms along the close-
packed <110> directions, as shown with the green lines in the top-panel of Figure 28.106
Few minutes
after the gases were introduced into the chamber, the surface structure reaches equilibrium. A disordered
structure forms on the surface, which does not show any additional significant changes.106
When the CO
partial pressure is slightly higher, a similar morphological change related to the oxidation of the Cu
surface can be observed in the first ten minutes (Figure 28 middle-panel). However, after some time,
metallic clusters (shown inside white circles) form on the surface, suggesting that reduction of the surface
can also occur under the same conditions. This is similar to the oscillatory behavior previously mentioned
on Pt surfaces: The surface is not in equilibrium, and the local chemical state of the surface oscillates
between metallic and oxidic.106
Such clusters disappear with time (oxidation), and other clusters form
(reduction) randomly on the surface. If the CO partial pressure is even higher (Figure 28 bottom-panel),
more metallic clusters are formed at the surface.106
Figure 28: HPSTM images of the Cu(111) surface in the presence of a mixture of CO and O2 at room
temperature. Top row: in oxygen-rich conditions of 30 mTorr CO and 15 mTorr O2. Bottom row: in CO-
rich conditions of 32 mTorr CO and 8 mTorr O2. Middle row: intermediate pressure ration of 30 mTorr
CO and 10 mTorr O2. Scale bar is 10 nm in each set. Whilst the top row images show roughening due to
oxidation, the bottom two rows show bi-stability between the metallic and an oxidized surface. Small
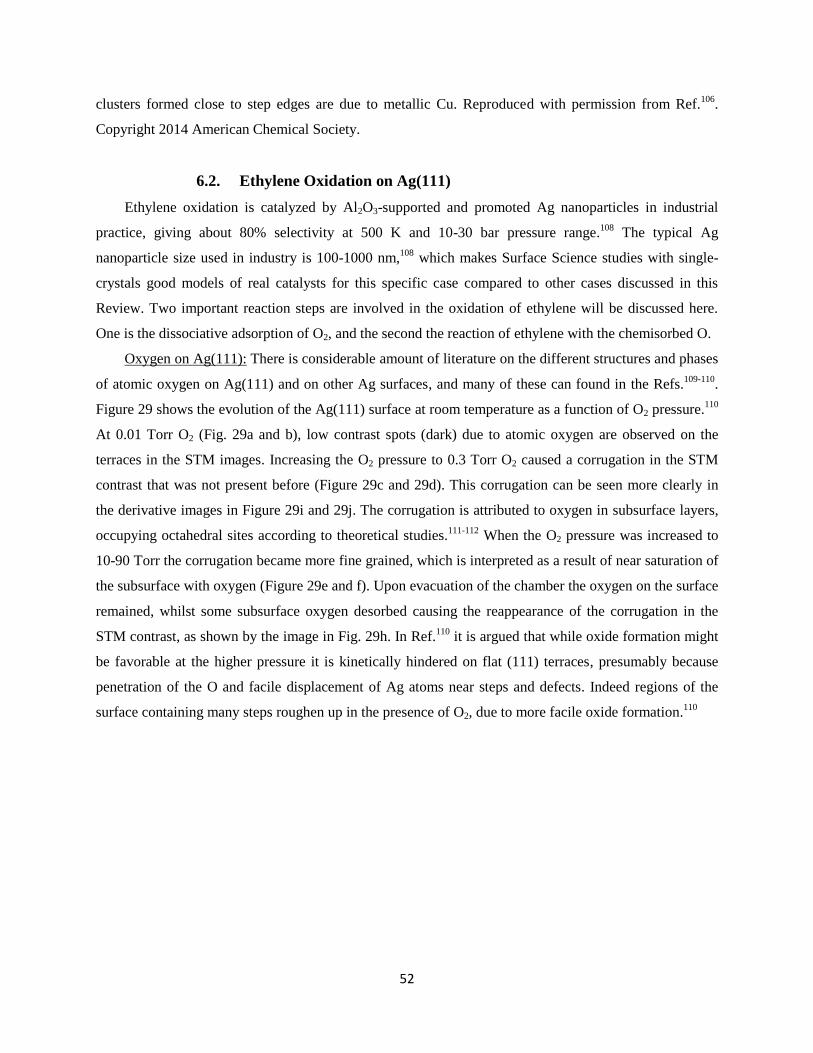
52
clusters formed close to step edges are due to metallic Cu. Reproduced with permission from Ref.106
.
Copyright 2014 American Chemical Society.
6.2. Ethylene Oxidation on Ag(111)
Ethylene oxidation is catalyzed by Al2O3-supported and promoted Ag nanoparticles in industrial
practice, giving about 80% selectivity at 500 K and 10-30 bar pressure range.108
The typical Ag
nanoparticle size used in industry is 100-1000 nm,108
which makes Surface Science studies with single-
crystals good models of real catalysts for this specific case compared to other cases discussed in this
Review. Two important reaction steps are involved in the oxidation of ethylene will be discussed here.
One is the dissociative adsorption of O2, and the second the reaction of ethylene with the chemisorbed O.
Oxygen on Ag(111): There is considerable amount of literature on the different structures and phases
of atomic oxygen on Ag(111) and on other Ag surfaces, and many of these can found in the Refs.109-110
.
Figure 29 shows the evolution of the Ag(111) surface at room temperature as a function of O2 pressure.110
At 0.01 Torr O2 (Fig. 29a and b), low contrast spots (dark) due to atomic oxygen are observed on the
terraces in the STM images. Increasing the O2 pressure to 0.3 Torr O2 caused a corrugation in the STM
contrast that was not present before (Figure 29c and 29d). This corrugation can be seen more clearly in
the derivative images in Figure 29i and 29j. The corrugation is attributed to oxygen in subsurface layers,
occupying octahedral sites according to theoretical studies.111-112
When the O2 pressure was increased to
10-90 Torr the corrugation became more fine grained, which is interpreted as a result of near saturation of
the subsurface with oxygen (Figure 29e and f). Upon evacuation of the chamber the oxygen on the surface
remained, whilst some subsurface oxygen desorbed causing the reappearance of the corrugation in the
STM contrast, as shown by the image in Fig. 29h. In Ref.110
it is argued that while oxide formation might
be favorable at the higher pressure it is kinetically hindered on flat (111) terraces, presumably because
penetration of the O and facile displacement of Ag atoms near steps and defects. Indeed regions of the
surface containing many steps roughen up in the presence of O2, due to more facile oxide formation.110
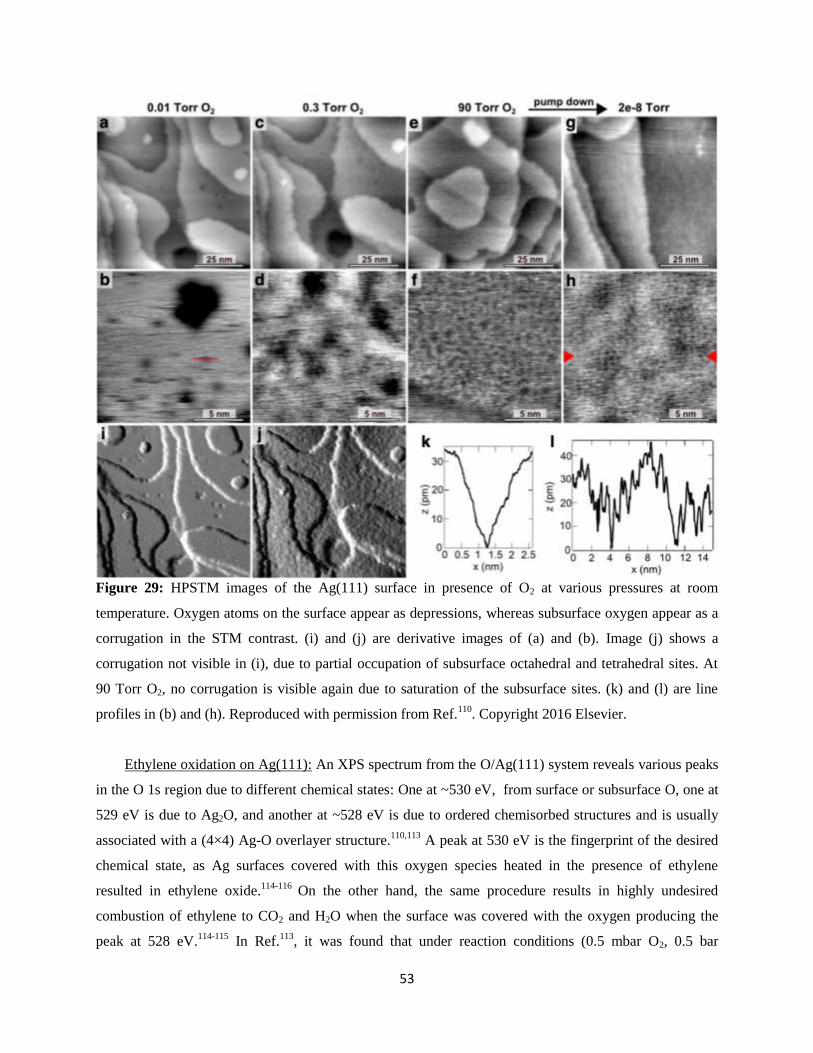
53
Figure 29: HPSTM images of the Ag(111) surface in presence of O2 at various pressures at room
temperature. Oxygen atoms on the surface appear as depressions, whereas subsurface oxygen appear as a
corrugation in the STM contrast. (i) and (j) are derivative images of (a) and (b). Image (j) shows a
corrugation not visible in (i), due to partial occupation of subsurface octahedral and tetrahedral sites. At
90 Torr O2, no corrugation is visible again due to saturation of the subsurface sites. (k) and (l) are line
profiles in (b) and (h). Reproduced with permission from Ref.110
. Copyright 2016 Elsevier.
Ethylene oxidation on Ag(111): An XPS spectrum from the O/Ag(111) system reveals various peaks
in the O 1s region due to different chemical states: One at ~530 eV, from surface or subsurface O, one at
529 eV is due to Ag2O, and another at ~528 eV is due to ordered chemisorbed structures and is usually
associated with a (4×4) Ag-O overlayer structure.110,113
A peak at 530 eV is the fingerprint of the desired
chemical state, as Ag surfaces covered with this oxygen species heated in the presence of ethylene
resulted in ethylene oxide.114-116
On the other hand, the same procedure results in highly undesired
combustion of ethylene to CO2 and H2O when the surface was covered with the oxygen producing the
peak at 528 eV.114-115
In Ref.113
, it was found that under reaction conditions (0.5 mbar O2, 0.5 bar
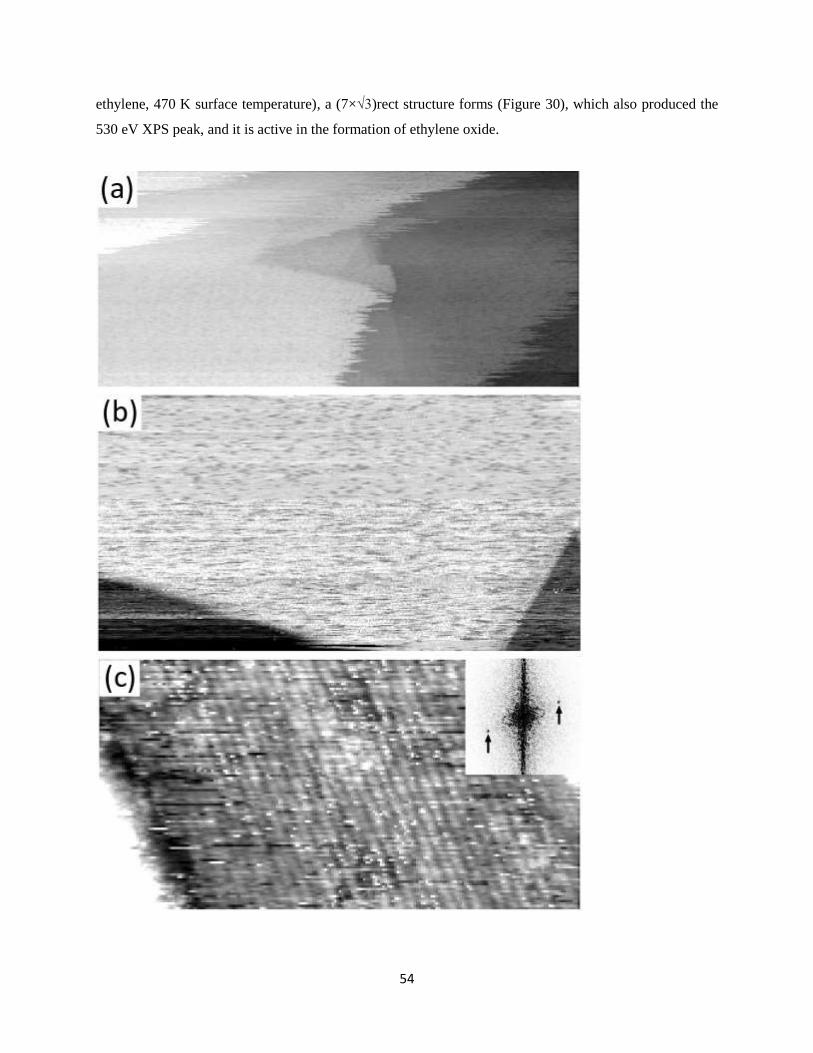
54
ethylene, 470 K surface temperature), a (7×√3)rect structure forms (Figure 30), which also produced the
530 eV XPS peak, and it is active in the formation of ethylene oxide.
55
Figure 30: HPSTM images of the Ag(111) surface in the presence of 0.5 mbar of ethylene and 0.5 mbar
of O2, at a surface temperature of 470 K. Image sizes: (a) 100×45 nm2, (b) 49×26 nm
2, (c) 25×13 nm
2.
The atomically resolved structure in (c) corresponds to a (7×√3)rect periodicity. Reproduced with
permission from Ref.113
. Copyright 2013 Wiley.
6.3 NO Reduction
Both CO and NO are products found in the exhaust gases of gasoline-powered automobiles. They are
toxic and cause severe air pollution. Catalysts are used therefore to convert them to inert gases via the CO
+ NO → ½N2 + CO2 reaction. Hydrogenation of NO is also an interesting reaction with the same idea or
mitigating NO pollution.
NO reduction by CO on Pt(100): Figure 31 shows the morphology of the Pt(100) surface at around
390 K in the presence of CO and NO at various partial pressures with the total pressure fixed at 1.25 bar.
As previously mentioned, the Pt(100) surface exhibits a quasi-hexagonal overlayer of Pt atoms with 6
atoms residing on top of 5 atoms in the second layers. Since no atomic resolution was obtained in the
images in Figure 31, it is not possible to know if the quasi-hexagonal structure is intact or not in the
presence of CO or NO. The structural analysis is based on less direct indications, like changes in
morphology. Figure 31 starts with the first image that was acquired under NO-rich conditions (after
cycling NO-rich and CO-rich conditions twice), where the surface exhibits vacancy islands. The authors
propose that the vacancies form due to switching from the (1×1) surface structure to the quasi-hexagonal
atomic structure, because the quasi-hexagonal structure has 20% more atoms and its formation should
result in vacancies.117
Images 2-4 show time-lapse magnified images under same conditions, where the
vacancy islands disappear. The authors attribute this to the tip-induced changes (tip dragging material
while scanning the surface) because the larger scale image 5 shows vacancy islands outside of the
scanned frame. Under CO-rich conditions (images 8-10), the process is reversed: The quasi-hexagonal
reconstruction is lifted, and two-dimensional nanoclusters are formed on a (1×1) surface by the extra
atoms liberated in the reconstruction,117
similar to observations at room temperature.37
Most clusters
appear near the step edges. Another evidence for these transformations is the shape of the vacancy islands
and clusters, which respectively show weak hexagonal and weak rectangular geometry in higher
resolution images.117
Final remarks should be made about oxidation of the surface in the presence of NO.
When the Pt surface is oxidized, it appears rougher than under NO-rich conditions in Figure 31.117
Therefore, oxidation of the surface can be ruled out in this study.
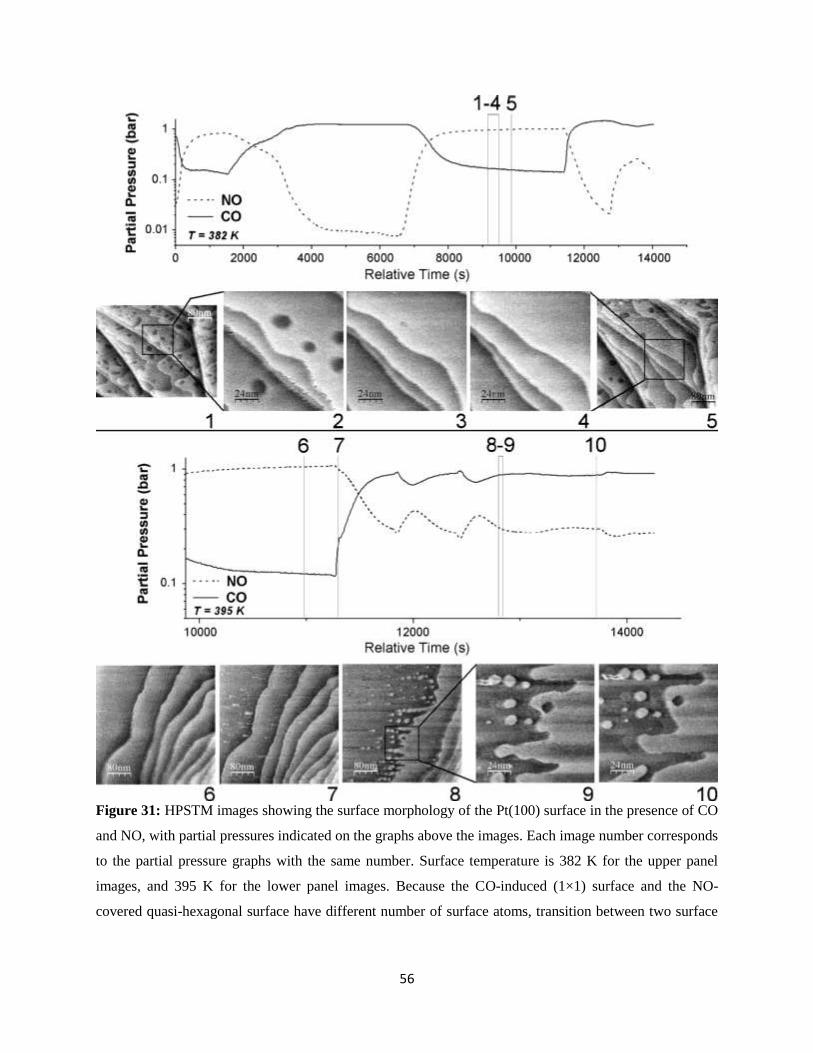
56
Figure 31: HPSTM images showing the surface morphology of the Pt(100) surface in the presence of CO
and NO, with partial pressures indicated on the graphs above the images. Each image number corresponds
to the partial pressure graphs with the same number. Surface temperature is 382 K for the upper panel
images, and 395 K for the lower panel images. Because the CO-induced (1×1) surface and the NO-
covered quasi-hexagonal surface have different number of surface atoms, transition between two surface
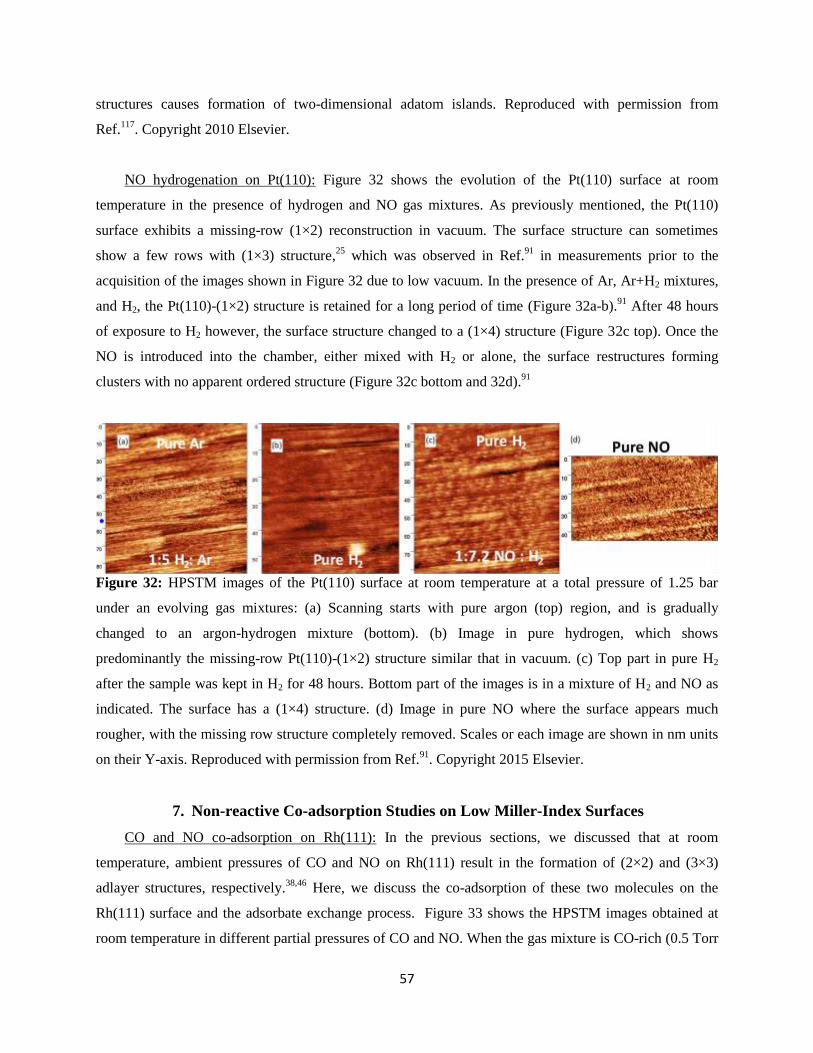
57
structures causes formation of two-dimensional adatom islands. Reproduced with permission from
Ref.117
. Copyright 2010 Elsevier.
NO hydrogenation on Pt(110): Figure 32 shows the evolution of the Pt(110) surface at room
temperature in the presence of hydrogen and NO gas mixtures. As previously mentioned, the Pt(110)
surface exhibits a missing-row (1×2) reconstruction in vacuum. The surface structure can sometimes
show a few rows with (1×3) structure,25
which was observed in Ref.91
in measurements prior to the
acquisition of the images shown in Figure 32 due to low vacuum. In the presence of Ar, Ar+H2 mixtures,
and H2, the Pt(110)-(1×2) structure is retained for a long period of time (Figure 32a-b).91
After 48 hours
of exposure to H2 however, the surface structure changed to a (1×4) structure (Figure 32c top). Once the
NO is introduced into the chamber, either mixed with H2 or alone, the surface restructures forming
clusters with no apparent ordered structure (Figure 32c bottom and 32d).91
Figure 32: HPSTM images of the Pt(110) surface at room temperature at a total pressure of 1.25 bar
under an evolving gas mixtures: (a) Scanning starts with pure argon (top) region, and is gradually
changed to an argon-hydrogen mixture (bottom). (b) Image in pure hydrogen, which shows
predominantly the missing-row Pt(110)-(1×2) structure similar that in vacuum. (c) Top part in pure H2
after the sample was kept in H2 for 48 hours. Bottom part of the images is in a mixture of H2 and NO as
indicated. The surface has a (1×4) structure. (d) Image in pure NO where the surface appears much
rougher, with the missing row structure completely removed. Scales or each image are shown in nm units
on their Y-axis. Reproduced with permission from Ref.91
. Copyright 2015 Elsevier.
7. Non-reactive Co-adsorption Studies on Low Miller-Index Surfaces
CO and NO co-adsorption on Rh(111): In the previous sections, we discussed that at room
temperature, ambient pressures of CO and NO on Rh(111) result in the formation of (2×2) and (3×3)
adlayer structures, respectively.38,46
Here, we discuss the co-adsorption of these two molecules on the
Rh(111) surface and the adsorbate exchange process. Figure 33 shows the HPSTM images obtained at
room temperature in different partial pressures of CO and NO. When the gas mixture is CO-rich (0.5 Torr
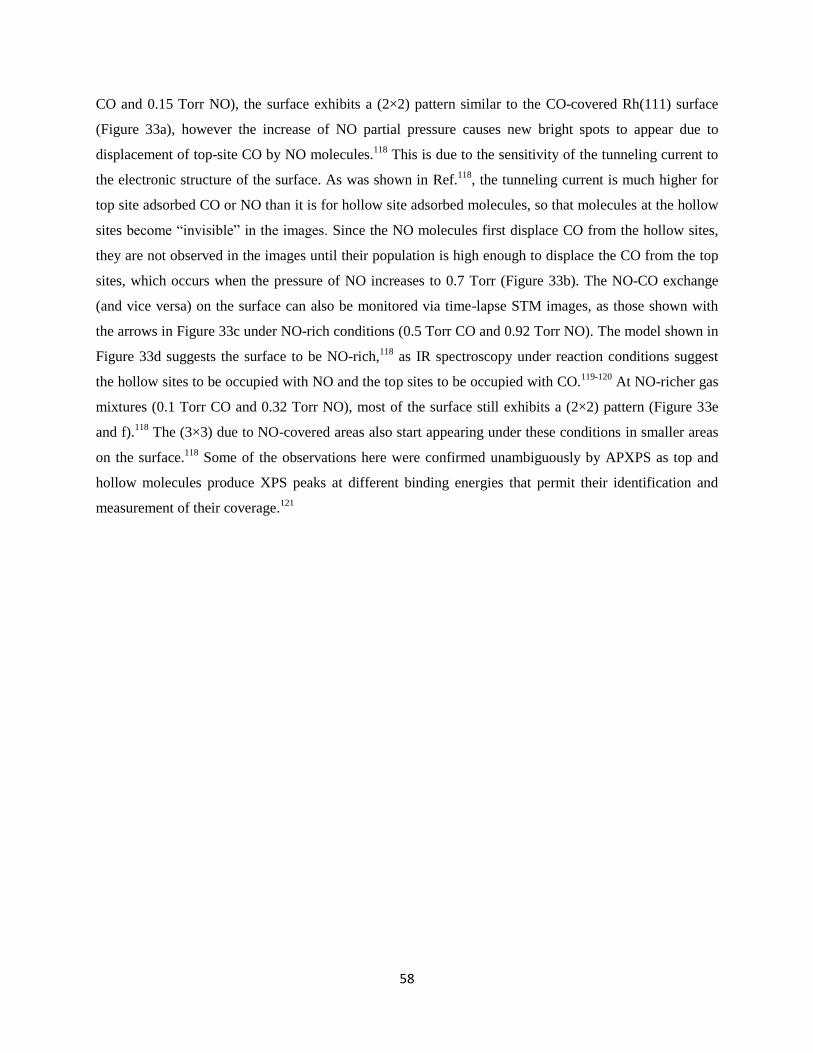
58
CO and 0.15 Torr NO), the surface exhibits a (2×2) pattern similar to the CO-covered Rh(111) surface
(Figure 33a), however the increase of NO partial pressure causes new bright spots to appear due to
displacement of top-site CO by NO molecules.118
This is due to the sensitivity of the tunneling current to
the electronic structure of the surface. As was shown in Ref.118
, the tunneling current is much higher for
top site adsorbed CO or NO than it is for hollow site adsorbed molecules, so that molecules at the hollow
sites become “invisible” in the images. Since the NO molecules first displace CO from the hollow sites,
they are not observed in the images until their population is high enough to displace the CO from the top
sites, which occurs when the pressure of NO increases to 0.7 Torr (Figure 33b). The NO-CO exchange
(and vice versa) on the surface can also be monitored via time-lapse STM images, as those shown with
the arrows in Figure 33c under NO-rich conditions (0.5 Torr CO and 0.92 Torr NO). The model shown in
Figure 33d suggests the surface to be NO-rich,118
as IR spectroscopy under reaction conditions suggest
the hollow sites to be occupied with NO and the top sites to be occupied with CO.119-120
At NO-richer gas
mixtures (0.1 Torr CO and 0.32 Torr NO), most of the surface still exhibits a (2×2) pattern (Figure 33e
and f).118
The (3×3) due to NO-covered areas also start appearing under these conditions in smaller areas
on the surface.118
Some of the observations here were confirmed unambiguously by APXPS as top and
hollow molecules produce XPS peaks at different binding energies that permit their identification and
measurement of their coverage.121
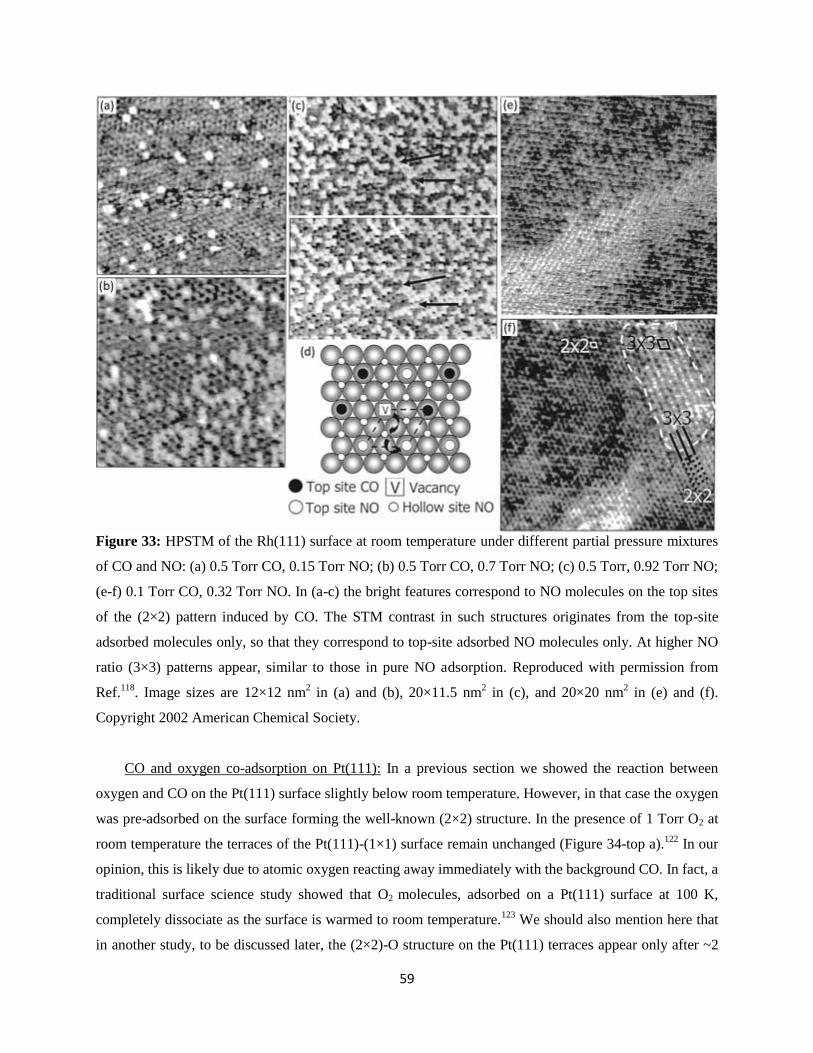
59
Figure 33: HPSTM of the Rh(111) surface at room temperature under different partial pressure mixtures
of CO and NO: (a) 0.5 Torr CO, 0.15 Torr NO; (b) 0.5 Torr CO, 0.7 Torr NO; (c) 0.5 Torr, 0.92 Torr NO;
(e-f) 0.1 Torr CO, 0.32 Torr NO. In (a-c) the bright features correspond to NO molecules on the top sites
of the (2×2) pattern induced by CO. The STM contrast in such structures originates from the top-site
adsorbed molecules only, so that they correspond to top-site adsorbed NO molecules only. At higher NO
ratio (3×3) patterns appear, similar to those in pure NO adsorption. Reproduced with permission from
Ref.118
. Image sizes are 12×12 nm2 in (a) and (b), 20×11.5 nm
2 in (c), and 20×20 nm
2 in (e) and (f).
Copyright 2002 American Chemical Society.
CO and oxygen co-adsorption on Pt(111): In a previous section we showed the reaction between
oxygen and CO on the Pt(111) surface slightly below room temperature. However, in that case the oxygen
was pre-adsorbed on the surface forming the well-known (2×2) structure. In the presence of 1 Torr O2 at
room temperature the terraces of the Pt(111)-(1×1) surface remain unchanged (Figure 34-top a).122
In our
opinion, this is likely due to atomic oxygen reacting away immediately with the background CO. In fact, a
traditional surface science study showed that O2 molecules, adsorbed on a Pt(111) surface at 100 K,
completely dissociate as the surface is warmed to room temperature.123
We should also mention here that
in another study, to be discussed later, the (2×2)-O structure on the Pt(111) terraces appear only after ~2
60
hours of exposure to 1 Torr O2.The more active step edges, however, are oxidized (Figure 34-top a).122
Once CO is added into the gas mixture, at 0.01 Torr partial pressure, a somewhat ordered structure due to
adsorbed CO on the Pt(111) surface appeared (Figure 34-top b). Increasing the CO partial pressure
changed the moiré pattern of the CO adlayer structure (Figure 34-top c). Although these structures appear
similar to the (√19×√19) R23.4°-13CO structure obtained at room temperature at 1 Torr CO and above,
they are not exactly the same.122
This means that even weakly adsorbed O2 molecules on the surface can
affect the structure to CO. This could be related to the steric repulsion between adsorbed CO molecules
and adsorbed O2 molecules and the fragile structure of a moiré structure that is perturbed easily with
changes in adsorbate density and inclusion of foreign species.
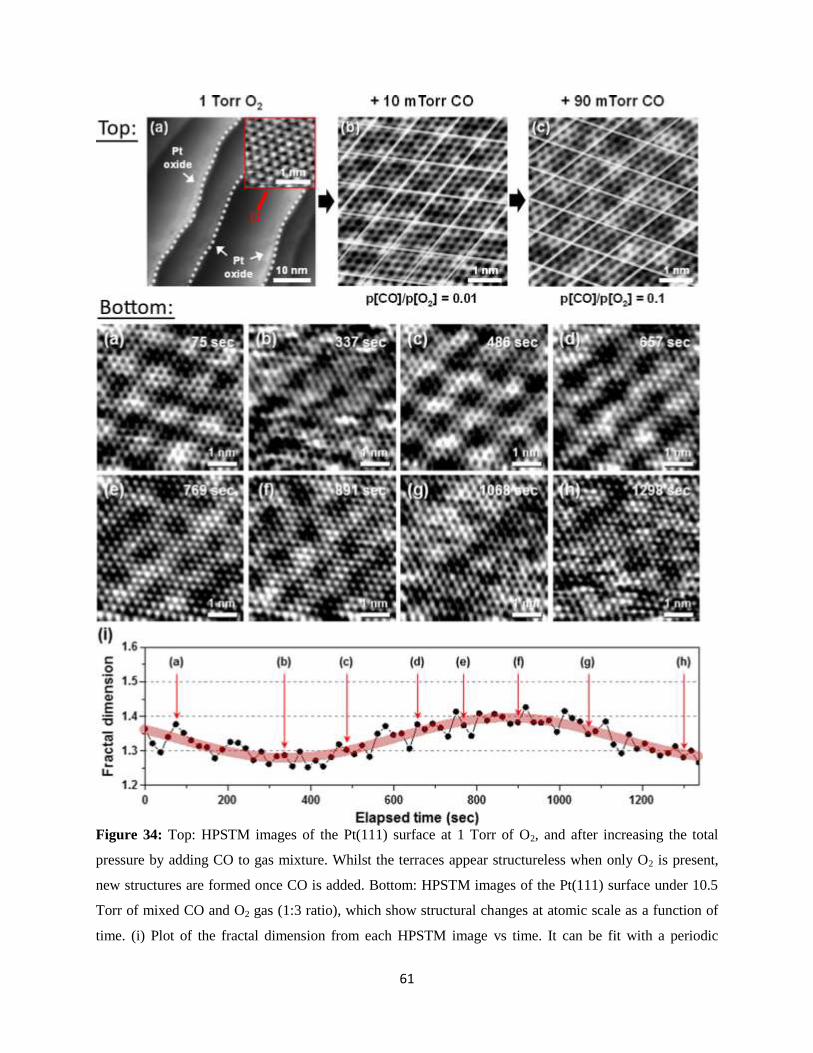
61
Figure 34: Top: HPSTM images of the Pt(111) surface at 1 Torr of O2, and after increasing the total
pressure by adding CO to gas mixture. Whilst the terraces appear structureless when only O2 is present,
new structures are formed once CO is added. Bottom: HPSTM images of the Pt(111) surface under 10.5
Torr of mixed CO and O2 gas (1:3 ratio), which show structural changes at atomic scale as a function of
time. (i) Plot of the fractal dimension from each HPSTM image vs time. It can be fit with a periodic
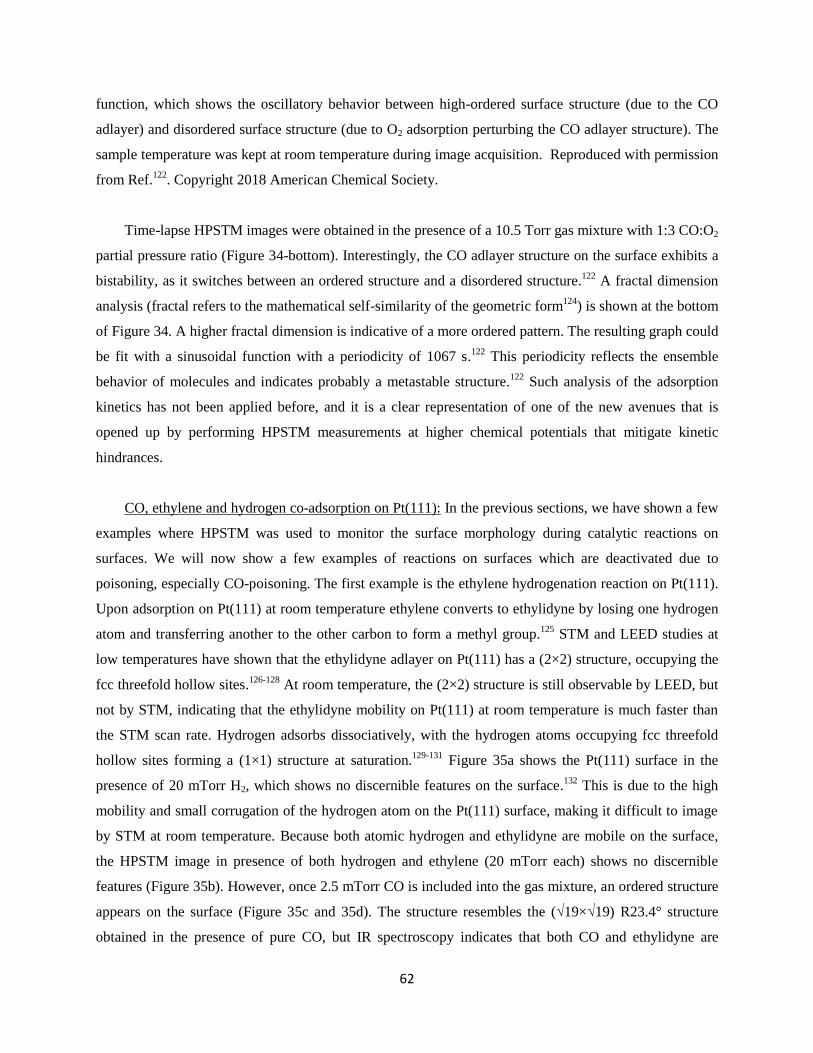
62
function, which shows the oscillatory behavior between high-ordered surface structure (due to the CO
adlayer) and disordered surface structure (due to O2 adsorption perturbing the CO adlayer structure). The
sample temperature was kept at room temperature during image acquisition. Reproduced with permission
from Ref.122
. Copyright 2018 American Chemical Society.
Time-lapse HPSTM images were obtained in the presence of a 10.5 Torr gas mixture with 1:3 CO:O2
partial pressure ratio (Figure 34-bottom). Interestingly, the CO adlayer structure on the surface exhibits a
bistability, as it switches between an ordered structure and a disordered structure.122
A fractal dimension
analysis (fractal refers to the mathematical self-similarity of the geometric form124
) is shown at the bottom
of Figure 34. A higher fractal dimension is indicative of a more ordered pattern. The resulting graph could
be fit with a sinusoidal function with a periodicity of 1067 s.122
This periodicity reflects the ensemble
behavior of molecules and indicates probably a metastable structure.122
Such analysis of the adsorption
kinetics has not been applied before, and it is a clear representation of one of the new avenues that is
opened up by performing HPSTM measurements at higher chemical potentials that mitigate kinetic
hindrances.
CO, ethylene and hydrogen co-adsorption on Pt(111): In the previous sections, we have shown a few
examples where HPSTM was used to monitor the surface morphology during catalytic reactions on
surfaces. We will now show a few examples of reactions on surfaces which are deactivated due to
poisoning, especially CO-poisoning. The first example is the ethylene hydrogenation reaction on Pt(111).
Upon adsorption on Pt(111) at room temperature ethylene converts to ethylidyne by losing one hydrogen
atom and transferring another to the other carbon to form a methyl group.125
STM and LEED studies at
low temperatures have shown that the ethylidyne adlayer on Pt(111) has a (2×2) structure, occupying the
fcc threefold hollow sites.126-128
At room temperature, the (2×2) structure is still observable by LEED, but
not by STM, indicating that the ethylidyne mobility on Pt(111) at room temperature is much faster than
the STM scan rate. Hydrogen adsorbs dissociatively, with the hydrogen atoms occupying fcc threefold
hollow sites forming a (1×1) structure at saturation.129-131
Figure 35a shows the Pt(111) surface in the
presence of 20 mTorr H2, which shows no discernible features on the surface.132
This is due to the high
mobility and small corrugation of the hydrogen atom on the Pt(111) surface, making it difficult to image
by STM at room temperature. Because both atomic hydrogen and ethylidyne are mobile on the surface,
the HPSTM image in presence of both hydrogen and ethylene (20 mTorr each) shows no discernible
features (Figure 35b). However, once 2.5 mTorr CO is included into the gas mixture, an ordered structure
appears on the surface (Figure 35c and 35d). The structure resembles the (√19×√19) R23.4° structure
obtained in the presence of pure CO, but IR spectroscopy indicates that both CO and ethylidyne are
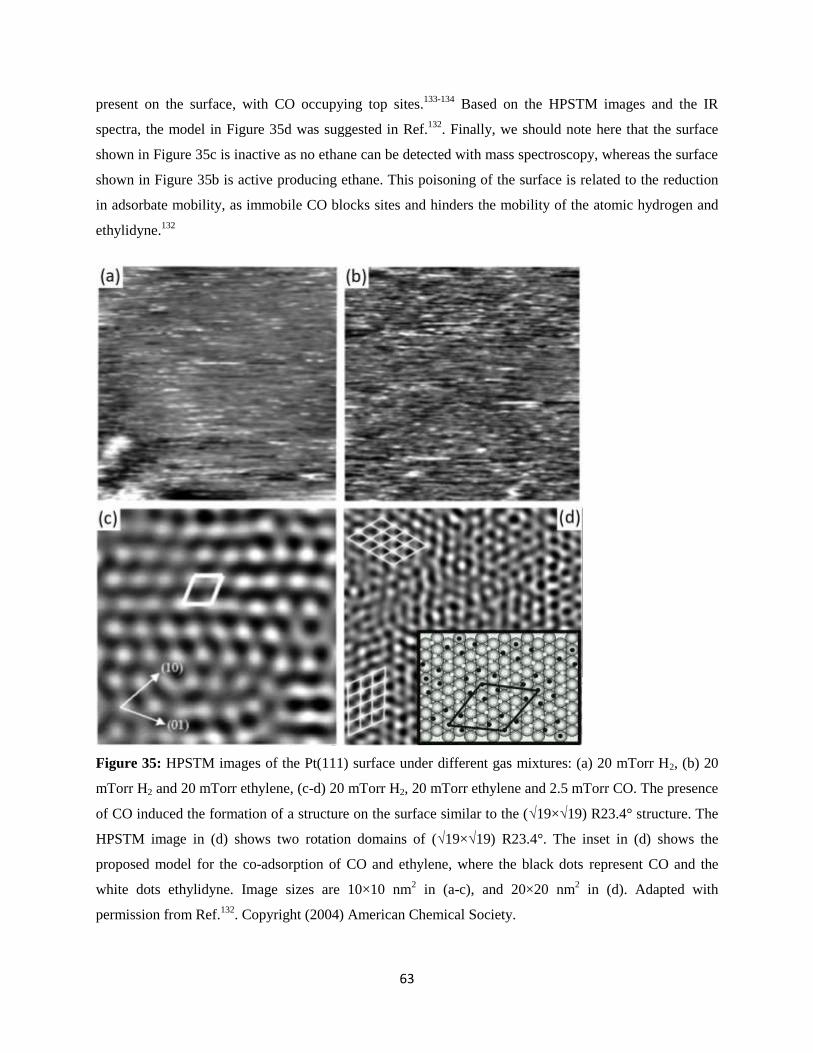
63
present on the surface, with CO occupying top sites.133-134
Based on the HPSTM images and the IR
spectra, the model in Figure 35d was suggested in Ref.132
. Finally, we should note here that the surface
shown in Figure 35c is inactive as no ethane can be detected with mass spectroscopy, whereas the surface
shown in Figure 35b is active producing ethane. This poisoning of the surface is related to the reduction
in adsorbate mobility, as immobile CO blocks sites and hinders the mobility of the atomic hydrogen and
ethylidyne.132
Figure 35: HPSTM images of the Pt(111) surface under different gas mixtures: (a) 20 mTorr H2, (b) 20
mTorr H2 and 20 mTorr ethylene, (c-d) 20 mTorr H2, 20 mTorr ethylene and 2.5 mTorr CO. The presence
of CO induced the formation of a structure on the surface similar to the (√19×√19) R23.4° structure. The
HPSTM image in (d) shows two rotation domains of (√19×√19) R23.4°. The inset in (d) shows the
proposed model for the co-adsorption of CO and ethylene, where the black dots represent CO and the
white dots ethylidyne. Image sizes are 10×10 nm2 in (a-c), and 20×20 nm
2 in (d). Adapted with
permission from Ref.132
. Copyright (2004) American Chemical Society.
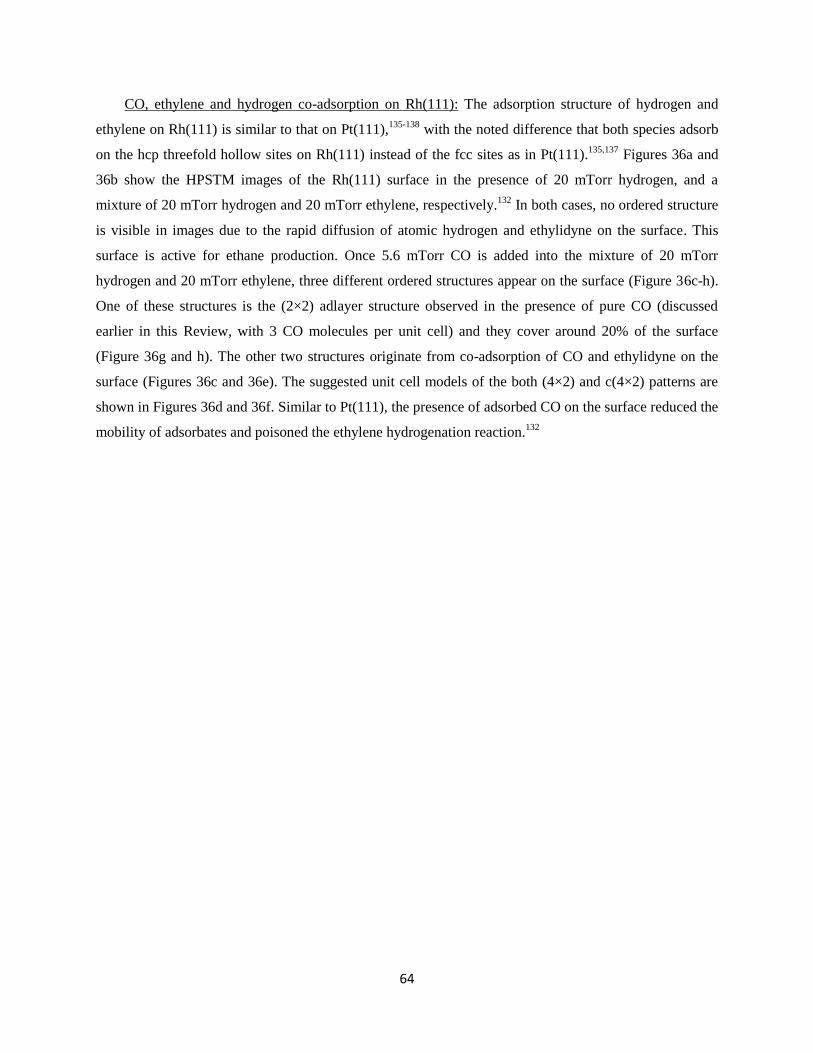
64
CO, ethylene and hydrogen co-adsorption on Rh(111): The adsorption structure of hydrogen and
ethylene on Rh(111) is similar to that on Pt(111),135-138
with the noted difference that both species adsorb
on the hcp threefold hollow sites on Rh(111) instead of the fcc sites as in Pt(111).135,137
Figures 36a and
36b show the HPSTM images of the Rh(111) surface in the presence of 20 mTorr hydrogen, and a
mixture of 20 mTorr hydrogen and 20 mTorr ethylene, respectively.132
In both cases, no ordered structure
is visible in images due to the rapid diffusion of atomic hydrogen and ethylidyne on the surface. This
surface is active for ethane production. Once 5.6 mTorr CO is added into the mixture of 20 mTorr
hydrogen and 20 mTorr ethylene, three different ordered structures appear on the surface (Figure 36c-h).
One of these structures is the (2×2) adlayer structure observed in the presence of pure CO (discussed
earlier in this Review, with 3 CO molecules per unit cell) and they cover around 20% of the surface
(Figure 36g and h). The other two structures originate from co-adsorption of CO and ethylidyne on the
surface (Figures 36c and 36e). The suggested unit cell models of the both (4×2) and c(4×2) patterns are
shown in Figures 36d and 36f. Similar to Pt(111), the presence of adsorbed CO on the surface reduced the
mobility of adsorbates and poisoned the ethylene hydrogenation reaction.132
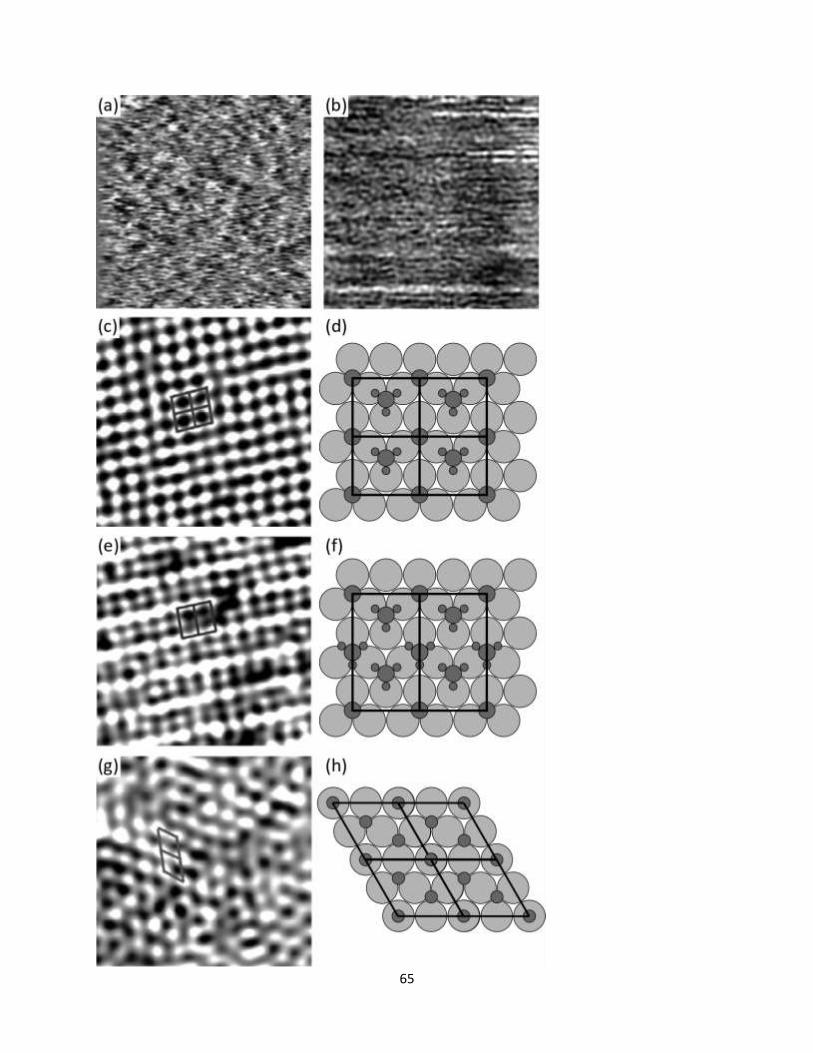
65
66
Figure 36: HPSTM images of the Rh(111) surface under different gas mixtures: (a) 20 mTorr H2, (b) 20
mTorr H2 and 20 mTorr ethylene, (c, e, g) 20 mTorr H2, 20 mTorr ethylene and 5.6 mTorr CO. The
addition of CO into the gas mixture resulted in three different adlayer patterns observed on the Rh(111)
surface attributed to c(4×2), (4×2), and (2×2) structures shown in (d), (f), and (h), respectively. Whilst the
(2×2) pattern is due to CO adsorbates only, the other two structures are due to co-adsorption of CO and
ethylidyne. Image sizes are 10×10 nm2 in (a-c), and 5×5 nm
2 in (e) and (g). Adapted with permission
from Ref.132
. Copyright (2004) American Chemical Society.
CO, ethylene and hydrogen co-adsorption on Pt(100): In previous sections we discussed the
structural changes observed on the quasi-hexagonal overlayer structure of the Pt(100) surface in the
presence of CO and in the presence of ethylene. Even at low pressures, CO lifts the reconstruction and
results in the formation of clusters with (1×1) structure on the surface. This was also observed for
ethylene, but a more recent publication attributed this to the effect of CO contamination from the
background,54
as pure ethylene did not lift the quasi-hexagonal reconstruction. Similar to hydrogen and
ethylene co-adsorption HPSTM studies discussed above for Rh(111) and Pt(111) surfaces, together with
online mass spectroscopy, ethane forms as a result of ethylene hydrogenation on the Pt(100) surface at
room temperature, whilst addition of some CO into the gas mixture poisons the surface.139
Figure 37a
shows the HPSTM image of the Pt(100) surface at room temperature in the presence of 0.5 Torr hydrogen
and 0.5 Torr ethylene, which shows no ordered structure. This is because of the rapid diffusion of atomic
hydrogen and ethylene adsorbates on the surface.139
Once the scanning speed is increased from 60 nm/s to
150 nm/s, some structure can be observed on the surface (Figure 37b), as the STM scanning speed
becomes comparable with the diffusion rate of the adsorbates on the surface. After addition of 3 mTorr
CO into the gas admixture, the surface breaks up into clusters, similar to those observed in the presence of
pure CO (Figure 37c and d). The presence of strongly adsorbed CO, which hampers the diffusion of
atomic hydrogen and ethylene-related adsorbates, is the reason of the poisoning of this model catalyst
surface.139
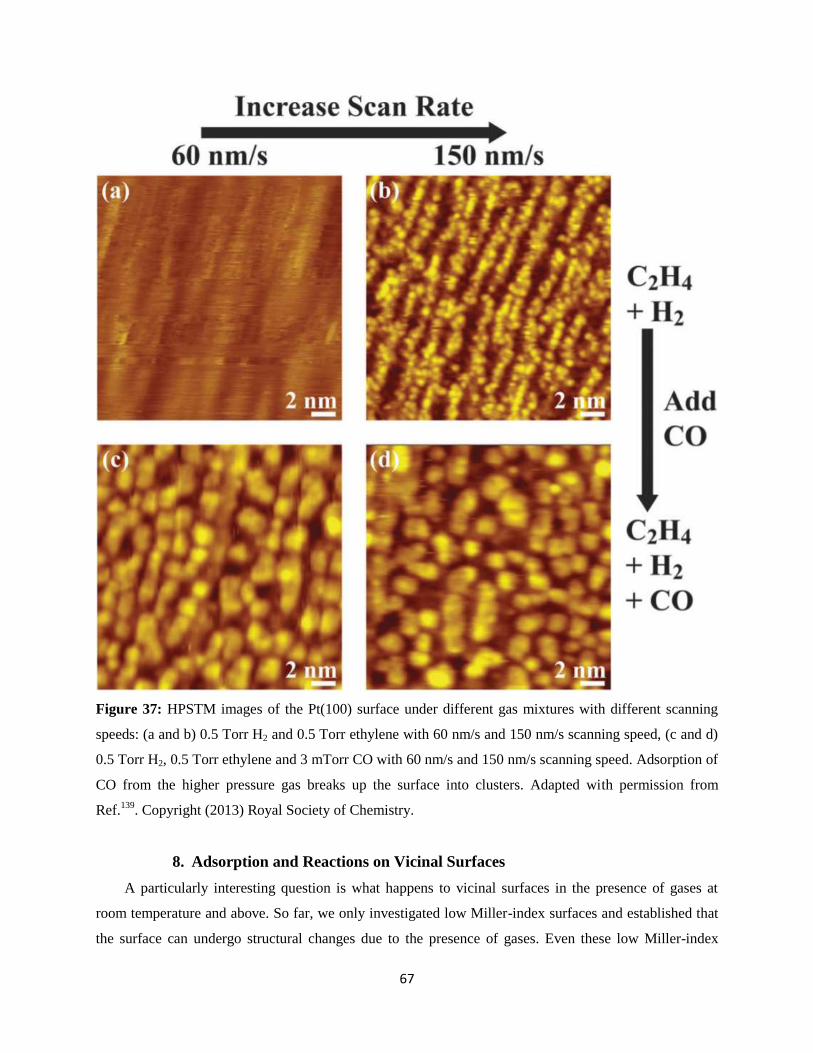
67
Figure 37: HPSTM images of the Pt(100) surface under different gas mixtures with different scanning
speeds: (a and b) 0.5 Torr H2 and 0.5 Torr ethylene with 60 nm/s and 150 nm/s scanning speed, (c and d)
0.5 Torr H2, 0.5 Torr ethylene and 3 mTorr CO with 60 nm/s and 150 nm/s scanning speed. Adsorption of
CO from the higher pressure gas breaks up the surface into clusters. Adapted with permission from
Ref.139
. Copyright (2013) Royal Society of Chemistry.
8. Adsorption and Reactions on Vicinal Surfaces
A particularly interesting question is what happens to vicinal surfaces in the presence of gases at
room temperature and above. So far, we only investigated low Miller-index surfaces and established that
the surface can undergo structural changes due to the presence of gases. Even these low Miller-index
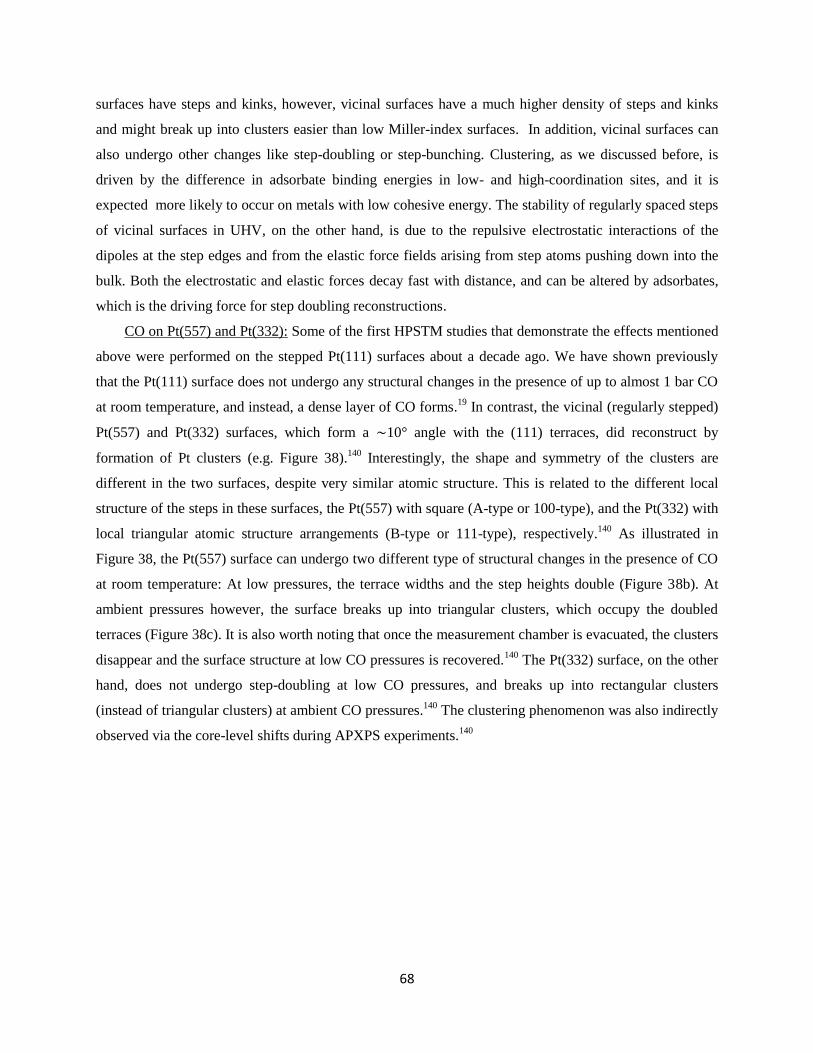
68
surfaces have steps and kinks, however, vicinal surfaces have a much higher density of steps and kinks
and might break up into clusters easier than low Miller-index surfaces. In addition, vicinal surfaces can
also undergo other changes like step-doubling or step-bunching. Clustering, as we discussed before, is
driven by the difference in adsorbate binding energies in low- and high-coordination sites, and it is
expected more likely to occur on metals with low cohesive energy. The stability of regularly spaced steps
of vicinal surfaces in UHV, on the other hand, is due to the repulsive electrostatic interactions of the
dipoles at the step edges and from the elastic force fields arising from step atoms pushing down into the
bulk. Both the electrostatic and elastic forces decay fast with distance, and can be altered by adsorbates,
which is the driving force for step doubling reconstructions.
CO on Pt(557) and Pt(332): Some of the first HPSTM studies that demonstrate the effects mentioned
above were performed on the stepped Pt(111) surfaces about a decade ago. We have shown previously
that the Pt(111) surface does not undergo any structural changes in the presence of up to almost 1 bar CO
at room temperature, and instead, a dense layer of CO forms.19
In contrast, the vicinal (regularly stepped)
Pt(557) and Pt(332) surfaces, which form a ∼10° angle with the (111) terraces, did reconstruct by
formation of Pt clusters (e.g. Figure 38).140
Interestingly, the shape and symmetry of the clusters are
different in the two surfaces, despite very similar atomic structure. This is related to the different local
structure of the steps in these surfaces, the Pt(557) with square (A-type or 100-type), and the Pt(332) with
local triangular atomic structure arrangements (B-type or 111-type), respectively.140
As illustrated in
Figure 38, the Pt(557) surface can undergo two different type of structural changes in the presence of CO
at room temperature: At low pressures, the terrace widths and the step heights double (Figure 38b). At
ambient pressures however, the surface breaks up into triangular clusters, which occupy the doubled
terraces (Figure 38c). It is also worth noting that once the measurement chamber is evacuated, the clusters
disappear and the surface structure at low CO pressures is recovered.140
The Pt(332) surface, on the other
hand, does not undergo step-doubling at low CO pressures, and breaks up into rectangular clusters
(instead of triangular clusters) at ambient CO pressures.140
The clustering phenomenon was also indirectly
observed via the core-level shifts during APXPS experiments.140
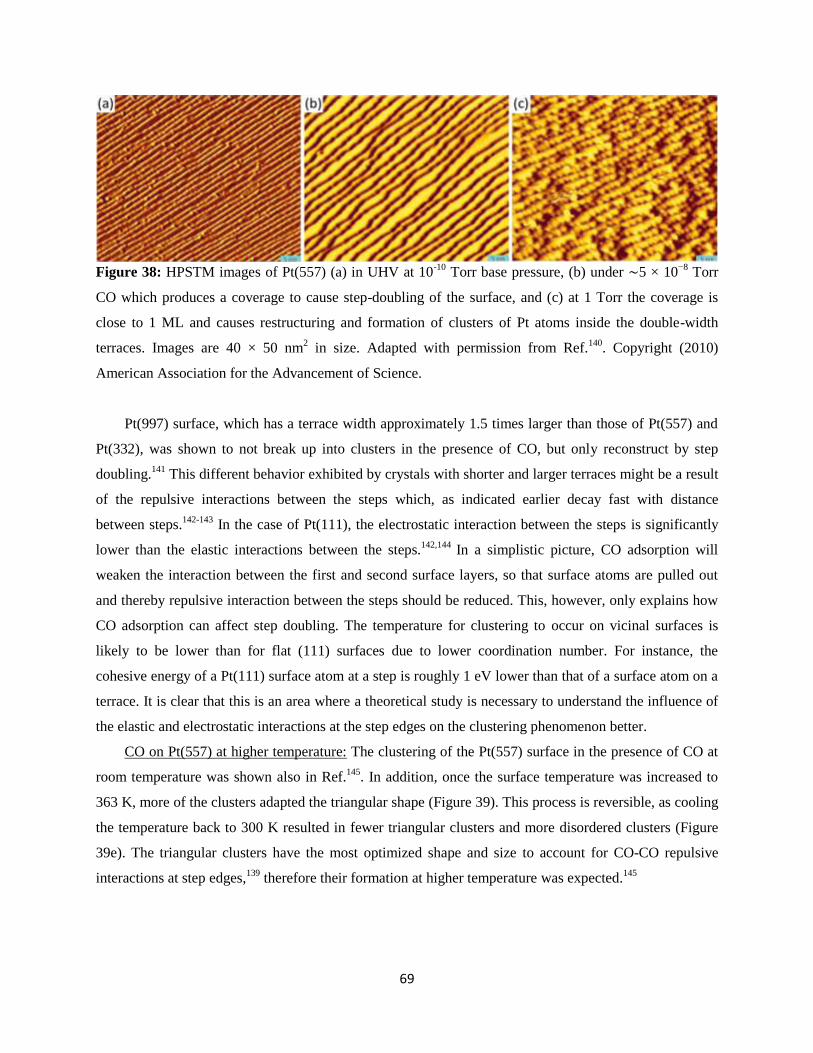
69
Figure 38: HPSTM images of Pt(557) (a) in UHV at 10-10
Torr base pressure, (b) under ∼5 × 10⁻⁸
Torr
CO which produces a coverage to cause step-doubling of the surface, and (c) at 1 Torr the coverage is
close to 1 ML and causes restructuring and formation of clusters of Pt atoms inside the double-width
terraces. Images are 40 × 50 nm2 in size. Adapted with permission from Ref.
140. Copyright (2010)
American Association for the Advancement of Science.
Pt(997) surface, which has a terrace width approximately 1.5 times larger than those of Pt(557) and
Pt(332), was shown to not break up into clusters in the presence of CO, but only reconstruct by step
doubling.141
This different behavior exhibited by crystals with shorter and larger terraces might be a result
of the repulsive interactions between the steps which, as indicated earlier decay fast with distance
between steps.142-143
In the case of Pt(111), the electrostatic interaction between the steps is significantly
lower than the elastic interactions between the steps.142,144
In a simplistic picture, CO adsorption will
weaken the interaction between the first and second surface layers, so that surface atoms are pulled out
and thereby repulsive interaction between the steps should be reduced. This, however, only explains how
CO adsorption can affect step doubling. The temperature for clustering to occur on vicinal surfaces is
likely to be lower than for flat (111) surfaces due to lower coordination number. For instance, the
cohesive energy of a Pt(111) surface atom at a step is roughly 1 eV lower than that of a surface atom on a
terrace. It is clear that this is an area where a theoretical study is necessary to understand the influence of
the elastic and electrostatic interactions at the step edges on the clustering phenomenon better.
CO on Pt(557) at higher temperature: The clustering of the Pt(557) surface in the presence of CO at
room temperature was shown also in Ref.145
. In addition, once the surface temperature was increased to
363 K, more of the clusters adapted the triangular shape (Figure 39). This process is reversible, as cooling
the temperature back to 300 K resulted in fewer triangular clusters and more disordered clusters (Figure
39e). The triangular clusters have the most optimized shape and size to account for CO-CO repulsive
interactions at step edges,139
therefore their formation at higher temperature was expected.145
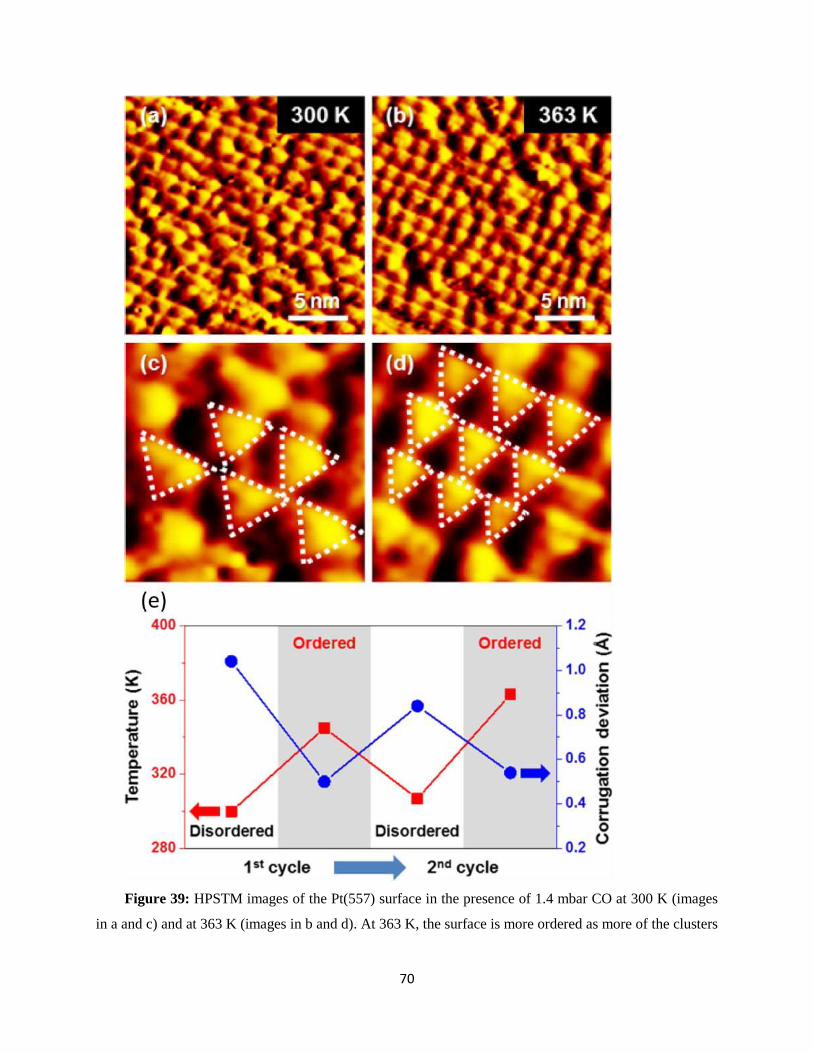
70
Figure 39: HPSTM images of the Pt(557) surface in the presence of 1.4 mbar CO at 300 K (images
in a and c) and at 363 K (images in b and d). At 363 K, the surface is more ordered as more of the clusters
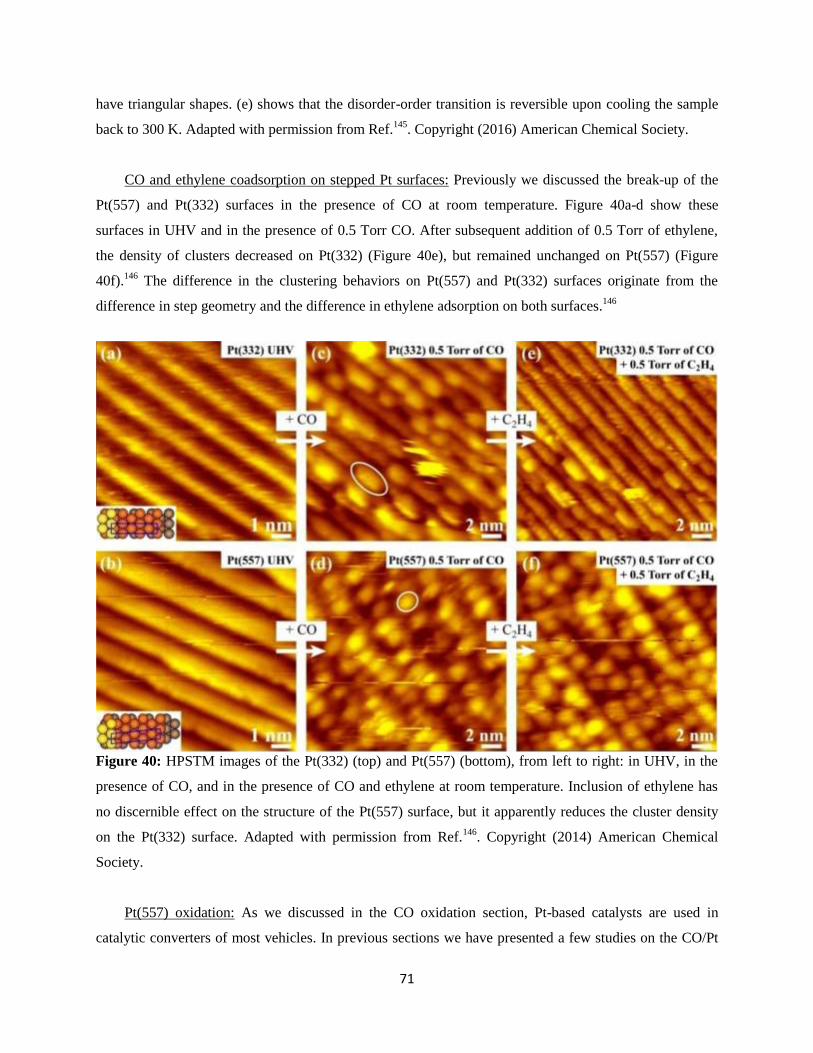
71
have triangular shapes. (e) shows that the disorder-order transition is reversible upon cooling the sample
back to 300 K. Adapted with permission from Ref.145
. Copyright (2016) American Chemical Society.
CO and ethylene coadsorption on stepped Pt surfaces: Previously we discussed the break-up of the
Pt(557) and Pt(332) surfaces in the presence of CO at room temperature. Figure 40a-d show these
surfaces in UHV and in the presence of 0.5 Torr CO. After subsequent addition of 0.5 Torr of ethylene,
the density of clusters decreased on Pt(332) (Figure 40e), but remained unchanged on Pt(557) (Figure
40f).146
The difference in the clustering behaviors on Pt(557) and Pt(332) surfaces originate from the
difference in step geometry and the difference in ethylene adsorption on both surfaces.146
Figure 40: HPSTM images of the Pt(332) (top) and Pt(557) (bottom), from left to right: in UHV, in the
presence of CO, and in the presence of CO and ethylene at room temperature. Inclusion of ethylene has
no discernible effect on the structure of the Pt(557) surface, but it apparently reduces the cluster density
on the Pt(332) surface. Adapted with permission from Ref.146
. Copyright (2014) American Chemical
Society.
Pt(557) oxidation: As we discussed in the CO oxidation section, Pt-based catalysts are used in
catalytic converters of most vehicles. In previous sections we have presented a few studies on the CO/Pt
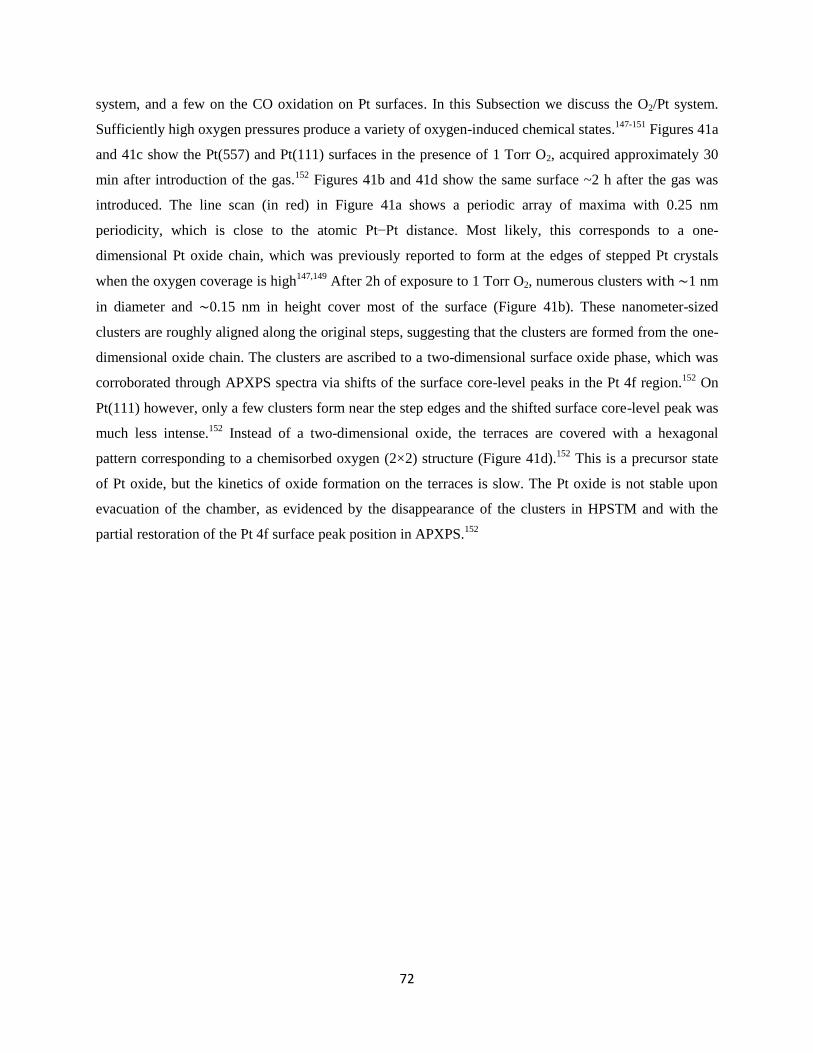
72
system, and a few on the CO oxidation on Pt surfaces. In this Subsection we discuss the O2/Pt system.
Sufficiently high oxygen pressures produce a variety of oxygen-induced chemical states.147-151
Figures 41a
and 41c show the Pt(557) and Pt(111) surfaces in the presence of 1 Torr O2, acquired approximately 30
min after introduction of the gas.152
Figures 41b and 41d show the same surface ~2 h after the gas was
introduced. The line scan (in red) in Figure 41a shows a periodic array of maxima with 0.25 nm
periodicity, which is close to the atomic Pt−Pt distance. Most likely, this corresponds to a one-
dimensional Pt oxide chain, which was previously reported to form at the edges of stepped Pt crystals
when the oxygen coverage is high147,149
After 2h of exposure to 1 Torr O2, numerous clusters with ∼1 nm
in diameter and ∼0.15 nm in height cover most of the surface (Figure 41b). These nanometer-sized
clusters are roughly aligned along the original steps, suggesting that the clusters are formed from the one-
dimensional oxide chain. The clusters are ascribed to a two-dimensional surface oxide phase, which was
corroborated through APXPS spectra via shifts of the surface core-level peaks in the Pt 4f region.152
On
Pt(111) however, only a few clusters form near the step edges and the shifted surface core-level peak was
much less intense.152
Instead of a two-dimensional oxide, the terraces are covered with a hexagonal
pattern corresponding to a chemisorbed oxygen (2×2) structure (Figure 41d).152
This is a precursor state
of Pt oxide, but the kinetics of oxide formation on the terraces is slow. The Pt oxide is not stable upon
evacuation of the chamber, as evidenced by the disappearance of the clusters in HPSTM and with the
partial restoration of the Pt 4f surface peak position in APXPS.152
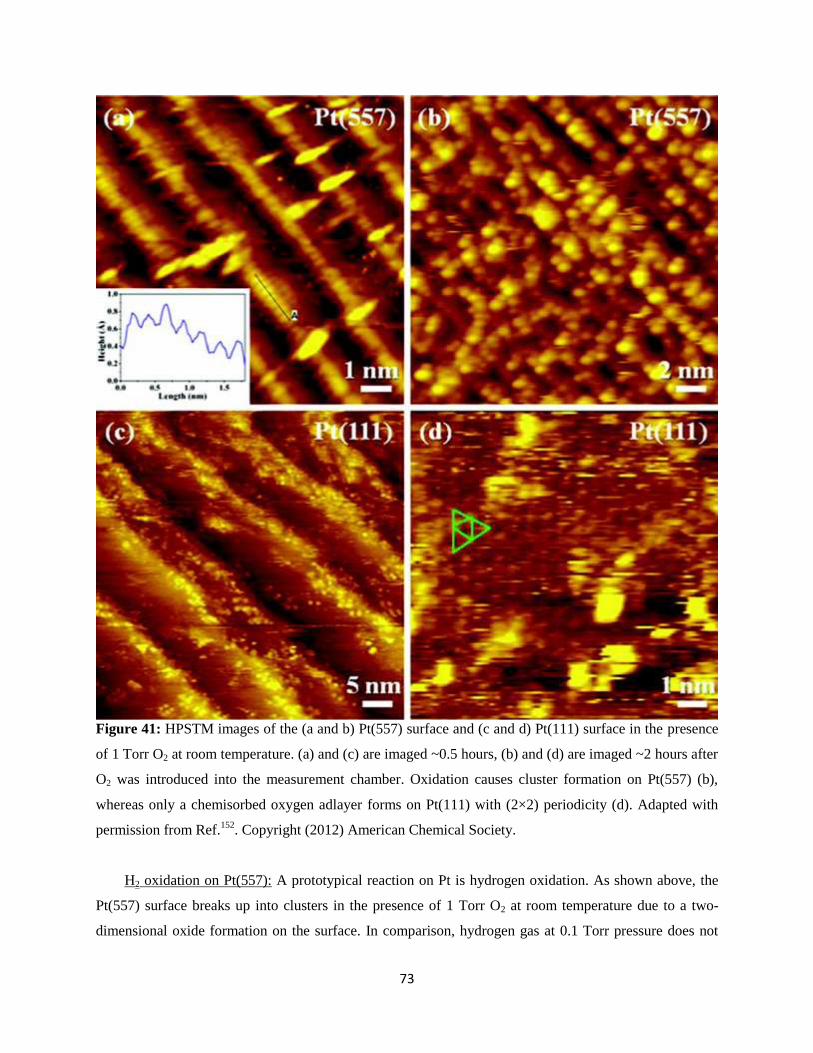
73
Figure 41: HPSTM images of the (a and b) Pt(557) surface and (c and d) Pt(111) surface in the presence
of 1 Torr O2 at room temperature. (a) and (c) are imaged ~0.5 hours, (b) and (d) are imaged ~2 hours after
O2 was introduced into the measurement chamber. Oxidation causes cluster formation on Pt(557) (b),
whereas only a chemisorbed oxygen adlayer forms on Pt(111) with (2×2) periodicity (d). Adapted with
permission from Ref.152
. Copyright (2012) American Chemical Society.
H2 oxidation on Pt(557): A prototypical reaction on Pt is hydrogen oxidation. As shown above, the
Pt(557) surface breaks up into clusters in the presence of 1 Torr O2 at room temperature due to a two-
dimensional oxide formation on the surface. In comparison, hydrogen gas at 0.1 Torr pressure does not
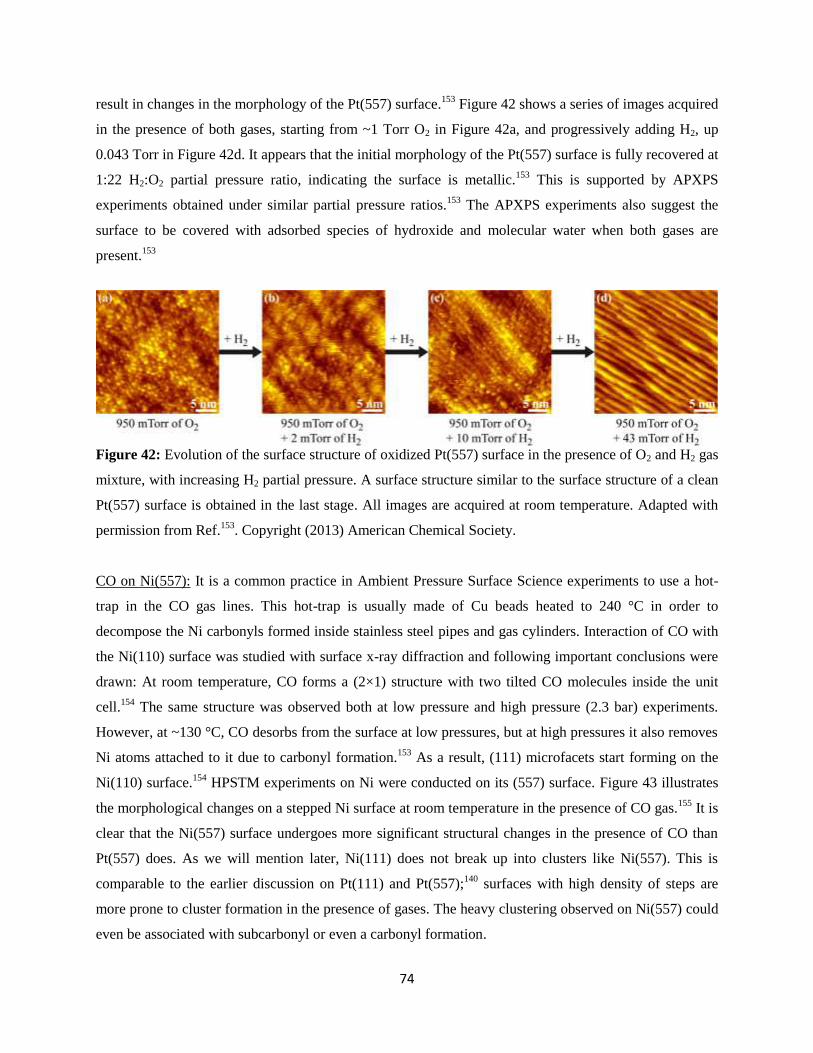
74
result in changes in the morphology of the Pt(557) surface.153
Figure 42 shows a series of images acquired
in the presence of both gases, starting from ~1 Torr O2 in Figure 42a, and progressively adding H2, up
0.043 Torr in Figure 42d. It appears that the initial morphology of the Pt(557) surface is fully recovered at
1:22 H2:O2 partial pressure ratio, indicating the surface is metallic.153
This is supported by APXPS
experiments obtained under similar partial pressure ratios.153
The APXPS experiments also suggest the
surface to be covered with adsorbed species of hydroxide and molecular water when both gases are
present.153
Figure 42: Evolution of the surface structure of oxidized Pt(557) surface in the presence of O2 and H2 gas
mixture, with increasing H2 partial pressure. A surface structure similar to the surface structure of a clean
Pt(557) surface is obtained in the last stage. All images are acquired at room temperature. Adapted with
permission from Ref.153
. Copyright (2013) American Chemical Society.
CO on Ni(557): It is a common practice in Ambient Pressure Surface Science experiments to use a hot-
trap in the CO gas lines. This hot-trap is usually made of Cu beads heated to 240 °C in order to
decompose the Ni carbonyls formed inside stainless steel pipes and gas cylinders. Interaction of CO with
the Ni(110) surface was studied with surface x-ray diffraction and following important conclusions were
drawn: At room temperature, CO forms a (2×1) structure with two tilted CO molecules inside the unit
cell.154
The same structure was observed both at low pressure and high pressure (2.3 bar) experiments.
However, at ~130 °C, CO desorbs from the surface at low pressures, but at high pressures it also removes
Ni atoms attached to it due to carbonyl formation.153
As a result, (111) microfacets start forming on the
Ni(110) surface.154
HPSTM experiments on Ni were conducted on its (557) surface. Figure 43 illustrates
the morphological changes on a stepped Ni surface at room temperature in the presence of CO gas.155
It is
clear that the Ni(557) surface undergoes more significant structural changes in the presence of CO than
Pt(557) does. As we will mention later, Ni(111) does not break up into clusters like Ni(557). This is
comparable to the earlier discussion on Pt(111) and Pt(557);140
surfaces with high density of steps are
more prone to cluster formation in the presence of gases. The heavy clustering observed on Ni(557) could
even be associated with subcarbonyl or even a carbonyl formation.
75
Figure 43: HPSTM images of the Ni(557) surface (a) under UHV at 3 × 10⁻¹⁰
Torr, (b) under UHV at 10–
8 Torr, (c) under 10
–6 Torr CO, and (d) in the presence of 1 Torr CO. All images have a size of 24 × 24
nm2. Adapted with permission from Ref.
155. Copyright (2013) American Chemical Society.
9. Fischer-Tropsch Synthesis on Co Surfaces
Modern gas-to-liquid technology aims to produce liquid fuels and lubricants from synthesis gas (a
mixture of CO, and H2, and sometimes CO2).156-159
The Fischer−Tropsch synthesis (FTS) consists of a
series of reactions that catalytically convert synthesis gas to long-chain hydrocarbons.160-161
The topic has
attracted a great deal of interest in the applied catalysis research over the past few decades.162-165
Co is
among the most often used catalyst in industrial FTS. In order to achieve an optimal catalyst design, it is
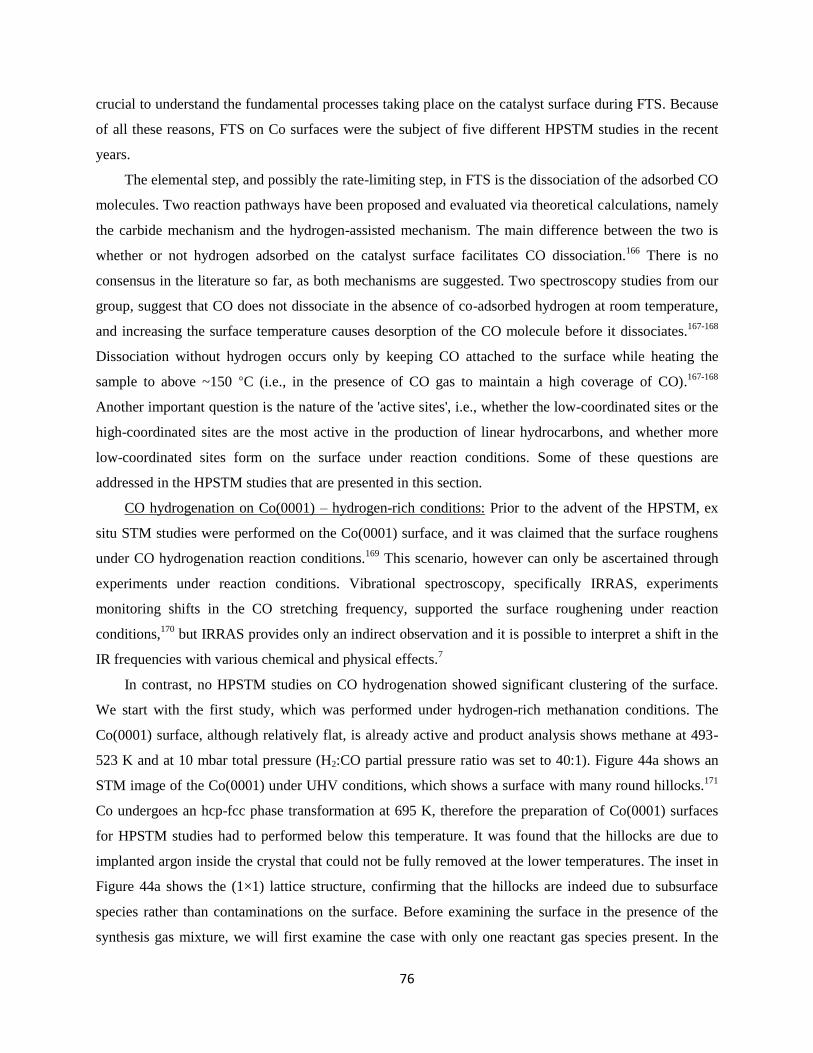
76
crucial to understand the fundamental processes taking place on the catalyst surface during FTS. Because
of all these reasons, FTS on Co surfaces were the subject of five different HPSTM studies in the recent
years.
The elemental step, and possibly the rate-limiting step, in FTS is the dissociation of the adsorbed CO
molecules. Two reaction pathways have been proposed and evaluated via theoretical calculations, namely
the carbide mechanism and the hydrogen-assisted mechanism. The main difference between the two is
whether or not hydrogen adsorbed on the catalyst surface facilitates CO dissociation.166
There is no
consensus in the literature so far, as both mechanisms are suggested. Two spectroscopy studies from our
group, suggest that CO does not dissociate in the absence of co-adsorbed hydrogen at room temperature,
and increasing the surface temperature causes desorption of the CO molecule before it dissociates.167-168
Dissociation without hydrogen occurs only by keeping CO attached to the surface while heating the
sample to above ~150 °C (i.e., in the presence of CO gas to maintain a high coverage of CO).167-168
Another important question is the nature of the 'active sites', i.e., whether the low-coordinated sites or the
high-coordinated sites are the most active in the production of linear hydrocarbons, and whether more
low-coordinated sites form on the surface under reaction conditions. Some of these questions are
addressed in the HPSTM studies that are presented in this section.
CO hydrogenation on Co(0001) – hydrogen-rich conditions: Prior to the advent of the HPSTM, ex
situ STM studies were performed on the Co(0001) surface, and it was claimed that the surface roughens
under CO hydrogenation reaction conditions.169
This scenario, however can only be ascertained through
experiments under reaction conditions. Vibrational spectroscopy, specifically IRRAS, experiments
monitoring shifts in the CO stretching frequency, supported the surface roughening under reaction
conditions,170
but IRRAS provides only an indirect observation and it is possible to interpret a shift in the
IR frequencies with various chemical and physical effects.7
In contrast, no HPSTM studies on CO hydrogenation showed significant clustering of the surface.
We start with the first study, which was performed under hydrogen-rich methanation conditions. The
Co(0001) surface, although relatively flat, is already active and product analysis shows methane at 493-
523 K and at 10 mbar total pressure (H2:CO partial pressure ratio was set to 40:1). Figure 44a shows an
STM image of the Co(0001) under UHV conditions, which shows a surface with many round hillocks.171
Co undergoes an hcp-fcc phase transformation at 695 K, therefore the preparation of Co(0001) surfaces
for HPSTM studies had to performed below this temperature. It was found that the hillocks are due to
implanted argon inside the crystal that could not be fully removed at the lower temperatures. The inset in
Figure 44a shows the (1×1) lattice structure, confirming that the hillocks are indeed due to subsurface
species rather than contaminations on the surface. Before examining the surface in the presence of the
synthesis gas mixture, we will first examine the case with only one reactant gas species present. In the
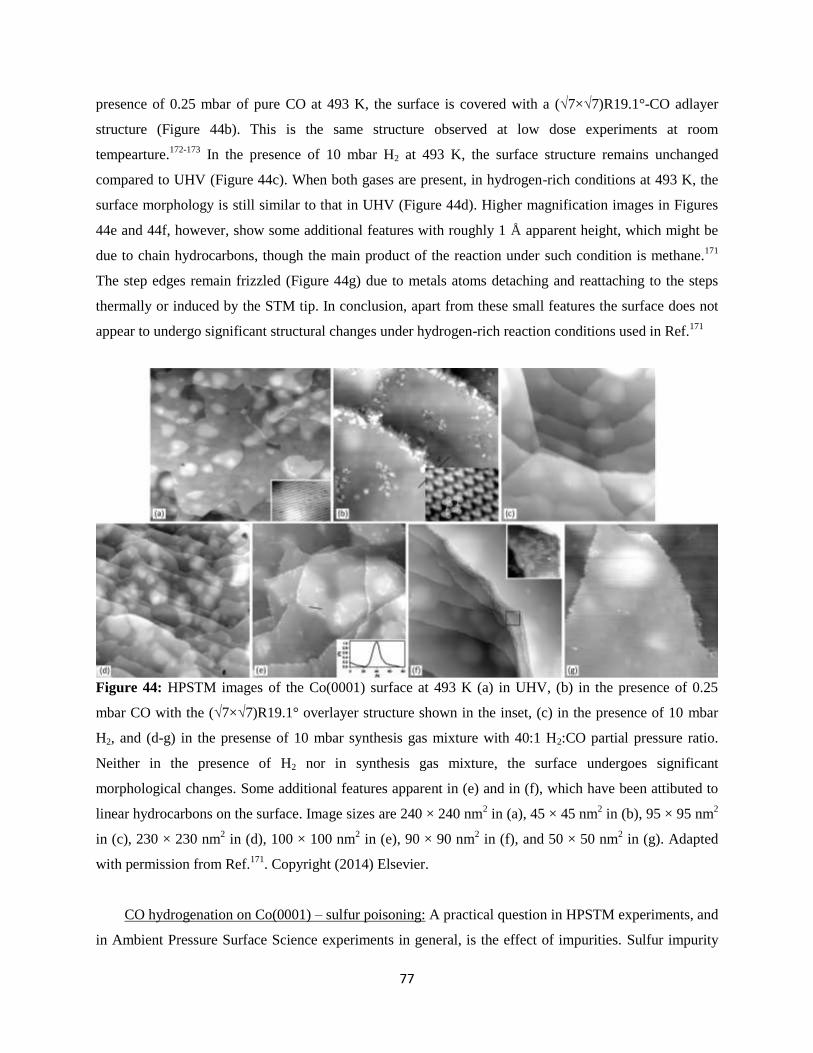
77
presence of 0.25 mbar of pure CO at 493 K, the surface is covered with a (√7×√7)R19.1°-CO adlayer
structure (Figure 44b). This is the same structure observed at low dose experiments at room
tempearture.172-173
In the presence of 10 mbar H2 at 493 K, the surface structure remains unchanged
compared to UHV (Figure 44c). When both gases are present, in hydrogen-rich conditions at 493 K, the
surface morphology is still similar to that in UHV (Figure 44d). Higher magnification images in Figures
44e and 44f, however, show some additional features with roughly 1 Å apparent height, which might be
due to chain hydrocarbons, though the main product of the reaction under such condition is methane.171
The step edges remain frizzled (Figure 44g) due to metals atoms detaching and reattaching to the steps
thermally or induced by the STM tip. In conclusion, apart from these small features the surface does not
appear to undergo significant structural changes under hydrogen-rich reaction conditions used in Ref.171
Figure 44: HPSTM images of the Co(0001) surface at 493 K (a) in UHV, (b) in the presence of 0.25
mbar CO with the (√7×√7)R19.1° overlayer structure shown in the inset, (c) in the presence of 10 mbar
H2, and (d-g) in the presense of 10 mbar synthesis gas mixture with 40:1 H2:CO partial pressure ratio.
Neither in the presence of H2 nor in synthesis gas mixture, the surface undergoes significant
morphological changes. Some additional features apparent in (e) and in (f), which have been attibuted to
linear hydrocarbons on the surface. Image sizes are 240 × 240 nm2 in (a), 45 × 45 nm
2 in (b), 95 × 95 nm
2
in (c), 230 × 230 nm2 in (d), 100 × 100 nm
2 in (e), 90 × 90 nm
2 in (f), and 50 × 50 nm
2 in (g). Adapted
with permission from Ref.171
. Copyright (2014) Elsevier.
CO hydrogenation on Co(0001) – sulfur poisoning: A practical question in HPSTM experiments, and
in Ambient Pressure Surface Science experiments in general, is the effect of impurities. Sulfur impurity
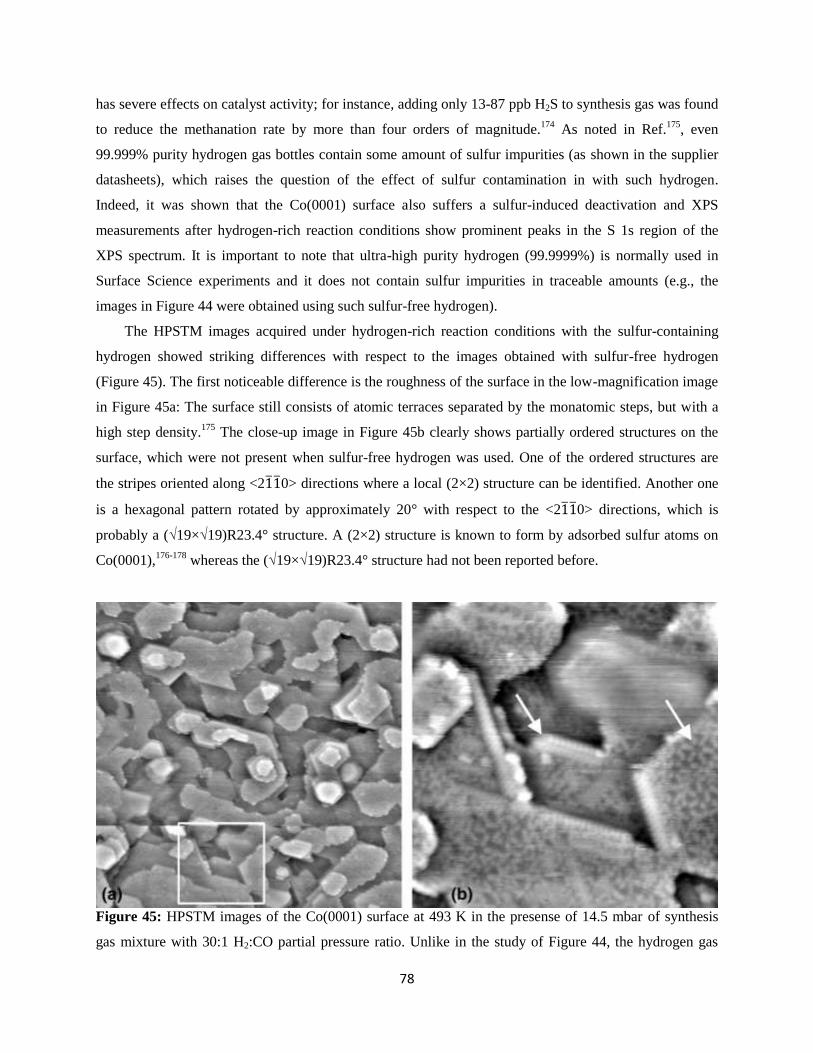
78
has severe effects on catalyst activity; for instance, adding only 13-87 ppb H2S to synthesis gas was found
to reduce the methanation rate by more than four orders of magnitude.174
As noted in Ref.175
, even
99.999% purity hydrogen gas bottles contain some amount of sulfur impurities (as shown in the supplier
datasheets), which raises the question of the effect of sulfur contamination in with such hydrogen.
Indeed, it was shown that the Co(0001) surface also suffers a sulfur-induced deactivation and XPS
measurements after hydrogen-rich reaction conditions show prominent peaks in the S 1s region of the
XPS spectrum. It is important to note that ultra-high purity hydrogen (99.9999%) is normally used in
Surface Science experiments and it does not contain sulfur impurities in traceable amounts (e.g., the
images in Figure 44 were obtained using such sulfur-free hydrogen).
The HPSTM images acquired under hydrogen-rich reaction conditions with the sulfur-containing
hydrogen showed striking differences with respect to the images obtained with sulfur-free hydrogen
(Figure 45). The first noticeable difference is the roughness of the surface in the low-magnification image
in Figure 45a: The surface still consists of atomic terraces separated by the monatomic steps, but with a
high step density.175
The close-up image in Figure 45b clearly shows partially ordered structures on the
surface, which were not present when sulfur-free hydrogen was used. One of the ordered structures are
the stripes oriented along <2110> directions where a local (2×2) structure can be identified. Another one
is a hexagonal pattern rotated by approximately 20° with respect to the <2110> directions, which is
probably a (√19×√19)R23.4° structure. A (2×2) structure is known to form by adsorbed sulfur atoms on
Co(0001),176-178
whereas the (√19×√19)R23.4° structure had not been reported before.
Figure 45: HPSTM images of the Co(0001) surface at 493 K in the presense of 14.5 mbar of synthesis
gas mixture with 30:1 H2:CO partial pressure ratio. Unlike in the study of Figure 44, the hydrogen gas
79
included traceable amounts ouf sulfur impurities. Image sizes are 90 × 90 nm2 in (a), and 25 × 25 nm
2 in
(b). Arrows mark one of the stripes with a (2×2) structure and an area with a (√19×√19)R23.4° structure.
Adapted with permission from Ref.175
. Copyright (2015) Elsevier.
Several test experiments were performed in Ref.175
to clarify the observations: 1- Separate H2S
dosing experiments in UHV resulted in the (√19×√19)R23.4° structure, with the (2×2) structure being
absent. The authors believe that they were not able to prevent coadsorption of CO from the background,
hence no (2×2) structure. 2- Sulfur typically adsorbs very strongly on metal surfaces, which causes the
poising/deactivation of the surface. The Co(0001) surface was imaged after evacuating the chamber from
the hydrogen-rich synthesis gas mixture, but the (2×2) and the (√19×√19)R23.4° patterns remained intact
on the surface. This observation supports the idea that these structures originate from a strongly adsorbed
sulfur. 3- When only the sulfur-containing hydrogen is present (instead of a mixture of hydrogen with
CO), no ordered structures are apparent on the surface. Only after addition of CO to the gas mixture, these
sulfur-induced structures stabilize on the surface. This final observation is a bit counterintuitive, but the
authors believe that the (√19×√19)R23.4° structure on the surface originates from a mixed S/C layer
instead of pure S. This is why this structure was never reported before in the literature. In other words,
contrary to common assumption, the authors believe that both S and C (the latter as a product of CO
hydrogenation) should be present on the surface to poison the surface.
In summary, it is evident that even small traces of impurities can play a major role in Surface
Science studies at ambient pressures. Other than Ref.175
there is no other HPSTM study that deals with the
effects of impurities in the surface structures and chemistry. More studies focused on the role of
impurities are clearly necessary in the Ambient Pressure Surface Science field.
CO on Co(0001): Here, we return to the topic of carbide-mechanism vs. hydrogen-assisted
mechanism of CO dissociation. HPSTM studies were performed in the presence of pure CO in order to
investigate whether the Co(0001) surface is active by direct carbide formation mechanism.179
Figure 46a
shows the image of the surface at 493 K, ~2 h after 0.22 mbar CO was introduced into the chamber. The
most prominent structure on the surface is the hexagonal pattern from a (√7×√7)R19.1° adlayer structure
of adsorbed CO molecules, which is also the structure observed in adsorption experiments at low
temperature in UHV.180-181
There is also an additional triangular structure on the surface with the edges
aligned with the closed-packed directions of Co(0001). These are local stacking faults in the topmost
layer, stabilized by atomic C adsorbing at the fault lines as illustrated by the model shown in inset in
Figure 46b. The reconstruction of the terraces in the form of fault lines requires ejection of Co atoms from
the terrace sites, which attach to the steps.179
Figure 46c shows the image of the surface at 493 K, ~5.5 h
after 0.22 mbar CO was introduced into the chamber. The surface evolves further, and the triangular
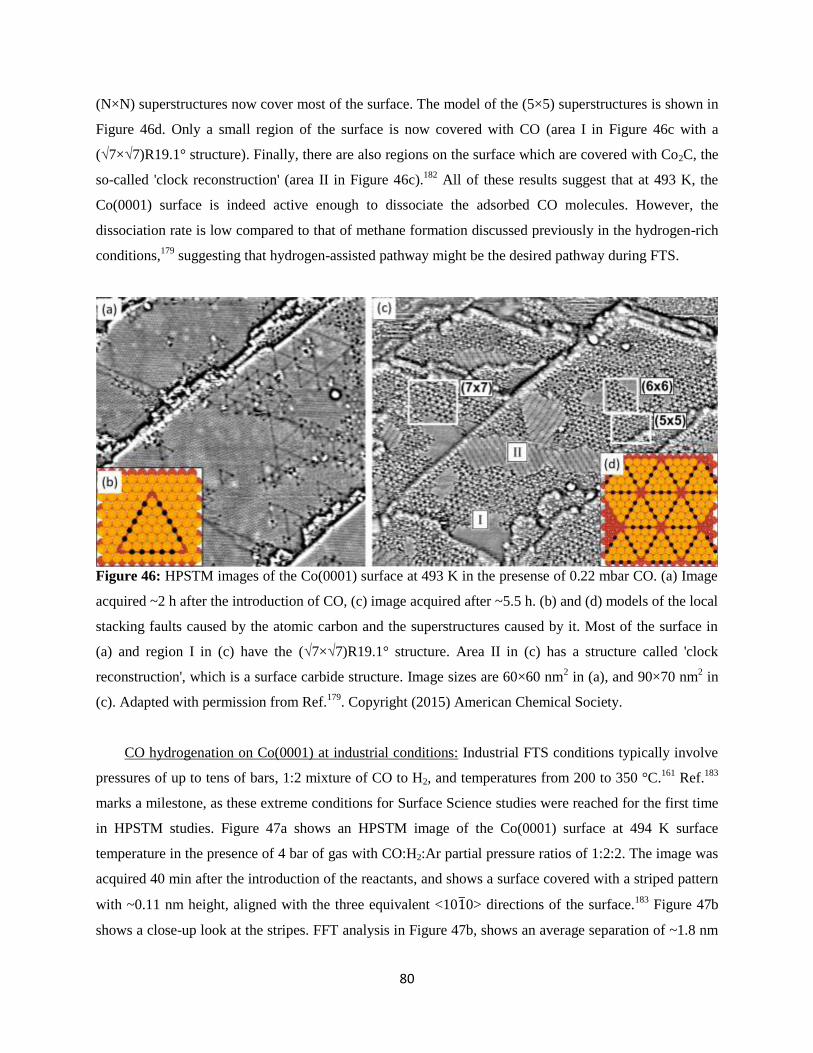
80
(N×N) superstructures now cover most of the surface. The model of the (5×5) superstructures is shown in
Figure 46d. Only a small region of the surface is now covered with CO (area I in Figure 46c with a
(√7×√7)R19.1° structure). Finally, there are also regions on the surface which are covered with Co2C, the
so-called 'clock reconstruction' (area II in Figure 46c).182
All of these results suggest that at 493 K, the
Co(0001) surface is indeed active enough to dissociate the adsorbed CO molecules. However, the
dissociation rate is low compared to that of methane formation discussed previously in the hydrogen-rich
conditions,179
suggesting that hydrogen-assisted pathway might be the desired pathway during FTS.
Figure 46: HPSTM images of the Co(0001) surface at 493 K in the presense of 0.22 mbar CO. (a) Image
acquired ~2 h after the introduction of CO, (c) image acquired after ~5.5 h. (b) and (d) models of the local
stacking faults caused by the atomic carbon and the superstructures caused by it. Most of the surface in
(a) and region I in (c) have the (√7×√7)R19.1° structure. Area II in (c) has a structure called 'clock
reconstruction', which is a surface carbide structure. Image sizes are 60×60 nm2 in (a), and 90×70 nm
2 in
(c). Adapted with permission from Ref.179
. Copyright (2015) American Chemical Society.
CO hydrogenation on Co(0001) at industrial conditions: Industrial FTS conditions typically involve
pressures of up to tens of bars, 1:2 mixture of CO to H2, and temperatures from 200 to 350 °C.161
Ref.183
marks a milestone, as these extreme conditions for Surface Science studies were reached for the first time
in HPSTM studies. Figure 47a shows an HPSTM image of the Co(0001) surface at 494 K surface
temperature in the presence of 4 bar of gas with CO:H2:Ar partial pressure ratios of 1:2:2. The image was
acquired 40 min after the introduction of the reactants, and shows a surface covered with a striped pattern
with ~0.11 nm height, aligned with the three equivalent <1010> directions of the surface.183
Figure 47b
shows a close-up look at the stripes. FFT analysis in Figure 47b, shows an average separation of ~1.8 nm
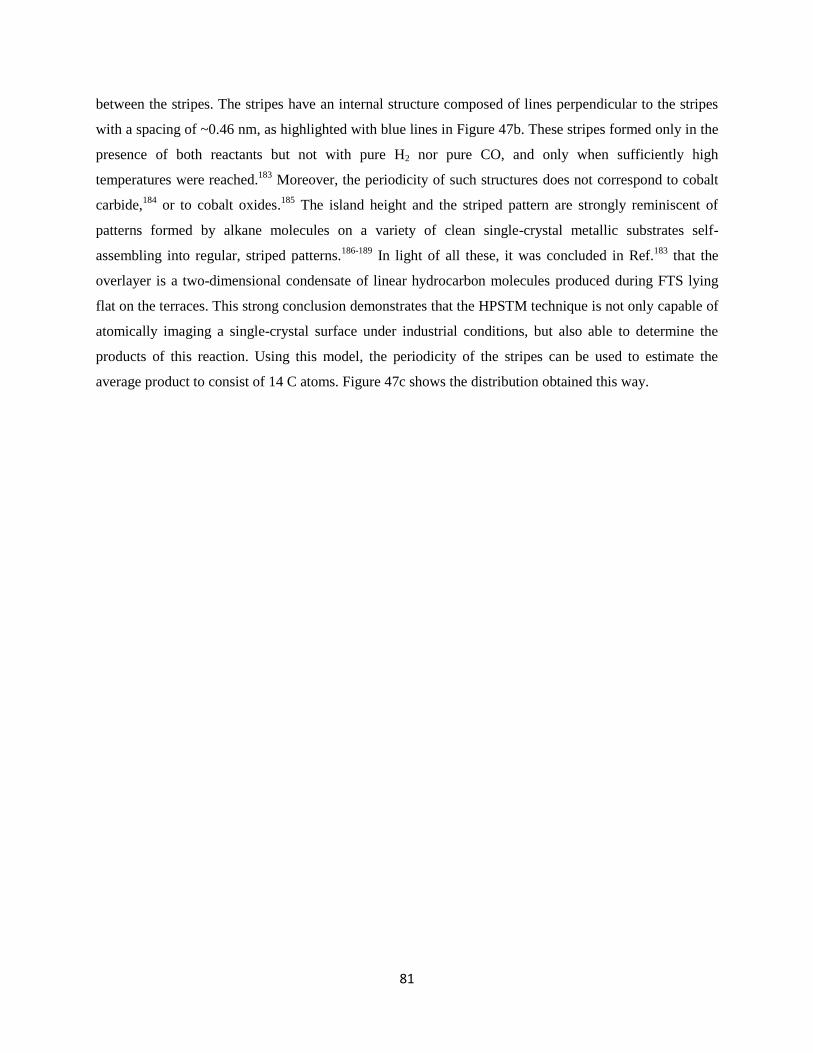
81
between the stripes. The stripes have an internal structure composed of lines perpendicular to the stripes
with a spacing of ~0.46 nm, as highlighted with blue lines in Figure 47b. These stripes formed only in the
presence of both reactants but not with pure H2 nor pure CO, and only when sufficiently high
temperatures were reached.183
Moreover, the periodicity of such structures does not correspond to cobalt
carbide,184
or to cobalt oxides.185
The island height and the striped pattern are strongly reminiscent of
patterns formed by alkane molecules on a variety of clean single-crystal metallic substrates self-
assembling into regular, striped patterns.186-189
In light of all these, it was concluded in Ref.183
that the
overlayer is a two-dimensional condensate of linear hydrocarbon molecules produced during FTS lying
flat on the terraces. This strong conclusion demonstrates that the HPSTM technique is not only capable of
atomically imaging a single-crystal surface under industrial conditions, but also able to determine the
products of this reaction. Using this model, the periodicity of the stripes can be used to estimate the
average product to consist of 14 C atoms. Figure 47c shows the distribution obtained this way.
82
Figure 47: (a-b) Overview and the close-up HPSTM images of the Co(0001) surface during Fischer-
Tropsch Synthesis (FTS) reaction. At a total pressure of 4 bar, with CO:H2:Ar partial pressure ratios of
1:2:2, and surface temperature of 494 K. Inset in (b) FFT of the image, showing ~1.8 nm separation
between the stripes and ~0.46 nm betweeen the features inside the stripes (e.g., the blue lines in (b)),
which assigned to a linear hydrocarbon on the surface. (c) distribution of the length of the hydrocarbon
molecules, estimated using the separation between the stripes. (d) schematic illustration showing step
edges catalyzing the growth of the linear hydrocarbons by addition of CH2 units to the growing chain.
Adapted with permission from Ref.183
. Copyright (2016) Springer Nature.
According to the Schulz–Flory–Anderson model,190-192
the hydrocarbon chains grow via the repeated
addition of CH2 monomers to the growing chain at the active site, which results in an exponential chain
length distribution, which was observed experimentally many times. In the present case, small molecules
83
are also produced, but they desorb swiftly to the gas phase. Longer molecules, which are produced at
much lower rates, reside on the surface much longer as they have stronger interaction with the surface
(since they lie flat on the surface, their interaction scales with chain length). Figure 47d is a schematic
illustrating this model. The active sites where CH2 monomer addition takes place are the step edges, and
the terraces are just hosts where the long-chain can reside.183
Terrace sites themselves are active for
methanation, but this gradually slows down as the chain growth reaction proceeds since the terraces
become occupied with long linear hydrocarbon molecules.183
CO hydrogenation on a rough Co(0001): As we discussed above, the step edges are potentially the
most active sites of the Co(0001) surface for long-chain hydrocarbon formation, whereas the terrace sites
are only active in the production of the undesired methane as the product. A possible scenario is,
however, the roughening of the flat surface by the synthesis gas mixture at ambient pressures and
temperatures, which would render it highly active. Previously, we showed that this is not the case under
hydrogen-rich conditions,171
and in this part we will show that this is also not the case when H2:CO partial
pressure ratio is 2:1, at 950 mbar total pressure and 493 K sample temperature.193
In fact, the contrary is
true, even an initially rough surface becomes smoother under such reaction conditions.193
Figures 48a and 48b show the as-prepared flat surface and the same surface under reaction
conditions, respectively. No structural differences between these two images can be observed. Another
surface was prepared by means of Ar sputtering, as shown in Figure 48c. This surface underwent
structural changes and it became smoother under reaction conditions (Figures 48d and 48e). This
observation indicates that the hypothesis that the origin of the activity of the Co(0001) surface is through
the formation of low coordinated sites during the reaction is probably not correct. The selectivity towards
the long-chain hydrocarbons is associated with the step edges present there initially, but they do not form
with time. Activity studies in Ref.193
show products with higher number of carbons to appear more on the
sputtered surface (in comparison, the flat and sputtered surface a similar activity towards methane
formation), however, this activity decreases with time, which can be attributed to the smoothening of the
surface under reaction conditions.
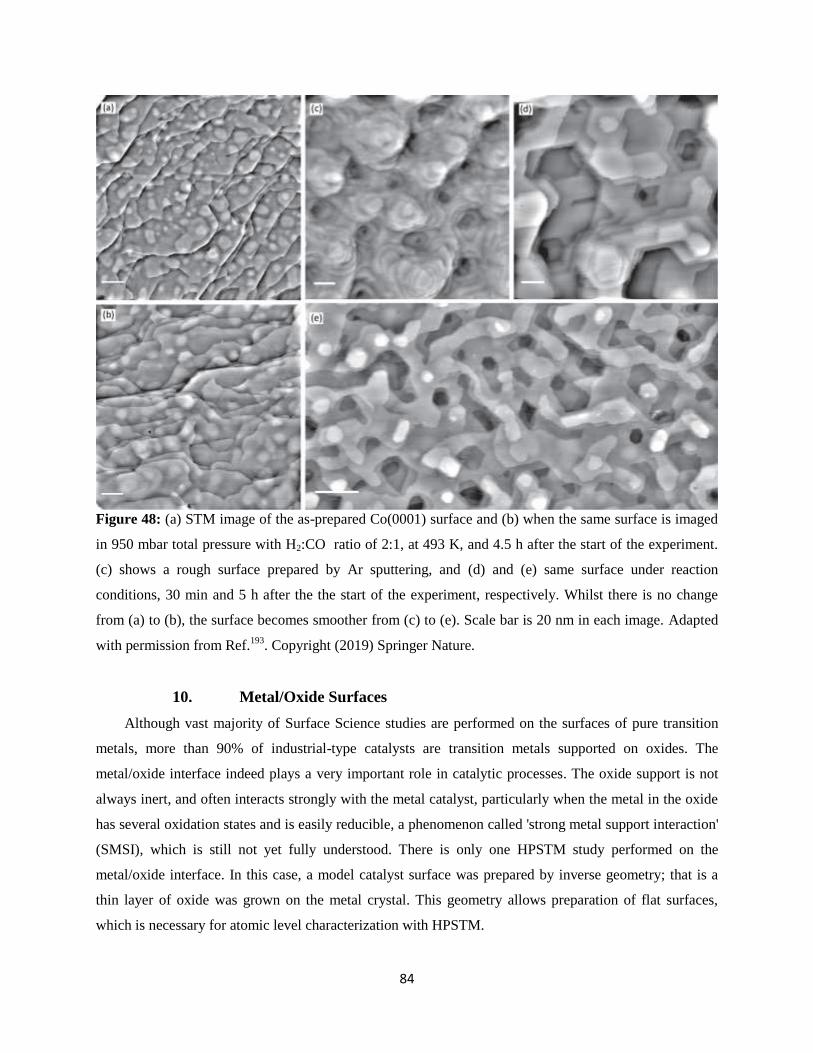
84
Figure 48: (a) STM image of the as-prepared Co(0001) surface and (b) when the same surface is imaged
in 950 mbar total pressure with H2:CO ratio of 2:1, at 493 K, and 4.5 h after the start of the experiment.
(c) shows a rough surface prepared by Ar sputtering, and (d) and (e) same surface under reaction
conditions, 30 min and 5 h after the the start of the experiment, respectively. Whilst there is no change
from (a) to (b), the surface becomes smoother from (c) to (e). Scale bar is 20 nm in each image. Adapted
with permission from Ref.193
. Copyright (2019) Springer Nature.
10. Metal/Oxide Surfaces
Although vast majority of Surface Science studies are performed on the surfaces of pure transition
metals, more than 90% of industrial-type catalysts are transition metals supported on oxides. The
metal/oxide interface indeed plays a very important role in catalytic processes. The oxide support is not
always inert, and often interacts strongly with the metal catalyst, particularly when the metal in the oxide
has several oxidation states and is easily reducible, a phenomenon called 'strong metal support interaction'
(SMSI), which is still not yet fully understood. There is only one HPSTM study performed on the
metal/oxide interface. In this case, a model catalyst surface was prepared by inverse geometry; that is a
thin layer of oxide was grown on the metal crystal. This geometry allows preparation of flat surfaces,
which is necessary for atomic level characterization with HPSTM.
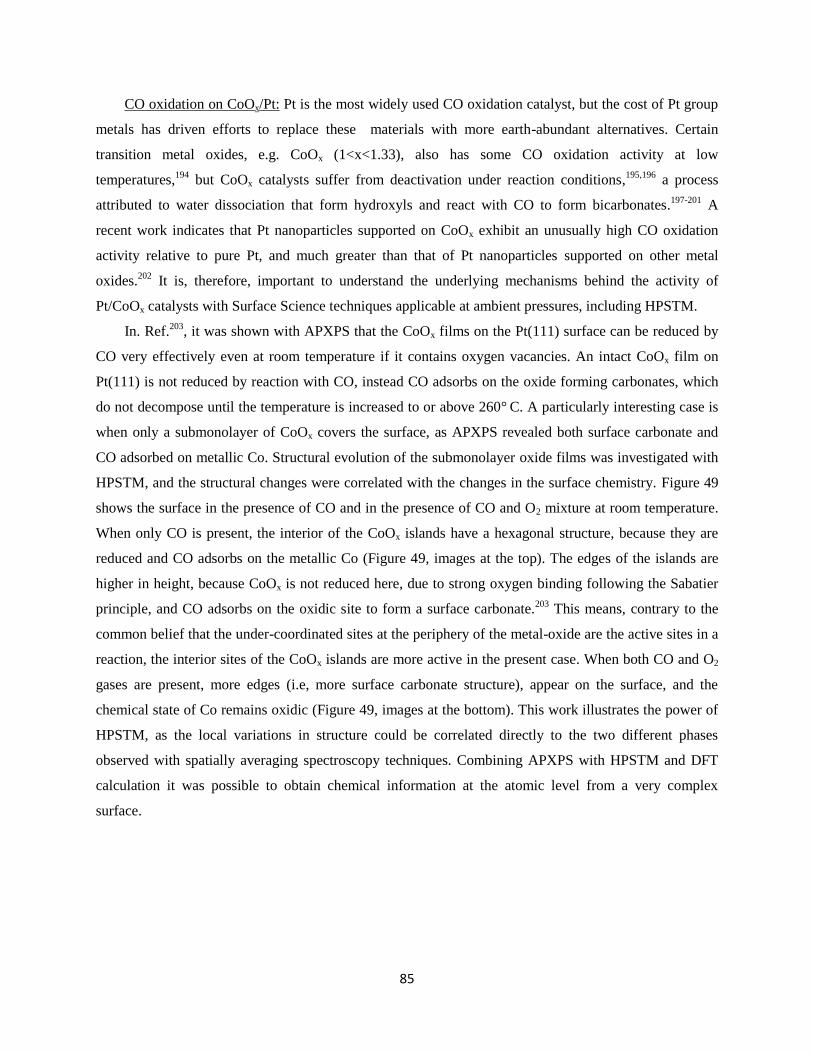
85
CO oxidation on CoOx/Pt: Pt is the most widely used CO oxidation catalyst, but the cost of Pt group
metals has driven efforts to replace these materials with more earth-abundant alternatives. Certain
transition metal oxides, e.g. CoOx (1<x<1.33), also has some CO oxidation activity at low
temperatures,194
but CoOx catalysts suffer from deactivation under reaction conditions,195,196
a process
attributed to water dissociation that form hydroxyls and react with CO to form bicarbonates.197-201
A
recent work indicates that Pt nanoparticles supported on CoOx exhibit an unusually high CO oxidation
activity relative to pure Pt, and much greater than that of Pt nanoparticles supported on other metal
oxides.202
It is, therefore, important to understand the underlying mechanisms behind the activity of
Pt/CoOx catalysts with Surface Science techniques applicable at ambient pressures, including HPSTM.
In. Ref.203
, it was shown with APXPS that the CoOx films on the Pt(111) surface can be reduced by
CO very effectively even at room temperature if it contains oxygen vacancies. An intact CoOx film on
Pt(111) is not reduced by reaction with CO, instead CO adsorbs on the oxide forming carbonates, which
do not decompose until the temperature is increased to or above 260° C. A particularly interesting case is
when only a submonolayer of CoOx covers the surface, as APXPS revealed both surface carbonate and
CO adsorbed on metallic Co. Structural evolution of the submonolayer oxide films was investigated with
HPSTM, and the structural changes were correlated with the changes in the surface chemistry. Figure 49
shows the surface in the presence of CO and in the presence of CO and O2 mixture at room temperature.
When only CO is present, the interior of the CoOx islands have a hexagonal structure, because they are
reduced and CO adsorbs on the metallic Co (Figure 49, images at the top). The edges of the islands are
higher in height, because CoOx is not reduced here, due to strong oxygen binding following the Sabatier
principle, and CO adsorbs on the oxidic site to form a surface carbonate.203
This means, contrary to the
common belief that the under-coordinated sites at the periphery of the metal-oxide are the active sites in a
reaction, the interior sites of the CoOx islands are more active in the present case. When both CO and O2
gases are present, more edges (i.e, more surface carbonate structure), appear on the surface, and the
chemical state of Co remains oxidic (Figure 49, images at the bottom). This work illustrates the power of
HPSTM, as the local variations in structure could be correlated directly to the two different phases
observed with spatially averaging spectroscopy techniques. Combining APXPS with HPSTM and DFT
calculation it was possible to obtain chemical information at the atomic level from a very complex
surface.
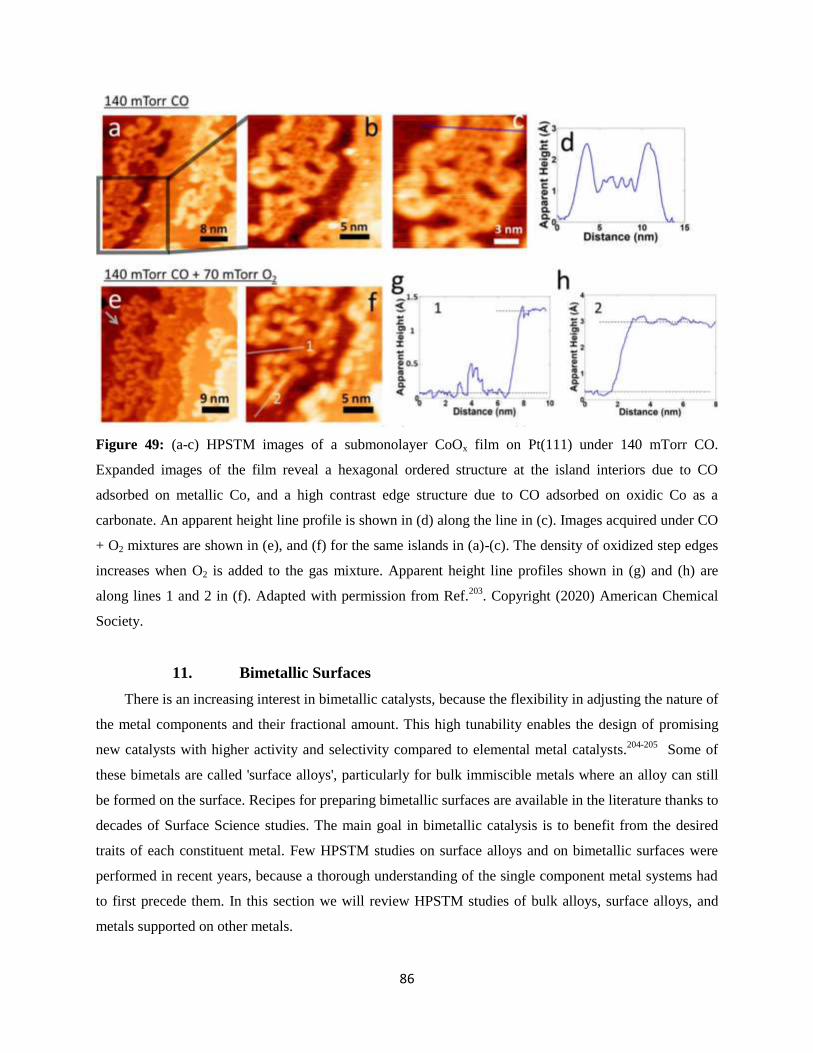
86
Figure 49: (a-c) HPSTM images of a submonolayer CoOx film on Pt(111) under 140 mTorr CO.
Expanded images of the film reveal a hexagonal ordered structure at the island interiors due to CO
adsorbed on metallic Co, and a high contrast edge structure due to CO adsorbed on oxidic Co as a
carbonate. An apparent height line profile is shown in (d) along the line in (c). Images acquired under CO
+ O2 mixtures are shown in (e), and (f) for the same islands in (a)-(c). The density of oxidized step edges
increases when O2 is added to the gas mixture. Apparent height line profiles shown in (g) and (h) are
along lines 1 and 2 in (f). Adapted with permission from Ref.203
. Copyright (2020) American Chemical
Society.
11. Bimetallic Surfaces
There is an increasing interest in bimetallic catalysts, because the flexibility in adjusting the nature of
the metal components and their fractional amount. This high tunability enables the design of promising
new catalysts with higher activity and selectivity compared to elemental metal catalysts.204-205
Some of
these bimetals are called 'surface alloys', particularly for bulk immiscible metals where an alloy can still
be formed on the surface. Recipes for preparing bimetallic surfaces are available in the literature thanks to
decades of Surface Science studies. The main goal in bimetallic catalysis is to benefit from the desired
traits of each constituent metal. Few HPSTM studies on surface alloys and on bimetallic surfaces were
performed in recent years, because a thorough understanding of the single component metal systems had
to first precede them. In this section we will review HPSTM studies of bulk alloys, surface alloys, and
metals supported on other metals.
87
CO on Au-Ni(111): The earliest HPSTM study of a surface alloy was the CO adsorption and
clustering of the Au-Ni(111) surface at room temperature.206-207
Figure 50a shows an atomically resolved
STM image of the Au-Ni(111) surface alloy surface, where the Au atoms appear as depressions in the
STM contrast. Such a surface alloy can be prepared by depositing submonolayers of Au on Ni(111) via
evaporation, and then annealing the sample at 800 K.206
Under CO gas pressures between 13 and 1000
mbar clusters were formed on the surface. Time-lapse HPSTM images acquired at 13 mbar show the
appearance of clusters at the step edges (Figure 50b-d), as Ni-carbonyls form at the step edges which
desorb to the gas phase and leaving Au clusters behind. This process starts after an incubation time, which
is due to the initial Au deposits preferentially decorating the step edges. It is important to mention that the
pure Ni(111) surface does not form such clusters. The presence of Au atoms inside the Ni matrix
facilitates Ni-carbonyl formation as more CO molecules can adsorb on a single Ni atom at the step edge
while the neighboring Au atoms remain empty.206
The HPSTM observations were also supported by DFT
and by Monte Carlo simulations.206,207
From a more practical point, these results suggest that the Ni-Au
surface alloy is not stable in the presence of CO, which makes it not very useful as an alloy catalyst.
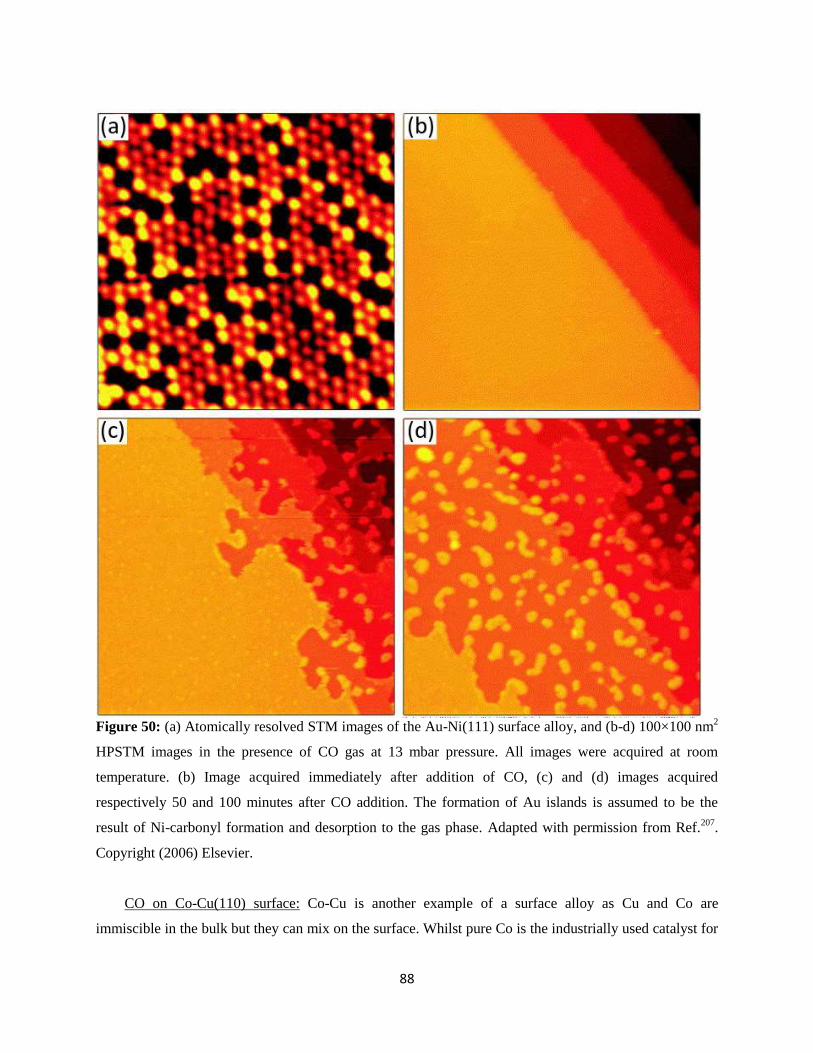
88
Figure 50: (a) Atomically resolved STM images of the Au-Ni(111) surface alloy, and (b-d) 100×100 nm2
HPSTM images in the presence of CO gas at 13 mbar pressure. All images were acquired at room
temperature. (b) Image acquired immediately after addition of CO, (c) and (d) images acquired
respectively 50 and 100 minutes after CO addition. The formation of Au islands is assumed to be the
result of Ni-carbonyl formation and desorption to the gas phase. Adapted with permission from Ref.207
.
Copyright (2006) Elsevier.
CO on Co-Cu(110) surface: Co-Cu is another example of a surface alloy as Cu and Co are
immiscible in the bulk but they can mix on the surface. Whilst pure Co is the industrially used catalyst for
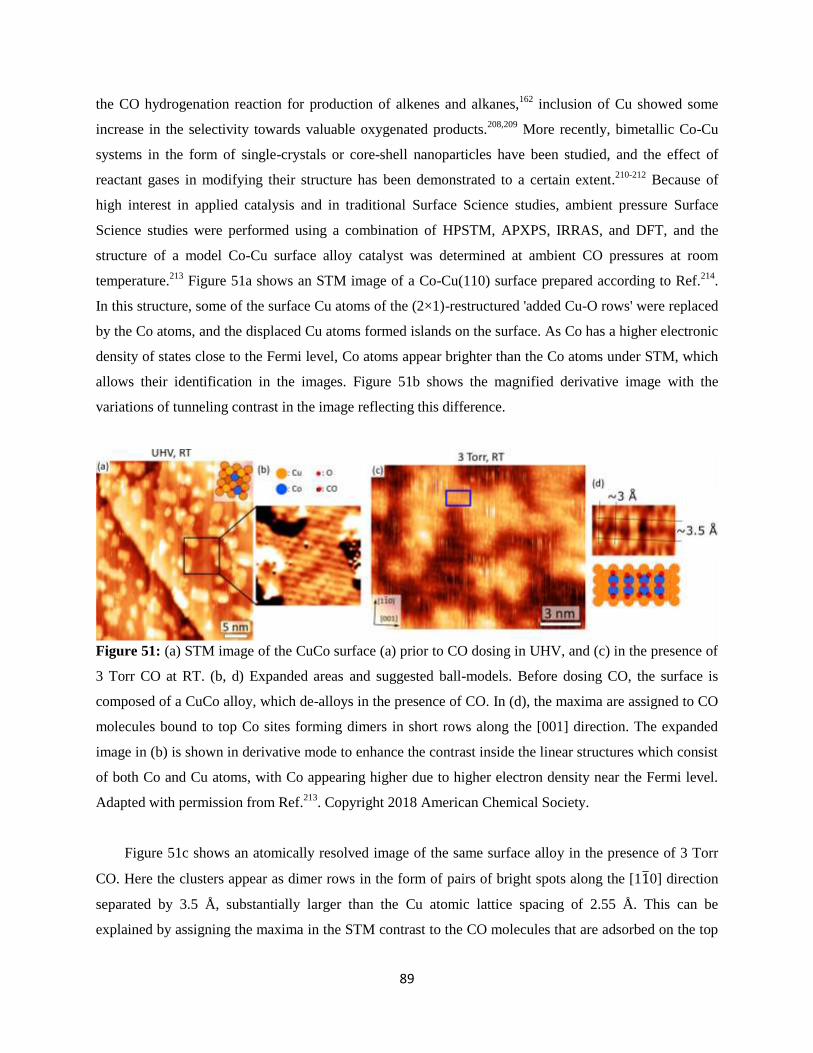
89
the CO hydrogenation reaction for production of alkenes and alkanes,162
inclusion of Cu showed some
increase in the selectivity towards valuable oxygenated products.208,209
More recently, bimetallic Co-Cu
systems in the form of single-crystals or core-shell nanoparticles have been studied, and the effect of
reactant gases in modifying their structure has been demonstrated to a certain extent.210-212
Because of
high interest in applied catalysis and in traditional Surface Science studies, ambient pressure Surface
Science studies were performed using a combination of HPSTM, APXPS, IRRAS, and DFT, and the
structure of a model Co-Cu surface alloy catalyst was determined at ambient CO pressures at room
temperature.213
Figure 51a shows an STM image of a Co-Cu(110) surface prepared according to Ref.214
.
In this structure, some of the surface Cu atoms of the (2×1)-restructured 'added Cu-O rows' were replaced
by the Co atoms, and the displaced Cu atoms formed islands on the surface. As Co has a higher electronic
density of states close to the Fermi level, Co atoms appear brighter than the Co atoms under STM, which
allows their identification in the images. Figure 51b shows the magnified derivative image with the
variations of tunneling contrast in the image reflecting this difference.
Figure 51: (a) STM image of the CuCo surface (a) prior to CO dosing in UHV, and (c) in the presence of
3 Torr CO at RT. (b, d) Expanded areas and suggested ball-models. Before dosing CO, the surface is
composed of a CuCo alloy, which de-alloys in the presence of CO. In (d), the maxima are assigned to CO
molecules bound to top Co sites forming dimers in short rows along the [001] direction. The expanded
image in (b) is shown in derivative mode to enhance the contrast inside the linear structures which consist
of both Co and Cu atoms, with Co appearing higher due to higher electron density near the Fermi level.
Adapted with permission from Ref.213
. Copyright 2018 American Chemical Society.
Figure 51c shows an atomically resolved image of the same surface alloy in the presence of 3 Torr
CO. Here the clusters appear as dimer rows in the form of pairs of bright spots along the [110] direction
separated by 3.5 Å, substantially larger than the Cu atomic lattice spacing of 2.55 Å. This can be
explained by assigning the maxima in the STM contrast to the CO molecules that are adsorbed on the top
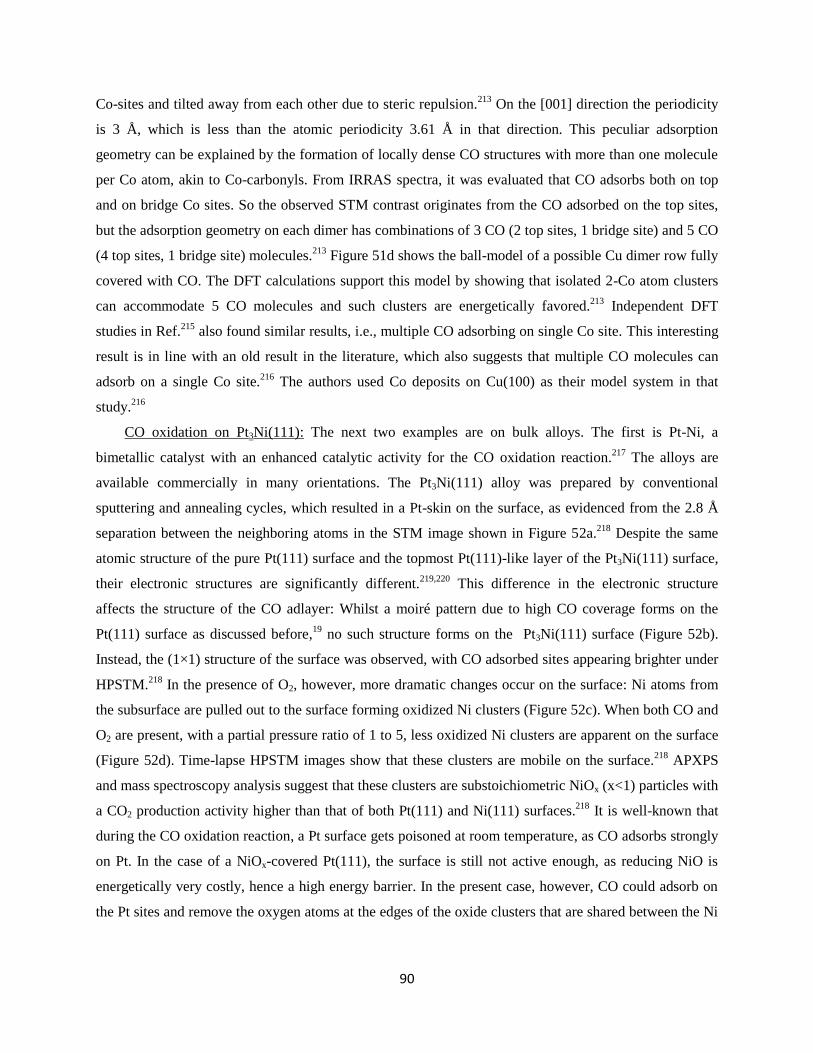
90
Co-sites and tilted away from each other due to steric repulsion.213
On the [001] direction the periodicity
is 3 Å, which is less than the atomic periodicity 3.61 Å in that direction. This peculiar adsorption
geometry can be explained by the formation of locally dense CO structures with more than one molecule
per Co atom, akin to Co-carbonyls. From IRRAS spectra, it was evaluated that CO adsorbs both on top
and on bridge Co sites. So the observed STM contrast originates from the CO adsorbed on the top sites,
but the adsorption geometry on each dimer has combinations of 3 CO (2 top sites, 1 bridge site) and 5 CO
(4 top sites, 1 bridge site) molecules.213
Figure 51d shows the ball-model of a possible Cu dimer row fully
covered with CO. The DFT calculations support this model by showing that isolated 2-Co atom clusters
can accommodate 5 CO molecules and such clusters are energetically favored.213
Independent DFT
studies in Ref.215
also found similar results, i.e., multiple CO adsorbing on single Co site. This interesting
result is in line with an old result in the literature, which also suggests that multiple CO molecules can
adsorb on a single Co site.216
The authors used Co deposits on Cu(100) as their model system in that
study.216
CO oxidation on Pt3Ni(111): The next two examples are on bulk alloys. The first is Pt-Ni, a
bimetallic catalyst with an enhanced catalytic activity for the CO oxidation reaction.217
The alloys are
available commercially in many orientations. The Pt3Ni(111) alloy was prepared by conventional
sputtering and annealing cycles, which resulted in a Pt-skin on the surface, as evidenced from the 2.8 Å
separation between the neighboring atoms in the STM image shown in Figure 52a.218
Despite the same
atomic structure of the pure Pt(111) surface and the topmost Pt(111)-like layer of the Pt3Ni(111) surface,
their electronic structures are significantly different.219,220
This difference in the electronic structure
affects the structure of the CO adlayer: Whilst a moiré pattern due to high CO coverage forms on the
Pt(111) surface as discussed before,19
no such structure forms on the Pt3Ni(111) surface (Figure 52b).
Instead, the (1×1) structure of the surface was observed, with CO adsorbed sites appearing brighter under
HPSTM.218
In the presence of O2, however, more dramatic changes occur on the surface: Ni atoms from
the subsurface are pulled out to the surface forming oxidized Ni clusters (Figure 52c). When both CO and
O2 are present, with a partial pressure ratio of 1 to 5, less oxidized Ni clusters are apparent on the surface
(Figure 52d). Time-lapse HPSTM images show that these clusters are mobile on the surface.218
APXPS
and mass spectroscopy analysis suggest that these clusters are substoichiometric NiOx (x<1) particles with
a CO2 production activity higher than that of both Pt(111) and Ni(111) surfaces.218
It is well-known that
during the CO oxidation reaction, a Pt surface gets poisoned at room temperature, as CO adsorbs strongly
on Pt. In the case of a NiOx-covered Pt(111), the surface is still not active enough, as reducing NiO is
energetically very costly, hence a high energy barrier. In the present case, however, CO could adsorb on
the Pt sites and remove the oxygen atoms at the edges of the oxide clusters that are shared between the Ni
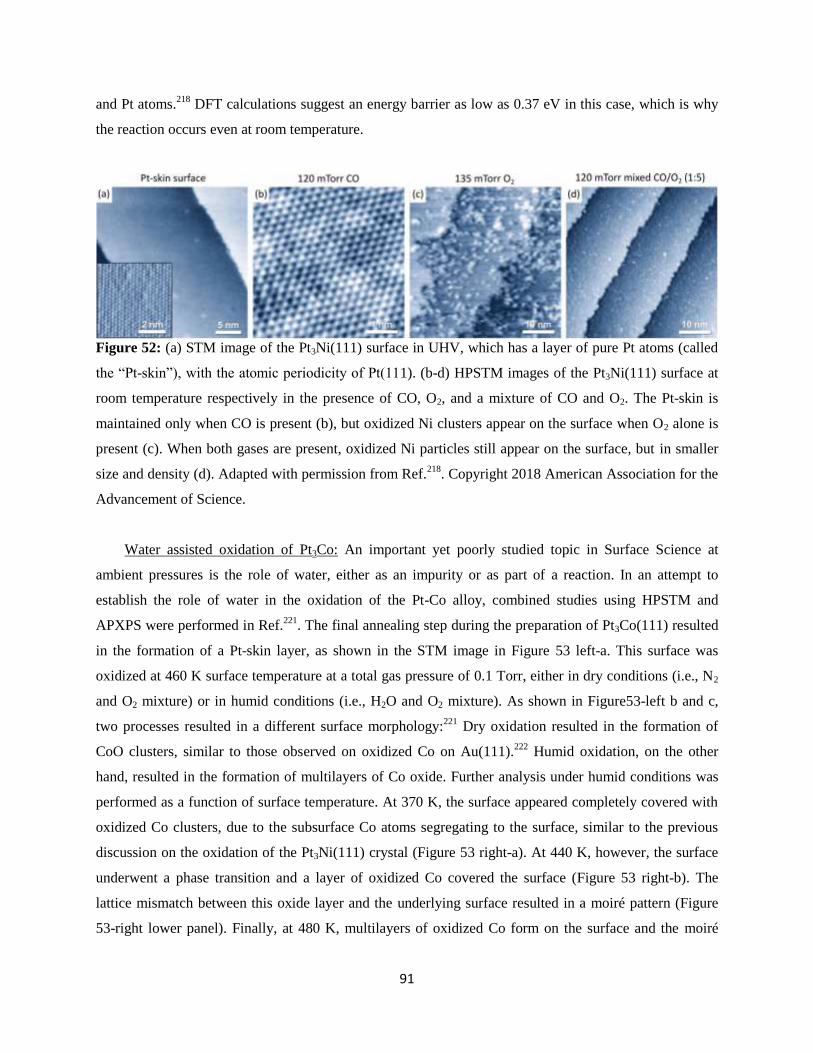
91
and Pt atoms.218
DFT calculations suggest an energy barrier as low as 0.37 eV in this case, which is why
the reaction occurs even at room temperature.
Figure 52: (a) STM image of the Pt3Ni(111) surface in UHV, which has a layer of pure Pt atoms (called
the “Pt-skin”), with the atomic periodicity of Pt(111). (b-d) HPSTM images of the Pt3Ni(111) surface at
room temperature respectively in the presence of CO, O2, and a mixture of CO and O2. The Pt-skin is
maintained only when CO is present (b), but oxidized Ni clusters appear on the surface when O2 alone is
present (c). When both gases are present, oxidized Ni particles still appear on the surface, but in smaller
size and density (d). Adapted with permission from Ref.218
. Copyright 2018 American Association for the
Advancement of Science.
Water assisted oxidation of Pt3Co: An important yet poorly studied topic in Surface Science at
ambient pressures is the role of water, either as an impurity or as part of a reaction. In an attempt to
establish the role of water in the oxidation of the Pt-Co alloy, combined studies using HPSTM and
APXPS were performed in Ref.221
. The final annealing step during the preparation of Pt3Co(111) resulted
in the formation of a Pt-skin layer, as shown in the STM image in Figure 53 left-a. This surface was
oxidized at 460 K surface temperature at a total gas pressure of 0.1 Torr, either in dry conditions (i.e., N2
and O2 mixture) or in humid conditions (i.e., H2O and O2 mixture). As shown in Figure53-left b and c,
two processes resulted in a different surface morphology:221
Dry oxidation resulted in the formation of
CoO clusters, similar to those observed on oxidized Co on Au(111).222
Humid oxidation, on the other
hand, resulted in the formation of multilayers of Co oxide. Further analysis under humid conditions was
performed as a function of surface temperature. At 370 K, the surface appeared completely covered with
oxidized Co clusters, due to the subsurface Co atoms segregating to the surface, similar to the previous
discussion on the oxidation of the Pt3Ni(111) crystal (Figure 53 right-a). At 440 K, however, the surface
underwent a phase transition and a layer of oxidized Co covered the surface (Figure 53 right-b). The
lattice mismatch between this oxide layer and the underlying surface resulted in a moiré pattern (Figure
53-right lower panel). Finally, at 480 K, multilayers of oxidized Co form on the surface and the moiré
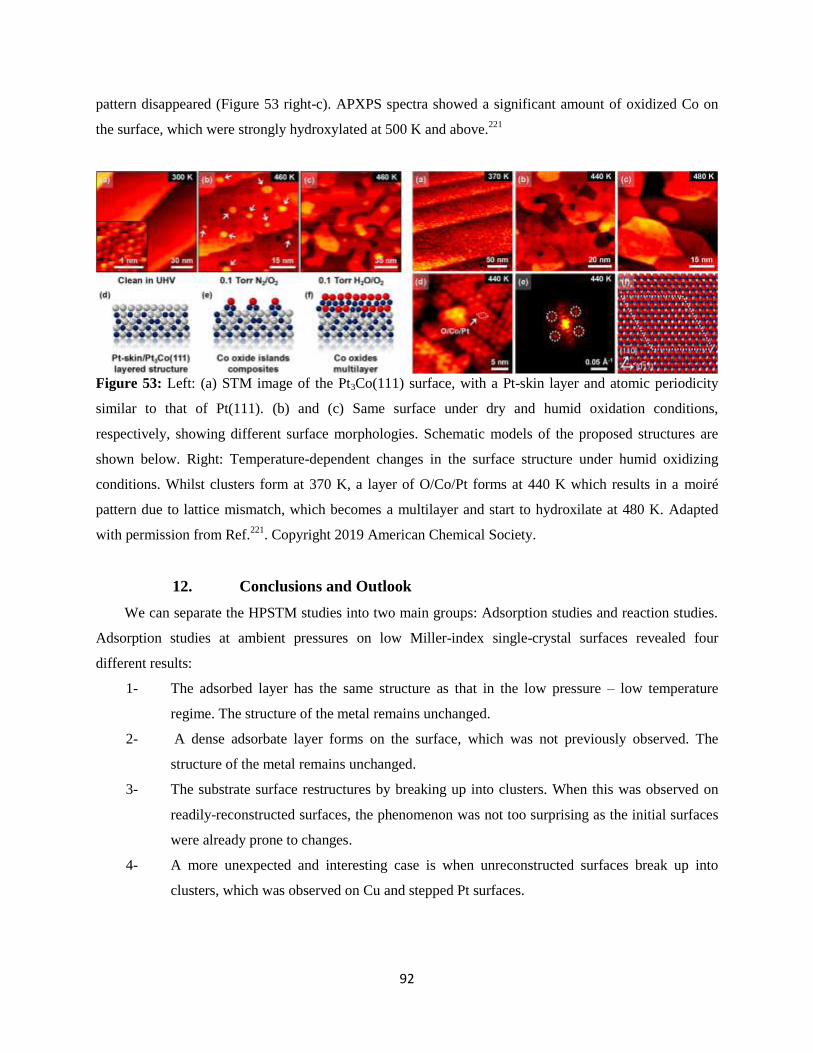
92
pattern disappeared (Figure 53 right-c). APXPS spectra showed a significant amount of oxidized Co on
the surface, which were strongly hydroxylated at 500 K and above.221
Figure 53: Left: (a) STM image of the Pt3Co(111) surface, with a Pt-skin layer and atomic periodicity
similar to that of Pt(111). (b) and (c) Same surface under dry and humid oxidation conditions,
respectively, showing different surface morphologies. Schematic models of the proposed structures are
shown below. Right: Temperature-dependent changes in the surface structure under humid oxidizing
conditions. Whilst clusters form at 370 K, a layer of O/Co/Pt forms at 440 K which results in a moiré
pattern due to lattice mismatch, which becomes a multilayer and start to hydroxilate at 480 K. Adapted
with permission from Ref.221
. Copyright 2019 American Chemical Society.
12. Conclusions and Outlook
We can separate the HPSTM studies into two main groups: Adsorption studies and reaction studies.
Adsorption studies at ambient pressures on low Miller-index single-crystal surfaces revealed four
different results:
1- The adsorbed layer has the same structure as that in the low pressure – low temperature
regime. The structure of the metal remains unchanged.
2- A dense adsorbate layer forms on the surface, which was not previously observed. The
structure of the metal remains unchanged.
3- The substrate surface restructures by breaking up into clusters. When this was observed on
readily-reconstructed surfaces, the phenomenon was not too surprising as the initial surfaces
were already prone to changes.
4- A more unexpected and interesting case is when unreconstructed surfaces break up into
clusters, which was observed on Cu and stepped Pt surfaces.
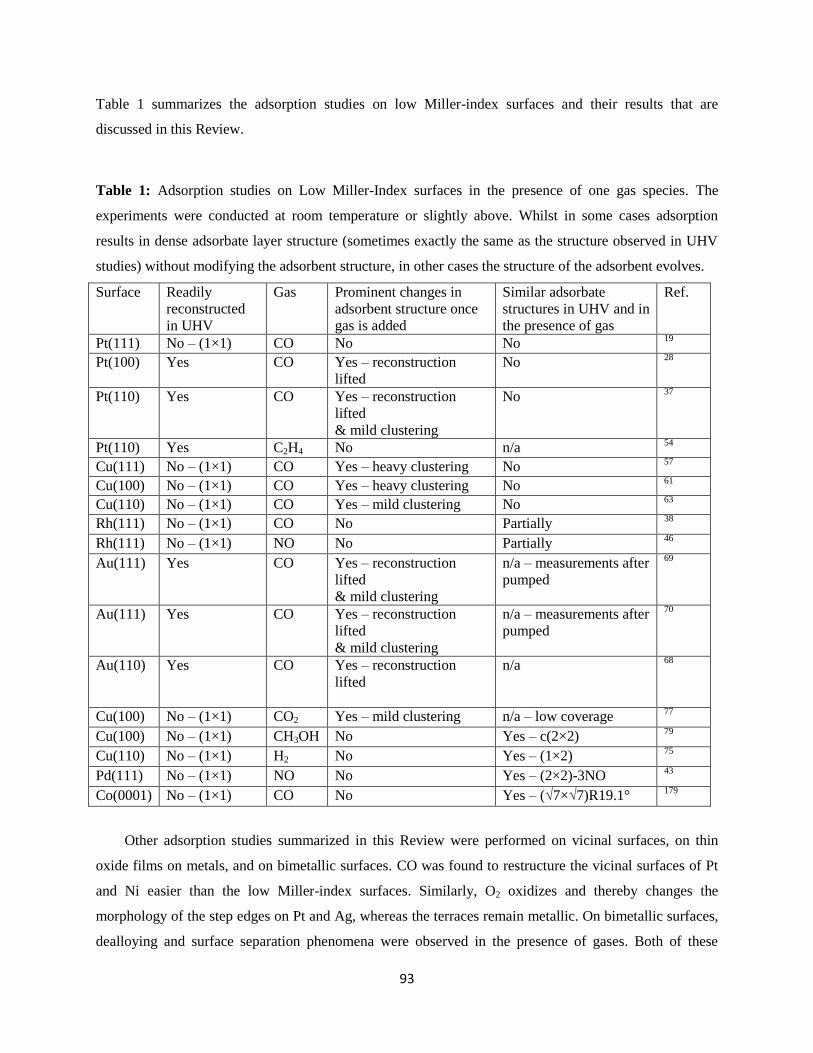
93
Table 1 summarizes the adsorption studies on low Miller-index surfaces and their results that are
discussed in this Review.
Table 1: Adsorption studies on Low Miller-Index surfaces in the presence of one gas species. The
experiments were conducted at room temperature or slightly above. Whilst in some cases adsorption
results in dense adsorbate layer structure (sometimes exactly the same as the structure observed in UHV
studies) without modifying the adsorbent structure, in other cases the structure of the adsorbent evolves.
Surface Readily
reconstructed
in UHV
Gas Prominent changes in
adsorbent structure once
gas is added
Similar adsorbate
structures in UHV and in
the presence of gas
Ref.
Pt(111) No – (1×1) CO No No 19
Pt(100) Yes CO Yes – reconstruction
lifted
No 28
Pt(110) Yes CO Yes – reconstruction
lifted
& mild clustering
No 37
Pt(110) Yes C2H4 No n/a 54
Cu(111) No – (1×1) CO Yes – heavy clustering No 57
Cu(100) No – (1×1) CO Yes – heavy clustering No 61
Cu(110) No – (1×1) CO Yes – mild clustering No 63
Rh(111) No – (1×1) CO No Partially 38
Rh(111) No – (1×1) NO No Partially 46
Au(111) Yes CO Yes – reconstruction
lifted
& mild clustering
n/a – measurements after
pumped
69
Au(111) Yes CO Yes – reconstruction
lifted
& mild clustering
n/a – measurements after
pumped
70
Au(110) Yes CO Yes – reconstruction
lifted
n/a 68
Cu(100) No – (1×1) CO2 Yes – mild clustering n/a – low coverage 77
Cu(100) No – (1×1) CH3OH No Yes – c(2×2) 79
Cu(110) No – (1×1) H2 No Yes – (1×2) 75
Pd(111) No – (1×1) NO No Yes – (2×2)-3NO 43
Co(0001) No – (1×1) CO No Yes – (√7×√7)R19.1° 179
Other adsorption studies summarized in this Review were performed on vicinal surfaces, on thin
oxide films on metals, and on bimetallic surfaces. CO was found to restructure the vicinal surfaces of Pt
and Ni easier than the low Miller-index surfaces. Similarly, O2 oxidizes and thereby changes the
morphology of the step edges on Pt and Ag, whereas the terraces remain metallic. On bimetallic surfaces,
dealloying and surface separation phenomena were observed in the presence of gases. Both of these
94
phenomena were already observed numerous times with spectroscopy experiments on nanoparticle
catalysts. Interestingly on bimetallic surfaces it was observed that multiple CO molecules can adsorb on
Ni and Co atoms, akin to carbonyl molecules.
Some of the most common reaction studies performed in model catalysts involve CO oxidation and
CO hydrogenation, the latter exclusively on Co. In the CO oxidation studies, the general trend is the
bistability of the surface between a relatively smooth metallic surface and a relatively rough oxidic
surface, which can explain the oscillatory behavior observed in the catalysis studies on this reaction. In
the CO hydrogenation studies, the general trend is that the steps are the active sites for the formation of
desired long-chain hydrocarbons, and no new steps form under reaction conditions. We can thus conclude
that one of the most often asked questions related to the surface structure during FTS on Co surfaces has
been addressed by Surface Science studies.
We think that the HPSTM field should in the future focus on other industrially important reactions
like ethylene oxidation, methanol oxidation, methane reforming, etc.
The HPSTM field is still relatively young, with only few groups working with this technique. Within
the last three decades, there are only ~50 studies with HPSTM which we covered in this Review, and only
a few of them combine HPSTM with powerful ambient pressure spectroscopic techniques of APXPS, x-
ray absorption spectroscopy, grazing x-ray diffraction, and of course optical techniques such as IR
spectroscopy, Raman spectroscopy, etc. In the 2010-2019 decade, there was only a small increase in the
number of publications compared to previous decades. The reason for this low output, in our opinion, is
the difficulty of the experiments and the scarce availability of instruments. This is expected to change in
the future due to the increased commercial availability of stand-alone systems (e.g., Aarhus STM and
Leiden STM).
An important difficulty in HPSTM experiments is keeping the surfaces clean compared to UHV
conditions. This is due to impurities in the gases used to fill the chambers, even for 99.9999% purity
grade gases. For instance, in an experiment at 1 bar the partial pressure of impurities is 10-3
mbar, which
can compete for adsorption sites in some cases. Even pure gases can displace adsorbates from walls,
which can produce background impurities. These difficulties are, in some cases, surmountable, but
requires stringent methodologies and refined methods of chamber cleaning and gas
purification. Contamination issues in ambient pressure microscopy and spectroscopy experiments is
worthy of an article of its own, therefore we will not discuss them in further detail here. We think that a
good procedure to alleviate contamination issues is to periodically ignite a nitrogen plasma in the
chamber to minimize the hydrocarbon contamination emanating from the chamber walls. Prior to each
experiment, the measurement chamber should be baked out for 48 h over 105 °C to minimize water
95
impurities. It is also important to check the sample cleanliness after each experiment, i.e., after evacuation
of the gases, with either XPS or AES.
Another typical issue is tip instability. In routine HPSTM operation, images of the clean surfaces are
acquired in UHV prior to dosing gases with a sharp STM tip, typically made of Pt/Ir or Pt/Rh. However,
once the gases are introduced into the measurement chamber, they adsorb on the tip surface and modify
its chemical nature and even its physical shape so that it may become blunt. Tip-recovery procedures in
ambient pressure experiments are similar to those in UHV: By electrical pulsing or by gently touching the
sample surface. During imaging at ambient conditions, some gases like CO can adsorb strongly on the tip
without causing tip instabilities. However most contaminated tips are unstable and produce poor quality
images.
A topic we did not discuss in detail in this Review is the potential use of the STM tip to induce or
catalyze reactions. Although not many recent studies are performed today, two old studies illustrate the
potential utility of this procedure.223,224
In these studies, carbonaceous fragments were first deposited on
Pt (l l l) by partial dehydrogenation of propylene. Then a Pt/Rh STM tip was activated by applying a
voltage pulse which removed the contaminant material from the tip. The clean STM tip catalyzed the
dissociation of H2 or O2 molecules, which respectively hydrogenated and oxygenated the carbonaceous
species covering the Pt(111) surface.223,224
The clean metallic tip remains active until after some time it
gets covered again with carbonaceous species. The procedure is more effective at smaller tip-sample
distances. The tip can be deactivated by coating its apex with Au, which in return results in no
hydrogenation or oxidation of the surface even after pulsing the tip.223,224
These results raise interesting
questions. To avoid any tip-related chemistry during HPSTM experiments it may be beneficial to use inert
materials, like Au-coated tips, but this comes at the expense of lower resolution due to large size of the tip
apex after Au deposition. More important question is to what extend does the tip contribute to the surface
structure and morphology observed on sample surfaces. Such important questions however have not
received the attention that we believe they deserve.
We believe that the impact of HPSTM combined with or spectroscopy studies at high pressure (for
example IRRAS, APXPS, etc.) is very high for catalysis, because there are not many options for
obtaining structural information from a working catalyst. What makes such structural information very
unique and important is that it can completely change the interpretation of the applied catalysis or
spectroscopy studies. No other technique in our field has such an impact.
Biographies
96
Prof. Miquel Salmeron is a principal investigator at the Lawrence Berkeley National Laboratory and
adjunct professor at UC Berkeley Materials Science and Engineering Department. Prof. Salmeron
received his BA in physics from the University of Barcelona, and his PhD from the University Autonoma
of Madrid, Spain, in 1975. In 1984 he moved to the Lawrence Berkeley National Laboratory as a
Divisional Fellow, becoming a senior scientist in 1996. He was elected Fellow of the American Physical
Society (APS) in 1996 and Fellow of the American Vacuum Society (AVS) in 2003. He received the
Outstanding Scientific Accomplishment Award in Materials Chemistry in 1995, and the Outstanding
Research Award in 1996 from the U.S. Department of Energy. He received the Klaus Halbach Award in
2004, and David A. Shirley Award in 2020, of the Advanced Light Source. In 2008 he received the
Medard Welch Award of the AVS and the Langmuir Lectureship Award of the American Chemical
Society (ACS). In 2010 he received the R&D 100 Award of R&D Magazine. In 2012 he received the
Materials Research Society (MRS) Medal Award. In 2015 he received the APS Davisson-Germer Prize in
Atomic or Surface Physics. Prof. Salmeron is the President of the Scientific Advisory Board of the
"Institut Catala de Nanotecnologia" in Barcelona, Spain.
Dr. Baran Eren is a principal investigator at the Weizmann Institute of Science. Dr. Eren received his BSc
in mechanical engineering at Boğaziçi University in Istanbul, Turkey, in 2007, and his MSc in micro-
nano systems at ETH in Zurich, Switzerland, in 2009. He completed his PhD with summa cum laude in
experimental condensed matter physics at the University of Basel, Switzerland, in 2013. From January
2014 until joining the Weizmann Institute of Science, Israel, in September 2017, he worked as a
postdoctoral fellow in the Materials Sciences Division of the Lawrence Berkeley National Laboratory in
California. Dr. Eren is currently a senior scientist at the Weizmann Institute of Science, incumbent of the
Alvin and Gertrude Levine career development chair, and Zuckerman STEM leadership faculty scholar.
Acknowledgements
M.S. was supported by the Office of Basic Energy Sciences of the US Department of Energy under
contract no. DE-AC02-05CH11231, through the Catalysis program of the Chemical Sciences,
Geosciences, and Biosciences Division. B.E. was supported by the Israel Science Foundation's (ISF)
Research Grant No. 919/18. BE acknowledges the support from the Zuckerman STEM Leadership
Faculty Fellowship, Ruth and Herman Albert Scholarship Program for New Scientists, and the Abramson
Family Center for Young Scientists.
97
References:
(1) Somorjai, G. A. Introduction to Surface Chemistry and Catalysis; Wiley-VCH: New York, 1999.
(2) Ertl, G. Reactions at Surfaces: From Atoms to Complexity. Angew. Chem. Int. Ed. 2008, 47, 3524–
3535.
(3) Langmuir, I. The Constitution and Fundamental Properties of Solids and Liquids. Part I. Solids. J. Am.
Chem. Soc. 1916, 38, 1221–2295.
(4) Binnig, G.; Rohrer, H. Scanning Tunneling Microscopy - From Birth to Adolescence. Rev. Mod. Phys.
1987, 59, 615–625.
(5) Langmuir, I. Part II. - “Heterogeneous Reactions”. Chemical Reactions on Surfaces. Trans. Faraday.
Soc. 1922, 17, 607–620.
(6) Salmeron, M.; Schlogl, R. Ambient Pressure Photoelectron Spectroscopy: A New Tool for Surface
Science and Nanotechnology. Surf. Sci. Rep. 2008, 63, 169−199.
(7) Hoffmann, F. M. Infrared Reflection-Absorption Spectroscopy of Adsorbed Molecules. Surface
Science Reports 1983, 3, 107−192.
(8) Salmeron, M. From Surfaces to Interfaces: Ambient Pressure XPS and Beyond. Topics in Catalysis
2018, 61, 2044–2051.
(9) SPECS The Aarhus SPM Series. Online:
https://www.specs-group.com/nc/specs/products/detail/spm-aarhus-150-nap/ (accessed Oct 12, 2020).
(10) Leiden Probe Microscopy B.V. Online: https://leidenprobemicroscopy.com/ (accessed Oct 12, 2020).
(11) McIntyre, B. J.; Salmeron, M.; Somorjai, G. A. A Variable Pressure/Temperature Scanning
Tunneling Microscope for Surface Science and Catalysis Studies. Rev. Sci. Instrum. 1993, 64, 687−691.
(12) Tao, F.; Tang, D.; Salmeron M.; Somorjai, G. A. A New Scanning Tunneling Microscope Reactor
Used For High-Pressure and High-Temperature Catalysis Studies. Rev. Sci. Instrum. 2008, 79, 084101.
(13) Lægsgaard, E.; Österlund, L.; Thostrup, P.; Rasmussen, P. B.; Stensgaard, I.; Besenbacher, F. A
High-Pressure Scanning Tunneling Microscope. Rev. Sci. Instrum. 2001, 72, 3537−3542.
(14) Rasmussen, P. B.; Hendriksen, B. L. M.; Zeijlemaker, H.; Ficke, H. G.; Frenken, J. W. M. The
“Reactor STM”: A Scanning Tunneling Microscope for Investigation of Catalytic Surfaces at Semi-
Industrial Reaction Conditions. Rev. Sci. Instrum. 1998, 69, 3879−3884.
(15) Herbschleb, C. T.; Van Der Tuijn, P. C.; Roobol, S. B.; Navarro, V.; Bakker, J. W.; Liu, W.; Stoltz,
D.; Cañas-Ventura, M. E.; Verdoes, G.; van Spronsen, M. A.; et al. The ReactorSTM: Atomically
Resolved Scanning Tunneling Microscopy under High-Pressure, High-Temperature Catalytic Reaction
Conditions. Rev. Sci. Instrum. 2014, 85, 083703.
98
(16) Blyholder, G. Molecular Orbital View of Chemisorbed Carbon Monoxide. Phys. Chem. 1964, 68,
2772–2777.
(17) Gross, L.; Mohn, F.; Moll, N.; Liljeroth, P.; Meyer, G. The Chemical Structure of a Molecule
Resolved by Atomic Force Microscopy. Science 2009, 325, 1110–1114.
(18) Rupprechter, G.; Dellwig, T.; Unterhalt, H.; Freund, H.-J. High-Pressure Carbon Monoxide
Adsorption on Pt(111) Revisited: A Sum Frequency Generation Study. J. Phys. Chem. B 2001, 105,
3797–3802.
(19) Longwitz, S. R.; Schnadt, J.; Vestergaard, E. K.; Vang, R. T.; Lægsgaard, E.; Stensgaard, I.; Brune,
H.; Flemming Besenbacher, F. High-coverage Structures of Carbon Monoxide Adsorbed on Pt(111)
Studied by High-Pressure Scanning Tunneling Microscopy. J. Phys. Chem. B 2004, 108, 14497–14502.
(20) Ertl, G.; Neumann, M.; Streit, K. M. Chemisorption of CO on the Pt(111) Surface. Surf. Sci. 1977,
64, 393–410.
(21) Persson, B. N. J.; Tüshaus, M.; Bradshaw, A. M. On the Nature of Dense CO Adlayers. J. Chem.
Phys. 1990, 92, 5034–4056.
(22) Biberian, J. P.; van Hove, M. A. A New Model for CO Ordering at High Coverages on Low Index
Metal Surfaces: A Correlation between LEED, HREELS and IRS: II. CO Adsorbed on fcc(111) and
hcp(0001) Surfaces. Surf. Sci. 1984, 138, 361–389.
(23) Toyoshima, R.; Yoshida, M.; Monya, Y.; Suzuki, K.; Amemiya, K.; Mase, K.; Mun, B. S.; Kondoh,
H. A High-pressure-induced Dense CO Overlayer on a Pt(111) Surface: A Chemical Analysis Using In
Situ Near Ambient Pressure XPS. Phys. Chem. Chem. Phys. 2014, 16, 23564–23567.
(24) Carrasco, E.; Aumer, A.; Brown, M. A.; Dowler, R.; Palacio, I.; Song, S.; Sterrer, M. Infrared
Spectra of High Coverage CO Adsorption Structures on Pt(111). Surf. Sci. 2010, 604, 1320–1325.
(25) Fery, P.; Moritz, W.; Wolf, D. Structure Determination of the (1×2) and (1×3) Reconstructions of
Pt(110) by Low-energy Electron Diffraction. Phys. Rev. B 1988, 38, 7275–7286.
(26) Shiang, K. D.; Tsong, T. T. Energetics and Atomic Steps in the Reconstruction of the Pt(110) Plane.
Phys. Rev. B 1995, 51, 5522–5525.
(27) Thostrup, P.; Christoffersen, E.; Lorensen, H. T.; Jacobsen, K. W.; Besenbacher, F.; Nørskov, J. K.
Adsorption-Induced Step Formation. Phys. Rev. Lett. 2001, 126102.
(28) Thostrup, P.; Vestergaard, E. K.; An, T.; Lægsgaard, E.; Besenbacher, F. CO-induced Restructuring
of Pt (110)-(1×2): Bridging the Pressure Gap with High-pressure Scanning Tunneling Microscopy. J.
Chem. Phys. 2003, 118, 3724–3730.
(29) Ahner, J.; Mocuta, D.; Ramsier, R. D.; Yates, J. T. Adsorbate–adsorbate Repulsions — The
Coverage Dependence of the Adsorption Structure of CO on Cu(110) as Studied by Electron-stimulated
Desorption Ion Angular Distribution. J. Chem. Phys. 1996, 105, 6553–6559.
99
(30) Hagstrom, S.; Lyon, H. B.; Somorjai, G. A. Surface Structures on the Clean Platinum (100) Surface.
Phys. Rev. Lett. 1965, 15, 491–494.
(31) Ritter, E.; Behm, R. J.; Potschke, G.; Wintterlin, J. Direct Observation of a Nucleation and Growth
Process on an Atomic Scale. Surf. Sci. 1987, 181, 403–411.
(32) Thiel, P. A.; Behm, R. J.; Norton, P. R.; Ertl, G. The Interaction of CO and Pt(100). II. Energetic and
Kinetic Parameters. J. Chem. Phys. 1983, 78, 7448–7458.
(33) Borg, A.; Hilmen, A. M.; Bergene, E. STM Studies of Clean, CO- and O2-exposed Pt(100)-hex-
R0.7°. Surf. Sci. 1994, 306, 10–20.
(34) Norton, P. R.; Davies, J. A.; Creber, D. K.; Sitter, C. W.; Jackman, T. E. The Pt(100) (5×20) ⇋ (1×1)
Phase Transition: A Study by Rutherford Backscattering, Nuclear Microanalysis, LEED and Thermal
Desorption Spectroscopy. Surf. Sci. 1981, 108, 205–224.
(35) Davies, J. A.; Norton, P. R. Absolute Coverage Measurement of Adsorbed CO and D2 on Platinum.
Nucl. Instrum. Methods 1980, 168, 611–615.
(36) Helms, C. R.; Bonzel, H. P.; Kelemen, S. The Effect of the Surface Structure of Pt on Its Electronic
Properties and the Adsorption of CO, O2, and H2: A Comparison of Pt(100) – (5×20) and Pt(100) – (1×1).
J. Chem. Phys. 1976, 65, 1773–1782.
(37) Tao, F.; Dag, S.; Wang, L. W.; Liu, Z.; Butcher, D.R.; Salmeron, M.; Somorjai, G. A. Restructuring
of hex-Pt(100) under CO Gas Environments: Formation of 2-D Nanoclusters. Nano Lett. 2009, 9, 2167–
2171.
(38) Cernota, P.; Rider, K.; Yoon, H. A.; Salmeron, M.; Somorjai, G. Dense Structures Formed by CO on
Rh(111) Studied by Scanning Tunneling Microscopy. Surf. Sci. 2000, 445, 249–255.
(39) Conrad, H.; Ertl, G.; Kuppers, J.; Latta, E. E. Interaction of NO and O2 with Pd(111) Surfaces. I.
Surf. Sci. 1977, 65, 235–244.
(40) Chen, P. J.; Goodman, D. W. Ordered High Coverage NO Overlayers on Pd(111). Surf. Sci. 1993,
297, L93–L99.
(41) Bertolo, M.; Jacobi, K. NO Adsorption on Pd(111) in the Temperature Range between 20 and 300 K.
Surf. Sci. 1990, 226, 207–220.
(42) Hansen, K. H.; Sljivancanin, Z.; Hammer, B.; Lægsgaard, E.; Besenbacher, F.; Stensgaard, I. An
STM and DFT Study of the Ordered Structures of NO on Pd(111). Surf. Sci. 2002, 496, 1–9.
(43) Vang, R. T.; Wang, J. G.; Knudsen, J.; Schnadt, J.; Laegsgaard, E.; Stensgaard, I.; Besenbacher, F.
The Adsorption Structure of NO on Pd(111) at High Pressures Studied by STM and DFT. J. Phys. Chem.
B 2005, 109, 14262–14265.
100
(44) Kim, Y. J.; Thevuthasan, S.; Herman, G. S.; Peden, C. H. F.; Chambers, S. A.; Belton, D. N.;
Permana, H. Chemisorption Geometry of NO on Rh(111) by X-ray Photoelectron Diffraction. Surf. Sci.
1996, 359, 269–279.
(45) Zasada, I.; Van Hove, M. A.; Somorjai, G. A. Reanalysis of the Rh(111)+(2×2)-3NO Structure Using
Automated Tensor LEED. Surf. Sci. Lett. 1998, 418, L89–L93.
(46) Rider, K. B.; Hwang, K. S.; Salmeron, M.; Somorjai, G. A. Structure and Dynamics of Dense
Monolayers of NO Adsorbed on Rh(111) in Equilibrium with the Gas Phase in the Torr Pressure Range.
Phys. Rev. Lett. 2001, 86, 4330–4333.
(47) Bond, G. C. Supported Metal Catalysts: Some Unsolved Problems. Chem. Soc. Rev. 1991, 20,
441−475.
(48) Zaera, F.; Somorjai, G. A. Hydrogenation of Ethylene over Platinum (111) Single-Crystal Surfaces.
J. Am. Chem. Soc. 1984, 106, 2288−2293.
(49) Hatzikos, G. H.; Masel, R. I. Structure Sensitivity of Ethylene Adsorption on Pt(100): Evidence for
Vinylidene Formation on (1 × 1) Pt(100). Surf. Sci. 1987, 185, 479−494.
(50) McCrea, K. R.; Somorjai, G. A. SFG-Surface Vibrational Spectroscopy Studies of Structure
Sensitivity and Insensitivity in Catalytic Reactions: Cyclohexene Dehydrogenation and Ethylene
Hydrogenation on Pt(111) and Pt(100) Crystal Surfaces. J. Mol. Catal. A: Chem. 2000, 163, 43−53.
(51) Morgan, A. E.; Somorjai, G. A. Low Energy Electron Diffraction Studies of Gas Adsorption on the
Platinum (100) Single-crystal Surface. Surf. Sci. 1968, 12, 405−425.
(52) Fischer, T. E.; Kelemen, S. R. Adsorption of Ethylene on the Pt(100) Surface. Surf. Sci. 1977, 69,
485−507.
(53) Rønning, M.; Bergene, E.; Borg, A.; Ausen, S.; Holmen, A. Scanning Tunnelling Microscopic
Studies on the Adsorption and Decomposition of Ethene on the Reconstructed Pt(100)-hex-R0.7° Surface.
Surf. Sci. 2001, 477, 191−197.
(54) Zhu, Z.; Butcher, D. R.; Mao, B.; Liu, Z.; Salmeron, M.; Somorjai, G. A. In Situ Scanning Tunneling
Microscopy and X‑ray Photoelectron Spectroscopy Studies of Ethylene-Induced Structural Changes on
the Pt(100)-hex Surface. J. Phys. Chem. C 2013, 117, 2799−2804.
(55) Bartels, L.; Meyer, G.; Rieder, K.-H. The Evolution of CO Adsorption on Cu(111) as Studied with
Bare and CO-functionalized Scanning Tunneling Tips. Surf. Sci. 1999, 432, L621–L626.
(56) Li, W.; Kong, L.; Feng, B.; Fu, H.; Li, H.; Zeng, X. C.; Wu, K.; Chen, L. Abnormal Phase Transition
between Two-Dimensional High-Density Liquid Crystal and Low-Density Crystalline Solid Phases. Nat.
Comm. 2018, 9, 198.
101
(57) Eren, B.; D. Zherebetskyy, D.; Patera, L. L.; Wu, C. H.; Bluhm, H.; Africh, C.; Wang, L.-W.;
Somorjai, G. A.; Salmeron, M. Activation of Cu(111) Surface by Decomposition into Nanoclusters driven
by CO Adsorption. Science 2016, 351, 475–478.
(58) Lysenko, O. V.; Stepanyuk, V. S.; Hergert, W.; Kirschner, J. Mesoscopic Relaxation in
Homoepitaxial Metal Growth. Phys. Rev. Lett. 2002, 89, 126102.
(59) Lagoute, J.; Liu, X.; Fölsch, F. Link Between Adatom Resonances and the Cu(111) Shockley
Surface State. Phys. Rev. Lett. 2005, 95, 13680.
(60) Dion, M.; Rydberg, H.; Schröder, E.; Langreth, D. C.; Lundqvist, B. I. Van der Waals Density
Functional for General Geometries. Phys. Rev. Lett. 2004, 92, 246401.
(61) Eren, B.; Zherebetskyy, D.; Hao, Y.; Patera, L. L.; Wang, L.-W.; Somorjai, G. A.; Salmeron, M.
One-dimensional Nanoclustering of The Cu(100) Surface under CO Gas in the mbar Pressure Range.
Surf. Sci. 2016, 651, 210–214.
(62) Vollmer, S.; Witte, G.; Christof Wöll, C. Determination of Site Specific Adsorption Energies of CO
on Copper. Catal. Lett. 2001, 77, 97–101.
(63) Eren, B.; Liu, Z.; Stacchiola, D.; Somorjai, G. A.; Salmeron, M. Structural Changes of Cu(110) and
Cu(110)-(2×1)-O Surfaces Under Carbon Monoxide in the Torr Pressure Range Studied With Scanning
Tunneling Microscopy and Infrared Reflection Absorption Spectroscopy. J. Phys. Chem. C 2016, 120,
8227–8231.
(64) Hollins P.; J. Pritchard, P. in: Vibrational Spectroscopies of Adsorbates, Vol. 15, Ed. R.F. Willis;
Springer: Berlin, 1980.
(65) Truong, C. M.; Rodriguez, J. A.; Goodman, D. W. CO Adsorption Isotherms on Cu(100) at Elevated
Pressures and Temperatures Using Infrared Reflection Absorption Spectroscopy. Surf. Sci. Lett. 1992,
271, L385–L391.
(66) Greenler, R. G.; Hayden, B. E.; Kretzschmar, K.; Klauser, R.; Bradshaw, A. M. Proc. 9th Intern.
Congress on Catalysis, 1984, Berlin IV-197, Verlag Chemie, Weinheim.
(67) Roiaz, M.; Falivene, L.; Rameshan, C.; Cavallo, L.; Kozlov, S. M.; Rupprechter, G. Roughening of
Copper (100) at Elevated CO Pressure: Cu Adatom and Cluster Formation Enable CO Dissociation. J.
Phys. Chem. C 2019, 123, 13, 8112–8121.
(68) Jugnet, W.; Cadete Santos Aires, F. J.; Deranlot, C.; Piccolo, L.; Bertolini. J. C. CO Chemisorption
on Au(1 1 0) Investigated under Elevated Pressures by Polarized Reflection Absorption Infrared
Spectroscopy and Scanning Tunneling Microscopy. Surf. Sci. Lett. 2002, 521, L639–L644.
102
(69) Hrbek, J.; Hoffmann, F. M.; Park, J. B.; Liu, P.; Stacchiola, D.; Hoo, Y. S.; Ma, S.; Nambu, A.;
Rodriguez, J. A.; White, M. G. Adsorbate-Driven Morphological Changes of a Gold Surface at Low
Temperatures. J. Am. Chem. Soc. 2008, 130, 17272−17273.
(70) Wang, J.; McEntee, M.; Tang, W.; Neurock, M.; Baddorf, A. P.; Maksymovych, P.; Yates, Jr., J. T.
Formation, Migration, and Reactivity of Au–CO Complexes on Gold Surfaces. J. Am. Chem. Soc. 2016,
138, 1518−1526.
(71) Piccolo, L.; Loffreda, D.; Cadete Santos Aires, F. J.; Deranlot, C.; Jugnet, Y.; Sautet, P.; Bertolini, J.
C. The Adsorption of CO on Au(1 1 1) at Elevated Pressures Studied by STM, RAIRS and DFT
Calculations. Surf. Sci. 2004, 566–568, 995–1000.
(72) Goerge, J.; Zeppenfeld, P.; David, R.; Büchel, M.; Comsa, G. Structure of the Hydrogen Covered
Cu(110) Surface Studied with Thermal Energy Helium Scattering. Surf. Sci. 1993, 289, 201–213.
(73) Spitzl, R.; Niehus, H.; Poelsema, B.; Comsa, G. H-induced (1×2) Reconstruction of the Cu(110)
Surface: Structure and Deconstruction Kinetics. Surf. Sci. 1990, 239, 243–253.
(74) Hayden, B. E.; Lackey, D.; Schott, J. A Vibrational Study of the Hydrogen Induced Reconstructions
on Cu(110). Surf. Sci. 1990, 239, 119–126.
(75) Österlund, L.; Rasmussen, P. B.; Thostrup, P.; Lægsgaard, E.; Stensgaard, I.; Besenbacher, F.
Bridging the Pressure Gap in Surface Science at the Atomic Level: H/Cu(110). Phys. Rev. Lett. 2001, 86,
460–463.
(76) Shi, Y.; Choi, B. Y.; Salmeron, M., Water Chains Guide the Growth of Monoatomic Copper Wires
on Cu(110). J. Phys. Chem. C 2013, 117, 17119–17122
(77) Eren, B.; Weatherup, R.; Liakakos, N.; Somorjai, G. A.; Salmeron, M. Dissociative Carbon Dioxide
Adsorption and Morphological Changes on Cu(100) and Cu(111) at Ambient Pressures. J. Am. Chem.
Soc. 2016, 138, 8207–8211.
(78) Hagman, B.; Posada-Borbón, A.; Schaefer, A.; Shipilin, M.; Zhang, C.; Merte, L. R.; Hellman, A.;
Lundgren, E.; Grönbeck, H.; Gustafson, J. Steps Control the Dissociation of CO2 on Cu(100). J. Am.
Chem. Soc. 2018, 140, 12974–12979.
(79) Eren, B.; Kersell, H.; Weatherup, R.; Heine, C.; Crumlin, E. J.; Friend, C. M.; Salmeron, M.
Structure of the Clean and Oxygen-Covered Cu(100) Surface at Room Temperature in the Presence of
Methanol Vapor in the 10 to 200 mTorr Pressure Range. J. Phys. Chem. B 2018, 123, 8112-8121.
(80) Fang, M.; Santos, G.; Chen, Z.; Baldelli, S. Roles of Oxygen for Methanol Adsorption on
Polycrystalline Copper Surface Revealed by Sum Frequency Generation Imaging Microscopy. Surf. Sci.
2016, 648, 35−41.
(81) Greeley, J.; Mavrikakis, M. Methanol Decomposition on Cu(111): A DFT Study. J. Catal. 2002,
208, 291−300.
103
(82) Hoyt, R. A.; Montemore, M. M.; Sykes, E. C. H.; Kaxiras, E. Anhydrous Methanol and Ethanol
Dehydrogenation at Cu(111) Step Edges. J. Phys. Chem. C 2018, 122, 38, 21952−21962.
(83) Chen, J.; Zhou, X.; Zhang, Y.; Jiang, B. Vibrational Control of Selective Bond Cleavage in
Dissociative Chemisorption of Methanol on Cu(111). Nature Comm. 2018, 9, 4039.
(84) Sakong, S. Methanol Oxidation on Oxygen Covered Cu Surfaces. Ph.D. Thesis, Technische
Universitat Munchen, 2005.
(85) Freund, H.-J.; Meijer, G.; Scheffler, M.; Schlogl, R.; Wolf, M. CO Oxidation as a Prototypical
Reaction for Heterogeneous Processes. Angew. Chem., Int. Ed. 2011, 50, 10064−10094.
(86) van Spronsen, M. A.; Frenken, J. W. M.; Groot, I. M. N. Surface Science under Reaction Conditions:
CO Oxidation on Pt and Pd Model Catalysts. Chem. Soc. Rev. 2017, 46, 4347−4374.
(87) Wintterlin, J.; Völkening, S.; Janssens, T. V. W.; Zambelli, T.; Ertl, G. Atomic and Macroscopic
Reaction Rates of a Surface-Catalyzed Reaction. Science 1997, 278, 1931−1934.
(88) Yeates, R. C.; Turner, J. E.; Gellman, A. J.; Somorjai, G. A. The Oscillatory Behavior of the Co
Oxidation Reaction at Atmospheric Pressure over Platinum Single-crystals: Surface Analysis and
Pressure Dependent Mechanisms. Surf. Sci. 1985, 149, 175−190.
(89) Eiswirth, M.; Ertl, G. Kinetic Oscillations in the Catalytic CO Oxidation on a Pt (110) Surface. Surf.
Sci. 1986, 177, 90−100.
(90) Hendriksen, B. L. M.; Frenken, J. W. M. CO Oxidation on Pt(110):Scanning Tunneling Microscopy
Inside a High-Pressure Flow Reactor. Phys. Rev. Lett. 2002, 89, 046101.
(91) Van Spronsen, M. A.; Van Baarle, G. J. C.; Herbschleb, C. T.; Frenken, J. W. M.; Groot, I. M. N.
High-pressure Operando STM Studies Giving Insight in CO Oxidation and NO Reduction over Pt(110).
Catal. Today 2015, 244, 85−95.
(92) Ackermann, M. D.; Pedersen, T. M.; Hendriksen, B. L. M.; Robach, O.; Bobaru, S. C.; Popa, I.;
Quiros, C.; Kim, H.; Hammer, B.; Ferrer, S.; et al. Structure and Reactivity of Surface Oxides on Pt (110)
during Catalytic CO Oxidation. Phys. Rev. Lett. 2005, 95, 255505.
(93) Hendriksen, B. L. M.; Bobaru, S. C.; Frenken, J. W. M. Oscillatory CO Oxidation on Pd(1 0 0)
Studied with in situ Scanning Tunneling Microscopy. Surf. Sci. 2004, 552, 229–242.
(94) Van Rijn, R.; Balmes, O.; Resta, A.; Wermeille, D.; Westerström, R.; Gustafson, J.; Felici, R.;
Lundgren, E.; Frenken, J. W. M. Surface Structure and Reactivity of Pd(100) During CO Oxidation Near
Ambient Pressures. Phys. Chem. Chem. Phys. 2011, 13, 13167–13171.
(95) Onderwaater, W. G.; Balmes, O.; Roobol, S. B.; Van Spronsen, M.; Drnec, J.; Carla, F. Felici, R.;
Frenken, J. W. M. Oxidation of CO on Pd(100): On the Structural Evolution of the PdO Layer during the
Self Sustained Oscillation Regime. Catal. Struct. React. 2017, 3, 89–94.
104
(96) Africh, C.; Esch, F.; Comelli, G.; Rosei, R. Reactivity and Deconstruction of the (1×2)-Rh(110)
Surface Studied by Scanning Tunneling Microscopy. J. Chem. Phys. 2002, 116, 7200–7206.
(97) Nguyen, L.; Liu, L.; Assefa, S.; Wolverton, C.; Schneider, W. F. Tao, F. Atomic-Scale Structural
Evolution of Rh(110) during Catalysis. ACS Catal. 2017, 7, 1, 664–674.
(98) Royer, S.; Duprez, D. Catalytic Oxidation of Carbon Monoxide over Transition Metal Oxides.
ChemCatChem 2011, 3, 24−65.
(99) Matsumoto, T.; Bennett, R. A.; Stone, P.; Yamada, T.; Domen, K.; Bowker, M. Scanning Tunneling
Microscopy Studies of Oxygen Adsorption on Cu(111). Surf. Sci. 2001, 471, 225–245.
(100) Yang, F.; Choi, Y.; Liu, P.; Hrbek, J.; Rodriguez, J. A. Autocatalytic Reduction of a Cu2O/Cu(111)
Surface by CO: STM, XPS, and DFT Studies. J. Phys. Chem. C 2010, 114, 17042–17050.
(101) Yang, F.; Choi, Y.; Liu, P.; Stacchiola, D.; Hrbek, J.; Rodriguez, J. A. Identification of 5–7 Defects
in a Copper Oxide Surface. J. Am. Chem. Soc. 2011, 133, 11474–11477.
(102) Baber, A. E.; Xu, F.; Dvorak, F.; Mudiyanselage, K.; Soldemo, M.; Weissenrieder, J.; Senanayake,
S. D.; Sadowski, J. T.; Rodriguez, J. A.; Matolin, V. In Situ Imaging of Cu2O under Reducing Conditions:
Formation of Metallic Fronts by Mass Transfer. J. Am. Chem. Soc. 2013, 135, 16781–16784.
(103) Leibsle, F. M. STM Studies of Oxygen-induced Structures and Nitrogen Coadsorption on the
Cu(100) Surface: Evidence for One-Dimensional Oxygen Reconstruction and Reconstructive Interactions.
Surf. Sci. 1995, 337, 51−66.
(104) Ling, W. L.; Takeuchi, O.; Ogletree, D. F.; Qiu, Z. Q.; Salmeron, M. STM Studies on the Growth
of Monolayers: Co on Cu(110) with One Half Monolayer of Preadsorbed Oxygen. Surf. Sci. 2000, 450,
227−241.
(105) Eren, B.; Lichtenstein, L.; Wu, C. H.; Bluhm, H.; Somorjai, G. A.; Salmeron, M. Reaction of CO
with Preadsorbed Oxygen on Low-Index Copper Surfaces: An Ambient Pressure X-Ray Photoelectron
Spectroscopy and Scanning Tunneling Microscopy Study. J. Phys. Chem. C 2015, 119, 14669−14674.
(106) Xu, F.; Mudiyanselage, K.; Baber, A. E.; Soldemo, M.; Weissenrieder, J.; White, M. G.; Stacchiola,
D. J. Redox-Mediated Reconstruction of Copper during Carbon Monoxide Oxidation. J. Phys. Chem. C
2014, 118, 15902–15909.
(107) Wiame, F.; Maurice, V.; Marcus, P. Initial Stages of Oxidation of Cu(111). Surf. Sci. 2007, 601,
1193–1204.
(108) Mendes, G.C.C.; Brandão, T.R.S.; Silva, C.L.M. Ethylene Oxide Sterilization of Medical Devices:
A Review. Am. J. Infect. Control 2007, 35, 574–581.
(109) Montemore, M. M.; van Spronsen, M. A.; Madix, R. J.; Friend, C. M. O2 Activation by Metal
Surfaces: Implications for Bonding and Reactivity on Heterogeneous Catalysts. Chem. Rev. 2018, 118,
2816–2862.
105
(110) Heine, Ch.; Eren, B.; Lechner, B. A. J.; Salmeron, M. A Study of the O/Ag(111) System with
Scanning Tunneling Microscopy and X-Ray Photoelectron Spectroscopy at Ambient Pressures. Surf. Sci.
2016, 652, 51–57.
(111) Li, W.-X.; Stampfl, C.; Scheffler, M. Subsurface Oxygen and Surface Oxide Formation At
Ag(111): A Density-Functional Theory Investigation. Phys. Rev. B 2003, 67, 045408.
(112) Todorova, M.; Li, W. X.; Ganduglia-Pirovano, M. V.; Stampfl, C.; Reuter, K.; Scheffler, M.
Role of Subsurface Oxygen in Oxide Formation at Transition Metal Surfaces. Phys. Rev. Lett. 2002, 89,
096103.
(113) Böcklein, S.; Günther, S.; Wintterlin, J. Scanning Tunneling Microscopy of a Silver Surface during
Catalytic Formation Of Ethylene Oxide. Angew. Chem. Int. Ed. 2013, 52, 5518–5521.
(114) Grant, R. B.; Lambert, R. M. A Single-crystal Study of the Silver-Catalysed Selective Oxidation
and Total Oxidation of Ethylene. J. Catal. 1985, 92, 364–375;
(115) Bukhtiyarov, V. I.; Boronin, A. I.; Savchenko. V. I. Two Oxygen States and the Role of Carbon in
Partial Oxidation of Ethylene over Silver. Surf. Sci. 1990, 232, L205– L209;
(116) Bukhtiyarov, V. I.; Prosvirin, I. P.; Kvon, R. I. Study of Reactivity of Oxygen States Adsorbed at a
Silver Surface towards C2H4 by XPS, TPD and TPR. Surf. Sci. 1994, 320, L47– L50;
(117) Herbschleb, C. T.; Bobaru, S. C.; Frenken, J. W. M. High-pressure STM study of NO reduction by
CO on Pt(100). Catal. Today 2010, 154, 61–67.
(118) Rider, K. B.; Hwang, K. S.; Salmeron, M.; Somorjai, G. A. High-Pressure (1 Torr) Scanning
Tunneling Microscopy (STM) Study of the Coadsorption and Exchange of CO and NO on the Rh(111)
Crystal Face. J. Am. Chem. Soc. 2002, 124, 5588–5593.
(119) Permana, H.; Ng, K. Y. S.; Peden, C. H. F.; Schmieg, S. J.; Lambert, D. K.; Belton, D. N. Adsorbed
Species and Reaction Rates for NO–CO over Rh(111). J. Catal. 1996, 164, 194–206.
(120) Zhdanov, V. P.; Kasemo, B. Mechanism and Kinetics of the NO-CO Reaction on Rh. Surf. Sci.
Rep. 1997, 29, 31–90.
(121) Requejo, F.G.; Hebenstreit, E.L.D.; Ogletree, D.F.; Salmeron, M. An In Situ XPS Study of Site
Competition between CO and NO on Rh(111) in Equilibrium with the Gas Phase. J. Catal. 2004, 226,
83–87.
(122) Kim, J.; Noh, M. C.; Doh, W. H.; Park, J. Y. In Situ Observation of Competitive CO and O2
Adsorption on the Pt(111) Surface Using Near-Ambient Pressure Scanning Tunneling Microscopy. J.
Phys. Chem. C., 122, 6246–6254.
(123) Gland, J. L.; Sexton, B. A.; Fisher, G. B. Oxygen Interactions with the Pt(111) Surface. Surf. Sci.
1980, 95, 587–602.
(124) Zunino, L.; Garavaglia, M. Moire by Fractal Structures. J. Mod. Opt. 2003, 50, 1477−1486.
106
(125) Zaera, F.; French, C. R. Mechanistic Changes in the Conversion of Ethylene to Ethylidyne on
Transition Metals Induced By Changes in Surface Coverages. J. Am. Chem. Soc. 1999, 121, 2236–2243.
(126) Starke, U. Barbieri, A.; Materer, N.; Van Hove, M. A.; Somorjai, G. A. Ethylidyne on Pt(111):
Determination of Adsorption Site, Substrate Relaxation and Coverage By Automated Tensor LEED. Surf.
Sci. Lett. 1993, 286, 1–14.
(127) Land, T. A.; Michely, T.; Behm, R. J.; Hemminger, J. C.; Comsa, G. Direct Observation of Surface
Reactions by Scanning Tunneling Microscopy: Ethylene→Ethylidyne→Carbon Particles→Graphite on
Pt(111). J. Chem. Phys. 1992, 97, 6774–6783.
(128) Land, T. A.; Michely, T.; Behm, R. J.; Hemminger, J. C.; Comsa, G. STM Investigation of the
Adsorption and Temperature Dependent Reactions of Ethylene on Pt(111). Appl. Phys. A 1991, 53, 414–
417.
(129) Umezawa, K.; Ito, T.; Asada, M. Nakanishia, S.; Ding, P.; Lanford, W. A.; Hjörvarsson, B.
Adsorption of Hydrogen on the Pt(111) Surface from Low-energy Recoil Scattering. Surf. Sci. 1997, 387,
320–327.
(130) Batra, I. P.; Barker, J. A.; Auerbach, D. J. Helium Scattering from (1 × 1) H-Pt(111). J. Vac. Sci.
Technol. A. 1984, 2, 943–973.
(131) Christmann, K. Interaction of Hydrogen with Solid Surfaces. Surf. Sci. Rep. 1988, 9, 1–163.
(132) Tang, D. C. Hwang, K. S.; Salmeron, M.; Somorjai, G. A. High Pressure Scanning Tunneling
Microscopy Study of CO Poisoning of Ethylene Hydrogenation on Pt(111) and Rh(111) Single-crystals. J
Phys. Chem. B. 2004, 108, 13300–13306.
(133) Chen P, Kung KY, Shen YR, Somorjai GA. Sum Frequency Generation Spectroscopic Study of
CO/Ethylene Coadsorption on the Pt(111) Surface and CO Poisoning of Catalytic Ethylene
Hydrogenation. Surf. Sci. 2001, 494, 289–297.
(134) Ainsworth, M. K.; Mccoustra, M. R. S.; Chesters, M. A.; Sheppard, N.; De La Cruz, C. An Infrared
Study of Ethene and CO Coadsorption on Pt[111] and a Pt/SiO2 Catalyst: Ambiguities in the
Interpretation of Difference Spectra. Surf. Sci. 1999, 437, 9–17.
(135) Payne, S. H.; Kreuzer, H. J.; Frie, W.; Hammer, L.; Heinz, K. Adsorption and Desorption of
Hydrogen on Rh(311) and Comparison with Other Rh Surfaces. Surf. Sci. 1999, 421, 279–295.
(136) Yanagita, H.; Fujioka, H.; Aruga, T.; Takagi, N.; Nishijima, M. Vibrational Spectra of Hydrogen on
the Rh(111) Surface. Surf. Sci. 1999, 441, 507–514.
(137) Wander, A.; Van Hove, M. A.; Somorjai, G. A. Molecule-induced Displacive Reconstruction in a
Substrate Surface: Ethylidyne Adsorbed on Rh(111) Studied by Low-energy-electron Diffraction. Phys.
Rev. Lett. 1991, 67, 626–628.
107
(138) Bowker, M.; Gland, J. L.; Joyner, R. W.; Li, Y.; Slin’ko, M. M.; Whyman, R. Stoichiometric
Hydrogenation of Ethene on Rh(111); Mechanism, Importance of Weakly Adsorbed Ethene, and
Relationship to Homogeneous Catalysis. Catal. Lett. 1994, 25, 293–308.
(139) Butcher, D. R.; Zhu, Z.; Mao, B. Wang, H.; Liu, Z.; Salmeron, M.; Somorjai, G. A Mobility on the
Reconstructed Pt(100)-hex Surface in Ethylene and in its Mixture with Hydrogen and Carbon Monoxide.
Chem. Commun. 2013, 49, 6903–6905.
(140) Tao, F.; Dag, S.; Wang, L. W.; Liu, Z.; Butcher, D. R.; Bluhm, H.; Salmeron, M.; Somorjai, G. A.
Break-up of Stepped Platinum Catalyst Surfaces by High CO Coverage. Science 2010, 327, 850–853.
(141) Balmes, O.; Prevot, G.; Torrelles, X.; Lundgren, E.; Ferrer, S. Diatomic Steps in Pt(997) Surfaces
Are Better Catalysts than Monatomic Steps for the CO Oxidation Reaction near Atmospheric Pressure.
ACS Catal. 2016, 6, 1285−1291.
(142) Prevot, G.; Steadman, P.; Ferrer, S. Determination of the Elastic Dipole at the Atomic Steps of
Pt(977) from Surface X-ray Diffraction. Phys. Rev. B 2003, 67, 245409.
(143) Giesen, M.; Icking-Konert, G. S. Step-step Interaction Energy on Cu(111) Vicinal Surfaces. Surf.
Rev. Lett. 1999, 6, 27−34
(144) Prevot, G.; Coati, A.; Garreau, Y. Grazing-incidence X-ray Diffraction Measurement of the
Relaxations and Elastic Step Interactions on Cu(211) and Cu(322). Phys. Rev. B 2004, 70, 205406.
(145) Kim, J.; Noh, M. C.; Doh, W. H.; Park, J. Y. Thermal Evolution and Instability of CO-induced
Platinum Clusters on the Pt (557) Surface at Ambient Pressure. J. Am. Chem. Soc. 2016, 138, 1110–1113.
(146) Zhu, Z.; Barroo, C.; Lichtenstein, L.; Eren, B.; Wu, C. H.; Mao, B.; Visart de Bocarmé, T.; Liu, Z.;
Kruse, N.; Salmeron, et al. Influence of Step Geometry on the Reconstruction of Stepped Platinum
Surfaces under Coadsorption of Ethylene and CO. J. Phys. Chem. Lett. 2014, 5, 2626–2631.
(147) Wang, J. G.; Li, W. X.; Borg, M.; Gustafson, J.; Mikkelsen, A.; Pedersen, T. M.; Lundgren, E.;
Weissenrieder, J.; Klikovits, J.; Schmid, M.; et al. One-Dimensional PtO2 at Pt Steps: Formation and
Reaction with CO. Phys. Rev. Lett. 2005, 95, 256102.
(148) Held, G.; Jones, L. B.; Seddon, E. A.; King, D. A. Effect of Oxygen Adsorption on the Chiral
Pt{531} Surface. J. Phys. Chem. B 2005, 109, 6159−6163.
(149) Bandlow, J.; Kaghazchi, P.; Jacob, T.; Papp, C.; Trankenschuh, B.; Streber, R.; Lorenz, M. P. A;
Fuhrmann, T.; Denecke, R.; Steinruck, H. P. Oxidation of Stepped Pt(111) Studied by X-ray
Photoelectron Spectroscopy and Density Functional Theory. Phys. Rev. B 2011, 83, 174107.
(150) Li, W. X.; Osterlund, L.; Vestergaard, E. K.; Vang, R. T.; Matthiesen, J.; Pedersen, T. M.;
Lægsgaard, E.; Hammer, B.; Besenbacher, F. Oxidation of Pt(110). Phys. Rev. Lett. 2004, 93, 146104.
108
(151) Butcher, D. R.; Grass, M. E.; Zeng, Z.; Aksoy, F.; Bluhm, H.; Li, W.-X.; Mun, B. S.; Somorjai, G.
A.; Liu, Z. In Situ Oxidation Study of Pt(110) and Its Interaction with CO. J. Am. Chem. Soc. 2011, 133,
20319−20325.
(152) Zhu, Z.; Tao, F.; Zheng, F.; Chang, R.; Li, Y.; Heinke, L.; Liu, Z.; Salmeron, M.; Somorjai, G. A.
Formation of Nanometer-Sized Surface Platinum Oxide Clusters on a Stepped Pt(557) Single-crystal
Surface Induced by Oxygen: A High Pressure STM and Ambient-Pressure XPS Study. Nano Lett. 2012,
12, 1491−1497.
(153) Zhu, Z.; Melaet, G.; Axnanda, S.; Alayoglu, S.; Liu, Z.; Salmeron, M. Somorjai, G. A. Structure
and Chemical State of the Pt(557) Surface During Hydrogen Oxidation Reaction Studied by in situ
Scanning Tunneling Microscopy and X-Ray Photoelectron Spectroscopy. J. Am. Chem. Soc. 2013, 135,
12560–12563.
(154) Peters, K. F.; Walker, C. J.; Steadman, P.; Robach, O.; Isern H.; Ferrer, S. Adsorption of Carbon
Monoxide on Ni(110) above Atmospheric Pressure Investigated with Surface X-Ray Diffraction. Phys.
Rev. Lett. 2001, 86, 5325.
(155) Nguyen, L.; Cheng, F.; Zhang, S.; Tao, F. Visualization of Surfaces of Pt and Ni Model Catalysts in
Reactive Environments Using Ambient Pressure High Temperature Scanning Tunneling Microscopy and
Understanding the Restructurings of Surfaces of Model Metal Catalysts under Reaction Conditions at
Near Ambient Pressure. J. Phys. Chem. C 2013, 117, 971–977.
(156) Wender, I. Reactions of Synthesis Gas. Fuel Process. Technol. 1996, 48, 189−297.
(157) Schulz, H. Short History and Present Trends of Fischer–Tropsch Synthesis. Appl. Catal. A 1999,
186, 3−12.
(158) Geerlings, J. J. C.; Wilson, J. H.; Kramer, G. J.; Kuipers, H. P. C. E.; Hoek, A.; Huisman, H. M.
Fischer–Tropsch Technology − From Active Site to Commercial Process. Appl. Catal. A 1999, 186,
27−40.
(159) Khodakov, A. Y.; Chu, W.; Fongarland, P. Advances in the Development of Novel Cobalt
Fischer−Tropsch Catalysts for Synthesis of Long-Chain Hydrocarbons and Clean Fuels. Chem. Rev.
2007, 107, 1692−1744.
(160) Fischer, F.; Tropsch, H. Über die Herstellung Synthetischer Ölgemische (Synthol) durch Aufbau
aus Kohlenoxyd und Wasserstoff. Brennstoff-Chemie 1923, 4, 276−285.
(161) Van Der Laan, G. P.; Beenackers, A. A. C. M. Kinetics and Selectivity of the Fischer–Tropsch
Synthesis: A Literature Review. Catal. Rev.: Sci. Eng. 1999, 41, 255−318.
(162) Iglesia, E. Design, Synthesis, and Use of Cobalt-based Fischer-Tropsch Synthesis Catalysts. Appl.
Catal. A 1997, 161, 59−78.
(163) Dry, M. E. The Fischer–Tropsch process: 1950–2000. Catal. Today 2002, 71, 227−241.
109
(164) Torres Galvis, H. M.; De Jong, K. P. Catalysts for Production of Lower Olefins from Synthesis
Gas: A Review. ACS Catal. 2013, 3, 2130−2149.
(165) Jiao, F.; Li, J.; Pan, X.; Xiao, J.; Li, H.; Ma, H.; Wei, M.; Pan, Y.; Zhou, Z.; Li, M.; et al. Selective
Conversion of Syngas to Light Olefins. Science 2016, 351, 1065−1068.
(166) Shetty, S.; van Santen, R. A. CO Dissociation on Ru and Co surfaces: The Initial Step in the
Fischer–Tropsch Synthesis. Catal. Today 2011, 171, 168−173.
(167) Tuxen, A.; Carenco, S.; Chintapalli, M.; Chuang, C.-H.; Escudero, C.; Pach, E.; Jiang, P.;
Borondics, F.; Beberwyck, B.; Alivisatos, A. P.; et al. Size-Dependent Dissociation of Carbon Monoxide
on Cobalt Nanoparticles. J. Am. Chem. Soc. 2013, 135, 2273–2278.
(168) Wu, C.H.; Eren, B.; Bluhm, H.; Salmeron, M. B., Ambient-Pressure X-ray Photoelectron
Spectroscopy Study of Cobalt Foil Model Catalyst under CO, H2, and Their Mixtures. ACS Catal. 2017,
7, 1150–1157.
(169) Wilson, J.; de Groot, C. Atomic-scale Restructuring in High-pressure Catalysis. J. Phys. Chem.
1995, 99, 7860–7866.
(170) Oosterbeek, H. Bridging the Pressure and Material Gap in Heterogeneous Catalysis: Cobalt
Fischer–Tropsch Catalysts from Surface Science to Industrial Application. Phys. Chem. Chem. Phys.
2007, 9, 3570–3576.
(171) Ehrensperger, M.; Wintterlin, J. In situ High-Pressure High-Temperature Scanning Tunneling
Microscopy of a Co(0001) Fischer–Tropsch Model Catalyst. J. Catal. 2014, 319, 274−282.
(172) Bridge, M. E.; Comrie, C. M.; Lambert, R. M. Chemisorption Studies on Cobalt Single-crystal
Surfaces: I. Carbon Monoxide on Co(0001). Surf. Sci. 1977, 67, 393–404.
(173) Papp, H. The Chemisorption of Carbon Monoxide on a Co(0001) Single-crystal Surface; Studied by
LEED, UPS, EELS, AES and Work Function Measurements. Surf. Sci. 1983, 129, 205–218.
(174) Agrawal, P. K.; Katzer, J. R.; W.H. Manogue, Methanation over Transition Metal Catalysts: III.
CoAl2O3 in Sulfur-poisoning Studies. J. Catal. 1981, 69, 327–344.
(175) Ehrensperger, M.; Wintterlin, J. In situ Scanning Tunneling Microscopy of the Poisoning of a
Co(0001) Fischer–Tropsch Model Catalyst by Sulfur. J. Catal. 2015, 329, 49–56.
(176) Lahtinen, J.; Kantola, P.; Jaatinen, S.; Habermehl-Cwirzen, K.; Salo, P.; Vuorinen, J.; Lindroos, M.;
Pussi, K.; Seitsonen, A. P. LEED and DFT Investigation on the (2×2)-S Overlayer on Co(0001).
Surf. Sci. 2005, 599, 113–121.
(177) Habermehl-Cwirzen, K. M. E.; Kauraala, K.; Lahtinen, J. Hydrogen on Cobalt: The Effects of
Carbon Monoxide and Sulphur Additives on the D2/Co(0001) System. Phys. Scripta 2004, T108, 28–32.
(178) Habermehl-Cwirzen, K. M. E.; Lahtinen, J. Sulfur Poisoning of the CO Adsorption on Co(0001).
Surf. Sci. 2004, 573, 183–190.
110
(179) Böller, B.; Ehrensperger, M.; Wintterlin, J. In Situ Scanning Tunneling Microscopy of the
Dissociation of CO on Co(0001). ACS Catal. 2015, 5, 6802–6806.
(180) Papp, H. The Chemisorption of Carbon Monoxide on a Co(0001) Single-crystal Surface; Studied by
LEED, UPS, EELS, AES and Work Function Measurements. Surf. Sci. 1983, 129, 205−218.
(181) Lahtinen, J.; Vaari, J.; Kauraala, K. Adsorption and Structure Dependent Desorption of CO on
Co(0001). Surf. Sci. 1998, 418, 502−510.
(182) Zhang, X.-Q.; van Santen, R. A.; Hensen, E. J. M. Carbon-Induced Surface Transformations of
Cobalt. ACS Catal. 2015, 5, 596−601.
(183) Navarro, V.; van Spronsen, M. A.; Frenken, J. W. M. In situ Observation of Self-assembled
Hydrocarbon Fischer–Tropsch Products on a Cobalt Catalyst. Nat. Chem. 106, 8, 929−934.
(184) Nakamura, S. Study of Metallic Carbides by Electron Diffraction Part IV. Cobalt Carbides. J. Phys.
Soc. Jpn 1961, 16, 1213–1219.
(185) Bergerhoff, G.; Brown, I. D. in International Union of Crystallography (eds Allen, F. H. et al.) 77–
95 (Chester, 1987).
(186) Yamada, R.; Uosaki, K. Two-dimensional Crystals of Alkanes Formed on Au(111) Surface in Neat
Liquid: Structural Investigation by Scanning Tunneling Microscopy. J. Phys. Chem. B 2000, 104, 6021–
6027.
(187) Uosaki, K.; Yamada, R. Formation of Two-dimensional Crystals of Alkanes on the Au(111)
Surface in Neat Liquid. J. Am. Chem. Soc. 1999, 121, 4090–4091.
(188) Xie, Z. X.; Xu, X.; Tang, J.; Mao, B. W. Molecular Packing in Self-Assembled Monolayers of
Normal Alkane on Au(111) Surfaces. Chem. Phys. Lett. 2000, 323, 209–216.
(189) Marchenko, J.; Cousty, A. Substrate-induced Freezing of Alkane Monolayers Adsorbed on Au(111)
Dependent on the Alkane/Gold Misfit. Surf. Sci. 2002, 520, 128–136.
(190) Schulz, G. V. Ueber die Bezeihung zwischen Reaktionsgeschwindigkeit und Zusammensetzung des
Reaktionsproduktes bei Macropolymerisationsvorgangen. Z. Phys. Chem. B 1935, 30, 379.
(191) Flory, P. J. Molecular Size Distribution in Linear Condensation Polymers. J. Am. Chem. Soc. 1936,
58, 1877–1885.
(192) Anderson, R. B.; Seligman, B.; Shultz, J. F.; Kelly, R.; Elliott, M. A. Fischer– Tropsch Synthesis.
Some Important Variables of the Synthesis on Iron Catalyst. Ind. Eng. Chem. 1952, 44, 391–397.
(193) Böller, B.; Durner, K. M.; Wintterlin, J. The Active Sites of a Working Fischer–Tropsch Catalyst
Revealed by Operando Scanning Tunnelling Microscopy. Nature Catalysis 2019, 2, 1027–1034.
(194) Royer, S.; Duprez, D. Catalytic Oxidation of Carbon Monoxide over Transition Metal Oxides.
ChemCatChem 2011, 3, 24–65.
111
(195) Jansson, J.; Palmqvist, A. E. C.; Fridell, E.; Skoglundh, M.; Österlund, L.; Thormählen, P.; Langer,
V. J. On the Catalytic Activity of Co3O4 in Low-Temperature CO Oxidation. J. Catal. 2002, 211, 387–
397.
(196) Jansson, J.; Skoglundh, M.; Fridell, E.; Thormählen, P. A. Mechanistic Study of Low Temperature
CO Oxidation over Cobalt Oxide. Top. Catal. 2001, 16, 385–389.
(197) Weilach, C.; Spiel, C.; Föttinger, K.; Rupprechter, G. Carbonate Formation on Al2O3 Thin Film
Model Catalyst Supports. Surf. Sci. 2011, 605, 1503–1509.
(198) Song, A.; Skibinski, E. S.; DeBenedetti, W. J. I.; Ortoll-Bloch, A. G.; Hines, M. A.
Nanoscale Solvation Leads to Spontaneous Formation of a Bicarbonate Monolayer on Rutile (110) under
Ambient Conditions: Implications for CO2 Photoreduction. J. Phys. Chem. C. 2016, 120, 9326–9333.
(199) Thormählen, P.; Skoglundh, M.; Fridell, E.; Andersson, B. Low-Temperature CO Oxidation over
Platinum and Cobalt Oxide Catalysts. J. Catal. 1999, 188, 300–310.
(200) Cunningham, D.A.H.; Kobayashi, T.; Kamijo, N.; Haruta Influence of Dry Operating Conditions:
Observation of Oscillations and Low Temperature CO Oxidation over Co3O4 and Au/Co3O4 Catalysts. M.
Catal. Lett. 1994, 25, 257–264.
(201) Vayssilov, G. N.; Mihaylov, M.; Petkov, P. St.; Hadjiivanov, K. I.; Neyman, M. Reassignment of
the Vibrational Spectra of Carbonates, Formates, and Related Surface Species on Ceria: A Combined
Density Functional and Infrared Spectroscopy Investigation. J. Phys. Chem. C 2011, 115, 23435–23454.
(202) An, K.; Alayoglu, S.; Musselwhite, N.; Plamthottam, S.; Melaet, G.; Lindeman, A.; Somorjai, G. A.
Enhanced CO Oxidation Rates at the Interface of Mesoporous Oxides and Pt Nanoparticles. J. Am. Chem.
Soc. 2013, 135, 16689–16696.
(203) Kersell, H.; Hooshmand, Z.; Yan, G.; Le, D.; Nguyen, H.; Eren, B.; Wu, C. H.; Waluyo, I.; Hunt,
A.; Nemšák, S.; et al. CO Oxidation Mechanisms on CoOx-Pt Thin Films. J. Am. Chem. Soc. 2020, 142,
8312-8322.
(204) Alonso, D. M.; Wettstein, S. G.; Dumesic, J. A. Bimetallic Catalysts for Upgrading of Biomass to
Fuels and Chemicals. Chem. Soc. Rev. 2012, 41, 8075−8089.
(205) Nørskov, J. K.; Abild-Pedersen, F.; Studt, F.; Bligaard, T. Density Functional Theory in Surface
Chemistry and Catalysis. Proc. Natl. Acad. Sci. 2011, 108, 937−943.
(206) Vestergaard, E. K.; Vang, R. T.; Knudsen, J.; Pedersen, T. M.; An, T.; Lægsgaard, E.; Stensgaard,
I.; Hammer, B.; Besenbacher, F. Adsorbate-Induced Alloy Phase Separation: A Direct View by High-
Pressure Scanning Tunneling Microscopy. Phys. Rev. Lett. 2005, 95, 126101.
(207) Zhdanov, V. P.; Vang, R. T.; Knudsen, J.; Vestergaard, E. K.; Besenbacher, F. Propagation of a
Reaction Front Accompanied by Island Formation: CO/Au/Ni(1 1 1). Surf. Sci. 2006, 600, L260–L264.
112
(208) Prieto, G.; Beijer, S.; Smith, M. L.; He, M.; Au, Y.; Wang, Z.; Bruce, D. A.; de Jong, K. P.; Spivey,
J. J.; de Jongh, P. E. Design and Synthesis of Copper-Cobalt Catalysts for the Selective Conversion of
Synthesis Gas to Ethanol and Higher Alcohols. Angew. Chem., Int. Ed. 2014, 53, 6397−6401.
(209) Mouaddib, N.; Perrichon, V.; Martin, G. A. Characterization of Copper-Cobalt Catalysts for
Alcohol Synthesis from Syngas. Appl. Catal. A 1994, 118, 63−72.
(210) Lewis, E. A.; Jewell, A. D.; Kyriakou, G.; Sykes, E. C. H. Rediscovering Cobalt's Surface
Chemistry. Phys. Chem. Chem. Phys. 2012, 14, 7215−7224.
(211) Lewis, E. A.; Le, D.; Jewell, A. D.; Murphy, C. J.; Rahman, T. S.; Sykes, E. C. H. Dissociative
Hydrogen Adsorption on Close-Packed Cobalt Nanoparticle Surfaces. ACS Nano 2013, 7, 4384−4392.
(212) Carenco, S.; Tuxen, A.; Chintapalli, M.; Pach, E.; Escudero, C.; Ewers, T. D.; Jiang, P.; Borondics,
F.; Thornton, G.; Alivisatos, A. P.; et al. Dealloying of Cobalt from CuCo Nanoparticles under Syngas
Exposure. J. Phys. Chem. C 2013, 117, 6259−6266.
(213) Eren, B.; Torres, D.; Karslıoğlu, O.; Liu, Z.; Wu, C. H.; Stacchiola, D.; Bluhm, H.; Somorjai, G. A.;
Salmeron, M. The Structure of Copper-Cobalt Surface Alloys in Equilibrium with Carbon Monoxide Gas.
J. Am. Chem. Soc. 2018, 140, 6575–6581.
(214) Ling, W. L.; Takeuchi, O.; Ogletree, D. F.; Qiu, Z. Q.; Salmeron, M. STM Studies on the Growth
of Monolayers: Co on Cu(110) with One Half Monolayer of Preadsorbed Oxygen. Surf. Sci. 2000, 450,
227−241.
(215) Collinge, G.; Kruse, N.; McEwen, J.-S. Dissolution of CoCu Catalyst Step Defects by Co
Subcarbonyl Formation. J. Catalysis 2018, 368, 31−37.
(216) Falo, F.; Cano, I.; Salmeron, M. CO Chemisorption on Two-dimensional Cobalt Clusters: A
Surface Science Approach to Cluster Chemistry. Surf. Sci. 1984, 143, 303−313.
(217) Mu, R.; Fu, Q.; Xu, H.; Zhang, H.; Huang, Y.; Jiang, Z.; Zhang, S.; Tan, D.; Bao, X. Synergetic
Effect of Surface and Subsurface Ni Species at Pt−Ni Bimetallic Catalysts For CO Oxidation. J. Am.
Chem. Soc. 2011, 133, 1978–1986.
(218) Kim, J.; Park, W. H.; Doh, W. H.; Lee, S. W.; Noh, M. C.; Gallet. J-J.; Bournel, F.; Kondoh, H.;
Mase, K.; Jung, Y.; et al. Adsorbate-driven Reactive Interfacial Pt-NiO1-x Nanostructure Formation on the
Pt3Ni(111) Alloy Surface. Sci. Adv. 2018, 4, eaat3151.
(219) Kim, Y. S.; Jeon, S. H.; Bostwick, A.; Rotenberg, E.; Ross, P. N.; Stamenkovic, V. R.; Markovic,
N. M.; Noh, T. W.; Han, S.; Mun, B. S. Role of Transition Metal in Fast Oxidation Reaction on the
Pt3TM (111) (TM = Ni, Co) Surfaces. Adv. Energy Mater. 2013, 3, 1257–1261.
(220) Su, H.-Y.; Bao, X.-H.; Li, W.-X. Modulating the Reactivity of Ni-containing Pt(111)-skin Catalysts
by Density Functional Theory Calculations. J. Chem. Phys. 2008, 128, 194707.
113
(221) Kim, J. Doh, W. H.; Kim, Y.; Kim, K. J.; Park, J. Y. Water-Assisted Growth of Cobalt Oxide and
Cobalt Hydroxide Overlayers on the Pt3Co(111) Surface. ACS Appl. Energy Mater. 2019, 2, 8580-8586.
(222) Walton, A. S.; Fester, J.; Bajdich, M.; Arman, M. A.; Osiecki, J.; Knudsen, J.; Vojvodic,
A.; Lauritsen, J. V. Interface Controlled Oxidation States in Layered Cobalt Oxide Nanoislands on
Gold. ACS Nano 2015, 9, 2445–2453.
(223) Mcintyre, B. J.; Salmeron, M.; Somorjai, G. A. Nanocatalysis by the Tip of a Scanning Tunneling
Microscope Operating Inside a Reactor Cell. Science 1994, 265, 1415-1418.
(224) Schröder, U.; Mcintyre, B. J.; Salmeron, M.; Somorjai, G. A. Spatially Controlled Oxidation by the
Tip of a Scanning Tunneling Microscope Operating Inside a Reactor. Surf. Sci. 1995, 331–333, 337–342.
TOC:
Copyright © 2022 FDOKUMEN