Analysis of the magnitude-frequency distribution for the 1983–1984 earthquake activity of Campi...
11
Journal of Volcanology and Geothermal Research, 48 ( 1991 ) 115-125 Elsevier Science Publishers B.V., Amsterdam 115 Analysis of the magnitude-frequency distribution for the 1983- 1984 earthquake activity of Campi Flegrei, Italy Giuseppe Vilardoa, Giuliana Alessioa and Giuseppe Luongoa'b aOsservatorio Vesuviano, Ercolano (Napoli), Italy bDipartimento di Geofisica e Vulcanologia, Napoli, Italy (Received October 10, 1990; revised version accepted February 6, 1991 ) ABSTRACT Vilardo, G., Alessio, G. and Luongo, G., 1991. Analysis of the magnitude-frequency distribution for the 1983-1984 earth- quake activity of Campi Flegrei, Italy. In: G. Luongo and R. Scandone (Editors), Campi Flegrei. J. Volcanol. Geotherm. Res., 48: 115-125. The magnitude-frequency distribution of earthquakes is one of the statistical relationships most frequently used to study the seismicity of a region. In this paper the Gutenberg-Richter frequency magnitude relationship is applied to the 1983- 1984 earthquake sequence of Campi Flegrei, Italy, in order to estimate the space-time variation of the b-value, and its possible correlation with other geophysical parameters in the sequence. The investigated region has been divided into three areas on the basis of differences in seismic activity: (a) to the west of Pozzuoli, where seismicity occurred mostly as swarms; (b) to the east of Pozzuoli, where events mostly included single, high-energy earthquakes; and (c) in the western sector of the Gulf of Pozzuoli. Moreover, b-value estimates have been carried out according to different hypocentral depths of all seismic events in the sequence. The obtained results have shown strong depth variations of the b-value which might reflect important differences in failure conditions at different depths. Furthermore, a certain complexity in the shape of the obtained distribution functions n (M) has been pointed out. Temporal variations of b-value, computed both for the whole region and the different selected areas, seem to be mean- ingful because they do not depend on the number of shocks AN, the data overlap and the magnitude step AM. The rates of change of b-value Ab/At, compared with the changing rates of seismic energy release AE/At do not show a consistent correlation, hence the Ab/At curve cannot be interpreted as a precursor to the other in any systematic way. Introduction Statistical methods are widely applied for investigating the seismicity of a region. By us- ing such methods, we can evaluate numerical parameters characteristic of the observed ac- tivity and attempt to correlate these parame- ters with the geophysical conditions governing seismic energy release. One of the fundamental relations of earth- quake statistics is the magnitude-frequency distribution of seismic events. The specific shape of the distribution varies according to the regions and time intervals analyzed; conse- quently, several empirical relations have been proposed for fitting observed magnitude-fre- quency distributions (Gutenberg and Richter, 1944; Shlien and Toksoz, 1970; Utsu, 1971; Purcaru, 1975). The most commonly used of these relations, due to Gutenberg and Richter ( 1944 ), has the simple form: log n(M) =a-b M (1) where n (M) is the number of earthquakes with magnitudes in the interval from M-dM to
-
Upload
independent -
Category
Documents
-
view
0 -
download
0
Transcript of Analysis of the magnitude-frequency distribution for the 1983–1984 earthquake activity of Campi...

Journal of Volcanology and Geothermal Research, 48 ( 1991 ) 115-125 Elsevier Science Publishers B.V., Amsterdam
115
Analysis of the magnitude-frequency distribution for the 1983- 1984 earthquake activity of Campi Flegrei, Italy
Giuseppe Vilardo a, Giuliana Alessio a and Giuseppe Luongo a'b aOsservatorio Vesuviano, Ercolano (Napoli), Italy
bDipartimento di Geofisica e Vulcanologia, Napoli, Italy
(Received October 10, 1990; revised version accepted February 6, 1991 )
ABSTRACT
Vilardo, G., Alessio, G. and Luongo, G., 1991. Analysis of the magnitude-frequency distribution for the 1983-1984 earth- quake activity of Campi Flegrei, Italy. In: G. Luongo and R. Scandone (Editors), Campi Flegrei. J. Volcanol. Geotherm. Res., 48: 115-125.
The magnitude-frequency distribution of earthquakes is one of the statistical relationships most frequently used to study the seismicity of a region. In this paper the Gutenberg-Richter frequency magnitude relationship is applied to the 1983- 1984 earthquake sequence of Campi Flegrei, Italy, in order to estimate the space-time variation of the b-value, and its possible correlation with other geophysical parameters in the sequence.
The investigated region has been divided into three areas on the basis of differences in seismic activity: (a) to the west of Pozzuoli, where seismicity occurred mostly as swarms; (b) to the east of Pozzuoli, where events mostly included single, high-energy earthquakes; and (c) in the western sector of the Gulf of Pozzuoli.
Moreover, b-value estimates have been carried out according to different hypocentral depths of all seismic events in the sequence.
The obtained results have shown strong depth variations of the b-value which might reflect important differences in failure conditions at different depths.
Furthermore, a certain complexity in the shape of the obtained distribution functions n (M) has been pointed out. Temporal variations of b-value, computed both for the whole region and the different selected areas, seem to be mean-
ingful because they do not depend on the number of shocks AN, the data overlap and the magnitude step AM. The rates of change of b-value Ab/At, compared with the changing rates of seismic energy release AE/At do not show a
consistent correlation, hence the Ab/At curve cannot be interpreted as a precursor to the other in any systematic way.
Introduction
Statistical methods are widely applied for investigating the seismicity of a region. By us- ing such methods, we can evaluate numerical parameters characteristic of the observed ac- tivity and attempt to correlate these parame- ters with the geophysical conditions governing seismic energy release.
One of the fundamental relations of earth- quake statistics is the magnitude-frequency distribution of seismic events. The specific shape of the distribution varies according to the
regions and time intervals analyzed; conse- quently, several empirical relations have been proposed for fitting observed magnitude-fre- quency distributions (Gutenberg and Richter, 1944; Shlien and Toksoz, 1970; Utsu, 1971; Purcaru, 1975). The most commonly used of these relations, due to Gutenberg and Richter ( 1944 ), has the simple form:
log n(M) = a - b M (1)
where n (M) is the number of earthquakes with magnitudes in the interval from M - d M to

1 16 G. VILARDO ET AL.
M + dM, and a and b are constants whose val- ues depend on the physical conditions of the seismic zone of interest. Thus, while a is a measure of the level of seismicity, b has been related by experimental studies to the mechan- ical structure of the deforming rocks (Mogi, 1963) and to the amount of applied stress (Scholz, 1968); more recent investigations have also associated b to the geometries of faults initiating earthquakes (Aki, 1981; Huang and Turcotte, 1988; Hirata, 1989 ).
A variation of equation (1) which is also frequently used for describing seismic patterns is the cumulative frequency distribution of earthquake magnitudes:
log N( M) = a - b M (2)
where N(M) denotes the number of earth- quakes with magnitude M and larger; a and b have broadly the same physical interpretation as in equation ( 1 ), although, for the same se- ismic sequence, their respective values in the two equations are usually different. The ad- vantage of using a cumulative frequency distri- bution is that it can considerably smooth fluc- tuations in simple frequency distributions (ProchhzcovA, 1970; Utsu, 1971 ). In so doing, of course, it also tends to obscure any special features of a frequency distribution.
The aim of this paper is to describe varia- tions in the b-value during the 1983-1984 Campi Flegrei seismic sequence and to inves- tigate how such variations (a) may be related to changes in stress, and (b) may be used as precursors to higher-energy seismic events. Since w e are particularly interested in local differences in seismicity, our analysis will con- centrate on the simple frequency distribution described by equation ( 1 ). However, because of energetic and geological constraints, equa- tion ( 1 ) is generally valid only for a portion of the complete magnitude-frequency distribu- tion for a given seismic sequence. In addition, when analyzing the spatial variation among magnitude-frequency distributions, it is im- portant to define the natural seismogenetic
units within which the same system of forces governs earthquake generation (Karnik, 1971 ). If this procedure is not followed, the re- suiting magnitude-frequency relation repre- sents an average distribution function, made up by the superposition of several functions from each seismogenetic unit, thereby inhibiting ex- amination of any spatial variations. Accord- ingly, before examining changes in b-value with time and position, we must first identify dif- ferent seismogenetic units in the area, as well as the range of magnitudes for which equation ( 1 ) is applicable.
Spatial features of the observed seismicity
The 1983-1984 Campi Flegrei seismic cata- log was compiled through an empirical mag- nitude-duration relationship:
M= -2.46+2.82 log(T)
where T is the signal duration in seconds and M is the local magnitude of the event.
More details about the magnitude evalua- tion procedure and the global characteristics of the seismic sequence under study can be found in Osservatorio Vesuviano (1984).
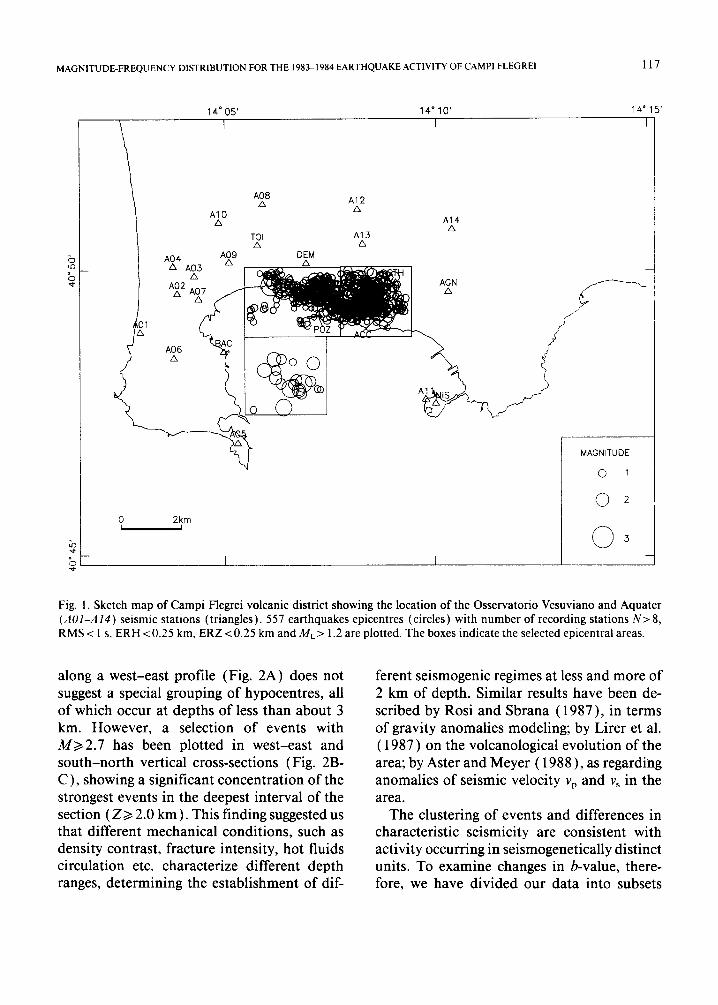
Three main epicentral areas can be recog- nised for the 1983-1984 Campi Flegrei se- ismic activity (Fig. 1 ): to the west (Pozzuoli area) and to the east (Solfatara area) of the coastal town of Pozzuoli, and in the western sector of the Gulf of Pozzuoli (Gulf area). Most of the activity was concentrated in the first two areas. In the Pozzuoli area, activity was characterized by intensive, low-energy, earthquake swarms, while the Solfatara area was the epicentral zone for the most energetic earthquakes of the whole seismic sequence (M>~ 3.0), occurring as isolated shocks. The Gulf area has been seismically active also in the past, showing seismicity of quite high energy. However, the detection threshold of events is higher in this sector, due to the unfavourable network geometry.
The events also appear to show some clus- tering with depth. The vertical cross-section
MAGNITUDE-FREQUENCY DISTRIBUTION FOR THE 1983-1984 EARTHQUAKE ACTIVITY OF CAMPI FLEGREI 1 1 7
~o .,¢
A08 /-, A12
A10 /" Z~ A14
A TOI A13 A /X
A09 DEM A04 /X /X A A03
~, A1 IS .c. f . - , "
14"05' 14" 10' 14" 15'
I I I
0 2km I I
I 1
m
MAGNITUDE
O 1
©
Fig. 1. Sketch map of Campi Flegrei volcanic district showing the location of the Osservatorio Vesuviano and Aquater (AO1-AI4) seismic stations (triangles). 557 earthquakes epicentres (circles) with number of recording stations N> 8, RMS < 1 s, ERH < 0.25 km, ERZ < 0.25 km and ML > 1.2 are plotted. The boxes indicate the selected epicentral areas.
along a west-east profile (Fig. 2A) does not suggest a special grouping of hypocentres, all of which occur at depths of less than about 3 km. However, a selection of events with M>~2.7 has been plotted in west-east and south-nor th vertical cross-sections (Fig. 2B- C), showing a significant concentrat ion of the strongest events in the deepest interval of the section (Z>~ 2.0 km ). This finding suggested us that different mechanical conditions, such as density contrast, fracture intensity, hot fluids circulation etc. characterize different depth ranges, determining the establishment of dif-
ferent seismogenic regimes at less and more of 2 km of depth. Similar results have been de- scribed by Rosi and Sbrana (1987), in terms of gravity anomalies modeling; by Lirer et al. ( 1987 ) on the volcanological evolution of the area; by Aster and Meyer ( 1988 ), as regarding anomalies of seismic velocity vp and Vs in the area.
The clustering of events and differences in characteristic seismicity are consistent with activity occurring in seismogenetically distinct units. To examine changes in b-value, there- fore, we have divided our data into subsets

1 1 8 G. V I L A R D O ET AL.
(o)
W BAC [ ]
-5
0
TOI DEM POZ SOL ACC NIS A GN E [ ] ~ ~ ~ ~
o o % ~ 0 o
1 2 km
W NIS AGN [gE~
BAC [ ]
1
-2
-5
0 1
TOI DEM POZ SOL ACC
© ©
2 km
NI$ BAC POZ SOL DEM TOI • @ [ ] - ~ ~ ~ [ ] - - N
O
( c ) 2
k~
0 ) 2 km
Fig. 2. Hypocentres distributions. (a) Vertical cross-sec- tion along a W - E profile of the same events as Fig. 1. (B) W - E profile of events with ME > 2.7 only. (C) S -N pro- file of the events as in Fig, 2b.
corresponding to the concentrations of events both across the surface and with depth.
Variations of b-value with position
In calculating the magnitude-frequency dis- tributions, the magnitudes were grouped into intervals which were sufficiently large to ac- count for the error (c. 0.3 magnitude unit) due to the method of estimating M. Among stan- dard estimation methods, the error is typically c. 0.3-0.5 magnitude unit. After several pre- liminary tests, we found that an interval of 0.3 magnitude unit yielded the best-constrained shapes for the frequency distributions.
The cumulative and non-cumulative mag- nitude-frequency distributions for the 1983-
1984 events as a whole in Campi Flegrei are shown in Figures 3a-b. In spite of the relative smoothing effect of the cumulative-frequency plot (Fig. 3a), both distributions have broadly similar shapes. In particular, figure 3b shows a main linear trend, following the form of the Gutenberg-Richter relation [equation (1) ], for magnitudes between 1.2 and 2.9; outside these limits, linearity (with slopes different from that of the main trend ) is maintained only for magnitude ranges too small for a simple first-order analysis. The characteristic b-value of the sequence thus refers to the gradient of the main trend; the result of 1.18 _+ 0.03, cal- culated by least-squares linear regression, is reasonable for a volcanic region with a high level of seismic activity and very shallow foci (Utsu, 1971 ). Corrado et a1.(1977) found a value of 2.51 for the exponent mA of the Ishi- moto-Iida's relation applied to 1970 A-type shocks at Campi Flegrei. Since the Gutenberg- Richter coefficient b is connected to m by the relation:
b = m - I
we would obtain a value of 1.51 for the b esti- mate of Campi Flegrei 1970 activity, in rea- sonable agreement with our value from the cu- mulative distribution (b= 1.35 ).
Beyond the main trend, the frequeocy distri- bution at lower magnitudes has an upward concave shape, peaking at about M = 0.4. This type of pattern is sometimes observed in mag- nitude-frequency distributions and is gener- ally attributed to the incompleteness of the data set, very low-magnitude events being under- represented (Utsu, 1971 ). The overall shape of the frequency distribution is further compli- cated by the relatively high number of earth- quakes with magnitude M>~ 3.01 which cause the changes in gradient away from the main trend in Figure 3b. Such an anomalous in- crease in the number of high-energy events ap- pears to be common among seismic sequences at volcanoes undergoing large-scale deforma- tion, including doming, bulging and caldera

MAGNITUDE-FREQUENCY DISTRIBUTION FOR THE 1983-1984 EARTHQUAKE ACTIVITY OF CAMPI FLEGREI 1 19
4 . 0 ¸
Log(N)
(o) 2.r~
•'°o.• °%°
,°
b = 1 . 3 5 ± 0 . 0 5
° ° .
" ° o
, .
°'00,0 1.0 2.0 &O
MAGNITUDE
4 .0
Log (n )
( b ) 2.0
0.0 0.0
• b = 1 . 1 8 - + 0 . 0 3
1.0 2,0 3,0 40
k4AGNITUDE
Log(n)
3.0
(o) 2o
b l = 1 . 1 1 ~ + 0 . 1 2 b~ = . 9 2 ± 0 . 0 7
0.0 . . . . . . . . . , . . . . . . . . . , . . . . . . . . . , . . ; . . . . . . , r , . . 0.0 1.0 2.0 3.0 4~
MAGNITUDE
4.0 qr 1
Log (n ) j b = 1 . 0 2 - + 0 . 0 6
I •
(d) I •
2 0 •
-1 • i.o o Oo. ° . . . . . . . . i.'o' . . . . . . . £ o ' ~.'o i ~ "
MAGNITUDE
4.O
Log(n)
3.0
(e) 2°
• b = 1 . 0 2 + - 0 . 0 3
°°o.o . . . . . . . i.'6 . . . . . . . £ 6 . . . . . . . £o . . . . . . . . ,L'o . . . .
MAGNITUDE
Log (n )
3.o
4 (f)
b l = 0 . 6 1 + 0 . 0 7 b2 = 0 . 6 1 - + 0 . 1 0
o • •
iii!i ....... ....... . ....... : I I : :H MAGNITUDE
Fig. 3. Magnitude-frequency distributions and b-values from the Gutenberg-Richter relationship cumulative (a) with dM=0.1 and non-cumulative (b-f) with/IM=0.3.(a) Nofevents= 15395 (whole sequence). The G.R. relationship has been applied to the linearity interval 0.9 < M< 2.9. (b) N of events = 15395, 1.2 < M~< 2.9. (c) West area, 1931 events, b~ for 1.2~<M~<2.9 and b2 for 1.2~<M~<3.8.(d) East area, 1792 events, 1.2~<M<2.9.(e) Shallow earthquakes (0~<Z~<2.0 km), 4869 events, 1.2~<M~<3.2.(f) Deep earthquakes (Z>~2.0 km), 1122 events, bl for 1.2~<M~<2.9 and b2 for 1.2 ~<M~<4.0.
collapse, as pointed out by Okada (1983) at Usu volcano, Fernandina caldera and St. He- lens volcano•
Moreover, in order to include also higher- magnitude events in evaluating the distribu- tion parameters we have also tried to fit the ex- perimental data through an higher degree curve
(Purcaru, 1975 ), but we gave up this attempt owing to the difficulty in relating the constants of the relation to the physical properties of the focal volumes and to the source parameters.
If the seismic patterns in the two most active areas (Pozzuoli and Solfatara) are considered separately (Figs. 3c-d), we see that, as ex-

120 G. VILARDOET AL.
pected from the restricted distribution of sin- gle, large-energy earthquakes, the high-magni- tude anomaly is more pronounced in the Solfatara area (Fig. 3d). Interestingly, this area is not located over the centre of maximum uplift (Pozzuoli harbour), but is displaced some 3-4 km to the east, approximately where the slope of the uplifted ground was steepest (Berrino et al., 1984; Lirer et al., 1987). In comparison, the magnitude-frequency distri- bution for earthquakes in the Gulf area shows only a poorly constrained trend. This is at least in part due to the unfavourable geometry of the seismic network for this particular area, result- ing in a drop in recording efficiency. Since the distribution obtained for the Gulf events is much less reliable than those for the other areas, it is not worth to be shown, also because we have not used the data for comparative study.
The frequency distribution of a seismic se- quence depends on the size and distribution of the source areas, as well as on the intensity of the applied stress field (Wyss, 1973). The dif- ference in the shapes of Figures 3c and d thus might suggest a local heterogeneity in the Campi Flegrei crust. In the case of the Solfa- tara area, for example, the heterogeneity must be such as to prevent the occurrence of earth- quakes greater than the maximum observed magnitude of 4.0, seismic energy in excess of that needed for such an event being released through an anomalously large number of earthquakes with magnitudes between 3 and 4.
In spite of the differences in higher-energy seismicity between the Pozzuoli and Solfatara areas, however, their characteristic b-values, for the range 1.2 ~<M~< 2.9, are essentially the same (Figs. 3c and d). Stress and structural varia- tions between the two areas are thus only rele- vant outside this magnitude range. Within both areas, on the other hand, the value of b de- creases with depth, from about 1.02 to about 0.61 for depths of, respectively, less than and greater than 2.0 km (Figs. 3e and f) . Similar trends have been observed in other areas such
as European area, New Zealand and Greece (Karnik, 1971; Gibowicz, 1973, 1974; Bath, 1983) and probably reflect a downward de- crease in degree of fracturing and increase in building up stress.
Particularly, finding such marked b-esti- mate differences with 2 km as a discriminant depth can be interesting also because this value probably represents, on the average, an impor- tant structural interface separating materials with different elastic response (Scandone et al., 1991-this volume).
Variations of b-value with time
Because b-values are inversely dependent on stress intensity (Scholz, 1968; Huang and Tur- cotte, 1988 ), they are likely to vary with time in a given area as a result of changes in one or more of the following interdependent parame- ters: the level of seismic activity, the rate of ap- plied stress, and the average focal depth. Much attention has thus been paid to the possibility of using variations in b-value for forecasting major seismic events (Bufe, 1970; Pfluke and Steppe, 1973; Wyss and Lee, 1973; Smith, 1981; Johnston, 1982; Bath, 1983; Huang and Turcotte, 1988 ). However, no generally-appli- cable patterns have yet been established either for describing precursory b-value sequences or for identifying the magnitude of an expected seismic event.
A major limitation to such forecasting stud- ies is the paucity of complete and homogene- ous data sets available. The large number of earthquakes (c. 15,400 events) recorded dur- ing the 1983-1984 Campi Flegrei activity thus provides a good opportunity for examining variations of b-value with time, both for the se- ismic sequence as a whole and for events in each of the main epicentral areas.
Running b-values were calculated applying equation ( 1 ) to events grouped into sets with a fixed number of shocks AN, successive sets having an x% data overlap. Since all the sets contain the same number of data, even with a

MAGNITUDE-FREQU ENCY DISTRIBUTION FOR THE 1983-1984 EARTHQUAKE ACTIVITY OF CAMPI FLEGRE1 121
s5
0
5
2 0
5
0
0 5 t
J u n
t m o n t h s
1 9 8 3 J o n . 1 9 8 4
Fig. 4. Variation of the range of linearity in the magnitude-frequency distributions evaluated for sets of 1000 events shifting along the time axis with 60% data overlap.
2,h
2.0
1 5
1 0
o s
o 0
July
t m o n t h s
1983 dan 1984
Fig. 5. b-value time variation, o--o: AM=0.5, 1.0~<M~< 2.9, sets of 1500 events 60% data overlap . . . . . . : AM=0.3, 1.2 ~< M ~< 2.9, sets of 2000 events 75% data overlap.
variable time-window, the same statistical re- liability applies to each b-value estimate. For consistency with the preceding magnitude-fre- quency distributions (Figs. 3a-f) , the values of b were determined for the magnitude range 1.2 ~< M~< 2.9; independent checks (e.g., Fig. 4) confirmed that the log (n) - M distributions were always linear within this range. Several b- value--time curves were obtained for different values of AN, x, and magnitude step AM. The results showed that, although the absolute val- ues of b depend on the input parameters, the shape of its variation with time remains essen- tially unchanged.
Two examples are given in Figure 5. To a first approximation, both curves are consistent with an approximately annual oscillation in b-value, peak values being attained in the period July- September. This underlying trend is inter- rupted close to its expected minimum by an
abrupt, short-term increase in b observable in February-March 1984.
It is worth noting that the anomalous peak in b-value occurred immediately before the largest seismic swarm, on 1 April 1984, of c. 500 earthquakes in 6 hours. Similar types of change in b have been observed before some tectonic earthquakes in New Zealand (Gibow- icz, 1973 ) and volcanic eruptions of Etna vol- cano (Gresta and Patan6, 1983) and, accord- ing to Huang and Turcotte ( 1988 ), may reflect an initial increase in small-scale fracturing (increase in b), followed by an increase in stress level (decrease in b), before a major event. However, we currently have no inter- pretation why such behaviour should have been pronounced before only one of the major swarms in the Campi Flegrei sequence.
The individual variations of b-value for the Pozzuoli and Solfatara areas are shown in Fig-

122 G. VILARDO ET AL.
(o)
b 2.0
15
lO
05
oo t
Sep. 198~ JGn 1984 months
(b)
b2O
15
10
M
0 0 ~ 1 , 1, ~ . . . . . . . 3 5
?~e~ 97?: .<:m ! 9~4
Fig. 6. (a) West area b-value time variation AM= 0.3, 1.2-S< M~< 2.9, sets of 500 events 80% data overlap. (b) East area b- value time variation AM=0.5, 1.0~< M~< 2.9, sets of 500 events 80% data overlap. In the bottom it is shown the time distribution for the events with M>~ 3.5, which were located in this area.
ures 6a and b. While the two trends are broadly similar, they are not coincident in time. Thus, in the Pozzuoli area (Fig. 6a), the main drops in b-value are observed in October 1983 and February-March 1984, preceding the corre- sponding drops in the Solfatara area (Fig. 6b) in December 1983 and March-April 1984. Ac- cordingly, it would seem that events in the Pozzuoli area trigger events in the Solfatara area. Unfortunately, we cannot maintain this interpretation at this stage of the study.
Rates of change in b-value
The variations of b with time suggest that a correlation may exist with the onset of some of the larger seismic events. To examine this pos- sibility further, we have also considered how the rates of change of b-value (Ab//It) com- pare with the changing rates of seismic energy release (dE~dr), ground uplift rate (Ah/At) and frequency of occurrence of the higher-en- ergy earthquakes (M>~ 3.5 ).
The results are shown in Figure 7. Again, al- though there is no obvious global correlation between any two parameters, there do appear
to be certain partial correspondences which suggest that at least some of the rate processes did not evolve independently from each other.
The Ab/zlt and AE/At curves, for example, show a general resemblance in their overall form. A consistent correlation, however, is not apparent, the two curves moving in and out of phase with time. Hence their relation changes from an initial inverse correlation (from Sep- tember 1983 to January 1984), through a time- shifted positive correlation (February-July 1984), with changes in zlb/At preceding those in/IE/zlt , to an approximately direct correla- tion towards the end of the sequence (August- November 1984). If the differing rates could be correlated, therefore, it might be feasible to use variations in Ab/dt as an indicator of near- future rates of seismic energy release.
With respect to the shapes of the other curves, the rate of ground uplift shows a rela- tively smooth variation with time. Conse- quently, it is more difficult to visually identify any underlying correlation between zlh/zlt and db/dt or dE~At; the variations of the major peaks of the three curves, however, do hint at

M A G N I T U D E - F R E Q U E N C Y D I S T R I B U T I O N FOR THE 1983-1984 E A RT H Q U A K E ACTIVITY O F CAMPI FLEGREI 123
Ab/AT 5E 2
i [ 2
0
1 p 2
5E 2
<: i
. J ' ~ - ~ j . ~ . y ~ - ~ ............ -. ~'~.~. _ ~ . ......... /~.~ !i i
i
2 5E+ 6
I 4 o M
,TT T T! ? i r lOr] thS
Ju ly 198,5 J@n 1 9 8 4
Fig. 7. o - - o = b-gradient versus time. Sets of 1500 events AM=0.5 , 1.0~<M~< 2.9, 60% data o v e r l a p I - - - I = seismic energy gradient versus time. Bimonthly average. The seismic energy has been calculated from the magnitude of the events through the relationship:Log E = 9.9 + 1.9 ML--0.024 ML 2 I - - I = ground uplift rate as measured at Pozzuoli Harbour. Monthly average. ~' = t i m e distribution for the events of the whole sequence with ML >/3.5.
a possible intercorrelation of the type argued for that between Ab/,Jt and AE/At.
Finally, compared with the Ab/At-AE/At association, a poor correlation is observed be- tween Ab/At and the frequency of occurrence of the largest earthquakes (Fig. 7). However, it is worth to point out that our b-values were calculated for earthquakes of magnitude 1.2~<M~<2.9 and so may not necessarily be representative of the physical conditions asso- ciated with the triggering of the biggest events.
Discuss ion and conclusions
In this section we first want to summarize some basic observations which can be drawn from the present study; successively we will provide a possible interpretation for at least some of the major findings.
(a) Most of the 1983-1984 Campi Flegrei seismicity was concentrated in two coastal ep- icentral areas, in the immediate neighbour- hood of Pozzuoli and within the main area of ground uplift. A third zone of seismic activity occurred further away from Pozzuoli in the Gulf area. No events were deeper than 4 km, and their magnitude did not exceed 4.0.
(b) The Pozzuoli area was characterised by low-level activity and major swarms, the last of which occurred on the 1 st April 1984.
(c) The observed seismic events consis- tently follow the Gutenberg-Richter relation for magnitudes between 1.2 and 2.9. This holds for all the areas.
(d) The b-value varies both with time and with location of hypocentre. A pronounced change in b-value occurred during February and March 1984. The variation with location indicates a decrease in b-value with depth.
(e) The gradient of b-value db/At and of the released seismic energy AE/At show similar broad patterns with time, but the two trends do not maintain the same relation with each other during the period of observation. There is no correlation between Ab/At and the fre- quency of major single events.
As regards the difference in seismic activity with position which we observe at Campi Fle- grei, one hypothesis is that it indicates a struc- tural crustal heterogeneity or a stress distribu- tion heterogeneity within a deforming zone.
Particularly, the decrease in b-value with depth suggests a decreasing degree of fractur-

124 G. VILARDO ET AL.
ing and /o r increasing stress drop intensity to- wards deeper levels.
The concentration in different areas of swarm activity and of major single events might also be related to style of fracturing, in that swarms could reflect a greater amount of smaller-scale fracturing, while the larger single events could reflect dislocation confined more to major planes of failure. Furthermore, major swarms appeared to cease after 1 st April 1984. This could indicate alternatively that the focal zone beneath the Pozzuoli area had become too fractured to allow sufficient stresses to build up to generate swarms, or that the imposed stress field have been irreversibly changed.
Finally the curves of Ab/At and AE/At are similar enough, in that they originate from a common source mechanism; however, the first one does not seem to be a precursor to the other in any systematic way. Maybe one process does trigger the other but, due to their different pe- riodicities, the two curves never maintain the same relation one to another for long.
In conclusion, the results shown in this work point out that the Gutenberg-Richter fre- quency-magnitude relationship, fitting the lin- ear range of the experimental distributions, can be used only for evaluating the global features of the whole seismic sequence, as the average level of the stress field and the structure prop- erties of the seismic volume ihvolved. Accord- ingly, the b parameter does not seem suitable for explaining adequately the extremely com- plex physical processes involved in volcanic areas. The frequency-magnitude distributions analyzed in this study testify such a complex- ity of physical phenomena responsible for the 1983-1984 seismic activity of Campi Flegrei. Since in this episode of bradiseism there were no evidences of substantial changes of source location (e.g. magma uprising), we did not find significant t ime variations for the b-value to be interpreted unambiguously; indeed the linear range in the frequency-magnitude distribution could be considered representative of the stea- diest part of the physical process involved.
Acknowledgements
We want to thank sincerely Dr. Roberto Scandone and Dr. Christopher Kilburn for im- proving the manuscript with proper sugges- tions and useful discussions.
Dr. Kilburn also revised the English of this paper.
References
Aki, K., 1965. Maximum likelihood estimate of b in the formula log N = a - b M and its confidence limits. Bull. Earthq. Res. Inst., Tokyo, 43: 237-239.
Aster, R.C. and Meyer R.P., 1988.3-Dimensional veloc- ity structure and hypocenter distribution in the Campi Flegrei Caldera, Italy. Tectonophysics, 149:195-218.
Bath, M., 1983. Earthquake frequency and energy in Greece. Tectonophysics, 95: 233-252.
Berrino, G., Corrado, G., Luongo, G. and Toro, B., 1984. Ground deformation and gravity changes accompa- nying the 1982 Pozzuoli uplift. Bull. Volcanol., 47: 187-200.
Bufe, C.G., 1970. Frequency-magnitude variations dur- ing the 1970 Danville earthquake swarm. Earthquake Notes, 41: 3-7.
Corrado, G., Guerra, I., Lo Bascio, A., Luongo. G. and Rampoldi, R., 1976/77. Inflation and microearth- quake activity of Phlegraean Fields, Italy. Bull Vol- canol., 40(3): 169-188.
Gibowicz, S.J., 1973. Variation of the frequency-magni- tude relation during earthquake sequences in New Zealand. Bull. Seismol. Soc. Am., 63:517-528.
Gibowicz, S.J., 1974. Frequency-magnitude, depth, and time relations for earthquakes in a island arc: North Island, New Zealand. Tectonophysics, 23: 283-297.
Gresta, A. and Patanr, G., 1983. Variation ofb values be- fore the Etnean eruption of March 1981. Pure Appl. Geophys., 121: 287-295.
Gutenberg, B. and Richter, C.F., 1944. Frequency of earthquakes in California. Bull. Seismol. Soc. Am., 34: 185-188.
Hirata, T., 1989. A correlation between the b value and the fractal dimensions of earthquakes. J. Geophys. Res., 94(B6): 7507-7514.
Huang, J. and Turcotte, D.L., 1988. Fractal distributions of stress and strength and variations of b-value. Earth Planet. Sci. Lett., 91: 223-230.
Johnston, A.C., 1982. On the use of the frequency-mag- nitude relation in earthquake risk assessment. In: Earthquake and Earthquake Engineering. Ann Arbor Science, USA Bearers J.E. 1.
Karnik, V., 1971. Some characteristics of seismic activity. In: V. Karnik (Editor), Seismicity of the European

MAGNITUDE-FREQUENCY DISTRIBUTION FOR THE 1983-1984 EARTHQUAKE ACTIVITY OF CAMPI FLEGREI 125
area/2. Reidel Publishing Company, Dordrecht, pp. 123-171.
Liter, L., Luongo G. and Scandone, R., 1987. On the vol- canological evolution of Campi Flegrei. EOS, 68 ( 16 ).
Mogi, K., 1967. Earthquakes and fractures. Bull. Earth- quake Res. Inst., Tokyo Univ., 44: 5-25.
Okada, Hm., 1983. Comparative study of earthquake swarms associated with major volcanic activities. In: Arc Volcanism, Physics and Tectonics. Terra Scien- tific Publishing Company, Tokyo.
Osservatorio Vesuviano, 1984. Bradisimo Flegreo Rapporto sorvegliansa, Gennaio 1982-Gennaio 1984, Internal Report.
Pfluke, J.H. and Steppe, J.A., 1973. Magnitude-frequency statistics of small earthquakes from S. Francisco Bay to Parkfield. Standford Univ. Publ., Geol. Sci., 13:13- 23.
Proch~zkova, D., 1970. Analysis of methods of calculat- ing the magnitude-frequency relation. Geofys. Sb., XVIII, 325: 229-256.
Purcaru, G., 1975. A new magnitude-frequency relation for earthquakes and a classification of relation types. Geophys. J. R. Astron. Soc., 42:61-79.
Rosi, M. and Sbrana, A., 1987. Phlegraean Fields. C.N.R. Quad. Ric. Sci. 114, vol.9.
Scandone, R., Belluci, F., Lirer, L. and Rolandi, G., 1991. The structure of the Campanian Plain and the activity of the Neapolitan volcanoes. In: G. Luongo and R. Scandone (Edfitors), Campi Flegrei. J. Volcanol. Geotherm. Res., 48:1-31.
Scholz, C., 1968. The frequency-magnitude relation of microfracturing in rock and its relation to earth- quakes. Bull. Seismol. Soc. Am., 58:399-415.
Shlien, S. and Toksoz, M.N., 1970. Frequency-magnitude statistics of earthquake occurrences. Earthquake Notes, 41: 5-18.
Smith, W.D., 1981. The b-value as an earthquake precur- sor. Nature, 289: 136-139.
Utsu, T., 1971. Aftershocks and earthquake statistics, III. J. Fac. Sci. Hokkaido Univ. Ser. VII, Geophysics, 3 (5): 379-441.
Wyss, M., 1973. Towards a physical understanding of the earthquake frequency distribution. Geophys. J. R. As- tron. Soc., 31: 341-359.
Wyss, M. and Lee, W.H.K., 1973. Time variations of the average earthquake magnitude in Central California. Standford Univ, Publ., Geol. Sci., 13: 24-42.