Seismic images and rock properties of the very shallow structure of Campi Flegrei caldera (southern...
10
RESEARCH ARTICLE Seismic images and rock properties of the very shallow structure of Campi Flegrei caldera (southern Italy) Dario Dello Iacono & Aldo Zollo & Maurizio Vassallo & Tiziana Vanorio & Sebastien Judenherc Received: 25 January 2007 / Accepted: 9 May 2008 / Published online: 7 June 2008 # Springer-Verlag 2008 Abstract In September 2001, an extensive active-seismic investigation (Serapis experiment) was carried out in the Gulfs of Naples and Pozzuoli, with the aim of investigating and reconstructing the shallow crustal structure of the Campi Flegrei caldera, and possibly identifying its feeding system at depth. The present study provides a joint analysis of the very shallow seismic reflection data and tomographic images based on the Serapis dataset. This is achieved by reflection seismic sections obtained by the 3D data gathering and through refined P-velocity images of the shallowest layer of Pozzuoli Gulf (z <1,000 m). From the refined Vp model, the overall picture of the velocity distribution confirms the presence of a complex arc-shaped anomaly that borders the bay offshore. The deeper part of the anomaly (beneath 700 m, with Vp>3,500 m/s) correlates with units made up of agglomerate tuffs and interbedded lava, which form the southern edge of the caldera, which was probably formed following the two large ignimbritic eruptions that marked the evolutionary history of the area under study. The upper part of the anomaly that tends to split into two parallel arcs is correlated with dikes, volcanic mounds and hydrothermal alteration zones noted in previous shallow reflection seismic analyses. The depth of the transition between the upper and lower parts of the anomaly is characterized by an abrupt Vp increase on the one-dimensional (1D) profiles extracted from the 3D tomographic model and by the presence of a strong reflector located at about 0.6/0.7 s Two Way Time (TWT) on Common Mid Point gathers. The move-out velocity analysis and stack of the P–P and P–S reflections at the layer bottom allowed to estimate relatively high Vp/Vs values (3.7±0.9). This hypothesis has been tested by a theoretical rock physical modeling of the Vp/Vs ratio as a function of porosity suggesting that the shallow layer is likely formed by incoherent, water saturated, volcanic and marine sediments that filled Pozzuoli Bay during the post-caldera activity. Keywords Campi Flegrei caldera . Shallow structure . Seismic reflection Introduction The volcanic field of Campi Flegrei is located in the central area of the Campanian plain, to the northwest of the Somma–Vesuvius complex. It covers a total area of around 200 km 2 , which includes both on-land portions and the underwater vents in the area of Pozzuoli Gulf. The Campanian plain is part of the eastern margin of the Tyrrhenian Sea, between 40° and 41° N, and it constitutes a large semi-graben from the superior Pliocene (5.3 My) that underwent pronounced subsidence during the Quaternary (more than 1,000 m/My, on average). The general structure of this semi-graben is easily recognizable at the edges of the plain, where the NE–SW- and SE–NW-oriented faults, that determined the gradual sinking of the carbonate rocks underneath thick layers of alluvial and pyroclastic Quaternary Bull Volcanol (2009) 71:275–284 DOI 10.1007/s00445-008-0222-1 Editorial responsibility: M. Ripepe. D. Dello Iacono : A. Zollo (*) : M. Vassallo : S. Judenherc Dipartimento di Scienze Fisiche, Università di Napoli Federico II, Napoli, Italy e-mail: [email protected] T. Vanorio Stanford Rock Physics Laboratory, Stanford University, Stanford, CA, USA S. Judenherc Agecodagis, sarl, Rieux Volvestre, France
Transcript of Seismic images and rock properties of the very shallow structure of Campi Flegrei caldera (southern...
RESEARCH ARTICLE
Seismic images and rock properties of the very shallowstructure of Campi Flegrei caldera (southern Italy)
Dario Dello Iacono & Aldo Zollo & Maurizio Vassallo &
Tiziana Vanorio & Sebastien Judenherc
Received: 25 January 2007 /Accepted: 9 May 2008 / Published online: 7 June 2008# Springer-Verlag 2008
Abstract In September 2001, an extensive active-seismicinvestigation (Serapis experiment) was carried out in theGulfs of Naples and Pozzuoli, with the aim of investigatingand reconstructing the shallow crustal structure of theCampi Flegrei caldera, and possibly identifying its feedingsystem at depth. The present study provides a joint analysisof the very shallow seismic reflection data and tomographicimages based on the Serapis dataset. This is achieved byreflection seismic sections obtained by the 3D datagathering and through refined P-velocity images of theshallowest layer of Pozzuoli Gulf (z<1,000 m). From therefined Vp model, the overall picture of the velocitydistribution confirms the presence of a complex arc-shapedanomaly that borders the bay offshore. The deeper part ofthe anomaly (beneath 700 m, with Vp>3,500 m/s)correlates with units made up of agglomerate tuffs andinterbedded lava, which form the southern edge of thecaldera, which was probably formed following the twolarge ignimbritic eruptions that marked the evolutionaryhistory of the area under study. The upper part of theanomaly that tends to split into two parallel arcs iscorrelated with dikes, volcanic mounds and hydrothermalalteration zones noted in previous shallow reflection
seismic analyses. The depth of the transition between theupper and lower parts of the anomaly is characterized by anabrupt Vp increase on the one-dimensional (1D) profilesextracted from the 3D tomographic model and by thepresence of a strong reflector located at about 0.6/0.7 s TwoWay Time (TWT) on Common Mid Point gathers. Themove-out velocity analysis and stack of the P–P and P–Sreflections at the layer bottom allowed to estimate relativelyhigh Vp/Vs values (3.7±0.9). This hypothesis has beentested by a theoretical rock physical modeling of the Vp/Vsratio as a function of porosity suggesting that the shallowlayer is likely formed by incoherent, water saturated,volcanic and marine sediments that filled Pozzuoli Bayduring the post-caldera activity.
Keywords Campi Flegrei caldera . Shallow structure .
Seismic reflection
Introduction
The volcanic field of Campi Flegrei is located in the centralarea of the Campanian plain, to the northwest of theSomma–Vesuvius complex. It covers a total area of around200 km2, which includes both on-land portions and theunderwater vents in the area of Pozzuoli Gulf.
The Campanian plain is part of the eastern margin of theTyrrhenian Sea, between 40° and 41° N, and it constitutes alarge semi-graben from the superior Pliocene (5.3 My) thatunderwent pronounced subsidence during the Quaternary(more than 1,000 m/My, on average). The general structure ofthis semi-graben is easily recognizable at the edges of theplain, where the NE–SW- and SE–NW-oriented faults, thatdetermined the gradual sinking of the carbonate rocksunderneath thick layers of alluvial and pyroclastic Quaternary
Bull Volcanol (2009) 71:275–284DOI 10.1007/s00445-008-0222-1
Editorial responsibility: M. Ripepe.
D. Dello Iacono :A. Zollo (*) :M. Vassallo : S. JudenhercDipartimento di Scienze Fisiche, Università di Napoli Federico II,Napoli, Italye-mail: [email protected]
T. VanorioStanford Rock Physics Laboratory, Stanford University,Stanford, CA, USA
S. JudenhercAgecodagis, sarl,Rieux Volvestre, France

deposits, can be seen (Ippolito et al. 1973; D’Argenio et al.1973; Finetti and Morelli 1974; Bartole et al. 1984; Miliaand Torrente 2003).
The volcanic activity of Campi Flegrei has beencharacterized by two main ignimbritic eruptions: that ofthe “Campanian Ignimbrite” (IC; 39 ka [De Vivo et al.2001]) and that of the “Neapolitan Yellow Tuff” (TGN;15 ka [Deino et al. 2004]). It is estimated that the first ofthese produced emissions of ca. 150/200 km3 of material,while the second produced emissions of ca. 40/50 km3
(Orsi et al. 1996, and references therein).Although various aspects remain controversial, many
studies have implicated one or both of these events as causalin the formation of the caldera (Rosi et al. 1983; Rosi andSbrana 1987; Lirer et al. 1987; Barberi et al. 1991; Orsi andScarpati 1989; Scarpati et al. 1993; Orsi et al. 1991, 1992,1996; Wohletz et al. 1995), a wide sunken structure thatforms part of Pozzuoli Gulf and the land area of CampiFlegrei (Agip 1987; Orsi et al. 1996; Zollo et al. 2003;Judenherc and Zollo 2004). After the formation of thecaldera, the post-TGN volcanic activity was characterized byminor eruptions that formed the monogenic structures thathave a circular distribution along the edge of the caldera, andthe products of which have covered the collapsed structure.
The area is inhabited by around 400,000 people, whoundergo an elevated risk from the still active magmaticsystem, which is well illustrated by the historic eruption ofMonte Nuovo in 1538, by the recent ground upwellingepisodes (1969–1972 and 1982–1984), by the fumaroleactivity, and by hot springs.
The definition of the structures that characterize the area andthe knowledge of their relationships to the volcanic activityrepresent key elements for an understanding of the system andan evaluation of the associated volcanic hazard. For thisreason, and in a first attempt to exploit the volcanic area as ageothermal source, the caldera structure has been investigatedthrough gravimetric, magnetic, and local earthquake tomogra-phy investigations, as well as with drilled-rock sampling downto 3,000 m in depth (Rosi and Sbrana 1987; Agip 1987; Asterand Meyer 1988; Cassano and La Torre 1987; Florio et al.1999; Capuano and Achauer 2003; Vanorio et al. 2005).
In September 2001, an extensive active seismic survey(Serapis Experiment) has been carried out in the Gulfs ofNaples and Pozzuoli to reconstruct the structure of theCampi Flegrei caldera, to identify the presence and the formof potential superficial magma reservoirs, and to define thegeometric relationships between the volcanic structures andthe carbonate bedrock. These investigations have resultedin the identification of new, deep, structural features (Zolloet al. 2003; Judenherc and Zollo 2004):
– The identification in the Pozzuoli Gulf of a ring-likepositive Vp anomaly, revealed between 750 and
2,000 m in depth (correlated with positive gravimetricanomalies [Capuano and Achauer 2003]);
– The identification of the off-shore extension of theTorre del Greco fault (a fault well described in theliterature, and with a probable continuation towardsthe NE under the Somma–Vesuvius complex [Bruno etal. 1998]);
– The identification of a second fault of around 35 km inlength that is parallel to the first to the west, and thatstarts from the southern coast of the Posillipo Hills andextends towards the SW, passing between the island ofIschia and Banco di Fuori (Zollo and Judenherc 2005).
All in all, the study has revealed the presence of thecarbonate bedrock (average Vp velocity of 6,000 m/s) thatis characterized by an irregular shape with a step-likestructure that descends towards the NW, upon which theCampi Flegrei volcanic district, and more to the south thatof the Somma–Vesuvius complex, have developed. Thetomographic images have also allowed the identificationand reconstruction of the geometry of the undersea part ofthe caldera.
The present study provide a detailed insight into the firstkilometre of depth of the Pozzuoli Gulf, by determining thegeometry and seismic properties of the volcano-clastic layerfilling the shallowest part of the caldera.
The tomography data here presented are in support of thenew analysis of seismic reflection and Vp/Vs relationships,but, in addition, they have contributed to the betterdefinition of the 3D P-velocity model of the very shallowcaldera structure, thus allowing for the correlation with thesuperficial volcanic structure of the bay noted by previousinvestigations.
Seismic reflection data analysis and modelling
Data and methods
The dataset used for this study includes about 45,000traces, and was extracted from the complete datasetcollected for the Serapis project. The latter itself comprisesmore than 92,000 traces recorded with 70 OBS (sea-bottomreceivers with 4.5 Hz 3-component sensors) and with 84receivers on land (66 with 3-component sensors).
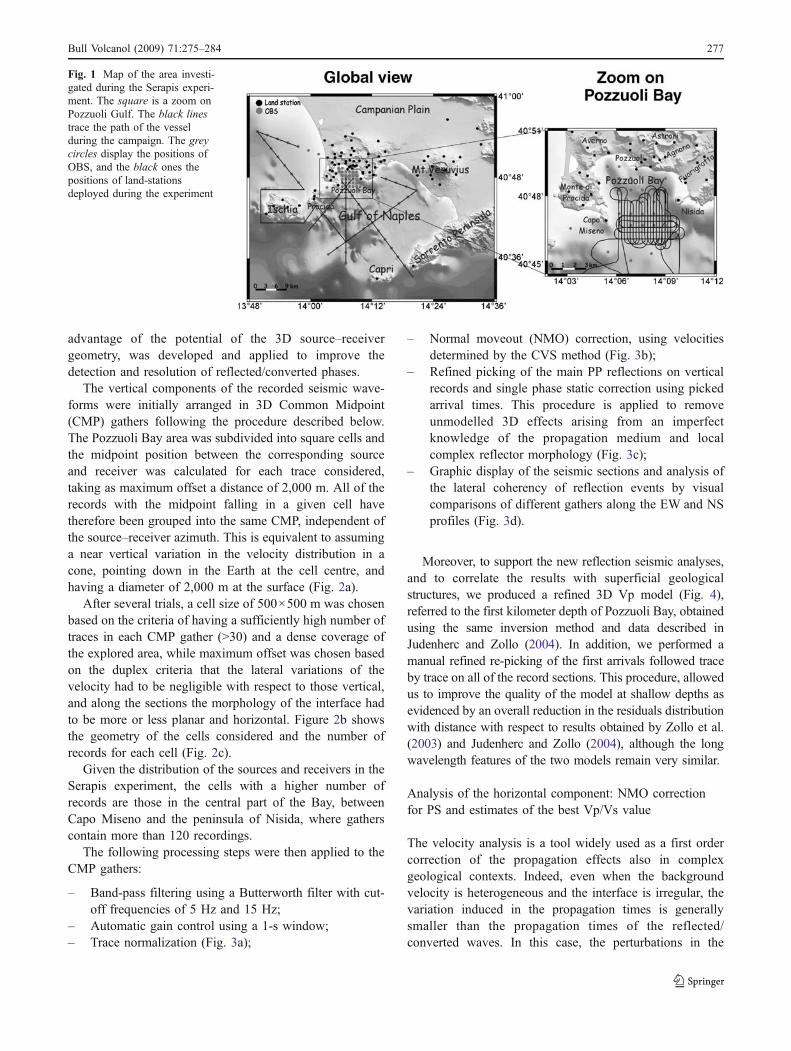
Shots were performed every 125 m on a grid with linesoriented N–S and E–W in Pozzuoli Bay (Fig. 1) (see alsoJudenherc and Zollo 2004, for more details).
To investigate the seismic properties of the very shallowlayer filling the bay area, an analysis of P-to-P (PP) and P-to-S (PS) reflection arrivals was performed on the Serapiswaveform dataset. Based on the acquisition layout of theexperiment, a specific trace gathering scheme, that took
276 Bull Volcanol (2009) 71:275–284
advantage of the potential of the 3D source–receivergeometry, was developed and applied to improve thedetection and resolution of reflected/converted phases.
The vertical components of the recorded seismic wave-forms were initially arranged in 3D Common Midpoint(CMP) gathers following the procedure described below.The Pozzuoli Bay area was subdivided into square cells andthe midpoint position between the corresponding sourceand receiver was calculated for each trace considered,taking as maximum offset a distance of 2,000 m. All of therecords with the midpoint falling in a given cell havetherefore been grouped into the same CMP, independent ofthe source–receiver azimuth. This is equivalent to assuminga near vertical variation in the velocity distribution in acone, pointing down in the Earth at the cell centre, andhaving a diameter of 2,000 m at the surface (Fig. 2a).
After several trials, a cell size of 500×500 m was chosenbased on the criteria of having a sufficiently high number oftraces in each CMP gather (>30) and a dense coverage ofthe explored area, while maximum offset was chosen basedon the duplex criteria that the lateral variations of thevelocity had to be negligible with respect to those vertical,and along the sections the morphology of the interface hadto be more or less planar and horizontal. Figure 2b showsthe geometry of the cells considered and the number ofrecords for each cell (Fig. 2c).
Given the distribution of the sources and receivers in theSerapis experiment, the cells with a higher number ofrecords are those in the central part of the Bay, betweenCapo Miseno and the peninsula of Nisida, where gatherscontain more than 120 recordings.
The following processing steps were then applied to theCMP gathers:
– Band-pass filtering using a Butterworth filter with cut-off frequencies of 5 Hz and 15 Hz;
– Automatic gain control using a 1-s window;– Trace normalization (Fig. 3a);
– Normal moveout (NMO) correction, using velocitiesdetermined by the CVS method (Fig. 3b);
– Refined picking of the main PP reflections on verticalrecords and single phase static correction using pickedarrival times. This procedure is applied to removeunmodelled 3D effects arising from an imperfectknowledge of the propagation medium and localcomplex reflector morphology (Fig. 3c);
– Graphic display of the seismic sections and analysis ofthe lateral coherency of reflection events by visualcomparisons of different gathers along the EW and NSprofiles (Fig. 3d).
Moreover, to support the new reflection seismic analyses,and to correlate the results with superficial geologicalstructures, we produced a refined 3D Vp model (Fig. 4),referred to the first kilometer depth of Pozzuoli Bay, obtainedusing the same inversion method and data described inJudenherc and Zollo (2004). In addition, we performed amanual refined re-picking of the first arrivals followed traceby trace on all of the record sections. This procedure, allowedus to improve the quality of the model at shallow depths asevidenced by an overall reduction in the residuals distributionwith distance with respect to results obtained by Zollo et al.(2003) and Judenherc and Zollo (2004), although the longwavelength features of the two models remain very similar.
Analysis of the horizontal component: NMO correctionfor PS and estimates of the best Vp/Vs value
The velocity analysis is a tool widely used as a first ordercorrection of the propagation effects also in complexgeological contexts. Indeed, even when the backgroundvelocity is heterogeneous and the interface is irregular, thevariation induced in the propagation times is generallysmaller than the propagation times of the reflected/converted waves. In this case, the perturbations in the
Fig. 1 Map of the area investi-gated during the Serapis experi-ment. The square is a zoom onPozzuoli Gulf. The black linestrace the path of the vesselduring the campaign. The greycircles display the positions ofOBS, and the black ones thepositions of land-stationsdeployed during the experiment
Bull Volcanol (2009) 71:275–284 277

arrival times do not prejudice the determination of thealignment of the phases in the NMO sections.
A posteriori, the data can demonstrate the validity of thecorrection carried out. Indeed, in the case of extremeheterogeneity of the velocity and/or a highly irregularreflecting surface, we would expect that the corrected NMOsections are dominated by diffractions, rather than byaligned phases; but when it is possible to recognize acoherent alignment of the phase on many adjacent sectionswe can assert that the reflector is nearly horizontal and themedium above it can be represented, as a first approxima-tion, by an uniform wave velocity model.
Taking in mind these assumptions we performed avelocity analysis both on vertical and radial component.
The two-way times of the PP reflected arrival have beenpicked from the vertical component sections and correctedfor a moveout velocity of 1,600 m/s. We have chosenCMPs 1031, 1073, 1111, 703, 705, 745, 827,868, 907, 908,949, 950 which show relatively high signal-to-noise ratiosfor the PP phase and a good lateral coherency. A total of1,108 readings of the PP arrival times were performed foran average value of 0.64 s two-way traveltime with astandard deviation of 0.06 s.
Assuming the average two-way time of the PP phase asthe zero-offset time for the identified reflector, and using theaverage P-velocity profile as inferred from seismic tomog-raphy in the Pozzuoli Bay area, one can obtain an interfacedepth of 600 m±120 m. The depth uncertainty is increasedby propagating the errors on time picks (0.06 s) and on P-velocity (200 m/s) through the formula h=(T0Vp) / 2.
The Vp/Vs ratio was estimated for each CMP by amoveoutanalysis of the PS phases on the radial component, i.e. thehorizontal component oriented in the source-to-receiverdirection (Jurkevics 1988). Given the average interface depthand layer P-velocity, the theoretical travel time of a PS phasecan be calculated for a given value of the Vp/Vs ratio. Thena narrow window (0.3 s) is selected on the radial componentCMP section, beginning at the estimated arrival time of thePS phase. For each Vp/Vs value limited in a defined range(1.5, 5.5), we evaluated the following stack function:
STACKPS Vp=Vs
� � ¼XTPS
1
t¼TPSTheo
XNsis
i¼1
Ai tð Þ !2
where TPSTheo is the theoretical PS travel time for a given Vp/
Vs value, and TPS1 ¼ TPS
Theo þ 0:3 s; Ai(t) is the amplitude at
Fig. 2 a Geometry used to organize traces in 3D CMP gathers. ThePozzuoli Bay area was subdivided into square cells (500×500 m) andthe midpoint position between the corresponding source and receiverwas calculated for each trace considered, taking as maximum offset adistance of 2,000 m. All of the records with the midpoint falling in a
given cell have therefore been grouped into the same CMP,independent of the source–receiver azimuth. b Map with position ofbin (the point shows the centre of the cell). The CMPs within thesquare were used for calculation of STACKPS function. c Densitymap showing the number of traces in each cell
278 Bull Volcanol (2009) 71:275–284

time t for the ith seismogram, and Nsis is the number ofseismograms contained in a given CMP section.
The function STACKPS vs Vp/Vs has been computedfor the CMPs indicated in Fig. 2b using a step of 0.01 in theVp/Vs quantity. We selected 27 CMP sections for which arelatively high number of traces was available (>60) and
which had a good offset coverage (at least 750 m to1,950 m). Several examples of STACKPS functions aregiven in Fig. 5a, where the functions have been normalizedto their maximum values. For the selected CMPs, the shapeof the STACKPS function, centered at Vp/Vs valuesranging between 3.0 and 4.0, generally showed a single,
Fig. 3 a Example of CMP gather section (745) after filtering, AGCand normalization. Note the reflection hyperbola with apex at about0.6/0.7 s TWT emphasized by black/white line. b NMO correction ofthe previous section, with Vnmo=1,600 m/s. Note aligned reflectionphase at about 0.6/0.7 s TWT indicated by the arrow and grey line. c
Static phase correction at 0.7 s TWT. d Example of presence andcoherency of superficial reflected phase at 0.6/0.7 s on adjacent CMPgsections (vertical component) highlighted by the arrow. In the belowmap, the position of CMPg is shown. The CMPs within the squarewere used for calculation of PP picking
Bull Volcanol (2009) 71:275–284 279

broad peak, whose amplitude is related to the inhomoge-neity of the superficial layer above the interface, to themorphology of the reflector, and to the noise of the data thatprevents a perfect alignment of the P–S reflected seismicphase after the NMO correction.
An estimate of the Vp/Vs ratio at each CMP is obtainedby the value corresponding to the maximum of theSTACKPS function. Figure 5b shows an example of the
PS moveout corrected radial section at CMP 908 using thevalues of Vp/Vs which maximize the relative STACKPSfunction. This example shows good agreement between thealigned PS phase and the theoretical travel-time estimate.
To obtain the average value of Vp/Vs and relateduncertainty by using the estimated values, we performed astatistical analysis of the variable A ¼ log Vp
Vs
� �. We used
log quantities because the log-normal probability density isadequate to represent probability distributions for quantitiesexpressed by the ratio of random variables, as Vp/Vs thatby definition are constrained to be positive (Tarantola2005).
We defined the uncertainty δAi on each estimate Ai, asthe half-width of the function STACKPS(A) at a level equalto half of the maximum amplitude. The weighted average Aof Ai values is calculated by using the weighting factors wi
defined as wi ¼ 1.
dAið Þ2. The standard error associated tothe quantity A is computed through the formula:
sA ¼
ffiffiffiffiffiffiffiffiffiffiffiffiffiffiffiffiffiffiffiffiffiffiffiffiffiffiffiffiffiffiffiffiffiffiffiffiffiffiffiffiffiffiffiffiffiffiffiffiffiffiffiffiffiffiffiffiPiwi Ai � A� �2Piwi
þXi
dAið Þ2N
vuuuut
which accounts for the statistical error depending on thespatial variability of Vp/Vs ratio and for the measurementerror which instead depends on the shape of the functionSTACKPS related to the signal-to-noise level on waveformsand misalignments on NMO corrected sections. The values ofA and σA computed by using the procedure above, providedan estimate of the Vp/Vs ratio of Vp / Vs=3.7±0.9.
Discussion
The joint analysis of seismic reflection sections andtomographic images has provided new information aboutthe shallow structure of the Campi Flegrei caldera incorrespondence with its southern border and inner region.
In the following we discuss on data evidences andinterpret our results by using previous outcomes obtained
F i g . 5 a E x am p l e s o fSTACKPS functions normal-ized to their maximum values.The function generally shows asingle, broad peak centered atVp/Vs values ranging between3.0 and 4.0. b Example of thePS moveout corrected radialsection at CMP 908 using thevalue of Vp/Vs which max-imizes the relative STACKPSfunction
Fig. 4 Plane views of the velocity model. Light grey indicate lowvelocities, and dark grey indicate high velocities. For each layer, thetop and bottom depths of the layer are indicated. Land topography isindicated with a solid line. Peripheral light grey indicates not resolvedarea for insufficient or absent ray coverage. Note double-arc shape P-velocity anomaly in the section 0.5–0.75 km, stretching betweenNisida and Capo Miseno
280 Bull Volcanol (2009) 71:275–284

from gravimetric, seismic activity, and drilled-rock samplinganalyses, conducted in Pozzuoli Gulf and on land, on the basisthat the velocity distribution and impedance contrasts can beassociated with the elastic characteristics, and thus ultimatelyto the lithology of the medium under investigation.
The most important result has been the identification andcharacterization of the volcano-clastic layer filling theshallowest part of the caldera. The tomographic analysis,performed in support of the new investigations of seismicreflection and of Vp/Vs relationships, was able also tobetter define the complex vertical development of the arc-shaped high P-velocity anomaly, stretching from Nisida toCapo Miseno (Judenherc and Zollo 2004), allowing for thecorrelation with the superficial volcanic structure of the bay.
Very high resolution seismic tomography and shallowvolcanic structures
Tomographic images reveal a correlation between P-velocityanomaly at 0.5–0.75 km in depth (Fig. 4) that tends to splitinto two parallel arcs, and the position of dikes, volcanicstructures and the off-shore fumaroles detected in the Gulfof Pozzuoli (Fig. 6) (De Bonitatibus et al. 1970; Pescatore
et al. 1984; Milia 1998; Milia and Torrente 2003). Thepresence of these structures suggests the existence of ahighly fractured area, through which the magma and gasesmay have been able to rise towards the surface.
In a similar way, the post-TGN eruptive activity on landhas been concentrated along the northern edge of thecaldera. Analogous models simulating caldera collapses(Acocella et al. 2000, 2004) have shown how the formationof caldera structures is accompanied by the development offaults in concentric rings, normal and inverse, with largeangles, and that these fractured areas can representpreferential routes for the rise of magma towards thesurface.
The analysis of the 1D velocity profiles extracted fromthe 3D tomographic model shows a steep change in the Pwave velocity at about 600 m in depth (Fig. 7). Above thatdepth, Vp values range from 1,500 to 2,000 m/s andindicate the presence of a thick, low velocity sedimentformation filling the shallower part of the caldera. Incontrast, from 600 m down to 900 m in depth, the P wavevelocity increases sharply from 2,000 to 2,600 m/s. Thisvelocity discontinuity is also confirmed by seismic reflec-tion data.
Evidence for a thick, low Vp, high Vp/Vs, water saturatedlayer
The analysis of the vertical component CMP gatherslocated on the southern border of the Bay of Pozzuoli has
Fig. 6 Correlation between the position of the double-arc Vp anomalyand the positions of fumaroles, dikes, the TGN mound and NisidaBank in the Bay of Pozzuoli (structures identified in De Bonitatibus etal. 1970; Pescatore et al. 1984; Milia 1998; Milia and Torrente 2003).White lines display the bathymetry of the bottom of the bay. Forvolcanic structure, we used the same symbols and the same acronymslike in Milia and Torrente (2003)
Fig. 7 One-dimensional Vp profiles extracted from NS verticaltomographic sections. Note the abrupt increase in Vp between 600and 900 m in depth. The map shows position of profiles
Bull Volcanol (2009) 71:275–284 281

shown the presence of a strong amplitude reflection event at0.6–0.7 s TWT, which aligns for a NMO correction of 1,600–1,800 m/s, and corresponds to an approximate reflectordepth of 600–800 m. By close inspection of the CMPgathers, we discovered that this seismic discontinuity isrevealed with continuity and lateral coherency in the wholeexternal area of Pozzuoli Bay (Fig. 3d).
The joint modeling of PP and PS reflections on verticaland radial component CMP gathers allowed the constrain-ing of the average Vp-to-Vs ratio in the shallow sediment to3.7±0.9. This value is much higher with respect to thosefound in the literature (Aster and Meyer 1988; Vanorio etal. 2005; Chiarabba and Moretti 2006; Battaglia et al.2008), where previous tomography studies have providedratios around 2 for the first kilometer in depth.
The value obtained, together with the estimated P-wavevelocities, provide shear-wave velocities of 450–515 m/sThe robustness of this result is confirmed by the clearalignment of the PS arrivals at the theoretical arrival timeson moveout radial sections obtained by using Vp=1,600–1,800 m/s and Vp/Vs values that maximize the stackfunction defined in the previous paragraph (Fig. 5b).
It is worth noting that the high Vp/Vs ratio represents anaverage estimate of the whole shallow layer, and thus sucha value could be strongly influenced by the saturationconditions of the rocks in the first hundreds of meters.
Concerning the origin of the strong velocity contrastgenerating the high amplitude reflection event at about 0.6–0.7 s TWT, we note that the stratigraphic profiles of in-landboreholes in the Mofete area, located on the northern borderof the caldera, show the evidence of a thick trachitic andlatitic lava layer at about 750 m under tuff and tuffites post-caldera. The velocity contrast, as indicated by laboratorymeasures of density and Vp on rock samples taken from thewells (Vanorio 2003), can generate a reflective wave ofgreat amplitude.
Although it remains speculation, in terms of the knowndifficulties in volcanic areas for correlations over largedistances, the location of the CMP gathers analysed is inthe southern sector of the caldera rim. So it appearedreasonable to hypothesize a lithological succession similarto that of the North-West sector, with the difference in thesedimentation environment that would have characterisedthe deposition of the products lying on the lava layer.
While the activity gradually became sub-aerial in thenorthern part of the caldera, in the southern sector, thepresent gulf of Pozzuoli, the conditions of marine sedimen-tation can have persisted since the caldera collapse exceptfor the Würmian phase (about 18 kyr bp), when the sealevel reached −120 m and all the area had emerged(Pescatore et al. 1984). The thick, low Vp, shallow layerunder study, formed by volcanic and marine sediments thatfilled up the bay during the post-caldera phases of activity
of Campi Flegrei, could therefore include incoherentpyroclastic rocks and chaotic tuffs, highly water saturatedbecause of marine sedimentation.
Theoretical rock physical modeling of the Vp/Vs ratio vsporosity
A layer with such physical characteristics could haveimportant repercussions on the modelling and generalunderstanding of the processes that form the basis of theslow up/down-welling episodes in the caldera.
In order to test our hypothesis, we modeled the variationof the Vp/Vs ratio as a function of porosity in unconsol-idated sediments, withstanding pressure conditions appro-priate to describe the layer lying above 600 m. The elasticproperties of rocks are known to be controlled by theproperties of the solid frame, such as composition and graincontact stiffness, and pore fluid and porosity. High Vp/Vsratios have been shown to characterize shallow water-flowsediments in water depths between 400 m and 2,000 mbelow the seabed (Huffman and Castagna 2001).
At such depths of burial, these materials are poorlyconsolidated (i.e. low grain contact stiffness) and undergolow effective stresses. That makes them exist near atransition between rocks and sediments characterized by a
Fig. 8 a Variation in the Vp/Vs ratio as a function of porosity inunconsolidated, water-saturated sediments. The critical porosity is0.38 and the number of contacts per grain is 8.5. b Vp/Vs ratio datafor water-saturated glass-bead samples plotted against the effectivepressure. Data are in grey scale as a function of porosity (fromZimmer 2003)
282 Bull Volcanol (2009) 71:275–284

critical porosity Φc (Nur et al. 1991, 1995). This Φc criticalporosity separates the mechanical behavior of rocks intotwo distinct domains: for porosities lower than Φc, themineral grains are load-bearing, whereas at porositiesgreater than Φc, sediments fall apart and behave as amineral-pore suspension. We theoretically reproduced theeffects of poorly consolidated sediments lying at 500 m onthe elastic properties, via modeling as proposed by Dvorkinet al. 1999.
The lower Hashin–Shtrikman bound is the most appro-priate model as we were simulating the elastic properties ofunconsolidated sediments and, therefore, looking for thesoftest rock arrangement. Figure 8a shows the variation ofthe Vp/Vs ratio as a function of porosity for an unconsol-idated quartz-sand having a critical porosity of 38%.Figure 8a shows that the Vp/Vs ratio increases withincreasing porosity, as in fluid-bearing sediments, shearwave velocity approaches zero while the compressional-wave velocity does not fall below the velocity of asuspension of sand in water.
Zimmer (2003) showed a similar trend in the Vp/Vs ratio(Fig. 8b) for a set of reconstituted, unconsolidated sand andglass-bead samples under low pressure conditions. Themodeling results and the experimental measurementsreported for unconsolidated sediments (Zimmer 2003)suggest that the large changes predicted in the Vp/Vs ratioat low effective pressures (Fig. 8a, b) are consistent with thehypothesis of poorly consolidated, fully water saturatedsediments lying above 600 m in depth.
Nevertheless, it should be emphasized that the results inFig. 8 have to be considered purely indicative of themagnitude of the Vp/Vs trends. The lack of the inputparameters for site-relevant poorly consolidated rocks aswell as the Vp/Vs calculated as a average over a layerthickness of 600 m prevents us from considering themodeling of Fig. 8a for quantitative purposes.
Conclusions
The present study has provided detailed information aboutthe elastic properties of the sediments in the first kilometerof depth of the Pozzuoli bay and the correlations withvolcanic structure known by previous investigations, byusing a new reflection seismic analysis and a refinedtomographic model.
The overall picture of the velocity distribution shows thepresence of a complex arc-shaped anomaly that borders thebay offshore The deeper part of the anomaly (beneath700 m, with Vp>3,500 m/s) correlates with units made upof agglomerate tuff and interlayered lava, which form thesouthern edge of the caldera, which was itself probablyformed following the two large ignimbritic eruptions that
marked the evolutionary history of the area under study.The upper part of the anomaly is correlated with dikes,volcanic mounds and hydrothermal alteration zones notedin previous shallow reflection seismic analyses.
The depth of the transition between the upper and lowerparts of the anomaly is characterized by an abrupt Vpincrease on the one-dimensional (1D) profiles extractedfrom the 3D tomographic model and by the presence of astrong reflector located at about 0.6/0.7 s Two Way Time(TWT) on Common Mid Point gathers. The moveoutvelocity analysis and stack of the P–P and P–S reflectionsat the layer bottom allowed to estimate relatively high Vp/Vs values (3.7±0.9).
This hypothesis has been tested by a theoretical rockphysical modeling of the Vp/Vs ratio as a function ofporosity suggesting that the shallow layer is likely formed byincoherent, water saturated, volcanic and marine sedimentsthat filled Pozzuoli Bay during the post-caldera activity.
The presence of a superficial layer with such character-istics could have important implications on the modellingand general understanding of the processes that form thebasis of the bradyseism of the zone.
References
Acocella V, Cifelli F, Funiciello R (2000) Analogue models ofcollapse calderas and resurgent domes. J Volcanol Geotherm Res104:81–96
Acocella V, Funiciello R, Marotta E, Orsi G, De Vita S (2004) Therole of extensional structures on experimental calderas andresurgence. J Volcanol Geotherm Res 129:199–217
Agip (1987) Geologia e Geofisica del Sistema Geotermico dei CampiFlegrei. Servizi Centrali per l’ Esplorazione, SERG-MMESG,San Donato, 19 pp
Aster RC, Meyer RP (1988) Three-dimensional velocity structure andhypocentral distribution in the Campi Flegrei caldera, Italy.Tectonophysics 149:195–218
Barberi F, Neri G, Valenza M, Villari L (1991) 1987–1990 unrest atVulcano. Acta Vulcanologica 1:95–106
Bartole R, Savelli D, Tramontana M, Wezel F (1984) Structural andsedimentary features in the Tyrrhenian margin of Campania,Southern Italy. Marine Geology 55:163–180
Battaglia J, Zollo A, Virieux J, Dello Iacono D (2008) Merging activeand passive data sets in traveltime tomography: the case study ofCampi Flegrei caldera (Southern Italy). Geoph Prosp. In press
De Vivo B, Rolandi G, Gans PB, Calvert A, Bohrson WA, Spera FJ,Belkin HE (2001) New constraints on the pyroclastic eruptivehistory of the Campanian volcanic Plain (Italy). Mineral Petrol73:47–65
Bruno PPG, Cippitelli G, Rapolla A (1998) Seismic study of theMesozoic carbonate basement around Mt. Somma-Vesuvius,Italy. J Volcanol Geotherm Res 84:311–322
Capuano P, Achauer U (2003) Gravity field modeling in the Vesuviusand Campanian area. In: Zollo A et al (ed) TomoVes SeismicProject: looking inside Mt. Vesuvius. Cuen, Napoli
Cassano E, La Torre P (1987) Geophysics, in Santacroce R (ed),Somma-Vesuvius. CNR Quaderni della Ricerca Scientifica 114(8):175–192
Bull Volcanol (2009) 71:275–284 283

Chiarabba C, Moretti M (2006) An insight into the unrest phenomenaat the Campi Flegrei caldera from Vp and Vp/Vs tomography.Terra Nova 18:373–379
D’Argenio B, Pescatore T, Scandone P (1973) Schema geologicodell’Appennino meridionale. Atti dell’ Accademia Nazionale deiLincei 183:49–72
De Bonitatibus A, Latmiral G, Mirabile L, Palumbo A, Sarpi E,Scalera A (1970) Rilievi sismici per riflessione: strutturali,ecografici (fumarole) e batimetrici del Golfo di Pozzuoli. BollSoc Nat 79:97–115
Deino AL, Orsi G, Piochi M, de Vita S (2004) The age of theNeapolitan Yellow Tuff caldera-forming eruption (Campi Flegreicaldera—Italy) assessed by 40Ar/39Ar dating method. J VolcanolGeotherm Res 133:157–170
Dvorkin J, Prasad M, Sakai A, Lavoie D (1999) Elasticity of marinesediments: rock physics modeling. Geophys Res Lett 26(12):1781–1784
Finetti I, Morelli C (1974) Esplorazione sismica a riflessione dei Golfidi Napoli e Pozzuoli. Boll Geof Teor Appl 16(62/63):175–222
Florio G, Fedi M, Cella F, Rapolla A (1999) The Campanian Plain andCampi Flegrei: structural setting from potential field data. JVolcanol Geotherm Res 91:361–379
Huffman A, Castagna J (2001) The petrophysical basis for shallowwater flow predication using multicomponent seismic data. TheLeading Edge 20(9):1030–1052
Ippolito F, Ortolani F, Russo M (1973) Struttura marginale tirrenicadell’ Appennino Campano: reinterpretazione di dati di antichericerche di idrocarburi. Mem Soc Geol Ital 12:227–250
Lirer L, Luongo G, Scandone R (1987) On the volcanologicalevolution of Campi Flegrei. EOS, Trans Am Geophys Union68:226–234
Judenherc S, Zollo A (2004) The Bay of Naples (Southern Italy):constraints on the volcanic structures inferred from a denseseismic survey. J Geophys Res 109:B10312
Jurkevics A (1988) Polarization analysis of three-component arraydata. Bull Seismol Soc Am 78(5):1725–1743
Milia A (1998) Stratigrafia, strutture deformative e considerazionisull’ origine delle unità deposizionale oloceniche del Golfo diPozzuoli (Napoli). Boll Soc Geol Ital 117:777–787
Milia A, Torrente M (2003) Late-Quaternary volcanism and transten-sional tectonics in the Bay of Naples, Campanian continentalmargin, Italy. Mineralogy and Petrology 79:49–65
Nur A, Marion D, Yin H (1991) Wave velocities in sediments. In:Hovem J, Richardson MD, Stoll RD (eds) Shear waves in marinesediments. Kluwer, Norwell, pp 131–140
Nur A, Mavko G, Dvorkin J, Galmundi D (1995) Critical porosity: thekey to relating physical properties to porosity in rocks: Proc 65thAnn Int Meeting. Soc Expl Geophys 878
Orsi G, Scarpati C (1989) Stratigrafia e dinamica eruttiva del TufoGiallo Napoletano. CNR-GNV Boll 2:917–930
Orsi G, Civetta L, Aprile A, D’Antonio M, de Vita S, Gallo G, Piochi M(1991) The Neapolitan Yellow Tuff: eruptive dynamics, emplacementmechanism and magma evolution of a phreatoplinian-to-plinianeruption. In: Large Ignimbrite Eruptions of the Phlegraean FieldsCaldera: The Neapolitan Yellow Tuff and The Campanian IgnimbriteG. Orsi and M. Rosi, Editors, I.A.V.C.E.I. Commission on ExplosiveVolcanism, Workshop on Explosive Volcanism, Naples, Sept. 1–8,Guideb., pp. 76–115.
Orsi G, D’Antonio M, De Vita S, Gallo G (1992) The NeapolitanYellow Tuff, a large-magnitude trachytic phreatoplinian eruption:eruptive dynamics, magma withdrawal and caldera collapse. JVolcanol Geotherm Res 53(1–4):275–287
Orsi G, De Vita S, Di Vito M (1996) The restless, resurgent CampiFlegrei nested caldera (Italy): constraints on its evolution andconfiguration. J Volcanol Geotherm Res 74:179–214
Pescatore T, Diplomatico G, Senatore MR, Tramutoli M, Mirabile L(1984) Contributi allo studio del Golfo di Pozzuoli: aspettistratigrafici e strutturali. Mem Soc Geol Ital 27:133–149
Rosi M, Sbrana A (1987) Phlegraean Fields. CNR Quaderni dellaRicerca Scientifica 114(9):175
Rosi M, Sbrana A, Principe C (1983) The Phlegraean Fields:structural evolution, volcanic history and eruptive mechanisms.J Volcanol Geotherm Res 17:273–288
Scarpati C, Cole P, Perrotta A (1993) The Neapolitan Yellow Tuff: alarge volume multiphase eruption from Campi Flegrei, SouthernItaly. Bull Volcanol 55:343–356
Tarantola A (2005) Inverse problem theory and methods for modelparameter estimation. SIAM, Philadelphia, 342 pp
Vanorio T (2003) Physical properties of volcanic rocks from Campaniaplain. In: Capuano P, Gasparini P, Zollo A, Virieux J, Casale R,Yeroyanni M (eds) The internal structure of Mt. Vesuvius. Aseismic tomography investigation. Liguori, Naples, pp 553–580
Vanorio T, Virieux J, Capuano P, Russo G (2005) Three-dimensionalseismic tomography from P wave and S wave microearthquaketravel times and rock physics characterization of the CampiFlegrei Caldera. J Volcanol Geotherm Res 110:B03201
Wohletz K, Orsi G, De Vita S (1995) Eruptive mechanism of theNeapolitan Yellow Tuff interpreted from stratigraphic, chemicaland granulometric data. J Volcanol Geotherm Res 67:263–290
Zimmer M (2003) Controls on the seismic velocities of unconsolidat-ed sands: measurements of pressure, porosity and compactioneffects. Ph.D. thesis, Stanford University, Stanford, CA
Zollo A, Judenherc S (2005) Reply to comment by Rapolla A on The Bayof Naples (southern Italy): constraints on the volcanic structuresinferred from a dense seismic survey. J Geophys Res 110:B06308
Zollo A, Judenherc S, Auger E, D’Auria L, Virieux J, Capuano P,Chiarabba C, De Franco R, Ma kris J, Michelini A, andMusacchio G (2003) Evidence for the buried rim of CampiFlegrei caldera from 3-d active seismic imaging. Geophys ResLett 30(19); DOI 10.1029/2003GL018173
284 Bull Volcanol (2009) 71:275–284