Comparison of different numerical Laplace inversion methods ...
Upload
independentCategory
view
0download
0
JOURNAL OF GEOPHYSICAL RESEARCH, VOL. 98, NO. Bll, PAGES 19,869-19,879, NOVEMBER 10, 1993
Velocity Structure of the Long Valley Caldera From the Inversion of Local Earthquake P and $ Travel Times
ARTURO E. ROMERO, JR., THOMAS V. McEVILLY AND ERNEST L. MAJER
Center for Computational $eismology, Earth Science Division, Lawrence Berkeley Laboratory, Berkeley, California
ALBERTO MICHEL1NI
CNR-lnstituto Talassografico Sperimentale, Trieste, Italy
A high-resolution tomographic study of the Long Valley region began J.n 1989 with the installation of a special fan array of eight three-component borehole (80-160 m depths) receivers on the northwestern rim of the caldera to provide the data necessary for a joint inversion for hypocenters and the three-dimensional P and S wave velocity structure in and below the caldera. The experiment specifically targeted the subsurface location of the previously inferred magma chamber beneath the Resurgent Dome. Additional coverage was provided by existing U.S. Geological Survey and University of Nevada, Reno seismographic networks. We employed the progressive inversion scheme of Thurber (1983), with cubic spline interpolation after Michelini and McEvilly (1991). The final model is based on data from 280 well-distributed local earthquakes. Some 6900 arrival times were used, including about 700 $ wave times from the three-component stations. The resulting velocity structure reflects the known geology, defining the low-velocity caldera fill to 2 km depth, contrasting markedly with the surrounding higher-velocity Sierran block and highland terrane. No isolated distinct low- velocity anomalies are revealed beneath the caldera floor, although a diffuse zone of reduced velocity persists to a depth of about 8 km. These lower velocities may be related to hydrothermal alteration and/or extensive fractures. The Vp/Vs structure contains significant lateral variation within and beneath the caldera to about 8 km depth, and these variations can be related to accepted models of the active geothermal system. The lack of a significant S wave velocity anomaly, along with the normal or low values of the Vp/Vs ratio, argues against the presence of a sizable and distinct magma body at shallow to midcrustal depth beneath Long Valley caldera, although a very low percentage of partial melt cannot be precluded.
INTRODUCTION
Advances in three-dimensional travel time tomography in recent years have made it practicable to image complex geological structures on a regional scale, given reasonably well-distributed seismicity and seismographs. The method has been applied in active, well-instrumented areas such as The Geysers [Eberhart-Phillips and Oppenheimer, 1984; O'Connell and Johnson, 1991], Long Valley [Kissling, 1988], and Loma Prieta [Foxall, 1992] yielding smooth velocity models with resolutions of a few kilometers. Michelini and McEvilly [1991] were successful in constructing both P and S wave velocity models for Parkfield. With both P and S wave models, the Vp?Vs distribution is available, a parameter which contains information on the mechanical properties of rocks and fluids at depth. In this study we apply the method in a study of the crustal structure beneath Long Valley caldera.
BACKGROUND
Long Valley caldera (LVC) is a Quaternary volcanic structure located on the western margin of the Basin and Range province at the base of the Sierra Nevada frontal fault escarpment. The caldera was formed as a result of a
Copyright 1993 by the American Geophysical Union.
Paper number 93JB01553. 0148-0227/93/93JB01553505.00
voluminous ash eruption 760,000 years ago that created the Bishop tuff. Since that time the caldera has been the site of numerous episodes of volcanism, the most recent being approximately 600 years ago. The detailed geology and history of the region are given by Bailey et al. [1976] and Bailey [1989]. The simplified geology of LVC shown in Figure 1 is adopted from Bailey et al. [1976]. Indications of renewed magma movement followed a series of large magnitude earthquakes in 1980 with subsequent surface uplift and inflation-consistent deformation. The associated heightened awareness of possible imminent volcanic eruption prompted numerous investigations into the current processes occurring within the caldera. The topic receiving most attention has been the search for the presumed magma chamber beneath the Resurgent Dome.
A number of geophysical studies argue for the existence of a magma body at shallow to midcrustal depths beneath LVC (reviews are presented by Hill et al. [1985a], Rundle et al. [1986], Goldstein [1988], and Goldstein and Stein [1988]). Refraction surveys showed possible seismic reflectors at depths of 7 to 8 km beneath the western margin of the Resurgent Dome, and these were interpreted by Hill [1976] and Hill et al. [1985b] as the top of a magma chamber. Luetgert and Mooney [1985] and Zucca et al. [1987] found deeper reflectors and proposed that these were reflections off the bottom of the magma chamber. Dawson et al. [ 1990] used teleseismic P wave residuals to determine a three-dimensional (3-D) velocity structure, finding a low-velocity body between 7 and 20 km beneath
19,869

19,870 ROMERO ET AL.: VELOCITY STRUCTURE OF LONG VALLEY CALDERA
119ø15 ' I 37o55 '
ß ß eeee e ß
Long '. Valley ' (• ß
Caldera ß ß
ß
ß ß
½D ø4 ß
:" ;'. :'.' "5. ', ;'.
• ,-.•Q-• .-,•...c,-• .-,',-...c,- ß 3703O '
I .
I o I I
'• Kilometers
LEGEND
20
Bishop Tuff Mesozoic plutonic Rhyodacite
Normal fault I,,1
Holocene rhyolite and rhyodacite
118o30 '
XBL927-5330a
Fig. 1. Simplified geologic map of Long Valley region adopted from Bailey et al. [1976]. The caldera boundary is represented by the dotted outline. RD, Resurgent Dome; MM, Mammoth Mountain; CD, Casa Diablo; HCF, Hilton Creek fault; RVF, Round Valley fault; VT, Volcanic Tableland.
the Resurgent Dome, a feature they interpret as a magma body of approximately 20% partial melt. In a more recent study, Steck [ 199 2] found a low-velocity sill-like body beneath the western half of the caldera between 7 and 11
km depth which he postulates as the remnant magma chamber. Sanders [1984] mapped S wave shadowing and defined a possible magma body between 5 and 8 km beneath the central part of the caldera, with the top possibly as shallow as 4 km.
Other studies have found no indications of anomalous
regions beneath the caldera. In particular, a detailed tomographic study by Kissling [1988] found no evidence for a low-velocity region which would indicate the presence of a magma body beneath LVC. Hauksson [1988] suggested that the observed S wave shadowing could be explained by radiation pattern effects. Black et al. [1991], employing a new migration algorithm, concluded that the
events previously interpreted as reflections from a magma chamber were most probably reflections from the faults of the caldera ring fracture system.
In an attempt to resolve these conflicting results on the presence of a shallow magma chamber under LVC, a special high-resolution tomographic study was initiated to image the region beneath the caldera using the technique of joint inversion of microearthquake P and S wave travel times for velocity structure and hypocenters. In a joint U.S. Geological Survey (USGS) and Lawrence Berkeley Laboratory (LB L) effort, the dense microearthquake network at Long Valley was supplemented with new stations. A fan array of eight three-component borehole (80-160 m depths) receivers was installed on the northwestern rim of the caldera with digital telemetry at high resolution (16 bits gain-ranged, 480 samples per second per channel) to a local event-recording PC-based

ROMERO ET AL.: VELOCITY STRUCTURE OF LONG VALLEY CALDERA 19,871
data acquisition system. The purpose of the fan array was to provide added ray path coverage in and below the Resurgent Dome, in the region of the proposed magma chamber, from microearthquake sources in the South Moat, in the Sierran Block south of the caldera, and in Chalfant Valley to the southeast. The resulting arrival time data were combined with those from the USGS and University of Nevada, Reno (UNR) seismographic networks to image the crustal structure within the caldera.
DATA
The data for this analysis consist of direct P and S wave arrival times for local earthquakes recorded by the composite network from June 1989 through August 1990. During the period of operation, about 2100 local earthquakes were recorded, most of which occurred near Mammoth Mountain, in the South Moat zone and in Chalfant Valley. A set of 280 high-quality events with a minimum of 10 P wave arrivals were selected for the
simultaneous inversion of hypocenters and velocity
structure. The selected events, characterized by impulsive first arrivals and distinct S phases, were well-distributed within the region of interest to provide uniformly dense ray coverage within the caldera.
Travel times from the refraction surveys [Hill et al., 1985b] provided constraints on the near-surface velocity structure. S wave arrivals were timed only on the horizontal components of the available three-component stations, which include six portable seismographs deployed by UNR around the South Moat area between March and May 1990. The final data set consists of approximately 6900 arrival times, including about 700 S wave arrivals. Figure 2 shows the station distribution and the epicenters of the 280 earthquakes used in the inversion.
MEIIqOD
The joint problem for 3-D velocity distribution and hypocenter locations is solved with the progressive inversion scheme proposed by Thurber [1983]. A series of linearized systems of equations relating travel time residual
5O
Z
-5O
-lOO
! !
N
/ /
/ /
Long Valley •' •, Caldera
/ ' .7:..'7" I ' •,
! .... 1•. • *;' ß a"'
&&
ß , 17 ß ! ,
A I A .• I I
I I
I
• ß I I
ß
I
& &
i
0 5 KM '.
& 3-comp Fan Array
•, UNR/USGS Network
[] 3-comp Station
ß Epicenter
-15 0 0 10 2O KM
I
-50 0 50
W-E (km)
Fig. 2. Map showing the station distribution and the epicenters of the 280 earthquakes (small dots) used in the inversion. Triangles denote the network stations. Squares denote the three-component stations. The caldera outline is shown for reference.

19,872 ROMERO ET AL.: VELOCITY STRUCTURE OF LONG VALLEY CALDERA
and adjustments in origin time, hypocentral coordinates, and velocity parameters is solved repeatedly using damped least squares. Parameter separation [Pavlis and Booker, 1980] is used to decouple hypocenter locations and velocity adjustments. A detailed discussion of the formulation used here is given by Michelini and McEvilly [1991]. To limit the CPU time required in travel time computation, we use the approximate ray tracer developed by Urn and Thurber [1987]. Using a pseudo-bending method, the ray tracer produced errors less than 0.7% when compared to a more computationally intensive exact ray tracer. The region was divided into a 3-D rectangular grid with velocities assigned to each grid point. The starting P wave velocity model is derived from the one-dimensional velocity model used routinely by the USGS to locate hypocenters in the LVC region (Figure 3). A Vp/Vs ratio of 1.73 is assumed for the corresponding $ wave model. The velocity model is parameterized in terms of cubic splines, yielding a smooth velocity model continuous everywhere up to the second spatial derivative. Starting hypocenter locations are fixed arbitrarily near the center of the caldera.
Tests with synthetic data were used to explore the resolving power of the data set and also to determine the best parameterization to be adopted in the actual velocity inversion for the entire Long Valley region. We describe these tests in the following section.
TESTS W1TH SYNTHETIC DATA
Uncertainty and nonuniqueness are unavoidable problems in geophysical inverse problems. Finite model parameterization degrades short-wavelength image fidelity, while minimum allowable seismic ray density imposes a lower limit on node spacing. Overparameterization yields poorly sampled voxels and low resolution, as demonstrated by Toomey and Foulget [1989], who explored the trade-off between image fidelity and resolution using different parameterizations. Uneven ray coverage (due to limited
-8
-lO 2
L
- ß
•Vs Vp ..
I I i . I
,.
I I i I
ß i ,• i . i . i. . -
3 4 5 6 7
Velocity (krn/s)
Fig. 3. One-dimensional velocity structure for LVC used as "background" model for tests with synthetic data.
source-receiver distribution) leads to a mixture of overdetermined and underdetermined "sub-problems", and some a priori information is required for solution. Furthermore, errors introduced by nonlinearity, arrival time Uncertainties, model parameterization, and ray tracing 'smear the final velocity model and contribute to hypocenter mislocations. No straightforward estimate of the consequent uncertainties is available. Some studies [e.g., Spakrnan and Nolet, 1988; Michelini and McEvilly, 1991] employed synthetic data to estimate the errors and resolution of the inversion. In the following section we assess image fidelity in the LVC inversion using synthetic arrival time data and initial models with different node
spacing. The test model is derived from the starting 1-D velocity
model used in the actual inversion (Figure 3) with high- and low-velocity anomalies (15 to 20% contrasts) superimposed on several nodes. The grid used to generate synthetic travel times contains 294 nodes spaced at 2.5 km (x7 nodes) horizontally and 2 km (x6 nodes) vertically. Depths are referenced to a datum plane 2 km above sea level, the average elevation of the region. Plate l a presents the P wave test model in a series of horizontal slices at several depths beneath LVC. The cross sections display a 15x15 km 2 area centered at the Resurgent Dome. Colors indicate velocities with blue and red indicating high and low values, respectively. The velocity distribution contains parallel ridges 3.5 km long of high and low velocity in the west central LVC at a depth of 4 km and several isolated high- and low-velocity anomalies at greater depth near the Resurgent Dome. This "heterogeneity" was introduced to evaluate the capability of the dataset to resolve anomalies with varying scale lengths. A subset of 214 earthquakes and six refraction shots to 30 km distance provides a total of 5750 arrival times. We employed the same source-receiver geometry as for the real inversion problem.
Three parameterizations were adopted for the inversion tests: (1) a coarse grid with a node spacing along the x, y, and z directions of 10 km (x7 nodes), 10 km (x7 nodes), and 2 km (x6 nodes), respectively; (2) a medium grid with a node spacing of 5 km (x7 nodes), 5 km (x7 nodes), and 2 km (x6 nodes); and (3) a fine grid with a node spacing of 3 km (x7 nodes), 3 km (x7 nodes), and 2 km (x6 nodes). All three parameterizations have larger grid spacing than the generating model to simulate the effect of undersampling. We evaluate the resulting models on the degree to which the different parameterizations reproduce the original synthetic structure and compare the rms residual and the model resolution of the three cases.
The model resolution matrix R, defined in m = Rib shows how close a model estimate (m) is to a true model (lb). Ideally, the "true model" represents the real Earth structure in the absence of error and described by the model parameterization. Each element of the model estimate (m) is a weighted average of the data and a priori assumptions. The rows of R are the averaging kernels for each model parameter which describe how well neighboring model parameters are independently predicted [Menke, 1989]. If R is the identity matrix, then each model parameter is uniquely determined. Since R is an (mxm) square matrix, where rn is the number of model parameters, difficulties arise in displaying R even for modest rn because of its

ROMERO ET AL.' VELOCITY STRUCTURE OF LONG VALLEY CALDERA 19,873
' • o o
I::::1 :: • CI o '::•- ' I g 0
• O'g! 0'0 O'gl- O'gl 0'0 O'gl- O'gl 0'0 O'gl-
0'0
o
'%%
: ..:.
....
0'•I-
o
0'6!-
ß ß •
ii • II
o'• .... % 0:•': o'•,
(•) •-s (•)
,. :,.? •%..,% .... ,?•.:• ....
0'61 0'0 0'61- 0'61 0'0 0'61- 0'61

19,874 ROMERO ET AL.: VELOCITY STRUCTURE OF LONG VALLEY CALDERA
large size. A more meaningful and compact form of presenting R uses the resolving-width function (RW i ) of the ith model parameter, as defined by Menke [1989], Toomey and Foulger [1989], and Michelini and McEvilly [1991]
gw/= Ilrllwc,,> J
where Rij is an element of R, w(i,j)is a weighting function equal to the distance between the ith and,,jt,h. parameter, rn is the number of model parameters, and IIr .ll is the L 2 norm of the jth averaging kernel. A w"efl"- resolved model parameter has low RW i, while a large value indicates a poorly resolved parameter with broad resolving-kernel shape. In addition to visual evidence for image recovery, we assess the results by comparing the spatial variations of RW i for the three parameterizations.
Velocity structures obtained for the different parameterizations are shown in Plates lb, l c, and l d. Three cross sections at depths of 4, 6, and 8 km are presented for each case. Colors denote seismic velocity with contour interval of 0.2 km/s. The resolution
(indicated by RW i) is depicted by the degree of color intensity, e.g., low color intensity indicates low resolution (large RWi).
The P wave velocity structure in Plate lb, obtained using the coarse grid (node spacing of 10 km), shows little resemblance to the test model. The ridge features at 4-km depth show up as a diffuse high-velocity anomaly shifted at least 5 km to west of its actual location. The features at 8-
km depth similarly are represented as a broad high-velocity zone beneath the east central caldera. There is little
indication of the low-velocity anomalies. Other features seen with scale lengths around 10 km appear to be totally unrelated to the initial test model.
Both fine and medium grids recover more details of the test model. The medium grid (node spacing of 5 km) inversion test, shown in Plate l c, recovers more of the anomalies in the P wave structure. The anomaly ridges at 4-km depth are beginning to take shape. Distorted images of the anomalous high- and low-velocity features at 8-km depth are seen, and they apparently are influencing results at the 6-km level. Velocity anomalies, with +5% variations unrelated to the initial model are present in regions of low resolution in the southwest and northeast quarters of LVC.
The most prominent features recovered with the fine grid (node spacing of 3 km) are the parallel ridges of high and low velocity in the west central LVC at 4-km depth (Plate l d). Good resolution is obtained only in the western half of LVC. The two isolated high-velocity bodies northeast of these ridges are seen as a single diffuse anomaly. The anomalies at 8-km depth are not recovered, although there is evidence for their influence at 6-km depth.
It is clear that the fine and the medium grids yield the best results in well-resolved regions which are adequately sampled by seismic rays. However, because of poorly sampled nodes the fine grid has relatively large regions of low resolution compared to both the medium and the course grids. While the coarse grid provides the best resolution, owing to the fact that a fairly large number of rays are sampled and contribute to the prediction of each of
the velocity parameters, it presents the poorest recovery of the original model. For this data set then, the medium grid represents the optimum node spacing for relatively good resolution over the region of interest, while still preserving some small-scale features. We adopted the medium grid for the inversion of the real arrival time data.
These tests with synthetic data have shown that the caldera region is well-resolved to a depth of 8 km and velocity fluctuations less than 6% are insignificant. Furthermore, we conclude that the inverse problem as posed can define heterogeneity with scale lengths of 2.5 km within well-resolved regions, sufficient to test the various magma chamber hypotheses.
FINAL INVERSION MODEL AND INTERPRETATION
The final model, based on 280 well-distributed local earthquakes, exhibits an rms arrival time residual of 71 ms, an improvement of 42% after two iterations. The resulting Vp and Vs models are shown in Plates 2 and 3, with the resolving-width function (RW i) superimposed as color intensity to indicate regions of low resolution. The Vp model is well-resolved to a depth of 8 km within the caldera. Vs is not well-resolved in the eastern part of the caldera where there are no three-component stations, but elsewhere Vs is well-resolved to a depth of 8 km. The important target region beneath the Resurgent Dome and the West Moat, where the proposed magma bodies lie, is well-imaged for both Vp and Vs.
Vp Structure
The most striking feature in the velocity structure is the lateral velocity variation in the upper 2 km, presumably due to the postcaldera fill contrast with the surrounding rocks. Vp ranges from about 2.5 km/s in the postcaldera fill to above 4 km/s in the surrounding terranes with steep velocity gradients at the caldera ring faults. At a depth of 2 km the caldera is still evident as an oval structure within
which Vp increases westward from 5 km/s at the eastern boundary to 6 km/s at the west moat. The velocity structure becomes more uniform below a depth of 2 km. Although the velocities beneath the caldera are somewhat lower than those in the surrounding regions, there seems to be no evidence of distinct small-scale low-velocity zones to 8 km at the. inversion resolution of about 2.5 km. A
diffuse low-velocity region is seen east and southeast of the Resurgent Dome from depths of 2 to 6 km, bounded to the southwest by a trend roughly in line with the projection of the Hilton Creek and Round Valley faults into the caldera (refer to Figure 1). At a depth of 8 km, a low-velocity region appears beneath the southwest part of the caldera.
Vs and Vp/Vs Structure
The Vs structure (Plate 3) generally shows those variations seen for Vp. Resolution is lower due to the much reduced ray coverage for S waves. The Vp/Vs structure in Plate 4 displays intriguing features. Most striking is the relatively high Vp/Vs (greater than 1.8) within the caldera near Casa Diablo, separating regions of low Vp/Vs (less than 1.6) to the northwest and southeast. These two zones of low Vp/Vs appear to merge-at depths of 4 to 6 km into a broad low, lying beneath the

ROMERO ET AL.: VELOCITY STRUCTURE OF LONG VALLEY CALDERA 19 875
LONG VALLEY P-wave VELOCITY MODEL Depth = 0 km o Depth = 6 km
I -15.0 0.0 15.0 -15.0 0.0
Depth = 2 km
-15.0 0.0 15.0
Depth = 4 km
..,] ;?/ .... 'i, .... ,.• •. • •., • .:•..
' •. -.-• ._
.
-15.0 0.0 15.0
W-E (km) • • ? .,:
15.0
o Depth = 8 km
.
o .
I
-]5.0 0.0 15.0
Depth = 10 km
....... ........ ...........
0.0 15.0
W-E (km)
2.0 8.0 4.0 5.0 8.0 ?.0
P-VEL.
Plate 2. Plots of the final P wave velocity model. Colors denote velocities, while intensity indicates model resolution as given by the resolving width function RW i. Contour interval is 0.3 km/s. Datum plane is at 2 km above sea level.
southwestern caldera and bounded on the east by the projection of the Hilton Creek fault.
Lithological Interpretation of Velocities
The Vp model is consistent with the upper crustal structure determined by Hill et al. [1985b]. The caldera fill, discernible to a depth of 2 km, generally thickens northward and eastward, from about 1 km thickness beneath the west moat to about 2 km thickness beneath the
east moat. The welded Bishop tuff comprises roughly the lower half of the fill. The Resurgent Dome is evident as a thinning of the postcaldera fill at the central part of the caldera. The Inyo volcanic chain and Mammoth Mountain, northwest and southwest of the caldera, respectively, are characterized by lower velocities, probably associated with pumice and fractured rhyolite flows. Lower velocities extend southeast of the caldera into the Volcanic Tableland
which consists of relatively low-density Bishop tuff. The velocities found in the upper 2 km correspond well
to the rock units of the caldera fill and their associated P
and S wave velocities as summarized by Bailey et al. [1976] and Hill et al. [1985b]: (1) a surficial layer of poorly-consolidated sedimentary fill, and basalt and rhyolite lava flows with thickness of 100-300 m and velocities less
than 2 km/s (P) and 1.0 km/s (S); (2) postcaldera volcanics consisting of tuffs and rhyolite lava flows, and partly- welded Bishop tuff with thickness of 200-400 m and velocities between 2.0 and 4.0 km/s (P) and 1.0 and 2.2 krn/s (S); and (3) welded Bishop tuff with thickness of roughly 1 km and velocities between 4.0 and 4.5 km/s (P) and 2.3 and 2.6 km/s (S). Velocity-lithology relations in the caldera will depend heavily on the specific geothermal environment. The presence of fractures and hydrothermal alteration within the caldera fill will complicate lithological distinctions. For example, velocities for the welded Bishop tuff within the caldera are comparable to the velocities of the granitic and metasedimentary rocks in the upper 2 km of the crystalline basement.
The caldera and the surrounding highlands are underlain by crystalline basement of Mesozoic granite, Paleozoic

19,876 ROMERO ET AL.: VELOCITY STRUCTURE OF LONG VALLEY CALDERA
LONG VALLEY S-wave VELOCITY MODEL Depth = 0 km Depth = 6 km
o
-•a.o o.o ta.o
o Depth = 4 km
...
(km)
•o
1t5.0 -115.0
-15.0
Depth = 8 km
115.0
-•.o o.o 1•5.o
o Depth = 10 km
,
,
-15.0 0.0 15.0
(kin)
ß .
1.0 R.O 5.0 4.0
s-vi (KM/S)
Plate 3. Plots of the final S wave velocity model. Colors denote velocities, while intensity indicates model resolution as given by the resolving width function RW•. Contour interval is 0.3 km/s. Datum plane is at 2 km above sea level.
metasedimentary and metavolcanic rocks [Bailey et al., 1976], with velocities starting at the upper levels around 5 km/s (P) and 3 km/s (S). Model P and S velocities of at least 6 and 3.5 km/s are seen at a depth of 6 to 8 km. Location of the higher velocities at the western caldera margin suggests that the main caldera ring fault there extends roughly 3 km inward from the topographic boundary as confirmed by drilling in the west moat near Inyo domes [Suemnicht, 1987]. This feature suggests that the west moat subsidence may have been accomplished in a series of normal faults.
Implications of the Vp/Vs Structure
Fractures, pore pressure, porosity, fluid saturation, and partial melt affect seismic velocities. Variations in the observed Vp/Vs ratio, along with the P and S velocities, indicate changes in the mechanical properties of the rocks in situ. Moos and Zoback [1983] found that the presence of fully saturated fractures decreases both P and S wave velocities, and increases Vp/Vs. Christensen [1984]
demonstrated that Vp/Vs values increase with pore pressure at constant confining pressure. In a theoretical study, Mavko [1980] showed that partial melting increases the Vp/Vs ratio. The P wave velocity of porous rocks has been shown theoretically and experimentally to be more sensitive to fluid saturation changes than the S wave velocity [Castagna et al., 1985; O'Connell, and Budianski, 1974, 1977]. The effect of fluids in joints is to increase the specific stiffness to compressional waves while not inhibiting the relative shear displacement across the joint. As a result, higher saturation increases the effective Vp/Vs while undersaturation (dry or gas-filled fractures) depresses the effective Vp/Vs ratio [ToksSz et al., 1976; Gregory, 19761. Following O'Connell and Budianski [ 1974], we estimate
to first order the degree of fluid saturation from the observed Vp/Vs ratio obtained from the inversion. Using a self-consistent approximation, the equations relating seismic velocities and saturation for the case of randomly- oriented elliptical cracks partially saturated with fluid and gas phases are

ROMERO ET AL.' VELOCITY STRUCTURE OF LONG VALLEY CALDERA 19 877
LONG VALLEY Vp/Vs MODEL Depth = 0 km
z I
-15.0
,.
{•.o 15.o
- [5.0 0.0 15.0
o
-15.0
Depth = 4 km
:.f •,.
,
0.0 15.0
W-E (kin)
Depth = 6 km
!
-15.0 0.0 15.0
Depth = 8 km
! I ' '" ' ' -15.0 0.0 120
o Depth = 10 km
t
-15.0 0.0 15.0
W-E (kin)
1.50 1.75 l•.00
Vp/Vs Ratio
Plate 4. Plots of the final Vp/Vs structure. Colors denote Vp/Vs values, while intensity indicates model resolution as given by the resolving width function RW•. Contour interval is 0.1. Datum plane is at 2 km above sea level.
1
Vp/Vs (1- 2•)(1- x>)
45(•)- •)(2- •))
16(1- 5• )[(1 - •)(1 + 3v)(2 - 5)- 2(1 - 2v)]
(2)
(3)
where
Vp/Vs Vp!Vs
œ
observed Vp/Vs ratio; intact rock Vp/Vs ratio; observed Poisson's ratio; intact rock Poisson's ratio; fluid saturation;
, defined as œ = (2 N / •:) A://n)i crack density where N is the number of cracks per 't volume; A and P are the area and the perimeter of the crack, respectively.
We assume a Vp/Vs ratio of 1.73 for the dry uncracked
rock. The crack density œ may be obtained from estimating the number of cracks traces per unit area and the mean trace length in cores or thin sections. In the absence of a reliable measurement of the crack density, we can only put bounds on the estimated saturation values. These bounds are based on all elastic moduli approaching zero with increasing crack density. Examination of several well logs taken from several boreholes around the Resurgent Dome region indicates numerous cracks of various sizes and orientations, attesting to the highly fractured conditions of the rocks beneath LVC at shallow depths. In addition, large cracks reduce the elastic moduli more than a gmat number of small cracks with the same total crack area [O'Connell and Budianski, 1974]. Using these equations, we estimate an upper bound in saturation value of 0.53 and 0.41 at shallow depths beneath the South Moat and the West Moat, respectively. The isolated high Vp/Vs anomaly near Casa Diablo has saturation greater than 0.73. For the low Vp/Vs beneath the western part of the caldera at a depth of 4 km, the saturation is less than 0.63. How these results extrapolate to macrofractures is not well
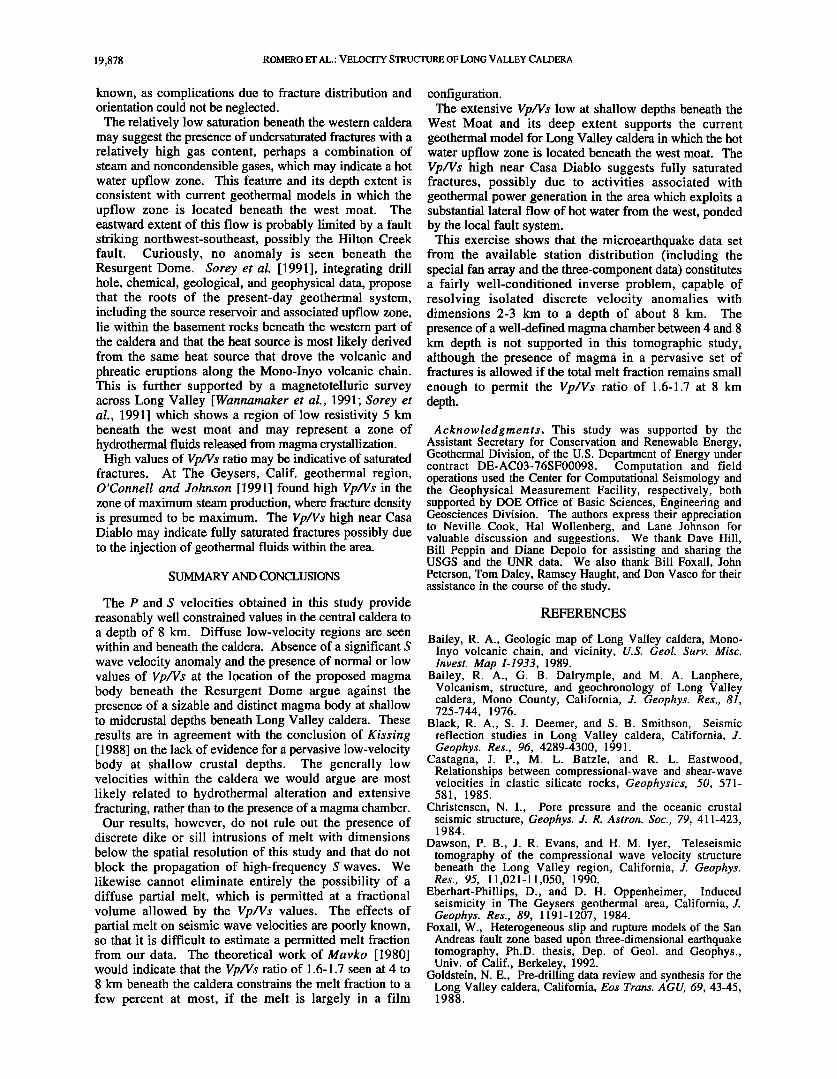
19,878 ROMERO ET AL.: VELOCITY STRUCTURE OF LONG VALLEY CALDERA
known, as complications due to fracture distribution and orientation could not be neglected.
The relatively low saturation beneath the western caldera may suggest the presence of undersaturated fractures with a relatively high gas content, perhaps a combination of steam and noncondensible gases, which may indicate a hot water upflow zone. This feature and its depth extent is consistent with current geothermal models in which the upflow zone is located beneath the west moat. The eastward extent of this flow is probably limited by a fault striking northwest-southeast, possibly the Hilton Creek fault. Curiously, no anomaly is seen beneath the Resurgent Dome. Sorey et al. [1991], integrating drill hole, chemical, geological, and geophysical data, propose that the roots of the present-day geothermal system, including the source reservoir and associated upflow zone, lie within the basement rocks beneath the western part of the caldera and that the heat source is most likely derived from the same heat source that drove the volcanic and
phreatic eruptions along the Mono-Inyo volcanic chain. This is further supported by a magnetotelluric survey across Long Valley [Wannarnaker et al., 1991; Sorey et al., 1991] which shows a region of low resistivity 5 km beneath the west moat and may represent a zone of hydrothermal fluids released from magma crystallization.
High values of Vp/Vs ratio may be indicative of saturated fractures. At The Geysers, Calif. geothermal region, O'Connell and Johnson [1991] found high Vp/Vs in the zone of maximum steam production, where fracture density is presumed to be maximum. The Vp/Vs high near Casa Diablo may indicate fully saturated fractures possibly due to the injection of geothermal fluids within the area.
SUMMARY AND CONCLUSIONS
The P and S velocities obtained in this study provide reasonably well constrained values in the central caldera to a depth of 8 km. Diffuse low-velocity regions are seen within and beneath the caldera. Absence of a significant S wave velocity anomaly and the presence of normal or low values of Vp/Vs at the location of the proposed magma body beneath the Resurgent Dome argue against the presence of a sizable and distinct magma body at shallow to midcrustal depths beneath Long Valley caldera. These results are in agreement with the conclusion of Kissing [ 1988] on the lack of evidence for a pervasive low-velocity body at shallow crustal depths. The generally low velocities within the caldera we would argue are most likely related to hydrothermal alteration and extensive fracturing, rather than to the presence of a magma chamber.
Our results, however, do not rule out the presence of discrete dike or sill intrusions of melt with dimensions
below the spatial resolution of this study and that do not block the propagation of high-frequency S waves. We likewise cannot eliminate entirely the possibility of a diffuse partial melt, which is permitted at a fractional volume allowed by the Vp?Vs values. The effects of partial melt on seismic wave velocities are poorly known, so that it is difficult to estimate a permitted melt fraction from our data. The theoretical work of Mavko [1980] would indicate that the Vp/Vs ratio of 1.6-1.7 seen at 4 to 8 km beneath the caldera constrains the melt fraction to a
few percent at most, if the melt is largely in a film
configuration. The extensive Vp/Vs low at shallow depths beneath the
West Moat and its deep extent supports the current geothermal model for Long Valley caldera in which the hot water upflow zone is located beneath the west moat. The Vp?Vs high near Casa Diablo suggests fully saturated fractures, possibly due to activities associated with geothermal power generation in the area which exploits a substantial lateral flow of hot water from the west, ponded by the local fault system.
This exercise shows that the microearthquake data set from the available station distribution (including the special fan array and the three-component data) constitutes a fairly well-conditioned inverse problem, capable of resolving isolated discrete velocity anomalies with dimensions 2-3 km to a depth of about 8 km. The presence of a well-defined magma chamber between 4 and 8 km depth is not supported in this tomographic study, although the presence of magma in a pervasive set of fractures is allowed if the total melt fraction remains small
enough to permit the Vp/Vs ratio of 1.6-1.7 at 8 km depth.
Acknowledgments. This study was supported by the Assistant Secretary for Conservation and Renewable Energy, Geothermal Division, of the U.S. Department of Energy under contract DE-AC03-76SF00098. Computation and field operations used the Center for Computational Seismology and the Geophysical Measurement Facility, respectively, both supported by DOE Office of Basic Sciences, Engineering and Geosciences Division. The authors express their appreciation to Neville Cook, Hal Wollenberg, and Lane Johnson for valuable discussion and suggestions. We thank Dave Hill, Bill Peppin and Diane Depolo for assisting and sharing the USGS and the UNR data. We also thank Bill Foxall, John Peterson, Tom Daley, Ramsey Haught, and Don Vasco for their assistance in the course of the study.
REFERENCES
Bailey, R. A., Geologic map of Long Valley caldera, Mono- Inyo volcanic chain, and vicinity, U.S. Geol. Surv. Misc. Invest. Map 1-1933, 1989.
Bailey, R. A., G. B. Dalrymple, and M. A. Lanphere, Volcanism, structure, and geochronology of Long Valley caldera, Mono County, California, J. Geophys. Res., 81, 725-744, 1976.
Black, R. A., S. J. Deemer, and S. B. Smithson, Seismic reflection studies in Long Valley caldera, California, J. Geophys. Res., 96, 4289-4300, 1991.
Castagna, J.P., M. L. Batzle, and R. L. Eastwood, Relationships between compressional-wave and shear-wave velocities in clastic silicate rocks, Geophysics, 50, 571- 581, 1985.
Christensen, N. I., Pore pressure and the oceanic crustal seismic structure, Geophys. J. R. Astron. Soc., 79, 411-423, 1984.
Dawson, P. B., J. R. Evans, and H. M. Iyer, Teleseismic tomography of the compressional wave velocity structure beneath the Long Valley region, California, J. Geophys. Res., 95, 11,021-11,050, 1990.
Eberhart-Phillips, D., and D. H. Oppenheimer, Induced seismicity in The Geysers geothermal area, California, J. Geophys. Res., 89, 1191-1207, 1984.
Foxall, W., Heterogeneous slip and rupture models of the San Andreas fault zone based upon three-dimensional earthquake tomography, Ph.D. thesis, Dep. of Geol. and Geophys., Univ. of Calif., Berkeley, 1992.
Goldstein, N. E., Pre-drilling data review and synthesis for the Long Valley caldera, California, Eos Trans. AGU, 69, 43-45, 1988.

ROMERO ET AL.: VELOCITY STRUCTURE OF LONG VALLEY CALDERA 19,879
Goldstein, N. E., and R.S. Stein, What's new at Long Valley, J. Geophys. Res., 93, 13,187-13,190, 1988.
Gregory, A. R., Fluid saturation effects on dynamic elastic properties of sedimentary rocks, Geophysics, 41, 895-921, 1976.
Haukkson, E., Absence of evidence for a shallow magma chamber beneath Long Valley caldera, California, in downhole and surface seismograms, J. Geophys. Res., 93, 13,251-13,264, 1988.
Hill, D. P., Structure of Long Valley caldera from seismic refraction experiments, J. Geophys. Res., 81, 745-753, 1976.
Hill, D. P., R. A. Bailey, and A. S. Ryall, Active tectonic and magmatic processes beneath Long Valley caldera, eastern California: An overview, J. Geophys. Res., 90, 11,111- 11,120, 1985a.
Hill, D. P., E. Kissling, J. H. Luetgert, and U. Kradolfer, Constraints on the upper crustal structure of the Long Valley- Mono craters volcanic complex, eastern California, from seismic refraction measurements, J. Geophys. Res., 90, 11135-11150, 1985b.
Kissling, E., Geotomography with local earthquake data, Rev. Geophys., 26, 659-698, 1988.
Luetgert, J. H., and W. D. Mooney, Crustal refraction profile of Long Valley caldera, California, from the January 1983 Mammoth Lakes earthquake swarm, Bull. Seismol. $oc. Am., 75, 211-221, 1985.
Michelini, A., and T. V. McEvilly, Seismological studies at Parkfield: I. Simultaneous inversion for velocity structure and hypocenters using cubic b-splines parameterization, Bull. $eismol. $oc. Am., 81, 524-552, 1991.
Mavko, G. D., Velocity and attenuation in partially molten rocks, J. Geophys. Res., 85, 5173-5189, 1980.
Menke, W., Geophysical Data Analysis: Discrete Inverse Theory, Academic, San Diego, Calif., 1989.
Moos, D., and M.D. Zoback, In situ studies of velocity in fractured crystalline rocks, J. Geophys. Res., 88, 2'345- 2358, 1983.
O'Connell, R. J., and B. Budiansky, Seismic velocities in dry and saturated cracked solids, J. Geophys. Res., 79, 5412- 5426, 1974.
O'Connell, R. J., and B. Budiansky, Viscoelastic properties of fluid-saturated cracked solids, J. Geophys. Res., 82, 5719- 5735, 1977.
O'Connell, D. R., and L. R. Johnson, Progressive inversion for hypocenters and P wave and S wave velocity structure: Application to The Geysers, California, geothermal field, J. Geophys. Res., 96, 6223-6236, 1991.
Pavlis, G. L., and J. R. Booker, The mixed discrete- continuous inverse problem: Application to the simultaneous determination of earthquake hypocenters and velocity structure, J. Geophys. Res., 85, 4801-4810, 1980.
Rundle, J. B., C. R. Carrigan, H. C. Hardee, and W. C. Luth, Deep drilling to the magmatic environment in Long Valley
caldera, Eos Trans. AGU, 67, 490-491, 1986. Sanders, C. O., Location and configuration of magma bodies
beneath Long Valley, California, determined from anomalous earthquake signals, J. Geophys. Res., 89, 8287- 8302, 1984.
Sorey, M. L., G. A. Suemnicht, N. C. Sturchio, and G. A. Nordquist, New evidence on the geothermal system in Long Valley, California, from wells, fluid sampling, electrical geophysics, and age determinations of hot-spring deposits, J. Volcanol. Geotherm. Res., 48, 229-263, 1991.
Spakman, W., and G. Nolet, Imaging algorithms, accuracy and resolution in delay time tomography, in Mathematical Geophysics, edited by N.J. Vlaar, G. Nolet, M. J. R. Wortel, and S. A. Cloetingh, pp. 155-187, D. Reidel, Norwell, Mass., 1988.
Steck, L., Array analysis of 3-component teleseismic P and P coda waves for crustal structure at Long Valley Caldera, California, Ph.D. thesis, Dep. of Geol. Sci., Univ. of Calif., Santa Barbara, 1992.
Suemnicht, G. A., Results of deep drilling in the western moat of Long Valley, California, Eos Trans. AGU, 68, 785, 1987.
Thurber, C. H., Earthquake locations and three-dimensional crustal structure in the Coyote Lake area, central California, J. Geophys. Res., 88, 8226-8236, 1983.
Toks6z, M. N., C. H. Cheng, and A. Timur, Velocities of seismic waves in porous rocks, Geophysics, 41, 621-645, 1976.
Toomey, D. R., and G. R. Foulger, Tomographic inversion of local earthquake data from the Hengill-Grensdalur Central Volcano Complex, Iceland, J. Geophys. Res., 94, 17,497- 17,510, 1989.
Urn, J., and C. H. Thurber, A fast algorithm for two-point seismic ray tracing, Bull. Seismol. Soc. Am., 77, 972-986, 1987.
Wannamaker, P. E., P.M. Wright, Z. Zhou, X. Li, and J. Zhao, Magnetotelluric transect of Long valley caldera: Resistivity cross section, structural implications, and the limits of a 2-D analysis, Geophysics, 56, 926-940, 1991.
Zucca, J. J., P. W. Kasameyer, and J. M. Mills, Jr., Observation of a reflection from the base of a magma chamber in Long Valley Caldera, California, Bull. Seismol. Soc. Am., 77, 1674-1687, 1987.
E. L. Majer, T. V. McEvilly, and A. E. Romero, Jr., Center for Computational Seisinology, Earth Science Division, MS 50E, Lawrence Berkeley Laboratory, Berkeley, CA 94720.
A. Michelini, CNR-Instituto Talassografico Sperimentale, Viale Romolo Gessi 2, 34110, Trieste, Italy.
(Received December 3, 1992; revised June 9, 1993;
accepted June 15, 1993.)
Copyright © 2022 FDOKUMEN