Oxygen isotopic and geochemical evidence for a short-lived, high-temperature hydrothermal event in...
32
pumalofvokanoio~ andgeohemdremh ELSEVIER Journal of Volcanology and Geothermal Research 73 (1996) 213-244 Oxygen isotopic and geochemical evidence for a short-lived, high-temperature hydrothermal event in the Chegem caldera, Caucasus Mountains, Russia Carey Gazis a3 * , Hugh P. Taylor Jr. a, Ken Hon b, Andrei Tsvetkov ’ a Division of Geological and Planetary Sciences, 170-25. California Institute of Technology, Pasadena, CA 91125, USA b U.S. Geological Survey, MS 903, Federal Center, Denver, CO 80225, USA ’ Institute of Geology of Ore Deposits, Petrography, Mineralogy and Geochemistry, Russian Academy of Sciences, Moscow 109017, Russia Received 29 August 1995; accepted 11 February 1996 Abstract Within the 2.8 Ma Chegem ash-flow caldera (11 X 15 km), a single cooling unit of rhyolitic to dacitic welded tuff more than 2 km thick is exposed in deep valleys incised during recent rapid uplift of the Caucasus Mountains. The intracaldera tuff is mineralogically fresh and unaltered, and is overlain by andesite lavas and cut by a resurgent granodiorite intrusion. Major- and trace-element compositions for a 1405-m stratigraphic section of intracaldera tuff display trends of upwardly increasing Na,O, CaO, Al,O,, total Fe, MgO, TiO,, Sr and Zr and decreasing SiO,, K,O and Rb. This mafic-upward zoning (from 76.1 to 69.9% SiO,) reflects an inverted view of the upper part of the source magma chamber. Oxygen isotope studies of 35 samples from this 1405-m section define a striking profile with “normal” igneous PO values (+7.0 to + 8.5) in the lower 600 m of tuff, much lower 6180 values ( - 4.0 to + 4.3) in a 700-m zone above that and a shift to high 6’*0 values (+4.4 to + 10.9) in the upper 100 m of caldera-fill exposure. Data from two other partial stratigraphic sections indicate that these oxygen isotope systematics are probably a caldera-wide phenomenon. Quartz and feldspar phenocrysts everywhere have “normal” igneous 6180 values of about +8.5 and +7.5, respectively, whereas groundmass and glass 6180 values range from - 7.7 to + 12.3. Consequently, the 6’*0 values of coexisting feldspar, groundmass and glass form a steep array in a plot of &eldsparvs. 6groundmass,glass. Such pronounced disequilibrium between coexisting feldspar and groundmass or glass has never before been observed on this scale. It requires a hydrothermal event involving large amounts of 10w-‘~O H,O at sufficiently high temperatures and short enough time (tens of years or less) that glass exchanges thoroughly but feldspar does not. The most likely process responsible for the I80 depletions at Chegem is a very high temperature (500-6OO”C), short-lived, vigorous meteoric-hydrothermal event that was focused within the upper 750 m of intracaldera tuff. Mass balance calculations indicate fluid fluxes of = 6 X 10m6 molcm-2s-‘. We believe that the closest historical analogue to this Chegem hydrothermal event is the situation observed in the Valley of Ten Thousand Smokes * Corresponding author. Present address: Department of Earth Sciences, Dartmouth College, Hanover, NH, 037.55 USA. Fax: 603-646-3922. E-mail: [email protected]. 0377-0273/96/$15.00 Copyright 0 1996 Elsevier Science B.V. All rights reserved. PII SO377-0273(96)00023-6
-
Upload
hilo-hawaii -
Category
Documents
-
view
0 -
download
0
Transcript of Oxygen isotopic and geochemical evidence for a short-lived, high-temperature hydrothermal event in...
pumalofvokanoio~ andgeohemdremh
ELSEVIER Journal of Volcanology and Geothermal Research 73 (1996) 213-244
Oxygen isotopic and geochemical evidence for a short-lived, high-temperature hydrothermal event in the Chegem caldera,
Caucasus Mountains, Russia
Carey Gazis a3 * , Hugh P. Taylor Jr. a, Ken Hon b, Andrei Tsvetkov ’ a Division of Geological and Planetary Sciences, 170-25. California Institute of Technology, Pasadena, CA 91125, USA
b U.S. Geological Survey, MS 903, Federal Center, Denver, CO 80225, USA
’ Institute of Geology of Ore Deposits, Petrography, Mineralogy and Geochemistry, Russian Academy of Sciences, Moscow 109017, Russia
Received 29 August 1995; accepted 11 February 1996
Abstract
Within the 2.8 Ma Chegem ash-flow caldera (11 X 15 km), a single cooling unit of rhyolitic to dacitic welded tuff more
than 2 km thick is exposed in deep valleys incised during recent rapid uplift of the Caucasus Mountains. The intracaldera tuff is mineralogically fresh and unaltered, and is overlain by andesite lavas and cut by a resurgent granodiorite intrusion. Major- and trace-element compositions for a 1405-m stratigraphic section of intracaldera tuff display trends of upwardly increasing Na,O, CaO, Al,O,, total Fe, MgO, TiO,, Sr and Zr and decreasing SiO,, K,O and Rb. This mafic-upward zoning (from 76.1 to 69.9% SiO,) reflects an inverted view of the upper part of the source magma chamber. Oxygen isotope studies of 35 samples from this 1405-m section define a striking profile with “normal” igneous PO values (+7.0 to + 8.5) in the lower 600 m of tuff, much lower 6180 values ( - 4.0 to + 4.3) in a 700-m zone above that and a shift to high 6’*0 values (+4.4 to + 10.9) in the upper 100 m of caldera-fill exposure. Data from two other partial stratigraphic sections indicate that these oxygen isotope systematics are probably a caldera-wide phenomenon. Quartz and feldspar phenocrysts everywhere have “normal” igneous 6180 values of about +8.5 and +7.5, respectively, whereas groundmass and glass 6180 values range from - 7.7 to + 12.3. Consequently, the 6’*0 values of coexisting feldspar, groundmass and glass form a
steep array in a plot of &eldspar vs. 6groundmass,glass. Such pronounced disequilibrium between coexisting feldspar and groundmass or glass has never before been observed on this scale. It requires a hydrothermal event involving large amounts of 10w-‘~O H,O at sufficiently high temperatures and short enough time (tens of years or less) that glass exchanges thoroughly but feldspar does not. The most likely process responsible for the I80 depletions at Chegem is a very high temperature (500-6OO”C), short-lived, vigorous meteoric-hydrothermal event that was focused within the upper 750 m of intracaldera tuff. Mass balance calculations indicate fluid fluxes of = 6 X 10m6 molcm-2s-‘. We believe that the closest historical analogue to this Chegem hydrothermal event is the situation observed in the Valley of Ten Thousand Smokes
* Corresponding author. Present address: Department of Earth Sciences, Dartmouth College, Hanover, NH, 037.55 USA. Fax: 603-646-3922. E-mail: [email protected].
0377-0273/96/$15.00 Copyright 0 1996 Elsevier Science B.V. All rights reserved. PII SO377-0273(96)00023-6

214 C. Gazis et ul./Joumal of Volcanology and Geothermal Research 73 (19%) 213-244
(Alaska, USA), where hundreds of steam fumaroles with measured temperatures as high as 645°C persisted for 10 to 15
years in the much smaller welded ash-flow tuff sheet ( = 200 m thick) produced by the 1912 Katmai eruption.
Kewvordst oxygen isotope; ash-flow tuff; water-rock interaction; hydrothermal event: fumarole; Chegem caldera; Caucasus
1. Introduction
Because they represent a massive, rapid emptying
of the upper parts of a large magma chamber, thereby producing an “upside-down” version of the original
magma system (e.g., Smith, 1979; Hildreth, 1979,
1981), ash-flow tuffs and other pyroclastic deposits
erupted from major calderas provide a “snap-shot”
of a specific stage in the evolution of silicic crustal
magma chambers. Most previous geochemical stud-
ies of such calderas have focused on outflow sheets
rather than the thick intracaldera deposits (which are
more susceptible to post-depositional alteration).
However, Fridrich et al. (1991) demonstrated that
intracaldera tuffs can provide useful information
about magma chamber evolution, even in mid-Ter-
tiary calderas. Here, we present results of a geo-
chemical study of a much younger and better pre-
served caldera located in the northern Caucasus
Mountains (Russia).
Principally because of its combination of youth,
exposure and simplicity, the Chegem caldera pre-
sents a unique research opportunity. Although it is
only 2.8 million years old (Gazis et al., 1995), more
than a 2-km-thick section of caldera fill is now
exposed as a result of recent rapid uplift and deep
erosion in the Caucasus Mountains. In addition, the
Chegem caldera has a relatively simple structural and eruptive history: the caldera fill consists of a
single cooling unit of welded tuff with sub-horizon- tal bedding; there is no evidence for pre-caldera
volcanism, nor has there been extensive post-caldera
hydrothermal alteration. In other words, this particu- lar “snap-shot” of the upper part of an inverted magma chamber is exceptionally well exposed and well preserved.
Oxygen isotope studies are useful for determining both the petrogenesis of an igneous rock and the extent of its interaction with water. Whole-rock 6”O values for unaltered igneous rocks are normally be- tween +6 and + 10 (Taylor, 1968). Interaction and
exchange with water can either lower (e.g., at high
temperatures) or raise (e.g., at low temperatures)
these 6’*0 values, depending on the degree of equi- libration, the temperature of exchange, and the iso-
topic composition and amount of water. Assimilation
of country rock by a magma or exchange of isotopes with the country rock (usually mediated by an aque-
ous fluid) can also raise or lower the 6’*0 value of a
body of magma.
Previous oxygen isotope studies of ash-Bow
calderas (e.g., Lipman and Friedman, 1975; Lambert
and Epstein, 1980; Hildreth et al., 1984; Larson and
Taylor, 1986a,b; Johnson et al., 1990; Smith and Suemnicht, 1991) have documented a variety of
interactions with water. For example, Hildreth et al. (1984) observed ” 0 depletions in quartz and feldspar
from several generations of post-collapse lavas at
Yellowstone. Because the measured lx O/ I60 frac- tionations between coexisting quartz and feldspar in
these lavas recorded equilibration at magmatic tem-
peratures, Hildreth et al. (1984) concluded that these rocks crystallized from low- I8 0 magmas and that the
“0 depletions were caused by direct interaction
between the magma and meteoric water. However,
Taylor (1985, 1987) proposed that these IRO deple- tions were the result of assimilation or melting of
low-‘*0 country rocks that had previously ex-
changed oxygen with meteoric-hydrothermal fluids, and in a more recent study Hildreth et al. (1991) now also concur in this general model.
Bacon et al. (1989) present direct evidence that, prior to ash-flow eruption, there was a lowering of
6’*0 in the magma at Crater Lake, Oregon, by assimilation of 10w-‘~O country rocks. They ob- served partially fused low- “0 granitoid blocks that were ejected during the climactic eruption and that the low- I80 quartz, plagioclase, and glass in par- tially fused blocks were in high-temperature isotopic equilibrium. Lipman and Friedman (1975) in their study of the Timber Mountain caldera in the South- west Nevada caldera complex, also demonstrated
C. Gazis et al./ Journal of Volcanology and Geothermal Research 73 (1996) 213-244 215
that “‘0 depletions of very large sized batches of
ash-flow tuff magma had occurred just prior to erup-
tion. Oxygen isotopic studies of a number of other
calderas have revealed no evidence for pre-eruptive
“0 lowering. For example, the Questa, New Mex-
ico, and Grizzly Peak, Colorado, calderas (Johnson
et al., 1990), the Central Nevada caldera complex
and numerous systems in the San Juan Mountains,
Colorado (Larson and Taylor, 1986b), and the Super-
stition-superior volcanic area, Arizona (Stuckless
and O’Neil, 1973), all have erupted ash-flows and
lavas with essentially unaltered igneous isotopic sig-
natures. Others, like Lake City, Colorado (Larson
and Taylor, 1986a). Long Valley, California (Smith and Suemnicht, 19911, and Valles, New Mexico
(Lambert and Epstein, 19801, have experienced ex-
tensive post-collapse, sub-solidus “0 depletions dur-
ing hydrothermal alteration.
Chegem igneous rocks; such data are essential in
understanding the stratigraphy and eruption history of a set of ash-flow deposits. Inasmuch as most (if
not all) large-volume silicic magma chambers be-
come compositionally zoned in major and trace ele-
ments prior to eruption, the compositions of the
pyroclastic products can in principle be used to infer
their original positions within the magma chamber,
most successfully done if pumices rather than whole
rocks are studied (e.g., Lipman, 1967). The com-
monly observed mafic-upward zoning in tuff se-
quences [e.g., Long Valley, California (Hildreth,
1979) and Grizzly Peak, Colorado (Fridrich et al.,
199111 is believed to represent progressive down-
ward tapping of a compositionally layered magma
chamber in which the top was the most silicic part of
the system.
Thus, examination of oxygen isotope systematics
has identified basically three end-member types of
situations that are associated with ash-flow tuff
calderas: (1) extensive sub-solidus hydrothermal ‘* 0 exchange, particularly along ring fractures and adja-
cent resurgent intrusions; (21 essentially “dry” sys-
tems where the primary magma 6’*0 values are all
largely preserved (except where they have been lo-
cally modified by low-temperature hydration or de-
vitrification of volcanic glass); (3) lo~-‘~O magmas
and coexisting low- ‘* 0 phenocrysts; the develop-
ment of such magmas is commonly associated with
large meteoric-hydrothermal systems, which also give rise to situation (1).
2. Geologic setting
In this paper, we present oxygen isotope analyses
of 134 samples from within and around the Chegem caldera, including 38 samples collected from a 1405
m stratigraphic section of intracaldera tuff. Within
this section we identified a zone of low- “0 rocks which display extreme isotopic disequilibrium be-
tween phenocrysts and coexisting groundmass. As will be discussed below, we now believe that this
represents a fourth end-member type that should be
added to the above list. We shall also discuss why
this fourth type may be very difficult to recognize in nature, except in historical eruptions or in very well preserved caldera complexes.
The 2.8 Ma Chegem caldera (Bogatikov et al.,
1992; Lipman et al., 1993) is exposed in an 11 X 1.5
km area of the north-central Caucasus Mountains, a
cratonic collision zone in southern Russia. It is the
only known ash-flow caldera in the region, consist- ing of a single complex cooling unit of densely
welded tuff which ranges in composition from rhy-
olitic at the lowermost exposure to dacitic at the top.
There are no obvious erosional breaks in this unit,
but there are horizons of more poorly welded tuff
indicating that there were some short hiatuses in the chain of eruptions that created this deposit. However,
cooling joints and structures pass across these hori-
zons, indicating that the entire mass of intracaldera
tuff cooled as a unit.
The intracaldera tuff is erosionally overlain by
glacial till, which in turn is overlain by andesitic lavas, preserved in the southern and western parts of
the caldera. In the northeast quadrant of the caldera, the tuff is cut by and in fault contact with a granitic
to granodioritic porphyry intrusion that has pushed
up in piston-fashion a large block of the tuff. Out-
flow tuff remnants as large as 25 X 7 km are ex- posed up to 50 km to the north of the northern caldera margin.
In addition to the ‘*O/ I60 data, we also present 40Ar/ ‘9Ar total fusion ages of biotite and sanidine major- and trace-element compositions for the from the base, top and interior of the intracaldera

216 C. Gazis et al./Joumal of Volcanology and Geothermal Research 73 (1996) 213-244
tuff, and from the outflow tuff, are analytically indis-
tinguishable at 2.82 f 0.02 Ma (Gazis et al., 1995).
Sanidine from the cross-cutting porphyry intrusion
yielded a similar age (2.84 f 0.03 Ma) as did an
incrementally heated whole-rock andesite (2.82 f
0.02 Ma), indicating that the Chegem Tuff was
erupted, deposited, intruded, eroded and covered by
andesite flows in a relatively short time, probably
less than 50,000 yr (Gazis et al., 199.5).
3. Analytical methods
Unweathered samples (= 1 kg) were collected
from within and around the Chegem caldera (Fig. 1).
As the terrain is rather rugged, sampling was mainly
confined to the more accessible parts of the caldera
(i.e., along the Chegem River). Efforts were made to
sample a complete stratigraphic section of caldera
fill, as well as to collect samples from all identifiable
lithologies and near all major structural features.
The main stratigraphic section discussed in this
paper (Section 1, Fig. 1) is located on the southeast
side of the caldera near Mt. Kum Tyube, and spans a
vertical range of 1405 m of compositionally zoned
tuff, locally overlain by 310 m of andesitic lavas. As
the sampled section is traversed radially inward from
the margin of the caldera, it samples progressively
upward in the stratigraphic column. Thus, the strati-
graphically higher samples are also more distant
/
0 1 2 3 4km i ‘)c-,
/
1 r /
,
I
I
\
L
,,’
I I
\
Pliocene Deposits of the
Upper Chegem River Area:
IUB Andesite Flows
cl Glacial Deposits
q Granodiorite
Chegem Tuff:
Upper Dacite
cl Lower Rhyolite
-r_.. . Fault
(dashed where approximately
located, dotted where concealed)
---- Contact
(dashed where approxlmateiy located)
River
- Foliation in welded tuff
. Sample location
Fig. 1. Geologic map of the Chegem caldera (modified after Lipman et al., 1993). 0 = sample locations; sections 1, 2 and 3 are
stratigraphic sections which were sampled in detail, and are discussed in the text.
C. Gazis et al./ Journal of Volcanology and Geothermal Research 73 (1996) 213-244 217
from the caldera margin, conceivably injecting a bias into the geochemical data. Two other partial strati- graphic sections were sampled, one on the east side of the caldera (Section 2, Fig. 1) up a side drainage of the main Dzhilgusu drainage, and one in the upper dacitic tuff horizons southwest of Kum Tyube Peak (Section 3, Fig. 1).
Whole-rock samples selected for oxygen isotope analysis were crushed in a mortar and pestle. Mineral separates were obtained by hand-picking = 50 mg of the given mineral from a 35-50 mesh fraction of the ground sample. The fluorination technique used for oxygen isotope analyses is essentially that de- scribed in Taylor and Epstein (1962). Sample gases were analyzed at Caltech with either a McKinney- Nier mass spectrometer or a Finnegan MAT 252 mass spectrometer and compared to the laboratory Rose Quartz standard. Oxygen isotope ratios are reported in the familiar ¬ation as per mil differ- ence from SMOW (standard mean ocean water). &values on this scale for NBS-28 and the Caltech Rose Quartz standard are + 9.60 and + 8.45, respec- tively. Analytical precision is better than f 0.15%0 (la).
In preparation for major- and trace-element analy- sis, lithic fragments were removed from whole-rock samples, and these or pumice samples were pulver- ized to = 200 mesh in a ceramic shatterbox. The
200 $ 0 70 72 74 76 78
Wt%
powders were fused into glass disks for major-ele- ment analysis and pressed into pellets for trace-ele- ment analysis at the U.S. Geological Survey. Major- element oxides were analyzed using wavelength X- ray fluorescence spectrometry, as described by Tag- gart et al. (1987). Accuracy for most of the major elements in concentrations found in the Chegem rocks is f 1%. The trace elements (Sr, Rb, Zr) were determined by energy dispersive X-ray fluorescence with an accuracy of +5% for Rb and than 10% for Zr (Yager and Quick, major- and trace-element data tables sented in Gazis et al. (in prep.).
Sr and better 1992). These will be pre-
4. Results
4.1. Mineralogy and major- and trace-element com- positions
4.1.1. Intracaldera stratigraphy The intracaldera Chegem Tuff is best character-
ized by the sampled section on the east side of Mt. Kum Tyube (Section 1, Fig. 1) that ranges from 2080 to 3485 m in elevation. Although this section spans more than 1400 m, it fails to expose the base of the intracaldera tuff, which is probably at least 2 km thick. The intracaldera ash-flow sequence con-
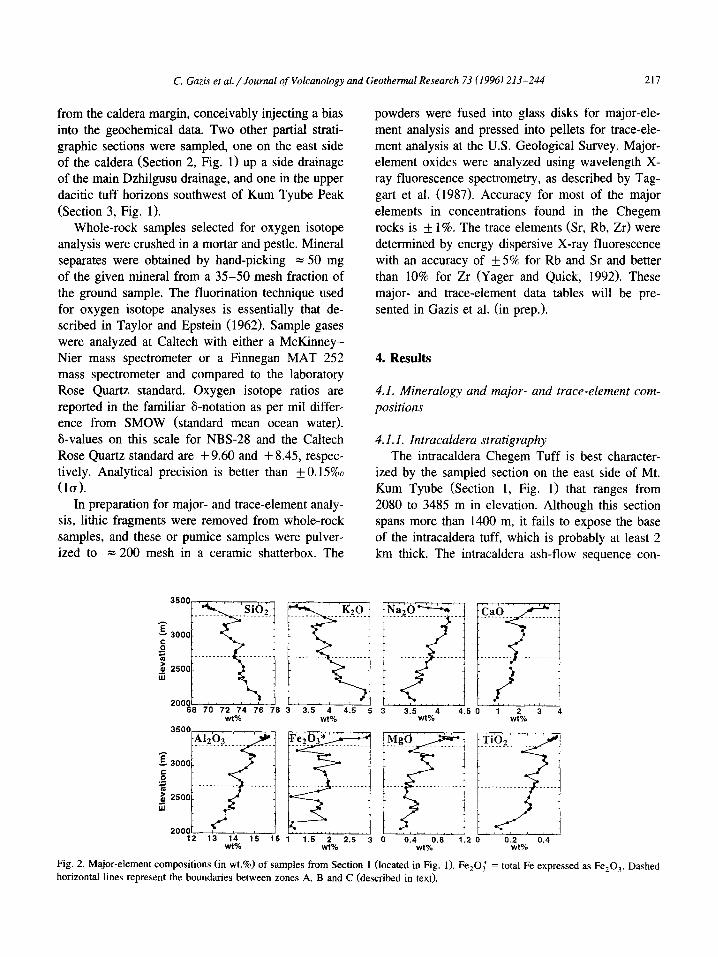
Fig. 2. Major-element compositions (in wt.%) of samples from Section 1 (located in Fig. 1). Fe,O; = total Fe expressed as Fe,O,. Dashed
horizontal lines represent the boundaries between zones A, B and C (described in text).
218 C. Gazis et al./Joutnal of Volcanology and Geothermal Research 73 (1996) 213-244
sists mainly of densely welded, devitrified tuff that is
zoned upward from rhyolite to dacite. Crude, mas-
sive layers are defined by flattened pumices, and
these also grade upwards from rhyolitic to dacitic.
Densely welded, vitrophyric rhyolite tuff occurs
along the margins of the caldera fill, usually low in
the stratigraphic sequence. The upper dacitic tuffs
contain at least two, and possibly three, distinct
cooling sub-units that are 30-50 m thick. Cooling
breaks are defined by 2-3 m zones of flattened
vitrophyric pumice at the base of each sub-unit.
The Chegem Tuff generally contains = 20% phe-
nocrysts, varying from predominantly quartz and
sanidine in the basal rhyolites to predominantly bi-
otite, augite and plagioclase in the upper dacitic
horizons. Corresponding to these systematic changes
in the modal phenocryst abundances, there are dis-
tinct trends in major- and trace-element composition.
Major-element compositions of the whole-rock
samples in Section 1 are shown in Fig. 2: SiO,
ranges from 76.1 wt.% at the base to 69.9 wt.% just
below the andesite flows, decreasing upward in a
generally monatonic fashion. There is a correspond-
ing upward decrease in K,O and increase in Al,O,,
Na,O, CaO, and MgO. Total Fe (as Fe,O,) also
increases upward, but in a very erratic fashion. The
Na,O content drops abruptly in the uppermost dacitic
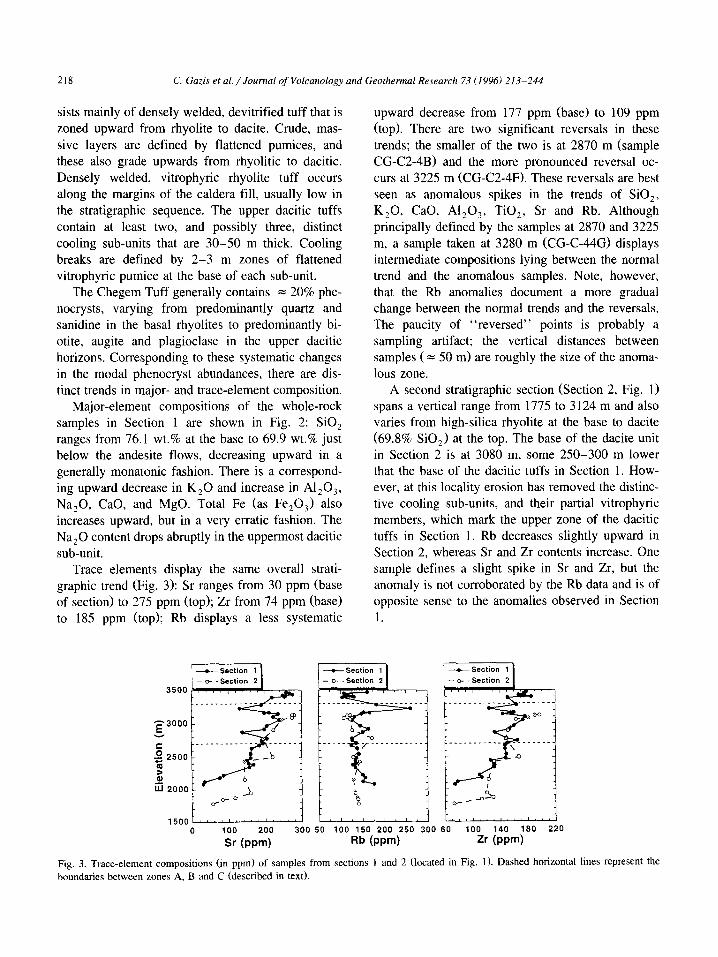
sub-unit. Trace elements display the same overall strati-
graphic trend (Fig. 3): Sr ranges from 30 ppm (base
of section) to 275 ppm (top); Zr from 74 ppm (base) to 185 ppm (top); Rb displays a less systematic
upward decrease from 177 ppm (base) to 109 ppm
(top). There are two significant reversals in these
trends; the smaller of the two is at 2870 m (sample
CG-C2-4B) and the more pronounced reversal oc-
curs at 3225 m (CG-C2-4F). These reversals are best
seen as anomalous spikes in the trends of SiO,,
K,O, CaO, Al,O,, TiO,, Sr and Rb. Although
principally defined by the samples at 2870 and 3225
m, a sample taken at 3280 m (CG-C-44G) displays intermediate compositions lying between the normal
trend and the anomalous samples. Note, however,
that the Rb anomalies document a more gradual
change between the normal trends and the reversals.
The paucity of “reversed” points is probably a
sampling artifact; the vertical distances between
samples ( = 50 m) are roughly the size of the anoma-
lous zone. A second stratigraphic section (Section 2, Fig. 1)
spans a vertical range from 1775 to 3 124 m and also varies from high-silica rhyolite at the base to dacite
(69.8% SiO,) at the top. The base of the dacite unit
in Section 2 is at 3080 m, some 250-300 m lower
that the base of the dacitic tuffs in Section 1. How-
ever, at this locality erosion has removed the distinc-
tive cooling sub-units, and their partial vitrophyric
members, which mark the upper zone of the dacitic
tuffs in Section 1. Rb decreases slightly upward in
Section 2, whereas Sr and Zr contents increase. One sample defines a slight spike in Sr and Zr, but the
anomaly is not corroborated by the Rb data and is of
opposite sense to the anomalies observed in Section
I.
-Section 1
- D -Section 2
0 100 200 300 50 100 150 200 250 300 60 100 140 160 220
9 kvm) Rb (wm) Zr @pm)
Fig. 3. Trace-element compositions (in ppm) of samples from sections I and 2 (located in Fig. 1). Dashed horizontal lines represent the
boundaries between zones A, B and C (described in text).
C. Gazis et al./ Journal of Volcanology and Geothermal Research 73 (1996) 213-244 219
The mafic-upward zoning displayed in the
Chegem Tuff probably represents downward tapping
of the upper levels of a compositionally layered
magma chamber during eruption, as has been in-
ferred for many other ash-flow tuffs (e.g., Smith and
Bailey, 1966; Smith, 1979; Hildreth, 1979, 1981;
Fridrich et al., 1991). However, note that the whole-
rock major- and trace-element compositions dis-
cussed here are bulk-tuff values that represent the
average mixtures of erupted pumice compositions.
Analyses of twenty pumices collected from
throughout the sections of intracaldera and outflow
tuff show the same range of variation (69.0-76.6
wt.% SiO,) as the whole-rock tuff samples. Pumice
fragments in the high-silica rhyolites are typically
extremely small and difficult to collect; nevertheless,
two such pumices showed a range from 76.6 to 74.5
wt.% SiO,, although part of the variation may be
error related to the small sample sizes. The low-silica
rhyolite tuffs contain the complete spectrum of
pumice compositions from 75.4 to 69.0 wt.% SiO,. In contrast, the pumices from the dacitic tuffs display
a restricted range of SiO, (69.2-72.9 wt.% SiO,).
Thus, the anomalous compositional reversals ob-
served in the low-silica rhyolites in Section 1 appear to reflect changes in the mixture of erupted pumices,
probably related to eruptions from separate vents
and/or to fluctuations in the level of tapping of the sub-caldera magma chamber.
4.1.2. Outjlow stratigraphy The outflow tuff sheet, whose remnants are ex-
posed 10 to 50 km away from the Chegem caldera,
contains only part of the sequence observed in the intracaldera section. Lower parts of the outflow sheets
are typically covered by talus and poorly exposed, and the tops of the outflow tuff remnants are invari-
ably eroded. As with the intracaldera Chegem Tuff,
phenocrysts consist of quartz, feldspar and biotite, and the outflow tuff also becomes more crystal-rich
and more biotite-rich upward. The two most com-
plete sections of outflow tuff are about 200 m thick
and correlate with the lower part of the intracaldera stratigraphic section in their major- and trace-ele- ment contents (SiO, = 73.0-76.6 wt.%; Sr = 12-161
ppm; Zr = 66-132 ppm). These ranges correspond most closely with the lower 600 m of caldera fill (zone A, described below) although some of the
anomalous spikes in the central part of Section 1 also
have comparable major- and trace-element composi-
tions.
4.1.3. Resurgent intrusion and post-collapse lavas The porphyry intrusion in the northeastern quad-
rant of the Chegem caldera contains 30-40% phe-
nocrysts of plagioclase (andesine), with lesser
amounts of resorbed quartz, sanidine, biotite, augite
and magnetite in a microcrystalline, granophyric
groundmass of quartz and feldspar. It ranges from
fine-grained granite at its borders to coarser-grained
granodiorite in its interior; this granodiorite is similar
in both major- and trace-element composition to the
dacitic tuff units (SiO, = 70.3-71.9 wt.%, Sr =
193-239 ppm and Zr = 141-188 ppm).
The post-collapse lavas which cap the intracaldera
Chegem Tuff range from andesite to mafic dacite
with 1 O-40% phenocrysts of plagioclase (andesine-
labradorite), pyroxene (mainly hypersthene), amphi-
bole, and rare biotite. Major and trace elements of the andesites indicate that they are much more mafic
than any of the Chegem ash-flow tuffs, with SiO, =
63.0-64.4 wt.%, Sr = 221-350 ppm and Zr = 149-
221 ppm.
4.2. Oxygen isotopes
Oxygen isotopic compositions for the igneous rocks of the Chegem caldera and some of the nearby
country rocks are presented in Table 1.
4.2.1. Intracaldera stratigraphy Measured whole-rock, quartz, feldspar, glass, and
groundmass 6’*0 values for the 1405 m of Section 1
(Fig. 4) define an elevation profile in which the
lower half and top have relatively high 6l*O values, whereas the whole-rock and groundmass samples of
the intermediate zone exhibit very low 6l*O values.
Quartz phenocrysts and all but two of the feldspar
phenocrysts throughout the caldera have relatively
constant St80 values of + 8.5 k 0.2 and + 7.7 + 0.4,
respectively (mean, std. dev.). In contrast, whole-rock 6”O values range from -4.0 to + 12.1, and mea- sured 6180 values of separated groundmass and glass span an even wider range ( - 7.7 to + 10.9). The two samples of feldspar phenocrysts that are slightly I80 depleted (at El80 = +5.2 and +5.9) both come

220 C. Gazis et al. /Journal of Volcanology and Geothermal Research 73 (19961213-244
Table I Oxygen isotope results
Sample Rock type, location and elevation 6’80 (%oo)
(if) Wr a Qtz Feld b Other ’
Stratigraphic sections: Section I-SE side qf caldera CG-C2-4S
CG-C2-4T
CG-C2-4Q,R
CG-C-44A
CG-C2-4P
CG-C-44B
CG-C-44C
CG-C-44D
CG-C2-40
CG-C-44E
CG-C2-4N
CG-C2-4M
CG-C-44F
CG-C2-4E
CG-C2-4D
CG-C2-4C
CG-C2-4B
CG-C2-4A
CG-C2-4L
CG-C2-4K
CG-C2-4K2
CG-C2-4J
CG-C2-41
CG-C2-4H
CG-C2-4G
CG-C2-4F
CG-C-44G
CG-C-44H
CG-C-441
CG-C-44J
CG-C-44K
CG-C-44L
CG-C-44M
CG-C-44N
CG-C-440
CG-C-44P
CG-C-44Q
vitrophyre, contact w/metamorphic rocks, 2080 m
vitrophyre, 2080 m
vitrophyre, 2 120 m
welded rhyolitic tuff, 2 180 m
white altered tuff, 2220 m
welded tuff, 2340 m
welded tuff, 2380 m
welded tuff, 2400 m
fresh grey tuff, 2450 m
welded tuff, 2490 m
partly altered tuff, 2550 m
fresh red-brown tuff, 2630 m
fresh red-brown tuff, 2680 m
welded tuff, 27 10 m
welded tuff, 2750 m
welded tuff w/pumices, 2780 m
welded tuff, 2870 m
welded tuff, 29 15 m
grey partly altered tuff, 2965 m
fresh grey tuff, 3050 m
fresh grey tuff, 3050 m
fresh grey tuff, 3 100 m
fresh grey tuff, 3 145 m
white poorly welded tuff, 3 160 m
fresh grey tuff, bio-rich, 3 165 m
fresh grey tuff, bio-rich, 3225 m
fresh grey tuff, bio-rich, 3280 m
fresh grey tuff, bio-rich, 3390 m
partial vitro., 3400 m
partial vitro., 3410 m
welded tuff, 3420 m
partial vitro., 3430 m
welded tuff, 3450 m
welded tuff, 3465 m
poorly welded tuff, 3485 m
andesite flow, 3490 m
andesite flow, 3775 m
8.4
8.6
8.7
7.6
6.7, 6.9
8.0
7.9
7.9
7.9
8.3
7.8
8.0
7.8
7.0
4.0
6.1
2.9
2.2
3.0
- 1.9
- 1.0
2.5
-2.1
- 3.9
-4.1
8.6(P)
8.5
8.5 7.6 8.4(GM)
8.3 7.5
7.9, 8. I 5.2
- O.S(GM)
- 0.4(GM)
7.1 5.9
8.4
- 7.7, - 7.O(GMJ
- 4.8, -7.6(P),
6SLF)
-0.3
-0.5
2.7. 3.0
4.3
7.7, 8.2
4.4, 4.6
6.5, 6.5
9.5
8.2 8.1
8.5 7.2
8.4
9.4
10.3, 10.9
7.9
7.5
8.5 7.6
4.5(G)
I .4, 2.5(G)
5.6(P)
9.3(P), 7.8(G),
9.8(GM)
8.7(GM)
12.3(GMJ, 5.6 (B)
Partial stratigraphic sections: Section 2-E side of caldera KH91-2B bio-rich tuff, local summit, 3 I24 m
KH91-3 tuff, NW of KH91-2, = 3120 m
KH9 1-4 darker tuff, 3080 m
KH9 l-9 tuff, close to fault, 3030 m
CG-C2-35 slightly altered tuff, 2900 m
CG-C2-34 tuff, 2780 m
CG-C2-38 tuff, saddle E of fault, 2500 m
3.0
I .4
2.5
1.7
7.8
8.4
6.8
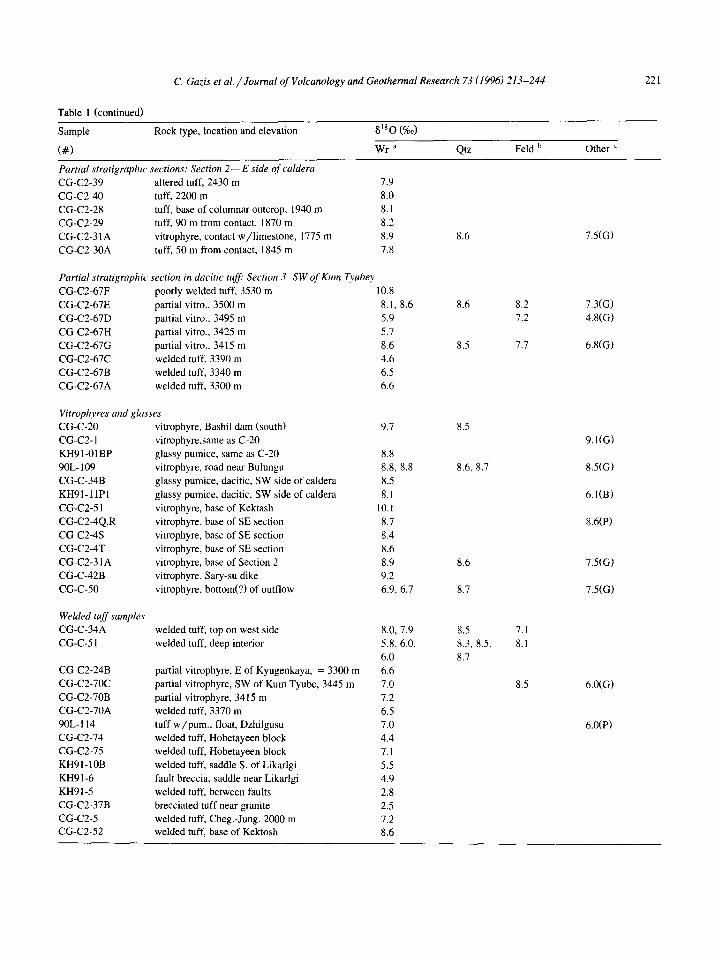
C. Gazis et al./ Journal of Volcanology and Geothennal Research 73 (1996) 213-244 221
Table 1 (continued)
Sample Rock type, location and elevation 8’80 (“loo)
(#I Wr a Qtz Feld b Other L
Partial stratigraphic sections: Section 2-E side of caldera CG-C2-39 altered tuff, 2430 m 7.9
CG-C2-40 tuff, 2200 m 8.0
CG-C2-28 tuff, base of columnar outcrop, 1940 m 8.1
CG-C2-29 tuff, 90 m from contact, 1870 m 8.2
CG-C2-31A vitrophyre, contact w/limestone, 1775 m 8.9
CG-C2-30A tuff, 50 m from contact, I845 m 7.8
Partial stratigraphic section in dacitic tu$ Section 3-SW of Kum Tvubey CG-C2-67F poorly welded tuff, 3530 m 10.8
CG-C2-6lE partial vitro., 3500 m 8.1. 8.6
CG-C2-67D partial vitro., 3495 m 5.9
CG-C2-67H partial vitro.. 3425 m 5.1
CG-C2-67G partial vitro., 3415 m 8.6
CG-C2-67C welded tuff, 3390 m 4.6
CG-C2-67B welded tuff, 3340 m 6.5
CG-C2-67A welded tuff, 3300 m 6.6
Vitrophyres and glasses CG-C-20 vitrophyre. Bashil dam (south)
CG-CZ- 1 vitrophyre.same as C-20
KH91-OlBP glassy pumice, same as C-20
9OL- 109 vitrophyre, road near Bulungu
CG-C-34B glassy pumice, dacitic, SW side of caldera
KH91-llP1 glassy pumice, dacitic, SW side of caldera
CG-C2-5 1 vitrophyre, base of Kektash
CG-C2-4Q,R vitrophyre, base of SE section
CG-C2-4S vitrophyre, base of SE section
CG-C2-4T vitrophyre, base of SE section
CG-C2-3 1 A vitrophyre, base of Section 2
CG-C-42B vitrophyre, Sary-su dike
CG-C-50 vitrophyre, bottom(?) of outflow
9.7
8.8
8.8, 8.8
8.5
8.1
10.1
8.7
8.4
8.6
8.9
9.2
6.9, 6.7
Welded tuff samples CG-C-34A welded tuff, top on west side
CG-C-5 1 welded tuff, deep interior
CG-C2-24B partial vitrophyre, E of Kyugenkaya, = 3300 m
CG-C2-7OC partial vitrophyre, SW of Kum Tyube, 3445 m
CG-C2-70B partial vitrophyre, 34 15 m
CG-C2-70A welded tuff, 3370 m
9OL-114 tuff w/pum., float, Dzhilgusu
CG-C2-74 welded tuff, Hobetayeen block
CG-C2-75 welded tuff, Hobetayeen block
KH91-IOB welded tuff, saddle S. of Likarlgi
KH91-6 fault breccia, saddle near Likarlgi
KH91-5 welded tuff, between faults
CG-C2-37B brecciated tuff near granite
CG-C2-5 welded tuff, Cheg.-Jung. 2000 m CG-C2-52 welded tuff, base of Kektosh
8.0, 7.9
5.8, 6.0,
6.0
6.6
7.0
7.2
6.5
7.0
4.4
7.1
5.5
4.9
2.8
2.5
7.2
8.6
8.6 7.5(G)
8.6 8.2 7.3(G)
7.2 4.8(G)
8.5 7.7
8.5
8.6, 8.7
8.6 7.5(G)
8.7 7.5(G)
8.5 7.1
8.3. 8.5, 8.1
8.7
8.5 6.0(G)
6.8(G)
9.1(G)
8.5(G)
6.1(B)
8.6(P)
6.0(P)

222
Table 1 (continued)
C. Gazis et al. /Journal of Volcanology and Geothermal Research 73 11996) 213-244
Sample Rock type, location and elevation 8’8 0 (%Joc)
(#) Wr ‘l
Welded tuff samples from block near intrusion CC-C-53B welded tuff, next to intrusion 6.8
CG-C-58B welded tuff, next to intrusion 1.3, 1.6,
CG-CZ 14 welded tuff, 3110 m 5.9
CC-C2-I 3 welded tuff, south of Likarilgi 7.0
KH91-8 welded tuff, contact w/granite 4.4
CG-CZ-15 welded tuff, 3330 m 2.0
KH91-1OC welded tuff, 3030 m 5.5
CG-C2-12 welded tuff, 3400 m 7.5
Section from Likarilgi westward to saddle (fault) near Mt. Kygenkaya
Qtz
8.5
Feld b Other ‘
CG-C2-10 welded tuff, Likarilgi, 3430 m 7.9
CG-C-54 welded tuff 6.5
CG-C-55 welded tuff 5.2
CC-C2-18 welded tuff 4.2
CG-C2-17A welded tuff, 3360 m -0.3
CG-C2-17B black tuff, float 3360m -4.6, -4.5
CG-C2-16 welded tuff, 3345 m 2.6
CG-C2-27 welded tuff 1.6
CG-C2-26 welded tuff, 3365 m 1.9, 1.5
CG-C2-25 welded tuff, 3310 m 2.4
CG-C2-24C welded tuff, 3200 m, saddle 1.4
CG-C2-24A welded tuff, 3205 m, saddle 1.8
outjlow tuff CG-C-47A
CG-C-47B
CO-C-50
9OL-117A
9OL-I 17B
9OL- 117c
9OL- 127C
9OL- 119P4
9OL- 12OP7
9OL-119A
CG-C-46
tuff, Lechnikaya, top of exposure
tuff, 100 m below 47A
vitrophyre, base of Teraklan
tuff, lowest-Lechnikaya
tuff, Lech., 3 m above A
partial vit., Lech., higher up
basalt, base(?) of outflow
pumice, Lechnikaya
pumice, Lechnikaya
tuff, Lechnikaya
tuff, Kaminka quarry
5.7
8.2
6.9, 6.7
5.5
4.4
6.4
7.3
5.3
Granodiorite porphyr)’ intrusion CC-C-53A granodiorite, edge of intrusion
CG-C-57 granodiorite, away from edge
CG-C-58A granodiorite, edge of intrusion
CG-C2-I9A granite, border, near inclus.
CG-C2- 19C granite, border
CG-C2-19D granite, 100 m from contact
C2-19B andesite incl., border
CG-C2- 1 I granodiorite, 2960 m (low)
0.X-56 granodiorite, 3020 m
CG-C2-37A granite, quenched near fault
4.8
5.0
3.8, 3.5
1.3
6.5
4.6
5.9
6.2
3.9
1.6
Andesite, diorite KH91-16 andesite flow, Kyugenkaya
CG-C2-2 diorite, inclusion in float
CG-C-44P andesite flow, SE section 3490 m
1.5
6.6
7.9
5.5 7.2, - 6.9(GM)
8.4 7.2 5.8,5.6(P)
8.7
8.4
8.1
8.5
85(xeno)
6.8(S)
7.8(S)
8.1(S)
8.2 7.0
8.6 6.8
8.5 7.0
8.3 7.3
8.2 6.6
7.4
7.5(G)
4.6(GM)
3.8(GM)
6.O(GM), 7.4(G)
2.7(GM)
6.O(GM)
5.9(GM)
3.5(GM)

C. Gazis et al. /Journal of Volcanology and Geothermal Research 73 (1996) 213-244 223
Table 1 (continued)
Sample Rock type, location and elevation s’*o (%0)
(#)
Andesite, diorite CG-C-44Q CG-CZ-68D
andesite flow, SE section 3775 m
andesite, little Kum Tyube
Wr a
7.5
1.2
Qtz Feld b
7.5
Other ’
Country rock CG-C-40
CG-C-4 1
CG-C-42D
CG-C-60C
CG-C-60B
CG-C-60A
CG-C-63B
CG-C2-31B
CG-C2-32
CG-C2-33
granite, several km west of caldera
gneiss, several km west of caldera
granite, near Sary-su dike
limestone, 4 m from ring fault
limestone, 18 m from ring fault
limestone, 30 m from ring fault
limestone, far from fault
limestone, caldera margin, fault
limestone, 100 m away from fault
limestone , = 1 km from fault
8.7
8.1
8.2
29.1 613C = 3.8
29.4 6’3C = 3.9
29.9 6’3C = 3.9
28.5 6’3C = 3.7 27.8 6’3C = 2.7
30.2 6’3C = 4.0
27.4 6°C = 3.9
All 6r”O values are expressed as per mil differences from Standard Mean Ocean Water. GM = groundmass; P = pumice (whole, including
phenocrysts); B = biotite; LF = lithic fragment; 613C expressed as per mil difference from PeeDee Belemnite (PDB) standard.
a Wr = whole rock.
b S = sanidine.
’ G = glass.
from the zone of intense “0 depletion in the ground-
mass (Zone B, discussed below). Also shown in Fig.
4 are the calculated material-balance 6180 values for
the groundmass samples, based on the measured
whole-rock values, and assuming for simplicity that each rock consists of 80% groundmass and 20%
3500
z 3000
s ‘G
c
y 2.500
2000
Fig. 4. Measured oxygen isotope compositions for whole rock,
quartz, feldspar, glass/groundmass in Section 1. Also included are calculated material-balance groundmass S180 values based on
whole-rock values, assuming rock consists of 20% phenocrysts
with combined 8r*O = + 7.9 and 80% groundmass. The shaded
zone is the range of calculated 6’*0 values for magma in equilib-
rium with phenocrysts.
phenocrysts; for this model calculation, the phe-
nocrysts (quartz + feldspar) are assumed to have a
combined aI80 of $7.9 in all samples, The shaded
zone represents the range of 6”O values for a
silicate melt in equilibrium with the quartz phe-
nocrysts and most of the feldspar phenocrysts, utiliz-
ing the empirical observation (e.g., Taylor, 1968)
that granitic melts are typically 0.2 to 0.4%~ higher in “0 than their coexisting feldspars.
In order to determine whether the low- 180 zone
in Fig. 4 represents a caldera-wide, low-“0 strati- graphic horizon or simply a local anomaly on the
southeast side of the caldera, two partial stratigraphic
sections (sections 2 and 3; Fig. 1) were also studied.
The whole-rock a’*0 results for sections 2 and 3, shown in Fig. 5, indicate that this is probably a
caldera-wide phenomenon.
For purposes of description, we have divided the ash-flow tuff into three zones on the basis of
“O/ I60 and petrology. Zone A (from 1775 to 2700
m in Section 1) is a section of “normal” al80 values, in which most of the measured whole-rock 6’*0 values clearly correspond to the calculated range for magmas in equilibrium with the analyzed phenocrysts. Chemically, the rhyolite tuff within this interval shows a relatively smooth upward transition

224 C. Gazis et al/Journal of Volcanology and Geothermal Research 73 (19961213-244
3200
E 2800 .,o ;;j i w 2400
i
Zone A
Fig. 5. Comparison of whole-rock 6’“O values in three strati-
graphic sections (sections 1, 2 and 3; located in Fig. 1). Zones A, B and C are described in the text.
to more mafic compositions. The tuff in this zone is
densely welded and forms massive, columnar-jointed
cliffs. Zone B (2700-3300 ml is the low-“0 sec-
tion: whole-rock 6”O values are as low as -4.0,
and the measured groundmass for the lowest I80
sample is -7.7. The measured whole-rock a”0
values are typically much lower than the magma 6’*0 values calculated from the phenocrysts. Note
that Zone B also contains both of the anomalous
reversals in major- and trace-element compositions
SiOz (wt%) l
66 68 70 72 14 76
-5 0 5 10 15
PO q
Fig. 6. Comparison of whole-rock 6180 values and SiO, content
(wt.%) for Section I. Zones A, B and C are described in the text.
defined by samples from Section 1 (Fig. 6). The tuff
throughout this zone is densely welded except for the
lowest “0 sample, which is poorly welded. Zone C
(3300-3465 ml is the upper dacitic part of the
stratigraphic section, and it shows very large varia-
tions in whole-rock 6’*0 over a very small strati-
graphic interval, extending to high 6”O values
(+ 10.9). This zone is also visually distinct from the
lower two zones because of the partial vitrophyre
horizons (containing black glassy pumices) that de- fine welding breaks between cooling sub-units.
4.2.2. Resurgent block
In samples collected along the ridges that traverse
the uplifted block of tuff in the northeast quadrant of
the caldera (Fig. 71, the whole-rock 6”O values tend
to be higher ( + 6 to + 8) on the northeast, closest to
the resurgent intrusion. The a’s0 values decrease to
0 to +2 to the southwest, near the fault that bounds
this block. Two anomolously ‘XO-depleted samples,
CG-C2-17A and CG-C2- 17B, were collected at a
single location in the middle of this block. Sample 17A is typical grey devitrified tuff, whereas 17B is
from a large, dark-grey, devitrified pumice block
found in float; in thin section this sample is entirely crystalline and lacks the pyroclastic texture of the
rest of the tuff in the resurgent block.
4.2.3. Vitrophyres and glassy pumices
All intracaldera vitrophyres consisting entirely of
phenocrysts and black glass have whole-rock 6”O
of +8.1 or higher (i.e., slightly enriched in ‘“0
relative to the range of calculated values for magma in equilibrium with the coexisting phenocrysts). A
single outflow vitrophyre, collected as float but con- sidered to be from the base of the outflow sheet, has
the lowest whole-rock alsO value of the vitrophyres,
+ 6.5. Glass from glassy pumices exhibits a range of S’“0 values, from + 1.4 to + 9.1. All of these
glasses are hydrated, and contain = 3 to 4 wt.% H,O (Gazis, 1994).
4.2.4. OutjIow tuff The quartz and feldspar a”0 values of the out-
flow tuffs (Table 1; Fig. 81 are very uniform ( + 8.4 f 0.2 and + 7.5 f 0.5, respectively), similar to those from the caldera fill. Groundmass and glass separates are commonly lower in “0 than the phenocrysts. In

C. Gazis et al./ Journal of Volcanology and Geothermal Research 73 (1996) 213-244 225
contrast to the major and trace elements, the whole- 4.25. Post-caldera igneous rocks rock oxygen isotopic compositions of the outflow The granodiorite intrusion displays the same kinds tuffs are most similar to those from the lower part of of oxygen isotope disequilibrium phenomena that are Zone B and the transition zone between zones B and observed in the middle section of Chegem Tuff, C. though the isotopic variations are less pronounced
b 6180 contour intervals (in per rnil)
Fig. 7. (a) Whole-rock 6”O values lettered in alongside sample localities (0) for the granodiorite porphyry intrusion and resurgent block,
both located in the northeast part of the Chegem caldera (Fig. 1). All tuff samples were collected along a set of ridges which range in
elevation from 3030 to 3430 m. Note that samples were also analyzed from the peaks of Vorlan and Likarilgi (triangles). (b) Interpretive
whole-rock ??I80 contour map of the resurgent block. Only welded tuff samples are included in this contour map.
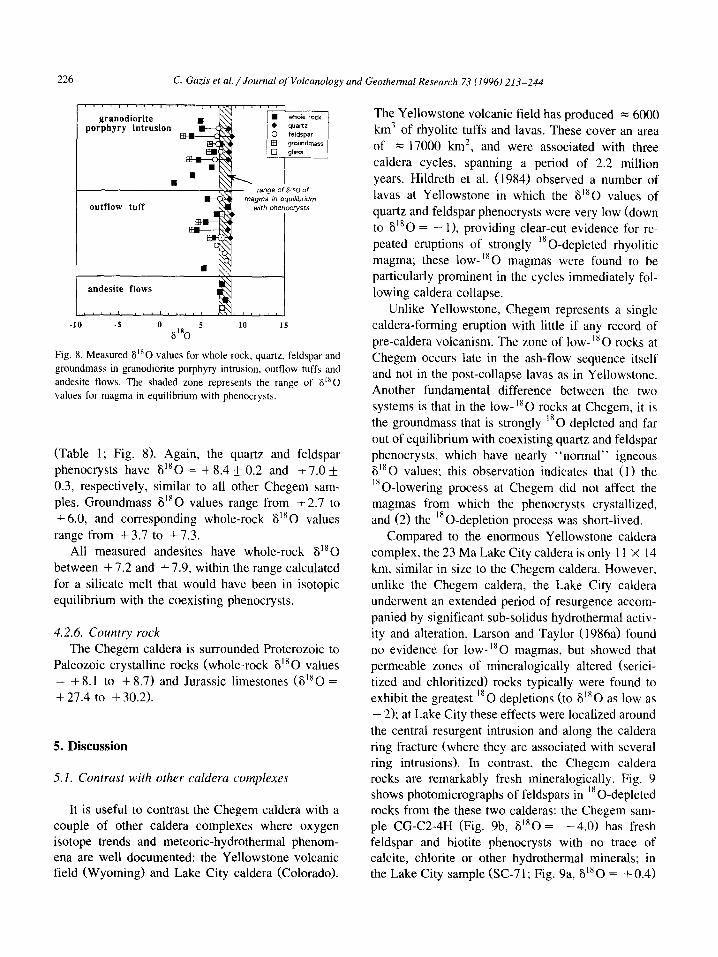
226 C. Gazis et al. /Journal of Volcanology and Geothemal Research 73 (1996) 213-244
andesite flows
-10 -5 0 5 10
6'80 15
Fig. 8. Measured 6’*0 values for whole rock, quartz, feldspar and
groundmass in granodiorite porphyry intrusion, outflow tuffs and
andesite flows. The shaded zone represents the range of 8”O
values for magma in equilibrium with phenocrysta.
(Table 1; Fig. 8). Again, the quartz and feldspar
phenocrysts have S’*O = + 8.4 + 0.2 and +7.0 + 0.3, respectively, similar to all other Chegem sam-
ples. Groundmass S180 values range from +2.7 to
+ 6.0, and corresponding whole-rock S180 values
range from +3.7 to +7.3.
All measured andesites have whole-rock S180 between + 7.2 and + 7.9, within the range calculated
for a silicate melt that would have been in isotopic
equilibrium with the coexisting phenocrysts.
4.2.6. Country rock
The Chegem caldera is surrounded Proterozoic to
Paleozoic crystalline rocks (whole-rock S” 0 values = + 8.1 to + 8.7) and Jurassic limestones (S”O =
+ 27.4 to + 30.2).
5. Discussion
5.1. Contrast with other caldera complexes
It is useful to contrast the Chegem caldera with a
couple of other caldera complexes where oxygen isotope trends and meteoric-hydrothermal phenom- ena are well documented: the Yellowstone volcanic field (Wyoming) and Lake City caldera (Colorado).
The Yellowstone volcanic field has produced = 6000 km3 of rhyolite tuffs and lavas. These cover an area of = 17000 km’, and were associated with three caldera cycles, spanning a period of 2.2 million
years. Hildreth et al. (1984) observed a number of
lavas at Yellowstone in which the S’*O values of
quartz and feldspar phenocrysts were very low (down to S180 = - l), providing clear-cut evidence for re-
peated eruptions of strongly “O-depleted rhyolitic magma; these low-‘*0 magmas were found to be
particularly prominent in the cycles immediately fol- lowing caldera collapse.
Unlike Yellowstone, Chegem represents a single
caldera-forming eruption with little if any record of
pre-caldera volcanism. The zone of low-‘*0 rocks at
Chegem occurs late in the ash-flow sequence itself
and not in the post-collapse lavas as in Yellowstone. Another fundamental difference between the two
systems is that in the low-“0 rocks at Chegem, it is
the groundmass that is strongly “0 depleted and far
out of equilibrium with coexisting quartz and feldspar phenocrysts, which have nearly “normal” igneous
S”O values; this observation indicates that (1) the
“O-lowering process at Chegem did not affect the magmas from which the phenocrysts crystallized,
and (2) the “O-depletion process was short-lived.
Compared to the enormous Yellowstone caldera complex, the 23 Ma Lake City caldera is only I 1 X 14
km, similar in size to the Chegem caldera. However,
unlike the Chegem caldera, the Lake City caldera
underwent an extended period of resurgence accom- panied by significant sub-solidus hydrothermal activ-
ity and alteration. Larson and Taylor (1986a) found
no evidence for low-“0 magmas, but showed that permeable zones of mineralogically altered (serici-
tized and chloritized) rocks typically were found to
exhibit the greatest lRO depletions (to S’*O as low as - 2); at Lake City these effects were localized around
the central resurgent intrusion and along the caldera
ring fracture (where they are associated with several ring intrusions). In contrast, the Chegem caldera rocks are remarkably fresh mineralogically. Fig. 9 shows photomicrographs of feldspars in 180-depleted rocks from the these two calderas: the Chegem sam- ple CG-C2-4H (Fig. 9b, S180 = - 4.0) has fresh
feldspar and biotite phenocrysts with no trace of calcite, chlorite or other hydrothermal minerals; in the Lake City sample (SC-71 ; Fig. 9a, S180 = + 0.4)
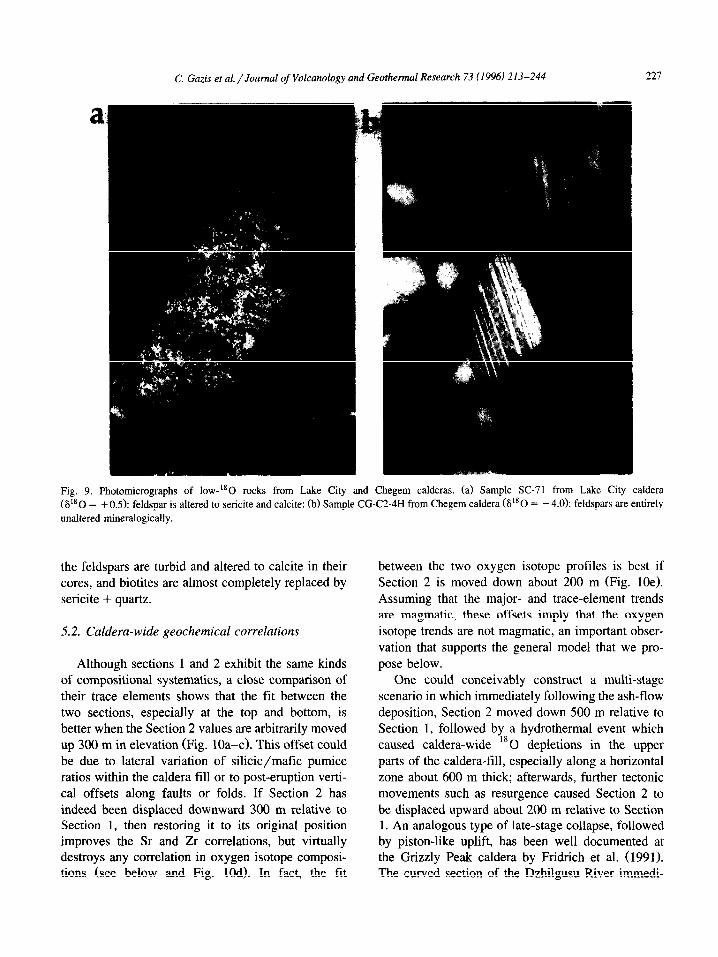
C. Gazis et al. /Journal of Volcanology and Geothermal Research 73 (1996) 213-244 221
a
Fig. 9. Photomicrographs of low-‘*0 rocks from Lake City and Chegem calderas. (a) Sample SC-71 from Lake City caldera
(6’sO = +0.5): feldspar is altered to sericite and calcite; (h) Sample CG-C2-4H from Chegem caldera (6’*0 = - 4.0): feldspars are entirely
unaltered mineralogically.
the feldspars are turbid and altered to calcite in their
cores, and biotites are almost completely replaced by
sericite + quartz.
5.2. Caldera-wide geochemical correlations
Although sections 1 and 2 exhibit the same kinds of compositional systematics, a close comparison of
their trace elements shows that the fit between the
two sections, especially at the top and bottom, is
better when the Section 2 values are arbitrarily moved
up 300 m in elevation (Fig. lOa-cl. This offset could be due to lateral variation of silicic/mafic pumice
ratios within the caldera fill or to post-eruption verti-
cal offsets along faults or folds. If Section 2 has
indeed been displaced downward 300 m relative to Section 1, then restoring it to its original position improves the Sr and Zr correlations, but virtually destroys any correlation in oxygen isotope composi- tions (see below and Fig. 1Od). In fact, the fit
between the two oxygen isotope profiles is best if
Section 2 is moved down about 200 m (Fig. 10e).
Assuming that the major- and trace-element trends are magmatic, these offsets imply that the oxygen
isotope trends are not magmatic, an important obser-
vation that supports the general model that we pro-
pose below.
One could conceivably construct a multi-stage
scenario in which immediately following the ash-flow
deposition, Section 2 moved down 500 m relative to Section 1, followed by a hydrothermal event which
caused caldera-wide “0 depletions in the upper parts of the caldera-fill, especially along a horizontal
zone about 600 m thick; afterwards, further tectonic
movements such as resurgence caused Section 2 to
be displaced upward about 200 m relative to Section 1. An analogous type of late-stage collapse, followed by piston-like uplift, has been well documented at the Grizzly Peak caldera by Fridrich et al. (1991). The curved section of the Dzhilgusu River immedi-
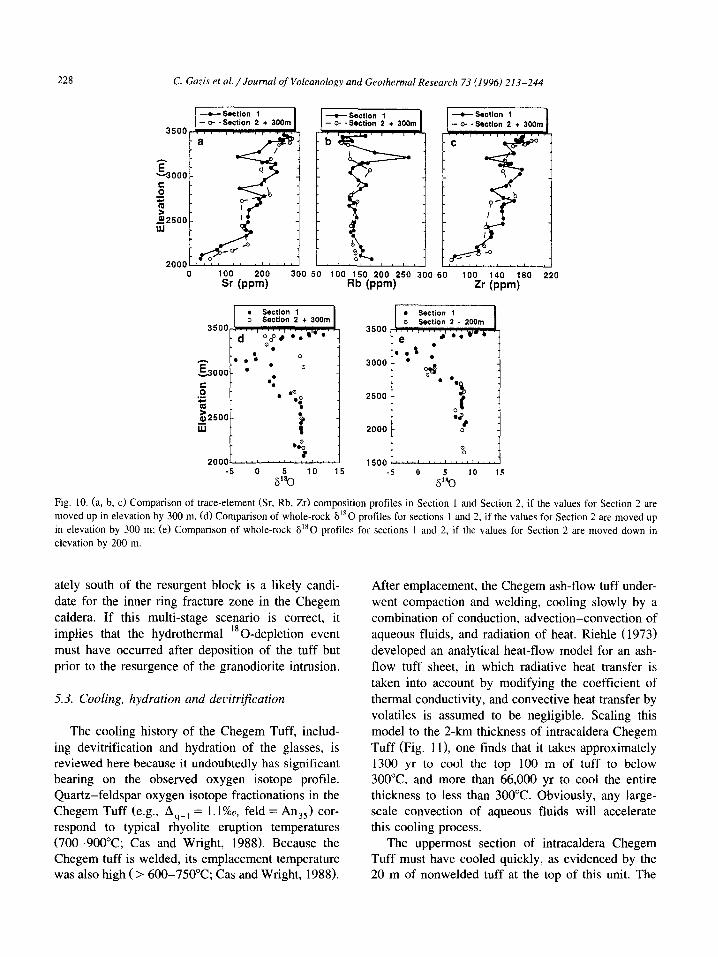
228 C. Gazis et al./ Journal of Volcanology and Geothermal Research 73 (1996) 213-244
0 100 200 300 50 100 150 200 250 300 60 100 140 180 220
Sr (wm) Rb (wm) Zr (wm)
Fig. 10. (a, b, c) Comparison of trace-element (Sr, Rb, Zr) composition profiles in Section I and Section 2, if the values for Section 2 are
moved up in elevation by 300 m. (d) Comparison of whole-rock 6’*0 profiles for sections I and 2, if the values for Section 2 are moved up
in elevation by 300 m: (e) Comparison of whole-rock 6180 profiles for sections 1 and 2, if the values for Section 2 are moved down in
elevation by 200 m.
ately south of the resurgent block is a likely candi-
date for the inner ring fracture zone in the Chegem
caldera. If this multi-stage scenario is correct, it
implies that the hydrothermal I8 O-depletion event
must have occurred after deposition of the tuff but
prior to the resurgence of the granodiorite intrusion.
5.3. Cooling, hydration and devitrifcation
The cooling history of the Chegem Tuff, includ-
ing devitrification and hydration of the glasses, is reviewed here because it undoubtedly has significant bearing on the observed oxygen isotope profile. Quartz-feldspar oxygen isotope fractionations in the Chegem Tuff (e.g., As-r = 1.1%0, feld = An,,) cor- respond to typical rhyolite eruption temperatures (700-900°C; Cas and Wright, 1988). Because the Chegem tuff is welded, its emplacement temperature was also high (> 600-750°C; Cas and Wright, 1988).
After emplacement, the Chegem ash-flow tuff under- went compaction and welding, cooling slowly by a
combination of conduction, advection-convection of aqueous fluids, and radiation of heat. Riehle (1973)
developed an analytical heat-flow model for an ash-
flow tuff sheet, in which radiative heat transfer is
taken into account by modifying the coefficient of
thermal conductivity, and convective heat transfer by volatiles is assumed to be negligible. Scaling this
model to the 2-km thickness of intracaldera Chegem
Tuff (Fig. 111, one finds that it takes approximately 1300 yr to cool the top 100 m of tuff to below 3OO”C, and more than 66,000 yr to cool the entire thickness to less than 300°C. Obviously, any large- scale convection of aqueous fluids will accelerate this cooling process.
The uppermost section of intracaldera Chegem Tuff must have cooled quickly, as evidenced by the 20 m of nonwelded tuff at the top of this unit. The

C. Gazis et al./ Journal of Volcanology and Geothermal Research 73 (1996) 213-244 229
TW
Fig. 11. Modeled cooling history of 2 km thick sheet of welded
tuff with initial temperature of 700°C. Modified from model by
Riehle (1973). The model assumes that cooling is mainly by
conduction.
dacitic tuff horizons also have well-preserved cool- ing sub-units with pristine glassy pumices at their boundaries. The margins of the intracaldera tuff mass also cooled quickly against the caldera walls, quenching to form densely welded marginal vitro- phyres a few meters thick. At temperatures of 650°C a l-km-thick tuff sheet probably requires less than 1 year to produce dense welding, but this time can be reduced to less than one week if at least 0.5% H,O is present (Bierwith, 1982).
Some of the initially glassy tuffs at Chegem also underwent high-temperature devitrification. Sub- solidus crystallization of thermodynamically metastable glass produces a variety of devitrification products, depending on the cooling rates (Lofgren, 1970). Rapid cooling produces fibrous crystals of quartz and sanidine that rapidly nucleate to form spherulites and axiolites (Ross and Smith, 1961). Slower cooling rates produce more equigranular gra- nophyric textures. For a 3-mm glass shard, experi- mental studies predict devitrification times of < 3 yr at 750°C to about 3000 yr at 300°C (Lofgren, 1970).
All of the analyzed glassy pumices from the intracaldera Chegem Tuff have undergone hydration, typically attaining water contents of 3-4 wt.% (Gazis, 1994). Glasses are rapidly hydrated, even at surface temperatures, when water diffuses into and through the glass structure, forming spheroidal (perlitic) cracks. Hydration rate experiments (Friedman and Smith, 1960; Friedman et al., 1966) predict that a 3-mm shard will be hydrated in < 3 h at 750°C or in
about 3 years at 300°C. These rates of hydration are 3-4 orders of magnitude faster than the rates of devitrification for the same size shard.
5.4. Significance of 10w-‘~O rhyolitic glasses in na-
ture
The presence of apparently pristine glasses with 6”O as low as + 1.4 presents an interesting dilemma. Inasmuch as glasses are essentially silicate melts quenched at sub-solidus temperatures, they should originally have exactly the same 6’*0 value as the melt phase of the magma (i.e., within the normal “magmatic” range of about +6 to + 10). In fact, in general they do not, because the low-temperature alteration and hydration that is commonly observed in older volcanic glasses in nature is invariably associated with an upward shift of the glass F”O value by several al., 1985). This i!
er mil (Taylor, 1968; Cerling et 0 shift is a result of pervasive
exchange between Earth-surface waters and such glasses over the course of several thousand years, together with the fact that the equilibrium oxygen isotope fractionations between water and silicate minerals or glass are very large at such low tempera- tures (e.g., at 25”C, A water_g,ass = 20%0: Taylor, 1968; Cerling et al., 1985). Thus, at ambient temperatures only extremely light meteoric waters in relatively cold climatic regions (e.g., 6180 < - 15) can sub- stantially lower the 6l*O value of a volcanic glass. On the other hand, water-glass oxygen isotope frac- tionations at higher temperatures (e.g., greater than 200°C) are sufficiently small that, even in temperate or subtropical climates, all meteoric water-glass in- teractions will lower the I80 content of the glass; however, such high temperature alteration would also be expected to devitrify and recrystallize the inherently metastable glass. For example, experi- ments by Lofgren (1970) and Marshall (1961) pre- dict that at 200°C a lmm (radius) glass shard will be devitrified by pure water in = 3000 yr. At higher temperatures or with saline waters, these times will be orders of magnitude shorter.
Also, even if low- i*O glasses are formed by some process, any subsequent interaction with additional water at low temperature will in general produce a high- I80 overprint that is likely to obscure the origi- nal low-‘*0 signature. This could be the main reason
230 C. Gazis et al. / Journal of Volcanology and Geothermal Research 73 (1996) 213-244
why low- I80 glasses are only rarely observed, ex- cept in very young volcanic rocks in unique geologi-
cal environments (e.g., in Iceland, Muehlenbachs et
al., 1974). Smith and Suemnicht (1991) found two
glassy pumices at Long Valley caldera with 6”O
values of + 0.3 and + 0.4, and Hildreth et al. (1984)
found that glasses in the non-hydrated cores of some
vitrophyres at Yellowstone have S’s0 values as low
as +0.5.
5.5. Lack of hydrothermally altered country rocks
The oxygen isotopic compositions of the country
rocks surrounding the Chegem caldera, like the field
and petrographic observations of the tuff itself, argue
against the development of any substantial “normal”
(i.e., 200-400°C) hydrothermal system at this local-
ity. In particular, samples CG-C-60A to 6OC, which are limestones collected at distances of 4, 18 and 30
m from the main caldera ring fault, have normal
sedimentary 8”O values of +29.0 to + 29.9. If a
significant hydrothermal system had developed after
caldera collapse, as, for example, in the Lake City
caldera (Larson and Taylor, 1986a), one would ex-
pect that abundant fluids would have moved along this ring fault, a zone of higher permeability. Lime-
stones are sensitive indicators of the passage of
meteoric-hydrothermal fluids in the brittle-fracture regime of the Earth’s crust, because under such
conditions they exchange rapidly and they can be
very permeable; also, because they have very high
initial a”0 values, even a small degree of 180/ I60
exchange can be readily observed.
5.6. Constraints on the process responsible for ‘so
depletion
The dramatic ‘*O depletion and disequilibrium
described in this paper has not to our knowledge
been observed previously anywhere in the world, and
certainly not on this scale. It is possible that these types of “0 depletions in fact occur much more frequently in nature, but are overlooked because they are usually overprinted and obscured by the ubiqui- tous hydrothermal alteration or low-temperature hy- dration that is so characteristic of volcanic centers, particularly calderas. The Chegem caldera may have uniquely preserved the effects of this “0 depletion event because of its youth, and because the rapid
uplift and associated deep erosion in the Caucasus Mountains has minimized the development of any
long-lived hydrothermal stage.
Based on our data, we can place certain con-
straints on the process that caused the “0 depletion
at Chegem. In quantifying these constraints in the following discussion, assumptions must be made re-
garding temperatures of equilibration, the isotopic
compositions of meteoric waters and unaltered
Chegem Tuff, and diffusion mechanisms and coeffi-
cients for oxygen isotope exchange between H,O
and feldspar or glass. Where these parameters are
uncertain (as for temperature), a range of values is
used or the most conservative estimate is made (i.e., we utilize values that minimize the amount of water
required to produce the observed effects).
5.6.1. Involvement oj’high-temperature meteoric wa-
ters
Whatever the IsO-lowering process was, it must
have involved meteoric waters at relatively high
temperatures ( > 300°C). Earth-surface waters are the only waters isotopically light enough to cause the
observed I80 depletions, and high temperatures are
necessary to produce sufficiently favorable equilib-
rium ‘so fractionations between silicates and H,O. It is possible that some of the less extreme “0
depletions (such as those in the outflow sheets) were
caused by isotopically light waters at temperatures below 300°C and therefore we should perhaps con-
sider two-stage (or multi-stage) processes, or pro-
cesses involving a range of temperatures. In fact, if
the ‘so enrichments of up to 4%0 observed at the top
of the intracaldera tuff section were caused by mete-
oric waters (as seems likely), these must have oc- curred at low temperatures (< 100°C). Only at such
low temperatures are oxygen isotope fractionations between silicates and H,O large enough to raise the
S1’O values of the rocks. Also, the simple cooling
model (Fig. 11) indicates that the upper 100 m of tuff was cooled rapidly to < 100°C.
In addition, mineralogical evidence provides an important constraint on the temperatures of water- rock interaction. Feldspars and biotites are known to be rapidly altered in a “low-temperature” (20O-
400°C) hydrothermal environment, but the feldspars in the Chegem Tuff are entirely unaltered (Fig. 9a> and there is no sign of chloritization of biotites. Cole
C. Gazis et al. / Journal of Volcanology and Geothermal Research 73 (1996) 213-244 231
et al. (1992) performed hydrothermal experiments
with pure water on granites at temperatures of 170 to 3OO”C, and observed that chlorite formed in biotites
in all cases after only 160 hours. The presence of salts (NaCl + KCl) in the water increased the alter-
ation rate. Thus, the lack of “typical” hydrothermal
alteration minerals, such as chlorite and sericite,
implies that the hydrothermal “0 exchange that
produced the ‘*O depletions at Chegem had to take
place at very high temperatures ( = 500-6OO”C),
within the stability fields of the high-temperature
minerals.
The present-day Chegem River water, a combina-
tion of glacial meltwater and rain water, has a 6D value of -89 (Gazis, 1994) which corresponds to a
6”O value of - 12, assuming that it lies on the
meteoric water line (Craig, 1961). Modern precipita-
tion at the highest point in the Chegem caldera might
be expected to be several per mil lower in “0 than this river water. However, estimates of recent uplift
in the Greater Caucasus are quite high (up to 12
mm/yr; Philip et al., 1988) and it is likely that
erosion did not keep pace with uplift. Thus, the overall elevation of the central Caucasus Mountains
was lower and topography was probably less pro- nounced 2.8 million years ago than at present. In
such a scenario, all else being the same, one would expect that 2.8 Ma meteoric water in the Chegem
area would have had a higher Si80 value than
present-day meteoric water. In the discussion below,
we will consider a range of meteoric water isotopic compositions from 8180 = - 12 to - 16. The lower
6’*0 value will tend to minimize the amount of
meteoric water needed. The measured 8D values of
glass samples from the caldera fill are compatible
with low-temperature exchange with a meteoric wa-
ter lying within the above range of isotopic composi- tions (Gazis, 1994).
5.6.2. Mass-balance W/R ratios
Mass balance calculations can be used to estimate the amounts and fluxes of water necessary to cause
the observed “0 depletions at Chegem. We will
utilize the following assumptions: (1) The original magma and erupted rock both
had 6’*0 = + 8, a value representing a close ap- proach to equilibrium with the coexisting phe- nocrysts.
(2) The = 7OO-m-thick ‘*O-depleted zone ob-
served in the stratigraphic section on the southeast
side of the caldera was present throughout the 11 X
15 km caldera and is equally intense throughout,
giving a flattened cylindrical volume of low-‘*0 rock equal to 1.16 X 10” m3. With a density of 2.4
g/cm3, this translates into about 2.8 X 10” g of
‘*O-depleted tuff. (3) The groundmass in each sample has ex-
changed thoroughly with (and attained isotopic equi-
librium with) the interacting meteoric waters; this
assumption minimizes the amount of water needed to
produce the observed ‘*O depletions.
(4) The groundmass 6’*0 value is estimated by
material-balance from the measured whole-rock 6’ 8 0
value, assuming that all of the samples contain 20%
phenocrysts having a bulk 6’*0 of +7.9.
(5) The oxygen isotope fractionation between wa-
ter and glass (or groundmass) is assumed to lie
halfway between the measured equilibrium fractiona-
tions for quartz-H,0 and albite-H,O (Clayton and
Kieffer, 199 1).
With the above assumptions, zero-dimensional box
models such as those described by Taylor (1977) are
useful for estimating the amounts of water required
to produce observed oxygen isotopic shifts. Material-balance water/rock (W/R) ratios can be
calculated and converted to integrated fluxes when
appropriate length scales and flow directions are
known. An advantage of such box models is that the
details of the hydrothermal “plumbing” system or
flow paths need not be known. On the other hand, a
disadvantage of such models is that the actual W/R
ratios in such systems in nature can only be calcu-
lated if the position of the rock in the flow path and
the conditions of flow and exchange are taken into
account (Norton and Taylor, 1979; Bowman et al.,
1994). Also, although the actual W/R ratios are dimensionless, they depend on the size of the rock
parcel (box) which is considered. The material-bal- ance and actual water/rock ratios only become iden-
tical if the size of the rock parcel is increased to
essentially encompass the entire hydrothermal sys-
tem. Nevertheless, since neither the nature nor the direction of fluid flow in the Chegem caldera system
is known, whereas the size of the “O-depleted zone is well-defined, zero-dimensional models are appro- priate in this case.

232 C. Gazis et al. /Journal of Volcanology and Geothermal Research 73 (1996) 213-244
To minimize the amount of water needed to pro-
duce the observed “0 depletions, we consider an
open-system model, where a tiny parcel of water
exchanges isotopes with the rocks and then passes
out of the rock system forever. The material-balance
model water/rock ratio (i.e., the amount of water
oxygen/amount of rock oxygen) for an open system
where rocks have reached equilibrium with the inter-
acting water, integrated over the lifetime of the
hydrothermal system, is given by (Taylor, 1977):
W - = In R
[
&!I*0 + A - a,:,,
6’ -@;/A) u2o I
where i is the initial value and f is the final value
after exchange, and A = &Lck - ?jL20 is the equilib- rium fractionation between water and rock at the
given temperature.
Because we do not a priori know the temperature
of exchange, we probably must consider a range of
temperatures, from 25 to 850°C. However, in apply-
ing the above expression one quickly discovers that the elevated 6180 values in the upper 40 m of the
stratigraphic section can only be produced at temper-
atures below 100°C from waters with 8L20 > - 13.
The lowest groundmass value (sample CG-C2-4H,
calculated 6 18 Ogm,= - 7) requires temperatures of at
least 350°C if 6;120 = - 12 and at least 250°C if
6’ H,O = - 16. Fig. 12 shows the calculated W/R
2000 d
0 0.5 1 1.5 2 2.5
Wk,,n
ratios vs. elevation for temperatures of 850 and
400°C (or 300°C) and for a1;2o = - 12 (or - 16).
The material-balance W/R ratios (e.g., for sample
CG-C2-4H) are reduced by as much as 45% at the
higher temperature (850°C) as opposed to the lower
temperature. Averaged over the entire I8 O-depleted
zone of the stratigraphic column, these W/R ratios
are overall about 30% lower at 850°C than at the
lower temperatures. These oxygen W/R ratios of 0.3
to 0.6 translate into water/rock ratios by weight of
about 0.16 to 0.32 (g of H,O per g of rock). This in
turn implies that about 0.5 to 1.0 X 10” g of H,O
exchanged with the = 700-m-thick section of tuff.
5.6.3. Timescale of I80 depletion at Chegem
The caldera-fill ash-flow tuff is not appreciably
mineralogically altered, and it also still contains
apparently pristine (but strongly hydrated!) volcanic
glass. As discussed earlier, the IgO depletions at
Chegem were definitely not caused by an extensive
long-lived hydrothermal system like the one which
existed at the Lake City caldera. Furthermore, the “O-lowering process at Chegem must have hap-
pened on a very short timescale because of the
extreme isotopic disequilibrium between groundmass and phenocrysts. A useful graphical mechanism for
discussing isotopic disequilibrium is provided by S-6 plots for coexisting quartz-feldspar or pyrox-
Fig. 12. Calculated open-system W/R ratios for Section 1 (Fig. 1). These were calculated using material-balance open system equation of
Taylor (1977) for waters with initial compositions of g’s0 = - 12 (a) and S”O = ~ 16 (b). The fractionation factors used are averages of
the fractionation factors for quartz and albite given in Clayton and Kieffer (1991). Two temperature extremes are shown for each water,
T= 850°C (magmatic temperature) and T= 400°C (6’*0 = - 12) or T= 300°C (6’80 = - 16). Exchange at temperatures below 350°C (6’sO = - 12) and 250°C (6180 = - 16) can not explain lowest 6”O sample. The averaged W/R ratios for the stratigraphic thickness from
2700 to 3400 m elevation are listed.
C. Gazis et al. /Journal of Volcanology and Geothemud Research 73 (1996) 213-244 233
15
a 10
2 B ‘c15 z
O
2 0
Ga
-5 /d
0 5 10 15 0 10 1s
PO quartz Sldb feldspar
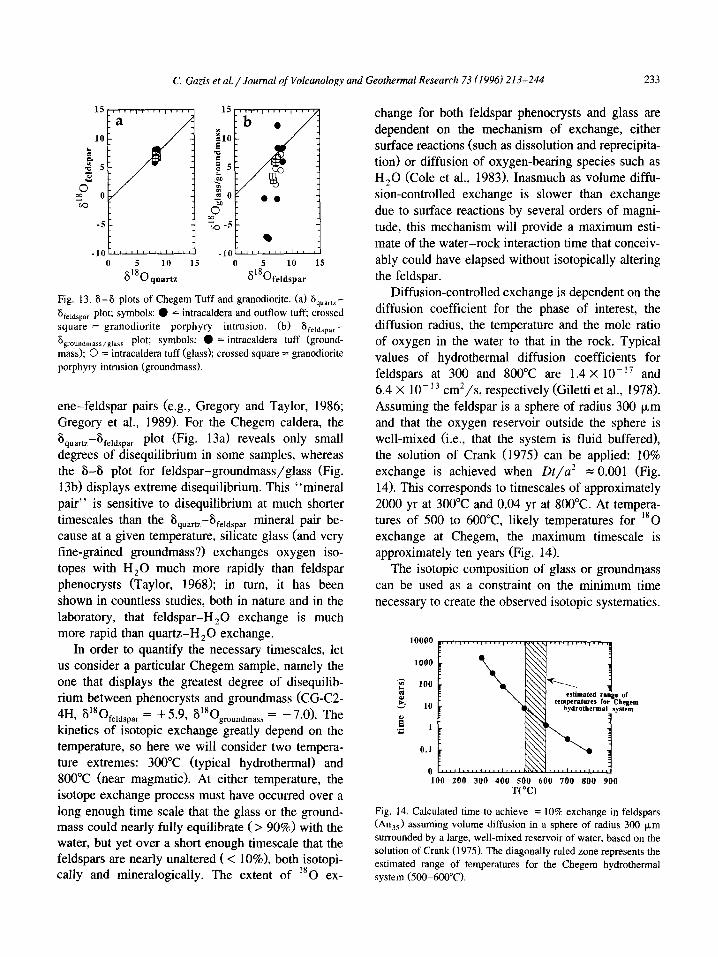
Fig. 13. 6-6 plots of Chegem Tuff and granodiorite. (a) hquartz -
6 reldspar plot; symbols: 0 = intracaldera and outflow tuff; crossed
square = granodiorite porphyry intrusion. (b) i5reldlpar -
6 sroundmass,slass plot; symbols: l = intracaldera tuff (ground-
mass); 0 = intracaldera tuff (glass); crossed square = granodiorite
porphyry intrusion (groundmass).
ene-feldspar pairs (e.g., Gregory and Taylor, 1986; Gregory et al., 1989). For the Chegem caldera, the 6 quartz -6 feldspar plot (Fig. 13a) reveals only small degrees of disequilibrium in some samples, whereas the 6-6 plot for feldspar-groundmass/glass (Fig. 13b) displays extreme disequilibrium. This “mineral pair” is sensitive to disequilibrium at much shorter timescales than the Squartz-Sfeldspar mineral pair be- cause at a given temperature, silicate glass (and very fine-grained groundmass?) exchanges oxygen iso- topes with H,O much more rapidly than feldspar phenocrysts (Taylor, 1968); in turn, it has been shown in countless studies, both in nature and in the laboratory, that feldspar-H,0 exchange is much more rapid than quartz-H,0 exchange.
In order to quantify the necessary timescales, let us consider a particular Chegem sample, namely the one that displays the greatest degree of disequilib- rium between phenocrysts and groundmass (CG-C2- 4H #so feldspar = + 5.9, ~‘80groundmass = -7.0). The kinetics of isotopic exchange greatly depend on the temperature, so here we will consider two tempera- ture extremes: 300°C (typical hydrothermal) and 800°C (near magmatic). At either temperature, the isotope exchange process must have occurred over a long enough time scale that the glass or the ground- mass could nearly fully equilibrate (> 90%) with the water, but yet over a short enough timescale that the feldspars are nearly unaltered ( < lo%), both isotopi- tally and mineralogically. The extent of “0 ex-
change for both feldspar phenocrysts and glass are dependent on the mechanism of exchange, either surface reactions (such as dissolution and reprecipita- tion) or diffusion of oxygen-bearing species such as H,O (Cole et al., 1983). Inasmuch as volume diffu- sion-controlled exchange is slower than exchange due to surface reactions by several orders of magni- tude, this mechanism will provide a maximum esti- mate of the water-rock interaction time that conceiv- ably could have elapsed without isotopically altering the feldspar.
Diffusion-controlled exchange is dependent on the diffusion coefficient for the phase of interest, the diffusion radius, the temperature and the mole ratio of oxygen in the water to that in the rock. Typical values of hydrothermal diffusion coefficients for feldspars at 300 and 800°C are 1.4 X lo-” and 6.4 X lo-l3 cm*/s, respectively (Giletti et al., 1978). Assuming the feldspar is a sphere of radius 300 pm and that the oxygen reservoir outside the sphere is well-mixed (i.e., that the system is fluid buffered), the solution of Crank (1975) can be applied: 10% exchange is achieved when Dt/a* = 0.001 (Fig. 14). This corresponds to timescales of approximately 2000 yr at 300°C and 0.04 yr at 800°C. At tempera- tures of 500 to 600°C likely temperatures for “0 exchange at Chegem, the maximum timescale is approximately ten years (Fig. 14).
The isotopic composition of glass or groundmass can be used as a constraint on the minimum time necessary to create the observed isotopic systematics.
10000
of hegem *tern
100 200 300 ‘loo 500 600 700 800 900
'U'C)
Fig. 14. Calculated time to achieve = 10% exchange in feldspars (An,,) assuming volume diffusion in a sphere of radius 300 pm
surrounded by a large, well-mixed reservoir of water, based on the
solution of Crank (1975). The diagonally ruled zone represents the
estimated range of temperatures for the Chegem hydrothermal
system (500-600°C).

234 C. Gazis et al./ Journal of Volcanology and Geothermal Research 73 (1996) 213-244
We assume that the groundmass S’s0 value was
attained before or during devitrification. Diffusion of
oxygen in rhyolite glass is thought to be controlled
by diffusion of water into the glass structure, and
diffusion coefficients for water in glass are about 5
orders of magnitude higher than hydrothermal diffu-
sion coefficients for oxygen in feldspar (Zhang et al.,
1991). This would imply timescales of less than a
year to achieve 90% exchange. Furthermore, if oxy-
gen exchange is caused by a mechanism other than
simple volume diffusion of H,O (which is especially
likely for the devitrified 10w-‘~O groundmass), then
the timescale will be even shorter.
Another approach to the timescale question is to
treat the plot of SFeldspar vs. Sslass,groundmass as an ‘ ‘oxygen isotope clock’ ’ , in the same way that Gre-
gory et al. (1989) regarded the Squartz-Sfeldspar plot
for fossil hydrothermal systems in nature. We will
consider our Sfe,dspar-Sg,ass,groundmass plot to be essen-
tially a SFeldspar -Sglass plot. Gregory et al. (1989)
pointed out that the slope of an array of data points
on a Squartz-Sfeldspar P lot can in principle indicate the
duration of a hydrothermal system. The array moves essentially from vertical (slope = m) to 45”(slope = 1)
through time as if it were the hand of an “oxygen
isotope clock”. In these terms, a Sfeldspar-Sglass plot is simply a clock which records much shorter
timescales than the Squartz-Sfeldspar clock, because glass exchanges oxygen extremely rapidly, and (rela-
tive to coexisting glass) feldspar can be regarded as the slow-exchanging mineral.
Criss et al. (1987) have shown that the slope of an
array of data points on a S-S plot is related to the
kinetic rate constants (k) for the two exchanging “minerals”, and to the fractional approach of that
mineral-water system to equilibrium (f). The rate
law used in this treatment is:
d R, - = k( aR, - RA)
dt
where R, and R, are the IsO/ I60 ratios in the
mineral and water, respectively, and cx is the min- eral/water equilibrium isotopic fractionation factor
for the temperature of interest:
( at equilibrium) eq
The term ,f is defined as:
6” - s .f= 6” _ s’q 1 - exp( -kt)
where S” and Seq are the S-values initially and at
equilibrium, respectively. A mineral-water system is
initially completely out of equilibrium with f’= 0,
whereas f= 1 when the system has attained equilib-
rium.
For buffered open-system conditions, Criss et al.
(1987) showed that for spherical mineral grains, the
kinetic rate constant, k, is related to the diffusion coefficient by the equations:
I
exp( -kt) = 1 -S=exp[--3.5/Dt/u2)
for \iDt/u’ < 0.1
exp( - kt) = 1 -f = exp( - 9.87Dt/a2 + 0.498)
for /Dt/a2 > 0.2
Table 2 shows how these different parameters and
the slopes of a data-point array on a Sfeldspar-Sgla\\
plot change with temperature, time and grain radius. One can see immediately that glass exchanges oxy-
gen isotopes with water extremely quickly, and for
almost all of the time-temperature conditions repre- sented in the table, the glass has completely equili-
brated with the water. Even at 300°C a sphere of
300 km will exchange = 80% in 4 months. In
contrast, a sphere of feldspar of equal size is essen- tially unchanged (f= 0.004) under these conditions.
Therefore, the degree of attainment of isotopic equi-
librium in the entire feldspar-glass-water system
(and hence the slope of the data point array on a
S feldspar -~g,ass plot) is controlled by the fractional
approach to equilibrium of the feldspar-water sys- tem. That is, the glass-water system equilibrates so
rapidly that it plays no role in defining these ex- change rate systematics.
Our estimate of the grain radius for both feldspar and glass at Chegem is 300 pm. For temperatures of 300, 600 and 800°C complete feldspar-water iso- topic equilibrium (slope = 1) should be attained after
approximately 600,000, 300 and 30 yr, respectively. The measured slope of the Chegem data array on a
6f,ldspar-8glass,groundmass plot is approximately 7 (Fig.

Table 2
C. Gazis et al./Joumal of Volcanology and Geothemwl Research 73 (1996) 213-244 235
Calculated values of various isotopic reaction rate parameters for feldspar-glass pairs
t a(f) Feldspar Glass Slope
k D f kt k D f kt
T = 300°C 0.3 mm, 0.3 yr
0.3 mm, 30 yr
0.3 mm, 300 yr
0.3 mm, 3000 yr
0.3 mm, 30,000 yr
0.1 mm, 3000 yr
0.6 mm, 3000 yr
1 mm, 3000 yr
T = 600°C
0.3 mm, 0.3 yr
0.3 mm, 3 yr
0.3 mm, 30 yr
0.3 mm, 300 yr
0.1 mm, 30 yr
0.6 mm, 30 yr
1 mm, 30 yr
T = 800°C 0.3 mm, 0.03 yr
0.3 mm, 0.3 yr
0.3 mm, 3 yr
0.3 mm, 30 yr
0.1 mm, 3 yr
0.6 mm, 3 yr
1 mm, 3 yr
l.OOE+08 0.03 4.365E - 11 1.40E - 17 0.004 0.004 4E - 08 1.88E - 12 0.98 4.0lE + 00 225.4
1 .OOE + 09 0.03 1.38E - 11 1.40E - 17 0.014 0.014 1E - 08 1.88E - 12 1.00 1.38E + 01 72.9
l.OOE + 10 0.03 4.365E - 12 1.40E - 17 0.043 0.044 very fast 1.88E - 12 1.00 very fast 23.4
l.OOE+ 11 0.03 1.38E - 12 1.40E - 17 0.129 0.138 very fast 1.88E - 12 1.00 very fast 7.8
l.OOE + 12 0.03 4.365E - 13 1.40E - 17 0.354 0.437 very fast 1.88E - 12 1.00 very fast 2.8
l.OJlE+ 11 0.01 4.14lE - 12 1.40E - 17 0.339 0.414 very fast 1.88E- 12 1.00 very fast 2.9
l.OOE+ 11 0.06 6.902E - 13 1.40E - 17 0.067 0.069 very fast 1.88E - 12 1.00 very fast 15.0
I.OOE+ 11 0.1 4.14lE - 13 1.40E - 17 0.041 0.041 very fast 1.88E - 12 1.00 very fast 24.7
l.OOE + 07 0.03 5.256E - 09 2.03E - 14 0.051 0.053 very fast 3.17E - 09 1.00 very fast 19.5
l.OOE +08 0.03 1.662E- 09 2.03E - 14 0.153 0.166 very fast 3.17E - 09 1.00 very fast 6.5
1.00E + 09 0.03 5.256E - 10 2.03E - 14 0.409 0.526 very fast 3.17E - 09 1.00 very fast 2.4
l.OOE + 10 0.03 1.662E - 10 2.03E - 14 0.81 1.662 very fast 3.17E- 09 1.00 very fast 1.2
l.OOE + 09 0.01 1.577E - 09 2.03E - 14 0.793 1.577 very fast 3.17E - 09 1.00 very fast 1.3
l.OOE + 09 0.06 2.628E - 10 2.03E - 14 0.231 0.263 very fast 3.17E - 09 1.00 very fast 4.3
l.OOE + 09 0.1 1.577E - 10 2.03E - 14 0.146 0.158 very fast 3.17E - 09 1.00 very fast 6.9
l.OOE + 06 0.03 6.315E - 08 2.93E - 13 0.061 0.063 very fast 4.46E - 08 I .OO very fast 16.3 l.OOE + 07 0.03 1.997E - 08 2.93E - 13 0.181 0.200 very fast 4.46E - 08 1.00 very fast 5.5 l.OOE + 08 0.03 6.315E - 09 2.93E - 13 0.468 0.632 very fast 4.46E - 08 1.00 very fast 2.1 l.OOE + 09 0.03 1.997E - 09 2.93E - 13 0.864 1.997 very fast 4.46E - 08 1.00 very fast 1.2
l.OOE + 08 0.01 1.895E - 08 2.93E - 13 0.85 1.895 very fast 4.46E - 08 1.00 very fast 1.2 l.OOEf08 0.06 3.1588 - 09 2.93E- 13 0.271 0.316 very fast 4.46E - 08 1.00 very fast 3.7 l.OOE + 08 0.1 1.895E -09 2.93E - 13 0.173 0.189 very fast 4.46E - 08 1.00 very fast 5.8
Abbreviations: t = time (s); a = effective grain radius km); k = kinetic rate constant (s _ ’ ). D = diffusion coefficient km* s- ‘1; , f = 1 - exp (- kt) (fractional approach to equilibrium; slope = fglara/ffeld).
13b). For 300, 600 and 8OO”C, this corresponds to
approximate timescales of 3000, 3 and 0.03 yr,
similar to the timescale calculated for sample CG-
C2-4H, because in both cases we predicted = 10%
feldspar exchange by volume diffusion in a fluid-
buffered system.
5.6.4. Cross-cutting relationships
The low-‘*0 zone is a = 700-m-thick strati-
graphic horizon located between elevations 2710 and 3390 m along the sample traverses in the southern
and eastern parts of the caldera. In the northeast, this
horizon was apparently offset by faults during late collapse and the faults were reactivated when the resurgent intrusion uplifted a block of tuff. The samples from the uplifted block of tuff appear to represent a portion of the low-‘*0 zone (possibly
that part between 2600 and 3000 m> that has been
both uplifted and tilted. Such an interpretation im-
plies that a significant part of the “0 depletion event
occurred prior to the intrusion of the granodiorite.
Though it is also possible that the apparent trunca-
tion of the low- “0 zone was due to preferential fluid flow in a direction of greater permeability at
that fault contact, the apparent vertical offsets be-
tween Section 1 and Section 2, which are in opposite
directions for the trace-element profile and the oxy-
gen isotope profile (as described above, Fig. lo),
also strongly suggest that the low-‘*0 zone was
formed after deposition of the tuff but prior to resurgence. 4oAr/ 39Ar studies (Gazis et al., 1995) constrain the resurgent intrusion to have been em- placed, crystallized, and cooled to 300°C within 50,000 years of eruption. These relationships, to-
236 C. Guzis et al. /Journal of Volcanology and Geothermal Research 73 f 1996) 213-244
gether with the requirement of high temperatures,
suggest that the low-“0 zone must have formed
immediately after eruption of the Chegem Tuff.
Outflow-facies tuff samples are similar to the
caldera fill, but they are more glass-rich and display
much less pronounced I80 lowering and lesser iso- topic disequilibrium effects. Inasmuch as these IgO
signatures exist up to 50 km away from the caldera,
and because the outflow tuff was probably every-
where less than 400 m thick, it is inconceivable that
all of these “0 depletions could have been caused
by a single hydrothermal system. The only likely
alternatives are: (1) that the intracaldera tuff and the
outflow tuff interacted in a somewhat similar fashion
with separate batches of meteoric waters; or (2) that
the “0 lowering occurred immediately prior to (or
during) eruption, a possibility that we do not favor
(see the discussion below).
The isotopic composition of the granodiorite por-
phyry intrusion further complicates the puzzling
cross-cutting relationships. Like the outflow tuff, the
granodiorite porphyry has a 10w-‘~O groundmass
even though its phenocrysts have “normal” igneous
a-values. Two pairs of samples of adjacent tuff and
granodiorite, collected several meters apart across
the intrusive contact (CG-C-53A, B; CG-C-58A, B),
consistently indicate that the tuff is 3 to 4%0 heavier
than the nearby granodiorite. However, the quartz is
isotopically identical in both the tuff and the gran-
odiorite (6”Oquartz = + 8.5 and + 8.61, strongly sug-
gesting that both kinds of rock initially formed from
isotopically similar magmas. Three plausible expla-
nations of this cross-cutting relationship are: (1)
meteoric water interacted briefly with the granodior- ite before it came into contact with the resurgent
block of tuff; (2) meteoric water interacted more
extensively with the granodiorite than with the tuff,
either because the intrusion was hotter or more per-
meable, or because its groundmass was more prone
to oxygen exchange (perhaps because it was still glassy, while the tuff had already been devitrified
and homfelsed by the intrusion); or (3) both samples originally suffered “0 depletion, but superposition of a late, lower-temperature alteration event in- creased the S180 value of the fine-grained tuff much
more than the more coarsely crystalline granodiorite. The post-caldera andesite lavas do not show any
signs of interaction with meteoric water. In fact,
there is an abrupt change in whole-rock 6”O across
the unconformity at the top of the intracaldera tuff in
Section 1 (below the andesites). Because this horizon
also contains glacial outwash gravels, and thus repre-
sents a significant time interval, it seems certain that
the process of water-rock/glass interaction that
caused the change in 6”O of the tuff must have
ceased on the surface by the time the andesites were
erupted.
5.7. Possible ‘80-depletion scenarios
Given the above, we here discuss several possible
scenarios of IgO depletion at Chegem.
5.7.1. Assimilation and / or melting of low- I80 rocks
This process has been suggested to explain low-
‘a0 magmas in the Yellowstone volcanic field
(Taylor, 19871, Crater Lake (Bacon et al., 1989) and
the Calabozos caldera complex (Grunder, 1987). Ei-
ther (1) a rather substantial amount of hydrother- mally altered rock foundered into the upper part of
the magma chamber and exchanged with this magma
or became assimilated by the magma prior to erup-
tion, or (2) hydrothermally altered rocks were par-
tially melted in the roof or walls of the magma
chamber. Neither of these possibilities is likely at
Chegem because: (1) The most striking “0 deple- tions are observed right in the middle of this series
of tuffs, so the 10w-‘~O effects cannot be the result
of assimilation in the upper part of the magma chamber. (2) In contrast to the above-described
caldera complexes, there are no low-“0, hydrother-
mally altered country rocks at Chegem. (3) There is no compositional or mineralogical evidence for large
amounts of assimilation. (4) Massive assimilation is incompatible with the extremely short timescales
(< 6 months) that are necessary to preserve the
observed oxygen isotope disequilibrium between
feldspar and coexisting silicate melt.
5.7.2. Direct water-magma interaction
Direct interaction between meteoric water and magma has been proposed to explain other occur- rences of low- “0 magmas (Lipman and Friedman,
1975; Hildreth et al., 1984; Harris and Erlank, 1992). A criticism of this mechanism has always been that, except for possible buoyant uprise of bubbles in a

C. Gazis et al./Joumal of Volcanology and Geothermal Research 73 (1996) 213-244 237
H,O-saturated melt, magmas have a very low or nonexistent permeability and are under lithostatic pressures, whereas the meteoric waters in the country rocks are under much lower (hydrostatic) pressures, and are separated from the magma chamber by a zone of hot, plastic (unfractured) rock. Therefore, the large amounts of H,O that needs to be cycled into and then out of such magma chambers will be in large part controlled by the very slow diffusion of H,O through ductile rock or silicate melt, and there is simply not enough time available for this to happen (Taylor, 1987). At Chegem, this problem is compounded by the fact that the feldspars have hardly exchanged at all with the meteoric waters, and this should have been relatively rapid, occurring in days (e.g., Gregory et al., 1989).
5.7.3. Water-glass interaction deep in vent system
during or just prior to eruption
At Chegem, we know that low- ‘* 0 volcanic rocks, 10w-‘~O intrusive rocks, and 10w-‘~O glasses all exist. However, there is no proof that any of these were actually derived from 10w-‘~O melts, although the mere existence of the low- I80 glasses implies that these materials were depleted in 180 while they were in the liquid, undercooled, or glassy state, and, as discussed above, this must have occurred at high temperatures ( > 250-350°C). One possible way that glass and water might interact at elevated tempera- tures is for meteoric water to infiltrate deep into the vent system of a caldera-forming system just before or during eruption. The extreme pressure differen- tials and the higher permeability provided by the interconnected fractures that develop during the cracking of the rapidly quenched porphyritic glass might make large-scale fluid infiltration more plausi- ble in this environment. For example, Sheridan et al. (1981) propose a somewhat analogous mechanism during the late stages of the A.D. 79 eruption of Vesuvius (Italy).
In addition, there is a possible correlation between the caldera-wide low- “0 zone and the second-order fluctuations in major- and trace-element composi- tions, and as we suggested earlier (Gazis et al., 1992), these compositional variations may be related to eruption dynamics. Perhaps fluctuating eruption rates or eruptions from different vents disrupted the progressive downward tapping of a compositionally
zoned magma chamber. This conceivably could per- mit the entrainment of hot meteoric fluids into the fragmented magma or highly fractured glass deep within the vent conduit system.
The problem with this mechanism is that very large integrated fluxes of water are required by the oxygen isotope systematics, and these must be sup- plied over a very short period of time. That is, in days to months (?), a large volume of water similar to the volume of the ‘*O-depleted zone itself would need to penetrate deep into the vent system, and some efficient physical mixing process would then be needed to produce intimate exchange of oxygen between these large volumes of materials. Further- more, the possible structural offsets in sections 1 and 2 of the trace-element and oxygen isotopic trends (discussed above) are in opposite directions, arguing against our earlier suggestion (Gazis et al., 1992) that both kinds of trends were formed at the same time.
5.7.4. A short-lived, high-temperature hydrothermal
system with efJicient recharge in the upper 7.5’0 m of
caldera fill
If the caldera-wide low-“0 zone at Chegem was formed by a flow system that developed after the tuffs were deposited, then the W/R profiles of Fig. 12 clearly imply that this was a very heterogeneous flow system containing horizons of variable perme- ability and fluid flow. In this scenario, the horizon of greatest fluid flux would be at the level of sample CG-C2-4H, which was in fact observed to be more poorly welded than the surrounding tuff. Further- more, the al80 profile is most easily explained if the flow direction is nearly horizontal. However, it is unlikely that the flow system was perfectly horizon- tal, because under such conditions it is difficult to initiate convection, particularly if the isotherms are also sub-horizontal. Even a slight tilt (= 5”), of either the boundaries of the flow system or the isotherms is sufficient to drive circulation (Criss and Hofmeister, 1991).
One drawback of attributing the “0 depletions to a hydrothermal system is the absence of any hydrous alteration minerals replacing the feldspar, biotite and groundmass. Consequently, a practically unique combination of unusually high hydrothermal temper- atures, a very short time interval, and large fluxes of
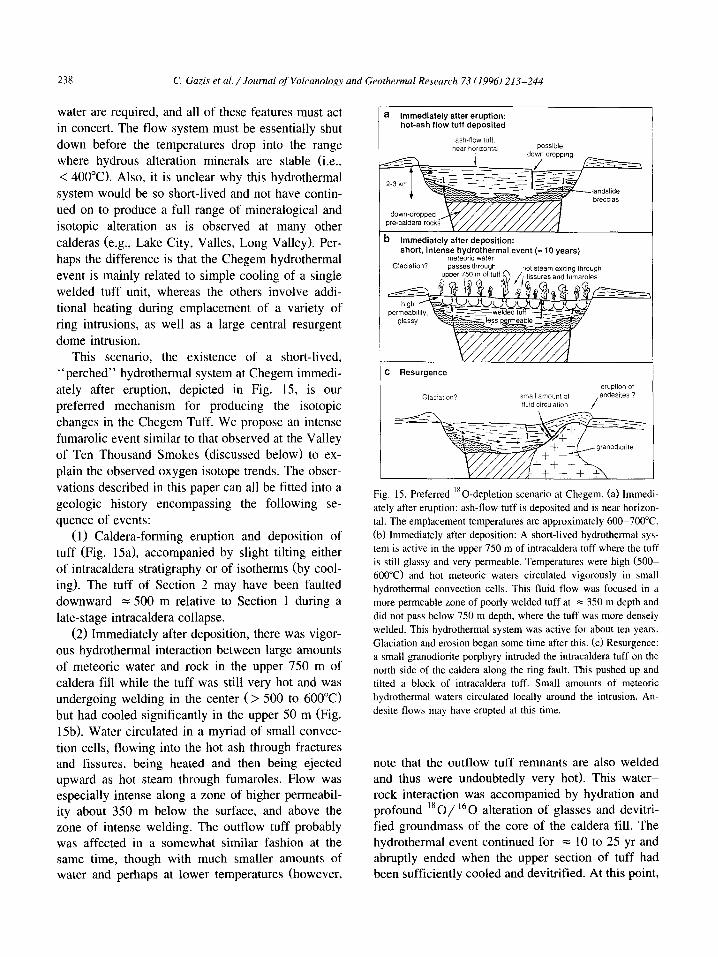
238 C. Gazis et al. /Journal of Volcanology and Geothermal Research 73 C 1996) 213-244
water are required, and all of these features must act
in concert. The flow system must be essentially shut
down before the temperatures drop into the range where hydrous alteration minerals are stable (i.e.,
< 400°C). Also, it is unclear why this hydrothermal
system would be so short-lived and not have contin-
ued on to produce a full range of mineralogical and
isotopic alteration as is observed at many other
calderas (e.g., Lake City, Valles, Long Valley). Per-
haps the difference is that the Chegem hydrothermal
event is mainly related to simple cooling of a single
welded tuff unit, whereas the others involve addi-
tional heating during emplacement of a variety of
ring intrusions, as well as a large central resurgent
dome intrusion.
This scenario, the existence of a short-lived,
“perched” hydrothermal system at Chegem immedi-
ately after eruption, depicted in Fig. 15, is our
preferred mechanism for producing the isotopic
changes in the Chegem Tuff. We propose an intense
fumarolic event similar to that observed at the Valley of Ten Thousand Smokes (discussed below) to ex-
plain the observed oxygen isotope trends. The obser-
vations described in this paper can all be fitted into a
geologic history encompassing the following se-
quence of events:
(1) Caldera-forming eruption and deposition of
tuff (Fig. 15a), accompanied by slight tilting either
of intracaldera stratigraphy or of isotherms (by cool- ing). The tuff of Section 2 may have been faulted
downward = 500 m relative to Section 1 during a
late-stage intracaldera collapse.
(2) Immediately after deposition, there was vigor-
ous hydrothermal interaction between large amounts
of meteoric water and rock in the upper 750 m of
caldera fill while the tuff was still very hot and was undergoing welding in the center (> 500 to 600°C)
but had cooled significantly in the upper 50 m (Fig.
15b). Water circulated in a myriad of small convec-
tion cells, flowing into the hot ash through fractures and fissures, being heated and then being ejected upward as hot steam through fumaroles. Flow was especially intense along a zone of higher permeabil- ity about 350 m below the surface, and above the zone of intense welding. The outflow tuff probably was affected in a somewhat similar fashion at the same time, though with much smaller amounts of water and perhaps at lower temperatures (however,
3 Immediately after eruption: hot-ash flow tuff deposited
3 Immediately after deposition: short, intense hydrothermal event (= 10 years)
rnNP”W WatLr
C Resurgence
Fig. 15. Preferred ‘*O-depletion scenario at Chegem. (a) Immedi-
ately after eruption: ash-flow tuff is deposited and is near horizon-
tal. The emplacement temperatures are approximately 600-700°C.
(b) Immediately after deposition: A short-lived hydrothermal sys-
tem is active in the upper 750 m of intracaldera tuff where the tuff
is still glassy and very permeable. Temperatures were high (500-
600°C) and hot meteoric waters circulated vigorously in small
hydrothermal convection cells. This fluid flow was focused in a
more permeable zone of poorly welded tuff at = 350 m depth and
did not pass below 750 m depth, where the tuff was more densely
welded. This hydrothermal system was active for about ten years.
Glaciation and erosion began some time after this. (c) Resurgence:
a small granodiorite porphyry intruded the intracaldera tuff on the
north side of the caldera along the ring fault. This pushed up and
tilted a block of intracaldera tuff. Small amounts of meteoric
hydrothermal waters circulated locally around the intrusion. An-
desite flows may have erupted at this time.
note that the outflow tuff remnants are also welded and thus were undoubtedly very hot). This water- rock interaction was accompanied by hydration and profound “O/ I60 alteration of glasses and devitri- fied groundmass of the core of the caldera fill. The hydrothermal event continued for = 10 to 25 yr and abruptly ended when the upper section of tuff had been sufficiently cooled and devitrified. At this point,
C. Gazis et al. /Journal of Volcanology and Geothenal Research 73 (1996) 213-244 239
the fractures and other hydrothermal conduits had been partially sealed by mineral deposition (e.g., quartz) such that the permeability of the tuff body was lower and hydrothermal circulation was no longer possible.
(3) Glacial erosion occurred some time after the deposition of the tuff. The timing of this glaciation relative to the hydrothermal event and the intrusion of the granodiorite is poorly constrained.
(4) Resurgence of granodiorite porphyry in the northeast part of the caldera (Fig. 1%) possibly accompanied by uplift of Section 2 relative to Sec- tion 1 (= 200 m). The intrusion also pushed up and tilted the small resurgent block of isotopically altered tuff. The vigorous high-temperature hydrothermal activity had largely ceased at this point but some meteoric water was still present at depth, producing a small, high-temperature hydrothermal system in this part of the caldera, which interacted with the (glassy?) groundmass of the intrusion as it cooled and devitri- lied, but not with the immediately adjacent tuffs.
(5) Eruption of andesite flows after hydrothermal activity had ceased at the surface. The eruption of andesites could actually be synchronous with the intrusion of the granodiorite if fluid flow had ceased at the surface before it had stopped at depth.
This model implies that the dacitic tuffs of Zone C were once low-‘*0 rocks also. Their present high Si*O values were probably caused by later low-tem- perature interaction with meteoric water near the surface before significant erosion of the caldera fill had occurred.
The source of the meteoric waters and geometry of the flow system is poorly constrained by this study. More work will need to be done to sort out these details. Sr isotope studies (Gazis, 1994) indi- cate that the waters carried radiogenic strontium which could only have come from the crystalline basement to the south of the caldera. However, this crystalline basement is also present within the intra- caldera tuff sequence in as slide debris in the form of megabreccias and lithic fragments, particularly along the margins of the caldera, perhaps providing a local, internal source for this radiogenic strontium. One possible source for the meteoric water is a lake or glacier near the caldera fill.
Given the large amounts of water that have to be heated to produce these “O/ I60 effects, tempera-
tures of 500 to 600°C probably could not be sus- tained for more than lo-25 yr, because of the con- straints of heat balance. The following simple heat balance calculation illustrates this point: The W/R ratio for the hydrothermally altered zone of tuff probably falls between 0.3 and 0.6 (see earlier dis- cussion), which converts to 0.17 to 0.34 in weight units (g H,O/g rock). The average heat capacity of water/steam over the temperature range from 25 to 500°C is 0.6 calg -’ “C-l (Haar et al., 1984). Thus, the heat needed to raise the temperature of water from 25 to 500°C is 285 Cal/g H,O. In addition, the water will be vaporized. The enthalpy of vaporiza- tion of water at 1 atm and 100°C is 540 Cal/g H,O (Marsh, 1987), so the total heat needed to bring the water to 500°C and vaporize it is = 825 Cal/g H,O. Using the W/R ratio to convert this to rock weight, we find that the heat needed is about 140 to 280 Cal/g rock. Rhyolite tuff has a heat capacity of about 0.22 Cal/g (Riehle, 1973). If such a rock is cooled from 800 to 5OO”C, it will produce 66 Cal/g of heat. Although this is not sufficient to heat and vaporize the water, an additional 30-70 Cal/g of latent heat is given off as the glass crystallizes or devitrifies. Thus the total heat budget of the rock is 96 to 136 Cal/g, somewhat less than to the heat budget of the water. The additional heat required in this model can be readily inferred to come from the cooling of the thick mass of welded tuff below the permeable zone. This simple calculation suggests that hot, devitrifying Chegem Tuff had just enough heat to sustain the high temperatures and water-rock ratios in the scenario we propose, but that after the welded tuff had devitrified (crystallized), it could no longer sustain these high temperatures.
Since we know the timescales of this hydrother- mal event and the W/R ratios, we can calculate fluxes of water through the system if we assume some geometry of fluid flow. The flux of water or of an aqueous fluid (in moles per unit cross-sectional area per unit time) through an elemental volume of rock (a cube with each side length d in cm) is given by (e.g., Taylor, 1996):
F bV4(NwR)
H,O = (Wt)
where W/R is the material-balance open-system

240 C. Gazis et al./ Journal oj’Valcanology and Geothemal Research 73 (1996) 213-244
water rock ratio, t is the duration of fluid flow in s,
h/d is the total flow length (A) divided by the size
of each elemental volume, and m is a factor which
converts the W/R ratio to moles of HZ0 per unit
elemental volume. If we arbitrarily choose an ele-
mental volume of 1 cm3 (d = 1 cm), then m is
approximately 0.076 moles. The W/R ratio for the
system probably falls between 0.3 and 0.6 (see ear-
lier discussion), and so for a length scale of 750 m
(i.e., the side of an equant convection cell, defined
by the thickness of the hydrothermal zone) and a
timescale of 10 to 25 yr, we have fluxes of 2.2 X
10e6 to 1.1 X lop5 molcm-*s-I (equivalent to
4.0 X lo-* to 2.0 X 10e7 lcm~‘s-’ for liquid
H,O). A final question is whether this high flux of
aqueous fluid is feasible. That is, can these fluxes be
attained with geologically reasonable permeabilities.
We can make an order of magnitude estimate of the
permeability needed by using a simple version of
Darcy’s Law (Dullien, 1979):
-k L’=-vp*
77
where I? is the Darcy velocity of the fluid
(cm3 cm- * s- ’ ), k is the permeability in cm2, -Q is
the fluid viscosity (poise), and P * is the piezometric
pressure (dyn/cm’). Thus, since the Darcy velocity
is related to the flux we calculated by:
where M is the molar weight of the aqueous fluid
and p is its density, we can cast the permeability k
in terms of these variables:
k= -41,o *(:)*!a We must make estimates of the water density and viscosity, and the piezometric pressure gradient. At 500°C and a pressure sufficient to maintain com- pressed water (= 100 bar), the density of water is 0.8 g/cm” and the viscosity of water is about 1 X lo-’ poise. Because this is a near-surface environ- ment, we will assume that the water is at hydrostatic pressure in hydrothermal cells = 750 m in diameter and that when the water rises as steam, it exerts no
pressure. This is equivalent to a pressure gradient of
980 dyn/cm3. These values predict permeabilities of 5.0 X lo-” to 2.5 X lo-“’ cm* or 5 to 25 milli-
darcy. Though these values are fairly high, measure-
ments of permeabilities in ash-flow tuff from Yucca
Mountain, Nevada (Nelson and Anderson, 19921,
have revealed comparable values. In fact, glassy
sections are commonly several orders of magnitude more permeable than devitrified tuff, with values as
high as 100 millidarcy (Nelson and Anderson, 1992).
Devitrification or mineralogical alteration tends to
reduce the permeability of such a rock. Also, the
permeabilities at Yucca Mountain were measured on
borehole samples and do not reflect the bulk perme-
ability of the rock. Any fracture permeability will
increase these values, and so our estimated perme-
abilities for the Chegem Tuff would seem to be
entirely reasonable, and well capable of allowing
circulation of the required amounts of H,O.
5.8. The Valley of Ten Thousand Smokes-A histori-
cal analogue?
In searching to understand the process which caused the extreme I80 depletion and disequilibrium
at Chegem, and in trying to develop a realistic model
of this system, we have also sought a modern ana-
logue. We suggest that the fumarolic activity at the
Valley of Ten Thousand Smokes in Alaska may be
just such an analogue, though at a different scale,
and in a somewhat different geologic setting (namely
in a much smaller eruption and in the thinner out-
flow facies of a welded ash-flow sheet rather than in
the thick caldera-fill facies as at Chegeml. The Valley of Ten Thousand Smokes is located at
the foot of Mt. Katmai on the Alaska Peninsula.
During the 1912 eruption of Novarupta caldera, = 20 km3 of air-fall tephra and 1 l- 15 km’ of ash-flow
tuff were ejected, much of which filled the nearby
valley with a = 200-m-thick sheet (Hildreth, 1983). This was one of the most voluminous historic erup- tions, and was unique in that the pyroclastic flows
came to rest on land and were subsequently welded. The valley was discovered in 1916 by Robert F.
Griggs, the head of a National Geographic Society expedition, and so named because of the many fis- sures and fumaroles that were vigorously emitting steam. In a subsequent expedition in 1917, Shipley

C. Gazis et al. /Journal of Volcanology and Geothermal Research 73 (I 996) 213-244 241
(1920) collected gases and attempted to measure
fumarole temperatures, but as he only had a mercury
thermometer, he could not measure temperatures above 357°C (the boiling point of mercury). In 1919,
Allen and Zies (1923) succeeded in measuring fuma-
role temperatures as high as 645°C using Hoskins
thermocouples. Several other fumaroles with temper-
atures above 500°C were measured and several oth-
ers were observed to melt lead or zinc. Allen and Zies (1923) also determined that the gases were
made up almost entirely of steam. Details of their
studies of the fumarolic gases and the near-surface mineral deposits are given in Allen and Zies (1923)
and Zies (1924a,b,1929)). Griggs (1922) and Fenner (1920) also published descriptions of those early
expeditions.
The hydrothermal activity at the Valley of Ten
Thousand Smokes was vigorous, but short-lived.
Within 15 yr, the high-temperature activity had
ceased and the fumaroles became hot springs and
mud pots before dying out altogether (Zies, 1924b), except in the vent region and one locality outside the
vent region (Keith, 199 1).
By comparison, the eruption of the Chegem
caldera produced pyroclastic deposits an order of
magnitude greater in volume than those at the Valley
of Ten Thousand Smokes. Furthermore, the intra- caldera fill is at least two km thick, as opposed to the
200-m thickness at the Valley of Ten Thousand
Smokes. Thus, one would expect that a similar hy-
drothermal event at Chegem would be much more
vigorous and involve larger volumes of water. This
is certainly consistent with our observations. This
correlation between the actual events at Katmai and
our hypothetical model of the Chegem system is
made even more compelling because we formulated
the basic parameters of our Chegem model (i.e., temperatures of 500-600°C a timescale of lo-25
yr, and exchange with large volumes of H,O) long before we realized that these same parameters are in
fact part of the historical record at the Valley of Ten
Thousand Smokes.
It would also be interesting to compare the dis-
charge rates at the Valley of Ten Thousand Smokes with the calculated fluxes of water in the Chegem system. Unfortunately, no careful measurements were made of discharge rates. However, Zies (1929) did make an estimate that the total volume of steam
‘ ‘exhaled” by the fumaroles was 26 X lo6 l/s
(calculated at 100°C and 1 atm). If the density of the
steam is 0.00059 g/cm3 and the total area through which it flows is the area of the valley ( = 120 km* ),
then this estimated discharge rate converts to a flux
of = 7 x lo-’ molcm-‘s-‘, within an order of
magnitude of our lowest calculated value. First-hand
descriptions of fumaroles at the Valley of Ten Thou-
sand Smokes also suggest that the flux of water
through these permeable tuffs was in fact compara-
ble to the calculated flux at Chegem. For example,
Griggs (1918) wrote: “Now [the valley] is traversed by hundreds of
fissures extending along its margin or criss-crossing
its floor. These fissures are the seat of several mil-
lions of volcanic vents of all sizes, from great volca-
noes pouring forth columns of vapour more than a
mile high, down to minute jets of gas which pass
unnoticed amongst their greater neighbours... For
here, continually rising quietly from the ground with-
out explosive action of any sort, is more vapour than is given off by all the rest of the world’s volcanoes
put together (except during a period of dangerous
eruption). ’ ’ One possible shortcoming of this analogy is that
the fumarolic activity at the Valley of Ten Thousand
Smokes is known to have been accompanied by
extensive mineralogical alteration and deposition of
fumarolic minerals (e.g., Zies, 1929; Papike et al.,
1991; Keith, 1991; Spilde et al., 1993). No evidence
has been found for fossil fumaroles or their deposits
in the Chegem intracaldera fill. However, this evi-
dence would only be expected in the near-surface portion of the caldera fill, which has been eroded
more extensively at Chegem than the lower part.
Also, the major fumaroles at Katmai were spaced
roughly 500-1000 m apart (fig. 1 in Zies, 1929) and
thus their deeper conduits might be difficult to locate at Chegem without doing careful fieldwork. More-
over, fumarolic encrustations are often metastable or
unstable under cooling fumarolic conditions, are sol-
uble in water or acids formed at the surface, and/or
are easily eroded (Keith et al., 1992); thus they are
not likely to be preserved in a 2.8 million year old caldera system.
This analogy between the hydrothermal event at Chegem and the fumarolic activity at the Valley of Ten Thousand Smokes can easily be tested by exam-

242 C. Gazis et al. / Journal of Volcanology and Geothermal Research 73 (1996) 213-244
ining samples from the Valley of Ten Thousand
Smokes. In particular, if the Valley of Ten Thousand
Smokes is ever drilled, a hole in the tuff would yield
a core which would be ideal for testing this model.
Acknowledgements
This research was part of the Caucasus-Western
USA cooperative project which was supported by the
Russian Academy of Sciences, the U.S. National
Academy of Science, and the U.S. Geological Sur-
vey. The authors are grateful to Peter Lipman for his
extremely helpful encouragement and guidance on
this project, as well as to Charles Bacon and an
anonymous reviewer for their helpful comments on
the manuscript. We also thank Valentine Beus, Ana-
toly Gurbanov, Nikolai Koronovsky, Igana Latifova,
and Peter Marchev for sharing in discussions, field
work and sample collection. Financial support for
this study was also provided by NSF grant EAR90-
19190, Division of Geological and Planetary Sci-
ences, California Institute of Technology, Pasadena,
CA, 91125. Contribution No. 5618, Division of Geological
and Planetary Sciences, California Institute of Tech-
nology.
References
Allen, E.T. and Zies, E.G., 1923. A chemical study of the
fumaroles of the Katmai region. Natl. Geogr. Sot. Contrib.
Tech. Pap., Katmai Ser., 2: 75-155.
Bacon, C.R., Adami, L.H. and Lanphere, M.A., 1989. Direct
evidence for the origin of 10w-‘~O silicic magmas: quenched
samples of a magma chamber’s partially-fused granitoid walls,
Crater Lake Oregon. Earth Planet. Sci. Lett., 96: 199-208.
Bierwith, P.N., 1982. Experimental welding of volcanic ash.
Ph.D. Thesis, Monash Univ.
Bogatikov, O.A., Gurbanov, A.G., Koronovsky, N.V., Kovalenko,
V.I., Lipman, P.W. and Tsvetkov, A.A., 1992. 2.5 Ma ash-flow
caldera at Chegem River in the northern Caucasus Mountains
(USSR), contemporaneous granites and associated ore bodies.
Izv. Russian Acad. Sci. Ser. Geol., 1: 5-21 (in Russian);
English Transl. in Int. Geol. Rev., 34: 131-147.
Bowman, J.R., Willett, S.D. and Cook, S.J., 1994. Oxygen iso-
topic transport and exchange during fluid flow: One-dimen-
sional models and applications. Am. J. Sci., 294: 1-55.
Cas, R.A.F. and Wright, J.V., 1988. Volcanic Successions. Unwin
Hyman, London, 528 pp.
Cerling, T.E., Brown, F.H. and Bowman, J.R., 1985. Low-temper-
ature alteration of volcanic glass: Hydration, Na, K, 180, and
Ar mobility. Chem. Geol., 52: 281-293.
Clayton, R.N. and Kieffer, S.W., 1991. Oxygen isotopic ther-
mometer calibrations. In: H.P. Taylor Jr., J.R. O’Neil and I.R.
Kaplan (Editors), Stable Isotope Geochemistry: A Tribute to
Samuel Epstein. Geochem. Sot. Spec. Publ., 3: 3-10.
Cole, D.R., Ohmoto, H. and Lasaga, A.C., 1983. Isotopic ex-
change in mineral-fluid systems. I. Theoretical evaluation of
oxygen isotopic exchange accompanying surface reactions and
diffusion. Geochim. Cosmochim. Acta, 47: 1681-1693.
Cole, D.R., Ohmoto, H. and Jacobs, G.K., 1992. Isotopic ex-
change in mineral-fluid systems: III. Rates and mechanisms
of oxygen isotope exchange in the system granite-H,O+ NaCl
+ KC1 at hydrothermal conditions. Geochim. Cosmochim.
Acta, 56: 445-466.
Craig, H., 1961. Isotopic variations in meteoric waters. Science,
133: 1702-1703.
Crank, J., 1975. The Mathematics of Diffusion. Clarendon Press,
Oxford.
Criss, R.E. and Hofmeister, A.M., 1991. Application of fluid
dynamical principles in tilted permeable media to terrestrial
hydrothermal systems. Geophys. Res. Lett.. 18: 199-202.
Criss, R.E., Gregory, R.T. and Taylor Jr., H.P., 1987. Kinetic
theory of oxygen isotope exchange between minerals and
water. Geochim. Cosmochim. Acta., 5 1: 1099- 1108.
Dullien, F.A.L., 1979. Porous Media. Fluid Transport and Pore
Structure. Academic Press, New York, NY.
Fenner, C.N., 1920. The Katmai region, Alaska, and the great
eruption of 1912. J. Geol., 28: 569-606.
Fridrich, C.J., Smith, R.P., Dewitt, E. and McKee, E.H., 1991.
Structural, eruptive and intrusive evolution of the Grizzly Peak
caldera, Sawatch Range, Colorado. Geol Sot. Am. Bull., 103:
1160-1177.
Friedman, I. and Smith, R.L., 1960. A new dating method using
obsidian. Am. Antiq., 25: 347-352.
Friedman, I., Smith, R.L. and Long, R.L., 1966. Hydration of
natural glass and formation of perlite. Geol. Sot. Am. Bull..
77: 323-328.
Gazis, C.A., 1994. An isotopic study of the fluid flow and thermal
history of the 2.8 Ma Chegem ash-flow caldera and related
intrusive rocks (Caucasus Mountains, Russia). Ph.D. Thesis,
California Inst. Technol., 280 pp.
Gazis, C.A., Hon, K., Taylor Jr., H.P., Tsvetkov, A.A. and Beus,
V., 1992. Stratigraphically-controlled geochemical trends
within the Chegem caldera, central Caucasus Mountains, Rus-
sia. EOS, 73: 623.
Gazis, CA., Lanphere, M., Taylor Jr., H.P. and Gurbanov, A.,
1995. 40Ar/ 39Ar and ‘*O/ I60 studies of the Chegem ash-flow
caldera and the Eldjurta Granite: Cooling of two Late Pliocene
igneous bodies in the Greater Caucasus Mountains, Russia.
Earth Planet. Sci. Lett., 134: 377-391.
Gazis, CA., Hon, K., Taylor Jr., H.P. and Saleeby, J.S., in prep.
Geochemical and Sr isotopic studies of the Chegem igneous
rocks and the Eldjurta Granite (Caucasus, Russia): Petroge-
netic and hydrothermal signatures.
Giletti, B.J., Semet, M.P. and Yund, R.A., 1978. Studies in

C. Gazis et al./ Journal of Volcanology and Geothermal Research 73 (1996) 213-244 243
diffusion-III. Oxygen in feldspars: an ion microprobe deter-
mination. Geochim. Cosmochim. Acta, 42: 4.5-57.
Gregory, R.T. and Taylor Jr., H.P., 1986. Non-equilibrium, meta-
somatic IsO/ I60 effects in upper mantle mineral assem-
blages. Contrib. Mineral. Petrol., 93: 124-135.
Gregory, R.T., Criss, R.E. and Taylor Jr., H.P., 1989. Oxygen
isotope exchange kinetics of mineral pairs in closed and open
systems: Applications to problems of hydrothermal alteration
of igneous rocks and Precambrian iron formations. Chem.
Geol., 75: l-42.
Griggs, R.F., 1918. The eruption of Katmai. Nature, 101: 497-499.
Griggs, R.F., 1922. The Valley of Ten Thousand Smokes. Natl.
Geogr. Sot., Washington, DC.
Grunder, A.L., 1987. Low 6l*O silicic volcanic rocks at the
Calabozos Caldera Complex, Southern Andes. Contrib. Min-
eral. Petrol., 95: 71-81.
Haar, L., Gallagher, J.S. and Kell, G.S., 1984. NBS/NRC Steam
Tables. Hemisphere Press, New York, NY.
Harris, C. and Erlank, A.J., 1992. The production of large-volume,
10w-8’~0 rhyolites during rifting of Africa and Antarctica:
The Lebombo Monocline, southern Africa. Geochim. Cos-
mochim. Acta, 56: 3561-3570.
Hildreth, W., 1979. The Bishop Tuff: Evidence for the origin of
compositional zonation in silicic magma chambers. Geol. Sot.
Am. Spec. Pap., 180: 43-75.
Hildreth, W., 1981. Gradients in silicic magma chambers: Implica-
tions for lithospheric magmatism. J. Geophys. Res., 86:
10,153-10,192.
Hildreth, W., 1983. The compositionally zoned eruption of 1912
in the Valley of Ten Thousand Smokes, Katmai National Park,
Alaska. J. Volcanol. Geotherm. Res., 18: l-56.
Hildreth, W., Christiansen, R.L. and O’Neil, J.R., 1984. Catas-
trophic isotopic modification of rhyolitic magma at times of
caldera subsidence, Yellowstone Plateau Volcanic Field. J.
Geophys. Res., 89: 8339-8369.
Hildreth, W., Halliday, A.N. and Christiansen, R.L., 1991. Iso-
topic and chemical evidence concerning the genesis and con-
tamination of basaltic and rhyolitic magma beneath Yellow-
stone Plateau volcanic field. J. Petrol., 32: 63-138
Johnson, C.M., Lipman, P.L. and Czamanske, G.K., 1990. H, 0,
Sr, Nd, and Pb isotope geochemistry of the Latir volcanic field
and cogenetic intrusions, New Mexico, and relations between
evolution of a continental magmatic center and modifications
of the lithosphere. Contrib. Mineral. Petrol., 104: 99-124.
Keith, T.E.C., 1991. Fossil and active fumaroles in the 1912
eruptive deposits, Valley of Ten Thousand Smokes, Alaska. J.
Volcanol. Geotherm. Res., 45: 227-254.
Keith. T.E.C., Thompson, J.M., Hutchinson, R.A. and White,
L.D., 1992. Geochemistry of waters in the Valley of Ten
Thousand Smokes region, Alaska. J. Volcanol. Geotherm.
Res., 49: 209-23 1.
Lambert, S.J. and Epstein, S., 1980. Stable isotope investigations
of an active geothermal system in Valles caldera, Jemez Mountains, New Mexico. J. Volcanol. Geotherm. Res., 8: 111-129.
Larson, P.B. and Taylor Jr., H.P., 1986a. An oxygen isotope study
of hydrothermal alteration in the Lake City caldera, San Juan
Mountains, Colorado. J. Volcanol. Geotherm. Res., 30: 47-82.
Larson, P.B. and Taylor Jr., H.P., 1986b. An oxygen-isotope study
of water-rock interaction in the granite of Cataract Gulch,
western San Juan Mountains, Colorado. Geol. Sot. Am. Bull.,
97: 505-515.
Lipman, P.W., 1967. Mineral and chemical variations within an
ash-flow sheet from the Aso caldera, Southwestern Japan.
Contrib. Mineral. Petrol., 16: 300-327.
Lipman, P.W. and Friedman, I., 1975. Interaction of meteoric
water with magma: An oxygen-isotope study of ash-flow
sheets from southern Nevada. Geol. Sot. Am. Bull., 86:
695-702.
Lipman, P.W., Bogatikov, O.A., Tsvetkov, A.A., Gazis, C., Gur-
banov, A.G., Hon. K., Koronovsky, N.V., Kovalenko, V.I. and
Marchev, P., 1993. 2.8 Ma ash-flow caldera at Chegem River
in the northern Caucasus Mountains (Russia), contemporane-
ous granites, and associated ore deposits. J. Volcanol.
Geotherm. Res., 57: 85-124.
Lofgren, G., 1970. Experimental devitritication rates of rhyolite
glass. Geol. Sot. Am. Bull., 81: 553-560.
Marsh, K.N. (Editor), 1987. Recommended Reference Materials
for the Realization of Physicochemical Properties. Blackwell,
Oxford.
Marshall, R.R., 1961. Devitritication of natural glass. Geol. Sot.
Am. Bull., 72: 1493-1520.
Muehlenbachs, K., Anderson Jr., A.T. and Sigvaldason, G.E.,
1974. Low-018 basalts from Iceland. Geochim. Cosmochim.
Acta, 38: 577-588.
Nelson, P.H. and Anderson, L.A., 1992. Physical properties of ash
flow tuff from Yucca Mountain, Nevada. J. Geophys. Res., 97:
6823-6841.
Norton, D. and Taylor Jr., H.P., 1979. Quantitative simulation of
the hydrothermal systems of crystallizing magmas on the basis
of transport theory and oxygen isotopic data. J. Petrol., 20:
42 I -486.
Papike, J.J., Keith, T.E.C., Silde, M.N., Galbreath, K.C., Shearer,
C.K. and Lam, J.C., 1991. Geochemistry and mineralogy of
fumarolic deposits, Valley of Ten Thousand Smokes, Alaska:
Bulk chemical and mineralogical evolution of dacite-rich pro-
tolith. Am. Mineral., 76: 1662-1673.
Philip, H., Cistemas, A., Gvishiani, A. and Gorshkov, A., 1988.
The Caucasus: An actual example of the initial stages of
continental collision. Tectonophysics, 161: l-21.
Riehle, J.R., 1973. Calculated compaction profiles of rhyolitic
ash-flow tuffs. Geol. Sot. Am. Bull., 4: 2193-2216.
Ross, C.S. and Smith, R.L., 1961. Ash-flow tuffs: Their origin,
geologic relations and identification. U.S. Geol. Surv. Prof.
Pap., 366: 1-81.
Sheridan, M.F., Barberi, F., Rosi, M. and Santacroce, R., 1981. A
model for Plinean eruptions of Vesuvius. Nature, 289: 282- 285.
Shipley, J.W., 1920. Some chemical observations on the volcanic
emanations and incrustations in the Valley of 10,000 Smokes,
Katmai, Alaska. Am. J. Sci., Ser. 4, 50: 141-153.
Smith, B.M. and Suemnicht, G.A., 1991. Oxygen isotope evi-
244 C. Gazis et al. /Journal of Volcanology and Geothermal Research 73 (1996) 213-244
dence for past and present hydrothermal regimes of Long
Valley caldera, California. J. Volcanol. Geotherm. Res., 48:
319-339.
Smith, R.L., 1979. Ash-flow magmatism. Geol. Sot. Am. Spec.
Pa,,., 180: 5-27.
Smith, R.L. and Bailey, R.A., 1966. The Bandelier Tuff: A study
of ash-flow eruption cycles from zoned magma chambers.
Bull. Volcanol., 29: 83-104.
Spilde, M.N., Brearley, A.J. and Papike, J.J., 1993. Alteration of
plagioclase and pyroxene phenocrysts in a fissure fumarole,
Valley of Ten Thousand Smokes, Alaska. Am. Mineral., 78:
1066-1081.
Stuckless, J.S. and O’Neil, J.R., 1973. Petrogenesia of the Super-
stition-superior volcanic area as inferred from strontium- and
oxygen-isotope studies. Geol. Sot. Am. Bull., 84: 1987-1998.
Taggart, J.E., Lindsay, J.R., Scott, B.A., Vivit, D.V., Bartel, A.J.
and Stewart, K.C., 1987. Analysis of geologic materials by
wavelength-dispersive X-ray fluorescence spectrometry. In:
P.A. Baedecker (Editor), Methods of Geochemical Analysis.
U.S. Geol. Surv. Bull., 1770: El-El9
Taylor Jr., H.P., 1968. The oxygen isotope geochemistry of
igneous rocks. Contrib. Mineral. Petrol., 19: l-71.
Taylor Jr., H.P., 1977. Water/rock interactions and the origin of
Hz0 in granitic batholiths. J. Geol. Sot. London, 133: 509-
558.
Taylor Jr., H.P., 1985. Igneous rocks: II. Isotopic case studies of
Circumpacific magmas. In: J.W. Valley, H.P.Taylor Jr. and
J.R. O’Neill (Editors), Stable Isotopes in High Temperature
Geological Processes. MSA Rev. Mineral., 16: 273-317
Taylor Jr., H.P., 1987. Comparison of hydrothermal systems in
layered gabbros and granites, and the origin of low-‘so
magmas. In: B.O. Mysen (Editor), Magmatic Processes:
Physicochemical Principles. Geochem. Sot. Spec. Publ.. 1:
337-357.
Taylor Jr., H.P., 1996. Oxygen and hydrogen isotope relationships
in hydrothermal mineral deposits. In: H.L. Barnes (Editor).
Geochemistry of Hydrothermal Ore Deposits. Wiley, New
York, NY (in press).
Taylor Jr.. H.P. and Epstein, S., 1962. Relationship between
o’s/0 I6 ratios in coexisting minerals in igneous and meta-
morphic rocks-Part 1. Principles and experimental results.
Geol. Sot. Am. Bull.. 73: 461-480.
Yager, D.B. and Quick, J.E., 1992. SUPERXAP Manual. U.S.
Geol. Surv., Open-File Rep. 92-l 3, 45 pp.
Zhang, Y., Stolper, E.M. and Wasserburg, G.J., 1991. Diffusion
of water in rhyolitic glasses. Geochim. Cosmochim. Acta, 55:
44 I -456.
Zies, E.G., 1924a. The fumarolic incrustations of the Valley of
Ten Thousand Smokes. Natl. Geogr. Sot. Contrib. Tech. Pap.,
Katmai Ser.. pp. 157-179:
Zies, E.G., 1924b. Hot Springs of the Valley of Ten Thousand
Smokes. J. Geol., 32: 303-310.
Zies, E.G., 1929. The Valley of Ten Thousand Smokes: I. The
fumarolic incrustations and their bearing on ore deposition. II.
The acid gases contributed to the sea during volcanic activity.
Natl. Geogr. Sot. Contrib. Tech. Pap., Katmai Ser., 4: l-79.


![Rugs of the Caucasus: Star Kazahs [with Robert Pinner]](https://static.fdokumen.com/doc/165x107/631b91ba665120b3330b6e06/rugs-of-the-caucasus-star-kazahs-with-robert-pinner.jpg)