The Magnitude of Base Erosion and Profit Shifting of ...
194
The Magnitude of Base Erosion and Profit Shifting of Multinational Enterprises with their Business Operations in New Zealand A thesis submitted in fulfilment of the Degree of Doctor of Philosophy in Taxation in the University of Canterbury by Siew Yee Chen Senior Supervisor: Professor Adrian Sawyer Co-supervisor: Associate Professor Andrew Maples Associate Supervisor: Dr Warwick Anderson February 2022
-
Upload
khangminh22 -
Category
Documents
-
view
1 -
download
0
Transcript of The Magnitude of Base Erosion and Profit Shifting of ...

The Magnitude of Base Erosion and Profit Shifting of
Multinational Enterprises with their Business Operations in New Zealand
A thesis submitted in fulfilment of the Degree of
Doctor of Philosophy in Taxation
in the University of Canterbury
by Siew Yee Chen
Senior Supervisor: Professor Adrian Sawyer
Co-supervisor: Associate Professor Andrew Maples
Associate Supervisor: Dr Warwick Anderson
February 2022

i
Acknowledgements
From the bottom of my heart, I would like to express my sincere gratitude to my research
supervisors, Professor Adrian Sawyer, Associate Professor Andrew Maples and Dr Warwick
Anderson for their consistent support of my PhD study, for their patience, guidance, and
immense knowledge. Their thoughtful comments and recommendations helped me in all the
time of research and writing of this thesis. Without their persistent help and wise guidance this
thesis would have not been the same.
My sincere thanks also go to all those academics who made their invaluable comments during
my presentations at the Australasian Tax Teachers Association Conferences/Symposium in
2019, 2020 and 2021. Their practical suggestions and advice helped me to broaden my study
from various perspectives.
Finally, I would like to thank my husband, Eadweard Lee, for supporting me spiritually
throughout writing this thesis and my life in general. I simply could not have done this without
him.

ii
Abstract
The concept of base erosion and profit shifting (BEPS) was first introduced by the Organisation
for Economic Co-operation and Development (OECD) in 2013. BEPS refers to tax avoidance
practices employed notably by multinational enterprises (MNEs) to achieve a lower tax base
through shifting profits to low or no tax jurisdictions.
This study seeks empirically to determine the BEPS issues in a New Zealand context by
focusing on two groups of multinational firms, (1) New Zealand subsidiaries owned by foreign
MNEs (NZSOFMs) and (2) New Zealand domestically owned MNEs (NZDOMs) with
overseas subsidiaries, using two methods of estimation.
The first part of the study is designed to uncover indirect indications of profit shifting by
estimating the percentage change in profits, in response to a percentage point change in the
statutory corporate tax rate, using the measure of semi-elasticity of profits. An ordinary least
squares (OLS) firm fixed effects model is employed to analyse the micro-panel data collected
for the years 2008 to 2017.
In addition to the indirect approach of observing the reported profitability of MNEs, the debt
structure and transfer price of a company also reveal certain traits of profit shifting. The second
part of the study regresses eight specific ratios related to debt, distribution of operating income
and transfer pricing on foreign ownership, controlling for size and industry, to capture profit
shifting driven by the differential in domestic tax treatment of foreign ownership as compared
to domestic ownership. The observations in the second part include NZSOFMs sampled in the
first part of study and New Zealand domestically owned companies (NZDOCs) with only
domestic subsidiaries or with at least one wholly owned foreign subsidiary. The cross-sectional

iii
data collected in 2015, when the final reports on OECD’s BEPS Action Plan were released, is
examined using the simple OLS method.
The samples in this study are selected using the full list of the companies registered in New
Zealand provided by the New Zealand Companies Office. Basic firm-level financial data is
employed to construct the variables needed for the estimation model. The data is collected and
consolidated manually from the financial statements published on the website of New Zealand
Companies Office. The commercial database Orbis, which provides financial data and
ownership information, is used as an additional source of company information.
The first part of the study on profit shifting suggests that the reported pre-tax profits of
NZSOFMs are more responsive to the single corporate tax rate of the host country (New
Zealand). The tax rate differences between NZSOFMs and their immediate parents have little
impact on the reported profits of NZSOFMs in New Zealand. On the other hand, the statistical
results of NZDOMs are not discussed in detail, but presented in the appendix, due to the
relatively small sample size of 16 NZDOMs which is highly unrepresentative of the population.
The estimation results in the second part of the study indicate that NZSOFMs have lower
interest-bearing debt, higher short-term debt, and lower long-term debt relative to total assets,
than do NZDOCs. Nonetheless, the income tax expense and net profit of NZSOFMs are
relatively higher than those of the NZDOCs, and the interest expense of NZSOFMs is lower
than NZDOCs. Lastly, there no significant difference has been identified in terms of the ratio
of earnings before interest and taxes (EBIT) to sales for NZSOFMs and NZDOCs.
Keywords: International tax; Profit shifting; Base erosion; New Zealand

iv
Table of Contents
Acknowledgements ................................................................................................................... i
Abstract ..................................................................................................................................... ii
Table of Contents .................................................................................................................... iv
List of Tables and Figures ..................................................................................................... vii
List of Appendices ................................................................................................................ viii
Table of Abbreviations ........................................................................................................... ix
Chapter 1 Introduction and Background .............................................................................. 1
1.1 Introductory Remarks ....................................................................................................... 1
1.2 An Overview of New Zealand’s International Tax Law .................................................. 7
1.2.1 New Zealand’s Permanent Establishment Rules ....................................................... 8
1.2.1.1 Double Taxation Agreements ........................................................................... 10
1.2.2 New Zealand’s Transfer Pricing Rules .................................................................... 14
1.2.3 New Zealand’s Thin Capitalisation Rules ............................................................... 18
1.2.4 New Zealand’s Non-resident Withholding Tax ....................................................... 20
1.2.5 New Zealand’s Controlled Foreign Companies Rules ............................................ 22
1.2.6 New Zealand’s Foreign Investment Fund Rules ..................................................... 23
1.3 International Tax Aspects of New Zealand .................................................................... 24
1.3.1 The New Zealand Economy and the Economic Relationship with Australia ......... 24
1.3.2 New Zealand and Australia Statutory Corporate Tax Rates (1980–2019) .............. 25
1.3.3 Globalisation and Corporate Tax Policy ................................................................. 29
1.4 Objectives and Scope of Research ................................................................................. 33
1.4.1 Background and Motivation .................................................................................... 33
1.4.2 Objectives of the Research and Research Questions ............................................... 36
1.5 Structure of the Thesis.................................................................................................... 39
Chapter 2 Literature Review and Development of Hypotheses ........................................ 41
2.1 Introduction .................................................................................................................... 41
2.2 Measuring BEPS ............................................................................................................ 41
2.2.1 The Problems of Measuring BEPS .......................................................................... 42
2.2.2 Currently Available Data Sources ........................................................................... 44
2.2.3 The Magnitude of BEPS .......................................................................................... 49
2.3 A Review of the Empirical Literature on BEPS ............................................................ 53
2.3.1 Empirical Methods of Measuring BEPS ................................................................. 56
2.3.1.1 Profit Measures and Corporate Tax Rates ......................................................... 56

v
2.3.1.2 Comparing Non-domestic Enterprises with Domestic Enterprises ................... 60
2.3.1.3 Meta-analysis ..................................................................................................... 61
2.3.1.4 Revenue Loss Estimates .................................................................................... 63
2.3.1.5 Foreign Direct Investment as Indirect Measure of BEPS ................................. 64
2.3.2 Major BEPS Channels ............................................................................................. 65
2.3.2.1 Debt Shifting ..................................................................................................... 65
2.3.2.2 Transfer Pricing ................................................................................................. 66
2.3.2.3 Mismatches between Tax Regimes and Preferential Tax Treatment ................ 67
2.4 Development of Hypotheses .......................................................................................... 67
2.5 Conclusion ...................................................................................................................... 71
Chapter 3 Research Methodology and Estimation Approach ........................................... 72
3.1 Introduction .................................................................................................................... 72
3.2 Research Paradigms ....................................................................................................... 72
3.2.1 Positivism ................................................................................................................ 73
3.3 Estimating Equations...................................................................................................... 74
3.4 Sample Selection ............................................................................................................ 84
3.4.1 Sampling in Quantitative Research ......................................................................... 84
3.4.1.1 Sample Companies and Sample Years for H1 and H2 ....................................... 84
3.4.1.2 Determining the Final Sample for H1 and H2 .................................................... 93
3.4.1.3 Sample Companies and Sample Years for H3 to H5 .......................................... 97
3.4.1.4 Determining the Final Sample for H3 to H5 ...................................................... 98
3.4.2 Data Collection Procedures and Limitations ......................................................... 100
3.5 Conclusion .................................................................................................................... 102
Chapter 4 Statistical Results ............................................................................................... 103
4.1 Introduction .................................................................................................................. 103
4.2 Statistical Results for Profit Shifting of NZSOFMs .................................................... 103
4.2.1 Descriptive Statistics for NZSOFMs ..................................................................... 103
4.2.2 Pearson Correlations for NZSOFMs ..................................................................... 107
4.2.3 Panel Regressions for NZSOFMs.......................................................................... 109
4.2.4 Logistic Regressions for NZSOFMs ..................................................................... 113
4.3 Statistical Results for Profit Shifting of NZDOMs ...................................................... 116
4.4 Statistical Results for Debt Shifting of NZSOFMs and NZDOCs ............................... 117
4.4.1 T-test Results for NZSOFMs and NZDOCs.......................................................... 117
4.4.2 Multiple Linear Regressions for NZSOFMs and NZDOCs .................................. 123
4.5 Summary of the Statistical Results .............................................................................. 127

vi
Chapter 5 Limitations, Contributions, Recommendations, and Conclusions ................ 129
5.1 Introduction .................................................................................................................. 129
5.2 Thesis Overview ........................................................................................................... 129
5.3 Summary of Findings ................................................................................................... 130
5.4 Limitations of the Study ............................................................................................... 133
5.5 Theoretical and Practical Contributions ....................................................................... 135
5.6 Recommendations for Future Research ....................................................................... 136
5.7 Concluding Remarks .................................................................................................... 138
Bibliography ......................................................................................................................... 139
Appendices ............................................................................................................................ 162

vii
List of Tables and Figures
List of Tables
Table 1.1 New Zealand Resident and Non-Resident Companies .............................................. 7
Table 1.2 New Zealand’s DTAs and Year of Establishment ................................................... 12
Table 2.1 Macro-data Sources and Accessibility ..................................................................... 46
Table 2.2 Micro-data Sources and Accessibility ..................................................................... 47
Table 2.3 Currently Available Databases ................................................................................ 48
Table 2.4 OECD BEPS Action 11: Six Indicators of BEPS .................................................... 52
Table 3.1 Variables-construction and Data Sources for Profit Shifting .................................. 78
Table 3.2 Variables-construction and Data Sources for Debt Shifting .................................... 82
Table 3.3 Descriptions of New Zealand Business Industry ..................................................... 83
Table 3.4 Number of Business Entities, Tax Rate and Taxable Income in New Zealand ....... 85
Table 3.5 Financial Reporting Requirements for New Zealand Companies ........................... 88
Table 3.6 Business Entity Types in New Zealand ................................................................... 91
Table 3.7 Registered LTD and ULTD that Matched the Sample Years .................................. 93
Table 3.8 Final Samples of NZSOFMs and NZDOMs............................................................ 95
Table 3.9 Number of NZSOFMs making losses from 2008–2017 .......................................... 96
Table 3.10 Final Samples of LTD and ULTD Companies to Test H3 ..................................... 99
Table 3.11 Final Samples of LTD and ULTD Companies to Test H4 ..................................... 99
Table 3.12 Final Samples of LTD and ULTD Companies to Test H5 ................................... 100
Table 4.1 Descriptive Statistics for Key Variables of NZSOFMs ......................................... 105
Table 4.2 Location of Immediate Parent of NZSOFMs ........................................................ 106
Table 4.3 Pearson Correlations for Key Variables of NZSOFMs ......................................... 108
Table 4.4 Profit Shifting of NZSOFMs ................................................................................. 112
Table 4.5 Logistic Regression Results of NZSOFMs ............................................................ 113
Table 4.6 Effects Estimates for Logistic Regression of NZSOFMs ...................................... 115
Table 4.7 Descriptive Statistics of Interest-bearing Debt Ratio ............................................ 119
Table 4.8 Descriptive Statistics of Indicators Related to Debt Structure .............................. 120
Table 4.9 Descriptive Statistics of Indicators Related to Distributions of EBIT ................... 121
Table 4.10 Descriptive Statistics of Indicators Related to Transfer Pricing .......................... 122
Table 4.11 Multiple Regression Results of Indicators Related to Debt Structure ................. 125
Table 4.12 Multiple Regression Results of Indicators Related to Distribution of EBIT ....... 126
Table 4.13 Multiple Regression Results of Indicators Related to Transfer Pricing .............. 127
List of Figure
Figure 1.1 New Zealand and Australia Statutory Corporate Tax Rates, 1980–2019 .............. 26

viii
List of Appendices
Appendix A Summary of Existing BEPS Studies ................................................................. 162
Appendix B Foreign Direct Investment in New Zealand by Country, March 2020 .............. 169
Appendix C New Zealand’s Direct Investment Abroad by Country, March 2020 ............... 170
Appendix D Descriptive Statistics for Key Variables of NZDOMs ...................................... 171
Appendix E Pearson Correlations for Key Variables of NZDOMs ....................................... 173
Appendix F Profit Shifting of NZDOMs ............................................................................... 174
Appendix G Samples Sourced from NZX ............................................................................. 177
Appendix H Full Listing of 259 NZSOFMs .......................................................................... 178

ix
Table of Abbreviations
ACC Accident Compensation Corporation
AIL Approved issuer levy
ANZCERTA Australia-New Zealand closer economic relations trade agreement
ANZSIC Australian and New Zealand standard industrial classification
ASFM Australian subsidiaries of foreign MNE
ASIC Australian Securities and Investment Commission
ATO Australian Taxation Office
BBLR Broad base low rate
BEA (US) Bureau of Economic Analysis
BEPS Base erosion and profit shifting
BIC Business industry classification
BOP Balance of payments
BvD Bureau van Dijk
CbC Country-by-country
CbC MCAA Multilateral competent authority agreement on the exchange of country-
by-country reports
CDROM Compact disc read-only memory
CEPALSTAT ECLAC databases and statistical publications
CER Closer economic relations
CFA Committee on Fiscal Affairs
CFC Controlled foreign company
COVID-19 Coronavirus
CPI Corruption perceptions index
CUP Comparable uncontrolled price
DOLAC Domestically owned listed Australian company
DTA Double taxation agreement
EBIT Earnings before interest and taxes
EBITA Earnings before interest, taxes, depreciation, and amortisation
EC European Commission
ECLAC Economic Commission for Latin America and the Caribbean
ESR Earning stripping rules
EU European Union
EUR Euro

x
FDI Foreign direct investment
FIF Foreign investment fund
FITC Foreign investor tax credit
FMC Financial Markets Conduct
FRA Financial Reporting Act 2013
G7 Group of Seven
G20 Group of Twenty
GAAR General anti-avoidance rule
GDP Gross domestic product
GPFR General purpose financial report
GRD Government revenue database
GST Goods and services tax
HNWI High-net-worth individual
ICTD International Centre for Tax and Development
IMF International Monetary Fund
IMF CDIS IMF coordinated direct investment survey
IRD Inland Revenue Department
ITA Income Tax Act 2007
MBIE Ministry of Business, Innovation and Employment
MiDi (German Bundesbank) Micro database on direct investment
MFAT (New Zealand) Ministry of Foreign Affairs and Trade
MLI Multilateral instrument
MNE Multinational enterprise
NGO Non-governmental organisation
NRCC Non-resident controlled company
NRPI Non-resident passive income
NRWT Non-resident withholding tax
NZD New Zealand dollar
NZDOC New Zealand domestically owned company
NZDOM New Zealand domestically owned MNE
NZSOFM New Zealand subsidiaries owned by foreign MNE
NZX New Zealand exchange
NZ Co-op New Zealand co-operative company
NZ GAAP New Zealand generally accepted accounting practices
NZ IAS 1 New Zealand equivalents to international accounting standard 1

xi
NZ IFRS New Zealand equivalents to international financial reporting standards
NZ IFRS RDR NZ IFRS reduced disclosure regime
NZ LTD New Zealand limited company
NZ ULTD New Zealand unlimited company
ODI Outward foreign direct investment
OECD Organisation for Economic Co-operation and Development
OLS Ordinary least squares
PDF Probability density function
PE Permanent establishment
PSM Propensity score matching
R&D Research and development
RCC Resident controlled company
SOE State-owned enterprise
SPE Special purpose entity
TAA Tax Administration Act 1994
TCJA Tax Cuts and Jobs Act 2017
TI Transparency International
TIFA Trade and investment framework agreement
UK United Kingdom
UN United Nations
UNCTAD United Nations Conference on Trade and Development
US United States
USD United States dollar
WGI Worldwide governance indicators
WRDS Wharton research data service
WTO World Trade Organization

1
Chapter 1 Introduction and Background
1.1 Introductory Remarks
Corporate tax avoidance is prevalent throughout the world and remains a controversial topic
debated in academic and political circles. In recent years, the international tax avoidance of the
world’s largest listed companies has received unprecedented levels of interest, especially since
the financial crisis of 2007–2009. The unfavourable economic distress resulting from the
Coronavirus (COVID-19) crisis which began in 2020, has once again turned the spotlight on
multinational corporations for not paying enough global tax revenue, which could be used to
assist with meeting the costs of the pandemic.
In 2012, the Organisation for Economic Co-operation and Development (OECD) and the
Group of Twenty (G20)1 worked together in the base erosion and profit shifting (BEPS) project
in response to aggressive tax avoidance of multinational enterprises (MNEs). BEPS was first
introduced in the report Addressing Base Erosion and Profit Shifting published by the OECD
in February 2013 (OECD, 2013a). The OECD describes BEPS as “tax planning strategies used
by multinational enterprises that exploit gaps and mismatches in tax rules to avoid paying tax”
(OECD, n.d.). The OECD has estimated the scope of avoidance by multinational corporations
at between USD 100 and USD 240 billion per year (in 2014 figures). Following this, the 15-
point OECD BEPS Action Plan released in 2016 focuses on battling against undesirable tax
avoidance especially by MNEs with complex networks of offshore affiliates.
Undoubtedly, taxing domestic enterprises that keep their business affairs in a single (home)
country is relatively simple and straightforward. However, as time progressed, traditional
1 The G20 is a premier forum for its members for international economic co-operation and decision-making. The
members of the G20 comprise the European Union (EU) and 19 other countries: Argentina, Australia, Brazil,
Canada, China, France, Germany, India, Indonesia, Italy, Japan, Mexico, Russia, Saudi Arabia, South Africa,
South Korea, Turkey, the United Kingdom (UK), and the United States (US).

2
businesses began to evolve into international businesses, which could now operate across
multiple jurisdictions with different tax systems, tax incentives and tax regulations. The
inconsistencies in tax legislation between different locations can be exploited by MNEs to their
advantage to reduce their overall corporate tax payments.
Tax revenue collected by a government can be transformed into public expenditure, which, in
turn, contributes positively to the social and economic development of the country. The major
areas of government spending for the 2019/20 financial year include social security and welfare
(NZD 44 billion), health (NZD 19.9 billion), and education (NZD 16.3 billion) (The Treasury,
2020).
New Zealand collects substantial revenues from three major tax bases: personal income tax,
company income tax and goods and services tax (GST) (Inland Revenue Department [IRD],
2017c). The revenue collected from taxes, especially income tax, has been the primary source
of government revenue in New Zealand since the imposition of income tax in 1891 (Smith,
2010). A total of NZD 85.1 billion out of NZD 116 billion of the core Crown revenue has been
sourced from tax for the financial year of 2019/20 in New Zealand (The Treasury, 2020).2
However, government revenue can be undermined by tax planning of MNEs, which will in
turn lead to economic efficiency problems (Johansson, Skeie, Sorbe, & Menon, 2017).
In today’s highly competitive business world, companies are competing intensely in a global
business environment. From a business perspective, tax is perceived as a significant
expenditure for companies. Therefore, many companies strive to pay the least possible tax in
order to maintain growth and profitability. Tax planning is a commonly accepted practice
2 In addition to tax collected, Crown revenue also comprises sales of goods and services, investment income and
other revenue. The term “sales of goods and services” was specially used in the financial statements of the
government of New Zealand.

3
undertaken by companies to arrange their tax affairs in order to utilise tax advantages within
the legislative framework and minimise the corporate tax burden.
Johansson et al. (2017) describe tax planning as situations where the location of real activity
disconnects from the location of profits. The avenues of tax planning covered in the study of
Johansson et al. (2017) are profit shifting and the exploitation of mismatches between tax
systems. The main profit shifting channels include locating internal and external debt in high-
tax countries, allocating intangible assets to low-tax countries, and through the manipulation
of transfer prices (Johansson et al., 2017). On the other hand, the exploitation of mismatches
between tax systems can be achieved through preferential tax treatment, hybrid entities, hybrid
instruments and transfers, as well as negotiated tax rates (Johansson et al., 2017). In general,
the tax planning schemes covered in their study overlap with the OECD’s BEPS behaviours,
which involve “arrangements that achieve no or low taxation by shifting profits away from the
jurisdictions where the activities creating those profits take place”, and “instances where the
interaction of different tax rules leads to double non-taxation or less than single taxation”
(OECD, 2013b, p. 10).
To fully comprehend the concepts of tax planning, it is crucial to distinguish between the two
deceptively similar concepts of tax avoidance and tax evasion (Hoffman, 1961). The
distinctions between these two concepts have been the subject of debate since 1900.3 However,
it is not easy to distinguish tax avoidance from tax evasion (Sikka & Willmott, 2010). The
media and the public even conflate the two terms tax evasion and tax avoidance as if they were
the same (Christians, 2017). According to Christians (2017), it is important that tax evasion
should be treated differently from tax avoidance as they require distinct regulatory responses.
Mainly, tax evasion can be considered as non-compliance with tax laws consciously and
3 See Bullivant v. Attorney General for Victoria (1901) for differences between tax avoidance and tax evasion.

4
wilfully, and it is regarded as a criminal offense (United Nations [UN], 2011). On the other
hand, tax avoidance can be defined as an arrangement to minimise one’s tax burden by
exploiting the ambiguities and weaknesses in national tax systems (UN, 2011).
In New Zealand, the definition of “evasion” and associated penalties is provided in Sections
141E and 143B of the Tax Administration Act 1994 (TAA). “Evasion” represents the highest
level of culpability and a taxpayer involved in evasion under Section 141E of the TAA is
subject to tax shortfall penalties (150 percent penalty). A taxpayer who fails to fulfil their tax
obligations under Section 143B of the TAA can face a jail sentence of up to five years or a
monetary fine of up to NZD 50,000 or both.
Conversely, the law of tax avoidance, by its nature, is uncertain. The function of tax laws is to
provide a taxpayer with an opportunity to attain tax benefits in order to fulfil the socioeconomic
needs of society. That is arguably why the statutory definition of “tax avoidance” under
Sections BG 1 and YA 1 of the Income Tax Act 2007 (ITA) has been left deliberately general.
Instead of relying on the ITA to provide a fully comprehensive definition of “avoidance”, a
parliamentary contemplation test introduced by the New Zealand Supreme Court in the Ben
Nevis decision has been in place since 2008 (IRD, 2013). Under this test the courts have to
identify and to determine if tax avoidance exists by considering if the specific provisions used
by taxpayers in a plan or scheme are within Parliament’s contemplation.
The case of Ben Nevis, the leading case on tax avoidance in New Zealand, demonstrates the
approach to New Zealand’s general anti-avoidance rule (GAAR). Section BG 1, which is the
general anti-avoidance provision of the ITA, will be employed when other specific provisions
of the Act do not apply. A tax arrangement which is fully compliant with specific provisions
of the ITA can be overturned under the GAAR if the arrangement conflicts with the “scheme
and purpose” of the ITA. In the case of Ben Nevis, a tax deduction claimed by the taxpayers
which was fully within the scope of a specific statutory provision, had been determined as an
5
arrangement outside Parliament’s contemplation and was constituted tax avoidance.
Subsequently, the Supreme Court applied this Parliamentary Contemplation Test in the case of
Penny and Hooper.
The public expectation of tax compliance of large corporations puts pressure on governments
and revenue authorities to identify large corporations involved in tax avoidance on a global
scale. In June 2014, the European Commission (EC) commenced an in-depth state aid
investigation into Apple, Starbucks and Fiat Finance and Trade. The EC had been investigating
the individual tax rulings issued by the Irish, Dutch and Luxembourg tax authorities,
respectively, following media reports claiming that certain member states of the European
Union (EU) have granted tax benefits to the powerful multinationals to reduce the corporate’s
tax burdens. The investigations were carried out by Margrethe Vestager, the European
Commissioner for Competition, and her team of 900-investigators.
In June 2015, the EC ruled that Starbucks and Fiat had received illegal state aid and ordered
Starbucks and Fiat to pay a tax bill of up to EUR 30 million to the Netherlands and Luxembourg,
respectively.4 Following this, Margrethe Vestager presented her verdict in 2016 that the tax
benefits of Apple in Ireland were illegal as well. The EC decided that Apple had received state
aid from the Irish government and Apple must repay to Ireland a tax bill worth up to EUR 13
billion.5 The unfair tax breaks granted by the international tax authorities to the multinational
firms reflect the intervention by state governments in re-writing the tax rules to facilitate
powerful companies (Evertsson, 2016).
4 In 2019, the EU General Court upheld the decision of the EC that Fiat will have to make a repayment of unpaid
taxes to Luxembourg. At the same time, the EU General Court dismissed the tax ruling case of Starbucks in the
Netherlands. 5 In 2020, the EU General Court overturned the EC’s ruling, that ordered Apple to return the underpaid taxes to
Ireland.
6
Apart from that, a list of international tax havens was published by the EU for the first time on
17 June 2015.6 It consists of the top 30 non-cooperative jurisdictions among which are Brunei,
Andorra, Monaco, Guernsey, and the Caribbean havens, including the British Virgin Islands
and the Cayman Islands. The list is a part of the tax reform of the EU to clamp down on tax
evasion and tax avoidance. This blacklist of global tax havens was one of the EU’s tax
proposals in response to the “LuxLeaks” scandal in November 2014. The “LuxLeaks” revealed
that the tax rulings created by Luxembourg’s Tax Office provide tax relief for more than 350
multinational corporations including Apple, IKEA, Amazon, Pepsi, and others.7
In 2016, an analysis published by the New Zealand Herald, one of the New Zealand’s major
daily newspapers, sparked renewed interest in tax compliance issues. Nippert (2016a, 2016b)
studied 103 multinational companies with subsidiaries in New Zealand.8 He compared profit
margins (the ratio of pre-tax profit to revenue) between New Zealand subsidiaries and their
parent companies and found a significant difference in profit margins between them. This
investigation reveals that 20 multinational companies, including Apple, Facebook, Google,
Pfizer, Methanex and Chevron, recorded an average local profit margin of 1.3 percent, as
compared to the average profit margin of more than 20 percent recorded by their listed parents.
The 20 multinational companies together paid income tax of NZD 1.8 million despite earning
revenue of NZD 10 billion in this country (Nippert, 2016a, 2016b). It is reasonable to believe
that these companies were shifting profit aggressively out of New Zealand (Nippert, 2016a,
2016b).
6 For the full list of international tax havens, visit the website https://www.eubusiness.com/news-eu/economy-
politics.120n and https://www.europarl.europa.eu/cmsdata/147404/7%20-%2001%20EPRS-Briefing-621872-
Listing-tax-havens-by-the-EU-FINAL.PDF 7 A full list of companies that allegedly have “shady” tax deals with Luxembourg can be found on
https://www.businessinsider.com.au/full-list-every-company-named-in-the-luxembourg-secret-tax-deal-
database-2014-11?r=UK&IR=T 8 The New Zealand Herald’s analysis was guided by Dr Don Trow, Emeritus Professor of Accounting at Victoria
University and Adam Hunt, former IRD senior manager (Nippert, 2016a, 2016b).

7
1.2 An Overview of New Zealand’s International Tax Law
The tax policy framework of New Zealand is characterised by the broad base low rate (BBLR)
approach, intended to eliminate any tax biases towards certain preferred income sources or
investments (Tax Working Group, 2010). New Zealand income tax is imposed under the source
and residence principles in accordance with the ITA which is administered by IRD under the TAA
(Smith, 2010). Section 1.2 provides a brief summary of the New Zealand international tax system
that taxes non-resident companies on income with a New Zealand source and resident companies
of New Zealand on offshore income. The domestic income of New Zealand resident companies is
taxed under the domestic tax laws.
Table 1.1
New Zealand Resident and Non-resident Companies
A company is considered a resident in New Zealand if it satisfies any one of the criteria in Section
YD 2 (1) of the ITA.9 Table 1.1 shows that New Zealand subsidiaries that are majorly or wholly
owned by non-resident shareholders are considered as New Zealand resident companies for tax
purposes. A New Zealand resident company is obliged to pay tax to the New Zealand government
9 A company is deemed as a New Zealand resident if:
- The company is incorporated in New Zealand.
- The head office of the company is in New Zealand.
- The company has its centre of management in New Zealand.
- The directors of the company exercise control of the company in New Zealand even if the decision-making
also occurs outside New Zealand.
New Zealand non-resident
companies (for tax purposes)
Foreign ownership Foreign ownership Domestic ownership
New Zealand branches of foreign
MNEs
New Zealand subsidiaries of
foreign MNEs
New Zealand owned
enterprises
New Zealand resident companies (for tax purposes)

8
on its New Zealand income, its foreign sourced income, and its worldwide income, while a non-
resident company is only taxed on the income which has a source in New Zealand (under Section
YD 4 of the ITA).
1.2.1 New Zealand’s Permanent Establishment Rules
A foreign company will only be subject to taxation in the jurisdictions where a permanent
establishment (PE) exists. In New Zealand, the domestic law, together with double taxation
agreements (DTAs), determine the taxing right of the New Zealand government on sales incomes
of non-residents attributable to a PE. Under New Zealand’s DTAs, New Zealand has the right to
tax business profits of non-resident entities with a PE in New Zealand only.
Article 5 of the OECD Model Tax Convention defines the concept of PE and this concept has
significantly influenced New Zealand’s domestic tax rules in defining a PE. Generally, a non-
resident will be considered to have a PE in New Zealand if the non-resident has an established
business place in New Zealand or a dependent agent has been authorised to exercise, negotiate,
and conclude contracts on behalf of non-resident, even though the contracts are executed
offshore.10 However, there is no single definition of PE as it differs between DTAs.
Transfer pricing and permanent establishment avoidance is a specific BEPS strategy used by non-
resident multinationals to avoid tax on sales incomes in a country such as New Zealand despite
having significant economic activities in New Zealand. This happens when non-resident
companies structure their business in New Zealand so as not to give rise to a PE in New Zealand.
10 The IRD has outlined more detailed criteria of PE. Visit:
https://www.ird.govt.nz/international/residency/company/company-tax-residency-index.html.

9
Currently, the taxation of structures that cause potential transfer pricing and permanent
establishment avoidance in New Zealand are as follows (IRD, 2017b):
• In-market support structure for direct sales from a foreign country:
To avoid having a taxable presence in New Zealand, the non-resident contracts a New
Zealand subsidiary to provide support to the sales activities in New Zealand. By using this
in-market support structure, the non-resident pays the subsidiary a service fee that is
slightly above its costs. The non-resident also pays a significant amount of money in
royalty to another group member that is based in a low-tax country. Ultimately, the non-
resident shifts the profit from sales in New Zealand to low-tax countries.
Under the current tax treatment of the in-market support structure, the subsidiary is not
treated as an agent for the non-resident as the subsidiary provides the sales support under
contract. In other words, the non-resident does not have a PE in New Zealand and the sales
income will not have a New Zealand source. In addition, the royalty paid for the ongoing
use of intellectual property to the low-tax jurisdiction will not be subject to non-resident
withholding tax (NRWT) as it arguably will not have a New Zealand source.
• In-market sales through a New Zealand distributor owned by a non-resident:
Under the in-market distributor structure, the non-resident sells the goods to New Zealand
customers by engaging its New Zealand subsidiary as a distributor. Typically, the non-
resident will charge the distributor subsidiary a high price for the sales of goods and by
doing so, the subsidiary has a low profit margin subject to tax in New Zealand. In this case,
the non-resident does not have physical presence in New Zealand and its sales income is

10
not sourced from New Zealand. This arrangement is a transfer pricing issue rather than a
PE issue.
In 2018, New Zealand introduced new PE anti-avoidance rules11 to target large multinationals12
that structure their business arrangements to avoid a PE in New Zealand.13 The new PE anti-
avoidance rules have widened the definition of a PE, where the dependent agent of the non-resident
who plays a principal role leading to the conclusion of contracts will now give rise to a PE.
New Zealand signed the multilateral instrument (MLI) in June 2017 to include the new, broader
PE definition in New Zealand’s DTAs. However, the new PE definition will come into effect only
if other trading partners that have a DTA with New Zealand sign the MLI and elect to adopt the
new PE definition (IRD, 2017b).
1.2.1.1 Double Taxation Agreements
Primarily, a DTA is an agreement between New Zealand and on other jurisdiction which
determines which jurisdiction has the ultimate right to tax specific types of income of a taxpayer
including a company.14 The primary goal of a DTA is to relieve New Zealand resident companies
and other taxpayers from double taxation.15
The rise of cross-border trade and investment results in double taxation issues when both the source
state and the residence state tax the same taxpayer on the same source of income under each state’s
domestic tax rules. Double taxation hinders the free movement of capital, investment, technology
11 Sections GB 54, YD 4(17C), YD 4B, YD 5(1BA), YD 5B and schedule 23 of the ITA. 12 “Large multinationals” refer to companies with consolidated global revenues of more than EUR 750 million. 13 For more information, see http://taxpolicy.ird.govt.nz/sites/default/files/2018-sr-beps-pe.pdf 14 The legal meaning of DTA is contained in Section BH 1(1) of the ITA. 15 The purposes of DTA are outlined in Section BH 1(2) of the ITA.

11
and trading of goods and services. It is unfair, as a principle of international taxation, to tax all
incomes more than once (Ting, 2014).
The Model Tax Convention published by the OECD intends to provide a uniform solution to the
problems of international juridical double taxation faced by its member countries. The OECD’s
members are encouraged to conform to this Model Tax Convention when determining or re-
evaluating their bilateral conventions. The OECD keeps pace with the latest tax issues that arise
from the ever-changing global economy by continually reviewing the Model Tax Convention. The
full text of the Model Tax Convention on Income and on Capital 2017 was published in 2019
(OECD, 2019a).
Table 1.2 shows the countries and territories that have entered into a DTA with New Zealand (IRD,
2021). The main objectives of New Zealand’s DTAs are to reduce the tax deterrent to cross-border
business and prevent double taxation.

12
Table 1.2
New Zealand’s DTAs and Year of Establishment
Note. Adapted from Tax treaties. Copyright 2021 by New Zealand Inland Revenue Department.
Conversely, double non-taxation occurs due to the exploitation by multinational companies of the
gaps in the interaction of different tax systems and the tax rate differentials among different
countries. Double non-taxation has been the most significant tax policy issue since late 2012 as
the aggressive tax planning techniques used to achieve double non-taxation can erode the tax bases
Australia India Poland Turkey
2010 1986 2006 2011
Austria Indonesia Portugal United Arab Emirates
2007 1988 Under negotiation 2004
Belgium Ireland Russian Federation United Kingdom
1983 1988 2003 1984
Canada Italy Samoa United States of America
2015 1983 2015 1983
Chile Japan Saudi Arabia Vietnam
2006 2013 Under negotiation 2014
China Korea (Republic of) Singapore
1986 1983 2010
Czech Republic Luxembourg Slovak Republic
2008 Under negotiation Under negotiation
Denmark Malaysia South Africa
1981 1976 2004
Fiji Mexico Spain
1977 2007 2006
Finland Netherlands Sweden
1984 1981 1980
France Norway Switzerland
1981 1983 1981
Germany Papua New Guinea Taiwan
1980 2014 1997
Hong Kong Philippines Thailand
2011 1981 1998

13
of both the country of residence and the source country. More specifically, the unintended double
non-taxation can also be referred to as “BEPS”.
Double non-taxation typically results from a hybrid mismatch arrangement. Countries with diverse
legal traditions (civil law vs common law) are likely to generate a mismatch (Blessing, 2012). The
inconsistency in dealing with classification of entities, transfers, and instruments between two or
more countries create arbitrage or mismatch opportunities for multinational companies to achieve
double non-taxation, through hybrid instruments, hybrid transfers, hybrid entities and dual
residence companies (OECD, 2012).
Under the arrangement that involves the use of a hybrid financial instrument, one country will
regard the payment under the instrument as deductible interest while another country will regard
the payment as exempt dividends. Hybrid transfers always involve a collateralised loan that is
treated differently in two countries. This arrangement will be considered as a transfer of ownership
of an asset for tax purposes in one jurisdiction while it is not in another jurisdiction. With hybrid
entities, an entity has different elements, being a transparent and opaque company in different
countries. If the entities are resident in two different jurisdictions, they would be able to achieve a
tax deduction on a single payment in both countries because of the dual tax residence status.
Failure of the countries to reach a consensus on determining the source of income would allow the
MNEs to engage in stateless income tax planning (Kleinbard, 2011). The income that escapes
taxation can be referred to as “stateless income” because each country considers that the taxing
right on the income belongs to another country. Tax policymakers are concerned about the
distortive effects arising from non-taxation. Several problems caused by international hybrid
mismatch arrangements include the reduction of overall tax revenue, competition and fairness
concerns, transparency issues and economic efficiency.

14
The corporate structure of multinational corporations is integrated and functions as a single
company nowadays (Ting, 2014). The OECD recognises that the existing international taxation
standards are insufficient to restrict BEPS activities in highly integrated corporate groups (OECD,
2013b). Further, the separate entity doctrine, which is designed to deal mainly with bilateral
transactions, may not effectively avert a trilateral or multilateral scenario today. MNEs with
multiple layers of individual entities between the residence country and source country can create
artificial intra-group transactions. The profits of MNEs can be shifted to the tax-favoured
interposed subsidiary for tax-avoidance purposes.
According to Ting (2014), the enterprise doctrine that regards a corporate group as a single entity
would be an effective anti-avoidance measure to combat double non-taxation and apply tax
treatments based on economic substance. Ting (2014) also notes that transparency is a powerful
and useful tool in helping the tax authorities who experience asymmetric information problems to
obtain significant information about the tax position of the taxpayers. Country-by-country (CbC)
reporting would be particularly helpful for tax authorities to determine the economic substance of
MNEs in a specific jurisdiction (Ting, 2014).
1.2.2 New Zealand’s Transfer Pricing Rules
Transfer pricing is one of a variety of strategies used by multinationals to mitigate their global tax
liabilities. It involves artificially high or low cross-country payments between the related legal
entities within the corporate group for transfer of goods, services, and intangible items. The price
and conditions may or may not be accepted or agreed to by an unrelated third party in a similar
transaction. The MNEs can shift profits offshore through the manipulation of these transfer price
or conditions. Thus, transfer pricing legislation is significantly important to protect the New
Zealand tax base from being eroded.

15
Sections GB 2 and GC 6 to GC 14 of the ITA16 are the current statutory rules governing transfer
pricing in New Zealand. The revised 2010 OECD guidelines, which are consistent with New
Zealand’s transfer pricing rules and double tax treaties, have been used by the IRD as the latest
guiding principles for transfer pricing. The Australian Taxation Office (ATO)’s guidelines and the
regulations under Section 482 in the US are another two significant reference sources for taxpayers.
New Zealand’s transfer pricing rules follow the arm’s length principle.
This principle has been enacted in Section GD 13(6) of the ITA:
[The] arm’s length amount of consideration must be determined by applying whichever …
method … will produce the most reliable measure of the amount completely independent
parties would have agreed upon after real and fully adequate bargaining.
New Zealand embraces the arm’s length principle to determine the amount of income derived from
the business operations of multinational firms in New Zealand. There are five transfer pricing
methods under Section GD 13(7) of New Zealand’s Transfer Pricing legislation that are used to
decide and assess the transfer prices of taxpayers (IRD, 2000):
• The comparable uncontrolled price (CUP) method
• The resale price method
• The cost plus method
• The profit split method
• Comparable profit method
16 See section GB 2 Arrangements involve transfer pricing and sections GC 6 to GC 14 Transfer pricing
arrangements of Income Tax Act 2007 (reprint as of 22 June 2018):
http://www.legislation.govt.nz/act/public/2007/0097/latest/DLM1512301.html.

16
Taxpayers are expected to submit transfer pricing documentation upon the request of the IRD only.
However, it is in the taxpayers’ best interests to prepare satisfactory documentation of how transfer
prices have been set for intercompany transactions and how their transfer pricing practices are in
accordance with the arm’s length principle. The transfer pricing documentation should be retained
for no less than seven years.
Section GC 13 requires taxpayers to use the most reliable transfer pricing method to establish the
arm’s length amount of the transfer price. In the case that taxpayers fail to provide adequate
transfer pricing documentation and therefore do not demonstrate compliance with Section GC 13(1)
to GC 13(4), and if the Commissioner of Inland Revenue (the Commissioner) can prove a more
reliable measure of the transfer price, this will result in penalties under Section 141A-K of the
TAA. Formerly Section GC 13(4) of the ITA had placed the burden of proof on the Commissioner;
however, the New Zealand government has shifted the burden of proof to the taxpayer with effect
from the income years commencing on or after 1 July 2018.
A three-tier standardised approach to transfer pricing documentation has been developed by the
OECD to set the different standards used by taxpayers to prepare transfer pricing documentation
for the different tax jurisdictions in which they do business. According to Action 13 of the BEPS
Action Plans, this standardised approach comprises the following documentations:
i. Master file
The Master file contains top-level details concerning the cross-border business operations
and transfer pricing policies of multinational firms that are to be accessible to tax
administrations.

17
ii. Local file
The Local file comprises transactional transfer pricing documentation that is specific to
each country. This file contains detailed information such as the amount of the related party
transactions, and the analysis of the transfer pricing determinations the company made
relating to those transactions.
iii. Country-by-country report
The CbC report, which was proposed by the OECD in BEPS Action 13, was enacted by
the New Zealand government in the Taxation (Neutralising Base Erosion and Profit
Shifting) Act 2018. Large multinational groups that are headquartered in New Zealand and
have a yearly consolidated group income of over EUR 750 million (about NZD 1.3 billion)
are required to submit a CbC report on an annual basis. The first reporting of CbC data
covered income years commencing on or after January 1, 2016. The IRD indicates that in
2017 there will be 20 MNEs with their headquarters in New Zealand that are affected by
this CbC reporting requirement, and they make up a small group of MNEs out of 6,000
large multinational groups around the world (IRD, 2018).17
The CbC report outlines a list of the amount of gross revenues, profit (or loss) before
income tax and income tax paid and accrued for each country in which large multinationals
conduct business. The multinational firms must also provide stated capital, the number of
employees, tangible assets and retained earnings in each tax jurisdiction.18 There are 89
17 New Zealand received 21 CbC reports in the first year of the initiative (IRD, 2019b). 18 The template for the CbC report can be found at: https://www.ird.govt.nz/-
/media/project/ir/home/documents/forms-and-guides/ir1000---ir1099/ir1032/ir1032-2018.pdf. No explicit definition
or clear instructions for reporting the CbC figures in the New Zealand context can be found on the website of the NZ
IRD. However, the final report on BEPS Action 13: Transfer pricing documentation and country-by-country
reporting sets out the guidelines on how to complete the CbC report (OECD, 2015e).
18
countries including New Zealand that signed the OECD’s multilateral competent authority
agreement on the exchange of country-by-country reports (CbC MCAA).19 As specified in
the OECD’s BEPS Action 13 report, the information contained in CbC reports can be used
for three purposes: to assess high level transfer pricing risk; to assess other BEPS-related
risks; and for economics and statistical analysis. Commercially sensitive information
disclosed in the CbC report is protected under the general tax secrecy rules in the TAA.
Hence, the information will only be shared with other tax authorities under the CbC MCAA
as well as with the US under a bilateral agreement (IRD, 2018).20
Many multinationals will only need to provide the local and master file when required to by a tax
authority on the grounds of concerns about the compliance costs that may be imposed on the
mandatory preparation of local and master file transfer pricing documentation on a yearly basis.
The IRD will contact the affected corporate groups who are required to file a CbC report each year.
The non-availability of adequate data to the public and researchers makes the measurement of the
magnitude of BEPS based on company-level data difficult. Some crucial financial reporting
information, such as CbC reports of multinational reported profits and tax payments, if available
to the public, will be particularly helpful in BEPS-related analysis.
1.2.3 New Zealand’s Thin Capitalisation Rules
New Zealand’s thin capitalisation provisions, which came into effect from the beginning of the
1996–97 income year, are a part of New Zealand’s international tax rules. They initially applied
to non-residents and have the purpose of limiting the excessive allocations of debt to a business
19 A list of the signatories of the CbC MCAA (last updated 13 January 2021) is published on the OECD’s website:
http://www.oecd.org/tax/automatic-exchange/about-automatic-exchange/CbC-MCAA-Signatories.pdf. 20 In 2018, New Zealand exchanged 21 CbC reports for MNEs that have headquarters here with treaty partners, and
received 1402 CbC reports from its treaty partners, under the BEPS Action 13 minimum standard (IRD, 2019b).

19
operation in New Zealand. In 2009, New Zealand companies with controlled foreign companies
(CFC) owned by New Zealand residents were included in the thin capitalisation regime (PwC,
2013). Transfer pricing rules work together with thin capitalisation rules (inbound and outbound)
to restrict tax deductions for interest paid on debt. The transfer pricing rules require cross-border
related party debt to be charged using an arm’s length interest rate (IRD, 2017a).
More specifically, New Zealand has put in extensive efforts to restrict the debt levels non-residents
can place on their New Zealand investments. The rules limit the deduction of interest expenditure
of foreign-owned companies when the permitted threshold is exceeded. The rules are designed to
protect the tax base of New Zealand, as the use of debt is one method a non-resident company can
use to shift profit out of New Zealand. On top of that, non-resident-controlled companies receive
significant attention as they are major payers of New Zealand company tax.21
A non-resident person, or a company with a single offshore owner who owns more than 50 percent
of the company, will be subject to the New Zealand thin capitalisation rules. Under the current
rules, the payment of interest on debt for up to 60 percent of the non-resident companies’ local
asset value is tax deductible. However, the 2014 changes extend the thin capitalisation rules to a
group of non-residents who have an investment in New Zealand jointly. Prior to the amendment
made to section FE 1 of the ITA, the rules applied only to companies controlled by a single non-
resident. The extension of the rules also applies to the New Zealand trusts, if more than 50 percent
of the trust settlements were settled by a non-resident, or a group of non-residents jointly (IRD,
2014).
21 For example, the foreign-owned firms contributed to 39 percent of the company tax in the 2015 tax year. Retrieved
from https://taxpolicy.ird.govt.nz/sites/default/files/2017-dd-beps-interest-limitation.pdf.
20
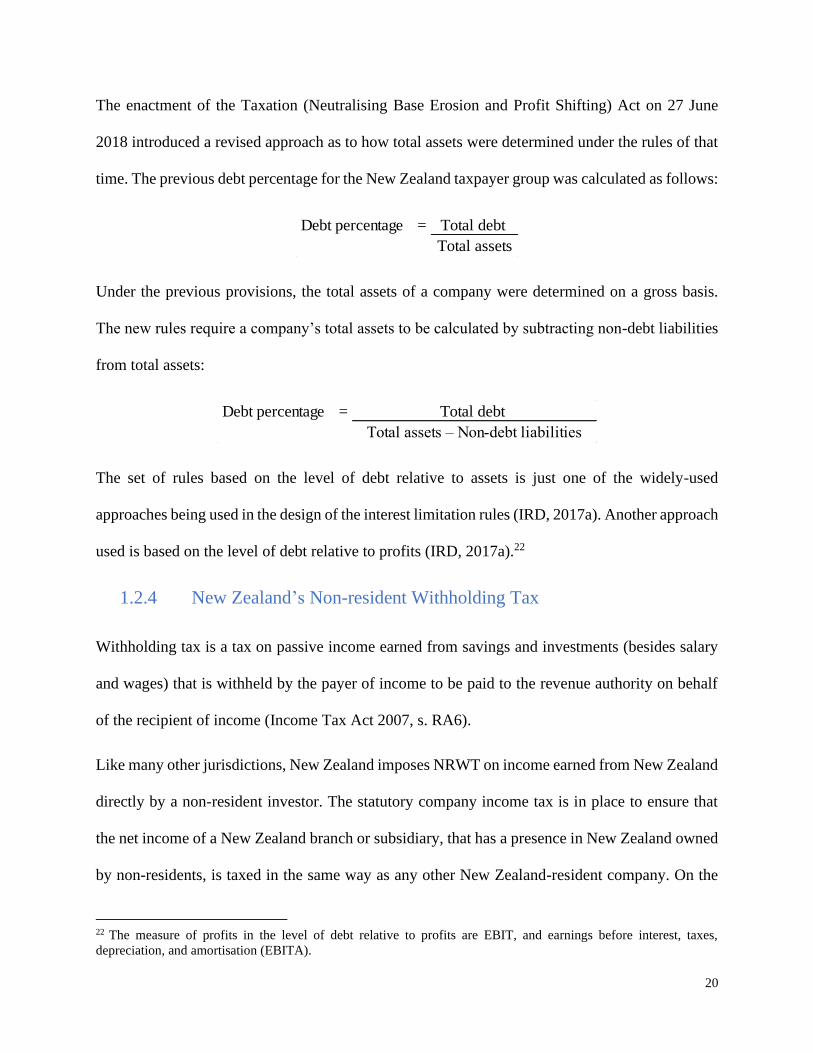
The enactment of the Taxation (Neutralising Base Erosion and Profit Shifting) Act on 27 June
2018 introduced a revised approach as to how total assets were determined under the rules of that
time. The previous debt percentage for the New Zealand taxpayer group was calculated as follows:
Under the previous provisions, the total assets of a company were determined on a gross basis.
The new rules require a company’s total assets to be calculated by subtracting non-debt liabilities
from total assets:
The set of rules based on the level of debt relative to assets is just one of the widely-used
approaches being used in the design of the interest limitation rules (IRD, 2017a). Another approach
used is based on the level of debt relative to profits (IRD, 2017a).22
1.2.4 New Zealand’s Non-resident Withholding Tax
Withholding tax is a tax on passive income earned from savings and investments (besides salary
and wages) that is withheld by the payer of income to be paid to the revenue authority on behalf
of the recipient of income (Income Tax Act 2007, s. RA6).
Like many other jurisdictions, New Zealand imposes NRWT on income earned from New Zealand
directly by a non-resident investor. The statutory company income tax is in place to ensure that
the net income of a New Zealand branch or subsidiary, that has a presence in New Zealand owned
by non-residents, is taxed in the same way as any other New Zealand-resident company. On the
22 The measure of profits in the level of debt relative to profits are EBIT, and earnings before interest, taxes,
depreciation, and amortisation (EBITA).
Debt percentage = Total debt
Total assets
Debt percentage = Total debt
Total assets – Non-debt liabilities
21
other hand, NRWT ensures that the tax on the income derived from direct investment in New
Zealand is withheld and collected from a non-resident who does not have a New Zealand presence
(IRD & the Treasury, 2015). Passive income which includes interest, dividends and royalties with
a New Zealand source received by non-residents, is known as non-resident passive income (NRPI),
and is subject to NRWT (Income Tax Act 2007, s. RF2).
However, NRWT rates may vary according to the territories that have entered into a DTA with
New Zealand and the types of passive income on which NRWT is imposed. Generally, a higher
deduction rate is applicable to recipients of passive income from jurisdictions that do not have a
DTA with New Zealand. A rate of 15 percent will be imposed on interest and royalties, and 30
percent for dividends.
For countries or territories with a DTA, the set rates would be different for interest, dividends,
royalties, or copyrights (cultural royalties) (IRD, n.d.). With regard to NRWT on interest, the rate
of withholding tax varies according to the relationship between a New Zealand borrower and a
foreign lender (“associated person”, or not), as well as upon the home jurisdiction of the lender
where New Zealand has entered into a DTA. The payments of interest on related-party debt paid
to related non-resident recipients (“associated persons”) are typically taxed at a lower rate of 10
percent under most tax treaties although NRWT on interest under domestic law is generally taxed
at 15 percent.
The interest on third-party debt paid to unrelated parties is subject to a withholding tax rate of 15
percent of the gross interest or a reduced rate at 10 percent under most DTAs. The interest
payments to unrelated foreign lenders can qualify for a zero-rate of NRWT if the payers are
approved issuers under the approved issuer levy (AIL) regime (Income Tax Act 2007, s.
RF12(1)(a)). In this case, the approved issuers are subject to a levy equivalent to the rate of 2

22
percent of the interest, and this is intended to lower the cost of capital for New Zealand borrowers.
Essentially, the payers pay an effective after tax rate of 1.44 percent on the interest of third-party
borrowing.23
With respect to NRWT rates applied to dividend, a standard withholding tax rate of 30 percent is
applicable to unimputed dividends distributed by New Zealand companies to non-resident
shareholders, but this rate has been limited to 15 percent under most tax treaties. For non-resident
shareholders who have a voting interest of less than 10 percent in a company, a NRWT of 15
percent is imposed on fully imputed dividends. However, the NRWT can be eased under the
foreign investor tax credit (FITC) regime. For non-resident shareholders with shareholdings of 10
percent or more, the dividends are reckoned at zero percent of NRWT, where fully imputed (PwC,
2020b).
1.2.5 New Zealand’s Controlled Foreign Companies Rules
New Zealand’s CFC regime, together with foreign investment fund (FIF) regime, aim at preventing
New Zealand resident taxpayers from avoiding or deferring the payment of income tax on their
overseas sourced income derived or returned by a foreign entity. In 2009, an active income
exemption was introduced where active income earned from business operations offshore is
exempted from tax. Following this, the FIF rules, that were designed to complement the CFC rules,
were amended in 2011 (Smith & Sawyer, 2020).
A non-resident company must meet one of the following tests to be a CFC (Income Tax Act 2007,
s. EX1):
23 The 2 percent rate of the AIL is reduced to 1.44 percent if the interest that has been paid by the approved issuers is
tax deductible at the company tax rate of 28 percent. (2% - (28%*2%) = 1.44%)

23
• A New Zealand resident owns at least a 40 percent controlling interest (not limited to
voting rights only) in the foreign company, and there is no other non-resident who holds
a greater control interest in that company;
• A group of New Zealand residents (up to 5) have at least a 50 percent ownership of the
foreign company; or
• A group of New Zealand residents (up to 5) can exercise their control over the
shareholder decision-making rights for the company.
The CFC rules aim to protect New Zealand’s domestic tax base by taxing foreign “passive income”
on an accrual basis. This passive income includes dividends, interests, royalties, and rents, which
can be easily shifted offshore by New Zealand taxpayers to avoid taxation in New Zealand. The
CFC legislation is considered to be “anti-tax haven” in the 1987 budget and it had been enacted in
1988 with an initial intention to target resident companies with offshore entities in low tax or tax
haven countries. Markle and Robinson (2012) find that the CFC rules and credit system decrease
the likelihood that a multinational firm will invest in the tax haven affiliates.
According to the New Zealand government, the current CFC rules are considered to be
comprehensive, and no further reform is expected in response to the implementation of the
OECD’s Action Plan on BEPS (Smith & Sawyer, 2020).
1.2.6 New Zealand’s Foreign Investment Fund Rules
According to Herman (as cited in Dunbar, 2003), New Zealand’s FIF rules can be considered to
be an extension of CFC rules, working towards diminishing deferral of income tax payment or
viewed as an all-inclusive-system to tax passive income. A New Zealand resident taxpayer who
has an attributing interest in a FIF, as defined in Sections EX 29 to EX 43 of the ITA, will be taxed

24
under the FIF tax regime. As stated in Section EX29 of the ITA, a person is deemed to have an
attributing interest in a FIF if that person:
• is a beneficiary or member of a foreign superannuation scheme and has the right to benefit
from this scheme, or
• holds shares in a foreign company or foreign unit trust and has a direct income interest in
the foreign company or unit trust, or
• is entitled to benefit from a foreign life insurance policy for which a FIF is the insurer.
The five methods, the attributable FIF income method, the comparative value method, the deemed
rate of return method, the fair dividend rate method and the cost method contained in Section EX
44, ITA 2007 are used to calculate the FIF income or loss.
1.3 International Tax Aspects of New Zealand
1.3.1 The New Zealand Economy and the Economic Relationship with
Australia
The term “trans-Tasman” is used specifically to describe the close and important bilateral
relationship between New Zealand and Australia–countries which are geographically close to one
another. Trade and investment between these countries are two vital elements that are driving
economic growth and bringing mutual economic benefits to both countries.
Cross-border trade between them has grown significantly since the inception of the Australia-New
Zealand closer economic relations trade agreement (ANZCERTA)24 on 1 January 1983 (Ministry
of Foreign Affairs and Trade [MFAT], n.d.). New Zealand’s total trade in 2020 was NZD 169.3
24 ANZCERTA is more widely known as the closer economic relations (CER) Agreement.

25
billion. Of this, the total amount of exports and imports of goods and services with Australia was
valued at NZD 27.2 billion (16 percent), with Australia ranked as New Zealand’s second largest
trading partner after China (Statistics New Zealand, 2020a).
Australia is also the primary source and destination of direct investment from New Zealand.
Investment flows are one of the significant and attributable features of a modern globally
interconnected economic environment. According to Statistics New Zealand (2020b), the inward
foreign direct investment (FDI) stock in New Zealand has grown exponentially from NZD 55.3
billion in 2001 to NZD 121.1 billion in 2020.25 Australia is the biggest source of direct investment
to New Zealand with FDI of NZD 59.3 billion in 2020. The other primary sources of FDI in New
Zealand include Hong Kong, the US, Singapore, and Japan (see Appendix B). The outward foreign
direct investment (ODI) of New Zealand was NZD 27.6 billion in 2020, and Australia was the
largest recipient of New Zealand’s direct investment, with the amount of NZD 14.2 billion (51
percent) in 2020 (see Appendix C).
1.3.2 New Zealand and Australia Statutory Corporate Tax Rates (1980–
2019)
The statutory rate of corporate tax of a country, alongside the changes in the corporate tax rate in
other jurisdictions are important considerations for its government in setting a coherent company
tax system. Company tax changes in Australia, including to the tax rate, are a matter of concern to
New Zealand. Company taxation imposes taxes on capital invested in an economy. Any reform in
New Zealand’s or Australia’s tax systems could lead to a bias in favour of, or against, company
investment decisions and the choices of investment locations. Figure 1.1 shows the statutory
25 FDI refers to investment by any single investor who holds 10 percent or more of voting shares in a company (for
example, subsidiaries of foreign companies based in New Zealand). The location of the investment is reported based
on immediate country, rather than on ultimate country (Statistics New Zealand, 2020b).

26
corporate tax rates of New Zealand, as compared to the full corporate tax rates of Australia in the
past 40 years (1980–2019) (OECD, 2019b).
Figure 1.1
New Zealand and Australia Statutory Corporate Tax Rates, 1980–2019
Note. Adapted from OECD. Stat. Copyright 2019 by the OECD.
The corporate tax rate in Australia was relatively high, at 36 percent from 1995 to 2000 and
dropped to 34 percent in 2001. The company tax rate in New Zealand was 33 percent in the years
1995 to 2001. Subsequently, Australia’s standard company tax rate fell to 30 percent in 2002 and
it remains the same rate to the present. The corporate tax rate in New Zealand was 3 percent higher
than in Australia from 2002 to 2007. Thereafter, there was a reduction in New Zealand’s company
tax rate from 33 percent to 30 percent, the rate aligned with Australia’s company tax rate from
1980 1982 1984 1986 1988 1990 1992 1994 1996 1998 2000 2002 2004 2006 2008 2010 2012 2014 2016 2018
0
10
20
30
40
50
60
Year
Pe
rce
nt
Australia New Zealand

27
2008 to 2010.26 The New Zealand corporate tax rate has been two percent lower than the Australian
rate since 2011, when New Zealand further reduced the corporate tax rate to 28 percent.27
A cut in the New Zealand company tax rate is expected to improve New Zealand’s competitive
advantage in attracting foreign investment (IRD, 2010). However, New Zealand’s 28 percent
company tax rate is still relatively high by international standards. In 2020, the average statutory
corporate tax rate worldwide (covering 177 jurisdictions) was 23.85 percent and slightly lower at
23.51 percent in OECD countries (Asen, 2020). According to Asen (2020), the average rate among
EU countries and the Group of Seven (G7) nations28 is 21.47 percent and 24 percent, respectively.
The average statutory corporate income rate in Africa is the highest, at 28.50 percent, while Europe
has the lowest average rate, at 19.99 percent when compared to all other regions.
A relatively high corporate tax rate in New Zealand will motivate multinational firms to shift profit
to lower-taxed jurisdictions. The New Zealand government were greatly concerned about this issue
in the years 2001 to 2007, when the New Zealand corporate tax rate was higher than Australia,29
with the fact that a high share of FDI in New Zealand was sourced from Australia. Subsequently,
in 2011, New Zealand’s corporate tax rate was reduced to the current rate of 28 percent. Australia
is still the largest FDI investor, with 49 percent direct investment in New Zealand on 31 March
2020 (Statistics New Zealand, 2020b).
26 Schedules 1 of the ITA. 27 The company tax rate of 30 percent is the full company tax rate in Australia. It is applicable to companies, corporate
unit trusts and public trading trusts that do not qualify for the lower tax rate of 27.5 percent. The lower rate applies to
base rate entities (from the 2017–18 income year) and a small business entity (for the 2015–16 and 2016–17 incomes
years). For a better understanding, see: https://www.ato.gov.au/rates/changes-to-company-tax-rates/ 28 The G7 comprises the seven largest advanced economies in the world, namely the UK, the US, Japan, Italy, France,
Germany, and Canada. 29 This concern was expressed in the background paper, Company tax issues facing New Zealand This paper
considered whether a high corporate tax rate is sustainable in the face of continual cuts in the corporate tax rate in
other countries (IRD & the Treasury, 2009).

28
Another issue encountered by New Zealand is that the Australian immediate parent companies
with New Zealand subsidiaries have an incentive to stream profits back to Australia in order to
receive Australian franking credits.30 Australia is among the few countries that offer a full dividend
imputation franking system (Brown, Lim, & Evan, 2020).31 Under the Australian imputation
system, the corporate tax paid at the company level will be recognised as franking credits that can
be used by shareholders to offset against their personal tax liability. On 1 July 2000, a provision
came into effect that allows a full amount of franking credits to be claimed by Australian resident
shareholders32 to the extent that shareholders can get a refund of excess credits.33
The dividend imputation system that operates in Australia is said to have a corporate tax
avoidance-reducing effect, particularly for Australian publicly listed companies with domestic
ownership (Li & Tran, 2020). Australian companies that distribute franked dividends are likely to
pay corporate tax to enhance their shareholder value (Brown et al., 2020). Put differently, those
domestically owned listed Australian companies (DOLACs) 34 that have subsidiaries in New
Zealand are keen to stream profits from New Zealand back to Australia in order to meet the
30 The term “profit streaming” was used in the background paper, Company tax issues facing New Zealand (IRD &
the Treasury, 2009). It refers to a scenario where profits are being “streamed” across borders from New Zealand
because of (i) a comparatively high New Zealand company tax rate, or (ii) the imputation systems of other countries
(IRD & the Treasury, 2009; IRD & the Treasury, 2018c). In the BEPS context, profits are being “shifted” attributed
to the gaps and mismatches of international tax laws. The issue of profit streaming tends to arise in New Zealand from
Australia’s franking scheme. 31 Many countries have abolished imputation systems or implemented partial imputation systems. The other OECD
countries that still operating full dividend imputation systems are Australia, Canada, New Zealand, Chile, and Mexico.
Malta is a non-OECD country that operates a full dividend imputation system (Ainsworth, 2016). 32 Franking credits can only be utilised by Australian resident shareholders (Brown et al., 2020). 33 This refund provision is set out in Section 67-25(1) of the Income Tax Assessment Act 1997 (Australia). Generally,
tax offsets rules do not offer a tax refund to shareholders, even though the tax offsets are greater than the amount of
tax liable to be paid. Contrarily, the refundable tax offsets ruled effective from 1 July 2000 allows shareholders to
claim their franking credits in full and this can even reduce the tax liability of a shareholder to an amount less than
zero. In other words, the excess franking credits will be refunded to shareholders. 34 The term “DOLACs” was used in the study of Li and Tran (2020).
29
shareholders’ demands for full franking credits. Likewise, the Australian subsidiaries of New
Zealand parents have the same incentive to stream profits from Australia back to New Zealand.
To discourage profit streaming across the Tasman, both New Zealand and Australia to varying
degrees see the importance of mutual recognition of imputation franking credits in the other
country. In any case, these mutually beneficial policies have still not been adopted, due to a
reluctance by Australia and the risk of a reduction in its tax revenues from such a policy (The
Treasury, 2008).
1.3.3 Globalisation and Corporate Tax Policy
The corporate income tax systems of many countries are continuing to be reformed because of the
ongoing process of globalisation. The G20/OECD BEPS project was developed because of the
realisation of the need to align international tax rules to the continuing changes in the world
economy emerging from globalisation, digitalisation, and the dependence on intangible assets
(Bradbury, Hanappi, & Moore, 2018).
While globalisation is generally thought of as a recent phenomenon, some studies believe that the
emergence of globalisation can be dated back a few hundred years (Eštok & Bzdilová, 2011).
According to Scholte (2000, as cited in Eštok & Bzdilová, 2011), the first group of authors regard
globalisation as either a historical and cyclical process or a historical and linear process, and the
second group of authors sees globalisation as a new phenomenon. Scholte (2000, as cited in Eštok
& Bzdilová, 2011) considers the phenomenon of globalisation to be a historical and linear process
and he suggests that the first phase of globalisation emerged 500 years ago, and the second phase
of globalisation started from 1850 until 1950. The globalisation which began around the year 1960
and is continuing as an “absolute globalisation” because of the interference of internet, electronic

30
communications, satellites, and optic cables in our daily life (Scholte, 2000, as cited in Eštok &
Bzdilová, 2011).
Zodrow (2009), who discusses the implications for corporate tax policy in response to
globalisation, regards globalisation as an environment characterised by high international capital
mobility, tax competition between countries, and tax avoidance. International tax avoidance is one
of the salient features of the economic environment facing a small open economy, and it is
especially difficult for any small open economies to operate in the presence of globalisation
(Zodrow, 2009).
An economy is said to be an open economy when there is the trade of goods and financial assets
between the domestic community and the rest of the world. An economy is small when
international prices and world interest rates are unaffected by domestic economic conditions.
While Wynne (2007) refers to a small open economy as the price taker on world markets, Pablo
(2013) believes that a small open economy has little or no control over the interest rate on its debt.
Countries with small open economies are too small to exert a significant influence on world prices
and interest rates and therefore they become price takers.
However, not all small open economies are the same (Pablo, 2013). They can be categorised as
either developed small open economies or developing (emerging) small open economies according
to three distinguishing features (Pablo, 2013). First, developing small open economies experience
comparatively more volatile business cycles than developed small open economies. Secondly,
consumption increases more than output in developing small open economies as compared to
developed countries. Third, emerging economies experience abrupt changes in interest rates on
their foreign debt, and such abrupt movements are unlikely to be seen in developed small open
economies.

31
According to Hines and Summers (2009), the acceleration of globalisation implicitly means that
many countries are turning out to be small open economies. Business NZ (2016) indicates that
New Zealand has become more globally integrated since deregulation and domestic market
liberalisation took place in the late 1980s. Because of the limited domestic capital base, New
Zealand is a capital importer (Business NZ, 2016). Being characterised as a small open economy,
New Zealand relies heavily on net capital inflows (Wynands, 2018).
Some studies argue that small open economies should abolish source-based capital income
taxation (Zodrow, 2009). As price takers in the capital market, the imposition of corporate tax on
capital income will distort the investment of highly mobile international capital in small open
countries. High taxes on the capital base will likely result in a reduction in the stock of capital
flows into an economy, given that the capital is highly mobile in these countries.
Governments are under increasing pressure to ease the tax burdens on businesses and investors as
business location choices, activity levels, and taxable incomes are very responsive to local tax rates
(Hines & Summers, 2009). Consequently, the corporate tax rate is on a downward trend because
of the intense competition to attract mobile capital (Zodrow, 2009). According to Kumar and
Quinn (2012), a gradual reduction of worldwide statutory corporate tax rates has been observed in
the past three decades, although there are various arguments in favour of imposing corporate
income tax.
Undeniably, the statutory corporate tax rates across the globe have seen a constant decline since
1980, and the largest reduction in company tax rate took place in the early 2000s (Asen, 2020).35
According to Asen (2020), the average corporate tax rates around the world had been declined
35 The historical corporate tax rate collected by the Tax Foundation comes from different sources and can be dated
back to 1980. Thus, the present study benchmarks the changes in corporate tax rate over the years against the rate in
1980.

32
from an average of 40.11 percent in 1980 to 23.85 percent in 2020. The US was formerly one of
the few countries with a high company tax rate: 38.91 percent in their case (which is comprised of
an average of the corporate income taxes imposed at the individual states level and the federal
statutory rate of 35 percent) (Asen, 2020). The US has undergone significant tax reform by
reducing the corporate tax rate to 21 percent at the end of 2017.
The last time they reduced the federal tax rate was in 1986, when the federal rate was reduced from
46 percent to 40 percent with effect from 1987. The US had maintained a federal corporate income
tax rate of 35 percent since 1993 prior to the 2017 tax reform. However, under the proposed tax
plan of the newly elected president, Joe Biden, the federal corporate tax rate will be increased from
21 percent to 28 percent, reversing the corporate tax rate cut under the Tax Cuts and Jobs Act 2017
(TCJA). Biden’s tax plan also proposes a minimum tax of 15 percent to be imposed on book profits
of more than USD 100 million for all US corporations.
Fundamentally, globalisation has set a new trend in corporate income tax rates worldwide. Small
countries are even facing strong incentives to impose low corporate tax rates as they are facing the
most elastic corporate tax bases (Hines & Summers, 2009). However, in the aftermath of the 2008
financial crisis, a new trend of “slowbalisation” emerged, when the globally integrated economy
started to experience a slow-down (Titievskaia, Kononenko, Navarra, Stamegna, & Zumer,
2020).36 According to this study, an example of the slowdown in globalisation is the decrease of
cross-border trade and investment relative to gross domestic product (GDP).37 Nevertheless,
globalisation is characterised by distinctive aspects and features. Titievskaia et. al. (2020) outline
36 The term “slowbalisation” was first used in 2015 by Adjiedj Bakas, a trend-watcher and futurologist (Kandil,
Battaïa, & Hammami, 2020). 37 The ratio of world trade relative to GDP is a standard estimation of globalisation (Antràs, 2020).

33
five pathways of globalisation and not every pathway underwent a deceleration in term of
interconnectedness.38
The Coronavirus pandemic in 2020 set the scene for “deglobalisation” 39 when the trend of
“slowbalisation” was intensified by the current health crisis (García-Herrero & Tan, 2020;
Titievskaia et al., 2020). While there is little evidence to show that the state of globalisation is in
retreat, the rapidly changing economic conditions will continue to impact on global businesses and
transform the current tax system.
1.4 Objectives and Scope of Research
1.4.1 Background and Motivation
Increasing trade and investment flows across national boundaries allow MNEs to locate their
businesses in multiple geographical locations, including low tax countries. The issue of BEPS
arises when multinationals manage to reduce their tax payments by moving profit from high-tax
territories to low-tax territories or a no-tax haven. BEPS affects all countries and jurisdictions as
the increasingly globally integrated business environment spawn opportunities for MNEs to gain
tax advantages by exploiting discrepancies between national tax systems of various jurisdictions.
From an economic point of view, losses of corporate tax revenues will significantly impede the
economic growth and social welfare of a country. Many countries have expressed their concern
38 According to Titievskaia et. al. (2020), the five pathways of globalisation include global trade in goods and services,
international financial openness, deepening inequality, globalisation of social interactions (tourism and migration),
and digital exchanges (data flows across border). 39 Globalisation and deglobalisation is a repeating phenomenon. The first deglobalisation happened between 1929 to
1979 (followed the globalised economy from 1840 to 1929) due to the depression and World War One. The second
deglobalisation was caused by the global financial crisis in 2008 (Jones, 2005, as cited in Kim, Li, & Lee, 2020).
34
over the potential tax collection problems associated with BEPS. Clausing (2015) points out that
profit shifting erodes the tax base, and it may be harmful to government tax collection.
Beyond this, BEPS constitutes a serious threat to most countries as it affects trust in the fair tax
system and perceptions of fairness. BEPS would lead to undesirable distortions of competition
between MNEs and businesses operating at a national level only (OECD, 2014b). The enterprises
who suffer from BEPS are the ones who cannot exploit gaps or mismatches between different tax
regimes as effectively (Alvarez-Martinez et al., 2018).
Hence, the OECD and G20 governments have been dedicated to re-writing the international tax
rules since 2013. The BEPS project began in 2013 and all parties, including academia, business
organisations, government, non-government organisations and even individuals have participated
in the review process of the BEPS Action Plans and subsequent governments have implemented
the OECD’s BEPS recommendations. Likewise, a series of actions has been taken up by the EU
to eliminate the harmful tax practices of MNEs (Alvarez-Martinez et al., 2018).
While governments and international bodies endeavour to tackle BEPS and close the tax loopholes,
some argue that the problem of BEPS has been overstated. The OECD acknowledges that the
adverse effects of BEPS on fiscal and economic activities are undetermined (OECD, 2013b). It is
argued that extensive media reports about the spectacular tax planning strategies used by MNEs
are merely speculation. Indeed, recent statistical evidence consistently shows that the impact of
BEPS on tax revenues is relatively moderate (Hines, 2014). To state it differently, there would not
be a significant impact on government revenues even if the negative effects of BEPS were
completely reversed. Thus, it is crucial to understand the current BEPS phenomena and one way
to do so is to measure the extent of BEPS using more current data.
35
Several studies, like Huizinga and Laeven (2008), Weichenrieder (2009), Heckemeyer and
Overesch (2013), and Janský and Palanský (2019), attempt to quantify the magnitude of BEPS
using different econometric techniques and estimation methods. However, most of the research is
US-specific or heavily EU-centric (Alvarez-Martinez et al., 2018). Furthermore, statistical results
remain scarce for developing countries. The lack of corporate balance sheet data in developing
countries leads to researchers focusing on trade data in analysing profit shifting activities (Cobham
& Loretz, 2014). To the best of the researcher’s knowledge, research examining the magnitude of
BEPS does not extend to New Zealand due to inadequate firm-level datasets.
The BEPS problems in New Zealand could be completely different from what has happened in
Europe or the US. New Zealand is a relatively remote country situated in the South Pacific and is
considered as a distant nation by most Western countries. While New Zealand has been one of the
least regulated and easiest countries in which to do business (World Bank, 2020a), it may not be
an attractive destination for overseas interests to set up conduits for international transactions. This
is because a company incorporated under New Zealand law will be held to be a resident taxpayer
and its worldwide income will be taxed under the comprehensive FIF and CFC rules (Smith, 2010).
Likewise, New Zealand is consistently found to be one of the least corrupt countries and it tops
the 2020 corruption perceptions index (CPI) published by Transparency International (TI) in
January 2021 (TI, 2020).40 According to Bilicka and Seidel (2020), the relationship of corruption
in respect to profit shifting has received considerable attention as corruption may cripple the
implementation of the BEPS initiative. Their study found that the reported profits of a
multinational firm are strongly related to the joint effect of the taxes and corruption. Given that
40 TI is an international non-governmental organisation (NGO) which publishes an annual index ranking the world’s
most corrupt countries. Besides CPI provided by the TI, the worldwide governance indicators (WGI) released by the
World Bank is also a measure of perceptions of corruption (World Bank, 2020b).
36
New Zealand is one of the least corrupt nations, the magnitude of profit shifting in this country
remains inconclusive.
1.4.2 Objectives of the Research and Research Questions
International corporate tax avoidance is a broad research topic and has been subject to extensive
studies in different areas. BEPS is another term that refers to international tax avoidance practices
employed by MNEs to minimise their tax liabilities. Many studies focus on various BEPS channels
exploited by MNEs to shift profit artificially out of higher tax locations. Some of these studies
attempt to understand the nature and effects of BEPS. More recent studies strive to quantify the
scale and economic impact of BEPS using available macro- or micro-data.
The major interest of the present study is to explore the profit shifting activities of MNEs by
focusing on estimating the magnitude of BEPS in New Zealand using micro-level company data.
While major studies of BEPS estimates have been undertaken on US and EU companies, the
present study seeks to investigate resident companies in New Zealand for tax purposes. Micro-
level data has an advantage over macro-level data as it accommodates researchers by providing
more information to distinguish between real economic activity and BEPS-related activity (OECD
2015d). Thus, firm-level financial data establishes a better analysis of the scale of BEPS.
At an international level, corporate tax rate differentials impact on MNEs with cross-border
affiliates. New Zealand subsidiaries with foreign multinational parents in other jurisdictions or
New Zealand owned multinational parents with offshore subsidiaries are exposed to the corporate
income tax rate of New Zealand and other nations. The differences in statutory corporate tax rates
across borders facilitate tax avoidance for MNEs.

37
At the domestic level, the domestic tax systems in most jurisdictions are generally biased in favour
of debt finance. The use of debt is just another simple method of shifting profits out of New
Zealand. In terms of non-resident direct investment, the New Zealand tax regime treats non-
resident debt investment more favourably than non-resident equity investment as the cost of equity
(e.g., dividends) is not tax-deductible whereas interest paid on the debt is deductible (IRD & the
Treasury, 2015). The interest payments on unrelated party borrowings are subject to AIL at 2
percent, while interest paid on related party borrowings is subject to NRWT at 10 percent.
As a whole, the tax bias favours non-resident debt-financing as borrowing expenses are tax
deductible and the NRWT imposed on interest paid to non-resident lenders is much lower than
company tax of 28 percent on business income earned by a company that is owned by non-
residents.
While the thin capitalisation rules restrict the debt-to-net-asset ratio of an entity to 60 percent,41
the rules do not deny a deduction of interest for a foreign-owned New Zealand business unless the
New Zealand group ratio (New Zealand group interest-bearing debt to assets) exceeds 110 percent
of the worldwide group ratio (worldwide group interest-bearing debt to assets) (Simpson Grierson,
2013). The worldwide group debt test set out in the thin capitalisation rules is rarely used as long
as the companies stay within the 60 percent safe harbour which allows them to claim their interest
deductions on debt without referring to their worldwide group’s financial leverage (IRD & the
Treasury, 2015). Because of deficiencies and gaps in the New Zealand tax regimes, a company is
41 The debt-to-net-asset ratio is calculated as “the total group interest-bearing debt / total group assets net of non-debt
liabilities of a New Zealand entity or group” (PwC, 2020a). The “inbound” thin capitalisation threshold was previously
75 percent and was reduced to 60 percent starting from the 2012 income year (with effect from 1 April 2011) whereas
the “outbound” thin capitalisation threshold is 75 percent (PwC, 2020a).
38
more likely to engage in profit shifting arrangements to reduce tax liabilities incurred by the
company.
The first part of the study sets out to find indirect evidence of profit shifting by examining how the
reported profits of a sampled company change in associated with the tax rate differentials. The
observational units in the first part of study are New Zealand subsidiaries owned by foreign MNEs
(NZSOFMs) and New Zealand domestically owned MNEs (NZDOMs). NZDOMs do not include
New Zealand owned companies with solely domestic subsidiaries: they refer to New Zealand
owned companies with overseas subsidiaries located beyond New Zealand.
Since profit shifting can be achieved typically through manipulating company debt level, the
second part of the study seeks to further uncover the traits of profit shifting by observing the debt
structure of a company with foreign ownership as compared to companies with domestic
ownership. Additionally, this study attempts to find out if transfer pricing plays a role in facilitating
profit shifting of multinational firms owned by non-residents in view of the fact that cross-country
intra-group transfer pricing can be exploited for profit shifting purposes.
The research questions of this study therefore are:
RQ1: What effect do (cross-border) tax differentials have on the profits reported by NZSOFMs
under BEPS?
RQ2: What effect do (cross-border) tax differentials have on the profits reported by NZDOMs
with overseas subsidiaries under BEPS?
RQ3: What are the differences in terms of debt structure and transfer price of a company with
foreign ownership compared to a company with domestic ownership?

39
1.5 Structure of the Thesis
This chapter has reviewed the academic works related to empirical methods of measuring BEPS.
The chapter also looked into the New Zealand tax system and the tax aspects of New Zealand from
an international viewpoint. This set out a background to the topic, and thus led up to the problem
statement for the research. Ultimately, the objectives of carrying out this research and the research
questions are identified at the end of this chapter. The remainder of the thesis is structured as
follows.
Chapter 2 summarises the existing literature conducted on corporate tax avoidance and BEPS. This
chapter illustrates the chronological development of the statistical estimation of BEPS, starting
from earlier studies in the 90s to current scholarly literature. The main BEPS channels are also
discussed in this chapter before the research hypotheses are formed.
Chapter 3 sets out the methodology of research used to solve the research problem in this study.
The research paradigms were first discussed in this chapter. The remainder of the chapter
delineates the statistical empirical models used to measure the magnitude of BEPS. Finally, the
quantitative methods engaged by the researcher in carrying out the sample selection and data
collection are outlined in this chapter. The limitations related to collecting and analysing the data
are also brought up.
Chapter 4 presents the empirical results of this study. The chapter is important in uncovering
answers to the research questions set out in Chapter 1. Nevertheless, the empirical evidence is
obtained from the statistical analyses is used to validate the research hypotheses stated in Chapter
1.

40
Lastly, Chapter 5 will look back on the main purpose of the study and summarise the major
findings derived from the statistical results in Chapter 4. The limitations of the study are discussed
in this chapter as it is crucial in refining the research design for future studies. The chapter also
outline the theoretical and practical contributions. Finally, recommendations and suggestions for
future studies are provided.
41
Chapter 2 Literature Review and Development of Hypotheses
2.1 Introduction
The term “BEPS” was introduced in the 2013 G20/OECD BEPS project to deal with tax avoidance
issues of MNEs using BEPS tools. This chapter will evaluate the relevant literature ranging from
the topics of tax avoidance to BEPS to formulate the hypotheses of this study. Section 2.2 discusses
the major issues involved in resolving the core problem for this research, which is the estimation
of the magnitude of BEPS. Section 2.2 also presents the existing data sources that make the
quantitative research of this topic possible. Section 2.3 sheds light on empirical methods that had
been employed in the prior studies to measure BEPS. In addition, this section provides a review
of studies on the most prevalent BEPS channels. By considering existing theories and evidence,
the research hypotheses are developed and formulated in Section 2.4. Finally, Section 2.5
concludes the chapter.
2.2 Measuring BEPS
The OECD considers BEPS to be a “serious risk to tax revenues, tax sovereignty and tax fairness
for OECD countries and non-member alike” (OECD, 2013c, p. 2). Unquestionably, BEPS could
have unintended adverse consequences such as loss of government revenue, economic inefficiency
due to misallocation of resources, distortion of business competition between multinational and
domestic companies, and loss of confidence in the fairness of current tax systems. Determining
the magnitude of BEPS is crucial in helping governments to manage the harmful impact of BEPS
and to evaluate the effectiveness of BEPS countermeasures.

42
A clear definition of BEPS is important for measuring its scale or extent. The ability to understand
this has significant implications for policy (Barrios & d’Andria, 2018). More specifically, an
exhaustive definition of BEPS can be stated as follows:
BEPS relates chiefly to instances where the interaction of different tax rules leads to double
non-taxation or less than single taxation. It also relates to arrangements that achieve no or
low taxation by shifting profits away from the jurisdictions where the activities creating
those profits take place. No or low taxation is not per se a cause of concern, but it becomes
so when it is associated with practices that artificially segregate taxable income from the
activities that generate it. In other words what creates tax policy concerns is that, due to
gaps in the interaction of different tax systems, and in some cases because of the application
of bilateral tax treaties, income from cross-border activities may go untaxed anywhere, or
be only unduly lowly taxed (OECD, 2015b, p. 57).
2.2.1 The Problems of Measuring BEPS
Measuring BEPS is challenging because it cannot be observed directly. According to Koch and
Oestreicher, pertaining to the OECD BEPS Action 11 Request for Input, the different classification
of the company’s residence, legal forms and financing contracts by tax authorities, made the BEPS
activities hard to observe directly in published financial statements (OECD, 2014a). However,
Koch and Oestreicher note that the full aggregate international tax figures that would improve the
empirical evidence of tax research are currently not available. Given the absence of aggregate
international tax data, accounting information presented in the financial statements constitutes the
second-best option for empirical research in taxation.
In addition, the presence of MNEs in many different parts of the world and the complex corporate
structures of MNEs complicate BEPS estimation. For this reason, it is fundamentally difficult to
identify the intra-group cross-country transactions in tax or financial accounting data due to the
lack of explicit data sources. The complete lack of data in some countries or jurisdictions constrains
the analysis of BEPS even further. Despite that, current government policy analysis and decisions

43
are based on incomplete information and such analyses recognise the data limitations and how
those limitations impact on the interpretation of the results (OECD, 2015b).
The current estimates of BEPS magnitude are arguably less convincing as most of the studies
assessing profit shifting activities focus on the profits indicated in the financial statements. The
reported profit is typically different from taxable income in nature because of the different sets of
rules governing financial reporting and tax reporting. The actual amount of taxes paid by a
company, according to their taxable income, may not be the same as the amount of taxes reported
according to the book income (also known as financial income). In addition, the financial incomes
of MNEs that operate in multiple countries may be subject to different measurement and
recognition rules, and distinct levels of consolidation.
The book-tax differences have always been the focus of interest of a significant line of accounting
research. The study of Bokulic, Henry and Plesko (2012), which attempts to reconcile the financial
income to taxable income of US multinational corporations, found that the fundamental book-tax
differences include temporary differences, permanent differences, and consolidation differences.
In their view, temporary differences arise when book and tax reporting systems recognize the same
amount of income or expense at different times, while permanent differences are caused by the
differences of the total amount of income or expense between the financial and tax reports.
Temporary differences could last for several years until the differences are entirely reversed and
this will further impede the measure of BEPS using financial statements.
Even though taxable income is possibly the most adequate form of data, most researchers still
resort to the financial information derived from financial statements in constructing their
estimation models. This is because the tax return information, including taxable income, is
confidential and therefore it is restricted information. While the proponents of public disclosure of

44
tax return information believe that they will gain much better insights into the complex situations
of BEPS if the tax return information is made publicly available, enormous concerns about possible
unintended outcomes make such disclosure improbable.
Lenter, Slemrod, and Shackelford (2003) review the issues related to the full disclosure of
corporate tax return information and they discuss the arguments and counterarguments of public
disclosure of tax return information from accounting, economics, and legal perspectives.
According to them, there are several potential arguments for keeping the tax return information
undisclosed. First, the confidentiality assurances of corporate tax returns will enhance the
willingness of companies to disclose confidential and sensitive information and thus lead to
increased tax compliance. By keeping the return information confidential, it will also help to
protect the valuable proprietary information contained in the company tax returns. Besides, the full
disclosure of tax returns of large corporations, which may run into hundreds of pages, may cause
greater confusion rather than enlightenment among the public, due to the public may lack of
expertise and misinformed interpretation of tax information. However, Lenter et al. (2003) support
limited public disclosure of a few bottom-line items in the financial statements or an expanded
form of book-tax reconciliation.
2.2.2 Currently Available Data Sources
Researchers are confronted by various limitations in using the currently available databases in
measuring BEPS. One of the major limitations is the lack of comprehensive tax data due to the
confidential company tax information or the fact that some of the tax information is not currently
analysed or processed. Despite the significant deficiencies of existing data, they remain useful
sources of information in evaluating BEPS.

45
Statistical estimation of BEPS started as early as the early 1990s with researchers employing macro
(country-level) data to conduct cross-sectional analysis. At the same time, micro (firm-level) data
has mostly been used in recent studies for panel data analysis. A substantial amount of existing
research related to the scale of BEPS was carried out mostly in the US and EU countries, given
that the available databases such as Bureau of Economic Analysis (BEA), Compustat, Orbis,
Amadeus, and micro database on direct investment (MiDi) provide data on US or European
companies.
Table 2.1 and Table 2.2 provide an overview of the source and accessibility of macro-data and
micro-data, respectively. Current studies prefer firm (micro-level) data to country (macro-level)
data in analysing BEPS. Lipsey (2010) indicates that the underlying information from aggregate
country-level databases is typically tainted by BEPS behaviour. Hence, it is difficult to identify
BEPS components in the macroeconomic statistics. The use of firm-level data would substantially
help to improve and refine BEPS studies (OECD, 2015b). Researchers typically found a larger
scale of BEPS in earlier academic studies using macro-level aggregate data (OECD, 2015b).
Table 2.3 presents the most common corporate and financial databases which are widely employed
in existing BEPS studies. The company data found on these databases comprises mainly US and
European companies.
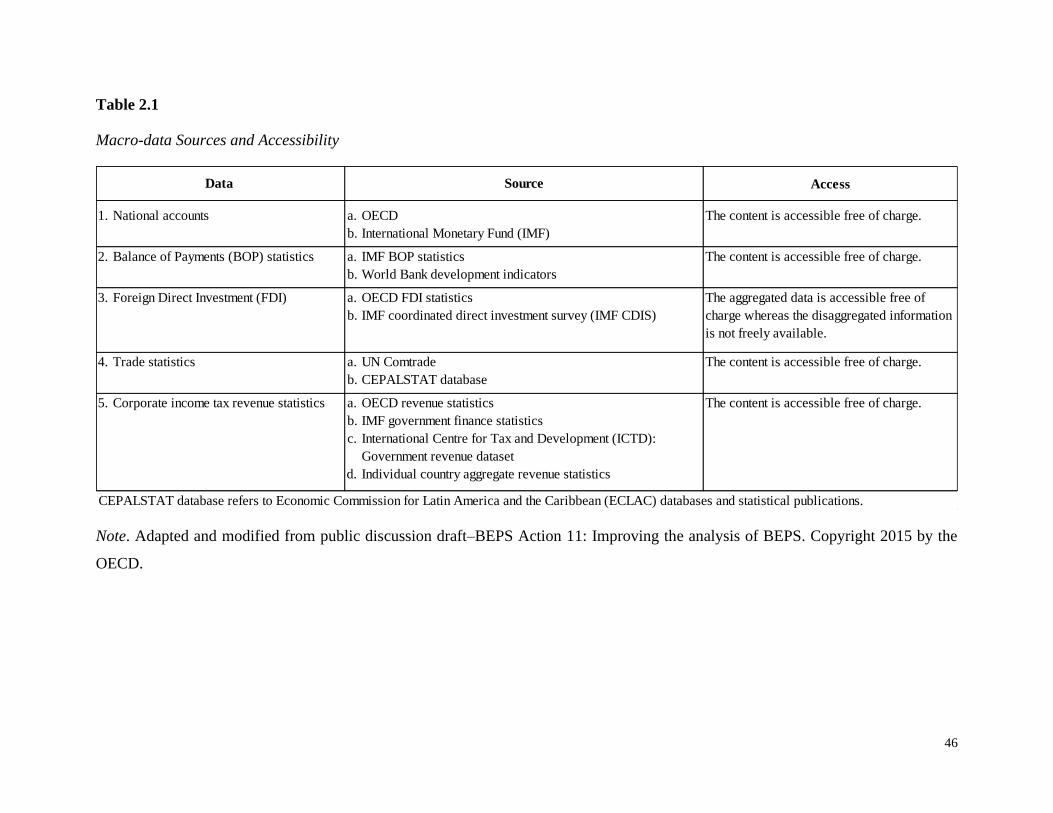
46
Table 2.1
Macro-data Sources and Accessibility
Note. Adapted and modified from public discussion draft–BEPS Action 11: Improving the analysis of BEPS. Copyright 2015 by the
OECD.
Access
1. National accounts a. OECD
b. International Monetary Fund (IMF)
2. Balance of Payments (BOP) statistics a. IMF BOP statistics
b. World Bank development indicators
3. Foreign Direct Investment (FDI) a. OECD FDI statistics
b. IMF coordinated direct investment survey (IMF CDIS)
4. Trade statistics a. UN Comtrade
b. CEPALSTAT database
5. Corporate income tax revenue statistics a. OECD revenue statistics
b. IMF government finance statistics
c. International Centre for Tax and Development (ICTD):
Government revenue dataset
d. Individual country aggregate revenue statistics
CEPALSTAT database refers to Economic Commission for Latin America and the Caribbean (ECLAC) databases and statistical publications.
The content is accessible free of charge.
Data Source
The aggregated data is accessible free of
charge whereas the disaggregated information
is not freely available.
The content is accessible free of charge.
The content is accessible free of charge.
The content is accessible free of charge.

47
Table 2.2
Micro-data Sources and Accessibility
Note. Adapted and modified from public discussion draft–BEPS Action 11: Improving the analysis of BEPS. Copyright 2015 by the
OECD.
Access
1. Company financial information a. Published company financial statements
b. Commercial databases
c. Open access databases
d. Database administered by public
authorities
The data administered by US BEA and German Bundesbank are
restricted data.
2. Corporate income tax returns a. Tax authorities Government analysts generally have access to data, but data
accessibility varies from country to country. External researchers are
unlikely to access the data.
3. Detailed specific company tax
information
a. Public enquiries by legislative and
parliamentary committees
The information has become available because of these public
enquiries.
4. Customs (trade) data a. Custom agencies This country-specific data is available in a few countries only.
Data Source
In general, the information is publicly available. However, data
consolidation is needed for analysis. Several commercial databases
such as Bloomberg, Amadeus, Orbis can be accessed without
restriction by subscribers.
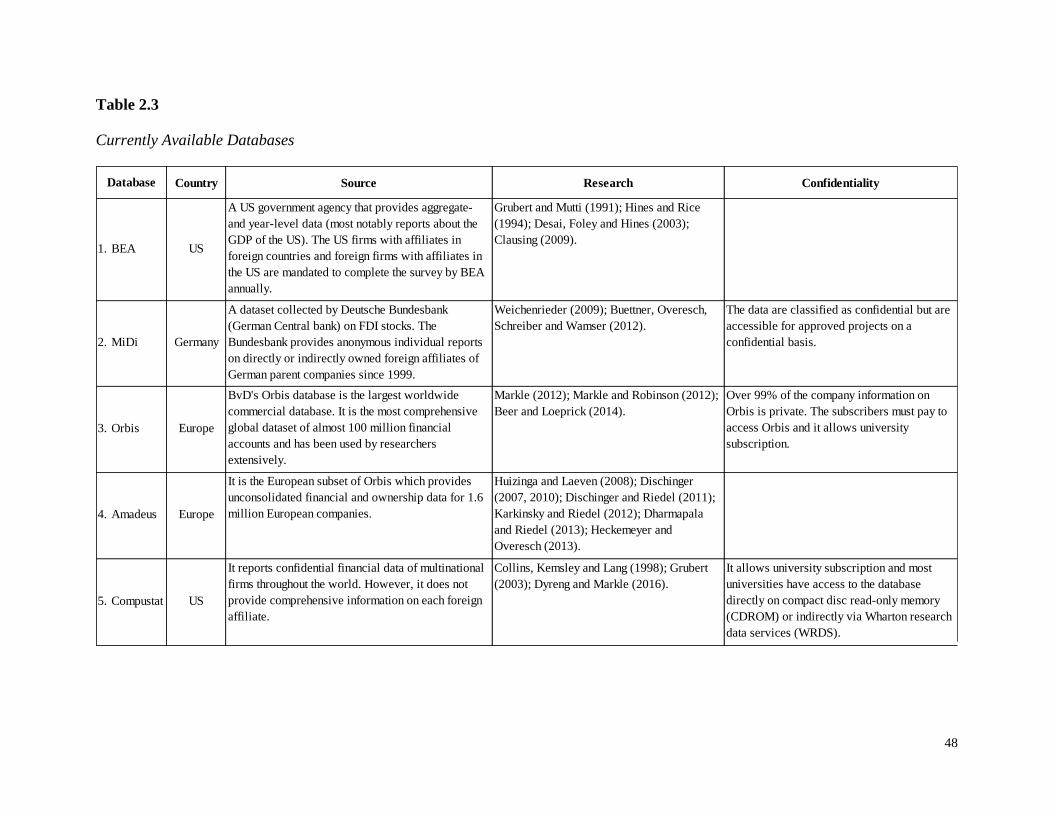
48
Table 2.3
Currently Available Databases
Country Source Research Confidentiality
1. BEA US
A US government agency that provides aggregate-
and year-level data (most notably reports about the
GDP of the US). The US firms with affiliates in
foreign countries and foreign firms with affiliates in
the US are mandated to complete the survey by BEA
annually.
Grubert and Mutti (1991); Hines and Rice
(1994); Desai, Foley and Hines (2003);
Clausing (2009).
2. MiDi Germany
A dataset collected by Deutsche Bundesbank
(German Central bank) on FDI stocks. The
Bundesbank provides anonymous individual reports
on directly or indirectly owned foreign affiliates of
German parent companies since 1999.
Weichenrieder (2009); Buettner, Overesch,
Schreiber and Wamser (2012).
The data are classified as confidential but are
accessible for approved projects on a
confidential basis.
3. Orbis Europe
BvD's Orbis database is the largest worldwide
commercial database. It is the most comprehensive
global dataset of almost 100 million financial
accounts and has been used by researchers
extensively.
Markle (2012); Markle and Robinson (2012);
Beer and Loeprick (2014).
Over 99% of the company information on
Orbis is private. The subscribers must pay to
access Orbis and it allows university
subscription.
4. Amadeus Europe
It is the European subset of Orbis which provides
unconsolidated financial and ownership data for 1.6
million European companies.
Huizinga and Laeven (2008); Dischinger
(2007, 2010); Dischinger and Riedel (2011);
Karkinsky and Riedel (2012); Dharmapala
and Riedel (2013); Heckemeyer and
Overesch (2013).
5. Compustat US
It reports confidential financial data of multinational
firms throughout the world. However, it does not
provide comprehensive information on each foreign
affiliate.
Collins, Kemsley and Lang (1998); Grubert
(2003); Dyreng and Markle (2016).
It allows university subscription and most
universities have access to the database
directly on compact disc read-only memory
(CDROM) or indirectly via Wharton research
data services (WRDS).
Database

49
2.2.3 The Magnitude of BEPS
Almost all studies use the indicators of profitability such as earnings before interest and taxes
(EBIT) or pre-tax profit reported in the financial statements as the dependent variable in a
regression model to determine the correlations between tax and measure of profits. Numerous
studies have established that reported profits of a parent or subsidiary responded to the local tax
levels (Heckemeyer & Overesch, 2013). However, the profit shifting activity of MNEs in response
to the tax rate differentials across multiple countries remains undetermined.
Tax semi-elasticity of profits is a common estimation method employed in most empirical studies
of BEPS (see Appendix A for semi-elasticity coefficient toward corporate tax rate difference).
Heckemeyer and Overesch (2013) identified 25 empirical analyses that regress the profit measures
of multinational parents or subsidiaries on international tax differentials in order to predict the tax
semi-elasticity of their profits. Semi-elasticity estimates the percentage change in profit measure
to a one percentage point change in the shifting incentive (in most cases, tax rate differentials) in
order to shift reported profits across countries. For example, a tax semi-elasticity of pre-tax profit
of –0.4 means that an increase in one percentage point of the tax rate differential within the MNE
would result in a 0.4 percent drop in reported profit.
The BEPS Action 11 final report also constructed six indicators of BEPS, as shown in Table 2.4,
with the purpose of determining the scale of BEPS, keeping track of BEPS variations over time,
and checking the progress of BEPS countermeasures (OECD, 2015d). Measuring the extent of
BEPS and changes in it over time is challenging. The question of how precise and accurate the
indicators are is largely reliant on the methods of measurement and the available data. The
limitations and caveats related to each indicator must be recognised when interpreting the
indicators (OECD, 2015d).

50
The six indicators in the report are more illustrative, rather than definitive, and none of them gives
a complete picture of BEPS (OECD, 2015d). While the six indicators are presented in five
categories, the data used to calculate each of the indicators can be derived from the existing
available macro-level and micro-level data.
In particular, the methodological approaches of indicators 3 and 4 are similar to the estimation
method of this study. They are constructed based on the theory of profit shifting determined by
distinctive tax rates across various locations (OECD, 2015d). A relative measure is employed to
compare profit rates of companies, or groups of companies which are in lower tax and higher tax
locations. The lower or higher tax location is defined by effective tax rates. The profit rate ratio is
defined as pre-tax income divided by an economic activity variable, and it acknowledges that
BEPS behaviour is featured by the disconnection between the location where profit is reported and
the location where economic activity generating that profit take place (OECD, 2015d).
The economic activity of a company can only be measured indirectly using firm data from publicly
available financial statements. Economic factors, such as assets, employment and labour
compensation, operating expenditures, or output, such as sales, can be used as the denominator in
the profit rate ratio (OECD, 2015d). In the BEPS Action 11 final Report, the profit rate indicators
use assets to measure economy activity. However, the intangible assets, which significantly
contribute to MNE global income, may be undervalued as intangible assets are generally excluded
from reported total assets or they are understated.
One of the limitations of the indicators is that the measures are calculated using accounting
information derived from publicly available financial reporting statements of public companies
but not privately held firms or partnerships (OECD, 2015d). In other words, sample selection bias
could have occurred in the studies, in which certain members of the population of interest are not

51
included in the sampling process, and, as a consequence, the findings might not reflect the intended
population precisely.

52
Table 2.4
OECD BEPS Action 11: Six Indicators of BEPS
Note. Adapted and modified from Measuring and monitoring BEPS Action 11–2015 final report: Improving the analysis of BEPS.
Copyright 2015 by the OECD.
Macro-sourced Data Micro-sourced Data
A. Disconnect between financial and real economic activities C. Profit rate differentials within top global MNEs
1. Concentration of high levels of FDI relative to GDP. 3. Differential profit rates compared to effective tax rates.
4. Differential profit rates between low-tax locations and
worldwide MNE operations.
B. Profit shifting through intangibles D. MNE vs. "comparable" non-MNE effective tax rate differentials
2. Concentration of high levels of royalty receipts relative to 5. Effective tax rates of large MNE affiliates relative to
R&D spending. non-MNE entities with similar characteristics.
E. Profit shifting through interest
6. Interest expense to income ratios of MNE affiliates in high-tax
locations.

53
2.3 A Review of the Empirical Literature on BEPS
BEPS could possibly occur in a wide variety of ways such as transfer pricing manipulation,
international debt shifting (to high-tax countries), exploitation of mismatches between different
tax regimes, deferral in repatriation of foreign profit earned in low-tax countries and the
inappropriate use of tax treaty benefits. Measuring BEPS has never been a simple task as BEPS
itself is a complex problem that involves various international tax avoidance schemes that take
place in multiple tax jurisdictions. MNEs can capitalise on various BEPS channels at the same
time and pose a great challenge to the work of measuring the scale of BEPS. Acciari, Tomarelli,
Limosani, & Benedetti (2015) pointed out that the diverse and complex tax planning strategies
employed by multinational corporations to alleviate a company’s tax liabilities is one of the
major difficulties in evaluating the scale and impact of BEPS. In addition, the absence of
complete and dependable international micro-data sets, and the lack of sufficiently accurate tax
variables to identify a low-tax system increases the level of complexity of BEPS estimation
(Acciari et al., 2015).
There is a large strand of literature related to the measurement of the extent of BEPS and
different conclusions have been drawn from the studies about their seriousness. More
specifically, Dharmapala (2014) and Riedel (2014) have provided a good overview of the
economic literature relevant to the profit shifting estimates.
Dharmapala (2014) reviews a broad range of economic literature and presents a comprehensive
summary of the findings of the existing empirical literature on tax-motivated profit shifting.
His survey mainly focuses on elucidating the magnitude of BEPS. His paper presents some
empirically based evidence of the existence of BEPS behaviours. He finds that the scale of
BEPS in earlier studies is typically much larger than that found in recent studies. The latest
empirical studies, which uses micro-level and richer sources of data, has found a smaller
54
estimated magnitude of BEPS. Dharmapala (2014) also indicates that the shift from aggregate-
level data to micro-level datasets has enhanced the integrity of profit shifting analysis. The
estimates of magnitude of profit shifting are more credible and convincing when using firm-
level analysis.
Riedel (2014) also conducted an analysis on the existing academic literature that quantitatively
estimates the tax avoidance behaviour of multinational firms. His paper assesses the descriptive
evidence and indirect evidence of the existing studies and reports evidence of income shifting
by multinational entities. While the media, the public and politicians are heavily criticising the
aggressive arrangements of tax-motivated profit shifting of MNEs, he sought to find out
whether the tax issues of BEPS are indeed as critical as is featured in the media concerning
BEPS. As the tax avoidance activities of multinational firms are not directly observed, the
identification approaches undertaken by researchers are indirect and dependent on presumption.
Any violation of these indirect approaches will lead to biased assumptions (Riedel, 2014).
Riedel (2014) concludes that various studies using different data sources and estimation
approaches unanimously prove the BEPS behaviours of MNEs. However, the quantitative
estimates of profit shifting vary across studies, ranging from less than 5 percent to more than
30 percent of the income earned by companies in high-tax locations being shifted to low-tax
locations. In the study, Riedel (2014) finds that the most common approach pursued by
researchers for identifying multinational income shifting is to compare the pre-tax profitability
rates of high-tax and low tax affiliates. While early studies tend to use this approach in
estimating BEPS, recent studies analyse how affiliates’ pre-tax profits change with regard to
corporate tax reforms. He points out that it is too early to draw an inference on the quantitative
importance of BEPS. Future research will rely heavily on the access of good-quality tax
information that enables identifying MNEs’ reported tax bases, tax liabilities or tax payments
and business activity across group locations for a reliable estimation of BEPS (Riedel, 2014).

55
Undeniably, anecdotal evidence gives the impression of the proliferation of BEPS among
multinational corporations. The exemplar (anecdotal evidence)42 , together with base rates
(statistical evidence), are often used by newsmakers and influencers with a persuasive intent to
convince readers of certain point of view (Hornikx, 2018). He indicates that both anecdotal and
statistical evidence are not consistent with each other. This explains why a few current studies
suggest that the far-reaching incidence of profit shifting, which is widely cited in policy debates
and general public discussion might not be necessarily true.
Hines (2014) indicates that the journalistic stories of controversial BEPS measures employed
by MNEs generally leave out critical elements from legal and economic perspectives and make
it difficult to make any inference about how severe the problem of BEPS is. According to Hines
(2014), the statistical studies constantly find that BEPS has only a modest impact on tax
revenues. Dharmapala (2014) reports a relatively small magnitude of BEPS that were presented
in the latest empirical literature. Heckemeyer and Overesch (2013) have similar findings and
reveal that recent studies are associated with a smaller scale of BEPS.
Hines (2014) expresses concern that the reporting of the BEPS issues was exaggerated because
of the inconsistencies in the evidence between empirical reports and popular discussion. The
relocations of pre-tax profits away from home-countries with higher tax rates to foreign
locations with zero or incredibly low tax rates, do not come without cost. He indicates that the
arrangements of reallocating profits to low-tax locations by MNEs in order to alleviate their
tax burdens might not be as attractive and cost-effective as is thought. He also points out the
empirical puzzles of why the corporations continue to pay taxes in high-tax countries and why
there are not more tax-sensitive multinational corporations highly involved in tax avoidance
schemes. Nevertheless, Hines (2014) argues that, while BEPS is a real phenomenon, it is
42 The exemplars also include narrative evidence, case histories, and story evidence (Hornikx, 2018).

56
considerably smaller in magnitude. He questions whether radical reform is necessary due to
the modest size of the BEPS problem.
Barrios and d’Andria (2018) review an extensive quantity of the earlier literature on BEPS in
order to explain the apparent downward trend in the estimation of the magnitude of profit
shifting. They indicate that the smaller estimated magnitude of profit shifting is simply related
to the wide use of different econometric techniques. They also show that current empirical
studies employ richer and newer data sources for panel data analyses resulting in lower
elasticities. Nevertheless, they propose a multilevel estimation strategy as an alternative
empirical methodology to be used in profit shifting analysis.
2.3.1 Empirical Methods of Measuring BEPS
2.3.1.1 Profit Measures and Corporate Tax Rates
Grubert and Mutti (1991) are among the few researchers who studied multinational income
shifting. Their study is the only comprehensive study that presents direct evidence on the
relationship between profit margins and tax rates in the early 1990s. They use the US
Commerce Department’s 1982 data to analyse the profit shifting activities of the US
multinational affiliates from high-tax countries to low-tax countries. There are two types of
profitability measures used in their study: (1) the ratio of profit to local sales and (2) the ratio
of book income to local equity.43
The study of Grubert and Mutti (1991) shows that the US affiliates located in low tax countries
reported a higher profit from sales. Yet, they mention that the use of local sales in the
denominator of the company profit measure only gives an approximate idea of affiliate activity
as other material inputs are unascertained. In addition, Hines and Rice (1994) find that firms
43 The variables are derived from the US Commerce Department and the study demonstrated direct evidence of
profit shifting.

57
may vary in their purchases of intermediate inputs. Hines and Rice (1994) suggest that the rate
of return of equity is a more satisfactory measure of the affiliate’s profitability. However,
MNEs have an incentive to finance their affiliate with a high debt-equity ratio and the finding
of a higher return on equity in low-tax countries may only reflect practical financing decisions
made by the parent company (Hines & Rice, 1994).
Hines and Rice’s (1994) study on profit shifting is one of the early pioneering studies widely
cited by academic researchers. Their study predominantly examines the capability of US
corporations to shift their profit and real business activities from high-tax foreign jurisdictions
to tax-preferred low-tax foreign jurisdictions. They use the country-level data on US affiliates
in 1982 to investigate the relationship between foreign tax rates and the reported profit of US
FDI abroad, controlled for capital and labour inputs.
Hines and Rice (1994) are concerned that the profit shifting activities will erode the US tax
base in the long run and shift productive physical activities (for example, employment of capital
and labour) to low-tax locations. In this same study, the pre-tax income of a subsidiary is used
to represent the sum of “true” income and “shifted” income. The “true” level of income is
determined by measuring the capital and labour inputs used by the subsidiary. The “shifted”
income is determined by the tax rate difference between the subsidiary and the parent company.
The empirical results indicate that the profitability of multinational firms responds significantly
to local tax rates and the tax effect is strongest at low-tax rates. A one percentage point increase
in the host country tax rate resulted in a lower reported after-tax profit of affiliates of US
corporations by around 3 percent. The study of Hines and Rice (1994) is known as the Hines-
Rice approach.
Clausing (2009) investigates the income shifting of US multinational firms using a similar
approach to that of Hines and Rice (1994). She runs a panel regression analysis on two periods
(1982–1993 relative to 1993–2004) to find out how the profit rate (pre-tax income scaled by

58
sales) for all US affiliates in a foreign country and in a given year, is affected by the tax rate
differential with the US. Her study yields a coefficient of –0.5 and the income shifting is greater
in the latter part of her sample period (1993–2004).
Klassen and Laplante (2012) use a more distinct approach to analyse BEPS. They observed US
based multinational companies from 1988 to 2009 to determine if the companies shift income
from the US to subsidiaries in foreign countries. They used the foreign tax rate as a measure
of the strength of the incentive to shift income abroad. Their estimation of foreign tax rate is
as follows:
Foreign tax rate = Foreign pretax income/Foreign sales
Another approach in estimating income shifting has been developed by Dyreng and Markle
(2016). They argued that the direction and extent of income shifting can be estimated by
analysing the difference between the sales location of US multinationals and the location of
their reported earnings. However, it relies heavily on the assumption that the location of sales
is nonmanipulable and that it is not affected by income-shifting strategies.
A new approach which departs significantly from the Hines-Rice approach has been proposed
by Dharmapala and Riedel (2013). This study compares the differential impact among low-tax
and high tax subsidiaries of a common shock to the same parent, controlling for other factors
that may affect affiliates’ reported profit.
In the study of Dischinger, Knoll, & Riedel (2013), the authors suggest that multinational firms
are resistant to shifting profits away from the high tax country where their headquarters are
located. The semi-elasticity of shifting profits from parents located in high tax jurisdictions to
affiliates in low tax jurisdictions is 0.5. They find that the magnitude of income shifting from
high-tax parents to affiliates in low tax jurisdictions is smaller than shifting from high-tax
affiliates to parents, and this could be attributable to tax or non-tax reasons.
59
The studies on tax-inducing profit shifting since the early nineties were mostly conducted using
US data. The study of Weichenrieder (2009) is the first with non-US data. He examines the
profit shifting behaviour of multinationals in Germany using the MiDi. This database was
compiled by the Deutsche Bundesbank from inbound and outbound FDI of Germany.
Weichenrieder (2009) believes that the foreign tax rate influences firm profitability and he
specifically looks at how the foreign tax rate influences German-owned subsidiaries abroad, as
well as German affiliates with a foreign parent.
Weichenrieder (2009) follows the collection method of the Deutsche Bundesbank to divide
directly-held and indirectly-held affiliates. On the outbound side, a directly-held German-
owned foreign affiliate is the affiliate with no intermediate foreign company in the ownership
chain, while an indirectly-held foreign affiliate has at least one foreign company between the
foreign affiliate and the German investor. On the inbound side, an indirectly-held affiliate is
owned by a foreign-owned intermediate company in Germany whereas a directly-held affiliate
is owned by a foreign investor. Weichenrieder (2009) finds compelling evidence for profit
shifting for inbound FDI. He finds that a 10 percentage point rise in the home country tax rate
of a foreign parent causes a 0.5 percentage point increase in the profit of its subsidiary located
in Germany.
It appears that the existing studies employ similar estimation approaches in examining the
profit measures and corporate tax rate changes in order to identify profit shifting, and the
estimation results are comparable across different studies. The present study uses a similar
estimation method to the previous studies in measuring the magnitude of BEPS in New Zealand,
as the empirical findings of this study will only be meaningful if the estimates of the profit
shifting activities of MNEs are comparable with existing evidence in other research with the
same measure.

60
2.3.1.2 Comparing Non-domestic Enterprises with Domestic Enterprises
Riedel (2014) reviews a broad range of academic literature that provides quantitative evidence
of multinational profit (or income) shifting. He finds that the studies primarily investigate the
link between the affiliates’ reported pre-tax profits and corporate tax rates, which comes with
several caveats. Riedel (2014) suggests alternative mechanisms that do not rely on estimation
methods based on difference in corporate tax rates. One such approach is to compare tax
variables of comparable multinational and national (domestic) enterprises.
In New Zealand, Smith and Dunmore (1997) examine corporate tax avoidance by foreign
investors. Their study focuses on non-resident controlled companies (NRCCs) to investigate
the tax differentials that arise from the different tax rates imposed upon business profits and
interest earned by non-residents. Smith and Dunmore (1997) also study the thin capitalisation
arrangements of New Zealand subsidiaries owned by non-resident investors from 1983 to 1992.
Until 1996, there were few tax provisions that could possibly address thin capitalisation
arrangements by NRCCs (Smith & Dunmore, 1997). Non-resident investors could finance their
New Zealand subsidiaries with debt and subsequently the interest paid on that debt to those
investors would be taxed at lower rates than on their business profits sourced in New Zealand
(Smith & Dunmore, 1997).
Additionally, in the study of Smith and Dunmore (1997) a sample of New Zealand resident
controlled companies (RCCs) was also collected in order to compare the financial structures
between NRCCs and RCCs. However, they found that higher debt to equity ratios of NRCCs,
as compared to RCCs, did not necessarily indicate that NRCCs thinly capitalised their
companies to avoid tax, as the debt used to finance the companies was non-interest bearing.
Li and Tran (2020) examine international profit shifting in Australia by focusing on DOLACs
and Australian subsidiaries of foreign MNEs (ASFMs) that operated under Australia’s full
61
dividend franking system. Under the dividend imputation system, Australian resident
shareholders of DOLACs receive and use franking credits attached to dividends distributed in
order to offset their personal tax to the extent that it is less than zero. The franking credits
generate additional value to shareholders as the excess credits are fully refundable to
shareholders, thus enhancing the shareholders’ after-tax returns. In contrast to DOLACs,
ASFMs do not benefit from the franking system in Australia as only Australian shareholders
are permitted to claim the franking credits. Therefore, DOLACs serve as a benchmark against
ASFMs to investigate profit shifting in Australia as both DOLACs and ASFMs face different
incentives for engaging in tax avoidance activities.
Li and Tran (2020) proposed six ratios capturing the effectiveness of thin capitalisation and
transfer pricing in both DOLACs and ASFMs to compare their cross-border profit shifting. The
empirical results reveal that ASFMs engage in tax avoidance to a greater extent than DOLCs
in order to shift profits out of Australia by utilising intra-group debts and transfer pricing.
2.3.1.3 Meta-analysis
Glass (1976) refers to meta-analysis as “a statistical analysis of a large collection of analysis
results from individual studies for the purpose of integrating the findings” or it can be more
concisely defined as “the analysis of analyses” (p. 3).
In general, meta-analysis is a statistical tool used to make a general statement by inference
from many existing studies. It compares different methodologies, data, and specifications, and
synthesises the results quantitatively for easier comparison. Meta-analysis indicates the central
tendency and can explain the diverseness in empirical literature. In other words, the research
results obtained from a meta-analysis represents a consensus synthesis of a large body of
empirical studies (Florax, de Goot, & de Mooij, 2002).
62
Meta-analysis has been applied in various fields such as education, psychology, and medical
research. In econometric analyses, meta-analysis has become an important statistical method
employed in diverse fields within economics. De Mooij and Ederveen (2008), Feld,
Heckemeyer and Overesch (2013), Heckemeyer and Overesch (2013), and Adam, Kammas
and Lagou (2013) all use this statistical approach in analysing tax-related empirical literature.
De Mooij and Ederveen (2008) provide a guide to the empirical results of the corporate tax
elasticity of FDI using meta-analysis. In the study of Feld et al. (2013), meta-analysis was
employed to explain how capital structures are impacted on by a variety of marginal tax effects.
Heckemeyer and Overesch (2013) conducted a meta-analysis of the empirical literature that
studies the profit-shifting activity of multinational firms.
A strand of the literature investigates the profit-shifting activity of multinational companies,
and the evidence available is either direct or indirect evidence. The central area of interest in
the research of Heckemeyer and Overesch (2013) is the estimate of the size of the tax elasticity
of parent or affiliate profit. For a meta-regression analysis to be significant, the estimates of
the quantitative surveys must be comparable (Heckemeyer & Overesch, 2013). Thus, the 25
studies included in their meta-sample measure the tax-motivated profit shifting of multinational
firms using semi-elasticity of profits.
Heckemeyer and Overesch (2013) provide a consensus estimate of the tax elasticity of profits
from the 25 empirical studies. By taking into consideration all the evidence and the biases from
misspecification, they find that the consensus tax semi-elasticity of a company pre-tax profit is
0.8. This simply means that a 1 percent point increase in the tax differential of one country will
result in 0.8 percent decrease in reported pre-tax profit of the parent or the affiliates.
Following the meta-analysis that surveys the impact of taxation on FDI, de Mooij and Ederveen
(2008) extend their research by investigating the scale of the distortions of corporate taxes at

63
five different decision margins (organisational form, financial policy, profit shifting, intensive
and extensive investment). The results suggest that tax-base elasticity of profit shifting is the
largest among them all.
2.3.1.4 Revenue Loss Estimates
While the existing studies generally use tax semi-elasticity of profits to describe the severity
of BEPS, a recent study by International Monetary Fund (IMF) researchers Crivelli, de Mooij
and Keen (2015) defines the problem of BEPS in terms of an absolute amount of revenue losses.
This study is the most complete study of the global tax losses of 173 countries over 33 years.
Nonetheless, the statistics for the corporate income tax revenues and statutory tax rates used in
the study of Crivelli et al. (2015) are private data provided in confidence sourced from the
IMF’s Fiscal Affairs Department. They observe that the total revenue losses across the globe
are estimated to be USD 650 billion annually from BEPS related activity.
On the other hand, Clausing (2016) wanted to determine how much the profit shifting activities
of US-headquartered multinationals costs the US government. She estimates that the corporate
revenue losses ranged between USD 77 billion and USD 111 billion by 2012. Clausing’s (2016)
study uses survey data of US multinationals from the BEA, and it focuses on one major
economy (the US).44
While Crivelli et al. (2015) present the estimates of tax losses for two groups of countries,
OECD and non-OECD countries, Cobham and Janský (2017) disaggregate the revenue losses
and present the results at country level. This allows a comparative analysis at both the global
and regional level. More specifically, New Zealand suffered a revenue loss of USD 760 million
according to IMF estimates, as reported by Crivelli et al. (2015), or USD 520 million losses in
government revenue database (GRD) as estimated by Cobham and Janský (2017).
44 The US BEA data is strictly confidential and made available to US researchers on a confidential basis.
64
2.3.1.5 Foreign Direct Investment as Indirect Measure of BEPS
FDI includes investments among affiliates across countries. BEPS not only affects tax-related
variables, but also non-tax variables such as GDP and FDI. Analyses of FDI can provide
indirect evidence of BEPS-related activities. An unjustifiably high concentration of FDI
relative to GDP of a country can be attributed to the BEPS arrangements of MNEs. The FDI
data needed for analysis can be sourced from OECD FDI statistics, the IMF CDIS, the United
Nations Conference on Trade and Development (UNCTAD), the World Bank, and the World
Trade Organization (WTO).
In terms of Action 11 of the BEPS Action Plan, FDI data has been used as an indirect indicator
of BEPS. In addition to this, Janský and Palanský (2019), Acciari et al. (2015), and Bolwijn,
Casella, and Rigo (2018) all analyse the BEPS phenomena that are likely to be captured by FDI
data. However, key limitations must be kept in mind when interpreting the results of BEPS
estimation using FDI. One of the shortcomings using macroeconomic aggregates, such as FDI,
in studying BEPS behaviours of MNEs is the need to disentangle real economic effects and tax
effects associated with BEPS arrangements. For example, the real investment (greenfield and
expansion investment) is difficult to distinguish from financial transactions (mergers and
acquisitions), which are likely to be related to BEPS (OECD, 2015d).
A high level of FDI could be an indication of ideal economic and financial conditions for
investment (OECD, 2015d). Despite numerous limitations serving as a user warning, FDI has
been one of the six BEPS indicators in the OCED’s BEPS Action 11 final report. UNCTAD’s
(2015) World Investment Report has been greatly influential in later studies, which investigate
the scale of profit shifting using an FDI-driven approach. UNCTAD’s seminal work is used as
a baseline model in the study of Janský and Palanský (2019).

65
2.3.2 Major BEPS Channels
The rapidly evolving nature of BEPS is of great concern to tax authorities and tax policy makers
throughout the world. Lawmakers must keep up with rapid changes in the BEPS landscape for
optimal design of tax avoidance laws. The identification of the prominent shifting channels
used by multinational firms in cross-border income shifting is important in setting effective
international tax rules (Heckemeyer & Overesch, 2013).
2.3.2.1 Debt Shifting
The tax-deductibility of interest is the prominent determinant of using debt instead of equity as
a source of financing for companies (Merlo & Wamser, 2014). However, problems may arise
when companies start to make extensive use of the debt tax shield, not only for tax minimisation
but also for profit shifting purposes. It has been highlighted in Action 4 of the OECD’s BEPS
Action Plan that “the use of third party and related party interest is perhaps one of the most
simple of the profit shifting techniques available in international tax planning” (OECD, 2015a,
p. 15).
Ting (2017) found that intra-group debt is a common tax avoidance tool used by MNEs.
Related party loans are popular for the following reasons. MNEs have the flexibility to
determine the amount of the loans, as well as the interest rate, and the accounting standards
generally do not recognise the loans of a related party (Ting, 2017).
MNEs operating across borders benefit more from international debt shifting than domestic
companies do. The variation of tax rates between an affiliate and the parent company, as well
as among other foreign affiliates, determines the international debt shifting of MNEs (Huizinga
& Laeven, 2008). MNEs can optimise the level of indebtedness of affiliates that face higher
tax rates so that more interest expenses are deductible from taxable income in high tax countries.

66
Egger, Eggert, Keuschnigg, and Winner (2010), who study debt shifting using internal debt,
find that MNEs have higher debt relative to assets especially in high-tax jurisdictions.
While thin capitalisation rules are commonly used in limiting disproportionate deductions of
interest of high-leveraged companies, these rules were found to be ineffective in limiting BEPS
using intra-group debt in Australia (Ting, 2017). The debt to asset ratio in the thin-capitalisation
rules fail to recognise the amount of real interest expenses of the loans (Ting, 2017).
Merlo and Wamser (2014) outline three basic methods in tackling BEPS involving interest.
They point out that the arm’s length principle, earning stripping rules (ESR) and fixed debt-to-
equity rules can restrain the use of debt funding to gain interest deductions for profit shifting.
2.3.2.2 Transfer Pricing
Traditionally, a transfer price has been viewed as the price charged on tangible goods and
services. However, transfer prices may take in nearly everything, including intellectual
property, royalties, interest payments, expenses, fees, leasing, management charges and
advisory services to minimise tax expenses for shareholder value maximisation (Sikka &
Willmott, 2010). It comes as no surprise that three actions of the revised OECD (2015e)’s
Transfer Pricing Guidelines cover three related areas so that the transfer pricing outcomes are
in line with value creation. The three actions include Action 8, which targets transactions
relating to intangibles, Action 9 concerning risk and capital, and Action 10 focusing on other
high-risk transactions. The major revisions for Action 8 to 10 in the 2015 BEPS reports are
incorporated in the latest OECD (2017)’s Transfer Pricing Guidelines, together with the revised
guidelines on safe harbours and a few consistency changes.
Intra-group trade is easy for MNEs to manipulate in order to facilitate profit shifting.
Unsurprisingly, almost all multinational companies use transfer pricing as a tool to shift profit
to different geographical jurisdictions (Baker, 2005). Heckemeyer and Overesch (2013) find

67
that transfer pricing and licensing is a more prominent profit shifting channel than inter-
company debt. Sikka and Willmott (2010) investigate the use of transfer pricing by companies
in developed and emerging economies, and find that the transfer pricing practices may increase
the loss of tax revenues.
2.3.2.3 Mismatches between Tax Regimes and Preferential Tax Treatment
In economics, “arbitrage” is a way to take advantage of the variation of prices in different
markets. Likewise, the divergence and dissimilarity between tax systems make “tax arbitrage”
possible.45 Hybrid mismatch arrangements predominantly exploit the differences between tax
laws across countries in order to achieve mismatches of tax outcomes. The final report of
Action 2 of the BEPS Action Plan aims at addressing tax arbitrage arising from mismatches of
hybrid elements to achieve Deduction/No Inclusion (D/NI), Double Deduction (DD) or Indirect
Deduction/No Inclusion (Indirect D/NI). Kuzniacki et al. (2017) note that the final report on
Action 2 is the lengthiest (at 458 pages) and the most comprehensive of all the 15 actions of
the BEPS package. It indicates that hybrid mismatches might be the most complex and difficult
BEPS issues to deal with. Without doubt, the coordination and implementation of the hybrid
mismatch rules in different taxing jurisdictions has required great effort and exertion of all
involved parties.
2.4 Development of Hypotheses
The formulation of hypotheses is an important part in any empirical research as it helps to
further elucidate the research questions and keep researchers on the right track towards
achieving the primary goal of their research (Mourougan & Sethuraman, 2017). A good
45 There is no general agreement as to whether “tax arbitrage” is a form of tax optimisation or tax avoidance. In
the study of Kuzniacki et al. (2017), the term “tax arbitrage” represents a sub-concept of tax avoidance that
emerges from hybrid mismatch arrangements.

68
research question is a prerequisite of a good hypothesis which is testable and falsifiable.
Researchers work towards falsification, but not the verification, of the initial hypothesis
(Mourougan & Sethuraman, 2017).
Fundamentally, the first step in a statistical hypothesis testing process involves establishing a
null hypothesis. A null hypothesis or H0 (H-naught) is a statement stating that there is no
difference or relationship between variables. An alternative hypothesis (H1 or HA) can be
formulated once the null hypothesis has been constructed (Mourougan & Sethuraman, 2017).
The alternative hypothesis is a statement set out in the opposite way to the null hypothesis that
the researcher is seeking to prove.
Sample data is used to evaluate the null hypothesis.46 However, one cannot prove a null
hypothesis to be true, only prove it to be false (Huck, 2009). That is why the statement of
“accepting the null hypothesis” might not be appropriate as it suggests that the null hypothesis
is true. Instead, the null hypothesis is either “rejected” or “failed to be rejected”. The statistical
inference indicates that if the null hypothesis is rejected, then the alternative hypothesis will be
accepted (Stang & Poole, 2013).
The international tax differences provide opportunity and incentives for multinationals to
redistribute their paper profits internationally so as to reduce their worldwide corporate tax
liability. One strand of empirical literature regresses some measures of profitability of a
multinational parent or a subsidiary on the tax incentive of profit shifting behaviour
(Heckemeyer & Overesch, 2013). The earlier study of Hines and Rice (1994) employs after-
financing profit and EBIT as dependent variables to investigate the relationship between the
profitability of US affiliates and foreign tax burdens. Several more recent studies such as
46 The Popperian Principle of Falsification illustrates the reason why the null hypothesis is set up and why the
working hypothesis (alternative hypothesis) is not tested directly. A hypothesis cannot be confirmed but it can be
invalidated or nullified. The data will help us to determine if we refute the null hypothesis in favour of the
alternative hypothesis. Retrieved from https://online.stat.psu.edu/stat502/lesson/1/1.2
69
Huizinga and Laeven (2008), Dischinger (2007, 2010), Karkinsky and Riedel (2012),
Dharmapala and Riedel (2013), and Heckemeyer and Overesch (2013), all dealing with
multinational income shifting in a non-US context, have exploited European data derived from
the commercial database Amadeus to examine the relationship between the changes in the tax
rate differentials and the reported profit of the affiliates of multinationals.
Dischinger (2007) investigates the relationship between the reported profit of affiliates and the
tax rate changes of affiliates relative to their foreign parent firms using micro data from
affiliated companies located in Europe. Huizinga and Laeven (2008) analyse the international
profit shifting of European multinationals due to tax differences between parent companies and
subsidiaries, as well as tax differences among subsidiaries in different host countries. On the
whole, empirical evidence shows that multinational firms follow the usual pattern of BEPS by
reporting lower profits in high-tax locations (Hines, 2014). The statistical studies consistently
suggest that tax-rate differences have an important effect on multinational firms in arranging
their tax affairs (Hines, 2014).
This study takes a similar approach to empirically estimate the income shifting between parent
companies and their subsidiaries. To be more precise, this study measures the scale of profit
shifting activity of two sub-groups:
i. New Zealand subsidiaries and their overseas parents, and
ii. New Zealand enterprises owned by a resident taxpayer with affiliates in other
jurisdictions.
The variance in the statutory tax rates of parents and subsidiaries plays a significant role in
determining the level of international income shifting (Dischinger et al., 2013). This study
seeks to test for shifting activities by determining a relationship between the changes of
corporate tax rate and the reported profit of these two sub-groups.

70
The hypotheses are stated as follows:
H01: Corporate tax rate differential is not significantly associated with the pre-tax
profitability of NZSOFMs.
HA1: Corporate tax rate differential is significantly associated with the pre-tax
profitability of NZSOFMs.
H02: Corporate tax rate differential is not significantly associated with the pre-tax
profitability of NZDOMs.
HA2: Corporate tax rate differential is significantly associated with the pre-tax
profitability of NZDOMs.
In regard to debt shifting, New Zealand domestically owned companies (NZDOCs)47 are
benchmarked to NZSOFMs to investigate if there is any systematic difference between these
two groups of companies in eight specific ratios in term of debt structure, distribution of
operating income and transfer pricing.
H03: The ratios Interest-bearing debt/Total assets, Total debt/Total assets, Short-term
debt/Total assets, and Long-term debt/Total assets do not differ between NZSOFMs
and NZDOCs.
HA3: The ratios Interest-bearing debt/Total assets, Total debt/Total assets, Short-term
debt/Total assets, Long-term debt/Total assets for NZSOFMs are higher than for
NZDOCs.
H04: The ratios Interest expense/EBIT, Income tax expense/EBIT, Net profit/EBIT do
not differ between NZSOFMs and NZDOCs.
47 NZDOCs vary from NZDOMs, and they could be stand-alone New Zealand resident companies without any
(local or foreign) subsidiaries, or with merely domestic subsidiaries, or with at least one wholly owned foreign
subsidiary.

71
HA4: The ratio Interest expense/EBIT for NZSOFMs is higher than for NZDOCs, but
the ratios Income tax expense/EBIT and Net profit/EBIT for NZSOFMs are lower than
for NZDOCs.
H05: The ratio EBIT/Sales do not differ between NZSOFMs and NZDOCs.
HA5: The ratio EBIT/Sales for NZSOFMs is lower than for NZDOCs.
2.5 Conclusion
A review of prior scholarly works related to tax avoidance and BEPS provide a great insight
into the methods that were used in the academic studies in measuring the magnitude of BEPS.
This helps the researcher to form a specific, and testable research hypothesis. In addition, the
review of literature is particularly important in identifying theories pertinent to the topic being
studied, and lays a fundamental groundwork that will help the researcher to devise the most
appropriate analytic model that can be used to measure BEPS, specifically in the New Zealand
context. The hypotheses formed in this chapter will be tested using a statistical estimation
model, as presented in Chapter 4.

72
Chapter 3 Research Methodology and Estimation Approach
3.1 Introduction
In this chapter, the research methodology, which is an extension of the literature review in
Chapter 2, is used to explain what and why the methodological choices were taken for
conducting the research. The methodological approach to the research, data collection methods,
and methods of analysis are important to ensure the validity and reliability of the research.
The philosophical paradigms, which guide the researcher in developing research methodology
are discussed in Section 3.2. The estimation models, which are used to identify statistical
evidence from the data collected, is presented in Section 3.3. The methodological approach that
outlines the techniques used to collect and evaluate the datasets of the research is defined in
Section 3.4. Finally, Section 3.5 provides a summary of the chapter.
3.2 Research Paradigms
A research paradigm refers to a set of beliefs and assumptions held by a researcher about
ontology, epistemology and methodology. The credibility and generalisability of a study relies
on the right application of paradigm by a researcher in their specific field of study.
Before probing into the philosophical paradigm to be adopted, this study seeks to contribute to
the body of knowledge of international taxation by accomplishing the following goal:
• to quantify the magnitude of international profit shifting activities of MNEs that have
business operations in New Zealand.
In this context, the underlying theory that guides the study is “positivism”. This approach will
be discussed in the next section.

73
3.2.1 Positivism
Traditionally, positivism and interpretivism are two fundamental philosophical paradigms
guiding researchers through the research design (McKerchar, 2008). Positivists perceive that
the nature of reality is objective, single and tangible (Hudson & Ozanne, 1988). Positivist
researchers will always remain detached from their research subjects so that they can conduct
the research rationally and logically. On the other hand, interpretivists believe that reality exists
in a multiple, contextual structure, and the researchers and participants in the research are
mutually dependent and interactive (Hudson & Ozanne, 1988). Therefore, they always use a
more flexible, personal approach to the research. Positivists interpret “real reality” based on
empirical evidence, whereas interpretivists observe reality based on the perception of the
individual researcher (McKerchar, 2010, p. 75).
Positivism and interpretivism are on opposite ends of a continuum, while critical realism and
pragmatism are two other philosophical approaches that lie in the middle of the continuum
(McKerchar, 2010). Interpretivism, critical realism, pragmatism and other present-day
paradigms have been classified as rejecting positivism. Undeniably, positivism is one of the
most prominent theoretical underpinnings and it is still a common research approach (Hunter
& Leahey, 2008). However, unfavourable opinions of positivist epistemologies have often
shifted the epistemic beliefs of researchers from positivism towards post positivism. Post-
positivism is neither an extension of positivism nor a rejection of it (Adam, 2014). Post-
positivism is an improved version of positivism that moves away from a purely empirically-
based stance towards the subjectivity of reality (Adam, 2014).
A quantitative positivistic researcher relies on sophisticated analytical tools and statistical
models to obtain empirical results that are generalisable to the wider population. Positivists
endeavour to be neutral and completely objective and who believe in the importance of

74
empirical evidence to obtain explanations and create knowledge about reality. The present
study, conducted under positivism, engages a quantitative methodological approach, where a
hypothesis is tested while the researcher remains detached from the topic of the study.
3.3 Estimating Equations
BEPS, by nature, is complicated and difficult to identify in a direct way. Only a few studies
provide direct evidence of profit shifting strategies because of the limited availability of data
on intra-company transfer prices (Dischinger, 2010). Given that intra-company data is
inaccessible, the present study hopes to provide indirect numerical evidence of the BEPS
problems by engaging with publicly available company financial data.
First, the present study seeks to examine the existence and extent of profit shifting between
NZSOFMs and their immediate parents located in other countries, as well as between
NZDOMs and their subsidiaries established outside New Zealand. The estimation model
involves assessing the semi-elasticities in regard to the effect of corporate tax rate differences
on profit. Multinational firms that have international operations typically respond to changes
in the corporate tax rate differential between the host and home country, especially a reduction
of the corporate tax rate in the host country, by strategically shifting their profits between
jurisdictions.48
The tax semi-elasticity measure is the most prevalent estimation method to date to investigate
profit differences connected with profit shifting activities (Hansson, Olofsdotter, & Thede,
2016). However, the present study acknowledges that this measure, which evaluates the
48 Changes in the corporate tax rate differential could arise from either an increase or a decrease in the corporate
tax rate in the home country or host country.
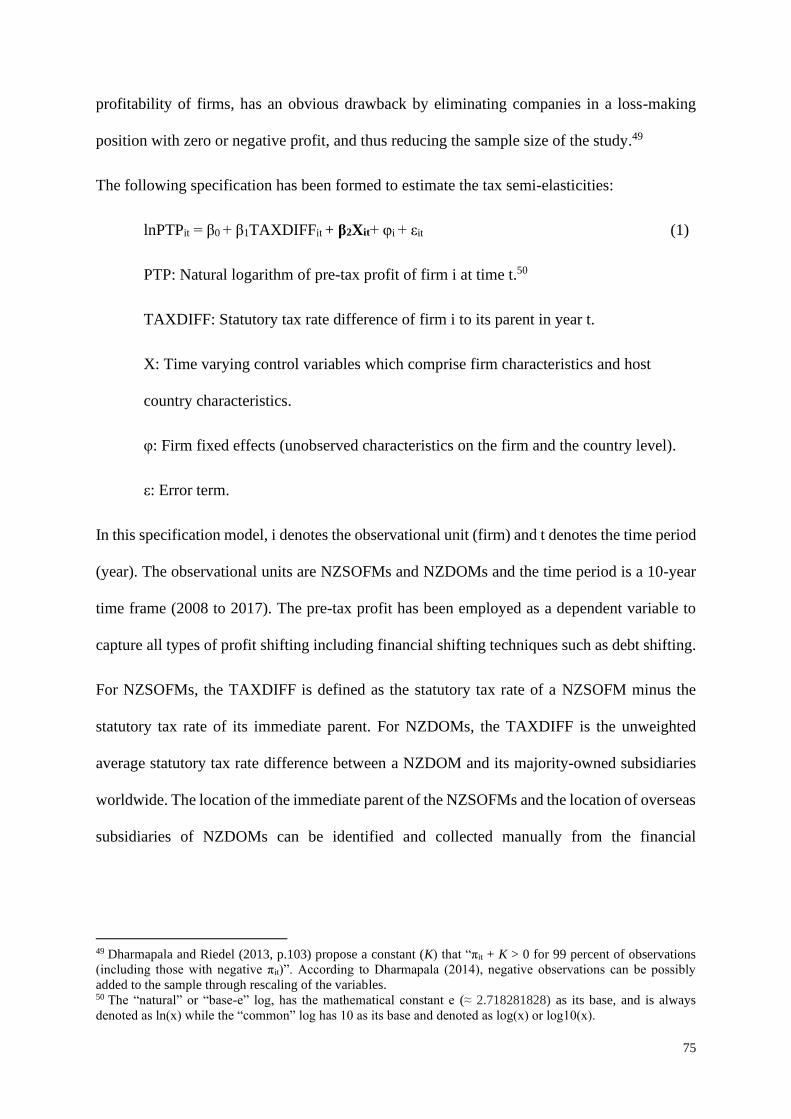
75
profitability of firms, has an obvious drawback by eliminating companies in a loss-making
position with zero or negative profit, and thus reducing the sample size of the study.49
The following specification has been formed to estimate the tax semi-elasticities:
lnPTPit = β0 + β1TAXDIFFit + β2Xit+ φi + εit (1)
PTP: Natural logarithm of pre-tax profit of firm i at time t.50
TAXDIFF: Statutory tax rate difference of firm i to its parent in year t.
X: Time varying control variables which comprise firm characteristics and host
country characteristics.
φ: Firm fixed effects (unobserved characteristics on the firm and the country level).
ε: Error term.
In this specification model, i denotes the observational unit (firm) and t denotes the time period
(year). The observational units are NZSOFMs and NZDOMs and the time period is a 10-year
time frame (2008 to 2017). The pre-tax profit has been employed as a dependent variable to
capture all types of profit shifting including financial shifting techniques such as debt shifting.
For NZSOFMs, the TAXDIFF is defined as the statutory tax rate of a NZSOFM minus the
statutory tax rate of its immediate parent. For NZDOMs, the TAXDIFF is the unweighted
average statutory tax rate difference between a NZDOM and its majority-owned subsidiaries
worldwide. The location of the immediate parent of the NZSOFMs and the location of overseas
subsidiaries of NZDOMs can be identified and collected manually from the financial
49 Dharmapala and Riedel (2013, p.103) propose a constant (K) that “πit + K > 0 for 99 percent of observations
(including those with negative πit)”. According to Dharmapala (2014), negative observations can be possibly
added to the sample through rescaling of the variables. 50 The “natural” or “base-e” log, has the mathematical constant e (≈ 2.718281828) as its base, and is always
denoted as ln(x) while the “common” log has 10 as its base and denoted as log(x) or log10(x).

76
statements. The statutory tax rate of the location is important information to be used to calculate
the tax differential.
The controls at the firm level are the (tangible) fixed assets (as a proxy for the capital input),
the cost of employees (as a proxy for the labour input) and the leverage ratio of a company. At
the country level, the controls include GDP (as a proxy for market size) and the CPI (as a proxy
for the overall risk of a country). The double-log (sometimes called log-log) functional form is
used to interpret the relationship between pre-tax profit and firm-level and country level
variables, in which the regressand and regressors are expressed in terms of their natural logs.
The elasticity of pre-tax profit with regards to micro or macro variable estimates the percentage
change in pre-tax profit to a one percentage change in the macro or micro variable, holding the
other variables in the equation constant.51
The firm fixed effects are included in this study as it is crucial to mitigate the endogeneity
problem of unobservable firm-specific characteristics in explaining variations in profit
(Dischinger, 2010). Nonetheless, micro-level data outweighs macro-level data in identifying
profit shifting behaviours of companies as the variables identified at the micro-level are
unlikely to cause endogeneity problems in the estimation model (Fuest & Riedel, 2010). The
panel data collected for the year 2008 to 2017 is analysed using an ordinary least squares (OLS)
firm fixed effects model. The country and industry dummy variables are not applied to fixed
effect regressions as these variables do not change over time (Dishinger, 2010).
In the presence of profit shifting driven by tax, the correlation between tax level and reported
profit would expect to be negative (Fuest & Riedel, 2010). However, this study notes that a
negative relationship between tax levels and reported profit can be observed even in the
absence of tax-induced profit shifting as highly profitable projects are appealing to low tax
51 Elasticity measures the relative percentage changes between Y and X while semi-elasticity depicts the
percentage change in X with respect to an absolute change in Y.

77
jurisdictions (Fuest & Riedel, 2010). Table 3.1 summarises the variables used to construct the
regression model and the source of information for each variable.

78
Table 3.1
Variables-construction and Data Sources for Profit Shifting
Variables Abbreviation Definition Source of Information
Dependent Variable
Pre-tax Profit PTP Amount of profit before tax of NZSOFMs or NZDOMs in natural logarithm Company annual report for financial year ending from 2008 to 2017
Independent Variables
Tax Differential 1 TAXDIFF1 Corporate statutory tax rate of a NZSOFM – Corporate statutory tax rate of its
immediate parent
Different sources: The corporate statutory tax rate for OECD countries sourced
from OECD, “Table II.1. Statutory corporate income tax rate”; The corporate
statutory tax rate for non-OECD countries is obtained from Trading Economics,
KPMG’s tax rates table, PwC and researched online.
Tax Differential 2 TAXDIFF2 The average corporate statutory tax rate of NZDOM's foreign subsidiaries –
Corporate statutory tax rate of a NZDOM
Different sources: The corporate statutory tax rate for OECD countries sourced
from OECD, “Table II.1. Statutory corporate income tax rate”; The corporate
statutory tax rate for non-OECD countries is obtained from Trading Economics,
KPMG’s tax rates table, PwC and researched online.
Control Variables
Firm level:
Fixed assets FA Amount of tangible fixed assets in natural logarithm Company annual financial statements for financial year ending from 2008 to 2017
Cost of employees EMPLYCOST Amount of employee compensation expenses in natural logarithm Company annual financial statements for financial year ending from 2008 to 2017
Financial leverage ratio LEV The ratio of total liabilities to total assets in natural logarithm Company annual financial statements for financial year ending from 2008 to 2017
Country level:
Gross Domestic Product GDP GDP (current price, national currency) in natural logarithm IMF world economic outlook database 2008–2017
Corruption Perceptions Index CPI The value ranges from 0 (the most corrupt country) to 10 (the least corrupt country)
in natural logarithm
Transparency International's CPI 2008–2017

79
Apart from profit-shifting, this study seeks to investigate BEPS issues by considering the debt-
shifting strategies of NZSOFMs relative to comparable NZDOCs. Multinational companies are
exposed to diverse tax systems in all jurisdictions where they operate while domestic
companies operate solely in one jurisdiction and need only respond to that domestic tax system.
Arguably, multinational companies are tempted to shift high proportions of debt to jurisdictions
with a high tax rate or where they are biased in favour of foreign investors and debt financing.
In order to determine if NZSOFMs tend to be financed with more debt in comparison to
NZDOCs, the study examines the following indicators.
Financial leverage refers to the portion of debt capital in the company’s capital structure. The
commonly used debt ratio (calculated as “total debt/total assets”) demonstrates the level of debt
a company uses to acquire the assets. However, various non-interest bearing accruals and
provisions are included in the total liabilities a company has. A high percentage of debt does
not lead to profit shifting unless the debt is charged with interest (Smith & Dunmore, 1997).
Thus, this study looks specifically into interest-bearing debt relative to the total assets of a
company. In addition to that, the ratios of short-term debt relative to total assets, and long-term
debt relative to total assets are also included to investigate the debt structure of a company.
Interest-bearing debt ratio =Interest-bearing debt
Total assets
Leverage 1 =Total debt
Total assets
Leverage 2 =Short-term debt
Total assets
Leverage 3 =Long-term debt
Total assets

80
The value of debt and assets used to calculate these ratios is derived from the companies’
financial statements.52 New Zealand equivalents to international accounting standard 1 (NZ
IAS 1) Presentation of Financial Statements, which incorporates the equivalent IFRS standard,
sets out the basis on how to present the general purpose financial statements of an entity (New
Zealand Accounting Standards Board, 2011a). The item “financial liabilities” is presented in
the Statement of Financial Position (IAS 1.54) under item (m). The “financial liabilities”
exclude amounts shown under Item (k) trade and other payables and Item (l) provisions. The
“financial liabilities” are also required to be disclosed under IFRS 7.8 of IFRS 7 – Financial
Instruments: Disclosures. The “interest-bearing loans and borrowings” is listed under
“financial liabilities” (New Zealand Accounting Standards Board, 2011b).
EBIT is made up of three components: interest expense, income tax expense and net profit. If
NZSOFMs rely heavily on debt financing to avoid tax, they are expected to have a greater
proportion of interest expense, lower income tax expense and lower net profits than NZDOCs.
The last indicator intends to capture transfer pricing within the company group by looking at
the EBIT ratio. EBIT demonstrates that tax effects arising from non-financing channels such
as transfer pricing, without considering the interest income and interest paid from company
debt (Heckemeyer & Overesch, 2013). This indicator only investigates NZSOFMs and
52 New Zealand’s thin capitalisation rules rely on the value disclosed in the financial statements to calculate the
“debt-to-net-asset ratio”. This study does the same by obtaining the values from the company financial statements.
Interest expense ratio =|Interest expense|
|Interest expense|+|Income tax expense|+|Net profit|
Income tax expense ratio =|Income tax expense|
|Interest expense|+|Income tax expense|+|Net profit|
Net profit ratio =|Net profit|
|Interest expense|+|Income tax expense|+|Net profit|

81
NZDOCs with affiliates in other jurisdictions, as NZDOCs without overseas affiliates are
unlikely to use transfer pricing to avoid tax.
Following this, each of the ratios is regressed on a dummy variable which takes the value of
“one” if it is a company with foreign ownership and “zero” otherwise, controlling for firm size
and industry.53 The sales income is employed as a proxy for firm size and the descriptions of
business industry are displayed in Table 3.3. The sample year is year 2015 when the OECD
released the BEPS 2015 Final Report. The regression models are estimated using OLS.
53 Firm size and industry affiliation are influential factors of capital structure and also foreign ownership (Li &
Tran, 2020).
EBIT ratio =EBIT
Sales
Interest-bearing debt ratioi = β0 + β1FOREIGNi + β2SIZEi + β3-15INDUSTRYi + εi (2)
Leverage 1i = β0 + β1FOREIGNi + β2SIZEi + β3-17INDUSTRYi + εi (3)
Leverage 2i = β0 + β1FOREIGNi + β2SIZEi + β3-17INDUSTRYi + εi (4)
Leverage 3i = β0 + β1FOREIGNi + β2SIZEi + β3-17INDUSTRYi + εi (5)
Interest expense ratioi = β0 + β1FOREIGNi + β2SIZEi + β3-15INDUSTRYi + εi (6)
Income tax expense ratioi = β0 + β1FOREIGNi + β2SIZEi + β3-15INDUSTRYi + εi (7)
Net profit ratioi = β0 + β1FOREIGNi + β2SIZEi + β3-15INDUSTRYi + εi (8)
EBIT ratioi = β0 + β1FOREIGNi + β2SIZEi + β3-15INDUSTRYi + εi (9)
FOREIGN: A New Zealand company with foreign ownership takes value of 1, and 0 otherwise.
SIZE: Natural logarithm of sales income.
INDUSTRY: Business Industry Classification (BIC) code.
εi: Error term.

82
Table 3.2
Variables-construction and Data Sources for Debt shifting
Variables Abbreviation Definition Source of Information
Dependent Variables
Indicators related to debt structure
Interest-bearing debt ratio Interest-bearing debt/Total assets Company annual report for financial year ending 2015
Leverage 1 Total debt/Total assets Company annual report for financial year ending 2015
Leverage 2 Short-term debt/Total assets Company annual report for financial year ending 2015
Leverage 3 long-term debt/Total assets Company annual report for financial year ending 2015
Indicators related to distribution of operating income
|Interest expense|
|Interest expense|+|Income tax expense|+|Net profit|
|Income tax expense|
|Interest expense|+|Income tax expense|+|Net profit|
|Net profit|
|Interest expense|+|Income tax expense|+|Net profit|
An indicator related to transfer pricing
EBIT ratio EBIT/Sales Company annual report for financial year ending 2015
Independent Variables
Foreign ownership FOREIGN A New Zealand company with foreign ownership takes value of 1,
and 0 otherwise
Company annual report for financial year ending 2015
Size SIZE Sales income in natural logarithm Company annual report for financial year ending 2015
Industry IND Business industry classification code The website of business industry classification code
Company annual report for financial year ending 2015
Company annual report for financial year ending 2015
Company annual report for financial year ending 2015
Net profit ratio
Income tax expense ratio
Interest expense ratio

83
The industry classification is not readily available for every single company on the website of the
New Zealand Companies Office. The business industry classification (BIC) code is assigned to
each sample company manually according to the business activities described in the company’s
latest financial statements. For companies involved in multiple business activities, the industry
classification is coded according to the predominant activities.
The BIC code is divided into 19 broad industry divisions (Accident Compensation Corporation
[ACC], IRD & Statistics New Zealand, n.d.).54 However, the principal business activities of the
sample companies in this study involved only 15 industries as shown in Table 3.3.
Table 3.3
Descriptions of New Zealand Business Industry
54 The 6-digits BIC code can be converted into the Australian and New Zealand standard industrial classification
(ANZSIC) to be used by Statistics New Zealand for industry analyses.
Group Industry
1 Manufacturing
2 Electricity, Gas, Water and Waste Services
3 Construction
4 Wholesale Trade
5 Retail Trade
6 Accommodations and Food Services
7 Transport, Postal and Warehousing
8 Information Media and Telecommunication
9 Agriculture, Forestry and Fishing
10 Rental, Hiring and Real Estates Services
11 Professional, Scientific and Technical Services
12 Administrative and Support Services
13 Health Care and Social Assistance
14 Arts and Recreation Services
15 Other Services

84
3.4 Sample Selection
There are three commonly used research methods, namely qualitative research, quantitative
research, and mixed method research. In general, qualitative research is exploratory research,
which uses a top-down approach to collect qualitative data, while quantitative research uses a
bottom-up approach to collect measurable data that can be converted into statistics. In this study,
quantitative research has been engaged to measure the magnitude of BEPS in New Zealand using
numerical data.
3.4.1 Sampling in Quantitative Research
Purposive sampling techniques is used in this study to identify a specific group of business entities
of interest that fulfil objectives of the study. In general, the hypotheses of this study can be
categorised as follows: (i) H1 and H2 and (ii) H3 to H5. A different group of sample companies in
different sample years, and two distinctly different estimation methods are employed in this study
to test the hypotheses. The following sections will discuss the various aspects of sampling
according to these two groups of hypotheses.
3.4.1.1 Sample Companies and Sample Years for H1 and H2
The forms of an entity will determine the tax obligations of a business. Table 3.4 presents the
business entities in New Zealand and the types of tax rate that are applicable to each entity.55
55 The statistics on the number of business entities and taxable income are in 2018 figures. The report was prepared
especially for sessions 6 and 7 of the Tax Working Group meeting in 2018.
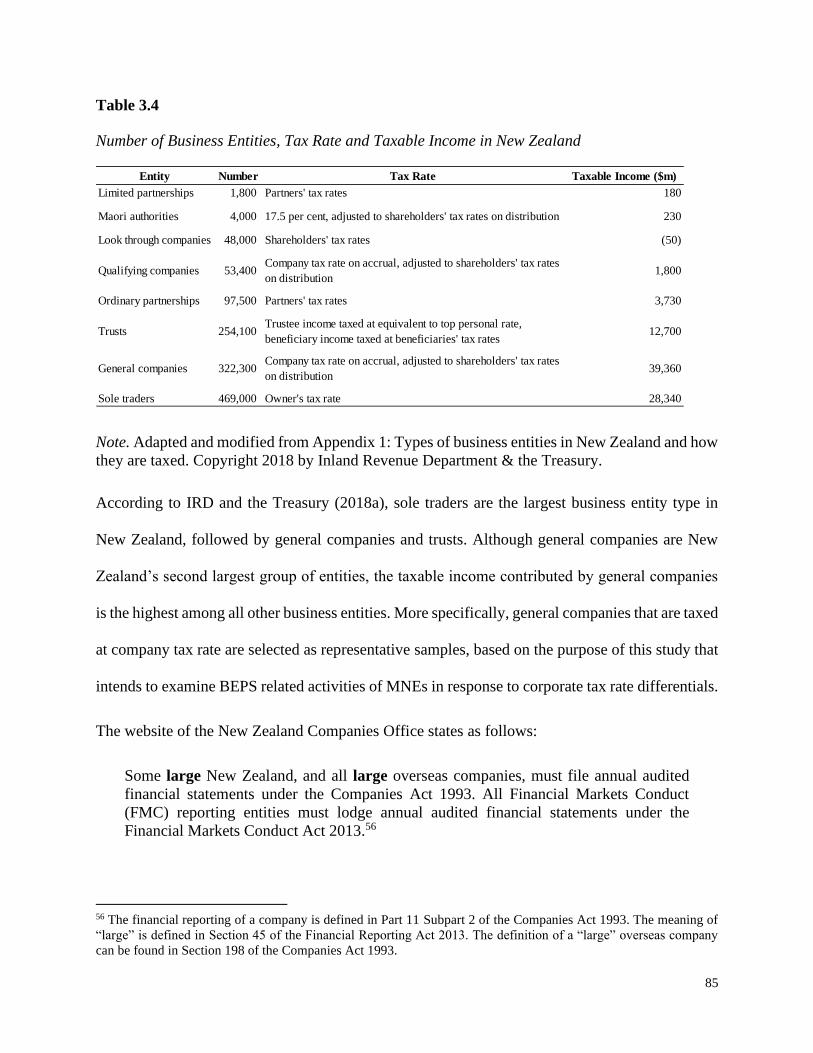
85
Table 3.4
Number of Business Entities, Tax Rate and Taxable Income in New Zealand
Note. Adapted and modified from Appendix 1: Types of business entities in New Zealand and how
they are taxed. Copyright 2018 by Inland Revenue Department & the Treasury.
According to IRD and the Treasury (2018a), sole traders are the largest business entity type in
New Zealand, followed by general companies and trusts. Although general companies are New
Zealand’s second largest group of entities, the taxable income contributed by general companies
is the highest among all other business entities. More specifically, general companies that are taxed
at company tax rate are selected as representative samples, based on the purpose of this study that
intends to examine BEPS related activities of MNEs in response to corporate tax rate differentials.
The website of the New Zealand Companies Office states as follows:
Some large New Zealand, and all large overseas companies, must file annual audited
financial statements under the Companies Act 1993. All Financial Markets Conduct
(FMC) reporting entities must lodge annual audited financial statements under the
Financial Markets Conduct Act 2013.56
56 The financial reporting of a company is defined in Part 11 Subpart 2 of the Companies Act 1993. The meaning of
“large” is defined in Section 45 of the Financial Reporting Act 2013. The definition of a “large” overseas company
can be found in Section 198 of the Companies Act 1993.
Entity Number Tax Rate Taxable Income ($m)
Limited partnerships 1,800 Partners' tax rates 180
Maori authorities 4,000 17.5 per cent, adjusted to shareholders' tax rates on distribution 230
Look through companies 48,000 Shareholders' tax rates (50)
Qualifying companies 53,400 Company tax rate on accrual, adjusted to shareholders' tax rates
on distribution 1,800
Ordinary partnerships 97,500 Partners' tax rates 3,730
Trusts 254,100 Trustee income taxed at equivalent to top personal rate,
beneficiary income taxed at beneficiaries' tax rates 12,700
General companies 322,300 Company tax rate on accrual, adjusted to shareholders' tax rates
on distribution 39,360
Sole traders 469,000 Owner's tax rate 28,340
86
While this quantitative study intends to analyse the magnitude of BEPS by obtaining the
accounting data from financial statements, not all MNEs deemed to be “large” entities are obliged
to submit financial reports as prescribed by New Zealand financial reporting regulations.
Interestingly, the definition of “large” companies has not been explicitly defined and there is no
official or legal definition of it. In New Zealand, a “large” entity can be categorised distinctively
according to different sets of criteria and thresholds of the Ministry of Business, Innovation and
Employment (MBIE), New Zealand Inland Revenue and the New Zealand Financial Reporting
Act 2013 (FRA) (Shekhovtsev, 2019). Shekhovtsev (2019), in his study, delineated the
quantitative and qualitative approach that helps to illuminate and provide a unified definition of
large enterprises.57
Table 3.5 outlines the conditions that apply to a business entity for it to be considered as a “large”
entity to file financial statements according to FRA. The conditions vary according to whether it
is a New Zealand entity or an overseas entity. There are no specific conditions for being classified
as a “large” FMC reporting entity as all FMC entities are required to prepare and submit their
financial statements. Non-large entities are not legally bound to submit a financial statement, but
they may opt to do so.
Table 3.5 also shows that the statutory reporting entities must prepare general purpose financial
reports (GPFR) that are compliant with New Zealand generally accepted accounting practices (NZ
GAAP). On the other hand, entities with no statutory financial reporting obligations may prepare
financial reports according to NZ GAAP or alternatively based on the requirements specified by
the IRD.58 In compliance with NZ GAAP, financial statements must be prepared in accordance
57 Refer to the doctoral thesis of Shekhovtsev (2019) for a more detailed explanation of defining large enterprises. 58 Instead of sending in their financial statements, the taxpayers can complete the IR 10 (the financial statements
summary form approved by IRD) online.

87
with New Zealand equivalents to international financial reporting standards (NZ IFRS) or NZ
IFRS reduced disclosure regime (NZ IFRS RDR).59
59 NZ IFRS RDR is applicable to entities with reduced public accountability.

88
Table 3.5
Financial Reporting Requirements for New Zealand Companies
Continued...
To be considered as a "large" entity and to file financial
statements if one of the following conditions applies GPFR Audit
Companies Office
Filing Requirement
(1)
- The total assets for the company exceed NZ$60 million as at
the balance date for the 2 preceding accounting periods, or
- The total revenue exceeds NZ$30 million in each of the 2
previous accounting periods
- The total assets for the company exceed NZ$60 million as at
the balance date for the 2 preceding accounting periods, or
- The total revenue exceeds NZ$30 million in each of the 2
previous accounting periods
(2)
- The total assets for the company exceed NZ$20 million as at
the balance date for the 2 preceding accounting periods, or
- The total revenue exceeds NZ$10 million in each of the 2
previous accounting periods
- The total assets for the company exceed NZ$20 million as at
the balance date for the 2 preceding accounting periods, or
- The total revenue exceeds NZ$10 million in each of the 2
previous accounting periods
Types of NZ Business Entity
¤ May opt out
Yes ¤
NZ entities
Overseas entities
An NZ Company with a foreign
ownership of less than 25 percent
Yes No
An NZ Company (but not a subsidiary of
an overseas company) with a foreign
ownership of more than 25 percent
Yes Yes Yes
A subsidiary of an overseas company
Yes YesYes
Yes Yes Yes
An overseas company or a branch
registered on Overseas Register of the
Companies Office that is undertaking
business operations in New Zealand
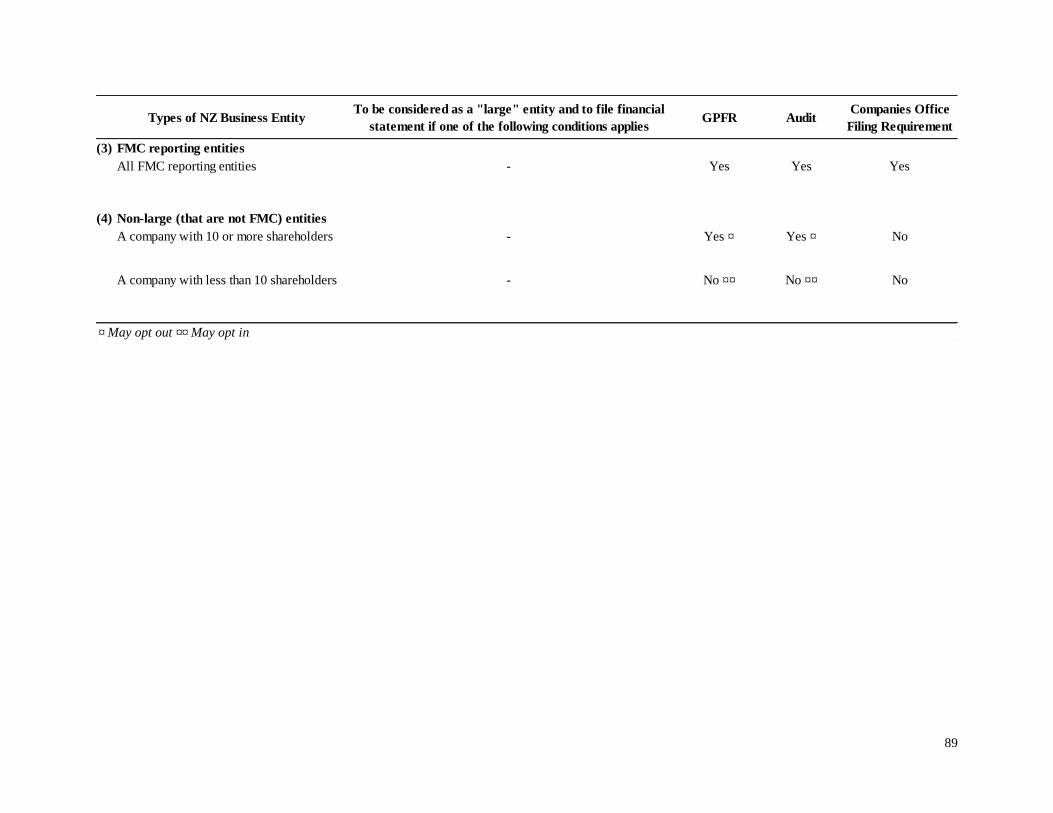
89
Types of NZ Business EntityTo be considered as a "large" entity and to file financial
statement if one of the following conditions applies GPFR Audit
Companies Office
Filing Requirement
(3)
All FMC reporting entities - Yes Yes Yes
(4)
A company with 10 or more shareholders - Yes ¤ Yes ¤ No
A company with less than 10 shareholders - No ¤¤ No ¤¤ No
¤ May opt out ¤¤ May opt in
FMC reporting entities
Non-large (that are not FMC) entities

90
This study, which aims to investigate profit shifting issues using company-level data derived
from the financial statements, will only focus on the New Zealand entities and overseas entities
that furnished financial statements.
Concerning overseas entities, an overseas entity can start up a business in New Zealand in any
form, as follows:
a. by trading directly; registering as an overseas company (i.e., as a branch),
b. by forming a subsidiary company,
c. by merging with or taking over an existing New Zealand company, or
d. by entering a limited partnership.
This study will look into New Zealand subsidiaries that are owned by an overseas company. A
New Zealand branch is excluded from the sampling as it is a different type of entity for tax
purposes, with a distinct format for reporting its financial statements. In the meantime, entities
formed from a merger or a limited partnership have different characteristics, so are also outside
the scope of this investigation.
The financial statements needed for this study were sourced from the website of the New
Zealand Companies Office. The website publishes the financial statements of the following
companies: New Zealand limited companies (NZ LTD), New Zealand unlimited companies
(NZ ULTD), New Zealand co-operative companies (NZ Co-ops), Overseas ASIC companies
(ASIC) and Overseas non-ASIC companies (non-ASIC).60
Table 3.6 shows the entity status of these five types of business entity as of 28 February 2020.
The entity status is based on the full list of companies provided by New Zealand Companies
Office on a confidential basis for the present study.
60 ASIC is the abbreviation for the “Australian Securities and Investment Commission”.

91
Table 3.6
Business Entity Types in New Zealand
The entity search report extracted from the website of the New Zealand Companies Office only
shows the first 1,000 results. The full report is not released for marketing purposes under the
Privacy Act 1993. While an entire list of New Zealand registered companies is not available to
the public, it can be obtained for business usage, research, or general interest on a case-by-case
basis.
General information, such as company name, status, type of entity, registration date and
financial reports are public data which can be accessed on the website of the New Zealand
Companies Office. The remaining business information such as the primary contact details for
the entity, personal information of specific roles in a company, are restricted or confidential
information.
The representative samples of this study, which are NZSOFMs and NZDOMs, can be
registered as NZ LTD or NZ ULTD. A New Zealand branch that is registered on the Overseas
Register of the Companies Office under ASIC (referring to Australian companies) or non-ASIC
(referring to non-Australian companies) and NZ co-ops, are beyond the scope of this study and
are therefore not included in the sampling.
Registered
External
administration (in
liquidation or in
receivership)
In statutory
management or
voluntary
administration
New Zealand limited companies (NZ LTD) 646,659 4,204 16
New Zealand unlimited companies (NZ ULTD) 394 1 -
New Zealand co-operative companies (NZ Co-ops) 127 - -
Overseas ASIC companies (ASIC) 1,666 - -
Overseas non-ASIC companies (Non-ASIC) 521 2 -
Total 649,367 4,207 16
Entity Type
Entity Status

92
Since this study relies heavily on company data extracted from the website of the New Zealand
Companies Office for the purpose of constructing study variables, the availability of the data
will also determine and restrict the sample period of the study. It is noted that documents
registered before the year 1996 might not be able to be found on the website. Therefore it was
decided that the sample period would be no earlier than 1996.
The researcher intended to conduct the BEPS analysis over a reasonably long sample period so
as to be able to uncover the traits of tax avoidance (assuming it exists), as corporate tax
strategies take effect gradually over time. In addition, a long sample period would contribute
to a larger sample size which in turn offers the potential for more precise and reliable results
and alleviates the influence of any confounding factors on the results. Even so, a problem facing
a long sample period is that the obligations of financial reporting entities may change when for
example, they are no longer “large” entities, or they are exempted from filing financial
statements. This may result in missing data due to missing financial statements for some years.
By taking all the factors into account, the sample period of this study has been restricted to the
period 2008 to 2017 (10 years). New Zealand adjusted its corporate income tax rate in 2008
from 33 percent to 30 percent, and again in 2011 from 30 percent to 28 percent. Given a
reduction in the New Zealand company tax rate, the researcher was particularly interested in
finding out if the recent rate cut that occurred within the period 2008 to 2011, had any impact
on the profits reported by the companies.
This study also attempts to review the responses of companies to recent changes of government
tax policies both within in New Zealand and in other jurisdictions. The OECD BEPS project
was rolled out in 2013. The New Zealand government and other jurisdictions have made
relevant amendments to their tax legislation or enacted new tax rules that implement the BEPS
recommendations, following the release of the final reports on the BEPS Action Plan in 2015.

93
Thus, this study takes into consideration changes before and after 2013 when determining the
sample period so that it will be possible to capture and track the changes caused by BEPS.
The cut-off point of the sample year is 2017, right before the top corporate tax rate in the US
was reduced from 35 percent to 21 percent by the TCJA which took effect on 1 January 2018.
This is because the sample of companies in the study may consist of New Zealand subsidiaries
owned by an US foreign parent and the study seeks to investigate any profit shifting related to
corporate tax rates. A sudden change in the US corporate tax rate, which had been maintained
at the same rate for many years, will lead to variation in data, thus affecting the statistical power
of the study.
3.4.1.2 Determining the Final Sample for H1 and H2
The first phase of final sample selection involved filtering those NZ LTD and NZ ULTD that
are not within the sample periods (2008–2017), the details are presented in Table 3.7.
Table 3.7
Registered LTD and ULTD that Matched the Sample Years
By removing companies incorporated after 2008 (393,094) and companies without their latest
financial statements for 2017 (252,650), 1309 registered LTD and ULTD entities were left for
647,053
Year of
Incorporation
Number of LTD
and ULTD
Year of
Incorporation
Number of LTD
and ULTD
2019 53,443 2013 28,074
2018 52,789 2012 24,870
2017 49,746 2011 22,069
2016 46,694 2010 21,528
2015 39,068 2009 21,679
2014 33,134 Total 393,094
252,650
1,309 Registered NZ LTD and ULTD that fit into the sample period
Registered NZ LTD and ULTD
less: Companies incorporated after 2008
393,094
less: Companies without latest financial statement 2017

94
analysis. The registered NZ LTD and NZ ULTD entities that fulfilled the sample period of this
study can be divided into 940 NZSOFMs and 369 NZDOMs.
The second phase of sample selection sorts out the entities according to the main study criteria
as follows:
a. Not-for profit entities
b. Banking and insurance industries
Corporations such as banks are highly regulated by governmental authorities and have
different financial characteristics. In addition, the banking and insurance entities are
governed by different sets of tax regimes. For example, banking entities in New Zealand
are regulated by special thin capitalisation rules (IRD, 2017a). Weichenrieder (2009)
does not include financial firms in his study as they have a distinct balance sheet
structure. One of the BEPS indicators in the OECD BEPS Action Plan 11 final report
is calculated using company-level financial statement information of a sample of the
250 largest global companies, which are non-financial MNEs (OECD, 2015d).
c. Incomplete financial data
Those companies with incomplete 10-year financial statements for the years 2008 to
2017 were excluded. Since the missing financial statements for these companies are
non-random, the present study recognises that this might cause a systematic bias to the
results.
d. Operating losses and with negative operating cash flow
Companies with taxable losses are not subject to statutory corporate tax and taxation
has significant effects on companies with positive net incomes only (Dischinger, Knoll,
& Riedel, 2013). The high statutory tax rate does not have an impact on the business
which makes losses as the additional profit is not taxed (Heckemeyer & Oversesch,

95
2013). By eliminating companies that operate at a loss, it will improve the measurement
precision in the studies of profit shifting as the loss-making enterprises are linked to an
observational error of the tax incentive (Heckemeyer & Oversesch, 2013).
e. Companies with no subsidiaries or no overseas subsidiaries
The first part of the study intends to determine how BEPS is impacted by the tax rate
differential between two nations. New Zealand companies with no subsidiaries or with
no overseas subsidiaries will not be included in the final sample.61
f. State-owned enterprises (SOEs) or high-net-worth individuals (HNWI) or tax exempt
Crown entities
Table 3.8
Final Samples of NZSOFMs and NZDOMs
Studies on profit shifting that measure the profits of a company might be faced with a sample
restriction as the “profit” itself can be zero or negative. The exclusion of loss-making
companies from the sample is a limitation of this approach. Table 3.8 indicates that 409 (or 44
61 To be specific, a New Zealand company with no subsidiaries refers to a stand-alone New Zealand owned
company and a New Zealand company with no overseas subsidiaries refers to a New Zealand owned company
that possesses local subsidiaries but has no subsidiaries based in other countries.
NZSOFMs NZDOMs
Registered NZ LTD and ULTD that fit into the sample period 940 369
Step 1:
less: Not-for-profit entities 0 1
less: Banking, insurance and investment companies 90 151
less: Incomplete 10-year financial statements 182 29
less: Loss-making companies 409 44
Step 2:
less: No subsidiaries or no overseas subsidiaries n/a 73
less: Crown entities, SOEs or HNWI n/a 55
Final Samples 259 16

96
percent) of NZSOFMs have reported pre-tax losses. The breakdown of the loss-making
companies is shown in Table 3.9.
Table 3.9
Number of NZSOFMs making losses from 2008–2017
It is normal for a company to be operating temporarily at an operating loss when the tax-
deductible expenses are significantly higher than its taxable income. In New Zealand, a loss-
making company does not have to pay income tax and is permitted to carry forward the loss
indefinitely to offset against future taxable income subject to certain conditions.62
However, most tax avoidance schemes involve the creation of expenditure between related
parties leading to business losses that will reduce the overall assessable income (Smith &
Dunmore, 1997). Johansson, Skeie, Sorbe, and Menon (2017) believe that such studies should
not necessarily rule out companies with reported losses, as some companies with positive
income may eventually find themselves unprofitable if the amount of profit being shifted is
62 There is no provision for the company to carry back tax losses. However, a temporary tax loss carry-back
scheme has been introduced to adjust for the COVID-19 pandemic in 2020 (IRD, 2020).
Number of years of making losses
(2008–2017)Number of companies
10 5
9 5
8 13
7 15
6 25
5 42
4 52
3 55
2 89
1 108
Total 409

97
greater than the “true” profit.63 While existing studies focus extensively on profit-making
companies and find it more relevant by restricting the observations to the affiliates with positive
income, the profit shifting incentives may remain in the affiliates with negative income if the
tax system of the country allows for loss carryforwards and carrybacks (Dharmapala & Riedel,
2013). If loss offsets are permitted in a tax system, the MNEs would be more tempted to shift
income to the low-tax affiliate rather than the high-tax affiliate if both affiliates have negative
income (Dharmapala & Riedel, 2013). However, in most tax systems, the merits of shifting
profits to a loss-making affiliate with low tax might be reduced by the limitations on loss offsets
(Dharmapala & Riedel, 2013).
3.4.1.3 Sample Companies and Sample Years for H3 to H5
To represent the companies with foreign ownership, 259 NZSOFMs used to test H1 are adopted
to represent sample companies of foreign ownership in the second part of the study. The same
group of NZSOFMs is used so that the empirical results of both sections of study can be brought
together and present a coherent and consistent interpretation of the results. NZDOCs that
represent the control group of domestic ownership include NZDOMs with at least one wholly
owned subsidiary outside New Zealand, and New Zealand owned companies with solely
domestic subsidiaries or with no subsidiaries. While the panel analysis of 2008–2017 with fixed
effect regressions in the first section provides the quantitative findings of profit shifting, the
cross-section analysis for the year 2015 in the second section provides suggested evidence of
debt shifting. Given the constraints of time, the second section examines the one year data of
63 The equation of (observed) profit = “true” profit + (unobserved) shifted profit was first introduced in the studies
of Grubert and Mutti (1991) and Hines and Rice (1994), and subsequently adopted in the study of Johansson et
al. (2017). In the study of Johansson et al. (2017), the observed profit refers to pre-tax profit, and the determinants
of “true” profit in the study include firm-specific characteristics and various macroeconomic variables. The shifted
profit is driven by tax motives such as tax differential.

98
2015, and it aims to improve and complement the first section of the study by looking into the
BEPS issues from a debt structure perspective.
3.4.1.4 Determining the Final Sample for H3 to H5
NZSOFMs and NZDOCs with financial statements available for the year 2015 are employed
as the final sample to test hypotheses H3 to H5. The number of companies for the respective 8
specific ratios are displayed in Table 3.10, Table 3.11, and Table 3.12. The sampled companies
with ratios greater than 1, or less than 0 are not included in the sample and treated as outliers
in order to avoid huge variation caused by extreme values.
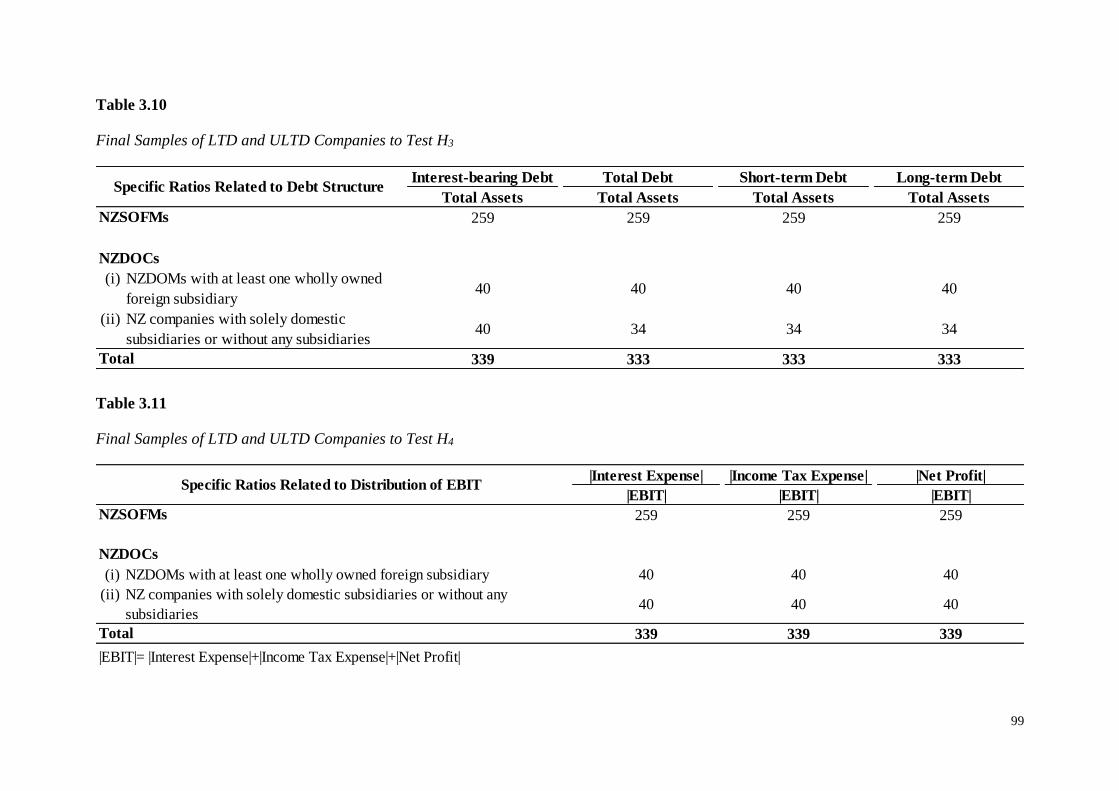
99
Table 3.10
Final Samples of LTD and ULTD Companies to Test H3
Table 3.11
Final Samples of LTD and ULTD Companies to Test H4
Interest-bearing Debt Total Debt Short-term Debt Long-term Debt
Total Assets Total Assets Total Assets Total Assets
259 259 259 259
(i) NZDOMs with at least one wholly owned
foreign subsidiary40 40 40 40
(ii) NZ companies with solely domestic
subsidiaries or without any subsidiaries40 34 34 34
339 333 333 333
NZSOFMs
NZDOCs
Total
Specific Ratios Related to Debt Structure
|Interest Expense| |Income Tax Expense| |Net Profit|
|EBIT| |EBIT| |EBIT|
259 259 259
(i) NZDOMs with at least one wholly owned foreign subsidiary 40 40 40
(ii) NZ companies with solely domestic subsidiaries or without any
subsidiaries40 40 40
339 339 339
Specific Ratios Related to Distribution of EBIT
NZSOFMs
NZDOCs
Total
|EBIT|= |Interest Expense|+|Income Tax Expense|+|Net Profit|
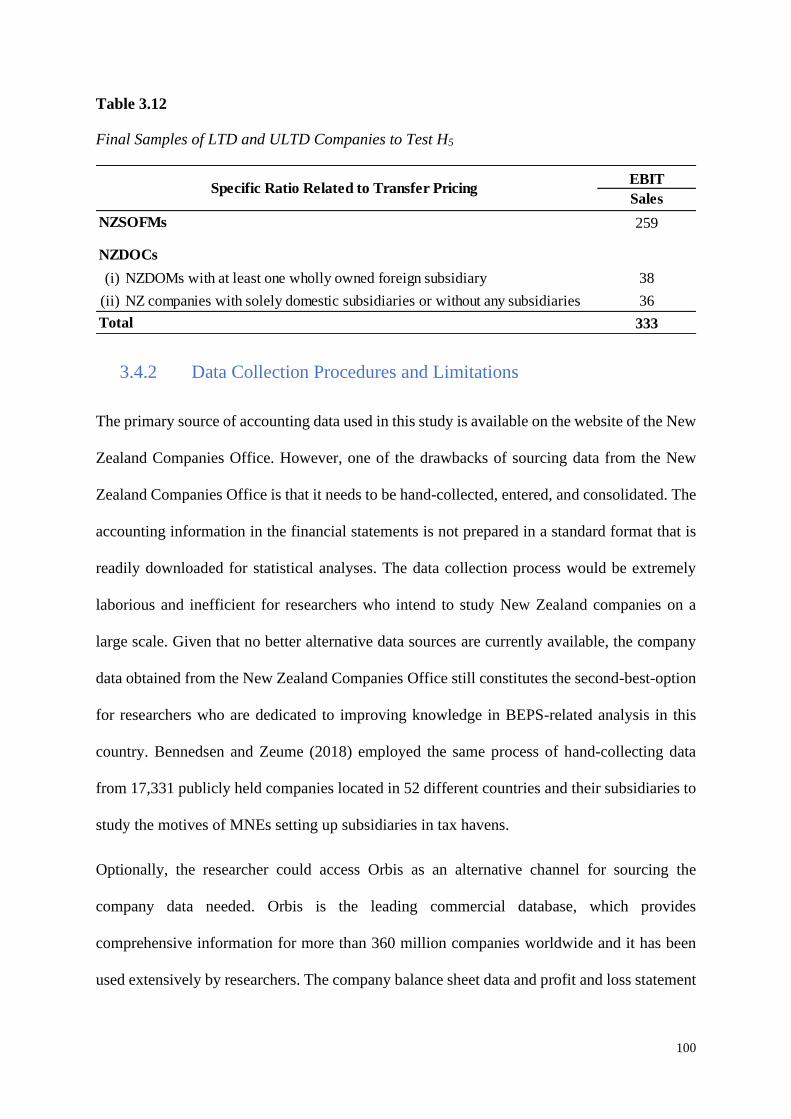
100
Table 3.12
Final Samples of LTD and ULTD Companies to Test H5
3.4.2 Data Collection Procedures and Limitations
The primary source of accounting data used in this study is available on the website of the New
Zealand Companies Office. However, one of the drawbacks of sourcing data from the New
Zealand Companies Office is that it needs to be hand-collected, entered, and consolidated. The
accounting information in the financial statements is not prepared in a standard format that is
readily downloaded for statistical analyses. The data collection process would be extremely
laborious and inefficient for researchers who intend to study New Zealand companies on a
large scale. Given that no better alternative data sources are currently available, the company
data obtained from the New Zealand Companies Office still constitutes the second-best-option
for researchers who are dedicated to improving knowledge in BEPS-related analysis in this
country. Bennedsen and Zeume (2018) employed the same process of hand-collecting data
from 17,331 publicly held companies located in 52 different countries and their subsidiaries to
study the motives of MNEs setting up subsidiaries in tax havens.
Optionally, the researcher could access Orbis as an alternative channel for sourcing the
company data needed. Orbis is the leading commercial database, which provides
comprehensive information for more than 360 million companies worldwide and it has been
used extensively by researchers. The company balance sheet data and profit and loss statement
EBIT
Sales
259
(i) NZDOMs with at least one wholly owned foreign subsidiary 38
(ii) NZ companies with solely domestic subsidiaries or without any subsidiaries 36
333
Specific Ratio Related to Transfer Pricing
NZSOFMs
NZDOCs
Total

101
data are captured and presented on Orbis. Although this database is widely used in existing
studies, the downside of the Orbis datasets should be clearly noted by researchers.
The Orbis database is dominated by European and US companies, and the data coverage differs
largely across countries. The company coverage in lower-income countries is under-
represented (Cobham & Janský, 2017). This explains why the existing studies on BEPS activity
using firm-level data have been conducted mainly in Europe and the US. New Zealand
companies are comparatively poorly represented on Orbis as well.
Orbis data is also known to have suffered from reporting errors as the data on it is not collected
for statistical purposes at the outset (Johansson et al., 2017). Orbis data should be read with
caution as some genuine data entry errors have been identified by the researcher. For example,
the figure “7869” found in one financial statement was reported as “7859” on Orbis. Besides
that, Orbis does not standardise the format numbers (to be displayed in thousands or to be
displayed in exact values). Some companies show the numbers in thousands (e.g., 450,000 was
reported as 450) in their financial statements while some companies report the numbers as the
actual value (e.g., 450,000). However, Orbis does not display the number in a standard format.
Readers will not know if the number of 450 is in absolute terms (450) or a number in thousands
(450,000) as Orbis displays the data in different formats. While this non-standard format would
not affect the financial ratio calculations, readers are still being misinformed.
Therefore, the data derived directly from the company financial statements remains the primary
source of data in this study. To validate the accuracy of data collected in the study, the
information in the published financial statements extracted from the New Zealand Companies
Office is compared to Orbis datasets. Since Orbis is a commercial database and over 99 percent
of the company details on it are private, and researchers have to pay to access Orbis, the
publicly available data on New Zealand Companies Office is a better option for researchers
who do not have access to Orbis datasets.

102
3.5 Conclusion
The philosophical approach of positivism has been adopted as the research paradigm in
conducting this research. In respect to the methodological approach, a quantitative research
method has been engaged by the researcher to resolve the research questions indicated in
Chapter 1. A methodological approach simply reflects the epistemological beliefs of the
researchers.
Purposive sampling (a non-probability sampling) is used with quantitative research technique
in investigating the research topic The sampling process and the procedures for collecting and
measuring data have been explained clearly in this chapter. The statistical model has also been
explained in detail as it is crucial for an accurate and sound analysis in the following chapters.

103
Chapter 4 Statistical Results
4.1 Introduction
In this chapter, all the data is gathered and analysed. The statistical results are displayed and
interpreted in detail. More specifically, the effects of the input variables on the reported
profitability of NZSOFMs and NZDOMs are discussed. Section 4.2 responds to the first
research question of what effect do (cross-border) tax differentials have on the profits reported
by NZSOFMs under BEPS, while Section 4.3 addresses the second research question of what
effect do (cross-border) tax differentials have on the profits reported by NZDOMs under BEPS.
Besides, Section 4.4 presents the results of the t-test and regression analyses on NZSOFMs and
NZDOCs, which deals with the final research question of what the differences in terms of debt
structure and transfer pricing of a company with foreign ownership in comparison to a company
with domestic ownership are. Finally, Section 4.5 briefly summarises the main key findings
and conclusions are drawn about the research data.
4.2 Statistical Results for Profit Shifting of NZSOFMs
4.2.1 Descriptive Statistics for NZSOFMs
Table 4.1 summarises the descriptive statistics of 259 NZSOFMs. The observed variables, in
their original values and after logarithmic transformation, are presented. The raw data in this
study is transformed into the natural logarithmic function to decrease the variability of data,
and to improve the interpretability and comparison of data. The regression analysis was
conducted on the transformed variables.
As shown in Table 4.1, the average and the median for each group of transformed variables are
close in value indicating that the sample distribution is fairly symmetric. Overall, the
observations of each group of key variables after transformation are spread within three

104
standard deviations of the mean, suggesting that the data points are less spread out and cluster
to the mean of the data set.64
By looking at the initial values of the data, NZSOFMs possess a mean of pre-tax profits of
NZD 8.9 million, average fixed assets amounting to NZD 17 million, and an average cost of
employees of NZD 13 million. The leverage of NZSOFMs ranges from 0.02 to 2.18 with a
mean of 0.46. This suggests that, on average nearly half of the total assets of NZSOFMs are
financed by liabilities. The CPI of New Zealand is relatively high (M = 9.17, SD = 0.18). A
high CPI score implied a low degree of corruption, which presents a low risk to businesses and
seems to impact positively on pre-tax profits. The tax differential of NZSOFMs ranges from –
16.4 percent to 30 percent, with a mean of 1.42 percent. On average, the tax rate difference
between host country and the immediate parent location is relatively small.
64 The mean and the standard deviation of the sample are two important parameters to determine if the variables
have normal distribution.

105
Table 4.1
Descriptive Statistics for Key Variables of NZSOFMs
M Median SD Range
^ PTP 8,955,256.38 3,507,513.00 19,888,440.47 1,071 - 389,224,000
lnPTP 15.07 15.07 1.36 6.98 - 19.78
TAXDIFF1 1.42 0.00 7.34 –16.43 - 30.00
^ FA 17,421,412.84 1,576,500.00 54,939,047.87 1 - 505,908,000
lnFA 14.16 14.27 2.76 0.00 - 20.04
^ EMPLYCOST 13,139,534.34 5,099,448.50 20,417,310.43 1 - 241,166,000
lnEMPLYCOST 15.51 15.44 1.42 0.00 - 19.30
LEV 0.46 0.43 0.24 0.02 - 2.18
lnLEV –0.96 –0.84 0.64 –3.91 - 0.78
# GDP 226.10 221.82 27.70 189.66 - 274.92
lnGDP 5.41 5.40 0.12 5.25 - 5.62
¤ CPI 9.17 9.10 0.18 8.90 - 9.50
lnCPI 2.22 2.21 0.02 2.19 - 2.25
Notes . N NZSOFMs = 2590. ̂In New Zealand Dollars. # In billion New Zealand Dollars. ¤ CPI ranges from 0 (highly corrupt) to 10 (least corrupt).
FA = Property, plant and equipment. EMPLYCOST = Personal costs; Personal expenses. LEV = Total liabilities/Total assets. GDP = GDP of host
country (New Zealand). CPI = CPI of host country (New Zealand). TAXDIFF1 = Statutory corporate tax rate of host country (New Zealand) –
Statutory corporate tax rate of immediate parent's country.
NZSOFMs
Panel 2008–2017

106
Table 4.2
Location of Immediate Parent of NZSOFMs
Table 4.2 shows the countries where the immediate parents of NZSOFMs are located. 106
NZSOFMs in the final sample have their immediate parent located in Australia. This is
followed by the US (36), the Netherlands (29) and the UK (19).
Australia and New Zealand have had a mutually collaborating, long-established economic
relationship, fostered by the ANZCERTA, since 1983. New Zealand is geographically distant
from major world markets and Australia is its closest and most important trading partner.
Location of
Immediate Parent
Number of
NZSOFMs
Australia 106
Bermuda 1
Canada 3
China 1
Denmark 2
Finland 1
France 10
Germany 8
Guernsey 1
Hong Kong 3
India 1
Ireland 1
Isle of Man 1
Japan 12
Luxembourg 2
Netherlands 29
Singapore 9
Spain 1
Sweden 2
Switzerland 9
UK 19
US 36
Virgin Island, British 1
Total 259

107
Unsurprisingly, New Zealand subsidiaries of Australian parents made up a major portion (41
percent) of the sample, and foreign multinational parents from other countries have less
business presence in this country as compared to Australia.
On the other hand, New Zealand and the US have entered a bilateral economic relationship
since the trade and investment framework agreement (TIFA) was signed in 1992. The US has
continued to be a close trading partner throughout the 2000s, and it had the third-largest inward
FDI in New Zealand in 2020, after Australia and Hong Kong, mainly investing in finance,
manufacturing, and wholesale trade (Statistics New Zealand, 2020b).
In addition to that, the Netherlands is one of the most important European trading partners for
New Zealand despite their physical distance. There are certain economic and cultural ties that
bind these two countries together. Both New Zealand and the Netherlands focus especially on
horticulture and agriculture. Being among the world’s leading producers of agricultural and
food products, Dutch companies have always wanted to tap into the expertise of New Zealand
in the agricultural and horticultural industries. Dutch migrants form the largest non-British
immigrant group in New Zealand and there are over 150,000 New Zealanders of Dutch descent
in New Zealand today (MFAT, 2017). Ancestry relatedness and cultural similarities allow close
trade and investment ties between the two countries.
4.2.2 Pearson Correlations for NZSOFMs
Table 4.3 shows the correlations among seven key continuous variables on data for 259
NZSOFMs. A Pearson correlation coefficient was computed and the correlation estimations
and the directions of the relationship for each pair of variables are presented.

108
Table 4.3
Pearson Correlations for Key Variables of NZSOFMs
The correlation matrix shows that pre-tax profit and tax difference to the immediate parent’s
location have a small negative correlation, r = –.004 and are not statistically significant. On the
other hand, fixed assets and pre-tax profits have a statistically significant relationship (r = .51,
p < .01) and there is a moderate correlation between these two variables (.3 < | r | < .7). The
relationship between cost of employees and pre-tax profits is also moderately correlated (r
= .52, p < .01). The relationship between leverage and pre-tax profits is in an inverse direction,
r = –.007 and it is not statistically significant. There is a positive correlation between GDP and
pre-tax profits (r = .11, p < .01) and these two variables are weakly correlated. The results also
indicate that there is an inverse relationship between CPI and pre-tax profits (r = –.09, p < .01).
1 2 3 4 5 6 7
1. lnPTP -
2. TAXDIFF1 –0.004 -
3. lnFA 0.511** 0.064** -
4. lnEMPLYCOST 0.518** 0.026 0.486** -
5. lnLEV –0.007 0.173** 0.013 0.143** -
6. lnGDP 0.113** –0.046* –0.006 0.058** –0.071** -
7. lnCPI –0.087** 0.032 0.007 –0.440* 0.058** –0.797** -
Variable
Notes. N NZSOFMs = 2590. lnPTP = Natural log of pre-tax profit. TAXDIFF1 = Statutory corporate tax rate of
host country (New Zealand) – Statutory corporate tax rate of immediate parent's country. lnFA = Natural log
of property, plant and equipment. lnEMPLYCOST = Natural log of personal costs; Personal expenses. lnLEV
= Natural log (Total liabilities/Total assets). lnGDP = Natural log of GDP of host country (New Zealand).
lnCPI = Natural log of CPI of host country (New Zealand) and it ranges from 0 (highly corrupt) to 10 (least
corrupt). ** Correlation is significant at the 0.01 level (2-tailed). * Correlation is significant at the 0.05 level
(2-tailed).

109
4.2.3 Panel Regressions for NZSOFMs
In this study, a firm fixed effects panel regression has been applied on 259 observed NZSOFMs
for the years 2008 to 2017, and the regression results are presented in Table 4.4. There are
different regression methods that can be applied to a panel data analysis which combines both
cross section and time series data.65 A panel study which employs common effects examines
different units of cross sections within a certain period of time, while a study applying fixed
effects or random effects observes the same unit of cross-sections at different points in time
(Wooldridge, 2010). The firm fixed effects method is applied across all specifications in this
study to investigate how the same observed NZSOFMs react to changes in the tax rate over
time. The fixed effects (group dummies) regression manages to capture time-constant
company-specific effects, such as company culture and managerial qualities which cannot be
measured using accounting variables.
First, this study aims to examine if the reported profitability by NZSOFMs responds to the
changes of corporate tax rate, particularly the single statutory tax rate of the host country (New
Zealand) and corporate tax differential (between New Zealand and the country where the
immediate parent is located). The relationship between the pre-tax profit of 259 NZSOFMs
and the key tax rate variables is displayed in Specification 1 and Specification 5, respectively.
The results presented in Specifications 1 and 5 indicate a strong negative correlation between
profitability and the statutory tax rate, at the 1 percent confidence level. The coefficient
estimate of the single country statutory corporate tax rate is about six times the tax rate
difference to the parent.
65 Most of the discussions and academic papers focused on the fixed and random effect model used in the panel
study. However, Zulfikar (2018) discussed three estimation methods, which are common effect, fixed effect and
random effect model, that can be employed in panel data analysis.

110
The results suggest that NZSOFMs are more responsive and sensitive to the changes of the
domestic corporate tax rate of the host country which has a direct impact on the business where
it operates. Specification 1 suggests a 10 percentage points decrease in the host country tax rate
resulting in a 1.7 percent increase in reported pre-tax profits of NZSOFMs. By considering the
tax difference from the parent country, NZSOFMs with a lower tax rate relative to the parent
location observe an increase in pre-tax profits of 0.3 percent if the tax differential decreases by
10 percentage points.
Following this, the company control variables (fixed assets and cost of employees) are included
in Specifications 2 and 6 to control for heterogeneity in different companies. With the inclusion
of these firm-level control variables, the coefficients of the host country (New Zealand)
statutory tax rate and tax differential in both Specification 2 and 6 remain negative and highly
significant at the 1 percent level. The fixed assets and cost of employee variables have a strong
positive relationship with pre-tax profits in both Specifications 2 and 6. The effect of the cost
of employees on pre-tax profits is about two times greater than that of capital.
In Specifications 3 and 7, the company leverage (total liabilities/total assets) is added to the
estimation model. Dischinger (2010) included the debt-to-assets ratio, which is likely to be
affected by the tax variables, together with two other firm control variables, to find out if it will
impact on the coefficient estimates of the statutory tax rate. The results show that the tax
coefficients in Specification 3 and Specification 7 are marginally affected, and, significantly,
the coefficient of leverage turns out to be negative. It shows that low leverage in a firm
enhances the profitability. The coefficient estimates of these company-level variables are quite
stable in each of the different specifications.
In Specifications 4 and 8, the country-level control variables are additionally applied to the
estimation framework. In Specification 8, the coefficient of tax rate differential turns out to be
negative but is not statistically significant. The GDP coefficient appears to have an inverse

111
relationship with company profitability. It seems that a highly competitive market, indicated
by a high GDP, results in lower company profits. The results also show that the coefficient
estimates of CPI turns out to be positive but not statistically significant.

112
Table 4.4
Profit Shifting of NZSOFMs
Explanatory variables (1) (2) (3) (4) (5) (6) (7) (8)
Host country statutory tax rate a
–0.17*** –0.16*** –0.15*** –0.08***
(0.01) (0.01) (0.01) (0.02)
Tax difference to parent b
–0.03*** –0.03*** –0.03** –0.01
(0.01) (0.01) (0.01) (0.01)
lnFA 0.07*** 0.08*** 0.08*** 0.07*** 0.08*** 0.08***
(0.01) (0.01) (0.01) (0.01) (0.01) (0.01)
lnEMPLYCOST 0.13*** 0.14*** 0.13*** 0.16*** 0.17*** 0.13***
(0.02) (0.02) (0.02) (0.02) (0.02) (0.02)
InLEV –0.14*** –0.13** –0.20*** –0.14**
(0.04) (0.04) (0.04) (0.04)
lnGDP 0.69** –1.20***
(0.22) (0.18)
lnCPI 0.22 0.56
(1.04) (1.04)
N 2590 2590 2590 2590 2590 2590 2590 2590
Adjusted R-squared .77 .78 .78 .78 .76 .77 .77 .78
Notes. *, **, *** indicates significance at the 10 percent, 5 percent, and 1 percent level, respectively. Standard errors are in parentheses.aIt refers to statutory corporate
tax rate of New Zealand.b
It refers to the difference between statutory corporate tax rate of New Zealand and statutory corporate tax rate of immediate parent's country.
lnFA = Natural log of property, plant and equipment. lnEMPLYCOST = Natural log of personal costs; Personal expenses. lnLEV = Natural log (Total liabilities/Total
assets). lnGDP = Natural log of GDP of host country (New Zealand). lnCPI = Natural log of CPI of host country (New Zealand).
OLS firm fixed effects model for NZSOFMs
Panel 2008–2017
Dependent variable: Natural log of profit before tax

113
4.2.4 Logistic Regressions for NZSOFMs
A series of logistic regressions was also conducted to model the probability of NZSOFMs
reporting a high profit, or not. It was an extension from the linear regression to find the solution
to binary classification problems. This statistical analysis method has been used extensively
because it is simple to implement, and the results predicted by the analysis are highly
interpretable, with only two possible discrete categorical outcomes that take the values of 0 and
1. The results of two binary outcome models (logit and probit) are shown in Table 4.5.
Table 4.5
Logistic Regression Results of NZSOFMs
The sample of 259 NZSOFMs was sorted according to the total of pre-tax profits in 10 years
(2008 to 2017) in descending order. The first 100 companies, which reported the highest total
To Report High Profit
(1=Yes, 0=Otherwise)
Tax Difference to Parent –0.03 *** –0.02 ***
lnFA 0.51 *** 0.29 ***
lnEMPLYCOST 0.77 *** 0.37 ***
lnLEV 0.23 ** 0.14 ***
lnGDP
lnCPI
Constant
N
McFadden R-squared
Logit Coefficients Probit Coefficients
(0.008)
(0.034)
(0.056)
(0.005)
Notes . Observations with dependent variable = 1: 1000. Observations with
dependent variable = 0: 1000. *, **, *** indicates significance at the 10%,
5% and 1% level; Standard errors are in parentheses.
(0.018)
(0.026)
(0.055)
–0.24
–7.10
(0.463)
–0.62
(2.803)
(0.100)
–0.57
(0.815)
–0.34
(4.921)
(14.68) (8.35)
2000
0.359
–15.30
2000
0.376

114
of pre-tax profits, were coded as 1, while the last 100 companies, which reported the lowest
profits, were coded as 0. 59 NZSOFMs lying between these two sets of companies are
eliminated from this logistic regression analysis.
The binary models (logit and probit) are employed to find out what makes NZSOFMs more or
less likely to report a high profit. The dependent variables are binary variables, which take the
value 0 (if a company reports low profits) or 1 (if a company reports high profits). To determine
the independent variables in the binary logistic regression, Tabachnick and Fidell (2013)
suggest including predictors with correlation coefficients of not more than 0.90 in the logistic
model. By referring to the correlation matrix in Table 4.3, the correlation coefficients of all key
variables of NZSOFMs are less than 0.90 and all of them are included in the logistic model.
The results of both logit and probit models, using the maximum likelihood method, are almost
identical. The pseudo-R-squared (McFadden R-squared) of both models are 0.376 and 0.359,
respectively. A pseudo-R-square with a value between 0.2 and 0.4 means a good fit of the
model.
The results indicate that a decrease in tax difference makes the outcome of 1 more likely to
occur. In other words, the companies are more likely to report high profits when the tax
differences decrease. Unlike the linear regression, the magnitude of the coefficient was not
interpreted in a logistic regression analysis, as the scales of coefficients vary among different
models. Thus, only the signs of each coefficient in both the logit and probit models are defined
and interpreted.

115
To further understand the effects estimates for logistic regression model, the estimated
percentage unit effect of each explanatory variable is measured by scaling the β coefficients by
p(1–p).66 The results are presented in Table 4.6.
Table 4.6
Effects Estimates for Logistic Regression of NZSOFMs
The results show that a one percent decrease in the tax difference to parents is estimated to
result in a 0.0075 percent increase in the probability of reporting a high profit. In other words,
the estimated percentage unit effect of tax difference is insignificant. In consistent with the
finding of the most preferred multiple regression analysis of profit shifting of NZSOFMs
(Specification 8), the effect of tax difference is too tiny, which in turn, has little impact on the
profitability reported by NZSOFMs.
66 The logistic regression equation is ln[pi/(1–pi)] = β 0 + β 1X1i + β 2X2i + … + β kXki. The odds ratio, which is
pi/(1–pi) estimates the outcome (y = 1) relative to the outcome (y = 0). β1is the effect of X1i on the predicted
ln(odds) (or log-odds). Assuming X1 is continuous, the estimated percentage unit effect of X1 for a given individual
i is β1[pi (1–pi)] where p*(1–p) is the logistic probability density function (PDF).
Tax Difference to Parents –0.03 *** –0.0075
lnFA 0.51 *** 0.1275
lnEMPLYCOST 0.77 *** 0.1925
lnLEV 0.23 ** 0.0575
lnGDP –0.57 –0.1433
lnCPI –0.34 –0.0850
Constant –15.30 –3.8250
Notes. The estimated percentage unit effect of x is calculated as [p(1–p)β]
where p is the probability that an observational unit has (y = 1). y represents
the binary (0 or 1). Observations with dependent variable =1: 1000.
Observations with dependent variable = 0: 1000.
To Report High Profit,
(1=Yes, 0=Otherwise)
Logit
Coefficients (β)[p(1–p)β]

116
With respect to the firm-level control variable, a one percent increase in the fixed assets (which
represents the capital input) and a one percent increase in the costs of employees (which
represents the labour input) is associated with a 0.13 percent and a 0.19 percent rise in the
probability of a company reporting a higher profit, respectively. The results also indicate that
a one percent increase in the GDP leads to a 0.14 percent decrease in the probability of higher
profit being reported. A highly competitive environment has a strong effect on the probability
of NZSOFMs reporting a lower profit. While the estimated effect of leverage and the CPI
(0.0575 and –0.085, respectively) is not in the predicted direction, its effect on the probability
of reporting a higher profit is minor as compared to other variables.
4.3 Statistical Results for Profit Shifting of NZDOMs
The descriptive statistics, Pearson correlations and firm fixed effect regression analysis have
been conducted on 16 NZDOMs. While there is no single definition of a “small” sample size,
the final sample of 16 NZDOMs used in the analyses are still considered too small to yield
precise and reliable results.
Prior to any firms being identified and selected as the final samples for testing H2, the initial
sample comprises 369 New Zealand owned companies. Given that 151 are companies in the
banking, insurance, and investment industries, 73 do not have any subsidiaries or subsidiaries
in foreign countries, and 55 are Crown entities, SOEs or owned by HNWI, this further reduces
the final sample to 16 NZDOMs.
Alternatively, the researcher analysed the New Zealand exchange (NZX), where the most
highly market capitalised New Zealand companies are listed. This shows that only 13
companies fulfil the study requirements to test H2 (see Appendix G). The sample found on the
NZX are remarkably similar to the final samples identified in this study. This indicates that
117
New Zealand does not have many large multinational New Zealand owned companies,
especially companies that truly fulfil the study criteria to analyse profit shifting of NZDOMs.
Since it is inadequate to make inferences from a sample size of 16 NZDOMs, the statistical
results are displayed in the appendices (Appendix D to Appendix F) as supplementary
information. The findings are still interpreted and discussed in the appendices in order to
understand the profit shifting of NZDOMs.
4.4 Statistical Results for Debt Shifting of NZSOFMs and NZDOCs
4.4.1 T-test Results for NZSOFMs and NZDOCs
An independent sample t-test was performed to compare the means on the eight specific ratios
of NZSOFMs and NZDOCs as to whether the true difference between the means of these two
groups is zero. The descriptive statistics of each ratio and its control variables of size and
industry are displayed in Table 4.7 to Table 4.10.
The results of the sample of the interest-bearing debt ratio are presented in Table 4.7.
NZSOFMs (M = 0.06, SD = 0.14) are compared to NZDOCs (M = 0.18, SD = 0.19) and
NZSOFMs demonstrated a significantly lower interest-bearing debt ratio, t (339) = 9.6, p < .001,
Cohen’s D = .75.
Table 4.8 demonstrates the results of three debt ratios (total debt/total assets, short-term
debt/total assets, and long-term debt/total assets). The results indicate that NZSOFMs (M =
0.44, SD = 0.23) compared to NZDOCs (M = 0.46, SD = 0.24) showed significantly lower total
debt/total assets ratio (leverage 1), t (333) = 34.69, p < .001, Cohen’s D = .10. In terms of the
ratio of short-term debt to total assets (leverage 2), NZSOFMs (M = 0.39, SD = 0.22) has a
higher ratio than NZDOCs (M = 0.25, SD = 0.19), t (333) = 29.13, p < .001, Cohen’s D = .64.
By comparison, the ratio of long-term debt to total assets (leverage 3) of NZSOFMs (M = 0.05,

118
SD = 0.11) is significantly lower than NZDOCs (M = 0.20, SD = 0.20), t (333) = 10.08, p < .001,
Cohen’s D = .88.
Table 4.9 displays the results for the samples of interest expense ratio, income tax expense ratio
and net profit ratio. In the sample of interest expense ratio, there is a significant difference in
the interest expense ratio for NZSOFMs (M = 0.07, SD = 0.13) and NZDOCs (M = 0.23, SD =
0.21), t (339) = 11.23, p < .001, Cohen’s D = .77. In the sample of income tax expense ratio,
the results showed that NZSOFMs (M = 0.27, SD = 0.09) had a higher income tax expense
ratio than NZDOCs (M = 0.18, SD = 0.15), and the t-test found this pattern to be significant, t
(339) = 41.40, p < .001, Cohen’s D = .69. Concerning the net profit ratio, NZSOFMs (M =
0.66, SD = 0.13) demonstrated a significantly higher net profit ratio than NZDOCs (M = 0.59,
SD = 0.24), t (339) = 72.86, p < .001, Cohen’s D = .37.
Finally, the result in Table 4.10 suggests that NZSOFMs (M = 0.14 SD = 0.13) has a
significantly higher EBIT ratio (EBIT/Sales) as compared to NZDOCs (M = 0.13 SD = 0.11),
t (333) = 17.12, p < .001, Cohen’s D = .06.
Overall, the results indicate that NZSOFMs are significantly different from NZDOCs in all of
the eight specific ratios. In term of firm size, the samples of NZSOFMs are on average larger
than NZDOCs except in the sample of EBIT to sales. Specifically, NZSOFMs have lower
interest-bearing debt ratio than NZDOCs (0.06 versus 0.18) and it turns out that NZSOFMs
have a lower interest expense ratio as compared to NZDOCs (0.07 versus 0.23). In comparison
to NZDOCs, NZSOFMs take on more short-term debt and less long-term debt to fund the
company’s assets.

119
Table 4.7
Descriptive Statistics of Interest-bearing Debt Ratio
NZDOCs NZSOFMs ALL
(n=80) (n=259) (n=339)
M 0.183 0.058 0.085
SD 0.186 0.143 0.161
M 17.343 17.640 17.575
SD 3.055 1.110 1.727
M 0.125 0.231 0.208
SD 0.333 0.422 0.406
M 0.069 0.000 0.015
SD 0.256 0.000 0.122
M 0.056 0.027 0.033
SD 0.231 0.162 0.180
M 0.194 0.288 0.268
SD 0.399 0.454 0.444
M 0.069 0.104 0.096
SD 0.256 0.306 0.296
M 0.042 0.023 0.027
SD 0.201 0.150 0.163
M 0.097 0.035 0.048
SD 0.298 0.183 0.214
M 0.028 0.038 0.036
SD 0.165 0.193 0.187
M 0.014 0.035 0.030
SD 0.118 0.183 0.171
M 0.042 0.046 0.045
SD 0.201 0.210 0.208
M 0.097 0.092 0.093
SD 0.298 0.290 0.291
M 0.028 0.062 0.054
SD 0.165 0.241 0.227
M 0.042 0.000 0.009
SD 0.201 0.000 0.095
M 0.028 0.004 0.009
SD 0.165 0.062 0.095
M 0.000 0.012 0.009
SD 0.000 0.107 0.095
Variable t-value Prob
Interest-bearing debt ratio 9.637 0.0000
SIZE 185.466 0.0000
Industry 1 9.319 0.0000
Industry 2 2.250 0.0251
Industry 3 3.368 0.0008
Industry 4 11.010 0.0000
Industry 5 5.942 0.0000
Industry 6 3.037 0.0026
Industry 7 4.093 0.0001
Industry 8 3.523 0.0005
Industry 9 3.206 0.0015
Industry 10 3.958 0.0001
Industry 11 5.839 0.0000
Industry 12 4.356 0.0000
Industry 13 1.737 0.0833
Industry 14 1.737 0.0833
Industry 15 1.737 0.0833
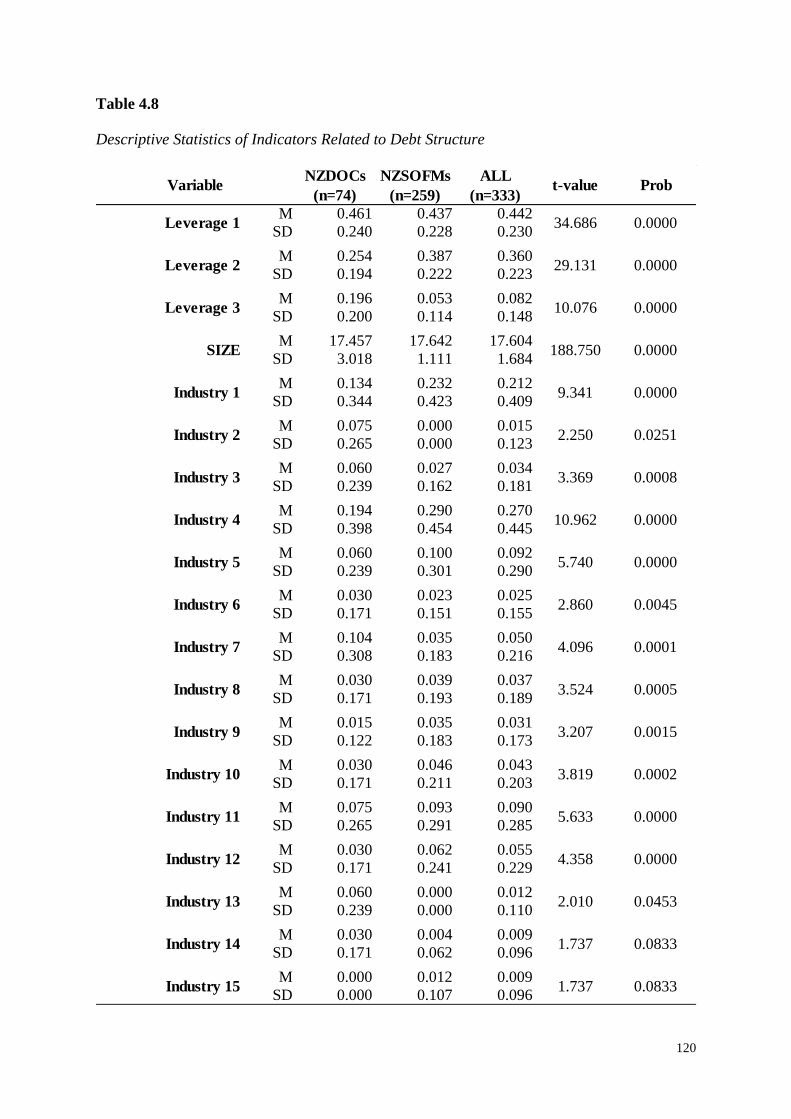
120
Table 4.8
Descriptive Statistics of Indicators Related to Debt Structure
NZDOCs NZSOFMs ALL
(n=74) (n=259) (n=333)
M 0.461 0.437 0.442
SD 0.240 0.228 0.230
M 0.254 0.387 0.360
SD 0.194 0.222 0.223
M 0.196 0.053 0.082
SD 0.200 0.114 0.148
M 17.457 17.642 17.604
SD 3.018 1.111 1.684
M 0.134 0.232 0.212
SD 0.344 0.423 0.409
M 0.075 0.000 0.015
SD 0.265 0.000 0.123
M 0.060 0.027 0.034
SD 0.239 0.162 0.181
M 0.194 0.290 0.270
SD 0.398 0.454 0.445
M 0.060 0.100 0.092
SD 0.239 0.301 0.290
M 0.030 0.023 0.025
SD 0.171 0.151 0.155
M 0.104 0.035 0.050
SD 0.308 0.183 0.216
M 0.030 0.039 0.037
SD 0.171 0.193 0.189
M 0.015 0.035 0.031
SD 0.122 0.183 0.173
M 0.030 0.046 0.043
SD 0.171 0.211 0.203
M 0.075 0.093 0.090
SD 0.265 0.291 0.285
M 0.030 0.062 0.055
SD 0.171 0.241 0.229
M 0.060 0.000 0.012
SD 0.239 0.000 0.110
M 0.030 0.004 0.009
SD 0.171 0.062 0.096
M 0.000 0.012 0.009
SD 0.000 0.107 0.096
Variable t-value Prob
Leverage 1 34.686 0.0000
Leverage 2 29.131 0.0000
Leverage 3 10.076 0.0000
SIZE 188.750 0.0000
Industry 1 9.341 0.0000
Industry 2 2.250 0.0251
Industry 3 3.369 0.0008
Industry 4 10.962 0.0000
Industry 5 5.740 0.0000
Industry 6 2.860 0.0045
Industry 7 4.096 0.0001
Industry 8 3.524 0.0005
Industry 9 3.207 0.0015
Industry 10 3.819 0.0002
Industry 11 5.633 0.0000
Industry 12 4.358 0.0000
Industry 13 2.010 0.0453
Industry 14 1.737 0.0833
Industry 15 1.737 0.0833

121
Table 4.9
Descriptive Statistics of Indicators Related to Distributions of EBIT
NZDOCs NZSOFMs ALL
(n=80) (n=259) (n=339)
M 0.228 0.074 0.109
SD 0.212 0.130 0.177
M 0.184 0.267 0.249
SD 0.146 0.089 0.110
M 0.588 0.658 0.642
SD 0.238 0.128 0.161
M 17.399 17.639 17.586
SD 3.036 1.110 1.729
M 0.122 0.231 0.207
SD 0.329 0.422 0.405
M 0.068 0.000 0.015
SD 0.253 0.000 0.122
M 0.054 0.027 0.033
SD 0.228 0.162 0.179
M 0.189 0.288 0.266
SD 0.394 0.454 0.443
M 0.081 0.104 0.099
SD 0.275 0.306 0.299
M 0.041 0.023 0.027
SD 0.199 0.150 0.162
M 0.095 0.035 0.048
SD 0.295 0.183 0.214
M 0.027 0.038 0.036
SD 0.163 0.193 0.186
M 0.014 0.035 0.030
SD 0.116 0.183 0.171
M 0.041 0.046 0.045
SD 0.199 0.210 0.207
M 0.095 0.092 0.093
SD 0.295 0.290 0.291
M 0.027 0.062 0.054
SD 0.163 0.241 0.226
M 0.054 0.000 0.012
SD 0.228 0.000 0.109
M 0.027 0.004 0.009
SD 0.163 0.062 0.094
M 0.000 0.011 0.009
SD 0.000 0.107 0.094
Variable t-value Prob
Interest expense ratio 11.232 0.0000
Income tax expense ratio 41.396 0.0000
Net profit ratio 72.855 0.0000
SIZE 185.897 0.0000
Industry 1 9.312 0.0000
Industry 2 2.250 0.0251
Industry 3 3.368 0.0008
Industry 4 10.999 0.0000
Industry 5 6.042 0.0000
Industry 6 3.037 0.0026
Industry 7 4.093 0.0001
Industry 8 3.523 0.0005
Industry 9 3.206 0.0015
Industry 10 3.957 0.0001
Industry 11 5.837 0.0000
Industry 12 4.355 0.0000
Industry 13 2.009 0.0453
Industry 14 1.737 0.0833
Industry 15 1.737 0.0833

122
Table 4.10
Descriptive Statistics of Indicators Related to Transfer Pricing
NZDOCs NZSOFMs ALL
(n=74) (n=259) (n=333)
M 0.130 0.137 0.137
SD 0.108 0.133 0.132
M 20.557 17.652 17.811
SD 1.296 1.102 1.294
M 0.067 0.233 0.223
SD 0.258 0.423 0.417
M - - -
SD - - -
M 0.067 0.027 0.029
SD 0.258 0.163 0.169
M 0.200 0.291 0.286
SD 0.414 0.455 0.453
M 0.133 0.105 0.106
SD 0.352 0.307 0.309
M 0.000 0.023 0.022
SD 0.000 0.151 0.147
M 0.133 0.035 0.040
SD 0.352 0.184 0.197
M 0.067 0.039 0.040
SD 0.258 0.193 0.197
M 0.000 0.031 0.029
SD 0.000 0.174 0.169
M 0.000 0.047 0.044
SD 0.000 0.211 0.205
M 0.133 0.093 0.095
SD 0.352 0.291 0.294
M 0.000 0.058 0.055
SD 0.000 0.234 0.228
M 0.067 0.000 0.004
SD 0.258 0.000 0.061
M 0.067 0.004 0.007
SD 0.258 0.062 0.085
M 0.000 0.012 0.011
SD 0.000 0.107 0.104
Variable t-value Prob
EBIT ratio 17.123 0.0000
SIZE 227.517 0.0000
Industry 1 8.847 0.0000
Industry 2 - -
Industry 3 2.866 0.0045
Industry 4 10.431 0.0000
Industry 5 5.686 0.0000
Industry 6 2.472 0.0140
Industry 7 3.379 0.0008
Industry 8 3.379 0.0008
Industry 9 2.866 0.0045
Industry 10 3.536 0.0005
Industry 11 5.351 0.0000
Industry 12 3.977 0.0001
Industry 13 1.000 0.3182
Industry 14 1.417 0.1577
Industry 15 1.738 0.0833

123
4.4.2 Multiple Linear Regressions for NZSOFMs and NZDOCs
The eight regression models in this study examine whether the status of foreign ownership,
while controlling for a firm’s size and industry, affects the specific ratios concerning debt
structures, distributions of operating income and transfer pricing.
More specifically, the regression analyses of the four ratios concerning debt structures and
three ratios concerning distributions of operating income involve NZSOFMs and NZDOCs
with or without foreign affiliates outside New Zealand. The eighth ratio of EBIT to sales
analyses NZSOFMs and NZDOMs with foreign affiliates only, as NZDOCs without affiliates
in other countries are unlikely to take advantage of intra-company transfer prices to reduce tax.
Table 4.11 to Table 4.13 report the regression results for the eight specific ratios. Table 4.11
displays the results concerning the debt structure. In the interest-bearing debt ratio sample, the
coefficient for the FOREIGN indicator is negative and significant at the 1 percent level.
However, the finding has a sign that is contrary to the expectations of this study. The result
indicates that NZSOFMs have lower interest-bearing debt relative to total assets than do
NZDOCs, after controlling for other factors.
With respect to the total debt relative to total assets (leverage 1), the FOREIGN coefficient is
negative, and not statistically significant. This suggests that there was no significant difference
found in the ratio of total debt to total assets for NZSOFMs and NZDOMs. In the sample of
leverage 2 (short-term debt relative to total assets), the coefficient for the FOREIGN indicator
is positive and significant at the 1 percent level, and thus H3 is not rejected. NZSOFMs tend to
have more current debt than NZDOCs. A possible explanation for NZSOFMs financing with
more short-term debt is that short-term debt, which is expected to be paid in the current year,
offers a more flexible form of financing, and thus is a more viable option to be employed for
profit shifting. In addition, NZSOFMs operate outside their home countries might not be able

124
to obtain long-term loans easily as it is riskier for creditors to grant credit for a long period of
time. Generally, short-term loans are much easier to obtain but come with a higher interest rate.
The FOREIGN coefficient in the sample of leverage 3 is negative and significant at the 1
percent level. It shows that NZSOFMs have less long-term debt in their capital structure in
comparison to NZDOCs.
In this study, the operating income (or EBIT) is calculated by adding back interest expense and
income tax expense to the net profit. In the sample of interest expense ratio, the coefficient for
FOREIGN is negative and significant at the 1 percent level. This result is consistent with that
for the interest-bearing debt ratio regression model. NZSOFMs have lower interest-bearing
debt, hence they incur lower interest expense than NZDOCs. In the sample of income tax
expense ratio and net profit ratio, both the coefficients for the FOREIGN indicator are positive
and significant at the 1 percent level. The results show that the income tax expense and net
profit of NZSOFMs are relatively higher than NZDOCs. It suggests that NZSOFMs transform
interest into profits, while they incur much more income tax than do NZDOCs. In the ratio of
EBIT to sales sample, the coefficient for the FOREIGN indicator is zero and there is no
statistical significance. This implies that there is no difference between NZSOFMs and
NZDOCs in terms of the ratio of EBIT to sales.
In conclusion, the non-significant finding for the ratio of total debt to total assets and the ratio
of EBIT to sales obtained from the regression analysis indicates a lack of evidence against the
null hypothesis, and thus fails to reject the null hypothesis. While the regression results for the
rest of the six specific ratios are statistically significant, only the result for the ratio of short-
term debt to total assets reveals a trending in the predicted direction.

125
Table 4.11
Multiple Regression Results of Indicators Related to Debt Structure
SD SD SD SDC –0.24 ** 0.10 –0.33 ** 0.15 –0.20 0.15 –0.10 0.09
FOREIGN –0.12 *** 0.02 –0.03 0.03 0.10 *** 0.03 –0.11 *** 0.02SIZE 0.03 *** 0.01 0.04 *** 0.01 0.02 ** 0.01 0.02 *** 0.01
Industry 1 –0.04 0.05 –0.04 0.01 0.07 0.08 –0.10 ** 0.05Industry 2 –0.02 0.15 –0.02 0.08 –0.07 0.22 –0.01 0.13Industry 3 –0.06 0.07 0.15 0.10 0.27 ** 0.10 –0.12 ** 0.06Industry 4 –0.02 0.05 0.05 0.08 0.17 ** 0.08 –0.13 ** 0.05Industry 5 –0.04 0.06 0.08 0.09 0.20 ** 0.09 –0.13 ** 0.05Industry 6 0.02 0.07 0.17 0.12 0.24 ** 0.12 –0.08 0.07Industry 7 0.02 0.06 0.17 * 0.09 0.15 * 0.09 –0.03 0.06Industry 8 –0.06 0.06 0.10 0.09 0.20 ** 0.09 –0.04 0.06Industry 9 –0.06 0.07 0.09 0.10 0.15 0.10 –0.07 0.06Industry 10 0.16 ** 0.06 0.17 * 0.09 0.16 * 0.09 0.00 0.06Industry 11 –0.10 0.06 0.05 0.09 0.18 ** 0.08 –0.14 ** 0.05Industry 12 –0.07 0.06 0.07 0.09 0.19 ** 0.09 –0.13 ** 0.05Industry 13 0.02 0.11 0.16 0.14 0.31 ** 0.14 –0.14 * 0.09Industry 14 –0.10 0.11 –0.01 0.17 0.17 0.16 –0.19 * 0.10Industry 15 –0.07 0.10 0.06 0.14 0.19 0.14 –0.14 0.09No. of Obs 339 333 333 333R-Squared .29 .17 .13 .29
Adj. R-Squared .25 .12 .10 .25
Notes. SIZE is the natural logarithm of company sales. FOREIGN is a binary variable which takes the value of 1 if the company is a NZSOFM, and
0 otherwise. * indicates significant at the 0.10 level. ** indicates significant at the 0.05 level. *** indicates significant at the 0.01 level.
Coef. Coef. Coef. Coef.Total assets Total assets Total assets Total assets
OLS Regression ModelCross section 2015
NZSOFMs vs NZDOCsInterest-bearing debt Total debt Short-term debt Long-term debt
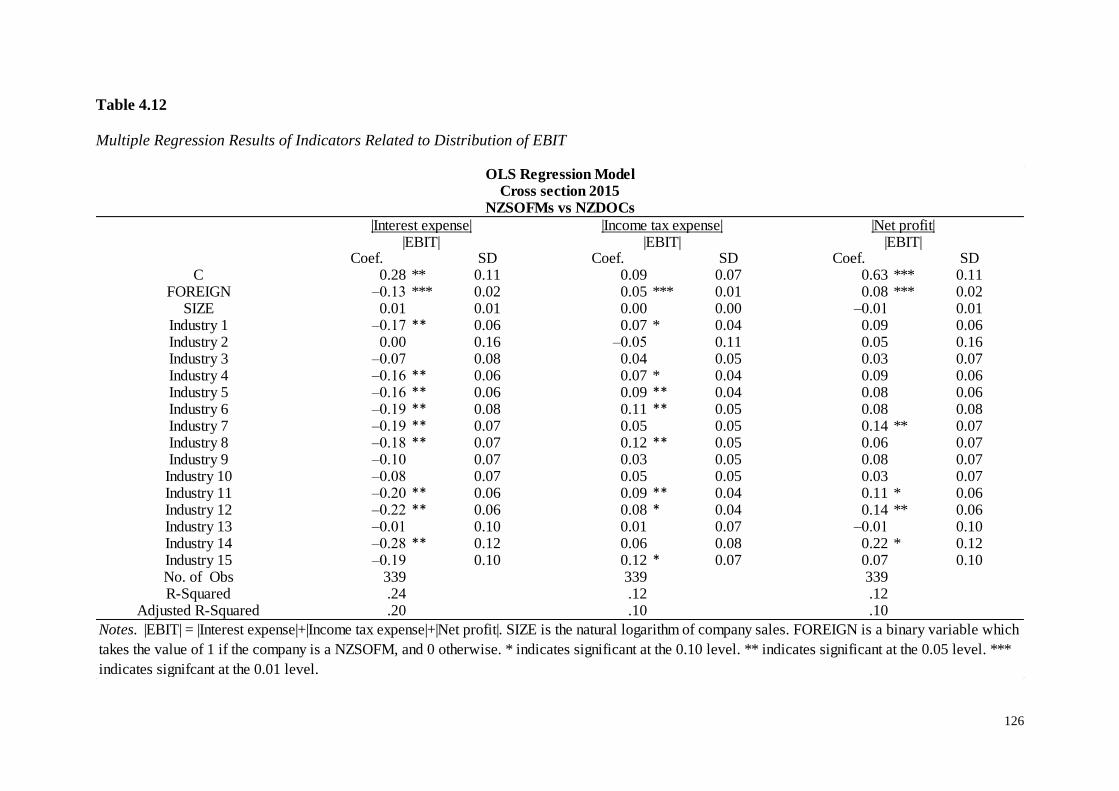
126
Table 4.12
Multiple Regression Results of Indicators Related to Distribution of EBIT
SD SD SDC 0.28 ** 0.11 0.09 0.07 0.63 *** 0.11
FOREIGN –0.13 *** 0.02 0.05 *** 0.01 0.08 *** 0.02SIZE 0.01 0.01 0.00 0.00 –0.01 0.01
Industry 1 –0.17 ** 0.06 0.07 * 0.04 0.09 0.06Industry 2 0.00 0.16 –0.05 0.11 0.05 0.16Industry 3 –0.07 0.08 0.04 0.05 0.03 0.07Industry 4 –0.16 ** 0.06 0.07 * 0.04 0.09 0.06Industry 5 –0.16 ** 0.06 0.09 ** 0.04 0.08 0.06Industry 6 –0.19 ** 0.08 0.11 ** 0.05 0.08 0.08Industry 7 –0.19 ** 0.07 0.05 0.05 0.14 ** 0.07Industry 8 –0.18 ** 0.07 0.12 ** 0.05 0.06 0.07Industry 9 –0.10 0.07 0.03 0.05 0.08 0.07Industry 10 –0.08 0.07 0.05 0.05 0.03 0.07Industry 11 –0.20 ** 0.06 0.09 ** 0.04 0.11 * 0.06Industry 12 –0.22 ** 0.06 0.08 * 0.04 0.14 ** 0.06Industry 13 –0.01 0.10 0.01 0.07 –0.01 0.10Industry 14 –0.28 ** 0.12 0.06 0.08 0.22 * 0.12Industry 15 –0.19 0.10 0.12 * 0.07 0.07 0.10No. of Obs 339 339 339R-Squared .24 .12 .12
Adjusted R-Squared .20 .10 .10
|EBIT| |EBIT| |EBIT|
Notes. |EBIT| = |Interest expense|+|Income tax expense|+|Net profit|. SIZE is the natural logarithm of company sales. FOREIGN is a binary variable which
takes the value of 1 if the company is a NZSOFM, and 0 otherwise. * indicates significant at the 0.10 level. ** indicates significant at the 0.05 level. ***
indicates signifcant at the 0.01 level.
Cross section 2015NZSOFMs vs NZDOCs
OLS Regression Model
|Interest expense| |Income tax expense| |Net profit|
Coef. Coef. Coef.

127
Table 4.13
Multiple Regression Results of Indicators Related to Transfer Pricing
4.5 Summary of the Statistical Results
This chapter provides and discusses the major findings of the quantitative research. As
mentioned in the introduction to the chapter, the data are collected in order to reveal the
underlying patterns of the profit shifting activities of NZSOFMs and NZDOMs individually.
This chapter mainly discussed the statistical analyses and the associated outcomes of
NZSOFMs, while the statistical findings of the unrepresentative sample of NZDOMs can be
SDC 0.34 *** 0.10
FOREIGN 0.00 0.02SIZE –0.01 ** 0.01
Industry 1 –0.01 0.05Industry 2 0.01 0.14Industry 3 –0.03 0.09Industry 4 –0.05 0.05Industry 5 0.00 0.05Industry 6 0.03 0.07Industry 7 0.01 0.06Industry 8 –0.01 0.06Industry 9 0.09 0.06Industry 10 0.17 ** 0.06Industry 11 0.03 0.05Industry 12 –0.05 0.06Industry 13 –0.08 0.13Industry 14 0.09 0.10Industry 15 –0.10 0.09No. of Obs 333R-Squared .16
Adjusted R-Squared .11
Sales
Notes. SIZE is the natural logarithm of company sales. FOREIGN is
a binary variable which takes the value of 1 if the company is a
NZSOFM, and 0 otherwise. * indicates significant at the 0.10 level.
** indicates significant at the 0.05 level. *** indicates signifcant at
the 0.01 level.
OLS Regression ModelCross section 2015
NZSOFMs vs NZDOCs
EBIT
Coef.

128
found in the appendices. On the other hand, it is worth mentioning that the expected results
from the statistical analyses for debt shifting in Section 4.4 are largely different from the
obtained results. This anomaly may be due to weaknesses in the research design that are caused
by the availability of the data. The next chapter, Chapter 5, looks closely into the findings and
provides explanations and implications of the findings.

129
Chapter 5 Limitations, Contributions, Recommendations, and Conclusions
5.1 Introduction
This final chapter first gives an overview of the thesis by revisiting the main purpose of the
study in Section 5.2. Following this, Section 5.3 summarises the major findings in the study
and provides discussions and explanations related to the findings. Section 5.4 outlines the
inherent limitations when carrying out the study. This is followed by the research contributions
to the literature in Section 5.5, and the recommendations for future study are set out in Section
5.6. Finally, Section 5.7 presents some closing thoughts.
5.2 Thesis Overview
International corporate tax avoidance by large corporations has always been a controversial
topic which is constantly covered by the press. Media reporting tends to use one or two high-
profile multinational corporations as extreme examples to show the corporate tax avoidance
problems that are most likely to capture reader interest and dominate public discussion. The
exemplar (or anecdotal evidence) is often a single piece of evidence chosen from a large sample
of cases used as statistical evidence. The anecdotal evidence based on extreme cases has a
strong impact on how people perceive tax avoidance issues. In general, the public believes that
the tax avoidance phenomenon is widespread.
The current statistical evidence of BEPS reasonably suggests that the profit shifting varies
across studies that were conducted in different countries. This study has sought to evaluate the
magnitude of BEPS in New Zealand, considering the lack of more extensive current literature
and relevant empirical findings of BEPS that truly reflect the extent of BEPS in this country.
130
5.3 Summary of Findings
Contrary to popular opinion and the findings of the latest studies in non-New Zealand context
(e.g., Dischinger, 2007, 2010; Dischinger, Knoll, & Riedel, 2013; Barrios & d’Andria, 2018;
Li & Tran, 2020), the overall empirical results in this study indicate that the magnitude of BEPS
is fairly low in the New Zealand context. In considering the profit shifting of NZSOFMs,
Specification 5 demonstrates a statistically significant negative effect of tax difference to the
immediate parent on profit before taxation of NZSOFMs. However, the coefficient estimate of
–0.03, which indicates that a 1 percentage point decrease in the tax rate differential leads to a
0.03 percent increase of profits reported by NZSOFMs, is reasonably small.
The most adequate specification in this study (Specification 8), which regresses the reported
pre-tax profits of NZSOFMs on the tax difference to the immediate parent and on the firm and
country variables, revealed a non-significant trend in the predicted direction with a coefficient
estimate of –0.01. However, the non-significant findings in the study cannot be interpreted as
evidence for the complete absence of the effect of interest (which is BEPS in this study).67
According to Mehler, Edelsbrunner, and Matić (2019), the null findings could merely reflect
that the effect might be approaching zero, and are thus deemed to be absent, or that the evidence
in the study is insufficiently strong and thus undermining the effect sizes. Therefore, non-
significant results in a study are still relevant and essential in validating theories and hypotheses.
Although there is no direct evidence showing that the “big tech”68 companies are involved
extensively in profit shifting and contributing to a higher magnitude of BEPS, a low level of
profit shifting in New Zealand has been identified from a sample study, which precluded the
67 Statistical significance determines how reliable the research results are, and the results generated by testing are
not due to chance. On the flip side, effect size indicates how important the results are. The sample size, the
significance level and the effect size together determine the statistical power of a significance test. 68 In general, the term “big tech” refers to the largest and most prominent American companies in the industry of
information technology. They include Amazon, Apple, Facebook, Google, and Microsoft.

131
big tech MNEs such as Facebook, Google, Amazon as they do not meet the study requirements.
Facebook is omitted because it was established in New Zealand in 2010 and its first financial
statements were published in 2015. The same happens with two New Zealand subsidiaries
ultimately held by Amazon which were newly incorporated in 2013 and 2018, respectively.
Google, which suffered 4-year pre-tax losses during the sample period of 2008 to 2017, was
excluded as well. However, the study includes two big tech companies such as Apple and
Microsoft. The final sample of NZSOFMs is listed in the appendices (see Appendix H) to allow
evaluation of the overall quality of the study.
Another possible explanation for the small magnitude of BEPS in this study is that the tax rate
differentials do not incentivise NZSOFMs to shift profits. According to Dischinger (2007), a
large discrepancy in national tax rates among neighbouring states in Europe, provides MNEs
with favourable circumstance to move profits from high-tax regimes to low-tax regimes.
However, nearly half of the New Zealand subsidiaries in the sample are owned by Australian
immediate parents where the statutory corporate tax rate of Australia and New Zealand is
almost identical (30 percent vs 28 percent). This makes profit shifting between these two
countries largely unrewarded.
Tax avoidance involves various potential costs, although this is generally believed to enhance
investors’ value as the reduction of taxes paid is traditionally considered as a relocation of
value from the government to shareholders. More specifically, political and reputational costs
are largely related to tax avoidance. Tax aggressive MNEs would easily attract media scrutiny,
which may lead to tighter regulatory assessment including legislative requirements.
Consequently, MNEs would incur compliance costs in conforming with tax authorities’
auditing, as this requires direct time and financial cost. Profit shifting activities among affiliated
companies of a large corporation would also give rise to efficiency costs and implementation
costs. The substantial costs related to profit shifting may cancel out the benefits of tax savings.

132
In addition, this study expected to find significantly low tax effects on BEPS using data
aggregated at the micro-level. Existing studies found that a micro database is always associated
with a smaller magnitude of BEPS. Nevertheless, the estimation measures using firm data in
this study are in line with the guidelines of the OECD on enhancing BEPS analyses. A shifting
preference for firm-level data has been observed in recent academic studies. Firm-level studies
have been considered better in identifying and controlling for most of the non-tax factors of
firms.
The statutory corporate tax rates where an affiliated firm is based are commonly used to explain
variations in reported profits of affiliated companies although the statutory tax rate difference
of a subsidiary from its foreign parent is a more accurate explanatory variable. This study found
that the local corporate tax rate of the host country (New Zealand) itself has a greater effect on
reported profits of NZSOFMs, as compared to the bilateral tax rate differential between the
host country and the home country. NZSOFMs were found to be more responsive to the host
country’s corporate tax level, and the results show that the New Zealand corporate tax rate is
inversely related to the pre-tax profits of NZSOFMs. An explanation could be that the local
business environment, is an “immediate” environment which has a direct influence on a
company’s business decisions, including tax planning strategies.
The independent sample t-test in the second part of the study shows that NZSOFMs are larger
than NZDOCs in term of firm size. In particular, the results of independent sample t-tests find
that NZSOFMs have a lower ratio of total debt to total assets as compared to NZDOCs, while
the regression analysis shows that the FOREIGN indicator is not statistically significantly
related to the ratio of total debt to total assets. The result shows that NZSOFMs do not rely on
debt financing to a greater extent than do NZDOCs. While the aggressive debt policy does not
necessarily imply profit shifting, this study found that NZSOFMs that are relatively larger in
size are less leveraged than NZDOCs. It indicates that the use of debt financing is not solely

133
determined by tax, although tax savings are the most prominent reason in deciding the capital
structure of a multinational company.
According to Graham (2000), the “conservative leverage puzzle” has been a prevalent topic in
the literature of corporate finance that keeps baffling researchers. However, on average,
companies do not maximise their debt level than when they could in order to attain the greatest
possible tax advantages. The costs of debt, especially financial distress costs and non-debt tax
shields counterbalance the tax benefits of taking on a high level of debt. As opposed to
NZDOCs, NZSOFMs incurred less interest expense, thus reporting a higher net profit. Low
interest expense indicates fewer deductible payments to shift profit out of New Zealand, and
thereby the income tax expenses and net profits of NZSOFMs are relatively higher than those
of NZDOCs.
The regression analysis indicated that foreign ownership is not significantly related to the ratio
of EBIT to sales. It shows that NZSOFMs do not differ from NZDOCs in term of transfer
pricing. In any case, transfer pricing manipulation is difficult to observe as intra-group
transactions within MNEs are not easily detected using publicly available data. This study
cannot find any indication that NZSOFMs engaged in more transfer pricing than NZDOCs.
5.4 Limitations of the Study
Inevitably, this study is also subject to a number of research limitations and some of them have
been mentioned throughout the study.
First, New Zealand companies are poorly represented in the large databases such as Orbis.
While the company financial statements are publicly available, the data is restricted to
companies that have statutory obligations to file financial statements, and the financial data
and company information are unconsolidated, and they must be collected and compiled
manually. This factor limited the research design and restricted the sample selection of New

134
Zealand companies. The purposive sampling employed in this study limits the observational
units of the study to well-established MNEs with financial statements only, without including
other forms of business such as partnerships, trusts, etc. Although the sampling is imperfect
and, as such, the findings cannot be generalised over the whole population of business entities
in New Zealand, the sample still sufficiently represents the cross-border MNEs that are most
likely to involved in BEPS activities.
Another limitation of this study involves the missing information in the primary financial
statements. This study relies on financial statements in obtaining data for empirical analysis.
However, the content and structure of the financial statements may vary between different
companies as the aggregation level at which financial information is presented is at the
discretion of the statutory reporting entities. Missing values are not uncommon, even in well-
designed research. However, missing data fields in the financial statements could lead to
underestimation of profit shifting activities.
Apart from that, the industry identification and classification of companies in the second part
of the study may not accurately reflect their main business activities. This is because the
industry classification of each company is not readily available, hence the industry code of the
companies is categorised manually, based on the decision of the researcher according to the
business information available on the latest financial statements.
The direct comparison between NZSOFMs and NZDOCs on eight specific ratios in this study
is fairly simple, although the analyses have controlled for company size and industry. There
are various systematic differences between these two groups of companies. Propensity score
matching (PSM) is a statistical matching technique which has become increasingly recognised,
and which has been employed in numerous recent studies (e.g., Hansson, Olofsdotter, & Thede,
2016; Li & Tran, 2020) to match treatment and control groups with similar characteristics in
order to reduce selection bias. However, this approach has not been feasible in this study as the

135
number of comparable NZDOCs (non-treated groups) is too small to match the NZSOFMs
(treated groups).
Since this is a single-country study using exclusively New Zealand data, the findings may not
be widely and generally applicable to other countries. As a result, the statistical approach of
the study was not sufficiently comprehensive to examine the complex profit shifting.
5.5 Theoretical and Practical Contributions
To the best of the researcher’s knowledge, Australasian research on profit shifting, especially
research that focuses primarily on New Zealand, is scarce. The sparse New Zealand database,
which provides relatively minimal tax information, restricts research and analysis of BEPS
using mathematical and statistical techniques. Research on this topic from this new perspective
using more current data is still under-represented in New Zealand. As there is a lack of
empirical studies on profit shifting in the New Zealand context, the findings from this study
are particularly noteworthy. This study demonstrates how statistical methods can be applied to
quantify BEPS phenomena in this country using observed data. Nonetheless, this study is
interdisciplinary in orientation, bringing together different aspects of taxation in understanding
profit shifting problem in New Zealand.
This single-country based study also contributes to the public, political and academic debate as
to how serious the profit shifting issues are in a specific country, which is New Zealand. The
empirical findings of the profit shifting of NZSOFMs are comparable to the estimates in other
studies that measured the profit shifting effects on the same or similar scale (see Appendix A
for semi-elasticity coefficient toward corporate tax rate difference). Comparing the BEPS
issues in New Zealand to those in other jurisdictions could help to develop knowledge about
BEPS in a systematic way.

136
Empirical studies are crucial to improving knowledge of tax policy making as effective policy
recommendations require evidence. The empirical evidence presented in this study helps
government policymakers in devising sensible, evidence-based tax policies, making policy
measures more reliable.
Last but not least, the systematic identification and segregation of MNEs into NZDOMs and
NZSOFMs in this study, can be adopted in other disciplines in researching specifically large
multinationals operating in New Zealand. The sampling of large multinational entities in New
Zealand could be time consuming and laborious due to constrained sources of information. The
most relevant open sources include the Forbes Global 2000, which identifies the largest public
companies worldwide according to sales, profits, market value and assets of the companies,
and the Deloitte Top 200, which ranked New Zealand publicly listed and even unlisted firms
according to the company revenue. None of these sources provide a complete data source for
MNEs in New Zealand. The well-planned sampling strategies in this study helps researchers
in determining and sourcing large entities in New Zealand based on different sets of criteria
and thresholds.
5.6 Recommendations for Future Research
The Taxation (Neutralising Base Erosion and Profit Shifting) Act was enacted in 2018, after
the launch of 15-point OECD BEPS Action Plan (BEPS 1.0) in 2016, bringing the BEPS
initiatives into New Zealand domestic legislation. Subsequently, the BEPS 2.0 measures were
introduced in 2019. Future studies can go beyond the research period of this study (2008–2017),
in exploring the more current state of profit shifting using post-BEPS data. The reduction in
the US federal corporate tax rate from 35 percent to 21 percent under the TCJA Act may also
altered the global profit shifting landscape. So, the future studies can explore the latest
international tax environment using post-TCJA data.

137
The study finds that analytical research employing mathematical and statistical techniques is
barely covered in the tax literature of New Zealand and Australia. The study was conducted
with limited reference resources, especially in New Zealand context. Researchers who are
devoted to examining this international tax issues in New Zealand may consider adopting the
analytical method in their future studies.
The major concerns of the BEPS problem lie with the tax collection of the government around
the world. After all, the most fundamental function of these involuntary levies is to contribute
to government finances in providing for public expenditure, although it also serves other
purposes, such as redistribution of income and wealth. Future studies could also explore the
BEPS issue from different aspects, such as examining tax gains or losses in order to validate
the findings of this study.
In the sample selection process, nearly half of the loss-making companies have been left out in
examining the shifting of profit, and this includes several companies making continuous nine
to ten years pre-tax loss during the sample period of 2008–2017. From a business perspective,
companies that are consistently incurring income deficits are not financially viable in the long
run. A large exclusion of loss-making NZSOFMs from the study may introduce a downward
bias on the estimates of profit shifting as companies running at a loss could also be involved in
lowering taxable income to avoid tax payments. This study has discussed why loss making
companies may be involved in tax avoidance. It suggests that future research could examine
BEPS issues by looking beyond profitable companies.
Future research can also go beyond this single-country study of New Zealand’s tax setting by
conducting a cross-country comparison of profit shifting issues between New Zealand and
other jurisdictions in the same region or with similar economic characteristics.

138
5.7 Concluding Remarks
The statistical evidence summarised from the datasets reveals that the magnitude of BEPS in
New Zealand is small, compared to the main findings of the existing studies in other countries.
Every country has its sovereign right to determine its own discrete global tax policies and to
adopt its own BEPS recommendations. So, it is not surprising that the degree of BEPS at a
domestic level could vary across different countries.
Furthermore, BEPS initiatives target mainly “large” MNEs. The CbC reporting requirements
as well as the latest global 15 percent minimum tax rate, apply to large multinationals with
consolidated global revenues of more than EUR 750 million. There are not many large MNEs
in New Zealand, based on the definition of OECD BEPS definition of “large” entities.
It is also interesting to note that the small sample size of 16 NZDOMs is not due to constraints
of data. A large number of New Zealand owned multinationals, which were eliminated in the
sampling process, are Crown entities, SOEs, or HNWI. They are not part of the central focus
of this BEPS study.
Lastly, this study indicates that BEPS issues might be restricted to a few extreme examples of
large MNEs. The stringent tax policies and legislation applicable to all companies might create
unmanageable compliance costs and tax burdens for compliant companies. The tax authorities
should give careful consideration to the magnitude of BEPS when undertaking or adopting any
new measures or devising any tax policies.

139
Bibliography
Journal Articles
Adam, A., Kammas, P., & Lagou, A. (2013). The effect of globalization on capital taxation:
What have we learned after 20 years of empirical studies? Journal of
Macroeconomics, 35(March), 199–209. https://doi.org/10.1016/j.jmacro.2012.09.003
Azémar, C. (2010). International corporate taxation and US multinationals' behaviour: An
integrated approach. The Canadian Journal of Economics,43(1), 232–253.
Becker, J., & Riedel, N. (2012). Cross-border tax effects on affiliate investment: Evidence
from European multinationals. European Economic Review, 56(3), 436–450.
https://doi.org/10.1016/j.euroecorev.2011.11.004
Beer, S., & Loeprick, J. (2014). Profit shifting: Drivers of transfer (mis)pricing and the
potential of countermeasures. International Tax and Public Finance, 22(3), 426–451.
https://doi.org/10.1007/s10797-014-9323-2
Bennedsen, M., & Zeume, S. (2018). Corporate tax havens and transparency. The Review of
Financial Studies, 31(4), 1221–1264. https://doi.org/10.1093/rfs/hhx122
Bilicka, K., & Seidel, A. (2020). Profit shifting and corruption. International Tax and Public
Finance, 27(5), 1051–1080. https://doi.org/10.1007/s10797-020-09596-4
Blessing, P. (2012). The debt-equity conundrum: A prequel. Bulletin for International
Taxation, 66(4/5), 198–212.
Bokulic, C., Henry, E., & Plesko, G. A. (2012). Reconciling global financial reporting with
domestic taxation. National Tax Journal, 65(4), 933–959.
https://doi.org/10.17310/ntj.2012.4.11
Bolwijn, R., Casella, B., & Rigo, D. (2018). An FDI-driven approach to measuring the scale
and economic impact of BEPS. Transnational Corporations, 25(2),107–143.
https://doi.org/10.18356/c4f9fd3c-en

140
Bradbury, D., Hanappi, T., & Moore, A. (2018). Estimating the fiscal effects of base erosion
and profit shifting: Data availability and analytical issues. Transnational
Corporations, 25(2), 91–106. https://doi.org/10.18356/e1d7a8b4-en
Brown, R., Lim, Y., & Evans, C. (2020). The impact of full franking credit refundability on
corporate tax avoidance. eJournal of Tax Research, 17(2), 134–167.
Buettner, T., Overesch, M., Schreiber, U., & Wamser, G. (2012). The impact of thin-
capitalisation rules on the capital structure of multinational firms. Journal of Public
Economics, 96(11–12), 930–938. https://doi.org/10.1016/j.jpubeco.2012.06.008
Chen, S., Schuchard, K., & Stomberg, B. (2018). Media coverage of corporate taxes. The
Accounting Review, 94(5), 83–116. https://doi.org/10.2308/accr-52342
Christians, A. (2017). Distinguishing tax avoidance and evasion: Why and how. Journal of
Tax Administration, 3(2), 5–21.
Clausing, K. A. (2009). Multinational firm tax avoidance and tax policy. National Tax
Journal, 62(4), 703–725. https://doi.org/10.17310/ntj.2009.4.06
Clausing, K. A. (2015). Beyond territorial and worldwide systems of international taxation.
Journal of International Finance and Economics, 15(2), 43–58.
http://dx.doi.org/10.18374/JIFE-15-2.5
Clausing, K. A. (2016). The effect of profit shifting on the corporate tax base in the United
States and beyond. National Tax Journal, 69(4), 905–934.
https://doi.org/10.17310/ntj.2016.4.09
Clemente-Almendros, J. A., & Sogorb-Mira, F. (2018). Costs of debt, tax benefits and a new
measure of non-debt tax shields: Examining debt conservatism in Spanish listed firms.
Spanish Accounting Review, 21(2), 162–175.
https://doi.org/10.1016/j.rcsar.2018.05.001
Collins, J., Kemsley, D., & Lang, M. (1998). Cross-jurisdictional income shifting and
earnings valuation. Journal of Accounting Research, 36(2), 209–229.
https://doi.org/10.2307/2491475

141
De Mooij, R. A., & Ederveen, S. (2008). Corporate tax elasticities: A reader’s guide to
empirical findings. Oxford Review of Economic Policy, 24(4), 680–697.
https://doi.org/10.1093/oxrep/grn033
Dharmapala, D., & Riedel, N. (2013). Earnings shocks and tax-motivated income shifting:
Evidence from European multinationals. Journal of Public Economics, 97(C), 95–
107.
Dischinger, M., & Riedel, N. (2011). Corporate taxes and the location of intangible assets
within multinational firms. Journal of Public Economics, 95(7–8), 691–707.
https://doi.org/10.1016/j.jpubeco.2010.12.002
Dischinger, M., Knoll, B., & Riedel, N. (2013). The roles of headquarters in multinational
profit shifting strategies. International Tax and Public Finance, 21(2), 248–271.
https://doi.org/10.1007/s10797-012-9265-5
Dyreng, S., & Markle, K. (2016). The effect of financial constraints on income shifting by
US multinationals. The Accounting Review, 91(6), 1601–1627.
https://doi.org/10.2308/accr-51420
Egger, P., Eggert, W., Keuschnigg, C., & Winner, H. (2010). Corporate taxation, debt
financing and foreign-plant ownership. European Economic Review, 54(1), 96–107.
https://doi.org/10.1016/j.euroecorev.2009.06.007
Evertsson, N. (2016). Corporate tax avoidance: A crime of globalisation. Crime, Law and
Social Change, 66(2), 199–216. https://doi.org/10.1007/s10611-016-9620-z
García-Herrero, A., & Tan, J. (2020). Deglobalisation in the context of United States–China
decoupling. Policy Contribution, 21, 1–16.
Glass, G. V. (1976). Primary, secondary and meta-analysis of research. Educational
Researcher, 5(10), 3–8. https://doi.org/10.3102/0013189x005010003
Graham, J. R. (2000). How big are the tax benefits of debt? The Journal of Finance, 55(5),
1901–1941. https://doi.org/10.1111/0022-1082.00277
142
Grubert, H. (2003). Intangible income, intercompany transactions, income shifting, and the
choice of location. National Tax Journal, 56(1.2), 221–242.
https://doi.org/10.17310/ntj.2003.1s.05
Grubert, H. (2012). Foreign taxes and the growing share of US multinational company
income abroad: Profits, not sales, are being globalised. National Tax Journal, 65(2).
247–281. https://doi.org/10.17310/ntj.2012.2.01
Grubert, H., & Mutti, J. (1991). Taxes, tariffs and transfer pricing in multinational corporate
decision making. The Review of Economics and Statistics, 73(2), 285–293.
https://doi.org/10.2307/2109519
Hines, J. R. (2014). How serious is the problem of base erosion and profit shifting? Canadian
Tax Journal, 62(2), 443–453. Retrieved from
https://repository.law.umich.edu/cgi/viewcontent.cgi?referer=&httpsredir=1&article=
2378&context=articles
Hines, J. R., & Rice, E. M. (1994). Fiscal paradise: Foreign tax havens and American
business. Quarterly Journal of Economics, 109(1), 149–182.
https://doi.org/10.2307/2118431
Hoffman, W. H. (1961). The theory of tax planning. The Accounting Review, 36(2), 274–281.
Hornikx, J. (2018). Combining anecdotal and statistical evidence in real-life discourse:
Comprehension and persuasiveness. Discourse Processes, 55(3), 324–336.
https://doi.org/10.1080/0163853X.2017.1312195
Hudson, L. A., & Ozanne, J. L. (1988). Alternative ways of seeking knowledge in consumer
research. Journal of Consumer Research, 14(4), 508–521.
https://doi.org/10.1086/209132
Huizinga, H., & Laeven, L. (2008). International profit shifting within multinationals: A
multi-country perspective. Journal of Public Economic, 92(5–6), 1164–1182.
https://doi.org/10.1016/j.jpubeco.2007.11.002

143
Hunter, L., & Leahey, E. (2008). Collaborative research in sociology: Trends and
contributing factors. The American Sociologist, 39(4), 290–306.
https://doi.org/10.1007/s12108-008-9042-1
Janský, P., & Palanský, M. (2019). Estimating the scale of profit shifting and tax revenue
losses related to foreign direct investment. International Tax and Public
Finance,26(5), 1048–1103. https://doi.org/10.1007/s10797-019-09547-8
Kandil, N., Battaïa, O., & Hammami, R. (2020). Globalisation vs. slowbalisation: A literature
review of analytical models for sourcing decisions in supply chain management.
Annual Reviews in Control, 49, 277–287.
https://doi.org/10.1016/j.arcontrol.2020.04.004
Karkinsky, T., & Riedel, N. (2012). Corporate taxation and the choice of patent location
within multinational firms. Journal of International Economics, 88(1), 176–185.
https://doi.org/10.1016/j.jinteco.2012.04.002
Kim, H., Li, P., & Lee, Y. R. (2020). Observations of deglobalisation against globalisation
and impacts on global business. International Trade, Politics and Development, 4(2),
83–103. https://doi.org/10.1108/ITPD-05-2020-0067
Klassen, K. J., & Laplante, S. K. (2012). Are US multinational corporations becoming more
aggressive income shifters? Journals of Accounting Research, 50(5), 1245–1285.
https://doi.org/10.1111/j.1475-679x.2012.00463.x
Kleinbard, E. D. (2011). Stateless income. Florida Tax Review, 11(9), 700–773.
Lapid, Y. (1989). The third debate: On the prospects of international theory in a post-
positivist era. International Studies Quarterly, 33(3), 235–254.
https://doi.org/10.2307/2600457
Lenter, D., Slemrod, J., & Shackelford, D. (2003). Public disclosure of corporate tax return
information: Accounting, economics, and legal perspective. National Tax Journal,
56(4), 803–830. https://doi.org/10.17310/ntj.2003.4.06

144
Letourneau, N., & Allen, M. (1999). Post-positivistic critical multipluralism: A beginning
dialogue. Journal of Advanced Nursing, 30(3), 623–630.
https://doi.org/10.1046/j.1365-2648.1999.01133.x
Li, X., & Tran, A. (2020). An empirical study on cross-border profit shifting in Australia.
eJournal of Tax Research, 17(2), 193–232.
Lipsey, R. E. (2010). Measuring the location of production in a world of intangible
productive assets, FDI, and intrafirm trade. Review of Income and Wealth, 56(1), 99–
110. https://doi.org/10.1111/j.1475-4991.2010.00385.x
Maffini, G., & Mokkas, S. (2011). Profit shifting and measured productivity of multinational
firms. Oxford Bulletin of Economics and Statistics, 73(1), 1–20.
https://doi.org/10.1111/j.1468-0084.2010.00610.x
Markle, K. (2012). A comparison of the tax-motivated income shifting of multinationals in
territorial and worldwide countries. Contemporary Accounting Research, 33(1), 7–43.
https://doi.org/10.1111/1911-3846.12148
McKerchar, M. A. (2008). Philosophical paradigms, inquiry strategies and knowledge claims:
Applying the principles of research design and conduct to taxation. eJournal of Tax
Research, 6(1), 5–22.
Mehler, D. M. A., Edelsbrunner, P. A., & Matić, K. (2019). Appreciating the significance of
non-significant findings in psychology. Journal of European Psychology Students,
10(4), 1–7. https://doi.org/10.5334/e2019a
Mills, L., & Newberry, K. (2004). Do foreign multinationals' tax incentives influence their US
income reporting and debt policy? National Tax Journal, 57(1), 89–107.
https://doi.org/10.17310/ntj.2004.1.05
Mourougan, S., & Sethuraman, K. (2017). Hypothesis development and testing. IOSR
Journal of Business and Management (IOSR-JBM), 19(5). 34–40. Retrieved from
http://www.iosrjournals.org/iosr-jbm/papers/Vol19-issue5/Version-
1/E1905013440.pdf

145
Onwuegbuzie, A. J., Dickinson, W. B., Leech, N. L., & Zoran, A. G. (2009). A qualitative
framework for collecting and analysing data in focus group research. International
Journal of Qualitative Methods, 8(3), 1–21.
https://doi.org/10.1177%2F160940690900800301
Pablo, G. (2013). The economics of small open economies. Business Review, Federal
Reserve Bank of Philadelphia, 96(Q4), 9–18. Retrieved from
https://www.philadelphiafed.org/-/media/frbp/assets/economy/articles/business-
review/2013/q4/brQ413_economics_small_open_economies.pdf
Rousslang, D. J. (1997). International income shifting by US multinational corporations.
Applied Economics, 29(7), 925–934. https://doi.org/10.1080/000368497326589
Sawyer, A., & Tan, LM. (2020). Reflections on tax research: An analysis of over 25 years of
research published in the New Zealand Journal of Taxation Law and Policy. New
Zealand Journal of Taxation Law and Policy, 26(4), 431–451. Retrieved from
https://hdl.handle.net/10092/101286
Schwarz, P. (2009). Tax-avoidance strategies of American multinationals: An empirical Analysis.
Managerial and Decision Economics, 30(8), 539–549. https://doi.org/10.1002/mde.1471
Sikka, P., & Willmott, H. (2010). The dark side of transfer pricing: It’s role in tax avoidance
and wealth retentiveness. Critical Perspectives on Accounting, 21(4), 342–356.
https://doi.org/10.1016/j.cpa.2010.02.004
Smith, A. M. C. (2010). Taxation of corporations in New Zealand: Andrew Smith reviews
New Zealand's company tax regime, noting that most provisions in the ITA are
comparable to those found in other jurisdictions and explaining features that are
unique to New Zealand. Corporate Business Taxation Monthly. 11(4),15–30.
Smith, A. M. C., & Dunmore, P. V. (1997). Tax avoidance and the financial structures of
non-resident controlled companies in New Zealand. Australian Tax Forum, 13(3),
277–309.
Stang, A., & Poole, C. (2013). The researcher and the consultant: A dialogue on null
hypothesis significance testing. European Journal of Epidemiology, 28(12), 939–944.
https://doi.org/10.1007/s10654-013-9861-4

146
Ting, A. (2014). iTax: Apple’s international tax structure and the double non-taxation issue.
British Tax Review, 2014(1), 40–71.
Ting, A. (2017). Base erosion by intra-group debt and BEPS project Action 4’s best practices
approach: A case study of Chevron. British Tax Review, 2017(1), 80–108.
Weichenrieder, A. J. (2009). Profit shifting in the EU: evidence from Germany. International
Tax and Public Finance, 16(3), 281–297. https://doi.org/10.1007/s10797-008-9068-x
Weyzig, F. (2013). Tax treaty shopping: Structural determinants of foreign direct investment
routed through the Netherlands. International Tax and Public Finance, 20(6), 910–
937. https://doi.org/10.1007/s10797-012-9250-z
Working Papers and Papers Presented at Conferences
Acciari, P., Tomarelli, F., Limosani, L., & Benedetti, L. (2015). Measurement of base erosion
and profit shifting phenomena through the analysis of FDI stocks. Department of the
Treasury of the Italian Ministry of Economy and Finance Working Paper No. 3.
Retrieved from
http://www.dt.mef.gov.it/modules/documenti_it/analisi_progammazione/working_pap
ers/WP_3.pdf
Ainsworth, A. (2016). Dividend imputation: The international experience. CIFR Working
Paper No. 096/2016. Retrieved from https://apo.org.au/sites/default/files/resource-
files/2016-03/apo-nid66192.pdf
Alvarez-Martinez, M., Barrios, S., d'Andria, D., Gesualdo, M., Nicodeme, G., & Pycroft, J.
(2018). How large is the corporate tax base erosion and profit shifting? A general
equilibrium approach. CESifo Working Paper No. 6870.
Antràs, P. (2020). De-globalisation? Global value chains in the post-COVID-19 age.
National Bureau of Economic Research Working Paper 28115. Retrieved from
https://www.nber.org/system/files/working_papers/w28115/w28115.pdf
Baldwin, R., & Martin, P. (1999). Two waves of globalisation: Superficial similarities,
fundamental differences. National Bureau of Economic Research Working Paper

147
6904. Retrieved from
https://www.nber.org/system/files/working_papers/w6904/w6904.pdf
Barrios, S., & d’Andria, D. (2018). Profit shifting and industrial heterogeneity. JRC Working
Papers on Taxation and Structural Reforms No. 7/2016. Retrieved from
https://ec.europa.eu/jrc/sites/default/files/jrc104524.pdf
Cobham, A., & Loretz, S. (2014). International distribution of the corporate tax base:
Implications of different apportionment factors under unitary taxation. International
Centre Tax and Development Working Paper 27. Retrieved from
https://opendocs.ids.ac.uk/opendocs/bitstream/handle/20.500.12413/11176/ICTD_WP
27.pdf
Cobham, A., & Janský, P. (2017). Global distribution of revenue loss from tax avoidance:
Re-estimation and country results. WIDER Working Paper 2017/55.
https://doi.org/10.35188/UNU-WIDER/2017/279-3
Crivelli, E., de Mooij, R. A., & Keen, M. (2015). Base erosion, profit shifting and developing
countries. IMF Working Paper WP/15/118. Retrieved from
https://www.imf.org/external/pubs/ft/wp/2015/wp15118.pdf
Davies, R. B., Martin, J., Parenti, M., & Toubal, F. (2014). Knocking on tax haven’s door:
Multinational firms and transfer pricing. CEPII Working Paper No. 2014–21.
Retrieved from http://cepii.fr/PDF_PUB/wp/2014/wp2014-21.pdf
Desai, M. A., Foley, C. F., & Hines, J. R. (2003). A multinational perspective on capital
structure choice and internal capital markets. National Bureau of Economic Research
Working Paper No. 9715.
Dharmapala, D. (2014). What do we know about base erosion and profit shifting? A review of
the empirical literature. CESifo Working Paper Series No. 4612.
Dischinger, M. (2007). Profit shifting by multinationals: Indirect evidence from European
micro data. Munich Discussion Paper No. 2007–30. Retrieved from
https://epub.ub.uni-muenchen.de/2029/1/dischinger_2007_profit_shifting.pdf
148
Dischinger, M. (2010). Profit shifting by multinationals: Evidence from European micro
panel data. Retrieved from https://www.ecpol.econ.uni-
muenchen.de/downloads/publis/dischinger_publis/dischinger_ps_new1.pdf
Dunbar, D. (2003). A historical review of the CFC and FIF regimes: Part one 1987 to 1
December 2003. Victoria University of Wellington, Centre for Accounting,
Governance and Taxation Research Working Paper No. 13. Retrieved from
https://researcharchive.vuw.ac.nz/xmlui/bitstream/handle/10063/198/paper.pdf?seque
nce=2
Eštok, G., & Bzdilová, R. (2011). Globalisation: An old or a new phenomenon? Prepared for
the conference “In the scale of globalisation. think globally, act locally, change
individually in the 21st century”, University of Ostrava. Retrieved from
https://globalization.osu.cz/publ2011/43-48_Estok-Bzdilova.pdf
Feld, L., Heckemeyer, J., & Overesch, M. (2013). Capital structure choice and company
taxation: A meta-study. ZEW Discussion Paper No. 11–075. Retrieved from
https://ftp.zew.de/pub/zew-docs/dp/dp11075.pdf
Florax, R., de Goot, H., & de Mooij, R. A. (2002). Meta-analysis: A tool for upgrading
inputs of macroeconomic policy models. Tinbergen Institute Discussion Paper No.
02–041/3.
Fuest, C., & Riedel, N. (2010). Tax evasion and tax avoidance in developing countries: The
role of international profit shifting. Oxford University Centre for Business Taxation
Working Paper No. 1012.
Hansson, Å., Olofsdotter, K., & Thede, S. (2016). Do multinationals pay less in taxes than
domestic firms? Evidence from the Swedish manufacturing sector. Lund University
Department of Economics Working Paper 2016:17. Retrieved from
https://project.nek.lu.se/publications/workpap/papers/wp16_17.pdf
Heckemeyer, J., & Overesch, M. (2013). Multinationals’ profit response to tax differentials:
Effect size and shifting channels. ZEW Discussion Paper No. 13–045. Retrieved from
https://ftp.zew.de/pub/zew-docs/dp/dp13045.pdf
149
Hines, J. R., & Summers, L. H. (2009). How globalisation affects tax design. National
Bureau of Economic Research Working Paper No. 14664. Retrieved from
https://www.nber.org/system/files/working_papers/w14664/w14664.pdf
International Monetary Fund. (2014). Spillovers in international corporate taxation. IMF
Policy Paper 2014: 071. https://doi.org/10.5089/9781498343367.007
Johansson, A., Skeie, Ø. B., Sorbe, S., & Menon, C. (2017). Tax planning by multinational
firms: Firm-level evidence from a cross-country database. OECD Economics
Department Working Papers No. 1355. Retrieved from
https://www.oecd.org/economy/public-finance/Tax-planning-by-multinational-firms-
firm-level-evidence-from-a-cross-country-database.pdf
Kumar, M. S., & Quinn, D. P. (2012). Globalisation and corporate taxation. IMF Working
Paper No. 12/252. Retrieved from
https://www.imf.org/external/pubs/ft/wp/2012/wp12252.pdf
Kuzniacki, B., Turina, A., Dubut, T., Mazz, A., Quiñones, N., Schoueri, L. E., West, C.,
Pistone, P., & Zimmer, F. (2017). Preventing tax arbitrage via hybrid mismatches:
BEPS Action 2 and developing countries. WU International Taxation Research Paper
Series No. 2017–03.
Lohse, T., & Riedel, N. (2013). Do transfer pricing laws limits international income shifting?
Evidence from European multinational. CESifo Working Paper No. 4404. Retrieved
from https://www.econstor.eu/bitstream/10419/84180/1/cesifo_wp4404.pdf
Markle, K., & Robinson, L. (2012). Tax haven use across international tax regimes.
Retrieved from http://faculty.tuck.dartmouth.edu/images/uploads/faculty/leslie-
robinson/marklerobinson.pdf
McDonald, M. (2008). Income shifting from transfer pricing: Further evidence from tax
return data. OTA Technical Working Paper No. 2. Retrieved from
https://www.treasury.gov/resource-center/tax-policy/tax-analysis/Documents/TP-
2.pdf

150
Merlo, V., & Wamser, G. (2014). Debt shifting and thin-capitalisation rules. CESifo DICE
Report No. 4. Retrieved from https://www.econstor.eu/bitstream/10419/167185/1/ifo-
dice-report-v12-y2014-i4-p27-31.pdf
Møen, J., Schindler, D., Schjelderup, G., & Tropina, J. (2011). International debt shifting: Do
multinationals shift internal or external debt. CESifo Working Paper No. 3519.
Riedel, N. (2014). Quantifying international tax avoidance: A review of the academic
literature. ETPF Policy Paper 2. Retrieved from
https://www.etpf.org/papers/PP002QuantAvoid.pdf
Wynne, M. A. (2007). How have small open economies responded to the challenge of
globalization? Prepared for the Bank of Iceland Conference on “The challenges of
globalization for small open economies with independent currencies”. Retrieved from
https://www.sedlabanki.is/lisalib/getfile.aspx?itemid=5237
Zodrow, G. R. (2009). International taxation and company tax policy in small open
economies. Prepared for presentation at a Victoria University of Wellington Tax
Policy conference on “New Zealand tax reform–Where to next?”. Retrieved from
https://www.wgtn.ac.nz/cagtr/pdf/zodrow.pdf
Books and Chapters in Books
Adam, F. (2014). Methodological and epistemic framework: From positivism to post-
positivism. In Measuring national innovation performance (pp. 5–7). Heidelberg:
Springer.
Baker, R. W. (2005). Capitalism’s Achilles heel: Dirty money and how to renew the free
market system. New Jersey: John Wiley.
Huck, S. W. (2009). Statistical misconceptions. New York: Routledge.
McKerchar, M. A. (2010). Design and conduct of research in tax, law and accounting.
Sydney: Thomson Reuters.
Smith, A. M. C., & Sawyer, A. (2020). Controlled foreign company legislation in New
Zealand. In Controlled foreign company legislation (pp. 463–483). Amsterdam:
IBFD.

151
Tabachnick, B. G., & Fidell, L. S. (2013). Using multivariate statistics (6th ed.). Boston:
Pearson.
Wooldridge, J. (2010). Econometric analysis of cross-section and panel data. London: MIT
Press.
Reports and Government Publications
Asen, E. (2020). Corporate tax rates around the world, 2020. Retrieved from
https://files.taxfoundation.org/20201208152358/2020-Corporate-Tax-Rates-around-
the-World.pdf
Business NZ. (2016). Foreign direct investment in New Zealand: A brief review of the pros
and cons. New Zealand Institute of Economic Research (NZIER) (report to export
New Zealand). Retrieved from https://www.think-
asia.org/bitstream/handle/11540/9217/foreign_direct_investment_in_nz.pdf?sequence
=1
Inland Revenue Department. (2000). Transfer pricing guidelines. Retrieved from
https://taxpolicy.ird.govt.nz/-/media/project/ir/tp/publications/2000/2000-other-
transfer-pricing-guidelines/2000-other-transfer-pricing-guidelines-
pdf.pdf?modified=20200910101447
Inland Revenue Department. (2008). Streaming and refundability of imputation credits: A
government tax policy discussion document. Retrieved from
https://taxpolicy.ird.govt.nz/-/media/project/ir/tp/publications/2008/2008-dd-
imputation-credits/2008-dd-imputation-credits-pdf.pdf?modified=20200910094529
Inland Revenue Department. (2010). New tax rates for companies and savings (Taxation
(Budget Measures) Act 2010) (Pubic 2010 No. 27). Retrieved from
https://www.taxtechnical.ird.govt.nz/new-legislation/act-articles/taxation-budget-
measures-act-2010/new-tax-rates-for-companies-and-savings
Inland Revenue Department. (2013). Tax avoidance and the interpretation of sections BG 1
and GA 1 of the Income Tax Act 2007. Retrieved from
https://www.taxtechnical.ird.govt.nz/-/media/project/ir/tt/pdfs/interpretation-
statements/is1301.pdf?la=en.

152
Inland Revenue Department. (2017a). BEPS – Strengthening our interest limitation rules: A
government discussion document. Retrieved from https://taxpolicy.ird.govt.nz/-
/media/project/ir/tp/publications/2017/2017-dd-beps-interest-limitation/2017-dd-beps-
interest-limitation-pdf.pdf?modified=20200910083659
Inland Revenue Department. (2017b). BEPS–Transfer pricing and permanent establishment
avoidance: A government discussion document. Retrieved from
https://taxpolicy.ird.govt.nz/-/media/project/ir/tp/publications/2017/2017-dd-transfer-
pricing-pe/2017-dd-transfer-pricing-pe-pdf.pdf?modified=20200910083704
Inland Revenue Department. (2017c). Changes in Revenue 2008 to 2017. Retrieved from
https://www.ird.govt.nz/about-us/archived-statistics/revenue-collected
Inland Revenue Department. (2017d). The New Zealand tax system and how it compares
internationally. Retrieved from https://www.ird.govt.nz/-
/media/project/ir/home/documents/about-us/who-we-are/our-minister/the-new-
zealand-tax-system-and-how-it-compares-internationally.pdf
Inland Revenue Department. (2018). Taxation (neutralising base erosion and profit shifting)
bill (Officials’ Report to the Finance and Expenditure Committee on Submissions on
the Bill). Retrieved from https://taxpolicy.ird.govt.nz/-
/media/project/ir/tp/publications/2018/2018-or-nbeps-bill/2018-or-nbeps-bill-
pdf.pdf?modified=20200910081909
Inland Revenue Department. (2019a). Base erosion and profit shifting: Administrative
measures. Retrieved from https://taxpolicy.ird.govt.nz/-
/media/project/ir/tp/publications/2019/2019-sr-beps-final/2019-sr-beps-final-
administrative-measures-pdf.pdf?modified=20200910080714
Inland Revenue Department. (2019b). Multinational enterprises compliance focus 2019.
Retrieved from https://www.ird.govt.nz/-
/media/project/ir/home/documents/international/multinational-enterprises---
compliance-focus-documents/compliance-focus---2019.pdf
Inland Revenue Department & the Treasury. (2009). Company tax issues facing New Zealand
(Background paper for Session 4 of the Victoria University of Wellington Tax
153
Working Group). Retrieved from https://www.wgtn.ac.nz/cagtr/events/past-
events/tax-working-group-2009/publications/4-company-tax-issues-facing-nz.pdf
Inland Revenue Department & the Treasury. (2015). NRWT: Related party and branch
lending. Retrieved from https://taxpolicy.ird.govt.nz/-
/media/project/ir/tp/publications/2015/2015-ip-nrwt/2015-ip-nrwt-
pdf.pdf?modified=20200910085522
Inland Revenue Department & the Treasury. (2018a). Appendix 1: Types of business entities
in New Zealand and how they are taxed (Background Paper for Sessions 6 and 7 of
the Tax Working Group). Retrieved from
https://taxworkinggroup.govt.nz/sites/default/files/2018-09/twg-bg-appendix-1--
types-of-business-entities-in-new-zealand-and-how-they-are-taxed.pdf
Inland Revenue Department & the Treasury. (2018b). Appendix 3: New Zealand’s imputation
system (Background Paper for Sessions 6 and 7 of the Tax Working Group).
Retrieved from https://taxworkinggroup.govt.nz/sites/default/files/2018-09/twg-bg-
appendix-3--new-zealand%E2%80%99s-imputation-system.pdf
Inland Revenue Department & the Treasury. (2018c). Company tax rate issues–further
information (Discussion paper for Session 8 of the Tax Working Group). Retrieved
from https://taxworkinggroup.govt.nz/sites/default/files/2018-06/twg-discussion-
paper-company-tax-issues.pdf
New Zealand Accounting Standards Board. (2011a). New Zealand equivalents to
international accounting standard 1: Presentation of financial statements (NZ IAS 1).
Retrieved from https://www.xrb.govt.nz/accounting-standards/for-profit-entities/
New Zealand Accounting Standards Board. (2011b). New Zealand equivalents to
international financial reporting standard 7–Financial instruments: Disclosures (NZ
IFRS 7). Retrieved from https://www.xrb.govt.nz/accounting-standards/for-profit-
entities/
Organisation for Economic Co-operation and Development. (2012). Hybrid mismatch
arrangements: Tax policy and compliance issues. Retrieved from
https://www.oecd.org/ctp/aggressive/HYBRIDS_ENG_Final_October2012.pdf

154
Organisation for Economic Co-operation and Development. (2013a). Addressing base
erosion and profit shifting. Retrieved from https://doi.org/10.1787/9789264192744-en
Organisation for Economic Co-operation and Development. (2013b). Action plan on base
erosion and profit shifting. https://doi.org/10.1787/9789264202719-en
Organisation for Economic Co-operation and Development. (2013c). Update: Base erosion
and profit shifting. Retrieved from https://www.oecd.org/mcm/C-MIN(2013)7-
ENG.pdf
Organisation for Economic Co-operation and Development. (2014a). Comments received on
public discussion draft–BEPS Action 11: Establish methodologies to collect and
analyse data on BEPS and the actions to address it (7 October 2014). Retrieved from
https://www.oecd.org/tax/tax-policy/comments-action-11-establishing-
methodologies.pdf
Organisation for Economic Co-operation and Development. (2014b). Taxation and
competition policy. Retrieved from https://www.oecd.org/tax/taxation-and-
competition-policy.htm
Organisation for Economic Co-operation and Development. (2015a). Limiting base erosion
involving interest deductions and other financial payments, Action 4: 2015 final
report. https://doi.org/10.1787/9789264241176-en
Organisation for Economic Co-operation and Development. (2015b). Public discussion
draft–BEPS Action 11: Improving the analysis of BEPS (16 April 2015 to 8 May
2015). Retrieved from https://www.oecd.org/tax/tax-policy/discussion-draft-action-
11-data-analysis.pdf
Organisation for Economic Co-operation and Development. (2015c). Comments received on
public discussion draft–BEPS Action 11: Improving the analysis of BEPS (13 May
2015). Retrieved from https://www.oecd.org/tax/tax-policy/public-comments-beps-
action-11-data-analysis.pdf
Organisation for Economic Co-operation and Development. (2015d). Measuring and
monitoring BEPS, Action 11: 2015 final report. Retrieved from
https://doi.org/10.1787/9789264241343-en

155
Organisation for Economic Co-operation and Development. (2015e). Transfer pricing
documentation and country-by-country reporting, Action 13: 2015 final report.
https://doi.org/10.1787/9789264241480-en
Organisation for Economic Co-operation and Development. (2016). Limiting base erosion
involving interest deductions and other financial payments, Action 4–2016 Update:
Inclusive framework on BEPS. https://doi.org/10.1787/9789264268333-en
Organisation for Economic Co-operation and Development. (2017). OECD transfer pricing
guidelines for multinational enterprises and tax administrations 2017.
https://doi.org/10.1787/tpg-2017-en
Organisation for Economic Co-operation and Development. (2018). OECD/G20 inclusive
framework on BEPS (Progress report July 2017–June 2018). Retrieved from
https://www.oecd.org/tax/beps/inclusive-framework-on-beps-progress-report-july-
2017-june-2018.pdf
Organisation for Economic Co-operation and Development. (2019a). Model tax convention
on income and on capital 2017 (full version). https://doi.org/10.1787/9a5b369e-en
Organisation for Economic Co-operation and Development. (2019b). Table II.1. Statutory
corporate income tax rate. Retrieved from
https://stats.oecd.org/index.aspx?DataSetCode=Table_II1
Statistics New Zealand. (2020a). Goods and services trade by country: Year ended 31 March
2020. Retrieved from https://www.stats.govt.nz/information-releases/goods-and-
services-trade-by-country-year-ended-march-2020
Statistics New Zealand. (2020b). Balance of payments and international investment position:
Year ended 31 March 2020. Retrieved from https://www.stats.govt.nz/information-
releases/balance-of-payments-and-international-investment-position-year-ended-31-
march-2020
Tax Working Group. (2010). A tax system for New Zealand’s future (Report of the Victoria
University of Wellington Tax Working Group). Retrieved from
https://www.wgtn.ac.nz/cagtr/pdf/tax-report-website.pdf

156
The Treasury. (2008). Mutual recognition of franking credits and New Zealand imputation
credits: A New Zealand submission to the review Australia’s future tax system.
Retrieved from https://www.treasury.govt.nz/sites/default/files/2008-10/mrfcnzic-aftr-
oct08.pdf
The Treasury. (2020). Financial statements of the government of New Zealand for the year
ended 30 June 2020. Retrieved from https://www.treasury.govt.nz/system/files/2020-
11/fsgnz-2020.pdf
Titievskaia, J., Kononenko, V., Navarra, C., Stamegna, C., & Zumer, K. (2020). Slowing
down or changing track? Understanding the dynamics of ‘slowbalisation’. Retrieved
from
https://www.europarl.europa.eu/RegData/etudes/IDAN/2020/659383/EPRS_IDA(202
0)659383_EN.pdf
United Nations Conference on Trade and Development. (2015). World investment report
2015: Reforming international investment governance. Retrieved from
https://unctad.org/system/files/official-document/wir2015_en.pdf
United Nations. (2011). Note on the revision of the manual for negotiation of bilateral tax
treaties. Retrieved from https://www.un.org/esa/ffd/wp-
content/uploads/2014/09/8STM_CRP11_Add1_Tax-Evasion.pdf
World Bank. (2020a). Doing Business 2020: Comparing business regulation in 190
economies. Retrieved from
https://documents1.worldbank.org/curated/en/688761571934946384/pdf/Doing-
Business-2020-Comparing-Business-Regulation-in-190-Economies.pdf
World Bank. (2020b). Worldwide governance indicators. Retrieved from
https://info.worldbank.org/governance/wgi/#home
Wynands, S. J. (2018). How should the tax system promote the right balance between
supporting the productive economy and the speculative economy? Treasury Tertiary
challenge. Retrieved from https://www.treasury.govt.nz/sites/default/files/2018-
10/2018-tertiary-challenge-first-runnerup-sam-wynands_1.pdf

157
Zulfikar, R. (2018). Estimation model and selection method of panel data regression: An
overview of common effect, fixed effect, and random effect model. Retrieved from
https://osf.io/download/5b24301a8b4bed0011b5b80f/
Newspaper Articles
Hunt, E. (2017, March 23). Apple paid no tax in New Zealand for at least a decade, reports
say. The Irish Times. Retrieved from
https://www.irishtimes.com/business/technology/apple-paid-no-tax-in-new-zealand-
for-at-least-a-decade-reports-say-1.3021658
Nippert, M. (2016a, March 18). Top multinationals pay almost no tax in New Zealand. The
New Zealand Herald. Retrieved from
https://www.nzherald.co.nz/business/news/article.cfm?c_id=3&objectid=11607336
Nippert, M. (2016b, March 18). The tax gap–where do their profits go? How Apple,
Facebook and Google move their earnings overseas. The New Zealand Herald.
Retrieved from
https://www.nzherald.co.nz/business/news/article.cfm?c_id=3&objectid=11607279
Nippert, M. (2017, March 18). Apple pays zero tax in NZ despite sales of $4.2 billion. The
New Zealand Herald. Retrieved from
https://www.nzherald.co.nz/business/news/article.cfm?c_id=3&objectid=11820240
Owen, M. (2017, March 20). Apple paid taxes from New Zealand revenues to Australia for
the last 10 years–report. Appleinsider. Retrieved from
https://appleinsider.com/articles/17/03/20/apple-paid-taxes-from-new-zealand-
revenues-to-australia-for-the-last-10-years---report
Websites and other Internet Resources
Accident Compensation Corporation, Inland Revenue Department & Statistics New Zealand.
(n.d.). Business industry classification code. Retrieved from
https://www.businessdescription.co.nz/
Inland Revenue Department. (n.d.). Non-resident withholding tax (NRWT) rates for double
tax agreement countries or territories. Retrieved from

158
https://www.ird.govt.nz/income-tax/withholding-taxes/non-resident-withholding-tax-
nrwt/deduct-nrwt-at-the-right-rate/nrwt-rates-for-dta-countries
Inland Revenue Department. (2014). Thin capitalisation rules. Retrieved from
https://www.taxtechnical.ird.govt.nz/new-legislation/act-articles/taxation-annual-
rates-employee-allowances-and-remedial-matters-act-2014/thin-capitalisation-rules
Inland Revenue Department. (2020). Loss carry-backs. Retrieved from
https://taxpolicy.ird.govt.nz/publications/2020/2020-bill-commentary-covid-19-
torum-bill/loss-carry-backs
Inland Revenue Department. (2021). Tax treaties. Retrieved from
https://taxpolicy.ird.govt.nz/tax-treaties#dta
International Monetary Fund. (2017). World economic outlook database: October 2017.
Retrieved from https://www.imf.org/en/Publications/WEO/weo-
database/2017/October/download-entire-database
Makhlouf, G. (2017). Chances, choices and challenges: New Zealand’s response to
globalisation. Retrieved from https://www.treasury.govt.nz/sites/default/files/2018-
03/sp-response-globalisation-17aug17.pdf
Ministry of Foreign Affairs and Trade. (n.d.). NZ-Australia closer economic relations (CER).
Retrieved from https://www.mfat.govt.nz/en/trade/free-trade-agreements/free-trade-
agreements-in-force/nz-australia-closer-economic-relations-cer/
Ministry of Foreign Affairs and Trade. (2017). Netherlands. Retrieved from
https://www.mfat.govt.nz/en/countries-and-regions/europe/netherlands/
Organisation for Economic Co-operation and Development. (n.d.). What is BEPS? Retrieved
from https://www.oecd.org/tax/beps/about/
PwC. (2013). International transfer pricing 2013/14. Retrieved from
https://www.pwc.com/gx/en/international-transfer-pricing/assets/itp-2013-final.pdf
PwC. (2020a). New Zealand corporate: Group taxation. Retrieved from
https://taxsummaries.pwc.com/new-zealand/corporate/group-taxation

159
PwC. (2020b). New Zealand corporate: Withholding taxes. Retrieved from
https://taxsummaries.pwc.com/new-zealand/corporate/withholding-taxes
Simpson Grierson. (2013). Proposals to tighten interest deductions for foreign-owned
businesses in New Zealand. Retrieved from
https://www.simpsongrierson.com/articles/2013/tax-interest-deductions-foreign-
owned-businesses
Trading economics. (2020). Countries’ indicators. Retrieved from
https://tradingeconomics.com/countries
Transparency International. (2020). Corruption perceptions index. Retrieved from
https://www.transparency.org/en/cpi/2020/index/nzl
Legislation
Companies Act 1993. Retrieved from
https://www.legislation.govt.nz/act/public/1993/0105/latest/whole.html
Financial Markets Conduct Act 2013. Retrieved from
https://www.legislation.govt.nz/act/public/2013/0069/latest/whole.html
Financial Reporting Act 2013. Retrieved from
https://www.legislation.govt.nz/act/public/2013/0101/latest/whole.html#DLM4632900
Financial Reporting (Amendments to Other Enactments) Act 2013. Retrieved from
https://www.legislation.govt.nz/act/public/2013/0102/latest/whole.html
Income Tax Act 2007. Retrieved from
https://www.legislation.govt.nz/act/public/2007/0097/latest/DLM1512301.html
Privacy Act 1993. Retrieved from
https://www.legislation.govt.nz/act/public/1993/0028/latest/DLM296639.html
Tax Administration Act 1994. Retrieved from
https://www.legislation.govt.nz/act/public/1994/0166/latest/whole.html
160
Taxation (Neutralising Base Erosion and Profit Shifting) Act 2018. Retrieved from
https://www.legislation.govt.nz/act/public/2018/0016/latest/whole.html
Tax Cases
Ben Nevis Forestry Ventures Ltd v. Commissioner of Inland Revenue [2008] NZSC 115,
[2009] 2 NZLR 289.
Bullivant v. Attorney General for Victoria [1901] AC 196.
Commissioner of Inland Revenue v. Penny and Hooper [2010] NZCA 231, [2010] 2 NZLR
360.
Penny v. Commissioner of Inland Revenue [2011] NZSC 95, [2012] 1 NZLR 433.
Theses
Shekhovtsev, N. (2019). The costs of tax compliance of large enterprises: Exploratory
analysis of large enterprises in New Zealand (Doctoral thesis, University of
Canterbury, Christchurch, New Zealand). http://dx.doi.org/10.26021/5530
Tables and Figures
Inland Revenue Department and the Treasury (2018). Number of Business Entities, Tax Rate
and Taxable Income in New Zealand [Table]. Retrieved from
https://taxworkinggroup.govt.nz/sites/default/files/2018-09/twg-bg-appendix-1--
types-of-business-entities-in-new-zealand-and-how-they-are-taxed.pdf
Inland Revenue Department. (2021). New Zealand’s DTAs and Year of Establishment
[Table]. Retrieved from https://taxpolicy.ird.govt.nz/en/tax-treaties
Organisation for Economic Co-operation and Development. (2015). Macro-data Sources and
Accessibility [Table]. Retrieved from https://www.oecd.org/ctp/tax-policy/discussion-
draft-action-11-data-analysis.pdf
Organisation for Economic Co-operation and Development. (2015). Micro-data Sources and
Accessibility [Table]. Retrieved from https://www.oecd.org/ctp/tax-policy/discussion-
draft-action-11-data-analysis.pdf

161
Organisation for Economic Co-operation and Development. (2015). OECD BEPS Action 11:
Six Indicators of BEPS [Table]. Retrieved from https://read.oecd-
ilibrary.org/taxation/measuring-and-monitoring-beps-action-11-2015-final-
report_9789264241343-en
Organisation for Economic Co-operation and Development. (2019). New Zealand and
Australia Statutory Corporate Tax Rates, 1980–2019 [Figure]. Retrieved from
https://stats.oecd.org/index.aspx?DataSetCode=Table_II1

162
Appendices
Appendix A
Summary of Existing BEPS Studies
Continued on next page…
Macro Approach
No. AuthorPublished
YearTopic Database
Type of
Data
Sample
PeriodSample
Dependent
Variable
Other form of coefficient /
results
–0.075 (OECD countries)
–0.192 (non-OECD countries)
–0.235 (low and middle
income countries)
–0.097 (All)
–0.054 (developed countries)
–0.115 (developing countries)
–0.34 (OECD countries)
–0.44 (non-OECD countries)
3 Crivelli,
de Mooij,
& Keen
2015 Base erosion, profit
shifting and developing
countries
Panel
1980–2013 103
countries
CIT basePanel
1980–2013 173
countries
CIT base
FDI Income
Rate of
Return
104
countries
Panel 2009–20122
1 IMF 2014 Spillovers in
International Corporate
Taxation
Bolwijn,
Casella, &
Rigo
2015 An FDI-driven approach
to measuring the scale
and economic impact of
BEPS
FDI data
from IMF
CDIF

163
Continued on next page…
Micro Approach
No. AuthorPublished
YearTopic Database
Type of
Data
Sample
PeriodSample
Dependent
Variable (s)
Semi-elasticity
coefficient toward
CIT rate
differences
Other form of
coefficient /
results
1 Grubert &
Mutti
1991 Taxes, tariffs and transfer pricing in
multinational corporate decision
making
BEA
(country-
level)
Cross-
section
1982 US MNEs
2 Hines & Rice 1994 Fiscal paradise: Foreign tax havens
and American business
BEA
(country-
level)
Cross-
section
1982 US MNEs After-financing
profit; EBIT
–2.25
3 Rousslang 1997 International income shifting by US
multinational corporations
Cross-
section
1988 US MNEs After-financing
profit
4 Collins et al. 1998 Cross-jurisdictional income shifting
and earnings valuation
Compustat Panel 1984–1992 US MNEs After-financing
profit
5 Desai, Foley &
Hines
2003 A multinational perspective on
capital structure choice and internal
capital markets
BEA Panel 1989–1994 US MNEs
6 Grubert 2003 Intangible income, intercompany
transactions, income shifting and the
choice of location
Compustat Cross-
section
1996 US MNEs After-financing
profit
7 Mills &
Newberry
2004 Do foreign multinationals' tax
incentives influence their US income
reporting and debt policy
Panel 1987–1996 Non-US
MNEs
After-financing
profit
8 De Mooij &
Ederveen
2008 Corporate tax elasticities: A reader's
guide to empirical findings
Before
2005
European
countries
Corporate pre-tax
reported profit
–1.2
Note. After-financing profit refers to profit net of interest. EBIT is earnings before interest and taxes.

164
Continued on next page…
Micro Approach
No. AuthorPublished
YearTopic Database
Type of
Data
Sample
PeriodSample
Dependent
Variable (s)
Semi-elasticity
coefficient toward
CIT rate
differences
Other form of
coefficient /
results
9 Huizinga &
Laeven
2008 International profit shifting within
multinationals: A multi-country
perspective
Amadeus Cross-
section
1999 European
countries
After-financing
profit; EBIT
–1.31
10 McDonald 2008 Income shifting from transfer pricing:
Further evidence from tax return data
EBIT
11 Clausing 2009 Multinational firm tax avoidance and
tax policy
BEA Panel 1982–2004 US MNEs After-financing
profit
–0.5
12 Schwarz 2009 Tax avoidance strategies of
American multinationals: An
empirical analysis
US MNEs After-financing
profit
13 Weichenrieder 2009 Profit shifting in the EU: Evidence
from Germany
MiDi Panel 1996–2003 Germany After-financing
profit
14 Azémar 2010 International corporate taxation and
US multinationals' behaviour: An
integrated approach
US MNEs After-financing
profit
15 Dischinger 2010 Profit shifting by multinationals:
Evidence from European micro panel
data
Amadeus Panel 1995–2005 Affiliated
companies
located in
Europe
Corporate pre-tax
reported profit
–0.7
Note. After-financing profit refers to profit net of interest. EBIT is earnings before interest and taxes.

165
Continued on next page…
Micro Approach
No. AuthorPublished
YearTopic Database
Type of
Data
Sample
PeriodSample
Dependent
Variable (s)
Semi-elasticity
coefficient toward
CIT rate
differences
Other form of
coefficient /
results
16 Dischinger &
Riedel
2011 Corporate taxes and the location of
intangible assets within multinational
firms
Amadeus Panel 1995–2005 After-financing
profit
17 Maffini &
Mokkas
2011 Profit shifting and measured
productivity of multinational firms
EBIT
18 Møen et al. 2011 International debt shifting: Do
multinationals shift internal or
external debt
German
MNEs
Internal and
external debt-to-
asset ratio
–0.294 to –0.132
19 Becker &
Riedel
2012 Cross-border tax effects on affiliate
investment: Evidence from European
multinationals
After-financing
profit
20 Blouin et al. 2012 Coordination of transfer prices on
intra-firm trade
BEA After-financing
profit
21 Buettner et al. 2012 The impact of thin-capitalization
rules on the capital structure of
multinational firms
MiDi Panel 1996–2004 Foreign
affiliates of
German-
based
MNEs
The use of debt
22 Grubert 2012 Foreign taxes and the growing share
of US multinational company income
abroad: Profits, not sales, are being
globalised
Panel 1996–2004 US MNEs After-financing
profit
Note. After-financing profit refers to profit net of interest. EBIT is earnings before interest and taxes.

166
Continued on next page…
Micro Approach
No. AuthorPublished
YearTopic Database
Type of
Data
Sample
PeriodSample
Dependent
Variable (s)
Semi-elasticity
coefficient toward
CIT rate
differences
Other form of
coefficient /
results
23 Karkinsky &
Riedel
2012 Corporate taxation and the choice of
patent location within multinational
firms
Amadeus European
affiliates
24 Klassen &
Laplante
2012 Are US multinational corporations
becoming more aggressive income
shifters?
Panel 1988–2009 US MNEs After-financing
profit
25 Markle 2012 A comparison of the tax-motivated
income shifting of multinationals in
territorial and worldwide countries
Orbis Panel 2004–2008 After-financing
profit
26 Dharmapala &
Riedel
2013 Earnings shocks and tax-motivated
income-shifting: Evidence from
European multinationals
Amadeus Panel 1995–2005 European
countries
(EU-25)
After-financing
profit
27 Dischinger,
Knoll &
Riedel
2013 The roles of headquarters in
multinational profit shifting strategies
Panel 1999–2009 European
MNEs
After-financing
profit
–0.5
28 Heckemeyer &
Overesch
2013 Multinationals' profit response to tax
differentials: Effect size and shifting
channels (meta-regression analysis)
Amadeus Panel 1999–2009 Various
countries
based on
consensus
Corporate pre-tax
reported profit
–0.8 ("consensus"
estimate)
29 Lohse &
Riedel
2013 Do transfer pricing laws limits
international income shifting?
Evidence from European
multinationals
Panel 1999–2009 European
MNEs
Corporate pre-tax
reported profit
–0.4
Note. After-financing profit refers to profit net of interest. EBIT is earnings before interest and taxes.

167
Continued on next page…
Micro Approach
No. AuthorPublished
YearTopic Database
Type of
Data
Sample
PeriodSample
Dependent
Variable (s)
Semi-elasticity
coefficient toward
CIT rate
differences
Other form of
coefficient /
results
(i) Effective
Corporate tax
abroad
5% of missed tax
revenue
(developing
countries)
(ii) Debt ratio The existence of
debt securities
increase debt ratio
by 0.12% while
the existence of
issuing Special
Purpose Entities
(SPEs) increase
debt ratio by
0.13%
31 Beer &
Loeprick
2014 Profit shifting: Drivers of transfer
(mis)pricing and the potential of
countermeasures
Orbis Panel 2003–2011 World
MNEs
Corporate pre-tax
reported profit
–1.2 to –0.52
depending on the
corporate structure
complexity and the
existence of
intangible asset
32 Blouin et al. 2014 The location, composition, and
investment implications of
permanently reinvested earnings
Panel 1982–2004 54
countries
Debt-to-asset
ratio
Thin capitalization
rules reduce debt-
to-asset ratio
between 1.9–6.3%
Note. After-financing profit refers to profit net of interest. EBIT is earnings before interest and taxes.
Weyzig 201330 MNEs in
many
countries
affected by
Dutch Tax
System in
2005
Tax treaty shopping: Structural
determinants of foreign direct
investment routed through the
Netherlands

168
Micro Approach
No. AuthorPublished
YearTopic Database
Type of
Data
Sample
PeriodSample
Dependent
Variable (s)
Semi-elasticity
coefficient toward
CIT rate
differences
Other form of
coefficient /
results
33 Davies et al. 2014 Knocking on tax haven's
door:Multinational firms and transfer
pricing
Cross-
Section
1999 400 MNEs
in France
intra-firm prices
in France
Tax authorities in
France lose 3% of
total corporate
taxes collected
34 Dyreng &
Markle
2016 The effect of financial constraints on
tax-motivated income shifting by US
multinationals
Compustat Panel 1997–2011 US MNEs
35 Barrios &
d'Andria
2018 Profit shifting and industrial
heterogeneity
Orbis &
country-
level data
Panel 2004–2013 Corporate pre-tax
reported profit
–0.47
Note. After-financing profit refers to profit net of interest. EBIT is earnings before interest and taxes.

169
Appendix B
Foreign Direct Investment in New Zealand by Country, March 2020
Countries NZD Million
Australia 59,303
Hong Kong 9,771
United States of America 7,778
Singapore 6,047
Japan 5,723
United Kingdom 5,471
Canada 5,147
Netherlands 3,983
Cayman Islands 2,312
Switzerland 1,888
China, People's Republic of 1,588
Virgin Islands, British 1,579
Germany 733
Luxembourg 657
France 298
Channel Islands 0
Netherlands Antilles 0
Papua New Guinea (2)
Belgium (21)
Ireland (30)
Argentina C
Austria C
Bermuda C
Chile C
Cook Islands C
Korea, Republic of C
Malaysia C
Norway C
Taiwan C
United Arab Emirates C
Total 121,052
Symbols:
C: Confidential
( ): Net external FDI
Note .
1. Limited countries are listed in this table.
2. The data does not add up to the total.
Source: Statistics New Zealand (2020b).

170
Appendix C
New Zealand’s Direct Investment Abroad by Country, March 2020
Countries NZD Million
Australia 14,212
United States of America 5,394
Hong Kong 1,892
United Kingdom 1,059
Bermuda 999
Singapore 457
Canada 292
China, People's Republic of 119
Japan 86
Taiwan 42
Germany 31
Chile 19
United Arab Emirates 10
Channel Islands 0
Luxembourg 0
Netherlands Antilles 0
Norway 0
Argentina C
Austria C
Belgium C
Cayman Islands C
Cook Islands C
France C
Ireland C
Korea, Republic of C
Malaysia C
Netherlands C
Papua New Guinea C
Switzerland C
Virgin Islands, British C
Total 27,621
Symbols:
C: Confidential
Note .
1. Limited countries are listed in this table.
2. The data does not add up to the total.
Source: Statistics New Zealand (2020b).

171
Appendix D
Descriptive Statistics for Key Variables of NZDOMs
M Median SD Range
^ PTP 99,870,215.68 56,527,500.00 107,270,626.50 4,664,000 - 632,000,000
lnPTP 17.93 17.85 1.03 15.36 - 20.26
TAXDIFF2 –1.90 –0.50 5.02 –17.50 - 4.50
^ FA 376,271,555.48 144,375,540.50 543,760,954.04 2,649,000 - 2,348,000,000
lnFA 18.79 18.79 1.51 14.79 - 21.58
^ EMPLYCOST 240,449,536.74 93,942,000.00 358,766,128.05 11,805,739 - 1,794,000,000
lnEMPLYCOST 18.58 18.36 1.13 16.28 - 21.31
LEV 0.50 0.54 0.18 0.07 - 0.88
lnLEV –0.79 –0.62 0.45 –2.66 - –0.13
# GDP 2,861.79 1,449.34 4,060.33 221.27 - 20,302.47
lnGDP 7.41 7.28 0.98 5.40 - 9.92
¤ CPI 7.36 7.60 0.94 5.80 - 8.80
lnCPI 1.99 2.03 0.13 1.76 - 2.17
NZDOMs
Panel 2008–2017
Notes . N NZDOMs = 160. ̂In New Zealand Dollars. # In billion New Zealand Dollars. ¤ CPI ranges from 0 (highly corrupt) to 10 (least
corrupt). FA = Property, plant and equipment. EMPLYCOST = Personal costs; Personal expenses. LEV = Total liabilities/Total assets.
GDP = The average GDP for its foreign subsidiaries. CPI = The average CPI for its foreign subsidiaries. TAXDIFF2 = The average
statutory corporate tax rate for its foreign subsidiaries – Corporate statutory tax rate at the parent location (New Zealand).

172
Appendix D gives descriptive statistics for the key variables of 16 NZDOMs. Both the observed
variables with their original values and after logarithmic transformation are displayed in the
above table, but the regression analysis was conducted on the transformed variables.
The sample distribution of each of the transformed variables of NZDOMs is fairly symmetrical,
as indicated by the average and the median for each variable, which are close together. By
looking at the initial values of the data, NZDOMs possess a mean of pre-tax profits of NZD
99.9 million, average fixed assets amounting to NZD 376 million, and an average cost of
employees of NZD 240 million. The leverage of NZDOMs ranges from 0.07 to 0.88 with a
mean of 0.50. It indicates that on average half of the total assets of NZDOMs are financed by
the debt.
The CPI of the location where NZDOMs’ foreign subsidiaries are based was fairly high (M =
7.36, SD = 0.94). A high CPI indicates a low degree of corruption, which in turns poses a low
risk to businesses. The tax differential of NZDOMs ranges from –17.5 percent to 4.5 percent
with a mean of –1.9 percent. The GDP of the host countries of NZDOM subsidiaries has a wide
range, which spreads from NZD 221.3 billion to NZD 20,302.5 billion.
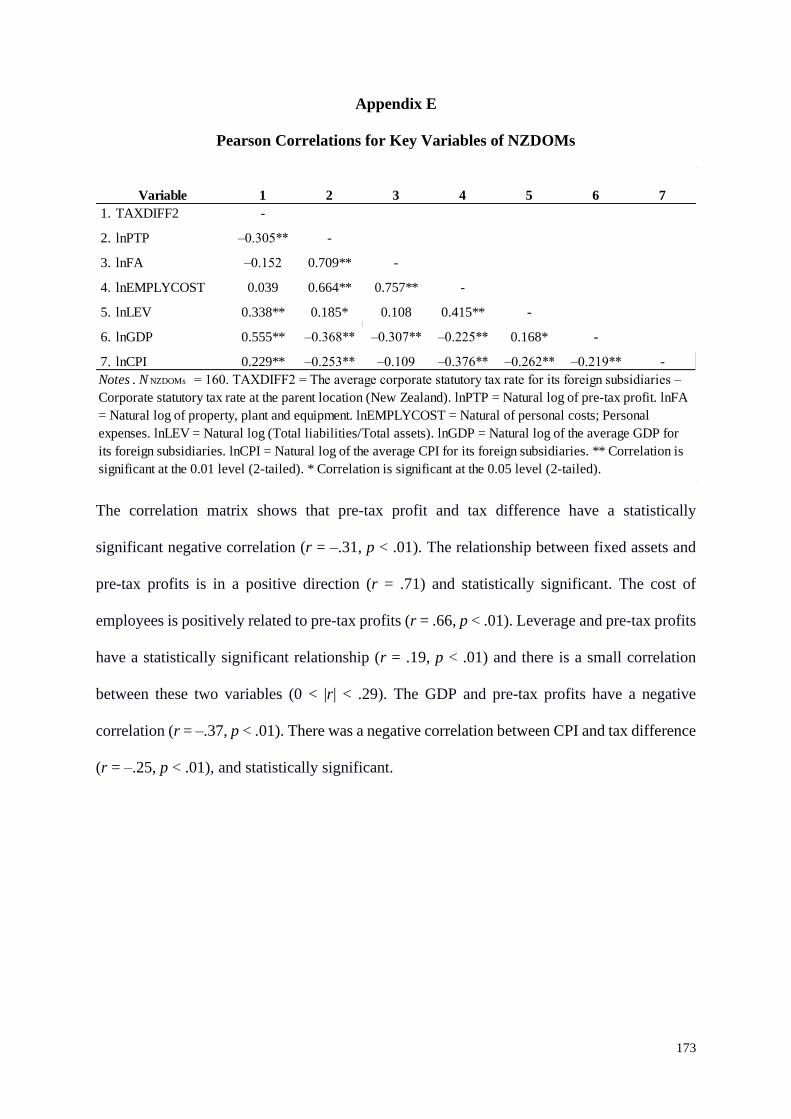
173
Appendix E
Pearson Correlations for Key Variables of NZDOMs
The correlation matrix shows that pre-tax profit and tax difference have a statistically
significant negative correlation (r = –.31, p < .01). The relationship between fixed assets and
pre-tax profits is in a positive direction (r = .71) and statistically significant. The cost of
employees is positively related to pre-tax profits (r = .66, p < .01). Leverage and pre-tax profits
have a statistically significant relationship (r = .19, p < .01) and there is a small correlation
between these two variables (0 < |r| < .29). The GDP and pre-tax profits have a negative
correlation (r = –.37, p < .01). There was a negative correlation between CPI and tax difference
(r = –.25, p < .01), and statistically significant.
1 2 3 4 5 6 7
1. TAXDIFF2 -
2. lnPTP –0.305** -
3. lnFA –0.152 0.709** -
4. lnEMPLYCOST 0.039 0.664** 0.757** -
5. lnLEV 0.338** 0.185* 0.108 0.415** -
6. lnGDP 0.555** –0.368** –0.307** –0.225** 0.168* -
7. lnCPI 0.229** –0.253** –0.109 –0.376** –0.262** –0.219** -
Variable
Notes . N NZDOMs = 160. TAXDIFF2 = The average corporate statutory tax rate for its foreign subsidiaries –
Corporate statutory tax rate at the parent location (New Zealand). lnPTP = Natural log of pre-tax profit. lnFA
= Natural log of property, plant and equipment. lnEMPLYCOST = Natural of personal costs; Personal
expenses. lnLEV = Natural log (Total liabilities/Total assets). lnGDP = Natural log of the average GDP for
its foreign subsidiaries. lnCPI = Natural log of the average CPI for its foreign subsidiaries. ** Correlation is
significant at the 0.01 level (2-tailed). * Correlation is significant at the 0.05 level (2-tailed).

174
Appendix F
Profit Shifting of NZDOMs
Explanatory variables (1) (2) (3) (4) (5) (6) (7) (8)
Average host countries statutory corporate tax rate a
–0.30*** –0.11 –0.10 –0.10
(0.07) (0.07) (0.07) (0.07)
Tax difference to parent b
0.05 –0.11** –0.13*** –0.15**
(0.06) (0.05) (0.05) (0.06)
lnFA 0.19 0.27 0.25 0.17 0.24 0.21
(0.18) (0.17) (0.18) (0.18) (0.17) (0.18)
lnEMPLYCOST 0.72*** 0.74*** 0.92*** 0.94*** 0.98*** 0.97***
(0.21) (0.20) (0.25) (0.22) (0.21) (0.24)
InLEV –0.96*** –0.29*** –1.01*** –0.98***
(0.19) (0.30) (0.19) (0.19)
lnGDP 1.29 –0.24
(1.35) (0.35)
lnCPI 0.72 0.04
(1.16) (1.44)
N 160 160 160 160 160 160 160 160
Adjusted R-squared .70 .77 .80 .80 .66 .77 .81 .81
Notes. *, **, *** indicates significance at the 10 percent, 5 percent, and 1 percent level, respectively. Standard errors are in parentheses. a It refers to the average host
countries statutory corporate tax rate where the overseas subsidiaries located. b It refers to the difference between the average statutory corporate tax rate for its foreign
subsidiaries and New Zealand statutory corporate tax rate. lnFA = Natural log of property, plant and equipment. lnEMPLYCOST = Natural log of personal costs; Personal
expenses. lnLEV = Natural log (Total liabilities/Total assets). lnGDP = Natural log of the average GDP where the overseas subsidiaries are located. lnCPI = Natural log of
the average CPI where the overseas subsidiaries located.
OLS firm fixed effects model for NZDOMs
Panel 2008–2017
Dependent variable: Natural log of profit before tax

175
Appendix F gives statistical findings for profit shifting of NZDOMs. Since the sample size of
the NZDOMs is too small to render any meaningful results, the findings discussed in this
section are treated as supplementary information to the thesis. A fixed firm effects panel
regression analysis has been applied on 16 observed NZDOMs across 8 specifications for the
sample period of 2008 to 2017.
The study begins with examining the relationship between the reported profitability by
NZDOMs and the average host countries corporate tax rate, where the foreign subsidiaries of
NZDOMs are located, together with the control variables, and the results are set out in
Specification 1 to Specification 4. The results presented in Specification 1 indicates a strongly
negative correlation between profitability and average host countries statutory tax rate, at the
1 percent confidence level. Specification 1 suggests a 10 percentage point decrease in the
average host countries tax rate where the overseas subsidiaries of the NZDOMs are based,
resulting in higher reported pre-tax profits of NZDOMs by 3 percent. Following this, the
company control variables are included in Specifications 2 and 3 and the country-level control
variables are included in Specification 4. With the inclusion of the control variables, the
coefficients of the host countries tax rate turn out statistically non-significant throughout
Specification 2 to Specification 4.
Subsequently, this study examines if the pre-tax profits reported by NZDOMs responds to the
difference between the average statutory corporate tax rate of foreign subsidiaries and New
Zealand’s statutory corporate tax rate. In Specification 5, the coefficient of the tax rate
differential reveals a positive but not statistically significant trend. In Specification 6 and 7, the
coefficients of the tax differential turn out negative and significant at the 5 percent level, and
at the 1 percent level, respectively, with the inclusion of the company control variables. In
Specification 8, the country-level control variables are additionally applied to the estimation,

176
and the coefficient of the tax rate differential turns out negative and statistically significant at
the 5 percent level.
The cost of employees has a strong positive relationship with pre-tax profits whereas the
leverage is negatively related to the pre-tax profits of the NZDOMs in all of the specifications.
The results indicate that an increase in the cost of employees results in an increase in the
reported profits of the NZDOMs. Meanwhile, a high ratio of total debt to total assets is related
to a decrease in pre-tax profits of the NZDOMs.

177
Appendix G
Samples Sourced from NZX
Status Number of NZX Company
Banking, insurance and investment companies 65
Non-ASIC 4
Companies without overseas subsidiaries 18
Companies that are not ultimate owners 24
Foreign MNEs 9
Co-ops 1
Companies set up after 2008 26
Companies with incomplete financial statements between 2008–2017 2
Companies with losses between 2008–2017 22
Sample companies to test H2 13
Total 184
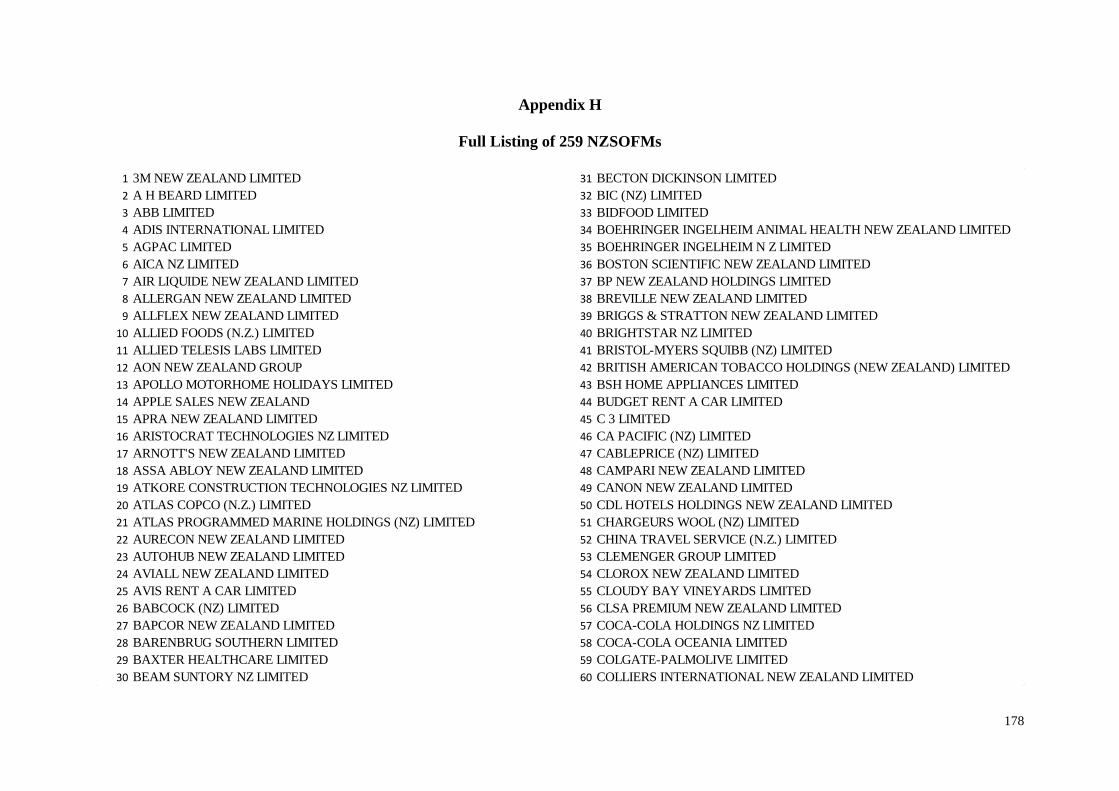
178
Appendix H
Full Listing of 259 NZSOFMs
1 3M NEW ZEALAND LIMITED 31 BECTON DICKINSON LIMITED
2 A H BEARD LIMITED 32 BIC (NZ) LIMITED
3 ABB LIMITED 33 BIDFOOD LIMITED
4 ADIS INTERNATIONAL LIMITED 34 BOEHRINGER INGELHEIM ANIMAL HEALTH NEW ZEALAND LIMITED
5 AGPAC LIMITED 35 BOEHRINGER INGELHEIM N Z LIMITED
6 AICA NZ LIMITED 36 BOSTON SCIENTIFIC NEW ZEALAND LIMITED
7 AIR LIQUIDE NEW ZEALAND LIMITED 37 BP NEW ZEALAND HOLDINGS LIMITED
8 ALLERGAN NEW ZEALAND LIMITED 38 BREVILLE NEW ZEALAND LIMITED
9 ALLFLEX NEW ZEALAND LIMITED 39 BRIGGS & STRATTON NEW ZEALAND LIMITED
10 ALLIED FOODS (N.Z.) LIMITED 40 BRIGHTSTAR NZ LIMITED
11 ALLIED TELESIS LABS LIMITED 41 BRISTOL-MYERS SQUIBB (NZ) LIMITED
12 AON NEW ZEALAND GROUP 42 BRITISH AMERICAN TOBACCO HOLDINGS (NEW ZEALAND) LIMITED
13 APOLLO MOTORHOME HOLIDAYS LIMITED 43 BSH HOME APPLIANCES LIMITED
14 APPLE SALES NEW ZEALAND 44 BUDGET RENT A CAR LIMITED
15 APRA NEW ZEALAND LIMITED 45 C 3 LIMITED
16 ARISTOCRAT TECHNOLOGIES NZ LIMITED 46 CA PACIFIC (NZ) LIMITED
17 ARNOTT'S NEW ZEALAND LIMITED 47 CABLEPRICE (NZ) LIMITED
18 ASSA ABLOY NEW ZEALAND LIMITED 48 CAMPARI NEW ZEALAND LIMITED
19 ATKORE CONSTRUCTION TECHNOLOGIES NZ LIMITED 49 CANON NEW ZEALAND LIMITED
20 ATLAS COPCO (N.Z.) LIMITED 50 CDL HOTELS HOLDINGS NEW ZEALAND LIMITED
21 ATLAS PROGRAMMED MARINE HOLDINGS (NZ) LIMITED 51 CHARGEURS WOOL (NZ) LIMITED
22 AURECON NEW ZEALAND LIMITED 52 CHINA TRAVEL SERVICE (N.Z.) LIMITED
23 AUTOHUB NEW ZEALAND LIMITED 53 CLEMENGER GROUP LIMITED
24 AVIALL NEW ZEALAND LIMITED 54 CLOROX NEW ZEALAND LIMITED
25 AVIS RENT A CAR LIMITED 55 CLOUDY BAY VINEYARDS LIMITED
26 BABCOCK (NZ) LIMITED 56 CLSA PREMIUM NEW ZEALAND LIMITED
27 BAPCOR NEW ZEALAND LIMITED 57 COCA-COLA HOLDINGS NZ LIMITED
28 BARENBRUG SOUTHERN LIMITED 58 COCA-COLA OCEANIA LIMITED
29 BAXTER HEALTHCARE LIMITED 59 COLGATE-PALMOLIVE LIMITED
30 BEAM SUNTORY NZ LIMITED 60 COLLIERS INTERNATIONAL NEW ZEALAND LIMITED

179
61 COMPASS GROUP NEW ZEALAND LIMITED 91 ESTEE LAUDER LIMITED
62 COMPUTERSHARE INVESTOR SERVICES LIMITED 92 EVONIK PEROXIDE LIMITED
63 CONNELL BROS COMPANY AUSTRALASIA LIMITED 93 EXPEDITORS INTERNATIONAL (NZ) LIMITED
64 CONQUEST IMPORTS N.Z. LIMITED 94 FIS SYSTEMS NZ LIMITED
65 CONSOLIDATED ALLOYS (N.Z.) LIMITED 95 FLEXIGROUP (NEW ZEALAND) LIMITED
66 COUNTRY ROAD CLOTHING (N.Z.) LIMITED 96 FLIGHT CENTRE (NZ) LIMITED
67 CRC INDUSTRIES NEW ZEALAND 97 FOCUS RESEARCH LIMITED
68 CROWN EQUIPMENT LIMITED 98 FOOTE,CONE & BELDING LIMITED
69 CROWN WORLDWIDE (NZ) LIMITED 99 FRUCOR SUNTORY NEW ZEALAND LIMITED
70 CSE NEW ZEALAND LIMITED 100 GEOFABRICS NEW ZEALAND LIMITED
71 CUMMINS NEW ZEALAND LIMITED 101 GHD NZ HOLDINGS LIMITED
72 DANFOSS (NEW ZEALAND) LIMITED 102 GILEAD SCIENCES (NZ)
73 DB BREWERIES LIMITED 103 GLAXOSMITHKLINE NZ LIMITED
74 DDB WORLDWIDE LIMITED 104 GRAND CENTRAL (NZ) LIMITED
75 DEC INTERNATIONAL NZ LIMITED 105 GWAIL (NZ) LIMITED
76 DELAVAL LIMITED 106 H.J. HEINZ COMPANY (NEW ZEALAND) LIMITED
77 DETMOLD NZ SALES LIMITED 107 HANCOCK FOREST MANAGEMENT (NZ) LIMITED
78 DFS NEW ZEALAND LIMITED 108 HARVEY NORMAN LIMITED
79 DICKER DATA NZ LIMITED 109 HELLA NEW ZEALAND LIMITED
80 DOMINO'S PIZZA NEW ZEALAND LIMITED 110 HELLMANN WORLDWIDE LOGISTICS LIMITED
81 DORMAKABA NEW ZEALAND LIMITED 111 HENRY SCHEIN NEW ZEALAND
82 DOTMAR HOLDINGS NEW ZEALAND LIMITED 112 HERTZ NEW ZEALAND HOLDINGS LIMITED
83 DUPONT (NEW ZEALAND) LIMITED 113 HEXAGON SAFETY & INFRASTRUCTURE LIMITED
84 EBSCO NZ LIMITED 114 HEXION (N.Z.) LIMITED
85 ECOLAB NEW ZEALAND 115 HILL'S PET NUTRITION (NZ) LIMITED
86 ELECTRIX LIMITED 116 HITACHI VANTARA NEW ZEALAND LIMITED
87 ELECTROLUX (NZ) LIMITED 117 HOLDEN NEW ZEALAND LIMITED
88 EMERSON PROCESS MANAGEMENT NEW ZEALAND LIMITED 118 HONEYWELL LIMITED
89 ENERGIZER NZ LIMITED 119 HP FINANCIAL SERVICES (NEW ZEALAND)
90 ESSILOR NEW ZEALAND LIMITED 120 HUBERGROUP NEW ZEALAND LIMITED

180
121 IBM GLOBAL FINANCING NEW ZEALAND LIMITED 151 LOUIS VUITTON NEW ZEALAND LIMITED
122 IBM NEW ZEALAND LIMITED 152 MALTEUROP NEW ZEALAND LIMITED
123 IMCD NEW ZEALAND LIMITED 153 MARS NEW ZEALAND LIMITED
124 IMPERIAL TOBACCO NEW ZEALAND LIMITED 154 MARUHA (N.Z.) CORPORATION LIMITED
125 INCHCAPE MOTORS NEW ZEALAND LIMITED 155 MAZDA MOTORS OF NEW ZEALAND LIMITED
126 INFOR (NEW ZEALAND) 156 MCDONALD'S RESTAURANTS (NEW ZEALAND) LIMITED
127 INFORMATION RESOURCES (NEW ZEALAND) LIMITED 157 MENZIES AVIATION (NEW ZEALAND) LIMITED
128 INTEGRATED PACKAGING LIMITED 158 MERCEDES-BENZ NEW ZEALAND LIMITED
129 INTERNATIONAL GAME TECHNOLOGY (NZ) LIMITED 159 METHVEN LIMITED
130 ISENTIA LIMITED 160 MICROSOFT NEW ZEALAND LIMITED
131 ITW NEW ZEALAND 161 MILLENNIUM & COPTHORNE HOTELS NEW ZEALAND LIMITED
132 J. GADSDEN (NZ) LIMITED 162 MITEK NEW ZEALAND LIMITED
133 J.F. HILLEBRAND NEW ZEALAND LIMITED 163 MITSUBISHI MOTORS NEW ZEALAND LIMITED
134 JACOBS (NZ) HOLDINGS LIMITED 164 MOFFAT LIMITED
135 JACOBS DOUWE EGBERTS NZ 165 MRC GLOBAL (NEW ZEALAND) LIMITED
136 JETCONNECT LIMITED 166 MULTISPARES N.Z. LIMITED
137 JOHNSON & JOHNSON (NEW ZEALAND) LIMITED 167 MULTIVAC NEW ZEALAND LIMITED
138 KERRY INGREDIENTS (NZ) LIMITED 168 MYLAN NEW ZEALAND LIMITED
139 KINGSPAN LIMITED 169 NCR (NZ) CORPORATION
140 KOP- COAT NEW ZEALAND LIMITED 170 NEGOCIANTS NEW ZEALAND LIMITED
141 KORN FERRY (NZ) 171 NESTLE NEW ZEALAND LIMITED
142 KRAUS & NAIMER PRODUCTION LIMITED 172 NEW BALANCE NEW ZEALAND LIMITED
143 LEASEPLAN NEW ZEALAND LIMITED 173 NEW ZEALAND SUGAR COMPANY LIMITED
144 LEGO NEW ZEALAND LIMITED 174 NISSAN NEW ZEALAND LIMITED
145 LEGRAND NEW ZEALAND LIMITED 175 NOAHS HOTELS (N.Z.) LIMITED
146 LEXISNEXIS NZ LIMITED 176 NOKIA NEW ZEALAND LIMITED
147 LIFE TECHNOLOGIES NEW ZEALAND LIMITED 177 NOVO NORDISK PHARMACEUTICALS LIMITED
148 LINDE HOLDINGS NEW ZEALAND LIMITED 178 NUTRITION SYSTEMS NZ PTY LIMITED
149 LION NZ LIMITED 179 OCS GROUP NZ LIMITED
150 L'OREAL NEW ZEALAND LIMITED 180 OLYMPUS NEW ZEALAND LIMITED

181
181 OMYA NEW ZEALAND LIMITED 211 SCHINDLER LIFTS NZ LIMITED
182 OOH!MEDIA STREET FURNITURE NEW ZEALAND LIMITED 212 SEALED AIR (NEW ZEALAND)
183 OPPENHEIMER NEW ZEALAND LIMITED 213 SEEK (NZ) LIMITED
184 ORIX NEW ZEALAND LIMITED 214 SEGARD MASUREL (NZ) LIMITED
185 OTIS ELEVATOR COMPANY LIMITED 215 SEQIRUS (NZ) LIMITED
186 PAE (NEW ZEALAND) LIMITED 216 SEW-EURODRIVE (NZ) LIMITED
187 PARAMOUNT PICTURES NZ 217 SIEMENS (N.Z.) LIMITED
188 PARKER HANNIFIN (N.Z.) LIMITED 218 SIKA (NZ) LIMITED
189 PENGUIN RANDOM HOUSE NEW ZEALAND LIMITED 219 SIMSMETAL INDUSTRIES LIMITED
190 PFIZER NEW ZEALAND LIMITED 220 SMC CORPORATION (NZ) LIMITED
191 PHILIP MORRIS (NEW ZEALAND) LIMITED 221 SMITH & NEPHEW LIMITED
192 PPG INDUSTRIES NEW ZEALAND LIMITED 222 SONOCO NEW ZEALAND LIMITED
193 PROBE CONTACT SOLUTIONS NEW ZEALAND LIMITED 223 SONOVA NEW ZEALAND (WHOLESALE) LIMITED
194 PROCTER & GAMBLE DISTRIBUTING NEW ZEALAND LIMITED 224 SONY INTERACTIVE ENTERTAINMENT NEW ZEALAND LIMITED
195 PROGRAMMED MAINTENANCE SERVICES (N.Z.) LIMITED 225 SOUTH PACIFIC PICTURES INVESTMENTS LIMITED
196 PUMA NEW ZEALAND LIMITED 226 SOUTH PACIFIC SEEDS (N.Z.) LIMITED
197 RECKON ACCOUNTANT GROUP LIMITED 227 SOUTHWOOD EXPORT LIMITED
198 RENTOKIL INITIAL LIMITED 228 SPECTRUM BRANDS NEW ZEALAND LIMITED
199 REVLON NEW ZEALAND LIMITED 229 SPICERS (NZ) LIMITED
200 RHEEM NEW ZEALAND LIMITED 230 SPIRAX SARCO LIMITED
201 RICOH NEW ZEALAND LIMITED 231 STANLEY BLACK & DECKER NZ LIMITED
202 ROCHE DIAGNOSTICS NZ LIMITED 232 STIHL LIMITED
203 ROCHE PRODUCTS (NEW ZEALAND) LIMITED 233 STRYKER NEW ZEALAND LIMITED
204 SAINT-GOBAIN ABRASIVES LIMITED 234 SUPER CHEAP AUTO (NEW ZEALAND) PTY LIMITED
205 SAN REMO PASTA LIMITED 235 SUZUKI NEW ZEALAND LIMITED
206 SANDVIK NEW ZEALAND LIMITED 236 SYNGENTA CROP PROTECTION LIMITED
207 SANOFI-AVENTIS NEW ZEALAND LIMITED 237 TECHNOLOGY ONE NEW ZEALAND LIMITED
208 SCANDINAVIAN TOBACCO GROUP NEW ZEALAND LIMITED 238 THALES NEW ZEALAND LIMITED
209 SCENTRE (NEW ZEALAND) LIMITED 239 THOMSON REUTERS NEW ZEALAND LIMITED
210 SCHERING-PLOUGH ANIMAL HEALTH LIMITED 240 TOYOTA NEW ZEALAND LIMITED

182
241 TRANSDEV AUCKLAND LIMITED
242 TRAVEL CORPORATION NZ LIMITED
243 TYCO ELECTRONICS NZ LIMITED
244 UNILEVER NEW ZEALAND LIMITED
245 UNISYS NEW ZEALAND LIMITED
246 UNIVERSAL MUSIC NEW ZEALAND LIMITED
247 USANA HEALTH SCIENCES (NZ) CORPORATION
248 WARWICK FABRICS LIMITED
249 WASHTECH LIMITED
250 WEDDERBURN SCALES LIMITED
251 WESFARMERS INDUSTRIAL & SAFETY HOLDINGS NZ LIMITED
252 WEX NEW ZEALAND
253 WILLIS NEW ZEALAND LIMITED
254 WITCHERY FASHIONS (NZ) LIMITED
255 WORLEY NEW ZEALAND LIMITED (EMPLYCOST=LABOUR)
256 XYLEM WATER SOLUTIONS NEW ZEALAND LIMITED
257 YAMAHA MOTOR NEW ZEALAND LIMITED
258 YARA FERTILIZERS (NZ) LIMITED
259 ZIMMER BIOMET NEW ZEALAND COMPANY