D1.1 – Cartography of the flexibility services ... - MAGNITUDE
120
D1.1 Cartography of the flexibility services provided by heating/cooling, storage and gas technology and systems to the electricity system This project has received funding from the European Union’s Horizon 2020 research and innovation programme under grant agreement No 774309 Ref. Ares(2019)628214 - 04/02/2019
-
Upload
khangminh22 -
Category
Documents
-
view
1 -
download
0
Transcript of D1.1 – Cartography of the flexibility services ... - MAGNITUDE

D1.1
Cartography of the flexibility services provided by heating/cooling, storage and gas technology and systems to the electricity system
This project has received funding from the European Union’s
Horizon 2020 research and innovation programme under grant
agreement No 774309
Ref. Ares(2019)628214 - 04/02/2019

D1.1 – Cartography of the flexibility services provided by heating/cooling, storage and gas
technology and systems to the electricity system
Grant agreement number: 774309
Start date of the project: 1 October 2017
Duration: 42 months
Due date of Deliverable: 31/05/2018 Actual submission date: R2.0 04/02/2019
Deliverable approved by the WPL/CO: ☒
Lead Beneficiary: Mälardalens Högskola: Hailong Li, Worrada Nookuea, Pietro Elia Campana, Jinyue Yan
Contributing beneficiaries: EIFER (Europaisches Institut für Energieforschung EDF-KIT EWIV):
Nicole Pini, Paul Haering, Stephan Seidelt, Karol Witkowski
Ricerca sul Sistema Energetico (RSE S.p.A.): Edoardo Corsetti
Efficacity: Odile Lefrère
Electricité de France: Régine Belhomme
Cardiff University: Meysam Qadrdan, Alexandre Canet, Yue Zhou, Jianzhong Wu
Empresa Municipal de Aguas y Saneamiento de Murcia: Johannes Steinbesser
Danmarsk Tekniske Universitet: Angelina Syrri, Thibaut Richert
Keywords
Multi-energy systems, Sector-coupling technologies, Real-life case studies, Flexibility services to electricity systems, variable Renewable Energy Sources
Dissemination Level
PU Public X
PP Restricted to other programme participants (including the Commission Services)
RE Restricted to a group specified by the consortium (including the Commission Services)
CO Confidential, only for members of the consortium (including the Commission Services)

©MAGNITUDE Consortium 2 February 2019
Disclaimer
This document and the results described reflect only the authors’ view. The EC and the Innovation and Networks Executive Agency (INEA) are not responsible for any use that may be made of the information it contains.
Copyrights
This document and all the results presented are the property of the MAGNITUDE Consortium and may not be used without the written approval of the authors and without the use of the appropriate copyrights: © MAGNITUDE Consortium
History
Author Date Reason for change Release
See above 15/11/2018 Final version R1
See above 22/01/2019 Correction of Table 1 and associated explanation text R1.1
See above 04/02/2019 2nd version to be submitted following changes R2.0

MAGNITUDE D1.1 - CARTOGRAPHY OF THE FLEXIBILITY SERVICES PROVIDED BY HEATING/COOLING,
STORAGE AND GAS TECHNOLOGY AND SYSTEMS TO THE ELECTRICITY SYSTEM – R2.0
©MAGNITUDE Consortium 3 February 2019
Executive Summary
The present report is a public deliverable (D1.1) of the MAGNITUDE H2020 funded European project. The MAGNITUDE project aims to develop business and market mechanisms, as well as supporting coordination tools to provide flexibility to the European electricity system, by enhancing the synergies between electricity, heating/cooling and gas systems.
Seven real-life case studies of multi-energy systems of different sizes and technological features located in seven European countries are used to provide the data foundation for this assessment and for the modelling activities taking place in different Work Packages (WP) in the project.
This deliverable aims at setting the first milestone towards this goal, analysing the current set-up of the case studies, describing how the technologies and the control strategies currently in place can be a source of flexibility, or as well a bottleneck, and proposing some improvement options for maximising the flexibility provision.
The work presented in this deliverable is then continued and deepened in a further deliverable (D1.2), where actual data coming from the project case studies will be used to quantitatively characterise the flexibility properties of technologies. The results of this report (D1.1) and of D1.2 will then be used as input information for the modelling and optimisation of multi-energy systems and the quantification of flexibility. They will also be used by the aggregation platform developed in the project to optimise the market allocation of the quantified flexibility and to provide forecasts of its market prices.
D1.1 summarises the main characteristics of the case studies and coupling technologies. Through mapping the main flexibility services to be found in the 7 case study countries against the case studies, possible bottlenecks and constraints to service provision and technological development are analysed and potential improvements to maximise the provision of the flexibility at the case study level are discussed.
Core business of the case studies and main technological characteristics
The current situations of the seven project case studies (CS) and the installed technologies for energy production, conversion, storage and distribution are reviewed. In general, their variety is very broad, e.g. in terms of sizing, main energy carriers or involved heat temperature levels. Three case studies involve industrial processes (paper mill, wastewater treatment plant, demonstration site including several industries and residential/tertiary buildings), five of them include district heating networks for residential and tertiary heat supply and two of them feature district cooling networks as well. All case studies involve processes of conversion of natural gas into heat or electricity, or conversion of electricity into heat, or inversely, and one of them involves biogas valorisation for cogeneration. Two of the CS also include small distributed individual units at customers’ premises.
Only few CS have already experience in market participation for grid flexibility services. Five of them are focusing directly to supply energy to end users through a district-heating network; the sizing ranges from providing energy to a campus of office buildings up to a district level. In addition, the implementation of electric vehicles is done in at least one CS.
Technology description
The technologies used in the different CS include:
1. biomass and gas boilers, gas CHP plants, since mainly natural gas is internally used for power and/or heat production and also biogenic fuels like wood and sewage sludge are used in two case studies,
2. anaerobic digestion, as it is the main energy conversion process for one CS, 3. P2H technologies (electric boilers and heat pumps), as they are key options in a sector-coupling
perspective (even if most of the CS do not include P2H technologies so far),

MAGNITUDE D1.1 - CARTOGRAPHY OF THE FLEXIBILITY SERVICES PROVIDED BY HEATING/COOLING,
STORAGE AND GAS TECHNOLOGY AND SYSTEMS TO THE ELECTRICITY SYSTEM – R2.0
©MAGNITUDE Consortium 4 February 2019
4. batteries: no CS features a battery system so far. However, for the future, the importance of this technology seems to be high,
5. hot water tanks and steam accumulators, since heat storage plays as well an important role in flexibility provision,
6. electricity network, since all CS are connected to the grid, 7. district heating/cooling network, even if the range of temperature levels is very diverse within
the different case studies, making general considerations very complex. 8. absorption chillers for cold production, as this technology is the main cold production source
in one CS.
Flexibility services and flexibility provision
The identified services from Deliverable 3.1 “Benchmark of markets and regulations for electricity, gas and heat and overview of flexibility services to the electricity grid” and the technological characteristics of the CSs are linked through a matrix that shows the capability of the CSs to provide the identified services. In Table 1, ‘++’ means that the service is already provided; ‘+’ means that the service is not yet provided but, according to the CS owner or contact point, it could be provided; and ‘-‘ means that the service is not provided and its provision is not foreseen by the CS owner.
As shown in Table 1, the project CSs can cover a lot of the services identified. However, this is not done so far, either due to lack of awareness, economic feasibility, available manpower or technological solutions.
Case study CS purpose Identified Services from Deliverable D3.1
FCR aFRR mFRR ID DA ReD Cap
Mälarenergi AB
DH, DC - - + ++ ++ - +
Paper Mill Industrial process
+ + ++ + + - -
HOFOR Individual units + DH
+ - + + + - -
ACS DH - + + ++ ++ - +
Neath Port Talbot
Industrial process
++ - + ++ ++ + +
EMUASA Industrial process
- + + + + - -
Paris Saclay DH, DC + individual units
- - + + + - -
Table 1: Matrix of the flexibility services and fitting technologies in the case studies
In Table 1: FCR = Frequency Containement Reserve; aFRR = automatic Frequency Restoration Reserve; mFRR = manual Frequency Restoration Reserve; ID = Intraday energy market; DA = Day Ahead energy market; ReD = Re-Dispatching or congestion management mechanism; Cap = Capacity requirement mechanism.
Success factors, bottlenecks and improvement options
Success factors and bottlenecks towards flexibility provision are identified for each CS, with regard to technological issues. Different solutions and improvements are proposed for each CS and ranked. These proposals were discussed with the CS owners or contact points to get their feedback and additional information about their site.

MAGNITUDE D1.1 - CARTOGRAPHY OF THE FLEXIBILITY SERVICES PROVIDED BY HEATING/COOLING,
STORAGE AND GAS TECHNOLOGY AND SYSTEMS TO THE ELECTRICITY SYSTEM – R2.0
©MAGNITUDE Consortium 5 February 2019
The most promising options are: increased utilisation of P2H technologies, both heat pumps and electric boilers, to increase the demand to the grid. In addition, heat storage options are identified as promising options. Heat storage is not only capable to shave heat peak loads, but, in combination with P2H technologies, also to shave electrical peaks. Furthermore, the increase of energy efficiency is an additional solution, which can be achieved either by internal heat recovery or by identifying additional heat sinks, e.g. new clients for the district heating networks. In this case, the provision of cooling was also identified as a promising option.

MAGNITUDE D1.1 - CARTOGRAPHY OF THE FLEXIBILITY SERVICES PROVIDED BY HEATING/COOLING,
STORAGE AND GAS TECHNOLOGY AND SYSTEMS TO THE ELECTRICITY SYSTEM – R2.0
©MAGNITUDE Consortium 6 February 2019
Table of Content
Executive Summary ................................................................................................................................. 3
Table of Content ...................................................................................................................................... 6
Table of Figures ....................................................................................................................................... 7
Table of Tables......................................................................................................................................... 7
List of Acronyms ...................................................................................................................................... 8
1 Background .................................................................................................................................... 13
Introduction .............................................................................................................................. 13
Objective ................................................................................................................................... 13
Methodology ............................................................................................................................ 13
Organisation of the report ........................................................................................................ 14
2 Technology review ......................................................................................................................... 15
Case studies: existing technologies and technology set up ..................................................... 15
Main characteristics and features of the reviewed technologies ............................................ 27
3 Degree of technical fit (capability) of technologies to provide services ........................................ 38
Services identified in the project Deliverable D3.1 .................................................................. 38
Matrix of the existing flexibility services and fitting technologies in the case studies ............ 42
Success factors and bottlenecks ............................................................................................... 45
Proposed improvement of the current technology set-up in the case studies........................ 48
4 Summary ........................................................................................................................................ 57
5 Acknowledgements ........................................................................................................................ 59
6 Bibliography ................................................................................................................................... 60
Appendix A1 Data of the Case Studies .................................................................................................. 64
Appendix A2 Technology Factsheets ..................................................................................................... 86

MAGNITUDE D1.1 - CARTOGRAPHY OF THE FLEXIBILITY SERVICES PROVIDED BY HEATING/COOLING, STORAGE AND GAS TECHNOLOGY AND SYSTEMS TO THE ELECTRICITY SYSTEM – R2.0
©MAGNITUDE Consortium 7 February 2019
Table of Figures
Figure 1: Schematic diagram of the CHP system of Mälarenergi AB (Adapted from [8]) .............................................. 16
Figure 2: Integrated Energy Systems in EnergyLab Nordhavn [10] ................................................................................ 18
Figure 3: Map of district heating network and electricity network in Århusgade area, Nordhavn, Copenhagen [10] .. 19
Figure 4: District heating network in Milano Est [11] .................................................................................................... 20
Figure 5: Map of units connections [11] ......................................................................................................................... 21
Figure 6: Neath Port Talbot [13] .................................................................................................................................... 22
Figure 7: Electricity networks in Neath Port Talbot [14] ................................................................................................ 24
Figure 8: High pressure gas networks feeding Neath Port Talbot [15] .......................................................................... 24
Figure 9: Murcia Este WWTP [16] .................................................................................................................................. 25
Figure 10: Comparison between different electrical energy storage technologies and suitability [11] ......................... 30
Figure 11: Relationships between time duration of the service, the service and power [11] ........................................ 30
Figure 12: Relationships between the power provision and the service duration [11] .................................................. 31
Figure 13: Current development phases for different technologies [11] ........................................................................ 31
Figure 14: Different types of thermal energy storage [11]............................................................................................. 32
Figure 15: Schematic of the operation of a typical heat pump [41] ............................................................................... 34
Figure 16: Performance of Air-Water heat pump for hot water temperatures of 35ᵒC and 50ᵒC [39] .......................... 34
Figure 17: Example of heat pump performance results [40] .......................................................................................... 35
Figure 18: Simplified flowchart of the CHP system of the paper mill (Line H) [51] ........................................................ 50
Table of Tables
Table 1: Matrix of the flexibility services and fitting technologies in the case studies ..................................................... 4
Table 2: Generation of electricity, heat and cooling at Mälarenergi ............................................................................. 15
Table 3: Electricity and steam generation in Paper mill ................................................................................................. 17
Table 4: Energy consumption in Paper mill .................................................................................................................... 17
Table 5: Energy consumption in HOFOR ......................................................................................................................... 19
Table 6: installed capacity at ACS .................................................................................................................................. 21
Table 7: Electricity generation in Neath Port Talbot ...................................................................................................... 23
Table 8: Gas and electricity demand in Neath Port Talbot [14] ..................................................................................... 23
Table 9: Installed capacity at ACS .................................................................................................................................. 26
Table 10: Installed capacity and production at Paris Saclay .......................................................................................... 27
Table 11: Matrix of the flexibility services and fitting technologies in the case studies ................................................. 45

MAGNITUDE D1.1 - CARTOGRAPHY OF THE FLEXIBILITY SERVICES PROVIDED BY HEATING/COOLING, STORAGE AND GAS TECHNOLOGY AND SYSTEMS TO THE ELECTRICITY SYSTEM – R2.0
©MAGNITUDE Consortium 8 February 2019
List of Acronyms
Abbreviation / Acronym Description
A2O Anaerobic-Anoxic-Oxic
AD Anaerobic Digestion
aFRR Automatic Frequency Restoration Reserve
ALFCO Adjusted Load Following Capacity Obligation
ASHP Air Source Heat Pump
BELPEX Belgium Power Exchange
BFB Bubbling Fluidised Bed
BOC British Oxygen Company
BOD5 5-day Biochemical Oxygen Demand
BR Building Regulation
Br Bromine
BRP Balancing Responsible Parties
C Degree Celcius
ca. Capacity
CAES Compressed Air Energy Storage
Cap capacity requirement mechanisms
CCGT Combined Cycle Gas Turbine
Cd Cadmium
CFB Circulating Fluidised Bed
CH4 Methane
CHP Combine Heat and Power
CIBO Council of Industrial Boiler Owners
Cl Chlorine
CO2 Carbon Dioxide
COP Coefficient of Performance
Cr Chromium
CRM Capacity Requirement Mechanisms
CS Case Study
d Day
DA Day-ahead Energy Trades
DH District Heating
DHC District Heating and Cooling
DHW Domestic Hot Water

MAGNITUDE D1.1 - CARTOGRAPHY OF THE FLEXIBILITY SERVICES PROVIDED BY HEATING/COOLING, STORAGE AND GAS TECHNOLOGY AND SYSTEMS TO THE ELECTRICITY SYSTEM – R2.0
©MAGNITUDE Consortium 9 February 2019
Abbreviation / Acronym Description
DMS Data Management System
DSO Distribution System Operator
EES Electrical Energy Storage
EESS Electrical Energy Storage Systems
EHB Electric Heat Boosters
EPAPS Etablissement public d’aménagement Paris-Saclay
EPEX European Power Exchange
ESAMUR Entidad de Saneamiento
ESSs Energy Storage Systems
EU European Union
FACTs Flexible Alternating Current Transmission System
FAT Full Activation Time
FCR Frequency Containment Reserve
Fe Iron
G2H Gas to Heat
G2P Gas to Power
GB Great Britain
GHG Greenhouse gas
GSHP Ground Source Heat Pump
GWh Gigawatt hour
GWP Global Warming Potential
h Hour
H2 Hydrogen
H2G Heat to Gas
H2H Heat Distribution (Heat to Heat)
H2P Heat to Power
H2S Hydrogen Sulfide
HB Heat Booster
HP Heat Pump
HRT Hydraulic Retention Time
HSs Heat Storages
Hz Hertz
ID Intraday energy trades
IPLV Integrated Part Load Value
kV Kilovoltage

MAGNITUDE D1.1 - CARTOGRAPHY OF THE FLEXIBILITY SERVICES PROVIDED BY HEATING/COOLING, STORAGE AND GAS TECHNOLOGY AND SYSTEMS TO THE ELECTRICITY SYSTEM – R2.0
©MAGNITUDE Consortium 10 February 2019
Abbreviation / Acronym Description
kWe Kilowatt Electricity
kWh Kilowatt Heat
Li Lithium
LLD-PE Linear Polyethylene, Low Density
l Litre
LTDH Low-temperature-District Heating
m meter
m2 Square Meter
m3 Cubic Meter
MES Multi-Energy Systems
mFRR Manual Frequency Restoration Reserve
mg milligram
MH Metal Hydride
Mt Metric Ton
MV Medium Voltage
MVA Mega Volt Amp
MW Megawatt
MWe Megawatts electric
MWth Megawatts thermal
N2 Nitrogen
Na Sodium
NaOH Sodium Hydroxide
NGT National Grid Transco (UK gas transporter)
NH3 Ammonia
Ni Nickel
Nm3 Normal Cubic Meter
NPT Neath Port Talbot
O&M Operations and Maintenance
O2 Oxygen
ODP Ozone Depletion Potential
OFGEM Office for Gas and Electricity Market
OPNs Offtake Profile Notices
OTC Over-the-Counter
P Phosphorous
P2C Power to Cooling

MAGNITUDE D1.1 - CARTOGRAPHY OF THE FLEXIBILITY SERVICES PROVIDED BY HEATING/COOLING, STORAGE AND GAS TECHNOLOGY AND SYSTEMS TO THE ELECTRICITY SYSTEM – R2.0
©MAGNITUDE Consortium 11 February 2019
Abbreviation / Acronym Description
P2G Power to Gas
P2H Power to Heat
Pb Lead
PCM Phase Change Material
PCR Price Coupling of Regions
PE-HD High-Density Polyethylene
PEXa High-Pressure Crosslinked Polyethylene
PIR Cyclopentane-Blown Polyisocyanurate rigid foam
PLC Programmable Logic Controller
PP2 Peak to Peak
ppmv parts per million volume
PUR Polyurethane Foam-Penthane Blown
PV Photovoltaics
R&D Research and Development
ReD Congestion management and re-dispatching
RES Renewable Energy Sources
rpm Rounds per Minute
RR Replacement Reserve or Complementary Reserves
S Sulfur
SC Sub C
SO System Operator
SO2 Sulfur Dioxide
SQL Structured Query Language
SS Suspended Solid
TES Thermal Energy Storage
TRL Technology Readiness Level
TSO Transmission System Operator
UK United Kingdom
UTES Underground Thermal Energy Storage
V2G Vehicle to Grid
VARs Volt Ampere Reactive
VRB Vanadium Redox Battery
vRES variable Renewable Energy Sources
WPs Work Packages
WSHP Water Source Heat Pump

MAGNITUDE D1.1 - CARTOGRAPHY OF THE FLEXIBILITY SERVICES PROVIDED BY HEATING/COOLING, STORAGE AND GAS TECHNOLOGY AND SYSTEMS TO THE ELECTRICITY SYSTEM – R2.0
©MAGNITUDE Consortium 12 February 2019
Abbreviation / Acronym Description
WWTP Wastewater Treatment Plant
XBID Cross-Border Intraday Initiative
yr Year
Zn Zinc

MAGNITUDE D1.1 - CARTOGRAPHY OF THE FLEXIBILITY SERVICES PROVIDED BY HEATING/COOLING, STORAGE AND GAS TECHNOLOGY AND SYSTEMS TO THE ELECTRICITY SYSTEM – R2.0
©MAGNITUDE Consortium 13 February 2019
1 Background
Introduction
MAGNITUDE will address the challenge to bring under a common framework, technical solutions, market design and business models, to ensure that its results can be integrated in the overall ongoing policy discussion in the energy field. MAGNITUDE’s goal is to identify the possible flexibility options from enhanced synergies of the electricity, heating, cooling and gas networks, supporting the cost-effective integration of variable Renewable Energy Sources (vRES) and the decarbonisation of the energy system. Innovative technical solutions will be proposed to assist the transformation of Europe's energy system in a cost-effective manner by making it more flexible, decentralised, integrated, sustainable, secure, competitive, and putting consumers at its centre.
Flexibility is the core issue of MAGNITUDE, which is defined as the ability of the system to maintain continuous service in the face of rapid and large swings in supply and/or demand, of network topology changes and mismatch between supply and demand. A large amount of efforts have been focused on the flexibility of different technologies; and the development of innovative technical solutions relies on a deeper understanding of the technological and operational constraints (and associated rebound effects) to the exploitation of flexibility potential deriving from the coupling of electricity, heat, and gas networks and production technologies [1] [2] [3] [4] [5].
Multi-energy coupling technologies and their combinations have potentials to provide larger flexibilities through synergies with heat and gas networks. Therefore, the present deliverable aims at characterising such technologies and assessing their potential capacities of providing the flexibility services identified in Deliverable D3.1 of the project [6]. Based on the characters of single multi-energy technologies, more complex and advanced configurations can be proposed in order to achieve the aforementioned goal.
Objective
The main objectives of this deliverable are:
1. To present the different case studies and their system configuration 2. To identify flexibility services that can be provided to the electricity sector by coupling technologies
considered in the MAGNITUDE project (gas, electricity and heating and cooling systems) 3. To describe barriers for implementation, referring to the projects’ Case Studies.
Methodology
Deliverable 1.1 primarily targets the technologies available in and the services provided by the Case Studies, which cover both producers and consumers.
1. To understand the technical characteristics of the single technologies, a thorough technology review is first conducted, with special focus on flexibility, which can be reflected by ramp rate, ramp magnitude and ramp frequency. Data is also collected from the case studies through case study contact points.
2. The specification of provided services are also collected from each Case Study. By comparing the existing services and the services determined in Deliverable 3.1, the technical bottlenecks are identified.
3. To fullfill the requirements of specific services, new technology couplings are proposed by examining the technical characteristics of the existing technologies. Potential improvement strategies are identified through the communications with the case study contact points.

MAGNITUDE D1.1 - CARTOGRAPHY OF THE FLEXIBILITY SERVICES PROVIDED BY HEATING/COOLING, STORAGE AND GAS TECHNOLOGY AND SYSTEMS TO THE ELECTRICITY SYSTEM – R2.0
©MAGNITUDE Consortium 14 February 2019
Organisation of the report
The main characteristics of the case studies and coupling technologies are presented in Section 2. In Section 3, the main flexibility services to be found in the considered countries are mapped against the case studies analysed in Section 2. Possible bottlenecks and constraints to service provision and technological development needed to maximise the provision of the flexibility at the case study level are analysed and described in Section 3 and later summarised in Section 4.

MAGNITUDE D1.1 - CARTOGRAPHY OF THE FLEXIBILITY SERVICES PROVIDED BY HEATING/COOLING, STORAGE AND GAS TECHNOLOGY AND SYSTEMS TO THE ELECTRICITY SYSTEM – R2.0
©MAGNITUDE Consortium 15 February 2019
2 Technology review
Case studies: existing technologies and technology set up
This Section gives an overview of the 7 case studies and describes the technologies that are currently used in these cases studies.
2.1.1 Mälarenergi AB
Mälarenergi AB is the largest Combined Heat and Power (CHP) plant in Sweden. Mälarenergi started supplying the town of Västerås with district heating back in the 1960s, and today covering the heat demand of 97 % of Västerås properties. The plant achieves a very high efficiency (~90%) by producing electricity and heat simultaneously. The flowrate of the district heating water is between 1 300 to 10 000 m3/h. The supply and return temperatures in the network are 72 - 100ᵒC and 42 - 52ᵒC, respectively.
Mälarenergi AB primarily uses waste and biofuels to fire the plant, i.e. industrial wastes, household wastes and renewable fuels from the forest products. By using biofuels, the production is not only environmental friendly and sustainable, but also financially beneficial due to the emission trading that is now conducted within the EU and due to the waste trading with other European countries.
In Mälarenergi AB, there are six boilers (Boiler 1 to 6) installed for heat and electricity production. Each block represents the boiler together with the steam turbine. The steam from boiler 5 and boiler 4 jointly drive the steam turbine in block 4, which is thereby utilised optimally for the production of electricity. The operating time for boiler 4 and 5 are approximately 5 500 and 8 000 hours annually, respectively. The fuels used in bolier 4 can be tall oil pitch, oil, wood pellets, peat and coal. The fuel used in boiler 5 is only biofuels, which are wood chips, sawmill byproducts, recycled wood, energy forest and peat.
The new boiler 6 is the world's largest waste fired boiler, whose capacity is 167 MWth [7]. It is a co-incineration boiler based on circulating fluidised bed technology. It can handle 480 000 tons of household waste, industrial waste and recycled wood per year. It can avoid the emission of 300 000 tons of CO2 per year. It can produce 50 MW electricity, 120 MW district heat from turbine condenser and 30 MW district heat by flue gas condensation. The operating time for boiler 6 is 8 000 hours annually. Recently, boiler 4, 5 along with boiler 6 are responsible for the heat and power plant's basic production.
Boilers 1, 2, and 3 are operated during the peak load. The fuel used for boilers 1 and 2 is tall oil pitch, coal, and peat. Boiler 3 is oil-fired, which is not in operation anymore. Two heat storage tanks with the storage capacity of 25 000 m3 and 26 000 m3 are connected to the CHP and the district heating network to provide flexibility for the heat and power productions.
Generation Type Production (GWh/yr)
Electricity 422
Heat 1 536
Cooling 25
Table 2: Generation of electricity, heat and cooling at Mälarenergi
The district cooling network of Mälarenergi AB connects 40 large properties in Västerås, including the town hall and the hospital. The supplied cooling amounts for approximately 25 GWh annually. Cooling is produced by two heat pumps and one absorption system. The installed capacities of Heat pumps 1 and 2 are 10 MW for district cooling and 12 MW for district heating respectively. The absorption system produces

MAGNITUDE D1.1 - CARTOGRAPHY OF THE FLEXIBILITY SERVICES PROVIDED BY HEATING/COOLING, STORAGE AND GAS TECHNOLOGY AND SYSTEMS TO THE ELECTRICITY SYSTEM – R2.0
©MAGNITUDE Consortium 16 February 2019
7 MW of district cooling, which is driven by district heating. Figure 1 shows the plants and the network configuration of Mälarenergi AB [8].
Figure 1: Schematic diagram of the CHP system of Mälarenergi AB (Adapted from [8])
2.1.2 Paper mill in Austria
The European pulp and paper industry is one of the largest consumer of electricity and fossil fuels in the industrial sector. In 2014, the 919 European paper mills operated 1 289 paper machines which consumed 313 000 GWh of fuels (primary energy consumption). The fraction of biomass in total fuel consumption was 57.6% (approx. 180 000 GWh). The electricity consumption was 101 000 GWh. More than 90% of the on-site electricity generation (51 763 GWh) was produced by CHP. The total CO2 emissions were about 31.96 Mt [9].
The MAGNITUDE project will assess, based on the Austrian Paper Mill case study, the flexibility potential of industrial steam networks combined with co-generation. This technological setup is very common in energy intensive industries such as chemical and food-processing industries. Flexibilities of the industrial sector will have a very high potential to support variable RES integration and grid management in the European context. Thus, the developed methods and results will have a high replicability potential. Technological and market barriers for the use of flexibilities of the industrial sector will be analysed in this report and further investigated in the project.
The paper mill consists of two separate paper production lines (H, K) that are connected to the internal electrical grid. Each production line has its own steam network. The paper mill operates four gas fired and one biomass fired steam generators and consumes ca. 670 GWh of natural gas (68 Mio. m³ - ca. 50 Mio. Nm³/a -line H-, ca. 18 Mio. Nm³/a -line K-) and 230 GWh of electricity (ca. 150 GWh/a -line H- and ca. 80 GWh/a -line K-) per year, ca. 57% of which is produced by the CHP at sites.
The average power demand and the natural gas demand from public grid are 17 MW and 157 MW respectively for both production lines. For onsite production, there are:
1. four back-pressure steam turbines: Line H: 10 MW + 5.3 MW and Line K: 10.8 MW + 6.4 MW 2. four gas and biomass fired steam generators: Line H: Steam generator (100 t/h, 505ᵒC, 76 bar)
+ Backup steam generator (50 t/h, 500ᵒC, 73 bar) and Line K: Steam generator (40 t/h, 510ᵒC, 73 bar) + Backup steam generator (25 t/h, 510ᵒC, 73 bar).

MAGNITUDE D1.1 - CARTOGRAPHY OF THE FLEXIBILITY SERVICES PROVIDED BY HEATING/COOLING, STORAGE AND GAS TECHNOLOGY AND SYSTEMS TO THE ELECTRICITY SYSTEM – R2.0
©MAGNITUDE Consortium 17 February 2019
Line K also includes a black liquor recovery unit (26 t/h, 510ᵒC, 75 bar) and excess heat from the paper mill is delivered to the local district heating network by one production line.
Generation Type Overall Capacity Status
Electricity (MW) Line H: 10+5.3
Lin K: 10.8+6.4
Steam
Line H: 100 t/h, 505ᵒC, 76 bar Operational
Line H: 50 t/h, 500ᵒC, 73 bar backup
Line K: 40 t/h, 510ᵒC, 73 bar Operational
Line K: 25 t/h, 510ᵒC, 73 bar Backup
Table 3: Electricity and steam generation in Paper mill
Energy form Consumption (GWh/yr)
Electricity 230
Natural gas 670
Table 4: Energy consumption in Paper mill
2.1.3 HOFOR
Nordhavn is the largest urban development project in Copenhagen, Denmark. When fully developed, Nordhavn will provide living space for 40 000 inhabitants and workspace for another 40 000 people. Inner Nordhavn, accounting for approximately 34 hectares of land, consists of the local districts Århusgadekvarteret, Sundmolen and Trælastholmen. The development of Århusgadekvarteret with 350 000 m2, when finished is expected to provide space for 2 500 - 3 000 residents and workspace for 6 000 - 7 000 people. The ambition is to use it as a testbed for energy technologies, supporting Copenhagen's goal to become carbon neutral by 2025.
Nordhavn combines electricity, heating, energy efficient buildings and electric transport aiming to build an intelligent, flexible and optimised energy system. Through the project EnergyLab Nordhavn – New Urban Energy Infrastructures, there have been developed and demonstrated a number of future energy solutions (as seen in Figure 2).

MAGNITUDE D1.1 - CARTOGRAPHY OF THE FLEXIBILITY SERVICES PROVIDED BY HEATING/COOLING, STORAGE AND GAS TECHNOLOGY AND SYSTEMS TO THE ELECTRICITY SYSTEM – R2.0
©MAGNITUDE Consortium 18 February 2019
Figure 2: Integrated Energy Systems in EnergyLab Nordhavn [10]
1. Havnehuset Vest:
The district heating substation in combination with a heat pump helps raising ultra-low temperature district heating to a suitable level for the hot tap water use. A storage tank provides flexibility for the energy system depending on the load (Rating= 3 kWe, COP=4, tank size=2 000 l, Danfoss equipment).
2. Frikvarteret:
In a row of townhouses, water heaters (electric heat boosters) provide flexibility through their ability to shift between district heating and electric heating, based on the amount of wind power in the grid or load on the district heating network (Rating=3kWe, COP=1, tank size=92 l, METRO THERM equipment)
3. Flexheat:
At the new cruise terminal, the functionality of a large heat pump is expanded with added controls and extended heat storage, to be used as a flexible demand element on the electricity market while optimising the supply of heat to the local heat network (2 options to produce heat: 1- 250 kWe/800 kWh heat pump, 2*100 kWe heat elements, 4 MWh thermal storage, HOFOR).
In summary, it can be observed that the network is designed to allow introduction of new equipment such as booster heat pumps. Moreover, a number of decentralised electrical booster heaters is installed in the district heating system, to supplement heat energy at times of peak demand. Some single family row houses have a "fuel shift unit" installed, which combines a district heating supply with a storage tank and an electrical booster heater. Additionally, buildings adhere to the building regulations (BR2020) and could have building automation or controllable heating, or they could be connected to the district heating system.
Nordhavn uses a 4th generation low-temperature district heating system for supplying residential and commercial heat demand. The low temperatures employed increase the mass flow requirement and

MAGNITUDE D1.1 - CARTOGRAPHY OF THE FLEXIBILITY SERVICES PROVIDED BY HEATING/COOLING, STORAGE AND GAS TECHNOLOGY AND SYSTEMS TO THE ELECTRICITY SYSTEM – R2.0
©MAGNITUDE Consortium 19 February 2019
consequently the required network capacity for a given heat demand. This improves the business case for achieving heat peak shaving by using electrical fuel-shift units at building level, or by using electrical booster units embedded into the heat network. Electrical heating units (simple resistive heaters or heat pumps) connected to the district heating network are potentially able to provide services to the electrical grid by using the heat capacity and operational flexibility of the district heating network as storage. Each of these use cases requires close operational coordination between the electrical and thermal systems.
A map of the district heating network (purple lines and dots) and the electricity network (other lines and triangles) for the network in Århusgade is depicted in Figure 3. At the entry of Århusgade a heat meter for measuring the energy in the network is installed. HOFOR has mounted a main heat meter at the entrance of Århusgade to be able to measure all the energy flowing in and out. The nominal flow that can be measured by the meter is 400 m3/h. The temperature is measured with the precision of ± 0.1ᵒC. The data is measured continuously and stored in a Structured Query Language (SQL) database on hourly basis. All customers in the area and their heating centrals are equipped with electronic heat meters for remote metering of flow, energy and temperatures. Furthermore, HOFOR has mounted two pressure transmitters at the customer with the longest distance to the main heat meter for monitoring of the differential pressure and calculation of pressure losses in the Århusgade network. The nominal flow that can be measured by the heat meters in Nordhavn is variable depending on the expected demand, but until now, the maximal value is 80 m3/h. The measurements from the customer heat meters are also collected every hour and stored in a SQL database.
Figure 3: Map of district heating network and electricity network in Århusgade area, Nordhavn, Copenhagen [10]
Energy form Consumption (GWh/yr)
Electricity 0.575
Heat 10.1
Table 5: Energy consumption in HOFOR

MAGNITUDE D1.1 - CARTOGRAPHY OF THE FLEXIBILITY SERVICES PROVIDED BY HEATING/COOLING, STORAGE AND GAS TECHNOLOGY AND SYSTEMS TO THE ELECTRICITY SYSTEM – R2.0
©MAGNITUDE Consortium 20 February 2019
2.1.4 ACS
ACS case study is a “3rd generation” district heating network system located in the east side of Milan (called “Milano Est”), as shown in Figure 4. The district heating (DH) network is connected to several supply plants, which are equipped with all main interconnection technologies available between heat, gas and electricity: CHP engines (gas+heat+power), heat pump (power-to-heat), gas boiler (gas-to-heat), electric boiler (power-to-heat) under installation and thermal storage systems.
Close to this plant, there are other DH-plants owned by A2A, owner of ACS. One of the interesting projects taken into account in a mid-term planning expansion is the integration of these DH-plants to exploit the possible synergies among them (e.g. one of the programs involves the interconnection between two plants: North-Milan and West-Milan).
The plants are heat driven and are operated in order to supply the thermal demand. The daily planning is designed in order to supply the thermal load with the more environment friendly, efficient technologies at lowest cost. At the moment, the plants take advantages of the “green certificates” because of the heat production by natural gas. The plant is also involved in the energy markets, day ahead and intra-day, to exchange electrical energy in accordance with the heat production. No other services are planned to be provided at the moment.
Figure 4: District heating network in Milano Est [11]
This case study shows interesting features making it wider replicable in terms of developed methods and results for the most diffused district heating system designs across Europe.
Flexibility in the Milan district heating network is provided by combining different technologies (CHPs, heat pumps, electric boilers), adopting suitable operating modes to exploit as well thermal storage and the district heating inertial capacity. Additional flexibility might be obtained increasing thermal storage availability, or power-to-heat capability with heat pumps and electric boilers.

MAGNITUDE D1.1 - CARTOGRAPHY OF THE FLEXIBILITY SERVICES PROVIDED BY HEATING/COOLING, STORAGE AND GAS TECHNOLOGY AND SYSTEMS TO THE ELECTRICITY SYSTEM – R2.0
©MAGNITUDE Consortium 21 February 2019
Currently the installed units include (see Table 6): 3 gas boilers (15 MWt), 3 CHP engines (5.04 MWe, 4.4 MWt), a heat pump (Unitop FY-81611 U) and thermal storages (1 000 m3). Figure 5 illustrates the connections of the different units. Another heat pump (UNITOP 22/22AY - 6087U) and an electric boiler will also be installed in 2018.
Figure 5: Map of units connections [11]
Equipment Installed capacity
Heat Pump 1 15 MWt
Heat Storage (2 units) 11 MWt (35 MWh with ΔT=25ᵒC Max. Capacity) (x 2)
Gas boiler (3 units) 15 MWt (x 3)
Gas engine (3 units) 5.04 MWe, 4.4 MWt (x 3)
Heat Pump 2 (1 unit from 4/2018) 3 MWt
Electrical Boiler (1 unit from 4/2018) 10 MWt
Table 6: installed capacity at ACS
The A2A-ACS plant is operated according to two different control strategies associated to the ambient temperature:
1. Average cold day 2. Coldest day
The operation in these two different conditions involves different sets of technologies.
In case A, the two heat storages (HSs) are filled by the CHPs (one or both depending on the thermal load request) during night hours. As long as the heat demand increases early in the morning, the CHP are activated to supply this demand, and heat storages are progressively discharged to complement the heat production. During the morning hours, once the heat storages are emptied, the demand is completely supplied by the CHPs. This schedule is completed with a re-charge of the heat storages by means of the CHPs, during off-peak hours during the day and the night.
The plant operation in the case B concerns those days where the total installed thermal capacity is required to satisfy the heat demand. Early in the morning, the CHPs supply the thermal demand and recharge the HSs (as in case A). When the thermal load increases, the CHPs are moved from charging the HS to supply the thermal load. At six o’clock, the heat pump (HP) is switched on and it remains in operation all the day long. Therefore, in the morning the configuration of the operated technologies includes the CHPs, the HSs and the HP. During the day, if needed, the three gas boilers are used to face specific thermal peak demand. This operation schema is followed until evening when the HP is turned off, and progressively the CHPs are moved from thermal load supply to HSs recharge [11].

MAGNITUDE D1.1 - CARTOGRAPHY OF THE FLEXIBILITY SERVICES PROVIDED BY HEATING/COOLING, STORAGE AND GAS TECHNOLOGY AND SYSTEMS TO THE ELECTRICITY SYSTEM – R2.0
©MAGNITUDE Consortium 22 February 2019
2.1.5 Neath Port Talbot
Neath Port Talbot is a part of the TATA Steel Port Talbot steelworks stretching around the coast to the proposed Swansea Bay Tidal Lagoon, as illustrated in Figure 6.
A tidal lagoon/barrage is designed to use the movement of the oceans to create energy. As the tides rise and fall water is channelled through turbines, which rotate to extract the power. This is a simple concept that only requires a few main parts to operate.
The turbines are submerged in the water and are located in the walls of the lagoon. They extract the potential energy of the difference in height between the water each side of the lagoon. The water rushes through the turbines forcing them to rotate creating kinetic energy, which the turbines then convert into electric energy by moving generators. The efficiency and durability of these have been maximised over time
1. Sluices are another important feature of a tidal lagoon. Sluices are openings in the lagoon’s wall. These can be opened and closed and are designed to allow large volumes of water to pass into or out of the lagoon in a short period of time.
2. Embankments or cassions are the final component essential to the tidal lagoon. The main role of this structure it to provide a watertight seal to hold the water in or prevent it from entering the lagoon. This is important, as any leakage would reduce the capacity of the lagoon. This is because there would be a reduction in the head difference either side of the wall. In addition to this, the embankment also provides a safe housing for the power cables connecting the turbines to the grid [12].
Figure 6: Neath Port Talbot [13]
The Neath Port Talbot County Borough Council area is the 8th most populous local authority area in Wales with a population of about 140 000 residents (2011 census). The electrical generators within the demonstration site include two biomass power stations, a Combined Cycle Gas Turbine (CCGT) power

MAGNITUDE D1.1 - CARTOGRAPHY OF THE FLEXIBILITY SERVICES PROVIDED BY HEATING/COOLING, STORAGE AND GAS TECHNOLOGY AND SYSTEMS TO THE ELECTRICITY SYSTEM – R2.0
©MAGNITUDE Consortium 23 February 2019
station, a solar farm, a wind farm and the proposed Tidal Lagoon. In terms of consumers, the demonstration site includes the steelworks (with onsite electrical generation from waste gases and heat), Welsh Water Treatment plant (with onsite electrical generation), the cement works, the paper mill, the Amazon warehouse, British Oxygen Company (BOC) Industrial gases plant, schools, hospitals, council offices, the University of South Wales Hydrogen Centre, Cardiff University’s Gas Turbine research centre and Swansea University’s Bay Campus. Detailed data on overall generation and demand is presented in Table 7 and Table 8, respectively.
Generation Type Overall Capacity
(MW) Status
Solar Generation 16.6 Operational
33.28 Under construction or proposed
Wind Generation 58 Operational
331.5 Under construction or proposed
CCGT + Biomass 614 Operational
1 490 Under construction or proposed
Swansea Tidal Lagoon 320 Proposed
Table 7: Electricity generation in Neath Port Talbot
Demand Type Aggregated Annual Energy Demand (GWh)
Domestic Non-domestic Total
Gas 740 368 1 108
Electricity 205 1 401 1 606
Table 8: Gas and electricity demand in Neath Port Talbot [14]
In terms of electricity supply, Neath Port Talbot area is served by Western Power Distribution using different substations with voltages ranging between 132 – 11 kV. The gas in this area is served by Wales and West Utilities through different gas pressure levels. Details of the electricity and gas networks including the electricity network parameters (e.g. feeder lengths, types of overhead conductors and underground cables), generation capacities of distributed generation (> 1 MW), gas pipe diameters and lengths and the energy demands are available and ready to use. The schematic diagrams for the electricity and gas networks in Neath Port Talbot are presented in Figure 7 and Figure 8 respectively.

MAGNITUDE D1.1 - CARTOGRAPHY OF THE FLEXIBILITY SERVICES PROVIDED BY HEATING/COOLING, STORAGE AND GAS TECHNOLOGY AND SYSTEMS TO THE ELECTRICITY SYSTEM – R2.0
©MAGNITUDE Consortium 24 February 2019
Figure 7: Electricity networks in Neath Port Talbot [14]
Figure 8: High pressure gas networks feeding Neath Port Talbot [15]
2.1.6 EMUASA
Murcia Este Waste Water Treatment Plant (WWTP, Figure 9) is a comprehensive “multi energy system”. Biogas, resulting from sludge Anaerobic Digestion (AD), is continuously produced and used to feed a Combined Heat and Power (CHP) plant, producing heat and electricity that are used onsite. Electricity is also produced by means of solar panels installed in parking areas and over roofs. All electricity produced by
SWANSEA NORTH 400kV
SWANSEA NORTH
275kV
SWANSEA NORTH 132kV
275/132kV
transformer
400/275kV
transformer
400/275kV
transformer
BAGLAN BAY 275kV
MARGAM 275kV
GRANGE 66kVCEFN GWRGAN
66kV
PYLE 275kV
PYLE 132kV
275/132kV
transformer
275/132kV
transformer275/66kV
transformer
132/66kV
transformer
BOC
MARGAM
132kV
13
2/3
3k
V
tra
ns
form
er
NORMALLY OPEN CONNECTION
TIR JOHN 33kV
11kV
Secondary
Substations
(7)
132/33kV
transformer
BRITON FERRY 33kV
33/11kV
transformer
11kV
Secondary
Substations
(5)
TATA STEEL
66/11kV
transformer 11
kV
Se
co
nd
ary
Su
bs
tati
on
s
(3)
`
11
kV
Se
co
nd
ary
Su
bs
tati
on
s
(2)
13
2/3
3k
V
tra
ns
form
er
33/11kV
transformer
11kV
Secondary
Substations
(4)
33/11kV
transformer
11kV
Secondary
Substations
(2)
400/132kV
transformer
275kV
400kV
132kV
33kV
66kV
11kV
NTS
1
2
3
4
567
8
9
10
12
13
14
11
1
2
3
4
56
14
13
12
11
10
9
8
7

MAGNITUDE D1.1 - CARTOGRAPHY OF THE FLEXIBILITY SERVICES PROVIDED BY HEATING/COOLING, STORAGE AND GAS TECHNOLOGY AND SYSTEMS TO THE ELECTRICITY SYSTEM – R2.0
©MAGNITUDE Consortium 25 February 2019
the PV (no self-consumption) is injected to the electric network. As forthcoming motivations, a small upgrading plant will be installed in the WWTP to produce biomethane for automotive uses (2.5 m3/h).
Aeration accounts for the biggest share in the total energy consumption, about 54%; followed by wastewater pumping (14%), anaerobic digestion (14%), and lighting and building (8%). Clarifiers, blet press, grit, screens, chlorination and return sludge pumping only account for less than 10%.
Figure 9: Murcia Este WWTP [16]
This facility, located in the city of Murcia (Spain), treats sewage collected through the municipal sewer network. The plant occupies a plot of around 12.5 ha and is located downstream from Murcia on the left bank of the Segura River, around 700 m from the confluence with the Guadalentín River. Murcia Este WWTP was designed to treat 100 000 m3/d with peak season contaminant loads of 588 mgBOD5/l and 548 mgSS/l. The wastewater treatment is carried out by means of a modified Anaerobic-Anoxic-Oxic (A2O) process for biological nutrient removal, which includes anaerobic, anoxic and aerobic stages, allowing significant nutrients (nitrogen (N) and phosphorous (P)) removal. The effluent is returned to the Segura River, actively contributing to the river’s regeneration and conservation.
The sludge produced during the wastewater treatment feeds three flat-bottomed anaerobic digesters, each 26 m in diameter by 11.5 m usable height, with a total volume of 18 317 m3. The units are thermally insulated and equipped with concentric tubes heat exchanger that allow homogenous and suitable temperatures maintenance for the proper development of the process. The hot water required for the heat exchanger is generated via the excess heat produced by the cooling circuit of the cogeneration engines or through a boiler, also fueled by biogas.
Anaerobic sludge digestion comprises a balance of biochemical reactions in which organic matter, in the absence of oxygen, and through the action of a group of specific bacteria, decomposes to obtain a gas mixture called biogas and a solid residue, called digestate. On one hand, the conversion of long chain carbon compounds that feed the digesters (proteins, amino acids, etc.) into short chain (volatile) acids takes place. In the second stage, these volatile acids are converted into methane (CH4). All these biochemical conversions are possible due to the action of the anaerobic bacteria that develop at the digester operating temperature (37ᵒC). Under these conditions, a reduction of up to 45 % in volatile matter within the digesters can be achieved, yielding as a by-product biogas, with an average CH4 content of 65 %.
This biogas is stored in two double-membrane spherical gasometers with a capacity of 1 350 m3 and is pretreated to eliminate unwanted compounds before to feed the CHP plant. The following minimum quality of biogas has been established to avoid deterioration of the equipment installed in the plant: (1) Hydrogen Sulfide (H2S) concentration < 300 ppmv and (2) Siloxanes concentration <10 mg/Nm3.

MAGNITUDE D1.1 - CARTOGRAPHY OF THE FLEXIBILITY SERVICES PROVIDED BY HEATING/COOLING, STORAGE AND GAS TECHNOLOGY AND SYSTEMS TO THE ELECTRICITY SYSTEM – R2.0
©MAGNITUDE Consortium 26 February 2019
For removal of H2S a biochemical desulphurisation system, has been installed, based on a biogas washing with a solution of sodium hydroxide (NaOH). The saturated solution is regenerated with a biological process and returned to the process, combining high removal efficiency and low operational costs.
Then there is a polishing including:
1. a chiller, reducing biogas temperature to about 5 - 10ᵒC, so that relative humidity value is lower than 50 %, necessary for optimal operation in the next stage;
2. two activated carbon filters operating in parallel so that, when one is saturated, biogas is passed to the second and the first filter is regenerated, thereby ensuring the supply of clean biogas to the engines.
The plant includes three engines of 500 kW of unitary nominal power, cabs independently in containers of dimensions 12.2 x 3.0 x 2.8 m, thus preventing noise pollution problems in the WWTP’s surroundings. Two of them are continuously running while the third one is a stand-by engine, it works in case of breakdown or preventive maintenance. The installation allows the recovery of heat from the cooling of high temperature engine circuit through a 1 038 kWt water-water heat plate exchanger.
All pipes from the heat recovery circuits are thermally insulated in order to achieve maximum energy efficiency. Measurement devices are distributed along the lines (field thermometers, thermocouples, pressure gauges, etc.) in order to control and ensure the correct operation of the installation.
Energy recovery of biogas generated in the WWTP can cover 100 % of the heat requirement and an important part of the electricity consumption of the installation, contributing to reach the GreenHouse Gas (GHG) emissions reduction targets of the company and avoiding sulfur dioxide (SO2) emissions from the combustion of raw biogas flaring.
Equipment Installed capacity Energy
Electricity generation
Cogeneration 3x 500 kW 7 741 MWh (2017)
Photovoltaic 520 kW 660.83 MWh (2017)
Energy consumption
Electricity consumption 6 000 kW 10 235.87 MWh (2017)
Heat consumption 1 038 kW (heat exchanger) 5 405.9 MWh (2017)
Table 9: Installed capacity at ACS
2.1.7 Paris Saclay
Paris Saclay is one of the most innovative district heating and cooling (DHC) in France. It combines low temperature exchange networks, demand management but also articulation with electrical grids and gas grids. Still under construction, it is built along the massive 562 hectares urban development project of Paris- Saclay (1 800 000 m² of offices, equipment, universities, and dwellings). The urban development has started in 2015 and is planned to finish in 2028. The DHC first phase should end in 2021 - 2022 with 1 200 000 m² connected to it (around 70 buildings). The network length will be between 20 to 25 km.
The DHC is alimented by two geothermal wells of 700 m depth (200 m3/h - 30ᵒC) along with 7 semi-centralised heat pumps stations and natural gas boilers. The heating and cooling capacities are 37 MW and 10 MW respectively and the expected Heat and Cold productions are 40 GWh/y and 10 GWh/y. For heating, the baseload is met thanks to deep geothermal and heat pumps whereas gas boilers are used for peaks. For cooling, the baseload is met by heat pumps and wet coolers are used for peaks. The expected energy mix is 60 % geothermal, 36% electricity, and 4% gas. CO2 emission is supposed to be less than 100 kg/MWh for the heat.

MAGNITUDE D1.1 - CARTOGRAPHY OF THE FLEXIBILITY SERVICES PROVIDED BY HEATING/COOLING, STORAGE AND GAS TECHNOLOGY AND SYSTEMS TO THE ELECTRICITY SYSTEM – R2.0
©MAGNITUDE Consortium 27 February 2019
There are four different sub-systems in the DHC, including two major loops: a geothermal network and medium low temperature network 30ᵒC - 15ᵒC feeding the heat pump, and two series of secondary loops from the heat pumps stations to the buildings: 7 hot water networks 63ᵒC - 45ᵒC and 7 cold water networks 6ᵒC - 12ᵒC. The low temperature network (30ᵒC - 15ᵒC) will allow consumers to reinject waste heat in this network for the benefit of the other consumers and the mix of users will allow the balance of the overall heating and cooling needs. Regarding the coupling with the electricity grid through the heat pumps, the heat power is 355 kW for heat pumps in each substation and the cold power is 237 kW for each heat pump in substations of buildings where cooling is required. With the different complementary energy sources, electrical peak shaving will be possible. Besides, consumers’ facilities will be equipped with a building management systems which should allow to anticipate and act on the demand side. By 2022, 2000 sensors will be deployed to monitor and optimise the DHC and optic fibre will be installed along the pipes. The DHC is still under construction and the energy centre should be put in operation in March 2019.
Energy forms Installed capacity (MW) Production (GWh)
Heat (HP+gas boiler) 37 40
Cooling 10 10
Table 10: Installed capacity and production at Paris Saclay
Main characteristics and features of the reviewed technologies
This Section reviews the existing technologies in the case studies mentioned in Section 2.1 with special focus on the provision of flexbible services. The technologies cover the following categories:
1. Heat to power a. heat generation: biomass boilers, and gas boilers b. power generation: steam turbines, gas turbines, and gas engines
2. Power to heat/cold a. power to cold: chillers b. power to heat: heat pumps, and electrical boilers
3. Energy storage a. electrical energy storage b. thermal energy storage
4. Energy networks: a. district heating and cooling b. electricity grid
5. Heat to gas a. anaerobic digestion
2.2.1 Biomass boilers
Boilers convert the chemical energy of fuel to heat. Through the combination with steam turbines, they can provide flexibility in the electricity grid. Biomass boilers, as a mature technology with Technology Readiness Level (TRL) of 9 [17], are the most commonly used technologies for solid biomass. Depending on the combustion system, the large biomass boilers used in power plants can be divided into fixed bed combustion type, suspension burner type, and fluidised bed combustion type [18], which are suitable for different types of biomass. The fixed bed combustion system further includes grate furnaces and underfeed stokers and the fluidised bed combustion system includes bubbling fluidised bed (BFB) and circulating fluidised bed (CFB). Council of Industrial Boiler Owners (CIBO)’s data indicate that, on a cold or warm start up, the total time for fluidised bed boilers to reach stable operation ranges from 6.5 to 45 hours, while for stoker or hybrid suspension grate units the total time is 2.2 to 32 hours. CIBO also collected information

MAGNITUDE D1.1 - CARTOGRAPHY OF THE FLEXIBILITY SERVICES PROVIDED BY HEATING/COOLING, STORAGE AND GAS TECHNOLOGY AND SYSTEMS TO THE ELECTRICITY SYSTEM – R2.0
©MAGNITUDE Consortium 28 February 2019
regarding the time required to reach stable conditions after achieving 25 % load. CIBO’s 25 % load data is a reasonable indicator of the time necessary for units to move from useful thermal energy to safe and stable conditions. Fluidised bed boilers can take up to 26 hours to reach stable conditions after reaching 25 % load, while stoker and hybrid suspension grate type units can take up to 20 hours to reach stable conditions after reaching 25 % load [19]. Together with steam turbines, biomass boilers can provide flexible operation to electricity generation. No information is available about the ramp rate of biomass boilers, as the properties of biomass vary significantly and are affected by many factors, such as moisture content, fuel composition etc. Referring to coal fired boilers, the ramp rate can be 1.5 – 6 % of the nominal load per minute [20].
2.2.2 Gas boilers
Gas boilers convert the chemical energy of natural gas to heat. Gas boiler is a mature technology with Technology Readiness Level (TRL) of 9. In Europe, among the active power plants with gas-fired boiler and steam turbine, only 5 of 107 were commissioned after 1995. More than half of these active power plants were commissioned before 1980. The latest gas-fired boiler for electricity generation was deployed in Finland in 2016 [21]. According to the data in GlobalData, countries with these active power plants include Azerbaijan, Belarus, Belgium, Bulgaria, Czech Republic, Finland, Georgia, Germany, Greece, Hungary, Ireland, Italy, Lithuania, The Netherlands, Republic of Moldova, Romania, Russian Federation, Turkey, and United Kingdom. The remaining countries do not have any in the electrical grid. The existing facilities have a limited ability to provide capacity and flexibility products when they are online. Start-up times generally are too great to provide intra-hour flexibility where the gas-fired boiler is not already online. Boiler plants have operating limitations that lower their ramping flexibility relative to many other generation options [22]. The typical start-up time for gas-fired steam boilers is between 4 and 6 hours. Gas boiler, usually as back-up capacities, are coupled with the district heating network to provide the peak heat load. The typical start-up time for the heat only boilers (HOB) in the district heating network is usually 1-2 hours.
Low-capacity gas boilers are also widely deployed for domestic use where residential gas is available.
2.2.3 Steam turbines
A steam turbine is a device that extracts thermal energy from pressurised steam and uses it to do mechanical work on a rotating output shaft. It is particularly suitable to drive an electrical generator to produce electricity. Steam turbines are manufactured in a variety of sizes, for example, utility steam turbines ranging from 90 MW to 1 900 MW with inlet steam pressure of 80 - 260 bar and steam temperature of 310ᵒC - 610ᵒC [23]. According to the heat drop process, Steam turbines can be classified into Condensing turbines, Condensing turbines with one or more intermediate stage extractions, Back pressure turbines and Topping turbines. Steam turbine is a mature technology with Technology Readiness Level (TRL) of 9.
Steam turbines can accept steam provided by different types of boilers to provide flexibility. The data from Agora Energiewende [24] indicate that the cold start-up time in hard-coal-fired plant and lignite-fired plant are 5 - 10 hours and 8 - 10 hours, respectively. The hot start time for these two types of power plant are 2.5 - 3 hours and 4 - 6 hours respectively. The ramp rates in these plants are 1.5 - 4 %nominal load/minute and 1 - 2 %nominal load/minute. Steam turbines can also be coupled with gas turbines in Combined Cycle Gas Turbine (CCGT) plant. The latest technology can reduce the CCGT hot-start time to 65 minutes, and the shutdown time is reduced to 25 minutes [24] [25].
2.2.4 Gas turbine
Gas turbines are turbomachines that produce power in a thermodynamic process (Brayton cycle). They consist of a turbine, a combustion chamber, a compressor (axial or centrifugal flow) and a shaft. The hot gases produced by an internal combustion of natural gas spin the turbine.

MAGNITUDE D1.1 - CARTOGRAPHY OF THE FLEXIBILITY SERVICES PROVIDED BY HEATING/COOLING, STORAGE AND GAS TECHNOLOGY AND SYSTEMS TO THE ELECTRICITY SYSTEM – R2.0
©MAGNITUDE Consortium 29 February 2019
Gas turbines may be slow for the needs of demand variation. It is needed between 55 minutes (hot start) and 170 minutes (cold start) to start and between 20 and 25 minutes to stop. Additionally, it is needed more than 64 hours (minimum) between start and stops for cold starts although this time can be reduced to 16 hours with warm starts and even less than 16 hours with hot starts [26] [27].
It is also important to consider the ramp up/down times:
1. start-up ramps are steep for very low load rates: around 10 MWe/min 2. ramps to minimum turndown level: around 4 MWe/min 3. between minimum turndown and full capacity: up to 6 MWe/min 4. ramps to full capacity: around 8 MWe/min
The performance of gas turbines can be monitored with the outlet and inlet air’s temperature [28] [29]. Usually, the power plant efficiency range between 30 - 40 %. This efficiency can be improved to 55 - 60 % by heat recovering. This performance is usually reduced after 4 000 operation hours by 10 %. The maximum operation hours are usually not more than 1 000 hours per year [30].
2.2.5 Gas engine
Gas engines consist of some cylinders where the gas (such as biogas or natural gas) is burnt. This combustion drives a crank shaft, which turns an alternator to generate electricity. Heat from the combustion process must be recovered or used in a combined heat and power configuration or dissipated via dump radiators located close to the engine. They have high efficiency percentages when using natural gas as fuel: for general gas engines, thermal efficiency, electrical efficiency and total efficiency are respectively about 43 %, 46 – 48 %and 89 % of the lower heating value of the fuel [31].
Maintenance is necessary because of the need for oil change (for example, [32] recommends an oil change after 750 h, [33] after 1 200 h for natural gas engines and after 700 h for biogas engines, etc.). Despite this, gas engines have a high availability. For example, the Jenbacher gas engine has its major overhaul at 60,000 hours of operation; and an availability of 95% was assumed [34].
Gas engines have low start-up times (5 - 10 minutes) which make them able to respond to consumption variation needs although they have limitations to work in minimum load being able to work at a minimum load of 30 – 35 % just for 95 hours [27].
2.2.6 Chiller
There are two basic types of chiller cycles: vapor compression and sorption. To power the cycle, vapor compression chillers use reciprocating, screw, or centrifugal compressors. Sorption chillers (absorption or adsorption) are driven by the thermal energy, which can be from a direct-fired burner integrated with the chiller or from thermal energy supplied indirectly to the chiller [35].
A typical chiller for air conditioning applications is rated between 0.7 kW to 7 MW, and at least one manufacturer can produce chillers capable of up to 18 MW [36]. Chilled water temperatures can range from 2 to 7ᵒC, depending on application requirements [37]. Centralised chillers generally have capacities ranging from 35 kW to more than 3.5 MW [4]. Decentralised chillers are usually small in size and cooling capacity, usually from 0.7 kW to around 35 kW [38].
The efficiency of an absorption chiller is measured by the coefficient of performance (COP) and the integrated part load value (IPLV). The COP and IPLV of the Water-cooled electrically operated (centrifugal) at the capacity < 0.5 MW are 5.00. While, the COP and IPLV of the Absorption double effect (indirect fired) are 1.00. The start-up time, shut down time and ramp up/down time of the compression chillers are in the same range as the ones of heat pumps [39] [40].

MAGNITUDE D1.1 - CARTOGRAPHY OF THE FLEXIBILITY SERVICES PROVIDED BY HEATING/COOLING, STORAGE AND GAS TECHNOLOGY AND SYSTEMS TO THE ELECTRICITY SYSTEM – R2.0
©MAGNITUDE Consortium 30 February 2019
2.2.7 Energy storage
Energy storage can store energy produced at one time for use at a later time.
2.2.7.1 Electrical Energy Storage
Electrical Energy Storage systems (EESS) can be adopted to provide a number of different services in different operation conditions: power/energy and changing from charging to discharging and vice-versa; but with very strict time constraints.
A comparison between different electrical energy storage technologies and suitability for the most important applications is depicted in Figure 10. The relationship between time duration of the service, the service and power is provided in Figure 11. The relationships between the power provision and the service duration typically for a number of different storage technologies is depicted in Figure 12.
Figure 10: Comparison between different electrical energy storage technologies and suitability [11]
Figure 11: Relationships between time duration of the service, the service and power [11]

MAGNITUDE D1.1 - CARTOGRAPHY OF THE FLEXIBILITY SERVICES PROVIDED BY HEATING/COOLING, STORAGE AND GAS TECHNOLOGY AND SYSTEMS TO THE ELECTRICITY SYSTEM – R2.0
©MAGNITUDE Consortium 31 February 2019
Figure 12: Relationships between the power provision and the service duration [11]
Figure 13 illustrates the current trends of the different technologies related to the different development phases (i.e., research, design, test, operation and market product), with 2030 time horizon.
Figure 13: Current development phases for different technologies [11]
Electrical Energy Storage (EES) has many applications, such as
1. Energy time shift, which is the ability to buy energy when the prices are low and to sell the stored energy when the price is high.
2. RES integration, which allows renewable energy sources to charge the EES during the low energy price periods and discharge the stored energy during the higher energy price periods.
3. Grid investment deferral and grid congestion management. In those cases when a grid unit is operated close to its limits an EES can solve the overload issues possibly arising. When the grid is overloaded, the EES is operated to shift in time a portion of the power in the grid. This designed ability can defer the need to invest in new grid expansion, and it is able to decrease the congestion problems possibly arising during the grid operation.
4. Primary frequency regulation or Frequency Containment Reserve. When an unbalance between generation and demand occurs this impacts the grid frequency. As stated in Section 3.1, Frequency Containment Reserve (FCR) is very fast: it requires to deliver 50% of the active power reserve within 15 secs and 100% in 30 secs. EESs generally satisfy this constraint, since their response time, ramp-up and

MAGNITUDE D1.1 - CARTOGRAPHY OF THE FLEXIBILITY SERVICES PROVIDED BY HEATING/COOLING, STORAGE AND GAS TECHNOLOGY AND SYSTEMS TO THE ELECTRICITY SYSTEM – R2.0
©MAGNITUDE Consortium 32 February 2019
ramp down, take actually much less time to reach the expected power. FCR also requires to maintain 100% of regulating power between 15 and 30 minutes. From a general point of view EESs satisfy this constraint, but it really depends on the specific storage operative states. Indeed, the state of charge of the EES can be incompatible to maintain the support for FCR. EESs strongly contribute to primary frequency regulation, but it is needed to operate them leaving their state of charge with enough margins.
5. Secondary frequency regulation. The secondary frequency control or aFRR, as defined in Section 3.1, is well suited with the characteristics of EESs as they provide the regulating power within the required activation time constraints. Though, even in this case, as for FCR, EESs must be operated in order to satisfy also the duration of the service provision. Indeed in this case the service generally requires to provide the regulating power for at least 2 hours.
6. Tertiary frequency regulation or mFRR can be covered by EESs. In this case the service activation requires slower time constraints and longer duration of the service provision. The operation of EESs for the mFRR provision have to be carefully managed not to violate the service deployment duration.
2.2.7.2 Thermal Energy Storage
Thermal energy storage (TES) is a key element for effective and efficient generation and utilisation of heat in those cases where heat supply and heat demand do not match in time, space, temperature and power. TES systems provide both environmental and economic benefits by possibly reducing the need for burning fuels. TES from a physical perspective can be classified into sensible, latent (also called as phase change material storage – PCM storage) and thermo-chemical heat storage, as shown in Figure 14.
Figure 14: Different types of thermal energy storage [11]
Sensible heat storage
The use of sensible heat results in an increase or decrease of the storage material temperature. Stored energy is proportional to the temperature difference of the used materials. Today, liquids (mostly water), molten salts and solids may be used as heat storage media. Solid materials can be utilised in a wide temperature range and heated up to very high temperature (e.g. refractory bricks in Cowper regenerators to 1 000 ᵒC). The materials’ density is between 1 000 kg/m3 (water) and 2 500 kg/m3 (soil, bricks). Natural materials in the form of rocks and pebbles are abundant and cheap.

MAGNITUDE D1.1 - CARTOGRAPHY OF THE FLEXIBILITY SERVICES PROVIDED BY HEATING/COOLING, STORAGE AND GAS TECHNOLOGY AND SYSTEMS TO THE ELECTRICITY SYSTEM – R2.0
©MAGNITUDE Consortium 33 February 2019
For low temperatures, rock and soil can be used as ground storage. The drawback exhibited by these materials is the difficult thermal transfer. Of the manufactured solid materials, various ceramics are widely used as heat storage materials. In the low temperature range, bricks act as a buffer for the acclimatisation of buildings. At higher temperatures, refractory bricks based on oxides (silica, alumina, magnesia and iron oxide), carbonates (e.g. magnesite) and their mixtures are commercially used in applications such as Cowper regenerators, night-storage heaters and tiled stoves.
Latent heat storage
The use of latent heat is connected with a phase transformation of the storage materials (phase change materials - PCM), typically changing their physical phase from solid to liquid and vice versa. The application range of PCMs is between 10ᵒC and 800ᵒC. The latent heat of PCM is between 100 and 500 kJ/kg. The density of PCM is in the area of 750 up to 2 000 kg/m3 but is different between the solid and liquid phases. For refrigeration below 0ᵒC, ice slurries using a solution of water-salt (brine) and water-glycol can be used. For the heating and cooling of buildings, PCM systems can be located in the floor, ceiling, wall or ventilation channels. Typical storage temperatures range from 40ᵒC to 70ᵒC. The heat transfer is usually limited by the low thermal conductivity of the PCMs.
Currently commercially available TES systems are solely sensible heat storage systems to be used in connection with single phase heat transfer fluids. The predominant TES system is water storage mainly used in the domestic heating sector. Due to the surface area – volume ratio, heat losses for smaller seasonal storage tanks are too high. Underground Thermal Energy Storage (UTES) for low temperature applications (at less than 40ᵒC) has been demonstrated and it is now available in some European markets, particularly in The Netherlands, Sweden and Germany.
For a widespread use and market penetration of TES for RES, the available heat storage technologies show still too high investment costs. Therefore, cost reduction of existing TES technologies as well as development of new cost effective TES concepts are the key issues to be solved. In addition, energy density and reliability are topics to be further improved.
2.2.8 Heat pump
Heat pump is a technology that extracts heat from a medium with relatively low temperature (heat source) and transfer it to a point of heat demand with a higher temperature (heat sink). The operation of heat pumps is shown in Figure 15.
For individual use, two of the major types of heat pumps are Air Source Heat Pump (ASHP) and Ground Source Heat Pump (GSHP). GSHPs use pipes that are buried in the ground to extract heat from the soil. These pipes are called ground-loop, and a mixture of water and antifreeze flows through them. Air source heat pumps (ASHPs) absorb heat from the outside air. For DH, Water Source Heat Pump (WSHP) are also an available technology which takes advantage of the relatively consistent temperature of large water sources to maintain high performance over the year. It has to be noted that most heat pumps are only capable of delivering output temperatures of ca. 80ᵒC, but some high temperature heat pumps can produce heat at temperatures up to 130ᵒC.

MAGNITUDE D1.1 - CARTOGRAPHY OF THE FLEXIBILITY SERVICES PROVIDED BY HEATING/COOLING, STORAGE AND GAS TECHNOLOGY AND SYSTEMS TO THE ELECTRICITY SYSTEM – R2.0
©MAGNITUDE Consortium 34 February 2019
Figure 15: Schematic of the operation of a typical heat pump [41]
Coefficient of Performance (COP) is a measure for heat pumps efficiency. The COP is determined by the ratio between energy usage of the compressor and the amount of useful heat supplied by the heat pump. The COP of heat pumps depends on several factors, especially temperature difference between heat source and heat sink (required output temperature). Figure 16 shows an example of the COP of a heat pump in relation to the ambient air temperature for two sink temperatures. The closer the sink temperature is from the source, the higher is the COP of the system.
Figure 16: Performance of Air-Water heat pump for hot water temperatures of 35ᵒC and 50ᵒC [39]
Heat pumps currently cannot provide temperatures above 90ᵒC, besides some new development. Therefore, during days when outside temperature is low and heating demand is high, a supplementary source of heating is required to fill the gap between heat produced by the heat pump and the heat demand, as seen in Figure 17 [39].

MAGNITUDE D1.1 - CARTOGRAPHY OF THE FLEXIBILITY SERVICES PROVIDED BY HEATING/COOLING, STORAGE AND GAS TECHNOLOGY AND SYSTEMS TO THE ELECTRICITY SYSTEM – R2.0
©MAGNITUDE Consortium 35 February 2019
Figure 17: Example of heat pump performance results [40]
2.2.9 Electrical boiler
An electrical boiler is a device that uses electrical energy to boil water either thanks to a resistance or through current passing directly through the water (electrode boiler). Boilers can provide heat for water heating, space heating and process heating (in industrial technologies). Electric boilers can be distinguished according to the temperature application and to their capacity.
The classical electric boiler mainly consists of an insulated tank, thermostats, electric heating elements, anode rod, inlet/outlet pipes and some valves. It heats water in a tank and is available in various sizes and capacity (from 4 kW to 2 MW). The conversion efficiency is 99% and the intial investment is one of the lowest for a boiler (between 130 to 160 €/kW). The temperature range goes from 0 ᵒC to 120 ᵒC with a voltage requirement of 240 or 400 V. The lifetime of such boiler is usually around 15 years [42].
For the electrode boiler, the water is heated by means of an electrode system consisting of three-phase electrodes, a neutral electrode and control screens. Power is fed to the electrodes which transfer it to the water, thus heating the water. The temperature range goes from 100ᵒC to more than 1 000ᵒC but required a higher voltage (1 – 35 kV). Typical electrode boilers are rated between 2 MW to more than 30 MW with an energy efficency up to 99.9 %. Their main advantages is their infinitely variable control range (min. load between 0 % and 20 % of nominal load) and their very fast load charge speed (0 – 100 % in 30 s) as well as the short ramp-up (cold start to full load in less than 5 minutes) [43]. The price is around 50 to 90 €/kW for an electrode boiler and the lifetime of such a technology is usually around 25 years.
From the flexibility point of view, electric boilers associated with a DH system can provide demand side flexibility with the coupling of power and heat [43], especially when associated with storage. They can faciliate the integration of large shares of renewable energy such as wind power and PV. Their quick response time and their availability all year long are an important asset for P2H. Electric boilers are also easy to maintain and simple with a highly mature technology.
2.2.10 Anaerobic digestion (AD)
A biogas plant provides biogas from biogenic materials via anaerobic digestion (also referred as fermentation). In agricultural biogas plants, animal excrements (manure, solid manure), often together with energy crops, are used as substrates. In non-agricultural plants, material from organic waste bins, waste products from food production or sewage sludge are used. The incurring fermentation residue is a by-product and is used as fertilizer on fields. In most biogas plants, the gas produced is used on site in a combined heat and power plant (CHP) to generate electricity and heat, less often is found the heat-only production via gas boilers. Other biogas plants upgrade the biogas to biomethane and feed it into the

MAGNITUDE D1.1 - CARTOGRAPHY OF THE FLEXIBILITY SERVICES PROVIDED BY HEATING/COOLING, STORAGE AND GAS TECHNOLOGY AND SYSTEMS TO THE ELECTRICITY SYSTEM – R2.0
©MAGNITUDE Consortium 36 February 2019
natural gas grid. This technology is at TRL 9 and well introduced into the European energy market, with a slow shifting from CHP usage to grid injection.
From the flexibility point of view, following aspects of AD are the most important:
1. AD is a microbiological process; therefore, it is very slow (days to weeks) and very sensitive to changes of the process parameters. The biogas production has to be considered as continuous. There are limited possibilities to significantly increase or decrease biogas production over time. This flexibility option is still under investigation (TRL of 6).
2. The produced biogas can be stored; therefore, this is the most promising flexibility option. Usually, the storage capacity of a biogas plant is less than 24 h, but with additional investments, the storage capacity could be increased easily.
3. There are two valorisation options: CHP vs. grid injection. For CHP usage, the same technical aspects than for gas engines have to be taken into account (start-up ramps etc.; see resp. Section of this report). One advantage is that many AD plants are running power-driven, and so restrictions for the heat production are less important.
For the grid injection, the natural gas grid can be considered as a gas storage facility with unlimited capacity.
2.2.11 Electricity network
The main function of electricity grids is to transport electricity from generators to demand centres. High voltage transmission grid is used to deliver power from large generators over long distances, and then in different regions power is distributed at lower voltages to reach end users. Electricity grids consist of various technologies including, conductors (i.e. cables, overhead lines), transformers, circuit breakers etc. The voltage of electricity networks is able to be adjusted by voltage regulation or reactive power compensation devices, such as shunt capacitor banks, on load tap changers, static var compensators, etc. Besides, the voltage of electricity networks is allowed to fluctuate within a certain range (e.g. in the UK, the allowable voltage variation is -6 % ~ +10 %). The change of voltage at end users may result in the change of their power consumption, and this fact enables electricity networks to provide flexibility for other services (e.g. peak load shaving, frequency response, etc.).
Network reconfiguration enables to change the topology of an electricity network by changing the open/closed status of the feeder switches. As a result, the power flow across the network may be changed, so that the voltage and line loss of the network can be changed. Advanced power electronics switches (e.g. soft open points) are used in some networks, in which the power exchange among feeders is able to be adjusted continuously, resulting in higher flexibility.
2.2.12 District heating network
District heating (DH) connects heat sources through a network of pre-insulated pipes carrying hot water to end-customers (i.e residential, commercial, industrial buildings) for heating and domestic hot water usage. The main energy sources for district heating are fossil fuels (coal, oil and natural gas), biomass and heat from waste incineration. Due to their enhanced energy supply efficiency resulting in higher cost saving, combined heat and power (cogeneration) plants are commonly found in district heating systems of cities. In Europe, there is a trend towards more sustainable district heating systems with a higher rate of renewable energy sources, less use of fossil fuels, more energy-efficient systems and lower emissions of greenhouse gases and air pollutants. Thus, new energy sources are being used in district heating systems such as waste heat from industrial processes, geothermal and solar thermal energy, environmental heat (utilised by HPs) and electricity via electric boilers.
From the electricity grid flexibility point of view, following aspects of DH are to be considered:
1. The main objective of a DH is the provision of the required heat demand (in the contractualised temperature range) at every point of time: this might be a restriction for flexibility provision.

MAGNITUDE D1.1 - CARTOGRAPHY OF THE FLEXIBILITY SERVICES PROVIDED BY HEATING/COOLING, STORAGE AND GAS TECHNOLOGY AND SYSTEMS TO THE ELECTRICITY SYSTEM – R2.0
©MAGNITUDE Consortium 37 February 2019
However, the heat system has a very high inertia compared to the electrical grid, which allows having shifts in demand over time without jeopardising the heat delivery.
2. For the future, heat demand response will play a more and more important role, due to increased heat storage, either short-term as well as seasonal ones.
3. The provision of flexibility by DH is a two-way process. On the one hand, DH can be used as storage to convert electricity into heat (P2H) and thus dissipate uncontrollable electricity peak production. On the other hand, the production from CHP can be reduced or stopped to provide balancing energy. For both directions, heat storage is the key figure, considering that the customers heat demand needs to be satisfied.
4. DH networks themselves can be considered as heat storage facility, but heat storage (seasonal or short-to midterm) is often provided by separate components like aquifer storages, or hot water tanks.

MAGNITUDE D1.1 - CARTOGRAPHY OF THE FLEXIBILITY SERVICES PROVIDED BY HEATING/COOLING, STORAGE AND GAS TECHNOLOGY AND SYSTEMS TO THE ELECTRICITY SYSTEM – R2.0
©MAGNITUDE Consortium 38 February 2019
3 Degree of technical fit (capability) of
technologies to provide services
Services identified in the project Deliverable D3.1
The goal of the MAGNITUDE project is to develop business and market mechanisms as well as supporting coordination tools to provide flexibility to the European electricity system, by increasing and optimising synergies between electricity, gas and heat systems.
In this respect one of the objectives of Deliverable D3.1 [6] is to identify the most relevant flexibility services towards the electricity system, which allow to meet the following MAGNITUDE expected impacts:
1. increase the share of Renewable Energy Sources (RES), 2. avoid curtailment of variable RES, 3. enhance security of supply, 4. increase trading between electricity, gas and heat networks.
To achieve this objective, the following methodology was applied:
1. From a literature survey, the present and expected future electricity system‘s needs were identified, and the associated services provided and products exchanged were briefly described. This first step lead to a very long list of services.
2. In the second step, a selection of the most relevant flexibility services to be provided by MES was carried out using the above expected impacts as selection criteria. This leads to the services described in Sections 3.1.1 to 3.1.4 below.
3. Then information was collected on the provision of those flexibility services in each case study country, namely Austria, Denmark, France, Great Britain, Italy, Spain and Sweden and the “national” mechanisms and associated products to offer and trade the services were described and compared.
The results of the different steps of the methodology are described in detail in Deliverable D3.1 [6]. In particular, the following information on the identified services provision and associated products can be found in this deliverable (whenever available):
1. names of the mechanisms in the national contexts 2. types of players involved and eligible technologies 3. type of participation (open to aggregation or not) 4. volume thresholds (minimum and maximum volumes, minimum increment) 5. types of products, remuneration and activation characteristics such as: lead time, ramping or
slopes, tolerances, deployment or activation duration, duration between two activations, number of activations per period, and other specific features.
A summary of the selected flexibility services, relevant for the proposition of services that the technology couplings in the case studies can provide, is given in the following Section together with some of their main characteristics.
3.1.1 Frequency regulation and balancing services
Frequency is a system-wide key parameter of the European synchronous electricity system. It continuously reflects the balance between generation and consumption in the system and must be maintained at (or as close as possible to) its nominal or reference value, which is 50 Hz in Europe.
Frequency deviations from this reference value are caused by events affecting the generation-consumption balance such as short-circuits, loss of a power plant or of a large consumption area, etc. These deviations

MAGNITUDE D1.1 - CARTOGRAPHY OF THE FLEXIBILITY SERVICES PROVIDED BY HEATING/COOLING, STORAGE AND GAS TECHNOLOGY AND SYSTEMS TO THE ELECTRICITY SYSTEM – R2.0
©MAGNITUDE Consortium 39 February 2019
can be more or less fast and severe depending on the steepness and volume of the generation or consumption decrease.
The regulation or control of frequency is in charge of maintaining or restoring the frequency to its reference value by maintaining or restoring the generation-consumption balance. It relies on services provided by different energy resources (generators, storage, consumers, etc.). Three or four categories of services are generally distinguished corresponding to successive mechanisms. But it should be noted that although the need of maintening the frequency in the electricity system is a common characteristic in all European countries, these frequency regulation and balancing services are currently only partially harmonised at the European level.
1. Frequency Containment Reserve (FCR): the objective of this service is to provide an active power reserve activated to stop the frequency deviation and contain the frequency after the occurrence of an imbalance (security at stake) over the European synchronous network (e.g. in case of a frequency drop after a loss of generation). The activation of the FCR shall begin as soon as possible after a frequency deviation. Typically, it is required that at least 50 % of the expected power variation is delivered after 15 s and 100 % after 30 s but there may be different requirements depending on the country. In the same way the activation of FCR should usually be maintained at least for 15 min or 30 min depending on the country or until the restoration reserve is activated. Note that FCR is sometimes called primary (frequency control) reserve.
2. Automatic Frequency Restoration Reserve (aFRR): the objective of this service is to provide an active power reserve which is automatically activated to replace the FCR activated after a frequency deviation and to restore the frequency to its nominal value. aFRR mechanisms still show significant differences throughout the European Union, which is partly due to the different generation mix from one country to the other. The required full activation time varies from 5 minutes (and even less in the UK) to 15 minutes depending on the country. In the same way depending on the country the requirement on the deployment duration (or how long aFRR activation should be maintained) varies from no time limit down to 2 hours or even less namely until the manual restoration reserve is activated. Note that aFRR was formerly and is sometimes still called secondary frequency control or reserve.
3. Manual Frequency Restoration Reserve (mFRR): the objective of this service is to provide an active power reserve which is manually activated after a frequency deviation to complement or to release the aFRR if the demand for secondary control reserve is too high. There is currently a high diversity of mechanisms for mFRR provision in Europe. Most of the time the mFRR activation shall be done within 15 min but in some countries, it might be less (e.g. between 10 to 13 min). The deployment duration is of the order of hours, e.g. at least 1.5 or 2 hours or may be fixed by contract.
4. Replacement Reserve or Complementary Reserves (RR): the objective of this service is to provide an active power reserve which is manually activated to progressively restore the activated FRR (aFRR and mFRR) and/or support FRR activation. The provision mechanism of RR is very different from country to country. In some cases, in some countries RR does not exist, in others they are procured through the intraday energy market and there might be a dedicated provision mechanism. Anyway, the RR activation time (when RR provision exists) is generally longer than the FRR one, e.g. 30 min or more.
mFRR and RR were formerly and are still sometimes called tertiary frequency control or reserve. There might also be some other specific tertiary balancing mechanisms in some countries.
Finally, it should be noted that faster frequency control mechanisms exist in the UK with activation time of 10s for instance. They are described in Deliverable D3.1.

MAGNITUDE D1.1 - CARTOGRAPHY OF THE FLEXIBILITY SERVICES PROVIDED BY HEATING/COOLING, STORAGE AND GAS TECHNOLOGY AND SYSTEMS TO THE ELECTRICITY SYSTEM – R2.0
©MAGNITUDE Consortium 40 February 2019
3.1.2 Energy trade
Regarding the trading of energy between buyers and sellers, there are several mechanisms such as long term energy contracts, Futures trade, Forward energy trades (i.e. more than day-ahead), Day-ahead energy trades, Intraday energy trades. Among these, the last two have been identified in Deliverable D3.1 among the most relevant flexibility services to be provided by MES.
1. Day-ahead energy trades (DA): they have the greatest physical implications because of the high volumes traded. Market participants trade on their expectations for each hour or half-hour of the next day, before a deadline every day (gate closure). Electricity can be traded bilaterally (OTC trading) or on a day-ahead power exchange (BELPEX, EPEX…). On the day-ahead energy market, hourly or half-hourly electricity products are traded for the following day. Block orders for several hours may also be traded. Because of the day-ahead market coupling mechanism in Europe as an initiative of seven power exchanges (Price Coupling of Regions - PCR - used by most of the European countries), the major processes for the design of the day-ahead energy markets are already similar in most of the countries considered in MAGNITUDE, namely Austria, Denmark, France, Italy, Spain, Sweden and UK. Regional specificities occur, for instance regarding the participation of aggregators which is still not possible in Italy but will be allowed in the future. Services providers have to bid unidirectional and asymmetrical products with a minimum volume increment of 0.1 MW. Volumes offered depend on the country.
2. Intraday energy trades (ID): intraday trading function is to trade volumes to be sold/purchased due to deviations from the day-ahead forecast. Thus, intraday energy market shall allow the market players to update and optimise their trading positions and thus reduce the volume risks and optimise their portfolios. Intraday market coupling between Austria, Belgium, Denmark, Estonia, Finland, France, Germany, Latvia, Lithuania, Norway, The Netherlands, Portugal, Spain and Sweden has been launched on June 12th, 2018 with 10 local implementation projects (XBID project). Until now, in the considered countries, the products traded are unidirectional and usually single orders (individual quarter-hours, half-hours or hours depending on the country) or block orders (standardised or user-defined). All markets require a minimum offer of 0.1 MW. Maximum bid volume may exist in some countries. Aggregation is allowed in all considered markets, except presently in the Italian one.
Both day-head and intraday energy trades are associated with the balancing obligations of the Balancing Responsible Parties (BRP).
3.1.3 System adequacy
System adequacy refers to the necessary ability of the power system to supply in the future the aggregated electrical demand and the associated energy requirements at all times (medium and long terms).
In this respect, in each country the main objective for the State and the TSO(s) is to guarantee the future security of supply (supply-demand balance), or in other words that the future generation mix will be able to supply the future demand (plus a reserve margin to account for unexpected events) in one, four or ten years from now. This issue is therefore related to the forecasted future demand, the future generation capacity (and its availability to contribute to meeting demand) and to future investments in generation, in particular to “cover” the expected phase out of more or less large volumes of conventional generation for different reasons depending on the country. These can be, for example: phasing out of nuclear energy in Germany, closure of some existing oil, coal and gas capacities in the UK, increased penetration of renewable energy sources and distributed energy resources, reduction of the profitability of conventional electricity generation, etc.
On the other side, the objective for the potential investors in periods of uncertainties is to receive the right signals to be motivated to invest in existing or new capacities in the right timeline.

MAGNITUDE D1.1 - CARTOGRAPHY OF THE FLEXIBILITY SERVICES PROVIDED BY HEATING/COOLING, STORAGE AND GAS TECHNOLOGY AND SYSTEMS TO THE ELECTRICITY SYSTEM – R2.0
©MAGNITUDE Consortium 41 February 2019
For this reason, some European member states have decided to implement mechanisms for the requirement/remuneration of capacity. These capacity requirement mechanisms (CRM or Cap later in this report) may take very different forms depending on the country. The benchmark carried out in Deliverable D3.1 showed that:
1. There are no capacity mechanisms in Austria, Denmark and Italy (even if a capacity mechanism is in preparation in Italy).
2. A decentralised capacity market is implemented in France, with a one-year ahead tender. Retailers, large industrial consumers not supplied by a retailer and grid operators (as buyers of grid losses) must buy a specific amount of certificates (calculated by the French TSO) to certified capacity providers (generation, demand response, aggregators, etc.) through the capacity market or bilateral trades. The certification of a provider’s capacity is an engagement of availability during the delivery period, namely during particular winter peak periods called “PP2 days”. Each of the PP2 days (from 10 to 25 per delivery period) are defined and declared by the TSO in day-ahead. The contracted capacity can be tested by the TSO and financial penalty applies for the provider if its real capacities is less than its certified capacities.
3. A centralised capacity market is implemented in Great Britain with a four-year ahead auction for both existing and new capacities. The participation is voluntary and is open to capacity providers (existing or new generation, storage and demand-side response, etc.). During the delivery period, contracted capacities must answer to the TSO (National Grid - NGT) stress requests: if a system stress is anticipated (margin < 500 MW), a Capacity Market Warning is sent by NGT to capacity providers. A system stress event then occurs if and only if, four hours after the warning, the TSO instigates a Demand Control Instruction over 15 minutes. Each capacity provider has then to deliver an Adjusted Load Following Capacity Obligation (ALFCO, in MWh) determined by the TSO. The stress event duration is at least 30 minutes.
4. The Italian CRM project in preparation presents a framework similar to the British one 5. Four targeted capacity payments are implemented in Spain since 2007, each of them targets
particular technologies. In particular “the beneficiaries of the Spanish investment incentive are simply obliged to build and operate an eligible power plant with no additional performance requirements”, i.e. apparently there is no availability obligation.
6. A strategic reserve mechanism is implemented in Sweden since 2003, opened to generation and demand response via a competitive process for selecting the providers. The reserve capacity is dispatched (i) if on the day-ahead market, supply does not meet demand; (ii) by the TSO after the gate closure, if the TSO foresees that in the regulating power market, there are not enough commercial offers to meet demand.
7. A strategic reserve mechanism was proposed in Denmark in 2016 but is not implemented yet.
3.1.4 Congestion management and re-dispatching (ReD)
A congestion appears as soon as the forecasted or real power flows exceed the physical capability of the grid components (cables, transformers…). This can occur on the transmission grid, the distribution grid or even on the interconnections between countries or transmission systems. The system operator has then to take measures to manage this situation and relieve the associated constraint.
With the increased penetration of renewables, congestion management both on transmission and distribution networks has appeared among the important present and future needs of the electricity systems.
Several options are possible for the system operator (SO):
1. The SO can directly control different resources for instance:

MAGNITUDE D1.1 - CARTOGRAPHY OF THE FLEXIBILITY SERVICES PROVIDED BY HEATING/COOLING, STORAGE AND GAS TECHNOLOGY AND SYSTEMS TO THE ELECTRICITY SYSTEM – R2.0
©MAGNITUDE Consortium 42 February 2019
a. Modify temporarily the grid configuration and topology and/or the technical means at his/her disposal such as transformer taps/phase shifters, FACTs (flexible alternating current transmission system), etc.
b. Control the reactive power c. Curtail RES d. Control the active power e. In a longer term, reinforce the grid
2. The SO can also use more market-based approaches, involving in particular the procurement of flexibility services. Flexibility services can thus be procured by the SO for the re-dispatching process, which consists in modifying (up/down) after the energy market gate closure, the generation and/or load pattern in order to change physical flows in the system and relieve a physical congestion. This generally implies the modification of the generation programs (or load programs) of producers (or consumers) well located on the network.
3. On the transmission network those flexibility services from well-located producers or consumers are often procured on the balancing mechanisms but dedicated mechanisms may also be put in place.
4. On the distribution network, this would imply that the DSOs procure flexibility services from the energy resources connected to their grid either directly (OTC mechanisms) or through organised flexibility markets. Presently this is generally limited to pilot studies but furthermore, in most countries, the appropriate regulation is not in place yet to allow DSOs to procure such services in a market-based approach. However, this is expected to develop in the future.
Additionnally on radial MV distribution grids redispatching can be used not only to manage the power flows but also to solve voltage constraints. Indeed, due to the technical characteristics of the MV lines, active and reactive powers are much more “coupled” on the distribution networks than on the transmission networks. Therefore, modifications of the active power of well located producers or consumers can be used to control the voltage and it appears as an efficient means to do so. Redispatching for the control of the voltage on distribution network is therefore another flexibility service that should be considered for the provision by MES.
Matrix of the existing flexibility services and fitting technologies in the case studies
This Section summarises the existing flexibility services provided by all case studies.
3.2.1 Mälarenergi
Mälarenergi is participating in the day ahead and intraday markets and also has a role of balance responsible party (BRP). The company is responsible to balance the power demand of its customers by either producing by itself or buying from the market. Except this, it currently does not provide any other services listed in Section 3.1.
Recently, boilers 4, 5 along with boiler 6 are responsible for the heat and power plant's basic production. The operating time for boilers 4 and 5 and 6 are approximately 5 500, 8 000 and 8 000 hours annually, respectively.
3.2.2 Paper mill in Austria
The case study of the paper mill as the representative of an industrial steam system seems to have a high potential for replicability.

MAGNITUDE D1.1 - CARTOGRAPHY OF THE FLEXIBILITY SERVICES PROVIDED BY HEATING/COOLING, STORAGE AND GAS TECHNOLOGY AND SYSTEMS TO THE ELECTRICITY SYSTEM – R2.0
©MAGNITUDE Consortium 43 February 2019
As it was described before (Section 2.1.2), the paper mill’s local energy system is composed of several technologies, including heat-2-power backpressure steam turbines, which are the main contributors to provide certain flexibility services.
The case study is already active on the Austrian electricity market thanks to the good controllability, which allows participating in the balancing market. The turbines are used to provide mFRR to the Austrian TSO, extension to aFRR provision is feasible. The average flexibility of power consumption is approximately 5 MW, which is currently used to provide ancillary services (tertiary control reserve) to the TSO [44].
Participation in a capacity market would be technically feasible, but such market does not exist in Austria. The magnitude and duration of the possible service provision depends on the technical requirements of the market and the conditions of the paper mill, e.g. heat demand of the produced paper quality or seasonal heat demand.
3.2.3 HOFOR
From the descriptions in Section 2.1.3, it can be observed that facilities in Nordhavn involve different types of equipment that make them flexible from a power system point of view. At the time, HOFOR is not providing any agreed services to the DSO or TSO.
3.2.4 ACS
Currently the “Canavese” DH-Plant is participating to the Day-Ahead and the Intra-Day Italian markets.
The participation in selling energy to the market is provided by the three gas engines (CHPs) according to their involvement in the daily district heating supply program. Each CHP is 5 MW Power and thus the participation to the market ranges from 5 to 15 MW per hour.
The plant exploits the “green certificates” provided to power produced by natural gas fuel (rather than oil). This incentive will expire at the end of 2018 (the duration of “green certificates” last at most 10 years).
3.2.5 Neath Port Talbot
Due to the large geographical area and a large number of technologies/stakeholders covered in the Neath Port Talbot area, there are numerous potential flexibility services. However, the provision of flexibility from gas networks to power system, through employing linepack (i.e. within pipe gas storage) to support the operation of gas-fired power station, is a key flexibility service which will be investigated.
In addition, the flexibility contained in TATA steelworks mainly comes from two sources: the on-site generators and the various industrial processes. The industrial processes involve coke oven, sinter plant, blast furnace, BOS plant, casting process, hot strip mill, annealing process, etc., having consumed as much as 880 GWh electricity per year (2016). However, utilising the flexibility of industrial processes to provide demand-side response services needs to be coordinated with the overall production process, thus the potential having not been extensively tapped at the moment.
Besides, there are 95 MW on-site generators in TATA steelworks, which is able to provide various ancillary services. Currently, TATA steelworks have participated in the frequency response and reserve markets in the GB. Furthermore, TATA steelworks plans to participate in the capacity market in the future.
The potential of TATA steelworks to provide services identified from Task 3.1 is estimated and presented in Table 11. Note that only the flexibility of on-site generators is considered. It is also worth noting that the setting of services in the GB is not consistent with that in the mainland Europe in some cases. Therefore, it will not be considered when there is no equivalent service in GB.

MAGNITUDE D1.1 - CARTOGRAPHY OF THE FLEXIBILITY SERVICES PROVIDED BY HEATING/COOLING, STORAGE AND GAS TECHNOLOGY AND SYSTEMS TO THE ELECTRICITY SYSTEM – R2.0
©MAGNITUDE Consortium 44 February 2019
3.2.6 EMUASA
None of the services identified in Task T3.1 are currently provided at Murcia Este WWTP. On-site generated electricity from cogeneration is only used for self-consumption.
3.2.7 Paris Saclay
Steering the thermal loop supports the electric network flexibility. Heat Pumps offer a direct control flexibility service for network management purposes. It is possible to have several minutes of power modulation (upward and downward) and this flexibility increases with a DH and/or DC connection because both the buildings and the thermal network are used as a thermal storage, beneficial for power modulation. This power modulation can be controlled by an aggregator. The multi energy smart grid management system is used to control all devices, including heat pumps, thermal energy storage, PV, batteries, EV charging and other appliances based on system optimisation, which is done according to the predefined energy services.
In case of surplus of electricity production due to vRES (PV, wind, etc.), the aggregator operates an upward power modulation. Heat pumps run at their maximum output, using the electricity surplus on the network. When there is no more surplus of electricity production, the aggregator reduces the power of the heat pumps back to the required load. Prices of electricity and need for heat and cold need to be taken into account.
The centralised geothermal system should be functional toward March 2019 but it will take many more years for all the buildings to connect.
3.2.8 Current services provided by case studies
The technologies existing in the CSs are mapped with the identified services to show the capability of providing flexibility services within the given market structures. A matrix showing the linkage between the identified services and the technological characteristics of the CSs is shown in Table 11. Here, ‘++’ means that the service is already provided; ‘+’ means that the service is not yet provided but, according to the CS owner or contact point, it could be provided; and ‘-‘ means that the service is not provided and its provision is not foreseen by the CS owner. It is clear that the project CSs can cover a lot of the services identified in Section 3.1. However, this is not done so far, due to either lack of awareness, economic feasibility, available manpower or technological solutions.

MAGNITUDE D1.1 - CARTOGRAPHY OF THE FLEXIBILITY SERVICES PROVIDED BY HEATING/COOLING, STORAGE AND GAS TECHNOLOGY AND SYSTEMS TO THE ELECTRICITY SYSTEM – R2.0
©MAGNITUDE Consortium 45 February 2019
Case study CS purpose Identified Services from Deliverable D3.1
FCR aFRR mFRR ID DA ReD Cap
Mälarenergi AB
DH, DC - - + ++ ++ - +
Paper Mill Industrial process
+ + ++ + + - -
HOFOR Individual units + DH
+ - + + + - -
ACS DH - + + ++ ++ - +
Neath Port Talbot
Industrial process
++ - + ++ ++ + +
EMUASA Industrial process
- + + + + - -
Paris Saclay DH, DC + individual units
- - + + + - -
Table 11: Matrix of the flexibility services and fitting technologies in the case studies
Success factors and bottlenecks
This Section summarises the success factors and the potentials regarding providing the services listed in Section 3.1 for each case study. Fuel switching and load shifting are the most commonly used methods. Through the comparison with the specifications of the identified services, the bottlenecks of the existing technologies are also discussed.
3.3.1 Mälarenergi
For Mälarenergi, producing heat for district heating is prioritised. The electricity production is not flexible since the capacity is dependent on the heat demand. As a combined heat and electricity production, the flexibility of the electricity production is limited by the steam production technologies, which are the biomass, oil and coal boilers. For biomass boiler, fluidised bed boilers can take up to 26 hours to reach stable conditions after reaching 25 % load [19].
Several technologies at Mälarenergi have the potential to provide the flexibility for the electricity market such as the district heating (DH) network, thermal energy storages and heat pumps. The DH network plus TES (25 000 m3 and 26 000 m3) enable the system to provide the required electricity during the peak load without affecting the heat supply. The two available heat pumps are at the capacity of 10 MW of district cooling and 12 MW of district heating. In general, the ramp up/down time for the district heating heat pump are 10 % per 30 seconds. Fuel switching and load shifting are enabled by the implementation of the heat pump.
Considering the capacity, with the available TESs and heat pumps, Mälarenergi has potential to provide aFRR, mFRR, FCR, ID and DA [45].

MAGNITUDE D1.1 - CARTOGRAPHY OF THE FLEXIBILITY SERVICES PROVIDED BY HEATING/COOLING, STORAGE AND GAS TECHNOLOGY AND SYSTEMS TO THE ELECTRICITY SYSTEM – R2.0
©MAGNITUDE Consortium 46 February 2019
3.3.2 Paper mill in Austria
In the Case Study of the Austrian paper mill, there is a constant need to supply steam that drives different processes. The superheated steam produced by natural gas-fired or biomass fired boilers has much higher parameters than needed in the process, in this case, steam is put through turbines or valves in order to lower the temperature and pressure to a demanded level. As it can be seen, the operation method of steam turbines is directly linked to the production process and the electricity may be treated as a by-product, which does not show significant flexibility potential. In addition, flexibility is partially limited by the steam supply technologies available at both sites, including biomass and natural gas-fired boilers.
Natural gas boilers respond faster to a load change than biomass-fired units, since a ramping load gradient limit for gas-fired steam turbines being around 6 % [46] and for biomass-fired units 2 – 3 % of nominal load/ min [47], [48]. It has to be also taken into account that backpressure turbines do not offer the same flexibility as extraction (condensing) turbines. A higher electricity production is always followed by a higher heat production, in this case steam production, which needs to be consumed or blown off. It is not efficient if there is no demand of heat.
Besides the steam that is consumed internally, a lower amount of the generated heat is also provided to the local district heating network (22 000 inhabitants). However, the paper mill is not the only heat source, so it does not have a significant impact on production. Nevertheless, a district heating network and additional heat accumulators may play a significant role in increasing turbines flexibility. Especially, the steam system with turbines and steam storage seems to be the main integration feature. This option allows taking influence on the net consumption of electricity and control the generation of the turbines in a narrow bandwidth and with a FAT (full activation time) of < 5 min, which is suitable for aFRR.
Changes in power generation have feedback on the gas consumption and may cause imbalances in the gas grid. Those imbalances are rather a minor economic risk than a technical issue. In general, there are no major bottlenecks in the distribution systems of heat and gas supplying the paper mill. However, a very important issue that cannot be omitted is the contractual limitation related to the grid tariff that implies on the maximum allowed electricity or gas consumption during the consumption peak. The limit could be changed monthly and to avoid contractual fees the energy consumption cannot be above a certain value. As a result of it, boilers and therefore turbines cannot be just simply switched off or replaced with the electric boilers to produce low-pressure steam as it may be a very costly option.
3.3.3 HOFOR
Coupling HPs to thermal storage or actively using the buildings' thermal inertia offers the possibility to decouple electricity consumption from heat demand, which brings flexibility in operation.
Low-temperature-District Heating (LTDH) is feasible for space heating, while it alone is not sufficient for DHW preparation. Electric Heat Boosters (EHBs), utilised in Nordhavn as a solution for domestic hot water (DHW) preparation under the context of LTDH is identified as a flexible resource for electricity and heat sector. The water tank for the DHW preparation could be heated up either from the electric power coming from the electricity network, or from the thermal power coming from the DH network. Additionally, the heat pump in Havnehuset Vest could be controlled for peak shaving or load shifting purposes, participating in load matching markets, again controlled by an aggregator along with other heat pumps. At the moment there is no control mechanism installed though.
Therefore, it seems quite possible the scenario that aggregators could manage a pool of EHBs and HPs to participate in the day-ahead energy market and intra day energy market, by submitting offers showing their readiness to reduce/increase or move their energy consumption over the planning horizon or for specific time periods. Additionally, assuming that intelligent control mechanisms are in place in order to enable fast response from the EHBs and HPs, the aggregator could utilise those technologies to participate in frequency regulation services such as aFRR and FCR or congestion management by peak reduction. Studies in [49]

MAGNITUDE D1.1 - CARTOGRAPHY OF THE FLEXIBILITY SERVICES PROVIDED BY HEATING/COOLING, STORAGE AND GAS TECHNOLOGY AND SYSTEMS TO THE ELECTRICITY SYSTEM – R2.0
©MAGNITUDE Consortium 47 February 2019
show for example, that if electricity and heat prices are comparable, then DH is preferred in summer time when DH demand is low, while electric heating is more frequently used in winter time. However, when prices are not comparable (either very low DH prices, or important add-ons in the electricity price), scheduler will always favor district heating for DHW heat demand. It can be seen, that pricing framework, can play an important role in the feasibility of a relevant coupling. This is an incentives and economic issue rather than a technological bottleneck.
Technological constraints in a coupling scenario like the one considered above, mainly lie in satisfying the operational requirements of the set up: heat boosting (power feed in from the electricity grid) is required to satisfy the hygiene requirements for domestic hot water up to an average tap temperature of 42ᵒC (German Standard W551), tap water draws characteristics for showers and other activities, DH network constraints for the flow rate in the DH pipes etc. A complete technical asssessment can be found in [50]. In addition, considering, however, that the main use of EHBs and the HP is for domestic hot water preparation, and therefore their duty cycle is relatively small, flexibility services could be limited.
3.3.4 ACS
Currently the DH-plant ensures to A2A the needed revenue. The climate changes are reducing the duration of the DH-working season, but the current plant management ensures a cost-effective heat production. Formally, the DH-working season starts from the mid of October and lasts until the mid of April. Really, until mid November and from the beginning of March the DH support to the heating demand is minimal. In these periods the ambient temperature produces a low heat request from residential and commercial demand. The actual plant expansions planned are mainly due to the need to cover the expansion of the DH-network to satisfy more customers. A possible economic improvement to the current management concerns the contractual form set with customers. The current standard contractual form foresees to set a long term contract to satisfy a daily thermal profile request where there is a peak-load in the morning, and to maintain this value with limited variation until evening when the thermal supply is set at the minimum value until the next morning. In this schema the main drawback is due to the early morning peak load to be covered. To cover the early-morning ramp-rate it is required to start-up a huge number of the available generators (this is due to the thermal inertia of loads and DH-network). Generators, once the heat production meets the request, are subsequently remodulated reducing their power output just to sustain the following of the demand and ensure the established confort level. This management of the early-morning peak load is not remunered by the long term contract set.
In order to reduce the morning peak load and operate the technologies reducing as far as possible daily-high ramp-rates the solution thought consists to offer a special night-tariff. The night-heat-provision is sold at a very cheap price. That strategy increases the night thermal production to satisfy the demand, but at the same time, reduces the gap between the night and the early morning thermal load demand, consequently, reducing the effort request to the thermal generation and associated costs.
3.3.5 Neath Port Talbot
In Neath Port Talbot (NPT) case study the focus is to quantify the flexibility provision from within-pipe gas storage (linepack) to support the operation of gas-fired generating units (due to fast ramping capability, gas-fired units are suitable options for complementing intermittent renewable generation).
There is no technical barrier for providing flexibility from gas network to electricity system. However, the barrier is mostly market related. First of all, the current market does not value flexibility from gas network. And secondly, there are different market arrangement (i.e. timing) for gas and electricity which makes it difficult to coordinate the operation of these networks and therefore maximise flexibility provision from gas network. For example, power generation customers need clarity on available capacity by 14:30 the day before the Gas Day for which they are submitting Offtake Profile Notices (OPNs). This is before Initial OPNs

MAGNITUDE D1.1 - CARTOGRAPHY OF THE FLEXIBILITY SERVICES PROVIDED BY HEATING/COOLING, STORAGE AND GAS TECHNOLOGY AND SYSTEMS TO THE ELECTRICITY SYSTEM – R2.0
©MAGNITUDE Consortium 48 February 2019
that the gas distribution company provides to National Grid Transmission at 18:00 on the day before the Gas Day.
3.3.6 EMUASA
In the CS Murcia Este WWTP, there are three main process lines (water treatment, sludge treatment, biogas/cogeneration). Flexibility provision as of load reduction is restricted by process functioning requirements and dependencies in the process lines as well as technological constraints (e.g. size of tanks within process lines, partial load of equipment etc.). There are currently no services provided among the ones identified in Deliverable D3.1.
The electricity that is generated by the CHPs is directly consumed in the process lines to cover their respective electricity demand and therefore reduce the demand from the electricity grid.
The following two main bottlenecks for implementation of flexibility services have been identified:
a. Emuasa does not own the plant. The facility is owned by the City Council, but its management depends on another administration, the Entidad de Saneamiento (ESAMUR), which is dependent on the Ministry of Water, Agriculture, Livestock and Fisheries. Emuasa is responsible for the operation, but the implementation of new energy recovery or production technologies must be proposed, or approved, by the administration.
b. The plant is located in an agricultural area, with a low population density in the surrounding area; the demand of heat, cold and energy would be low to justify the implementation of a local network and the natural gas networks are currently at a fairly large distance to justify the biogas upgrade to biomethane and its injection into the network.
3.3.7 Paris Saclay
The main success factor for flexibility provision in the Paris Saclay case study remains that the DHC system has been designed to become the first smart grid linking heat, cool and electricity network in France. Control devices and monitoring are thus implemented in order to evaluate the system efficiency. A smart management system is also in place to optimise the DHC. Those tools will make it easier to provide flexibility services. Another success factor is the diversity of the buildings (dwellings, universities, laboratories, and offices) connected to the DHC that tends to smoothen the heat and cooling demand. Besides, the numerous buildings have a thermal inertia that allows short-term flexibility even without thermal storage.
The main bottlenecks is that the district heating is not yet finished and not all the buildings are connected. The full capacity of the DHC and its ability to provide flexibility will not be complete before several years.
In addition to that, satisfaction of the thermal demand is the main purpose of the DHC so heat and cold provision will always be prioritised over flexibility services. Finally, the third bottleneck is that thermal storage is not currently planned in the project.
In term of contracts bottleneck, if the flexibility services provide a remuneration to the DHC operator, it is important to think about how this remuneration should have an impact on the heat and cold prices. Indeed, if the DHC operator is the actor running the network, the owner of the installation remains the public body of Etablissement public d’aménagement Paris-Saclay (EPAPS), which aims at the well-being of the people living and working on the site.
Proposed improvement of the current technology set-up in the case studies
This Section collects the potential options that can improve the provision of flexibility services. The options are proposed through the discussion with case study owners and under the consideration of the specification of flexibility services. They are sorted in descending estimated viability.

MAGNITUDE D1.1 - CARTOGRAPHY OF THE FLEXIBILITY SERVICES PROVIDED BY HEATING/COOLING, STORAGE AND GAS TECHNOLOGY AND SYSTEMS TO THE ELECTRICITY SYSTEM – R2.0
©MAGNITUDE Consortium 49 February 2019
The proposed options will be further discussed with the Case Study Owners in workshops organised to prioritise a couple of options according to their current business and energy plans. The prioritised options will then be modelled and simulated to evaluate their impacts and associated benefits.
3.4.1 Mälarenergi
Option #1: Heat pump: use the surplus electricity from renewables or low price electricity to produce heat
Expected benefits During periods with high renewable electricity production and/or at low electricity prices the heat pump can be used to convert electricity into heat. The heat produced can be stored in a thermal energy storage system or directly feed in the heat exchanger connected to the DH. The heat pump can also be used to increase the electricity self-consumption ratio during low electricity price.
Open questions How much can be benefited? How big should the energy storage be? How can the heat demand be accurately predicted?
Possible bottlenecks The economics of using the heat pump only for providing ancillary services should be analysed thoroughly. An accurate energy management system is required to follow/predict renewable electricity production and electricity price
Option #2: Electric boiler to partially substitute the steam generator
Expected benefits Increase the electricity self-consumption at low electricity price. The electric boiler can be used to avoid penalties due to the day before bid on electricity production if there is a surplus. It can help to increase the penetration of renewables.
Open questions -
Possible bottlenecks Mälarenergi AB is mostly using waste as fuel for heat and power production that has a negative cost. The economics of the investment only for providing ancillary services through the electric boiler should be analysed thoroughly.
Option #3: Heat/cool storage tank or district heating/cooling network to store excess of heat production
Expected benefits Guarantee flexibility to heat and electricity production and consumption.
Open questions -
Possible bottlenecks The economics of the heat storage investment only for providing ancillary services should be thoroughly investigated. Accurate modelling of the district heating network should be performed to assess the potentials of storing heat without loosing comfort at the end-user.
Option #4: Building thermal inertia: increase the indoor temperature of the building served by the DH system before the occurrence of a peak in the load or in case of surplus of electricity production from renewables, especially wind power.
Expected benefits Shaving the peak load of the CHP plant especially during cold periods to avoid the use of fossil fuels to cover the peaks. Increase the renewables penetration transforming electricity to heat through the heat pump.
Open questions The building is used as thermal energy storage. The end users should be somehow compensated for this service. A business model for this service should be created.

MAGNITUDE D1.1 - CARTOGRAPHY OF THE FLEXIBILITY SERVICES PROVIDED BY HEATING/COOLING, STORAGE AND GAS TECHNOLOGY AND SYSTEMS TO THE ELECTRICITY SYSTEM – R2.0
©MAGNITUDE Consortium 50 February 2019
Possible bottlenecks Better knowledge of the building construction types to assess the potential of the building thermal inertia. Accurate forecasting model to decide when the indoor temperature has to be increased.
Option #5: Production of synthetic fuels
Expected benefits In case of heat surplus or electricity price are low the heat can be used for chemical process to produce synthetic fuels
Open questions -
Possible bottlenecks The economics of the process only for providing ancillary services should be thoroughly investigated.
3.4.2 Paper mill in Austria
Options to maximise the flexibility provision from a technical perspective
From a technical perspective, there are three ways of action to improve the system configuration in order to improve the flexibility provision:
1. replacing a technology or adding a new one, 2. changing the control strategy of one or several energy assets, 3. combining the two previous options.
Figure 18: Simplified flowchart of the CHP system of the paper mill (Line H) [51]
Option #1: Pre-heating system: installation of a heat pump to pre-heat the feedwater before entering the boiler
Expected benefits Heat pump allows lower grid costs (or a different composition of the electricity consumption) and might be interesting to provide negative balancing energy
Open questions What is the current situation? How is the feedwater pre-heated? From heat recovery in the process? Or economiser in the steam boiler? (Curently there is no electric pre-heater)
Stea
m g
ener
ato
r 2
(bac
kup
)
G1T1
Production facility
G2T2
Stea
m g
ener
ato
r 1
Steamaccu-
mulator
Public power grid
Condenser(HX)
Blowoff
Boiler feed water
HP steam
LP steam
Fuel(natural gas)
byp
ass
Distric heating

MAGNITUDE D1.1 - CARTOGRAPHY OF THE FLEXIBILITY SERVICES PROVIDED BY HEATING/COOLING, STORAGE AND GAS TECHNOLOGY AND SYSTEMS TO THE ELECTRICITY SYSTEM – R2.0
©MAGNITUDE Consortium 51 February 2019
Possible bottlenecks Economic feasibility has to be carefully considered, especially considering low Pay Back Time required by industries
Additional grid fee if consumption peak is increased
Option #2: Steam accumulator or DH network to store excess heat: increase the share of self-produced electricity increases when the electricity prices are high (extra stream produced) or in case the plant wants to provide fast frequency services (enabled by the turbine, need of storing steam)
Expected benefits Steam accumulator can also help to reduce the steam blow-off caused by periodic changes in the steam demand of the paper process Steam accumulator output will be used to preheat burner air and boiler feedwater
Open questions -
Possible bottlenecks Economic viability to be checked High-pressure steam accumulator: not yet technically mature technology for the high pressures required in the process. Technical suitability to be assessed
Option #3: Steam generator: partial replacement of the steam generator with an electrode boiler to produce the low temperature steam (210 ᵒC, 12 bar)
Expected benefits Increased self-consumption of electricity, when the electricity prices are low (steam produced by generator + electric boiler) Opportunity to make bids at the same time for positive and negative balancing energy (special Austrian rule defines low grid tariffs for services provided to the TSO)
Open questions -
Possible bottlenecks The main constraint is additional grid fee [52] if monthly power consumption peak increases
Option #4: Absorption chillers to valorise excess heat/produce cold from excess steam when the electricity prices are high
Expected benefits Reduction of steam blow-off
Open questions Amount of steam currently blown-off? Cooling demand of the offices? Availability of other demand of cooling near the paper mill?
Possible bottlenecks Might not be relevant for the paper mill in the case study, depending on the need of cold for their office buildings
Option #5: Heat storage by means of hot water tanks
Low-pressure steam is used to warm up feedwater stored in a heat accumulator.
This may be done using small and big storage tanks allowing the paper mill to increase positive and negative load gradients for small units or to allow temporarily reduced low load operation and peak load generation for bigger units. The amount of energy stored in the hot water accumulators can be rapidly discharged to increase rapidly a flowrate of feedwater and therefore to increase steam production if needed, consequently electricity production. The load change can be in a faster and more controllable way than by means of boilers that need to be adjusted to do so.
The hot water storage tanks are therefore suitable for providing primary (FCR) and secondary frequency (aFRR) control response [53].
Expected benefits Increasing of ramping capabilities and avoidance of a steam blow off, thus optimisation of water consumption.

MAGNITUDE D1.1 - CARTOGRAPHY OF THE FLEXIBILITY SERVICES PROVIDED BY HEATING/COOLING, STORAGE AND GAS TECHNOLOGY AND SYSTEMS TO THE ELECTRICITY SYSTEM – R2.0
©MAGNITUDE Consortium 52 February 2019
Open questions Economic feasibility of primary and secondary control
Possible bottlenecks The paper production process must not be affected by optimisation of the upstream energy processes
Option #6: Back-up units to provide additional system services
1. A new turbine for the provision of system services would not pay off. 2. The existing backup turbine in K is old and uneconomical, so additional operating hours should be
avoided.
Expected benefits Installation of an additional turbine to provide additional control energy (positive and negative)
Open questions
Possible bottlenecks Economic feasibility, availability of the already installed turbine
The improvement options described above have been discussed with the energy manager of the paper mill.
Options #2: (Steam accumulator or DH network to store excess heat) and #3 (Adding an electric boiler to the gas boiler to generate low-temperature steam) appear to currently be the most promising, from the point of view of the energy manager, in terms of economic feasibility and expected benefits.
Concerning option #2, the installation of a high-pressure steam accumulator has been judged as the most interesting option, since no district heating network is available to receive heat from plant K, and the construction of a DH network between sites K and H is not economically viable.
3.4.3 HOFOR
The suggested options for HOFOR are listed in a descending priority according to CS interfacers’s criteria, since at the time this deliverable is written it is not possible to report the CS owners’s opinion. CS interfacers’ criteria represent economic feasibility and complexity of realisation as well as priority areas of Danish Energy Agency to increase data sharing and energy efficiency:
Option #1: Improved acquisition of measurements HOFOR has mounted a main heat meter at the entrance of Århusgade to be able to measure all the energy flowing in and out. The main heat meter measures water flow, temperature and pressure in supply pipe and return pipe. The data is measured continuously and stored in a SQL database on hourly basis. At the moment electric heat boosters have dedicated energy meter for both electricity and heat consumption and the metering precision is 1 s.
Expected benefits Better understanding of electricity and heat consumption, improved forecasts, improved measurement and validation of the activation of the flexible consumption/generation. Improved planning and quantification of flexibility availability from the aggregator side.
Open questions -
Possible bottlenecks -
Option #2: Explore different technologies for the EHBs and the HP Equipment installed at the moment in Nordhavn are fixed speed units, operated in an on-off manner (3kWe or zero). Variable speed units could allow a continuous regulation of the compressor speed over large parts of the operation range. In addition, exploring the COP of the equipment and the operational range and limitations of a high COP is useful. Since COP and maximum thermal capacity are dependent on source and sink temperatures, the available flexibility is not constant during the course of the year. Falling outdoor temperatures usually

MAGNITUDE D1.1 - CARTOGRAPHY OF THE FLEXIBILITY SERVICES PROVIDED BY HEATING/COOLING, STORAGE AND GAS TECHNOLOGY AND SYSTEMS TO THE ELECTRICITY SYSTEM – R2.0
©MAGNITUDE Consortium 53 February 2019
requires higher temperatures in the heating circuit to transfer the needed heat to the building, which leads to higher sink temperatures, hence reduced COP, and reduced maximum HP capacity. This leads to reduced flexibility in times of high heat demand.
Expected benefits This allows a control of the thermal output or the electric demand. Also, higher operational flexibility is offered, which for example can be used in order to improve power quality
Open questions Will they necessarily improve system efficiency?
Possible bottlenecks -
Option #3: Appropriate controls and communication interfaces Improvement in the control and communication between the P2H technologies and the aggregator. At the moment, EHBs can be controlled by the Data Management System (DMS) of Nordhavn, however the heat pump in Havnehuset Vest, has its own building management system but it is not connected to the central Data Management System of Nordhavn.
Expected benefits High speed response of equipment when the aggregator needs it. Also notice towards the aggregator could become very short (e.g seconds), as customers do not need to know in detail what is happening, provided that their comfort levels are satisfied.
Open questions What type of control and communication media?
Possible bottlenecks -
Option #4: Explore different storage tank sizes and equipment (HB and EHB) sizes The equipment capacity limits the possibility to increase or decrease the electric consumption by switching on or off, or by ramping the capacity up or down. And, the type and capacity of the thermal storage determine how much energy can be shifted over a certain period of time.
Expected benefits Heat pump flexibility will be improved for higher sizes of storage tank.
Open questions What are the optimal sizes relevant to the type and purpose of consumption?
Possible bottlenecks
3.4.4 ACS
Option #1: Heat recovery from the fumes of the boilers (actually there are three gas boilers installed). Extracting just a portion of the fumes from the three boilers it could be possible to recover 1 MWt, the heat held in the fumes will be exchanged with the return line of the DH-network. This possibility is currently under study.
Expected benefits Increasing of power generated by the plant
Open questions The associated overall costs are not completely clear and it is also unclear whether the cooling produces unwanted white fumes.
Possible bottlenecks The installation requires a not negligible amount of space
Option #2: Improve the pump system of the DH-network in order to increase the flow rate and thus support not only the A2A plant but also the other DH-supplier (Linate Airport). This pump system would support better the user service ensuring the required power delta. This project will be accomplished by April 2019.
Expected benefits Reduce the bottleneck currently limiting the withdrawal of hot water from the Linate plant (the other supply operator of the DH-networks)

MAGNITUDE D1.1 - CARTOGRAPHY OF THE FLEXIBILITY SERVICES PROVIDED BY HEATING/COOLING, STORAGE AND GAS TECHNOLOGY AND SYSTEMS TO THE ELECTRICITY SYSTEM – R2.0
©MAGNITUDE Consortium 54 February 2019
Open questions -
Possible bottlenecks Possible increasing of the pressure within the expansion vasin
Option #3: Installation of a predictive maintenance system for the cogeneration engines. This is currently under study.
Expected benefits Better management strategy for the 3 cogenerators increasing efficiency and consequently reducing the number of outages and the no-planned maintenance actions
Open questions It is not clear at the moment the model to be adopted for the predictive maintenance
Possible bottlenecks The difficulty of interaction between the low level controller (PLC) of the CHP and the predictive maintenance tool
Option #4: Reduction of the operating temperature of the DH-network. Currently A2A-ACS is supplying the network at 90ᵒC. Even in this case this possibility is under study.
Expected benefits Better integration of renewable resources and increasing of technology efficiency and DH-network leakages
Open questions -
Possible bottlenecks The low temperature of the DH-network feed-back line must be tuned by decreasing the temperature of the DH-network feed-in in order to avoid leakage increasing in the network.
3.4.5 Neath Port Talbot
Possible measures to maximise flexibility provision from the gas networks and TATA steel works in Neath Port Talbot are briefly discussed below. Provision of flexibility by gas network: Option #1: Increased coordination between gas and electricity systems operators is required Currently there are minimal flow of real time information between gas and electricity markets, and the markets have independent timeline (e.g. closure of the day-ahead bidding).
Expected benefits An improved market structure for gas and electricity allows gas linepack to be optimally managed to support the operation of gas-fired power stations.
Open questions -
Possible bottlenecks Making any changes in the market and regulatory frameworks usually takes long time and require stakeholders beyond the case study to be involved (e.g. Office for Gas and Electricity Market (OFGEM))

MAGNITUDE D1.1 - CARTOGRAPHY OF THE FLEXIBILITY SERVICES PROVIDED BY HEATING/COOLING, STORAGE AND GAS TECHNOLOGY AND SYSTEMS TO THE ELECTRICITY SYSTEM – R2.0
©MAGNITUDE Consortium 55 February 2019
Provision of flexibility by TATA steel:
Option #2: Waste heat recovery projects to produce electricity
Expected benefits Improving the energy efficiency of the steelworks by producing electricity from waste heat
Open questions -
Possible bottlenecks Finding opportunities with short payback time which do not affect the supply chain is a challenge.
Option #3: Replacing the blast furnace by an electric arc furnace
Expected benefits Decreasing the use of fossil fuel and increase the potential for demand side response
Open questions -
Possible bottlenecks Major investment for the steelwork. It depends on the purchase price of electricity and gas. It requires large amount of electricity which would need to be coming from renewable energy to have a positive impact on the carbon emissions of the plant.
3.4.6 EMUASA
Option #1: Sale of electricity
Expected benefits Economic advantages can origin from sale of on-site generated electricity.
Possible bottlenecks The benefits highly depend on the limited flexibility of the treatment processes since today the generated electricity is only used for own consumption.
Option #2: Upgraded Biomethane for use in cars
Expected benefits Cars that are used on-site of the plant could be fed by upgraded biomethane originating from biogas.
Possible bottlenecks The technology is mature now, but economic feasibility will depend on market prices or economic incentives related to environmental policies. Anyway, the fleet of vehicles to run with biomethane is not very big yet.
Option #3: Trigeneration - Addition of a chiller for cold generation
Expected benefits The existing cogeneration system which uses the on-site produced biogas in a CHP plant may be extended by a chiller to generate cold from the extra excess heat that is available in the summer months. At the WWTP there are no processes that demand cold. However, it can be used for cooling of offices on-site. Additionally, it can be used for the pretreatment of the biogas. In another scenario the cold could be sold to a local network as well.
Possible bottlenecks Economic feasibility is a restrictive factor. Furthermore, there is no infrastructure like a district cooling network available yet.

MAGNITUDE D1.1 - CARTOGRAPHY OF THE FLEXIBILITY SERVICES PROVIDED BY HEATING/COOLING, STORAGE AND GAS TECHNOLOGY AND SYSTEMS TO THE ELECTRICITY SYSTEM – R2.0
©MAGNITUDE Consortium 56 February 2019
Option #4: Use of waste heat for electricity generation by steam turbines
Expected benefits The available waste heat could be used for electricity generation by steam turbines.
Possible bottlenecks The viability is very uncertain due to high investment costs and the fact that it can only be used in summer since in winter the heat is needed to maintain the sludge temperature into the digesters.
Option #5: Upgrade of biomethane for grid injection.
Expected benefits The upgraded biogas that is produced by the digestion process can be upgraded to biomethane for injection into the natural gas grid. Therefore, it can provide a balancing service for the natural gas network. For the WWTP, it would mean additional economic income when selling the biomethane.
Possible bottlenecks In Spain currently no legislative regulatory framework exists. Depending on the efficiency of the upgrading process of the biogas as well as investment and maintenance costs for such a system, there will be technological and economic bottlenecks that need to be studied in detail before the implementation.
Option #6: Use of waste heat to feed a local heating network
Expected benefits The available waste heat could be used in a local district heating network.
Possible bottlenecks There is no infrastructure like a district heating network available yet.
3.4.7 Paris Saclay
Option #1: Adding an centralised heat storage
Expected benefits Increase the flexibility service and reduce gas consumption
Open questions Paris Saclay has considered this possibility. It might be an option for after 2022.
Possible bottlenecks Cost, space in the energy center
Option #2: Adding several decentralised heat storages
Expected benefits Increase the flexibility service and reduce gas consumption
Open questions Paris Saclay has considered this possibility. It might be an option for after 2022.
Possible bottlenecks Cost, space in the buildings

MAGNITUDE D1.1 - CARTOGRAPHY OF THE FLEXIBILITY SERVICES PROVIDED BY HEATING/COOLING, STORAGE AND GAS TECHNOLOGY AND SYSTEMS TO THE ELECTRICITY SYSTEM – R2.0
©MAGNITUDE Consortium 57 February 2019
4 Summary
Introduction
The first goal of MAGNITUDE is to enable the mobilisation of flexibility for the electricity system from the integration of multi-energy systems’ operation. Seven case studies are used to provide the data foundation for this assessment and for the modelling activities taking place in two work packages in the project, namely WP4 (Simulation and optimisation of multi-energy systems) and WP5 (Tools for multi-energy aggregation).
This deliverable aims at setting the first milestone towards this goal, analysing the current set-ups of the cases studies, describing how the technologies and the control strategies currently in place can be a source of flexibility, or as well a bottleneck, and proposing some improvement options for maximising the flexibility provision.
When talking about sector coupling referred to specific installations, it is in fact important to keep into consideration the different backgrounds of the actors involved: the Case study owners, with their strong interest within their core business, and the energy market participants, within their role of supplying cost effective and secure energy.
Together with the identified grid services in Deliverable D3.1, bottlenecks as well as the promising flexibility options to maximise flexibility provision could be determined, having the current case study set-ups as base for the analysis.
Core business of the case studies and main technological characteristics
Referring to the structure of this document, Section 2 deals with the seven project case studies (CS) and the installed technologies for energy production, conversion, storage and distribution. A general description of these case studies is provided in Section 2.1: their variety is very broad, e.g. in terms of sizing, main energy carriers or involved heat temperature levels. Three case studies involve industrial processes (paper mill, wastewater treatment plant, demonstration site including several industries and residential/tertiary buildings), five of them include district heating networks for residential and tertiary heat supply and two of them feature as well district cooling networks. All case studies involve processes of conversion of natural gas into heat or electricity, or conversion of electricity into heat, or inversely, and one of them biogas valorisation for cogeneration. Two of the CS also include small distributed individual units at customers’ premises.
Only few CS have already experience in market participation for grid flexibility services. Five of them are focusing directly to supply energy to end users through a district-heating network; the sizing ranges from providing energy to a campus of office buildings up to a district level. In addition, the implementation of electric vehicles is done in at least one CS.
Technology description
Section 2.2 gives an overview about the technologies used in the different CS.
The technologies described in this Section are:
1. biomass and gas boilers, gas CHP plants, since mainly natural gas is internally used for power
and/or heat production and also biogenic fuels like wood and sewage sludge are used in two
case studies
2. anaerobic digestion, as it is the main energy conversion process for one CS
3. P2H technologies (electric boilers and heat pumps), as they are key options in a sector-coupling
perspective (even if most of the CS do not include P2H technologies so far)
4. batteries: no CS features a battery system so far. However, for the future, the importance of
this technology seems to be high

MAGNITUDE D1.1 - CARTOGRAPHY OF THE FLEXIBILITY SERVICES PROVIDED BY HEATING/COOLING, STORAGE AND GAS TECHNOLOGY AND SYSTEMS TO THE ELECTRICITY SYSTEM – R2.0
©MAGNITUDE Consortium 58 February 2019
5. hot water tanks and steam accumulators, since heat storage plays as well an important role in
flexibility provision
6. electricity network, since all CS are connected to the grid
7. district heating/cooling network, even if the range of temperature levels is very diverse within
the different case studies, making general considerations very complex.
8. Absorption chillers for cold production, as this technology is the main cold production source
in one CS.
A detailed summary about the involved technologies and the seven different case studies is provided in the appendices.
Flexibility services and flexibility provision
Section 3 deals with the capability of the above mapped and described technologies to provide flexibility services within the given market structures.
In particular, Section 3.1 summarises the main outcomes of Deliverable 3.1 “Benchmark of markets and regulations for electricity, gas and heat and overview of flexibility services to the electricity grid”, with respect to the technological characteristics required for the provision of such services.
In Section 3.2, the identified services and the technological characteristics of the CSs are linked through a matrix that shows the capability of the CSs to provide the identified services.
As shown in Table 11, the project CSs can cover most of the services identified in Section 3.1. However, this is not done so far, due to either lack of awareness, economic feasibility, available manpower or technological solutions.
Success factors, bottlenecks and improvement options
In Section 3.3, success factors and bottlenecks towards flexibility provision are identified for each CS, with regard to technological issues. Section 3.4 summarises and ranks the different improvements proposed and discussed with the CS owners or contact points.
Therefore, different solutions and improvements were developed for each CS. In most cases, these proposals were discussed with each CS owner to get their feedback and additional information about their site.
A ranking of the proposed options is proposed, as described in Section 3.4, according to the comments of the CS owners and the expertise of the authors.
The most promising options are: increased utilisation of P2H technologies, both heat pumps and electric boilers, to increase the demand to the grid. In addition, heat storage options are identified as a promising option. Heat storage is not only capable to shave heat peak loads, but, in combination with P2H technologies, also to shave electrical peaks. Furthermore, the increase of energy efficiency is an additional solution, which can be achieved either by internal heat recovery or by identifying additional heat sinks, e.g. new clients for the district heating networks. In this case, the provision of cooling was identified as a promising option.
This deliverable, focusing on a general description of the case studies and their characterisation from the technological point of view, represents the first milestone with regard to the objectives of MAGNITUDE. The following deliverables and other WPs will be able to describe more in details the proposed options and to quantify them through modelling and optimisation.

MAGNITUDE D1.1 - CARTOGRAPHY OF THE FLEXIBILITY SERVICES PROVIDED BY HEATING/COOLING, STORAGE AND GAS TECHNOLOGY AND SYSTEMS TO THE ELECTRICITY SYSTEM – R2.0
©MAGNITUDE Consortium 59 February 2019
5 Acknowledgements
The information provided by Christoph Gutschi from CyberGrid and Diego Arnone from Engineering is much appreciated.

MAGNITUDE D1.1 - CARTOGRAPHY OF THE FLEXIBILITY SERVICES PROVIDED BY HEATING/COOLING, STORAGE AND GAS TECHNOLOGY AND SYSTEMS TO THE ELECTRICITY SYSTEM – R2.0
©MAGNITUDE Consortium 60 February 2019
6 Bibliography
[1] “CORDIS.EUROPA.EU,” [Online]. Available: https://cordis.europa.eu/project/rcn/213922_en.html. [Accessed 2018].
[2] “CORDIS.EUROPA.EU,” [Online]. Available: https://cordis.europa.eu/project/rcn/200841_en.html. [Accessed 2018].
[3] “INDUSTRE.EU,” [Online]. Available: http://www.industre.eu/. [Accessed 2018].
[4] “FLEX4GRID.EU,” [Online]. Available: https://www.flex4grid.eu/. [Accessed 2018].
[5] “FLEXICIENCT-H2020.EU,” [Online]. Available: http://www.flexiciency-h2020.eu/. [Accessed 2018].
[6] EDF, EIFER, REGE, EFFICA <to be completed>, “D3.1 – Benchmark of markets and regulations for electricity, gas and heat and overview of flexibility services to the electricity grid,” MAGNITUDE H2020 European project, Deliverable D3.1, 2018.
[7] “VALMET.COM,,” [Online]. Available: https://www.valmet.com/about-us/references/energy-references/the-worlds-biggest-waste-fired-boiler-at-malarenergis-power-plant/. [Accessed 2018].
[8] "A Combined Heat and Power Plant Under Constant Development," Mälarenergi AB, Västerås, Sweden, 2016.
[9] “CEPI.ORG, "Key Statistics 2015: European Pulp and Paper Industry",” 2015. [Online]. Available: http://www.cepi.org/system/files/public/documents/publications/statistics/2016/FINALKeyStatistics2015web.pdf. [Accessed 2018].
[10] J. Wang, Artist, [Art]. Technical University of Denmark - DTU, with the permission of HOFOR (https://www.hofor.dk/).
[11] “L’accumulo di energia electrica”, RSEview RiflESSioni Sull’EnERgiA, Ricerca sul Sistema Energetico RSE SpA , 2011, Ed. IL MELOGRANO,” RSE.
[12] “BRITANNICA.COM "Tidal Power",” [Online]. Available: https://www.britannica.com/science/tidal-power. [Accessed 2018].
[13] “FLEXIS.WALES, "Demonstration Area",” [Online]. Available: http://www.flexis.wales/demonstration-area/. [Accessed 2018].
[14] Western Power Distribution.
[15] Wales and West Utilities.
[16] EMUASA.
[17] A. Ortwein and V. Lenz, “Flexible Power Generation from Solid Biofuels,” In: Thrän D. (eds) Smart Bioenergy. Springer, Cham, 2015.
[18] “BIOMASSPOWER.GOV.IN, "Biomass combustion",” [Online]. Available: https://biomasspower.gov.in/document/download-lef-tside/Biomass%20combustion%20manual%20-%206%20october%202015.pdf. [Accessed 2018].
[19] R. D. Bessette, L. K. Gershman and D. McWilliams, “CIBO.ORG, "National Emission Standards for Hazardous Air Pollutants for Major Sources: Industrial, Commercial, and Institutional Boilers and Process Heaters; Proposed Rule",” [Online]. Available: https://www.cibo.org/wp-cont.
[20] J. Hentschel, U. s. Babić and H. Spliethoff, “ A parametric approach for the valuation of power plant flexibility options,,” Energy Reports, 2, 40–47, 2016.
[21] “POWER.GLOBALDATA.COM,” [Online]. Available: https://power.globaldata.com. [Accessed 2018].
[22] “PNUCC.ORG, "Capabilities of Electric Power Resources",” [Online]. Available: http://pnucc.org/sites/default/files/CapabilitiesofResourcesReportandMemoweb.pdf. [Accessed 2018].
[23] “SIEMENS.COM,” [Online]. Available: https://www.siemens.com/global/en/home/products/energy/power-generation/steam-turbines.html#!/. [Accessed 2018].
[24] “Flexibility in thermal power plants –With a focus on existing coal-fired power plants,” Agora Energiewende, 115/04-S-2017/EN, 2017.

MAGNITUDE D1.1 - CARTOGRAPHY OF THE FLEXIBILITY SERVICES PROVIDED BY HEATING/COOLING, STORAGE AND GAS TECHNOLOGY AND SYSTEMS TO THE ELECTRICITY SYSTEM – R2.0
©MAGNITUDE Consortium 61 February 2019
[25] “SIEMENS.COM, "Flexibility Solutions",” [Online]. Available: https://www.siemens.com/content/dam/webassetpool/mam/tag-siemens-com/smdb/power-and-gas/power-plants/value-plus/addedvalue-flexibility-final.pdf. [Accessed 2018].
[26] N. Ceccarelli, M. v. Leeuwen, T. Wolf, P. v. Leeuwen, R. v. d. Vaart, W. Maas and A. Ramos, “Flexibility of Low-CO2 Gas Power Plants: Integration of the CO2 Capture Unit with CCGT Operation,” Energy Procedia, vol. 63, no. -, pp. 1703-1726, 2014.
[27] “GLOBAL.KAWASAKI.COM,” [Online]. Available: http://global.kawasaki.com/en/energy/equipment/gas_engines/line_up.html. [Accessed 2018].
[28] “ENERGIZA.ORG,” [Online]. Available: http://www.energiza.org/tubinasgasmarzo14/124-especial-turbinas-de-gas/971-principio-de-operaci%C3%B3n-en-una-turbina-de-gas. [Accessed 2018].
[29] K. Pathirathna , “GAS TURBINE THERMODYNAMIC AND PERFORMANCE ANALYSIS METHODS USING AVAILABLE CATALOG DATA,” University of Gävle, 2013.
[30] “ELCOGAS.ES,,” [Online]. Available: http://www.elcogas.es/en/news-and-documents/news/latest-news/191-1000-horasfuncionamiento. [Accessed 2018].
[31] “Data of Model J624 of Jenbacher Gas Engines (4,5 mWe) & Kawasaki KG-12 (5,2 Mwe)”.
[32] “CATERPILLAR.COM,” [Online]. Available: https://www.caterpillar.com/. [Accessed 2018].
[33] “GUASCOR.EQUIP4SHIP.COM,” [Online]. Available: http://www.guascor.equip4ship.com. [Accessed 2018].
[34] “CLARKE-ENERGY.COM,” [Online]. Available: https://www.clarke-energy.com/2012/using-biogas-for-combined-heat-and-power/). [Accessed 2018].
[35] ENERGYDESIGNRESOURCES.COM, [Online]. Available: https://energydesignresources.com/media/1681/edr_designbriefs_chillerplant.pdf?tracked=true. [Accessed 2018].
[36] “USAIR-ENG.COM,” [Online]. Available: http://www.usair-eng.com/chillers/OMtitan.pdf. [Accessed 2018].
[37] “GETTY.EDU, "American Society of Heating, Refrigerating and Air-Conditioning Engineers",” [Online]. Available: https://www.getty.edu/conservation/publications_resources/teaching/case/olita/resources/docs/Climate_control.pdf. [Accessed 2018].
[38] “WIKIPEDIA.ORG,” [Online]. Available: https://en.wikipedia.org/wiki/Chiller. [Accessed 2018].
[39] “CIBSEJOURNAL.COM,” [Online]. Available: https://www.cibsejournal.com/cpd/modules/2010-02/. [Accessed 2018].
[40] “BRE.CO.UK,” [Online]. Available: https://www.bre.co.uk/heatpumpefficiency/. [Accessed 2018].
[41] “ORO.OPEN.AC.UK "The Energy Saving Trust, Getting warmer: a field trial of heat pumps",” 2010. [Online]. Available: https://oro.open.ac.uk/31647/1/Getting_warmer_a_field_trial_of_heat_pumps_report.pdf. [Accessed 2018].
[42] “VELDE-GROUP.DE,” [Online]. Available: https://www.velde-group.de/en/products-and-services/boiler-constructions/electrode-boilers/. [Accessed 2018].
[43] E. R. Soysal, D. M. Sneum, K. Skytte and O. J. Olsen, “Electric Boilers in District Heating Systems: A comparative Study of the Scandinavian market conditions,” DTU Management Engineering, 2016.
[44] “ Data provided by the energy manager of the paper mill on Feb. 1st, 2017”.
[45] “SMARTEN.EU, "Explicit Demand Response in Europe: Mapping the Markets 2017",” [Online]. Available: http://www.smarten.eu/wp-content/uploads/2017/04/SEDC-Explicit-Demand-Response-in-Europe-Mapping-the-Markets-2017.pdf. [Accessed 2018].
[46] “DIW.DE, "Current and Prospective Costs of Electricity Generation until 2050",” [Online]. Available: http://www.diw.de/documents/publikationen/73/diw_01.c.424566.de/diw_datadoc_2013-068.pdf . [Accessed 2018].
[47] “NEOS-GUIDE.ORG, "Active Power Ramp Rates",” [Online]. Available: https://neos-guide.org/sites/default/files/ramp_rates.pdf. [Accessed 2018].
[48] “BWE.DK, "High Efficient Biomass Energy production",” [Online]. Available: http://www.bwe.dk/download/articles_pdf/art_state_of_green_dec_2015.pdf. [Accessed 2018].

MAGNITUDE D1.1 - CARTOGRAPHY OF THE FLEXIBILITY SERVICES PROVIDED BY HEATING/COOLING, STORAGE AND GAS TECHNOLOGY AND SYSTEMS TO THE ELECTRICITY SYSTEM – R2.0
©MAGNITUDE Consortium 62 February 2019
[49] H. Cai, S. You, H. Bindner, S. Klyapovskiy, X. Yang and R. Li, “Optimal scheduling for electric heat booster udner dayahead electricity and heat pricing,” in Power Engineering Conference (UPEC), 2017.
[50] H. Cai, S. You, J. Wang, H. Bindner and S. Klyapovskiy, “Technical assessment of electric heat boosters in low temperature district heating based on combined heat and power analysis 150, 938-949,” Energy, vol. 150, pp. 938-949, 2018.
[51] C. Gutschi, Artist, [Art]. CyberGrid.
[52] “E-CONTROL.AT,” [Online]. Available: https://www.e-control.at/marktteilnehmer/strom/netzentgelte/netznutzungsentgelt. [Accessed 2018].
[53] “MODERNPOWERSYSTEMS.COM, "Increasing flexibility while reducing cost – is it possible?",” 2014. [Online]. Available: http://www.modernpowersystems.com/features/featureincreasing-flexibility-while-reducing-costs-is-it-possible-430. [Accessed 2018].
[54] “EUROHEAT.ORG "Study on Efficient DHC System in the EU",” [Online]. Available: https://www.euroheat.org/wp-content/uploads/2017/01/study-on-efficient-dhc-systems-in-the-eu-dec2016_final-public-report6.pdf. [Accessed 2018].
[55] “BASISBIOENERGY.EU, "Report on conversion efficiency of biomass",” 2015. [Online]. Available: http://www.basisbioenergy.eu/fileadmin/BASIS/D3.5_Report_on_conversion_efficiency_of_biomass.pdf. [Accessed 2018].
[56] “ZZBOILER.COM,” [Online]. Available: http://www.zzboiler.com/ranqiguolu/dianzhan.html. [Accessed 2018].
[57] “Consulting the sales from ZHENGZHOU BOILER (GROUP) CO.,LTD”.
[58] “ACADEMIA.EDU,” [Online]. Available: http://www.academia.edu/19761519/Start-up_Analysis_of_125MW_Steam_Turbine_at_Different_Condition. [Accessed 2018].
[59] “WSEAS.US, "Efficiency Assessment of Condensing Steam Turbine",” [Online]. Available: http://www.wseas.us/e-library/conferences/2013/Brasov/STAED/STAED-32.pdf. [Accessed 2018].
[60] D. Thrän, Smart Bioenergy, Springer, 2015.
[61] M. A. Salazar, T. Kirsten and L. Prchlik, “Review of the operational flexibility and emissions of gas- and coal-fired power plants in a future with growing renewables,” Renewable and Sustainable Energy Reviews, vol. 18, pp. 1497-1513, 2018.
[62] “ENERGY.GOV, "Combined Heat and Power Technology: Fact Sheet Series",” 2016. [Online]. Available: https://www.energy.gov/sites/prod/files/2016/09/f33/CHP-Steam%20Turbine.pdf. [Accessed 2018].
[63] “ESMAP.ORG, "Study of Equipment Prices in The Power Sector",” 2009. [Online]. Available: https://esmap.org/sites/default/files/esmap-files/TR122-09_GBL_Study_of_Equipment_Prices_in_the_Power_Sector.pdf. [Accessed 2018].
[64] N. Ceccarelli, M. v. Leeuwen, T. Wolf, P. v. Leeuwen, R. v. d. Vaart, W. Maas and A. Ramos, “Flexibility of Low-CO2 Gas Power Plants: Integration of the CO2 Capture Unit with CCGT Operation,” Energy Procedia, vol. 63, pp. 1703-1726, 2014.
[65] “BV.COM, "Cost and Performance Data for Power Generation Technologies: Prepared for NREL",” 2012. [Online]. Available: https://www.bv.com/docs/reports-studies/nrel-cost-report.pdf. [Accessed 2018].
[66] “WARTSILA.COM,” [Online]. Available: https://www.wartsila.com/energy/learning-center/technical-comparisons/combustion-engine-vs-gas-turbine-ramp-rate. [Accessed 2018].
[67] “WARTSILA.COM,” [Online]. Available: https://www.wartsila.com/energy/learning-center/technical-comparisons/combustion-engine-vs-gas-turbine-startup-time. [Accessed 2018].
[68] “US Department of energy”.
[69] “ENERSION.COM,” [Online]. Available: http://enersion.com/cost-of-the-current-cooling-technology/. [Accessed 2018].
[70] “C03.APOGEE.NET,” [Online]. Available: http://c03.apogee.net/contentplayer/?coursetype=ces&utilityid=northwestern&id=1084. [Accessed 2018].
[71] I. Sarbu and C. Sebarchievici, “A Comprehensive Review of Thermal Energy Storage,” Sustainability , vol. 10(1), p. 191, 2018.
[72] “ENS.DK, "Technology Catalogue: Individual Heating Plants Energy Transport",” [Online]. Available: https://ens.dk/sites/ens.dk/files/Analyser/technology_catalogue_individual_heating_plants_energy_transport_aug16.pdf. [Accessed 2018].

MAGNITUDE D1.1 - CARTOGRAPHY OF THE FLEXIBILITY SERVICES PROVIDED BY HEATING/COOLING, STORAGE AND GAS TECHNOLOGY AND SYSTEMS TO THE ELECTRICITY SYSTEM – R2.0
©MAGNITUDE Consortium 63 February 2019
[73] “European Commission Directorate - general for energy, Ed., “Mapping and analyses of the current and future (2020 - 2030) heating/cooling fuel deployment: Work package 2: Assessment of the technologies for the year 2012,” 2016.”.
[74] “Energinet.dk, Ed., “Technology data for energy plants: Generation of Electricity and District Heating: Energy Storage and Energy Carrier Generation and Conversion,” 2012.”.
[75] “Insight-e "analysis of the potential for Power-to-Heat/Cool applications to increase flexibility in the European elctricity system until 2030" 2017”.
[76] D. Liu, G. Zhang, B. Huang and W. Liu, “Optimum Electric Boiler Capacity Configuration in a Regional Power Grid for a Wind Power Accommodation Scenario,” Energies, vol. 9(3), p. 144, 2016.
[77] H. Lund, S. Werner, R. Wiltshire, S. Svendsen, J. E. Thorsen, F. Hvelplund and B. V. Mathiesen, “4th Generation District Heating (4GDH): Integrating smart thermal grids into future sustainable energy systems,” Energy, vol. 15, pp. 1-11, 2014.
[78] “Manufacturer data,” European Institute for Energy Research (EIFER).
[79] “IEABCC.NL, "Sensitivity of System Design on Heat Distribution Cost in District Heating",” 2014. [Online]. Available: www.ieabcc.nl/publications/IEA_Task32_DHS_Cost_Analysis.pdf. [Accessed 2018].
[80] S. Werner and S. Svendsen, District Heating and Cooling, Majestic Books, 2013.

MAGNITUDE D1.1 - CARTOGRAPHY OF THE FLEXIBILITY SERVICES PROVIDED BY HEATING/COOLING, STORAGE AND GAS TECHNOLOGY AND SYSTEMS TO THE ELECTRICITY SYSTEM – R2.0
©MAGNITUDE Consortium 64 February 2019
Appendix A1 Data of the Case Studies
Case Study: Mälarenergi – Combined Heat and Power Plant Västerås
Case study owner
Entity that owns/is responsible for the case study
Mälarenergi AB
Case study interfacer
project participant that holds the contact to the Case study owner
Mälardalen Unversity
Overall description
brief narrative description of the case and how it contributes to the project
The Västerås CHP plant is located in the city of Västerås and provides electricity and heat for the city of Västeras and neighbouring communities - Skultuna, Tillberga, Hokasen, Hallstahammar and Kolbäck. This is Sweden's largest combined power and heating plant composed four separate blocks as well as boiler. Västeras Heat and Power Plant is also one of the cleanest CHP plant in Europe.
- Production based on biofuels 80%, remaining from fossil fuels
- Electricity generation: 700 GWh/y
- Heat generation: 1 800 GWh/y
- Cooling generation: 25 GWh/y
- District cooling customers: 40 large properties in Västeras, including the town hall and the hospital.
- Cooling generation technology: two heat pumps and one absorption system
Block 1 & 2 (block = boiler + turbine) is only used for peak load. They are fired using Tall oil pitch & peat.
Block 6 is used for the base load and fired using biofuel and waste
Boiler 5 is fired using biofuel
Block 3 is fired using oil and only used as backup/for peak loads
Block 6 consists of a circulating fluidised bed boiler with a capacity of accepting up to 50 tons of fuel per hour. The boiler is connected to a turbine and to exhaust gas cleaning
Main integration features
brief narrative description on how the case study integrates different domains
Boilers + Turbines (heat + power)
Heat pump (power-to-heat/cooling)
Absorption system (“heating-to-cooling”)

MAGNITUDE D1.1 - CARTOGRAPHY OF THE FLEXIBILITY SERVICES PROVIDED BY HEATING/COOLING, STORAGE AND GAS TECHNOLOGY AND SYSTEMS TO THE ELECTRICITY SYSTEM – R2.0
©MAGNITUDE Consortium 65 February 2019
Domains covered
list of domains: electricity, heat, cooling, gas
Electricity
Heating
Cooling
List of coupling components
list the coupling components that are part of the case study i.e. components that connect two or more domains
Block1 (boiler + turbine):
100 MWt
30 MWe
start-up year: 1963
Block2 (boiler + turbine):
100 MWt
30 MWe
start-up year: 1963
Block 3 (boiler + turbine):
400 MWt
220 MWe
start-up year: 1969
Block 5:
150 MWt
60 MWe
CFB-boiler
Steam temperature: 540 degrees
Boiler efficiency: 91 %
Condensation power: 42.5 MW
Fuel power: 170 MW
Start-up year: 2000
Block 6 (CFB-boiler + turbine):
120 MWt
50 MWe
Fuel power: 167 MW
Steam temperature: 470 degrees
Boiler efficiency: 90 %
Heat recycling: up to 30 MW
Start-up year: 2014

MAGNITUDE D1.1 - CARTOGRAPHY OF THE FLEXIBILITY SERVICES PROVIDED BY HEATING/COOLING, STORAGE AND GAS TECHNOLOGY AND SYSTEMS TO THE ELECTRICITY SYSTEM – R2.0
©MAGNITUDE Consortium 66 February 2019
Block 7 (boiler + turbine):
To be constructed, operations planned to start in 2020
120 MWt
50 MWe
Heat pump 1:
10 MW district cooling
12 MW district heating
Heat pump 2:
10 MW district cooling
12 MW district heating
Absorption system:
7 MW of district cooling driven with 9 MW of district heating
Hydropower:
42 hydropower stations, generated 179 GWh of electricity in 2016
Storage elements
list the storage elements in the case study that provides flexibility and which state can be controlled
Hot water storage tank 1 (Ackumulatortank 1)
Storage for ca 25 000 m3 of hot water
Hot water storage tank 2 (Ackumulatortank 2)
Not yet put in use, start-up autumn 2018
Storage for 26 000 m3 of hot water
District heating network contains about 24 000 m3 of hot water
Networks
Overall description of the networks that are part of the case study e.g. in terms of length, customers, consumption and generation
District heating network:
Length: 870 km (in 2016)
Number of customers: 14 848 (in 2016)
Consumption: 1 536 GWh (in 2016)
Electric network:
Length: 5 830 km (in 2016)
Number of customers: ca 143 000 (in 2016)
Consumption: 1 708 GWh delivered (in 2016)
2 000 GWh sold (2016)

MAGNITUDE D1.1 - CARTOGRAPHY OF THE FLEXIBILITY SERVICES PROVIDED BY HEATING/COOLING, STORAGE AND GAS TECHNOLOGY AND SYSTEMS TO THE ELECTRICITY SYSTEM – R2.0
©MAGNITUDE Consortium 67 February 2019
Generation: Mälarenergi produced 422 GWh (in 2016) (including hydropower that is about 179 GWh)
Cooling network:
Length:
Number of customers:
Consumption: 27 GWh (in 2016)

MAGNITUDE D1.1 - CARTOGRAPHY OF THE FLEXIBILITY SERVICES PROVIDED BY HEATING/COOLING, STORAGE AND GAS TECHNOLOGY AND SYSTEMS TO THE ELECTRICITY SYSTEM – R2.0
©MAGNITUDE Consortium 68 February 2019
Case Study overall: Paper mill in Austria
Case study owner
Entity that owns/is responsible for the case study
Paper mill in Austria
Case study interfacer
project participant that holds the contact to the Case study owner
cyberGRID
Christoph Gutschi
Overall description
brief narrative description of the case and how it contributes to the project
The paper mill consists of 2 production sites, which are connected electrically.
• Flexibility to the power system can be provided by the steam turbines (CHP) in the steam network.
• Paper mill in Austria is already active on the Austrian mFRR market and can provide existing operational experience. Thus, the case seems to represent a “low hanging fruit”
• The good controllability of power generation of the CHP was the main innovation in the past years and allows participation in the balancing systems
• The case of industrial steam systems seems to have a high potential for replicability.
• The production (energy consumer) part of the sites does not show significant flexibility potential
Main integration features
brief narrative description on how the case study integrates different domains
The paper mill is a net consumer of electricity and gas against the public grids. Excess heat is provided as district heating to the surrounding municipality (ca. 20 000 inhabitants), but the paper mill is not the only heat source.
The main integration “feature” is the steam system with turbines and steam storage, which allows to take influence on the net consumption of electricity and control the generation of the turbines in narrow bandwidth and with a FAT (full activation time) of <5 min (suitable for aFRR).
Changes in power generation have feedback on the gas consumption and may cause imbalances in the gas grid. Those imbalances are rather a (minor) economic risk than a technical issue. (In general, there are no major bottlenecks in the Austrian distribution systems of power and gas.)
Domains covered
list of domains: electricity, heat, cooling, gas
Electricity,
heat (steam, district heating)
natural gas
organic waste/residue (used as additional fuel)
List of coupling components
list the coupling components that are part of the case study i.e. components that
Steam network

MAGNITUDE D1.1 - CARTOGRAPHY OF THE FLEXIBILITY SERVICES PROVIDED BY HEATING/COOLING, STORAGE AND GAS TECHNOLOGY AND SYSTEMS TO THE ELECTRICITY SYSTEM – R2.0
©MAGNITUDE Consortium 69 February 2019
connect two or more domains
Storage elements
list the storage elements in the case study that provides flexibility and which state can be controlled
Steam accumulator
Networks
Overall description of the networks that are part of the case study e.g. in terms of length, customers, consumption and generation
Electricity and gas networks are said not to cause problems (not technical congestions) – only grid tariffs for peak load can be an issue.
There are 2 separate steam networks (only coupled via the electrical network). The steam networks have limited length.
Net power consumption (from public grid) of both sites is ca. 20 MW.
Annual power consumption: ca. 300 GWh/a of which ca. 60 % generated in CHP
Annual gas consumption: ca. 1 100 GWh
Data available Technical description of main components of the steam network
Timeseries of generated power per turbine
Timeseries of gas consumption
Timeseries from steam meters (number and position not communicated yet)
References for previous use of the case study
Not available
Coupling components
Description 3 steam turbines 4 gas and waste fired steam generators
Heat exchanger to public district heating system
Case study Paper mill in Austria
Component owner confidential
From domain Gas
To domain Electricity
Name plate
main characteristic data of the component
confidential
Network
Description
brief description of the network, domain, types of consumers, generation
Electric network
Site 1
20 kV / 6 kV
2 cables to substation of public grid: 20kV, 2* 15 MVA

MAGNITUDE D1.1 - CARTOGRAPHY OF THE FLEXIBILITY SERVICES PROVIDED BY HEATING/COOLING, STORAGE AND GAS TECHNOLOGY AND SYSTEMS TO THE ELECTRICITY SYSTEM – R2.0
©MAGNITUDE Consortium 70 February 2019
Site 2
20 kV / 3 kV
2 cables to substation of public grid: 20 kV, 2* 15 MVA

MAGNITUDE D1.1 - CARTOGRAPHY OF THE FLEXIBILITY SERVICES PROVIDED BY HEATING/COOLING, STORAGE AND GAS TECHNOLOGY AND SYSTEMS TO THE ELECTRICITY SYSTEM – R2.0
©MAGNITUDE Consortium 71 February 2019
Case Study: HOFOR- Nordhavn Case
Case study owner HOFOR
Case study interfacer DTU
Overall description
brief narrative description of the case and how it contributes to the project
Nordhavn is a newly developed area of Copenhagen with a state of the art district heating system and distribution network. Århusgadekvarteret is the first neighborhood in Nordhavn with significant and dense development and covers about 0.2 km². At the end of the development period, Århusgadekvarteret is expected to house 3 000 residents and 7 000 work spaces.
The area consists mainly of newly built buildings. Flexibility of the low energy buildings will be modelled when applying demand response schemes. Consumption can be controlled and this is the main feature of the case study. Flexibility includes direct heat to electricity, building management systems and links to the district heating system.
Main integration features
brief narrative description on how the case study integrates different domains
The units in Nordhavn involve different types of equipment that make them flexible from a power system point of view. Buildings adhere particular building regulations (BR2020) and could have building automation or controllable heating, or they could be connected in the district heating system. Additionally, the network is designed to allow introduction of new equipment such as booster heat pumps.
A number of decentralised electrical booster heaters is installed in the district heating system, to supplement heat energy at times of peak demand.
Some single family row houses have a "fuel shift unit" installed, which combines a district heating supply with a storage tank and an electrical booster heater.
Domains covered
list of domains: electricity, heat, cooling, gas
Electricity, heat
Overall configuration The system configuration consists primarily of the two networks (electricity and heat), electricity and heat consumers and a number of power-to-heat units integrated into the district heating system.
The schematic starts from the 10 kV/0.4 V substation and 50 kV/10 kV transformer and the district heating network connection node down to the block of buildings and individual buildings.
Available data in hourly resolution are:
Heat: temperature (supply/return), accumulated flow, accumulated energy, flow and power
Electricity: hourly load profiles (not measurement)
List of coupling components
list the coupling components that are part of the case study i.e. components that
Nordhavn uses a 4th generation low-temperature district heating system for supplying residential and commercial heat demand. The low temperatures employed increase the mass flow requirement and consequently the required network capacity for a given heat demand. This improves the business case for achieving heat peak shaving by using

MAGNITUDE D1.1 - CARTOGRAPHY OF THE FLEXIBILITY SERVICES PROVIDED BY HEATING/COOLING, STORAGE AND GAS TECHNOLOGY AND SYSTEMS TO THE ELECTRICITY SYSTEM – R2.0
©MAGNITUDE Consortium 72 February 2019
connect two or more domains
electrical fuel-shift units at building level, or by using electrical booster units embedded into the heat network. Electrical heating units (simple resistive heaters or heatpumps) connected to the district heating network are potentially able to provide services to the electrical grid by using the heat capacity and operational flexibility of the district heating network as storage. Each of these use cases requires close operational coordination between the electrical and thermal systems.
Storage elements
list the storage elements in the case study that provides flexibility and which state can be controlled
- Two of the large heat producing plants in Copenhagen, have large accumulation tanks which can supply the entire city for a number of hours. However, all of these are outside of the Nordhavn district
- Hot water accumulation tanks with an integrated heat exchanger for connecting to district heating are installed in all buildings
-Flexhouses in DTU/SYSLAB could be used to explore flexibility through their controllable loads
Networks
Overall description of the networks that are part of the case study e.g. in terms of length, customers, consumption and generation
Electrical Layout: Medium-voltage (10 kV) and low-voltage (400 V) distribution grids
- Network topology, cable data, substation data can be available for 10 kV (after fixing the NDA agreement)
Thermal Layout: A new 4th generation low-temperature network is deployed in all areas of Nordhavn, which are currently under development. Existing networks which supplied the container port and some industries are being upgraded to the same standard. In the winter, the system is operated with a forward temperature of 65 - 70ᵒC and a return temperature of <=40ᵒC. During summer, the forward temperature is 65ᵒC with a return temperature of 30ᵒC.
- Network details such as roughness/diameter/topology of pipes can be available(after fixing the NDA agreement)
Coupling components
Because the availability of raw system configuration data is a bit limited and because at the moment only non-sensitive and commercial data will be made available for the MAGNITUDE project, to overcome that difficulty DTU proposed to use equipment available in SYSLAB: Flexhouses, heat pumps/electric heaters , electrical boosters/electric water heater
Description Flexhouses:
-The overall purpose of the FlexHouses facility is to provide a test platform for exploring the technical potential for actively controlled buildings as an asset in intelligent power grids.
There are three Flexhouses in SYSLAB, each of which entails different levels of controllability (different amount of sensors and actuators in every house) and different heat resources.
Case study
Main features Flexhouse1 consumes heat produced by the electric heaters installed in the building. Space heating and other individual demand can be

MAGNITUDE D1.1 - CARTOGRAPHY OF THE FLEXIBILITY SERVICES PROVIDED BY HEATING/COOLING, STORAGE AND GAS TECHNOLOGY AND SYSTEMS TO THE ELECTRICITY SYSTEM – R2.0
©MAGNITUDE Consortium 73 February 2019
controlled in Flexhouse1. The various controllable electrical units will be controlled within given conditions according to the required service level on the one hand and the potential benefits on the other hand.
Flexhouse2 and Flexhouse3 consume heat coming from a local heat substation (heat switchboard) in SYSLAB which constitutes of two heat pumps and an electrical heater. Flexhouse2 and flexhouse3 can be controlled from the heat switchboard.
Flexhouse2 has the lower control flexibility. The house can be controlled only as a whole and not by individual devices.
In Flexhouse3, heat consumption can be controlled in individual rooms through thermostatic control or controlling the radiator valves or switching on/off the devices.
From domain electricity
To domain Heat
Name plate
- manufacturer -heat pump: viessmann vitocal
- ratings The following load units could be made controllable as flexible loads in Flexhouse1:
12 electrical space heaters (0.5 - 1.5 kW)
One 0.5 kW refrigerator
One 5 kW hot water system with storage tank
One 2 kW coffee machine
One 5 kW air conditioner
One 10 kWh heat storage (electrical heating of a mass storage)
-datasheet of heat pump is available to be sent
- Flexhouse2 contains an electrical booster which is mainly an electric water heater with 3 kW rating and a tank size 92 litres.

MAGNITUDE D1.1 - CARTOGRAPHY OF THE FLEXIBILITY SERVICES PROVIDED BY HEATING/COOLING, STORAGE AND GAS TECHNOLOGY AND SYSTEMS TO THE ELECTRICITY SYSTEM – R2.0
©MAGNITUDE Consortium 74 February 2019
Case Study: ACS
Title
Canavese Plant – district heating
Case study owner
Entity that owns/is responsible for the case study
ACS (A2A Calore Servizi)
Case study interfacer
project participant that holds the contact to the Case study owner
RSE
Overall description
brief narrative description of the case and how it contributes to the project
ACS case study is a “3rd generation” district heating network system located in the east side of Milan (called “Milano Est”). The district heating networks are connected to several power plants which are equipped with all main interconnection technologies available between heat, gas and electricity: CHP engines (gas+heat+power), heat pump (power-to-heat), electric boiler (power-to-heat) under installation and thermal storage systems. Different interconnections among the district heating will be made available (extension of connection to Milano Nord and Milano West).
Identification of (additional) flexibility in district heating networks, combining different technologies (CHPs, heat pumps, electric boilers), defining new operation modes of thermal storage, quantifying district heating inertial capacity. Additional flexibility might be obtained increasing thermal storage availability, or power-to-heat capability from heat pumps and electric boilers.
Thanks to the chosen case study, the developed methods and results will have a very high replicability factor as the system under consideration is representative for the most diffused district heating system designs across Europe and other countries.
District heating systems, designed to provide flexibilities, have a very high potential to support vRES integration, to decarbonise the energy system and balance the power grid in the European context under favourable regulative and market frameworks.
Main integration features
brief narrative description on how the case study integrates different domains
The district heating networks are connected to several power plants which are equipped with all main interconnection technologies available between heat, gas and electricity: CHP engines (gas+heat+power), heat pump (power-to-heat), electric boiler (power-to-heat) under installation and thermal storage systems. Different interconnections among the district heating will be made available (extension of connection to Milano Nord and Milano West).

MAGNITUDE D1.1 - CARTOGRAPHY OF THE FLEXIBILITY SERVICES PROVIDED BY HEATING/COOLING, STORAGE AND GAS TECHNOLOGY AND SYSTEMS TO THE ELECTRICITY SYSTEM – R2.0
©MAGNITUDE Consortium 75 February 2019
Domains covered
list of domains: electricity, heat, cooling, gas
Electricity
Heat
gas
List of coupling components
list the coupling components that are part of the case study i.e. components that connect two or more domains
Currently installed:
(2) Gas boilers (15 MWt)
(3) chp enegines (5,04 MWe, 4,4 MWt)
(1) heat pump (Unitop FY-81611 U)
(2) thermal storages (1000 m3)
Under installation (running in 2018)
(1) heat pump (UNITOP 22/22AY - 6087U)
(2) electric boilers
Storage elements
list the storage elements in the case study that provides flexibility and which state can be controlled
2 thermal storage equipment. Can be controlled in charge and discharge mode (thermal) power.
Networks
Overall description of the networks that are part of the case study e.g. in terms of length, customers, consumption and generation
heating network
electric networks
gas networks
Data available Data available can be partitioned into two main categories: stored every 5 minutes and stored every 0.5 seconds. There other data with higher time granularities (monthly).
For the first category there are the following ones (5 minutes time slot):
• Boilers: thermal power for each boiler; gas flow (for both boilers)
• CHP: produced thermal energy (for each), produced electric energy (for each), gas flow (the sum of the three)
• Heat pump: produced thermal energy, consumed electric energy;
• Thermal storages: input thermal power (sum of two storages), output thermal storage, water input and output flow;
• Main (electrical) grid, point 1: input energy (to the plant), output energy (from the plant to the grid),
• Main (electrical) grid, point 2: input energy (to the plant), output energy (from the plant to the grid),
• Power center A: electric energy;
• Power center B: electric energy;

MAGNITUDE D1.1 - CARTOGRAPHY OF THE FLEXIBILITY SERVICES PROVIDED BY HEATING/COOLING, STORAGE AND GAS TECHNOLOGY AND SYSTEMS TO THE ELECTRICITY SYSTEM – R2.0
©MAGNITUDE Consortium 76 February 2019
For the second category there are the following ones (0.5 seconds time slot – data stored from 15/10/2017):
• Plant data: return flow district heating network (DH), active power QMT1 and QMT2, active power bus A QMT3 and bus B QMT3
• Boilers: gas flow rate BD1 , BD2 and BD3, thermal power BD1, BD2 and BD3;
• CHP: gas flow rate MG1, MG2, and MG3; water flow rate DH MG1, MG2 and MG3, thermal energy MG1, MG2 and MG3, electric power generated MG1, MG2 and MG3, input temperature MG1, output temperature MG1;
• Heat Pump1: COP H1, electric power consumption HP1, thermal energy HP1 and counted thermal energy;
• Thermal storages: output temperature to DH, measure flow rate at the tank collector for charge and discharge, measure temperature from/to DH network, measure temperature from / to DH network;
Data referred to monthly period:
• Gas network data: heating value kJ/M3; mean value heating value kCal/m3; weighted arithmetic mean kCal/m3;

MAGNITUDE D1.1 - CARTOGRAPHY OF THE FLEXIBILITY SERVICES PROVIDED BY HEATING/COOLING, STORAGE AND GAS TECHNOLOGY AND SYSTEMS TO THE ELECTRICITY SYSTEM – R2.0
©MAGNITUDE Consortium 77 February 2019
Case Study: Neath Port Talbot
Title
Neath Port Talbot County Borough Council area (NPT)
Case study owner
Entity that owns/is responsible for the case study
This case study covers the Neath Port Talbot County Borough Council area in Wales. This case study includes residential buildings (about 140,000 residents), power stations and several industries. Tata Steelworks is also located in Port Talbot, and is a key element of this case study.
Case study interfacer
project participant that holds the contact to the Case study owner
Cardiff University
Overall description
brief narrative description of the case and how it contributes to the project
The area has a variety of distributed generation that includes approximately 690MW of operational on-shore wind farms, solar photovoltaics, biomass and gas turbines (both open cycle and closed cycle). It also has the potential to benefit from 2,175MW of distributed generation which is either under-construction or whose permission is granted. The aggregated annual energy consumption (gas and electricity) is 2,715GWh for both domestic and non-domestic properties. The largest energy consumer in the area is Tata steel industry that has an average electrical demand of 140MW and an average on-site generation of 70MW using its own waste gas or grid natural gas.
The Tata Steel Works in Port Talbot is an ‘Integrated Steel Works’ and thus produces steel from iron ore. The works has a Coke Ovens, Sinter Plant, two Blast Furnaces, two Basic Oxygen Steel making vessels, three Continuous Casters, a Hot Strip Mill, a linked Pickle Line and Cold Mill and a Continuous Annealing Process Line (CAPL).
Main integration features
brief narrative description on how the case study integrates different domains
There are links between gas and electricity networks established through gas-fired power plants.
Currently Tata steel works participate in the frequency response market, reserve markets and have plan to participate in the capacity market. Tata steel works generate hydrogen enriched gas from the steel making process and use the generated gas in proposed CCGT power plant. This aims to achieve self-sufficiency in terms of on-site electricity generation for the steel industry. As a result, this can reduce the electricity import from the grid and provide demand side balancing reserve during peak hours.
Domains covered
list of domains: electricity, heat, cooling, gas
Electricity, natural gas, waste gases (consists of H2) and waste heat
List of coupling components Gas-fired power plants coupling gas and electricity

MAGNITUDE D1.1 - CARTOGRAPHY OF THE FLEXIBILITY SERVICES PROVIDED BY HEATING/COOLING, STORAGE AND GAS TECHNOLOGY AND SYSTEMS TO THE ELECTRICITY SYSTEM – R2.0
©MAGNITUDE Consortium 78 February 2019
list the coupling components that are part of the case study i.e. components that connect two or more domains
Storage elements
list the storage elements in the case study that provides flexibility and which state can be controlled
NA
Networks
Overall description of the networks that are part of the case study e.g. in terms of length, customers, consumption and generation
Neath Port Talbot:
Neath Port Talbot area is served by Western Power Distribution using different substations with voltages ranging between 132-11kV.
Annual electricity demand: 1,158,907 MWh
Tata steel:
Average electricity consumption: 140 MWe
Average electricity generation: 70MWe
Average electricity Import: 70MWe
Data available • Electricity distribution network data for the NPT is available. It includes the connection to National Grid’s transmission network at the 400 and 275kV levels, DNO’s sub transmission level (132kV) and distribution level down to the 11kV substations. (Data provided by WPD who is the owner and operator of the power distribution network in the area. Cardiff University and WPD have NDA to use the data for research purposes)
• Embedded generation over 1 MW and connection voltages (publically available).
• Annual generation and capacity installed in 2015 for biomass, hydro, onshore wind and solar PV (publically available).
• Aggregated annual electricity consumption for Industrial/Commercial and the domestic sector from 2005 to 2014 (publically available).
• Irradiation data at 30min resolution for the demonstration area from 2009 to 2016 that can be used to estimate PV generation at 30min resolution (the data provided by two solar PV generation in the area).
• Natural Gas demand at daily resolution from the national transmission system offtake for the area (the area covered includes the NPT and some additional local authorities) for 2015 and 2016 (publically available).
• Aggregated annual natural gas consumption for the local authority for the Industrial/Commercial sector and the domestic sector from 2005 to 2014 (publically available).

MAGNITUDE D1.1 - CARTOGRAPHY OF THE FLEXIBILITY SERVICES PROVIDED BY HEATING/COOLING, STORAGE AND GAS TECHNOLOGY AND SYSTEMS TO THE ELECTRICITY SYSTEM – R2.0
©MAGNITUDE Consortium 79 February 2019
References for previous use of the case study
FLEXIS, feasibility studies for district heating in the area by AECOM [13] .
Coupling components 1
Description Gas turbine
Case study
Main features
Brief description of the coupling component and the connecting domains incl. the main operational mode in the case study
Gas-fired generating units with a total of 95 MW capacity installed using both natural gas and gas from blast furnaces
Component owner Tata Steel
From domain Gas
To domain Electricity
Coupling components 2
Description Gas turbine
Case study
Main features
Brief description of the coupling component and the connecting domains incl. the main operational mode in the case study
Gas-fired generating units with a total of 32 MW capacity
Component owner MPF Operations Ltd
From domain Gas
To domain Electricity
Coupling components 3
Description CCGT
Case study
Main features
Brief description of the coupling component and the connecting domains incl. the main operational mode in the case study
Gas-fired generating units with a total of 520 MW capacity
Component owner MPF Operations Ltd
From domain Gas
To domain Electricity

MAGNITUDE D1.1 - CARTOGRAPHY OF THE FLEXIBILITY SERVICES PROVIDED BY HEATING/COOLING, STORAGE AND GAS TECHNOLOGY AND SYSTEMS TO THE ELECTRICITY SYSTEM – R2.0
©MAGNITUDE Consortium 80 February 2019
Network 1 Description
brief description of the network, domain, types of consumers, generation
Gas distribution network
Main characteristics
voltage levels, temperature
7 bar < pressure <35 bar
Topology
main design and operational principle: ring, open ring...
Radial gas distribution network
Components
substations, rating of main components
Gas off-take from national gas transmission network, pipes, regulators
Network 2 Description
brief description of the network, domain, types of consumers, generation
Electricity distribution network
Main characteristics
voltage levels, temperature
Distribution grid (132, 66, and 33kV)
Case Study: EMUASA
Case study owner EMUASA (Empresa Municipal de Aguas y Saneamiento de Murcia)
Case study interfacer Regenera
Overall description
brief narrative description of the case and how it contributes to the project
Murcia Este WWTP is a comprehensive “multi energy system”. Biogas, resulting from sludge Anaerobic Digestion (AD), is continuously produced and used to feed a Combined Heat and Power (CHP) plant, producing heat and electricity which is onsite consumed.
Electricity is also produced by means of solar panels installed in parking areas and over roofs. This energy is injected to the electric network.
As forthcoming evolutions, a small upgrading plant will be installed in the WWTP to produce biomethane for automotive uses (2.5 m3/h).
EMUASA contributes to the project development providing historical data about energy production and energy uses.
Main integration features
brief narrative description on how the case study integrates different domains
Murcia Este WWTP was designed to treat 100 000 m3/d with peak season contaminant loads of 588 mgBOD5/l and 548 mgSS/l.
The sludge produced feeds 3 anaerobic digesters (18 317 m3). Anaerobic digestion allows to stabilise the sludge, reducing the final sludge amount and producing biogas (63.4 % CH4, 34.1 % CO2.). This biogas is stored in

MAGNITUDE D1.1 - CARTOGRAPHY OF THE FLEXIBILITY SERVICES PROVIDED BY HEATING/COOLING, STORAGE AND GAS TECHNOLOGY AND SYSTEMS TO THE ELECTRICITY SYSTEM – R2.0
©MAGNITUDE Consortium 81 February 2019
2 gasometers (1 350 m3), cleaned to remove undesired compounds, as hydrogen sulphide, siloxanes and moisture (THIOPAQTM, cooling and activated carbon column), and finally used to feed a CHP plant.
The CHP plant includes 3 engines (0.5 MWe/unit), one of them as reserve, and burns 7 300 Nm3/d, allowing to produce 100 % of thermal and 48 % of electricity WWTP´s requirements.
In case of breakdown of any of the engines or any preventive maintenance shutdown, there is a reserve boiler (ECOFLAM ECOMAX NC 1600) that allows to keep the digesters optimal Tª.
Biogas valorisation allows to avoid GHG and SO2 emissions related to biogas flaring.
Domains covered
list of domains: electricity, heat, cooling, gas
• Electricity
• Gas
• Heat
List of coupling components
list the coupling components that are part of the case study i.e. components that connect two or more domains
• CHP (Biogas to Electricity and Heat)
• Anaerobic digestion (Sludge+Heat to Biogas)
Storage elements
list the storage elements in the case study that provides flexibility and which state can be controlled
• 2 double-membrane spherical gasometers (1 350 m3). The amount of biogas stored is controlled by the line pressure (250 mbar). If the pressure is higher because biogas consumption is not enough (CHP plant shutdown’s), there is a flare to burn biogas excess.
Networks
Overall description of the networks that are part of the case study e.g. in terms of length, customers, consumption and generation
• Electricity Network (frequency needs etc.) El. consumers in all process lines such as pumps, turbochargers, rotary screens, centrifuges, blowers, …
Coupling components
Description CHP plant
Case study EMUASA
Main features Two engines provide 1 MW electrical capacity, a 1 038 kWth heat exchanger utilises generated waste heat for sludge heating in the digesters.
• CHP covers ca. 48 % of on-site el. demand
• CHP covers 100 % of on-site th. demand
From domain Biogas
To domain Electricity and Heat
Name plate TCG2016C V12

MAGNITUDE D1.1 - CARTOGRAPHY OF THE FLEXIBILITY SERVICES PROVIDED BY HEATING/COOLING, STORAGE AND GAS TECHNOLOGY AND SYSTEMS TO THE ELECTRICITY SYSTEM – R2.0
©MAGNITUDE Consortium 82 February 2019
- manufacturer MWM/ [32]
- ratings 3 x 500 kWel
- operating constraints
o min start/stop times
o
- Max. starts per year: no limitation - Max. starts per day: no limitation - Min. runtime after start: 15 min
- Operating characteristics
o efficiency o ramping
- El. efficiency: 40 %; th. efficiency: 42 % - flexible part load between 50 % to 100 % of design load - exhaust gas temperature: 465ᵒC, after heat exchanger (for
sludge heating) it is 180 – 200ᵒC (instantaneous value monitored but not recorded)
Costs
- CAPEX 2.9 M€
Description Anaerobic digesters
Case study EMUASA
Main features 3 anaerobic digesters produce biogas by breaking down degradable components in the sludge in biochemical reactions. The optimal operating temperature is at 37ᵒC.
From domain Sludge + Heat
To domain Biogas
- ratings • Total volume: 18 317 m3
• Operating temperature: 37ᵒC. Max Temp: 40ᵒC.
- operating constraints
o min start/stop times
o
Continuously operating. The amount of sludge digested and thus the quantity of biogas produced depends on the pollution and the volume of the wastewater treated.
- Operating characteristics
o efficiency o ramping
45 % elimination of volatile matter
Hydraulic Retention Time (HRT): 21 days

MAGNITUDE D1.1 - CARTOGRAPHY OF THE FLEXIBILITY SERVICES PROVIDED BY HEATING/COOLING, STORAGE AND GAS TECHNOLOGY AND SYSTEMS TO THE ELECTRICITY SYSTEM – R2.0
©MAGNITUDE Consortium 83 February 2019
Case Study: Paris Saclay
Case study owner
Entity that owns/is responsible for the case study
Etablissement public d’aménagement Paris-Saclay (EPAPS)
Case study interfacer
project participant that holds the contact to the Case study owner
EFFICACITY
Mathieu AVELINE
Nicolas DAMESIN
Mohamed ELMITRI
Overall description
brief narrative description of the case and how it contributes to the project
Commissioning : beginning of 2019
1.7 Mm2 real estate program
37 MW heat
10 MW cold
Network length : 25 km
Approx 70 buildings connected by end 2022
Geothermal source (200 m3/h – 30ᵒC/10ᵒC)
Heat production:
- Baseload= deep geothermal + heat pumps - Peak = gas boilers
Cold production:
- Baseload= free cold generated by heat pumps making heat - Peak= wet coolers
+ Monitoring and optimisation tools with approx. 2 000 sensors by 2022 and optic fiber along the pipes
Main integration features
brief narrative description on how the case study integrates different domains
Paris Saclay network contribute to the project because it mixes heat, cold and domestic hot water. Energy comes from a geothermal source (200 m3/h – 30ᵒC/10ᵒC) and gas boilers.
Domains covered
list of domains: electricity, heat, cooling, gas
Heat and cooling
List of coupling components
list the coupling components that are part of the case study i.e. components that connect two or more domains
Heat pumps
Storage elements
list the storage elements in the case study that provides
Storage may be implemented after 2022. Nothing decided yet.

MAGNITUDE D1.1 - CARTOGRAPHY OF THE FLEXIBILITY SERVICES PROVIDED BY HEATING/COOLING, STORAGE AND GAS TECHNOLOGY AND SYSTEMS TO THE ELECTRICITY SYSTEM – R2.0
©MAGNITUDE Consortium 84 February 2019
flexibility and which state can be controlled
Networks
Overall description of the networks that are part of the case study e.g. in terms of length, customers, consumption and generation
37 MW heat
10 MW cold
Network length : 25 km
Approx 70 buildings connected by end 2022
References for previous use of the case study
Efficient district heating and cooling systems in the EU (2016) [54].
Coupling components
Description Heat pump
Case study Paris Saclay
Main features
Brief description of the coupling component and the connecting domains incl. the main operational mode in the case study
Heat pump making heat and cold
Component owner EPAPS
Name plate
main characteristic data of the component
- ratings - electrical power,
thermal power, voltage level, flow rates
Cold power : 237 kW / Heat power : 355 kW
- Operating characteristics
o efficiency o ramping
COP = 3
Costs
- CAPEX Approx 55 k€
- OPEX = Electricty costs + operating costs
Operating costs = 53 k€ + 8 x Heat power of the plant
Storage elements
No storage element yet
Network Heat, Cold

MAGNITUDE D1.1 - CARTOGRAPHY OF THE FLEXIBILITY SERVICES PROVIDED BY HEATING/COOLING, STORAGE AND GAS TECHNOLOGY AND SYSTEMS TO THE ELECTRICITY SYSTEM – R2.0
©MAGNITUDE Consortium 85 February 2019
Description
brief description of the network, domain, types of consumers, generation
Network length : 25 km
Approx 70 buildings connected by end 2022: 1/3 housing, 1/3 university and public labs and 1/3 private industries or offices
Case study Paris Saclay
Main characteristics
voltage levels, temperature
Energy comes from a geothermal source (200 m3/h – 30ᵒC/10ᵒC) and gas boilers
Topology
main design and operational principle: ring, open ring...
2 main rings (tempered networks)
7 small heat rings
7 small cold rings
Some of the heat or cold rings are connected
Components
substations, rating of main components
Valves
Exchangers
Dimensions
extent of network, number of substations etc.
25 km
70 substations by 2022
Length, cross section, type
brief description, attach network description file
25 km
Nominal pipe diameters between 50 and 500 mm
Generation and
consumption
description of generation and consumption, profiles etc., attach files
Not known yet (mobile boilers and coolers for the first customers)

MAGNITUDE D1.1 - CARTOGRAPHY OF THE FLEXIBILITY SERVICES PROVIDED BY HEATING/COOLING, STORAGE AND GAS TECHNOLOGY AND SYSTEMS TO THE ELECTRICITY SYSTEM – R2.0
©MAGNITUDE Consortium 86 February 2019
Appendix A2 Technology Factsheets
• Biomass Boiler
Create by Hailong Li, MDH
Category (P2G/P2H/H2P/H2G/G2P/G2H) H2P
Technology Name Biomass boiler
Description (including working principle)
In combustion, all fuel components are oxidised to the maximum. Commonly used technologies for combustion include different grate firings, fluidised bed combustion and dust firing.
Technical Maturity TRL 9 [17]
KPI (key performance indicator, such as efficiency) and the correpsponding performance
KPI Value
KPI1: Heat Efficiency: 83 % [55] Sweden, 5-20 MWt Boiler
Capacity ramp up/down 30 % - 110 % [17]
Ramp up/down time 20 %/Hour – 1 %/Minute [17]
Frequency of allowed start/stops (Time needed between two activations )
Few Hours [17]
Input & output parameters Input: Biomass, Air; Output: Steam
Parameters about performance monitoring and control
Steam flow rate, temperature, Pressure
Working Capacity Per Unit (give a range) 4 - 300 MWe, many in 20 - 50 Mwe [17]
Minimum load 30 % [17]
Operation hour (Availability during the year) More than 8 000 hours in the existing power plants [17]
Capital Cost 1 649 – 3 735 (2010) €/kW
Operation cost Fixed O&M: 3 – 6 % of installed cost, Variable O&M: 3.3 - 4.1 €/MWh
Related bottlenecks (production, sales, contracts) No bottleneck
Constrain of application Biomass Recourse
Technology coupling (with which technologies?) Steam Turbines

MAGNITUDE D1.1 - CARTOGRAPHY OF THE FLEXIBILITY SERVICES PROVIDED BY HEATING/COOLING, STORAGE AND GAS TECHNOLOGY AND SYSTEMS TO THE ELECTRICITY SYSTEM – R2.0
©MAGNITUDE Consortium 87 February 2019
• Gas boiler
Create by Yang Zhang, MDH
Category (P2G/P2H/H2P/H2G/G2P/G2H) H2P
Technology Name Gas boiler
Main Technology (core business) Heat production
Description (including working principle)
Gas boilers convert the chemical energy of natural gas to heat. Gas boiler is a mature technology with Technology Readiness Level (TRL) of 9. Gas-fired boiler technology is no longer deployed for new electricity generation in Europe. According to the data in GlobalData, countries with these active power plants include Azerbaijan, Belarus, Belgium, Bulgaria, Czech Republic, Finlan, Gerogia, Germany, Greece, Hungary, Ireland, Italy, Lithuania, Netherlands, Republic of Moldova, Romania, Russian Federation, Turkey, and United Kingdom. The remaining countries do not have any in the electrical grid. Technical Maturity TRL 9
KPI (key performance indicator, such as efficiency) and the correpsponding performance
KPI Value
KPI1: Heat Efficiency: 90 - 92 % [56] 20 - 130 t
Unit capacity up to 450 t/h
Capacity ramp up/down 15 %/Hour [22] Whole plant, not only the boiler
Start-up/down time 4 - 6 Hours [57]
Input & output parameters Input: Natural Gas, Air; Output: Steam
Parameters about performance monitoring and control
Steam flow rate, temperature, Pressure
Technology coupling (with which technologies?) Steam Turbines

MAGNITUDE D1.1 - CARTOGRAPHY OF THE FLEXIBILITY SERVICES PROVIDED BY HEATING/COOLING, STORAGE AND GAS TECHNOLOGY AND SYSTEMS TO THE ELECTRICITY SYSTEM – R2.0
©MAGNITUDE Consortium 88 February 2019
• Steam turbine
Create by Worrada Nookuea, MDH
Category (P2G/P2H/H2P/H2G/G2P/G2H) H2P
Technology Name Steam Turbine
Main Technology (core business) Electricity and heat production
Description (including working principle)
A steam turbine is a device that extracts thermal energy from pressurised steam and uses it to do mechanical work on a rotating output shaft. • Backpressure steam turbine – Here, power and heat production are directly coupled. In order to use backpressure turbines at times with peak power demand and low heat demand, one needs appropriate heat storage devices or auxiliary condensers (Konstantin 2007). Backpressure steam turbine power plants follow heat demand. • Extraction-condensing steam turbine – A part of the steam is extracted from the turbine to be used for heat consumers. The remaining part is used for condensation in the turbine. Such plants can vary the share of heat and power production and they do not have to follow heat demand. • Combined Cycle with heat extraction – Steam is extracted from the steam cycle to be used for heat consumption.
Technical Maturity TRL: 9
KPI (key performance indicator, such as efficiency) and the correpsponding performance
KPI Value
KPI1: Power to Heat Ratio [58] 500 kW: 0.086
3 MW: 0.066
15 MW: 0.101
KPI2: Turbine Efficiency [59] 30 to 500 MW: Design range of 34.80 – 43.97 %, Measured range: 31.00 to 41.90 %
KPI3: Isentropic Efficiency [59] 30 to 500 MW: Design range of 83.20 – 89.10 %, Measured range: 74.13 – 86.40 %
200 MW, High pressure turbine 70 % Load: 66.67 %
85 % Load: 72.91 %
94 % Load: 74.31 %
200 MW, Reheat or intermediate pressure turbine
70 % Load: 79.62 %
85 % Load: 80.80 %
94 % Load: 86.42 %
200 MW, Low pressure turbine 70 % Load: 81.36 %
85 % Load: 74.15 %
94 % Load: 70.53 %
KPI4: Mechanical Efficiency [59]
200 MW, Low pressure turbine 70 % Load: 98.63 %

MAGNITUDE D1.1 - CARTOGRAPHY OF THE FLEXIBILITY SERVICES PROVIDED BY HEATING/COOLING, STORAGE AND GAS TECHNOLOGY AND SYSTEMS TO THE ELECTRICITY SYSTEM – R2.0
©MAGNITUDE Consortium 89 February 2019
85 % Load: 98.82 %
94 % Load: 99.06 %
KPI5: Turbine Isentropic Efficiency [59]
200 MW, Low pressure turbine 70 % Load: 63.39 %
85 % Load: 62.48 %
94 % Load: 64.56 %
KPI6: Thermal Efficiency [59]
200 MW, Low pressure turbine 70 % Load: 40.78 %
85 % Load: 40.12 %
94 % Load: 41.08 %
KPI7: Electrical Efficiency
>1 MW [60] 25-35 %
Working Capacity Per Unit (give a range) Steam turbines are available in sizes from under 100 kW to over 250 MW [58]
Sub-critical cycle: Small-scale power plant (<50 MW), Mid-size power plant (~300 MW) [61]
Super-critical cycle: Large-scale power plant (~500 MW) [61]
Ramping rate (% full load/min ) Steam plant: gas, oil 7 % full load/min, coal 6 % full load/min, Lignite 4 % full load/min [61]
>1 MW steam turbine: 10 % per minute [60]
Startup/Shut down time at full load 125 MW, cold startup applicable at Trotar
metal <150ᵒC, warm startup 150ᵒC < Trotor metal< 400ᵒC and hot startup Trotar metal> 400ᵒC [62]
Cold startup
When turbine starts from cold condition it takes 240 minute to achieve full load 125 MW. Initially turbine does not take any load up to 60 minute then start to take load. During no load condition turbine attains 3 000 rpm and warms-up with in 60 minute.
When turbine starts from cold condition it takes 60 minute to achieve full speed 3 000 rpm. During different speed interval it is require to cross critical speed very rapidly.
High pressure turbine takes 240 minutes to attain 530ᵒC. It stands steady to 15 minutes at 350ᵒC and then starts to raise temperature for regular time interval.
High pressure turbine steady at 30 bar pressure for 120 minutes then allow to raise steam pressure. It attains full load steam pressure 130 bar at 240 minutes.
Intermediate turbine also steady at 350 to 352ᵒC for 15 minutes then increases during regular time interval. It takes 240 minutes to attain 530ᵒC.
Intermediate pressure turbine steady at 7.5 bar pressure for 120 minutes then allows increasing its pressure. It takes 240 minutes to attain 32 bar pressure.
Warm startup

MAGNITUDE D1.1 - CARTOGRAPHY OF THE FLEXIBILITY SERVICES PROVIDED BY HEATING/COOLING, STORAGE AND GAS TECHNOLOGY AND SYSTEMS TO THE ELECTRICITY SYSTEM – R2.0
©MAGNITUDE Consortium 90 February 2019
When turbine starts from warm condition it takes 120 minutes to achieve full load 125 MW. Initially turbine does not take any load up to 15 minutes then starts to take load.
When turbine starts from warm condition it takes 15 minutes to achieve full speed 3 000 rpm. It is desirable to start turbine from warm condition rather than from cold condition.
High pressure turbine takes 120 minutes to attain 530ᵒC. It stands steady to 12 minutes at 410ᵒC and then starts to raise temperature for regular time interval.
High pressure turbine steady at 32 bar pressure for 10 minutes then allows to raise steam pressure. It attains full load steam pressure 130 bar with in 120 minutes.
Intermediate turbine allows to raise its temperature from 410ᵒC to 530ᵒC during the regular time interval between 0 to 120 minutes.
Intermediate pressure turbine allows to increase its pressure from 7.5 bar to 32 bar pressure during regular time interval 0 to 120 minutes.
Hot startup
When turbine starts from hot condition it takes 60 minutes only to achieve full load 125 MW. Initially turbine does not take any load up to 10 minutes then starts to take load.
When turbine starts from hot condition it takes 10 minutes to achieve full speed 3 000 rpm. It is desirable to start turbine from hot condition rather than cold condition or warm condition.
High pressure turbine takes only 60 minutes to attain 530ᵒC. It stands steady to 12 minutes at 500ᵒC and then starts to raise temperature gradually for regular time interval.
High pressure turbine allows to raise steam pressure gradually from 31 to 130 bar during regular time interval 0 to 60 minutes only.
Intermediate pressure turbine takes only 60 minutes to attain 530ᵒC. It stands steady to 12 minute at 500ᵒC and then starts to raise temperature gradually for regular time interval.
Intermediate pressure turbine allows raising steam pressure gradually from 6 to 32 bar during regular time interval 0 to 60 minutes.
From [3], hot start up time Steam plant: gas, oil 3 h, coal 3 h, Lignite 6 h.
Startup/Shut down time >1 MW steam turbine (Startstop-behavior) : few hours [60]
Input & output parameters Input: steam, Output: power
Parameters about performance monitoring and control Steam flow rate, temperature, Pressure
Minimum load (%full load) Steam turbine: 5-25%
Steam plant Gas, oil,coal power: 30%, Lignite 50% [61]
Operation hour (Availability during the year) Depends on the coupling boiler
Capital Cost: Steam Turbine [63] Subcritical, 325-MW gross: €114 [63]
Subcritical, 540-MW gross: €105 [63]
Supercritical, 860-MW gross: €96 [63]
Capital Cost: Steam Turbine and Generator [58] 500 kW: €586
3 MW: €351

MAGNITUDE D1.1 - CARTOGRAPHY OF THE FLEXIBILITY SERVICES PROVIDED BY HEATING/COOLING, STORAGE AND GAS TECHNOLOGY AND SYSTEMS TO THE ELECTRICITY SYSTEM – R2.0
©MAGNITUDE Consortium 91 February 2019
15 MW: €344
Installation and Balance of Plant , not including boiler and steam system) [58]
500 kW: €410
3 MW: €246
15 MW: €240
Total Installed Cost [58] 500 kW: €996
3 MW: €598
15 MW: €584
O&M (€/kWh, steam turbine and generator) [58] 500 kW: 0.0088
3 MW: 0.0079
15 MW: 0.0053
Environmental friendly (such as GWP and ODP) Depends on the fuel used to produce the steam
Technology coupling (with which technologies?) Steam boiler and Electricity generator

MAGNITUDE D1.1 - CARTOGRAPHY OF THE FLEXIBILITY SERVICES PROVIDED BY HEATING/COOLING, STORAGE AND GAS TECHNOLOGY AND SYSTEMS TO THE ELECTRICITY SYSTEM – R2.0
©MAGNITUDE Consortium 92 February 2019
• Gas turbine
Create by Johannes Emmanuel Steinbeisser, REGE
Category (P2G/P2H/H2P/H2G/G2P/G2H) G2P
Technology Name Gas turbines (32 MWe to 520 MWe)
Main Technology (core business) Electricity production
Description (including working principle)
Gas turbines produce power by an internal combustion that produces hot gases that spin a turbine. These turbines consist of a turbine, a combustion chamber, a compressor (axial or centrifugal flow) and a shaft. The thermodynamic process used is the Brayton cycle.
Technical Maturity Since 1939
KPI (key performance indicator, such as efficiency) and the correpsponding performance
KPI Value
KPI1: internal rate of return of the turbine 25-30 %
KPI2: internal rate of return of the compressor 87 %
KPI3: power plant efficiency without heat recovering: 30 – 40 %
recovering the heat waste: 55 – 60 %
Working Capacity Per Unit (give a range) 32 Mwe - 520 Mwe
Capacity ramp up/down 30 - 100 %
Ramp up/down time
start-up ramps that are steep in the very first megawatts: around 10 Mwe/min
ramps to minimum turndown level: around 4 Mwe/min
between minimum turndown and full capacity: up to 6 Mwe/min
ramps to full capacity: around 8 MWe/min
Start-up/Shut down time
start-up time: 55 minutes (hot start) - 170 minutes (cold start)
shut down time: 20 - 25 minutes
Frequency of allowed start/stops (Time needed between two activations )
cold starts: >64 hors to start
warm starts: 16 - 64 hors to start
hot starts: <16 hors to start
Input & output parameters Input: air mass flow rate, compression ratio,
Output: turbine power
Parameters about performance monitoring and control Outlet and inlet air's temperature
Minimum load 60 %

MAGNITUDE D1.1 - CARTOGRAPHY OF THE FLEXIBILITY SERVICES PROVIDED BY HEATING/COOLING, STORAGE AND GAS TECHNOLOGY AND SYSTEMS TO THE ELECTRICITY SYSTEM – R2.0
©MAGNITUDE Consortium 93 February 2019
Figure A2-1: Load profile of the turbines [64]
Operation hour (Availability during the year) 4 000 – 5 000 hours (loss of performance of 10 % at 4 000 hours)
Capital Cost 131 - 306 €/kW
Installation cost 219 - 438 €/kW
Operation cost 0.035 - 0.088 €/kWh
Figure A2-2: Overall cost of the plant [65]
Environmental friendly (such as GWP and ODP) Gas Natural Combustion
Related bottlenecks (production, sales, contracts) Combustion chambers
Constrain of application High start-up time, which make them slow for consuption variation needs
Technology coupling (with which technologies?) Heat recovery steam generator, boilers

MAGNITUDE D1.1 - CARTOGRAPHY OF THE FLEXIBILITY SERVICES PROVIDED BY HEATING/COOLING, STORAGE AND GAS TECHNOLOGY AND SYSTEMS TO THE ELECTRICITY SYSTEM – R2.0
©MAGNITUDE Consortium 94 February 2019
Potential services (to the electricity grid-rough proposal)
Frequency response

MAGNITUDE D1.1 - CARTOGRAPHY OF THE FLEXIBILITY SERVICES PROVIDED BY HEATING/COOLING, STORAGE AND GAS TECHNOLOGY AND SYSTEMS TO THE ELECTRICITY SYSTEM – R2.0
©MAGNITUDE Consortium 95 February 2019
• Gas Engine
Create by Johannes Emmanuel Steinbeisser, REGE
Category (P2G/P2H/H2P/H2G/G2P/G2H) G2P
Technology Name Gas engines (5.04 MWe)
Main Technology (core business) Electricity production (also heat and cooling water and high-grade carbon dioxide production)
Description (including working principle)
Gas engines consists of some cylinders where the gas (such as biogas or natural gas) is burnt. This combustion makes a crank shaft turns an alternator which results in the generation of electricity. Heat from the combustion process must be recovered or used in a combined heat and power configuration or dissipated via dump radiators located close to the engine.
Technical Maturity since year 1860
KPI (key performance indicator, such as efficiency) and the correpsponding performance
KPI
Value
* DATA OF MODEL J624 OF Jenbacher Gas Engines
(4.5 mWe) & Kawasaki KG-12 (5.2 Mwe)
KPI1: Efficiency 40 – 50 % (general gas engines)
KPI2: Thermal Efficiency 43 %
KPI3: Electrical Efficiency 46 – 48 %
KPI4: Total Efficiency 89 %
Working Capacity Per Unit (give a range) 250 – 4 500 Kw & >10 MW
Capacity ramp up/down 50 % per minute
Ramp up/down time 250 - 300 MW/minute
Figure A2-3: Ramp rate [66]
Start-up/Shut down time Start-up time: 5 - 10 minutes
Frequency of allowed start/stops (Time needed between two activations )
Not information found *first maintenance after 4 000 h, major overhaul after 80 000 h
Input & output parameters Intake air temperature: 45ᵒC for high efficiency
Piston speed: 10 m/s

MAGNITUDE D1.1 - CARTOGRAPHY OF THE FLEXIBILITY SERVICES PROVIDED BY HEATING/COOLING, STORAGE AND GAS TECHNOLOGY AND SYSTEMS TO THE ELECTRICITY SYSTEM – R2.0
©MAGNITUDE Consortium 96 February 2019
Parameters about performance monitoring and control
Effective preasure: 20.3 bar
* DATA FROM TCG 2032B V16 OF MWM
Minimum load 35 % or 30 - 35 % load with time limitation 95 hours
34SG: 4 380 – 9 930 KW (different set types)
50SG: 18 440 – 18 690 KW (2 types)
GE, Alston: Gas turbine
GE, CCGT: Gas turbine
Siemens F-Class: Gas turbine
Figure A2-4: Minimum load [67]
Operation hour (Availability during the year) 8 760
Cost [68]
Capital Cost 789 – 876 €/kW
Installation cost 438 - 657 €/kW
Operation cost 0.79 – 1.4 €/kW
Figure A2-5: Cost of the gas engine [68].
Environmental friendly (such as GWP and ODP) Natural gas, biogas. Gas engines don't have minimum environmental load limitations
Related bottlenecks (production, sales, contracts) It needs the installation of a gas tank
Constraint of application Maintenance is necessary because of the need of oil change (for example, [32] recommends an oil change after 750 h, [33], after 1 200 h for natural gas engines and after 700 h for biogas engines, etc.)
Technology coupling (with which technologies?) Heat recovery and steam-based combined cycles

MAGNITUDE D1.1 - CARTOGRAPHY OF THE FLEXIBILITY SERVICES PROVIDED BY HEATING/COOLING, STORAGE AND GAS TECHNOLOGY AND SYSTEMS TO THE ELECTRICITY SYSTEM – R2.0
©MAGNITUDE Consortium 97 February 2019
Potential services (to the electricity grid-rough proposal)
Electric and hot water demand of buildings

MAGNITUDE D1.1 - CARTOGRAPHY OF THE FLEXIBILITY SERVICES PROVIDED BY HEATING/COOLING, STORAGE AND GAS TECHNOLOGY AND SYSTEMS TO THE ELECTRICITY SYSTEM – R2.0
©MAGNITUDE Consortium 98 February 2019
• Chiller
Create by Worrada Nookuea, MDH
Category (P2G/P2H/H2P/H2G/G2P/G2H) P2C
Technology Name Chiller
Main Technology (core business) Cooling load production
Description (including working principle)
Larger buildings and multiple building campuses usually use a chiller plant to provide cooling. In such systems, chilled water is centrally generated and then piped throughout the building to air handling units serving individual tenant spaces, single floors, or several floors. Ductwork then runs from each air handler to the zones that are served. Chilled water-based systems result in far less ductwork than all-air systems because chilled water piping is used to convey thermal energy from the point of generation to each point of use. Whereas the all-air systems used to cool smaller buildings usually contain all of their components packaged within a single cabinet (ergo the term “packaged cooling unit”), a chiller plant is a collection of individual components that have been selected to work together as a system (Figure A2-6). Though more costly to install and more complicated to operate, a chiller plant offers a number of benefits over simple packaged cooling units, including greater energy efficiency, better controllability, and longer life. Additionally, a chiller-based system can be much more efficient in terms of space utilisation within the building because components need not be located within the same space. A typical chilled water cooling plant is comprised of one or more chiller(s), chilled water circulation pump(s), condenser water pump(s), and cooling tower(s), plus piping to interconnect these components. One or more cooling coils are used to transfer heat out of the supply air stream and into the chilled water [38].
Technical Maturity Mature
KPI (key performance indicator, such as efficiency) and the correpsponding performance
KPI Value
KPI1: Chiller efficiency [35] COP (Coefficient of Performance)
IPLV ( Integrated Part Load Value)

MAGNITUDE D1.1 - CARTOGRAPHY OF THE FLEXIBILITY SERVICES PROVIDED BY HEATING/COOLING, STORAGE AND GAS TECHNOLOGY AND SYSTEMS TO THE ELECTRICITY SYSTEM – R2.0
©MAGNITUDE Consortium 99 February 2019
Figure A2-6: Chiller Efficiency [35]
Working Capacity Per Unit (give a range)
Use in Air conditioning A typical chiller for air conditioning applications is rated between 15 and 2 000 tons, and at least one manufacturer can produce chillers capable of up to 5 200 tons of cooling [36]. Chilled water temperatures

MAGNITUDE D1.1 - CARTOGRAPHY OF THE FLEXIBILITY SERVICES PROVIDED BY HEATING/COOLING, STORAGE AND GAS TECHNOLOGY AND SYSTEMS TO THE ELECTRICITY SYSTEM – R2.0
©MAGNITUDE Consortium 100 February 2019
can range from 35 to 45ᵒF (2 to 7ᵒC), depending upon application requirements [37].
Use in Industry (Centralise:single chiller serves multiple cooling needs)
Centralised chillers generally have capacities ranging from ten tons to hundreds or thousands of tons [38].
Use in Industry (Decentralise:each application or machine has its own chiller)
Decentralised chillers are usually small in size and cooling capacity, usually from 0.2 to 10 short tons (0.179 to 8.929 long tons; 0.181 to 9.072 t) [38].
Capacity ramp up/down Similar to the heat pump system
Ramping rate (% full load/min ) Similar to the heat pump system
Startup/Shut down time Similar to the heat pump system
Frequency of allowed start/stops (Time needed between two activations )
Similar to the heat pump system
Input & output parameters input: power or heat, out put: cooling
Parameters about performance monitoring and control
Temperature, pressure, flowrate
Minimum load (%full load) Similar to the heat pump system
Capital Cost: Air cooled chiller: €613 per ton below 150 tons and €394 per ton above 150 tons [69]
Water cooled chillers: €350 per ton below 400 tons and €263 per ton beyond 400 tons. (cheaper than the Air cooled chiller [69])
***However, water chillers need an extra motor and a cooling tower which usually increases the capital investment to more than that of an air cooled chiller.
Total Installed Cost [70]
The installed cost of electric chillers is significantly lower than comparable heat-driven chillers. Heat-driven Chillers require larger cooling water pumps and towers. Engine driven chillers have a prime mover that costs much more than a comparable electric motor (and has much higher maintenance costs as well). Absorption chillers are much more costly than comparable sized electric chillers.
The costs shown are typical of large water chiller installed costs including cooling tower with pump piping and installation or air-cooled condenser. They are at nominal tons capacity and HCFC-123 or HFC-134a compatible.

MAGNITUDE D1.1 - CARTOGRAPHY OF THE FLEXIBILITY SERVICES PROVIDED BY HEATING/COOLING, STORAGE AND GAS TECHNOLOGY AND SYSTEMS TO THE ELECTRICITY SYSTEM – R2.0
©MAGNITUDE Consortium 101 February 2019
Figure A2-7: Cost of Chillers [70]
O&M ($/ton ) A manufacturing plant that uses a chiller at its site to cool down a process spends around $700 per ton of cooling annually. This is already more than the cost of a chiller per ton and it arises from the electricity consumption of the chiller. Therefore, we can see that the compressor based cooling technology is cost effective to purchase but it is not very cost effective in the long run. The operating costs might not justify the low capital cost. With increasing electricity prices, the operating costs might go beyond what many consumers can afford [69].
Technology coupling (with which technologies?) Cooling tower, Condenser water pump, Chilled water pump, Cooling coil
Potential services (to the electricity grid-rough proposal)
Similar to the heat pump system

MAGNITUDE D1.1 - CARTOGRAPHY OF THE FLEXIBILITY SERVICES PROVIDED BY HEATING/COOLING, STORAGE AND GAS TECHNOLOGY AND SYSTEMS TO THE ELECTRICITY SYSTEM – R2.0
©MAGNITUDE Consortium 102 February 2019
• Battery
Create by Edoardo Corsetti, RSE
Category (P2G/P2H/H2P/H2G/G2P/G2H) Energy storage
Technology Name Battery - Electric storage
Main Technology (core business) Electric storage
Description (including working principle)
Electric storage are equipment able to accumulate energy. There exist a number of technologies. Chemical technologies adopt chemical reaction in order to store energy.
Technical Maturity TRL9
KPI (key performance indicator, such as efficiency) and the correpsponding performance
KPI Value
KPI1: Efficiency: 0.75 - 0.95
Working Capacity Per Unit (give a range) 1, for some technolgies it can be even 10 (for instance SC - SuperCapacitor)
Capacity ramp up/down Domestic HP: ramp up: 100 % in 1min; ramp down: 100 % in 0
Continuous process
Ramp up/down time Continuous process
Start-up/Shut down time Continuous process
Frequency of allowed start/stops (Time needed between two activations )
Continuous process
Input & output parameters voltage (V), current (A) and ambient Temerature (T)
Parameters about performance monitoring and control
Charge and discharge power;
Number of cycles (one cycle: charge phase reaching the upper energy limit either discharge reaching the downward limit
Minimum load 0
Operation hour (Availability during the year) 8 760
Capital Cost 200 - 800 €/kWh
Installation cost From a few hundred euros to several thousand euros, depending on the maximum energy
Operation cost depends on the technology adopted to supply the battery: renewable sources (phtovoltaic or wind generators) have very low production costs for instance
Environmental friendly (such as GWP and ODP) missing

MAGNITUDE D1.1 - CARTOGRAPHY OF THE FLEXIBILITY SERVICES PROVIDED BY HEATING/COOLING, STORAGE AND GAS TECHNOLOGY AND SYSTEMS TO THE ELECTRICITY SYSTEM – R2.0
©MAGNITUDE Consortium 103 February 2019
Related bottlenecks (production, sales, contracts)
high capital costs
Constrain of application high capital costs at the moment
Technology coupling (with which technologies?) All electrical units
Potential services (to the electricity grid-rough proposal)
ALL

MAGNITUDE D1.1 - CARTOGRAPHY OF THE FLEXIBILITY SERVICES PROVIDED BY HEATING/COOLING, STORAGE AND GAS TECHNOLOGY AND SYSTEMS TO THE ELECTRICITY SYSTEM – R2.0
©MAGNITUDE Consortium 104 February 2019
• TSE (Hot water tank, Steam accumulator)
Create by Ada Del Corno, RSE
Category (P2G/P2H/H2P/H2G/G2P/G2H) Energy storage
Technology Name Thermal Energy Store (TES)
Main Technology (core business) Thermal storage using sensible heat
Description (including working principle)
Three main physical principles are considered to provide a thermal storage: sensible heat (the storage is based on the temperature change in the material - capacity 10 - 50 kWh/t- efficiency 50 – 90 % - cost 0.1 - 10 €/kWh), phase-change ( the heat is stored during the phase-change of the material (PCM) -capacity 50 - 150 kWh/t- efficiency 75 – 90 % - cost 10 - 50 €/kWh)) and chemical reaction (thermo-chemical reactions provide the thermal storage capacity - capacity 120 - 250 kWh/t- efficiency 75 – 100 % - cost 8 - 100 €/kWh)). The most common systems are sensible heat storages with hot water. There are systems fully mixed or stratified and with constant or variable volume. Higher efficiency is obtained with water stratification and super insulated tank [71]. The choice of storage medium depends on storage time (short-term (1 day), mid-term and long-term as seasonal storage).
Technical Maturity Hot water storage : TRL 9
KPI (key performance indicator, such as efficiency) and the correpsponding performance
KPI Value
KPI1:
Efficiency = energy available/energy charged in the storage
50 - 90 %
KPI2: Thermal conductivity
Working Capacity Per Unit (give a range) 30 MWh each (1 000 m3)
Capacity ramp up/down
Usually we set a 4 h discharge and 4 h charge. To change from charge mode to discharge mode, it is needed some time because it is necessary to change the status of some valve.
Ramp up/down time Roughly 4 h from full load to complete discharge
Frequency of allowed start/stops (Time needed between two activations ) No time requested between two cycles of discharge.
Input & output parameters
Energy Capacity - Charge/Discharge Power - Thermal Losses - Mass Flow rate -Volume tank - Input/Output Temperature
Parameters about performance monitoring and control
Thermal energy in/out; flow rate in/out; Temperature inside the tank (there are 5 RTD that measure the temperature of the water inside the tank at different height from the bottom of the tank)
Minimum load Tank full of “cold” water (return temperature).
Operation hour (Availability during the year) There are no limitation
Capital Cost 0.1 - 10 €/kWh
Operation cost Cost of the electricity consumed by the pumps

MAGNITUDE D1.1 - CARTOGRAPHY OF THE FLEXIBILITY SERVICES PROVIDED BY HEATING/COOLING, STORAGE AND GAS TECHNOLOGY AND SYSTEMS TO THE ELECTRICITY SYSTEM – R2.0
©MAGNITUDE Consortium 105 February 2019
Constraint of application The charge or discharge can’t be too fast in order to limit the creation of convection currents
Technology coupling (with which technologies?) In Canavese the tanks are filled by the engines and the heat pump.
Potential services (to the electricity grid-rough proposal)
The 2 thermal storages permit to decouple the production from the thermal demand of the district heating network. So they allow to anticipate the production while the heating demand is low and to use it at the peak load. The thermal storages are able to make flatter the heat production of the power plant. This technology is strategic and essential for Canavese Power Plant.

MAGNITUDE D1.1 - CARTOGRAPHY OF THE FLEXIBILITY SERVICES PROVIDED BY HEATING/COOLING, STORAGE AND GAS TECHNOLOGY AND SYSTEMS TO THE ELECTRICITY SYSTEM – R2.0
©MAGNITUDE Consortium 106 February 2019
• Heat Pump
Create by Alexandre Canet & Meysam Qadrdan, CU
Category (P2G/P2H/H2P/H2G/G2P/G2H) P2H
Technology Name Air Source Heat Pump (ASHP)
Main Technology (core business) Heat production from electricity
Description (including working principle)
Heat pumps employ the same technology as refrigerators, moving heat from a low-temperature level to a higher temperature level. Heat pumps draw heat from a heat source (input heat) and convert the heat to a higher temperature (output heat: the sink) through a closed process; either compression type heat pumps (using electricity) or absorption heat pumps (using heat; e.g. steam, hot water or oil) [72].
KPI (key performance indicator, such as efficiency) and the correpsponding performance
KPI Value
KPI1: Coefficient of Performance (COP) Domestic HP: 1 to 6 (see Figure A2-8)
District Heating HP:
Figure A2-8: Coefficient of Performance (CoP) of Air-Water heat pump for hot water temperature of 35ᵒC and 50ᵒC [58]
KPI2: Output temperature (ᵒC) Domestic HP: 35 to ~55ᵒC
District Heating HP: 45 to 85ᵒC
Working Capacity Per Unit (give a range) Domestic HP: 5 to 15 kW
District Heating HP: 1 to 25 MW
Capacity ramp up/down
Domestic HP: ramp up: 100 % in 1min; ramp down: 100 % in 0
District Heating HP: 10 % per 30 seconds
Start-up/Shut down time Domestic HP: Warm start-up time: 0 and cold start-up time: 0
District Heating HP: Warm start-up time (hours): 0 and cold start-up time (hours): 6

MAGNITUDE D1.1 - CARTOGRAPHY OF THE FLEXIBILITY SERVICES PROVIDED BY HEATING/COOLING, STORAGE AND GAS TECHNOLOGY AND SYSTEMS TO THE ELECTRICITY SYSTEM – R2.0
©MAGNITUDE Consortium 107 February 2019
Frequency of allowed start/stops (Time needed between two activations )
It depends on the comfort level required for the dwelling and the thermal mass of the building including the thermal mass of water.
Minimum load Domestic HP: 20 %
District Heating HP: 10 %
Operation hour (Availability during the year) District Heating HP: 8 676 (Planned outage of 0.5 weeks per year)
Capital Cost Domestic HP: ~7 000 €/unit for a new famility house, ~10 000 €/unit for existing family house
District Heating HP: 700 000 €/MW
Installation cost Domestic HP: 40 % of capital cost
District Heating HP: 350 000 €/MW
Operation cost Domestic HP: 206 €/unit/year
District Heating HP: 2 000 €/MW/year + 8.4 €/MWh
Technology coupling (with which technologies?) Gas boilers, Thermal storage, Renewable energy (e.g. solar PV)
Potential services (to the electricity grid-rough proposal)
Frequency response

MAGNITUDE D1.1 - CARTOGRAPHY OF THE FLEXIBILITY SERVICES PROVIDED BY HEATING/COOLING, STORAGE AND GAS TECHNOLOGY AND SYSTEMS TO THE ELECTRICITY SYSTEM – R2.0
©MAGNITUDE Consortium 108 February 2019
• Electrical boiler
Create by Odile Lefrere, EFFICA
Category (P2G/P2H/H2P/H2G/G2P/G2H) P2H
Technology Name Electric boilers
Main Technology (core business) Hot water /heat production
Description (including working principle)
An electric boiler is a device that uses electrical energy to boil water either thanks to a resistance or through current passing directly through the water. Boilers can provide heat for water heating, space heating and process heating (in industrial technologies).electric boilers can be distinguished according to the temperature application and to their capacity. The water in the electrode boiler is heated by means of an electrode system consisting of three-phase electrodes, a neutral electrode and control screens. Power is fed to the electrodes, which transfer it to the water, thus heating the water.
Technical Maturity mature
KPI (key performance indicator, such as efficiency) and the correpsponding performance
KPI Value
KPI1: Energy Efficiency
Electrical resistance up to 2 MW: 99 %
Electrode Boilers 2 MW up to 30 MW: 99 %
KPI2: temperature range
Electrical resistance 0 to 120ᵒC
Electrode Boilers 120ᵒC to more than 1 000ᵒC
KPI3: Discharging period
Electrical resistance up to 24 hours
Electrode Boilers hours to year
KPI4: Lifetime
Electrical resistance 15 years
Electrode Boilers 25 years
KPI3: voltage requirement
Electrical resistance 400 V
Electrode Boilers 10 kV
Working Capacity Per Unit (give a range) Electrical resistance from 3kW to 2MW
Electrode Boilers from 2 to 30 MW
Capacity ramp up/down
Electrical resistance 100 to 500 L
Electrode Boilers less than 1 min response between minimum load to full load
Ramp up/down time 100 %/min
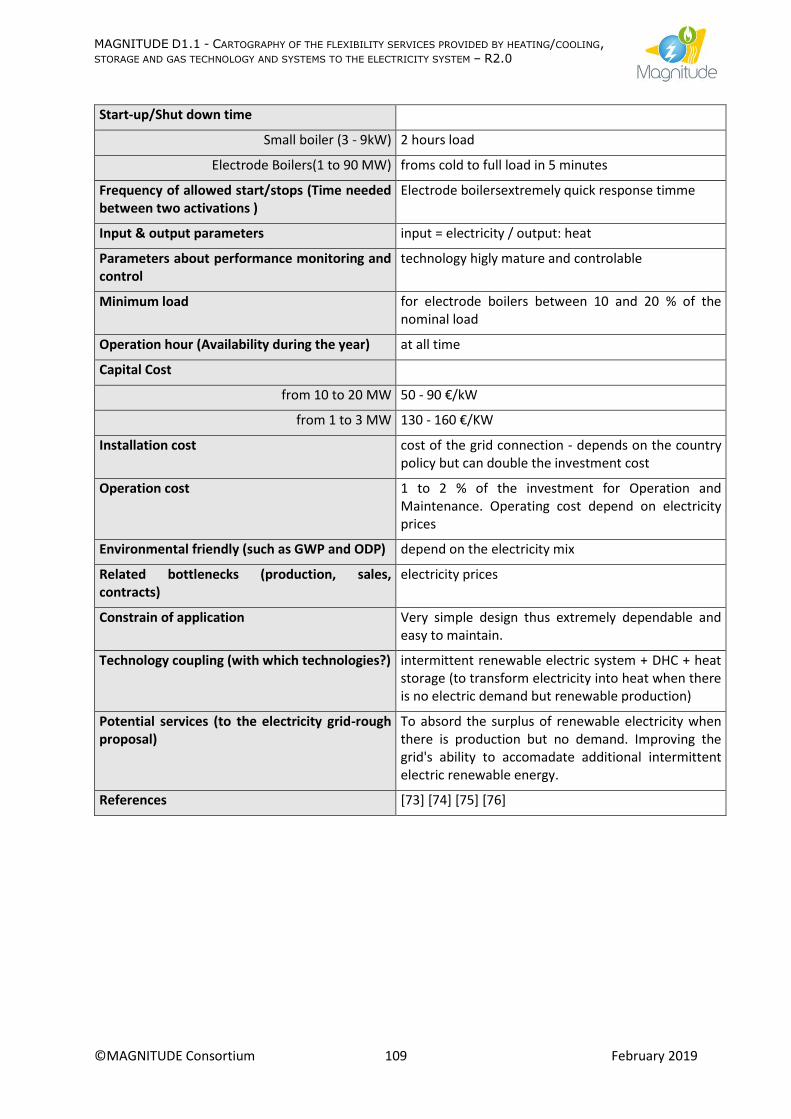
MAGNITUDE D1.1 - CARTOGRAPHY OF THE FLEXIBILITY SERVICES PROVIDED BY HEATING/COOLING, STORAGE AND GAS TECHNOLOGY AND SYSTEMS TO THE ELECTRICITY SYSTEM – R2.0
©MAGNITUDE Consortium 109 February 2019
Start-up/Shut down time
Small boiler (3 - 9kW) 2 hours load
Electrode Boilers(1 to 90 MW) froms cold to full load in 5 minutes
Frequency of allowed start/stops (Time needed between two activations )
Electrode boilersextremely quick response timme
Input & output parameters input = electricity / output: heat
Parameters about performance monitoring and control
technology higly mature and controlable
Minimum load for electrode boilers between 10 and 20 % of the nominal load
Operation hour (Availability during the year) at all time
Capital Cost
from 10 to 20 MW 50 - 90 €/kW
from 1 to 3 MW 130 - 160 €/KW
Installation cost cost of the grid connection - depends on the country policy but can double the investment cost
Operation cost 1 to 2 % of the investment for Operation and Maintenance. Operating cost depend on electricity prices
Environmental friendly (such as GWP and ODP) depend on the electricity mix
Related bottlenecks (production, sales, contracts)
electricity prices
Constrain of application Very simple design thus extremely dependable and easy to maintain.
Technology coupling (with which technologies?) intermittent renewable electric system + DHC + heat storage (to transform electricity into heat when there is no electric demand but renewable production)
Potential services (to the electricity grid-rough proposal)
To absord the surplus of renewable electricity when there is production but no demand. Improving the grid's ability to accomadate additional intermittent electric renewable energy.
References [73] [74] [75] [76]

MAGNITUDE D1.1 - CARTOGRAPHY OF THE FLEXIBILITY SERVICES PROVIDED BY HEATING/COOLING, STORAGE AND GAS TECHNOLOGY AND SYSTEMS TO THE ELECTRICITY SYSTEM – R2.0
©MAGNITUDE Consortium 110 February 2019
• Anaerobic digestion
Create by Nicole Pini, EIFER
Category (P2G/P2H/H2P/H2G/G2P/G2H)
Technology Name Anaerobic digestion
Main Technology (core business) Waste treatment & biogas production
Description (including working principle)
Anaerobic digestion (AD) is a multi-step process by which microorganisms convert in the absence of oxygen and at elevated temperatures (35 - 60ᵒC) biodegradable materials (like biowastes&sewage sludge) into biogas and digestate. Biogas contains around 50 – 75 % CH4, 25 – 50 % CO2 and minor amounts (<1 %) of N2, O2, H2S, NH3 and H2. The biogas can be used as fuel in gas engines to produce Power and Heat, in gas boilers to provide Heat and after upgrading to feed in natural gas grids. So, AD enables flexibility options beyond the electricity market, by connecting electricity and gas networks. The produced biogas can be stored or used directly for heat only or combined power and heat production. On the other side, AD is also a heat and electricity sink, in particular in combination with waste water treatment. In a typical WWTP, the heat demand can be delivered by combustion of the produced biogas in a CHP, and between 30 – 70 % of the needed electricity can be produced by itself. Therefore, flexibility can be delivered to an energy system either by electricity production, on the other side by electricity demand. Technical constraints from AD side to the above mentioned flexibility options are due to the required continous the (seasonal fluctuating) heat demand of the fermenter, as well as the electricity of the fermenter stirrer and the WWTP (mainly by blowing air into the aerobic treatment tanks).
Technical Maturity TRL 9; market rollout complete
KPI (key performance indicator, such as efficiency) and the correpsponding performance
KPI Value
KPI1: gas production depending from input material 25 - 250 Nm3 biogas per ton fresh matter input
KPI2:
Working Capacity Per Unit (give a range) 75 – 2 000 kW; combining possible
Capacity ramp up/down continous process (see gas boiler/gas engine)
Ramp up/down time continous process (see gas boiler/gas engine)
Start-up/Shut down time continous process (see gas boiler/gas engine)
Frequency of allowed start/stops (Time needed between two activations )
continous process
Parameters about performance monitoring and control
Temperature, pressure, gas production rate, residence time
Operation hour (Availability during the year) 8 760
Capital Cost 500 – 2 000 €/m3 fermenter; 3 000-9 000 €/kWel (fermenter+CHP); 8 000-10 000 €/Nm3 CH4 (fermenter+upgrading)
Environmental friendly (such as GWP and ODP) about 1% of produced methane are lost to atmosphere

MAGNITUDE D1.1 - CARTOGRAPHY OF THE FLEXIBILITY SERVICES PROVIDED BY HEATING/COOLING, STORAGE AND GAS TECHNOLOGY AND SYSTEMS TO THE ELECTRICITY SYSTEM – R2.0
©MAGNITUDE Consortium 111 February 2019
Related bottlenecks (production, sales, contracts) requires gas usage technology; gas storage capacity, feedstock amount
Constrain of application waste treatment priority
Technology coupling (with which technologies?) gas boiler; gas engine, gas storage, gas upgrading
Potential services (to the electricity grid-rough proposal)
none

MAGNITUDE D1.1 - CARTOGRAPHY OF THE FLEXIBILITY SERVICES PROVIDED BY HEATING/COOLING, STORAGE AND GAS TECHNOLOGY AND SYSTEMS TO THE ELECTRICITY SYSTEM – R2.0
©MAGNITUDE Consortium 112 February 2019
• Electricity network
Create by Yue Zhou & Meysam Qadrdan, CU
Category (P2G/P2H/H2P/H2G/G2P/G2H)
Technology Name Electricity grid
Main Technology (core business) Transporting electric power from supply to demand
Description (including working principle)
The main function of electricity grids is to transport electricity from supply to demand. Electricity grids consists of various technologies including, conductors (i.e. cables, overhead lines), transformers, circuit breaker etc. The voltage of electricity networks is able to be adjusted by voltage regulation or reactive power compensation devices, such as shunt capacitor banks, on load tap changers, static var compensators, ect. Besides, the voltage of electricity networks is allowed to stay in a range (e.g. in the UK the allowable voltage variation is -6% ~ +10%). The change of voltage at end users may result in the change of their power consumption, and this fact enables electricity networks to provide flexibility for other services (e.g. peak load shaving, frequency response, etc.). Network reconfiguration is able to change the topology of an electricity network by changing the open/closed status of the feeder switches. As a result, the power flow across the network may be changed, so that the voltage and line loss of the network can be changed. Advanced power electronics switches (e.g. soft open points) are used in some networks, in which the power exchange among feeders is able to be adjusted continuously, resulting in higher flexibility.
Technical Maturity
At the device level, some devices are mature, such as shunt capacitor banks, on load tap changers, static var compensators, etc., while some are not mature in terms of practical application such as soft open points. However, it is still not very mature to use active network management on a large scale in practice.
KPI (key performance indicator, such as efficiency) and the correpsponding performance
KPI Value
KPI1: Time resolution for control From milliseconds to months (e.g. power electronics devices can be controlled with very high time resolution while some feeder switches only change a few times per year to deal with the seasonal load change)
KPI2: MAGNITUDE resolution for control From continuous controllability to discrete controllability (e.g. the output of power electronics devices is able to be controlled continuously while on load tap changers usually only have 10 - 20 tap positions)
Working Capacity Per Unit (give a range) Depending on the level, scale and specific conditions of the electricity networks and the features of the devices to be controlled.
Capacity ramp up/down From several kWs/kVARs to tens of MWs/MVARs
Ramp up/down time From milliseconds to minutes
Start-up/Shut down time From milliseconds to minutes
Frequency of allowed start/stops (Time needed between two activations )
For power electronics devices: milliseconds; For devices with mechanical parts: it can be very quick

MAGNITUDE D1.1 - CARTOGRAPHY OF THE FLEXIBILITY SERVICES PROVIDED BY HEATING/COOLING, STORAGE AND GAS TECHNOLOGY AND SYSTEMS TO THE ELECTRICITY SYSTEM – R2.0
©MAGNITUDE Consortium 113 February 2019
but the frequent switching will decrease the lifespan of the devices.
Input & output parameters Input: control setpoints (e.g. tap position for tap changers, and active/reactive power references for power electronics devices) Output: Tap positions, active/reactive power, etc.
Parameters about performance monitoring and control
Voltages, currents, active and reactive powers across the network
Minimum load Depending on the specific condition of the electricity networks
Operation hour (Availability during the year) Throughout all the year
Capital Cost Depending on the level, scale and specific conditions of the electricity networks and the devices used.
Installation cost Depending on the level, scale and specific conditions of the electricity networks and the devices used.
Operation cost Depending on the level, scale and specific conditions of the electricity networks and the devices used.
Related bottlenecks (production, sales, contracts) 1. Technical maturity; 2. Automation level of electricity networks; 3. Market mechanisms for networks to provide such flexibility.
Constrain of application 1. Technical maturity; 2. Automation level of electricity networks; 3. Market mechanisms for networks to provide such flexibility.
Technology coupling (with which technologies?) Coupled with P2G/P2H/H2P/G2P
Potential services (to the electricity grid-rough proposal)
1. Voltage support; 2. Congestion management; 3. Line loss reduction; 4. Peak load shaving; 5. Frequency response

MAGNITUDE D1.1 - CARTOGRAPHY OF THE FLEXIBILITY SERVICES PROVIDED BY HEATING/COOLING, STORAGE AND GAS TECHNOLOGY AND SYSTEMS TO THE ELECTRICITY SYSTEM – R2.0
©MAGNITUDE Consortium 114 February 2019
• District heating/cooling network
Create by Nicole Pini, EIFER
Category (P2G/P2H/H2P/H2G/G2P/G2H) Heat distribution (H2H)
Technology Name District heating pipes
Main Technology (core business) Heat distribution
Description (including working principle)
HYPOTHESES: The scope of MAGNITUDE is to identify flexibility options to the electricity system which derive from the connection between electrity/heat/gas networks. The heat networks are a "boundary condition" to evaluate how and if new services can be provided --> the operating temperatures and the heat demand load curves that the DH network needs to provide remain the same as in the current case (the basic service - temperatures, thermal energy- that the heating network must provide remains unchanged --> no change in contracts with final users, no change in the architecture and control strategy of the substations). What can change is the heat production load curve, which does not affect the final heat users and which uses the network's thermal capacity as buffer. --> the architecture of the substations is out of the scope of the analysis. The control systems is described, since the availability of real-time monitored heat demand data (temperatures, energy) will have impact on the provision of flexibility services. TECHNOLOGY DESCRIPTION: District heating networks convey heat from one or several heat production systems to several delivery points, called substations. Heat (for space heating and, often, for domestic hot water) is carried by hot water (T supply < 110ᵒC), superheated water (T > 110ᵒC) or steam. Figure A2-9 shows the current technology development of DH systems (the lower the operating temperatures, the lower the heat losses and the bigger the portfolio of connectable heat sources). Depending on the operating temperatures and length of the pipe branches, several types of pipes are available. The materials used for the pipes determine the thermal properties of the network (and so the heat losses) - Figure A2-10. Heat is then delivered in substations through heat exchangers (in most cases) or direct connection (valve + mixing tank). The adjustment of the water speed and the supply temperature throughout the year allows the modulation of the delivered heat. The higher the water speed, the higher the water pressure drop, so the higher the water pumping costs. On the other hand, the higher the water speed, the lower the required pipe diameters and the lower the piping investment costs.

MAGNITUDE D1.1 - CARTOGRAPHY OF THE FLEXIBILITY SERVICES PROVIDED BY HEATING/COOLING, STORAGE AND GAS TECHNOLOGY AND SYSTEMS TO THE ELECTRICITY SYSTEM – R2.0
©MAGNITUDE Consortium 115 February 2019
Figure A2-9: The current technology development of DH systems [77]

MAGNITUDE D1.1 - CARTOGRAPHY OF THE FLEXIBILITY SERVICES PROVIDED BY HEATING/COOLING, STORAGE AND GAS TECHNOLOGY AND SYSTEMS TO THE ELECTRICITY SYSTEM – R2.0
©MAGNITUDE Consortium 116 February 2019
Figure A2-10: Pipe material property [78]
Technical Maturity State of the Art
KPI (key performance indicator, such as efficiency) and the corresponding performance
KPI Value
KPI1: Heat distribution efficiency 80 - 97%, depending on the pipe materials and the supply and return temperatures. To be calculated as 1-(Heat Losses/Heat produced). Heat losses are calculated as Uvalue*(Tav - Tground), where Uvalue is the thermal conductivity coefficient of the pipes, Tav the average temperature between supply and return and Tground the temperature of the ground surrounding the pipe (for pipes with one pipe per casing).
Working Capacity Per Unit (give a range). Available diameters
DN 20, 25, 32, 40, 50, 65, 80, 100, 125, 150, 200, 250, 300, 350, 400, 450, 500, 600, 700, 800, 900, 1 000 (mm)
Capacity ramp up/down Not relevant (DHN are put in operation only once. When pipes are substituted, the corresponding branch is emptied at the closes valve. The re-heating is a function of the pipe's materials and of the operating temperatures. Given the "exceptional" nature of the start-up, no ramp-up/down standard values can be proposed to model normal operation.)
Input & output parameters Supply and return temperatures, flow rates, pressures
Parameters about performance monitoring and control
Heat losses, pressure drop
Minimum load The minimum load is given by the highest acceptable pressure drop.
Operation hour (Availability during the year) 8 760 h
Contractualised availability Depends on the country/contract/company. Heat supply availability not always contractualised. Example Helen Oy (Helsinki): interruption rate of 2-3 hours year as average per substation.
Capital Cost Cost for pipes: Figure A2-11 [79]
Specific investment cost for rigid plastic jacket pipes for underground installation with insulation class Series 2 divided into piping and construction cost [10]. For the trench, costs for open field or street application are distinguished resulting in respective total cost. The piping costs include all costs of material and installation such as pipes, bends, tees, sockets, strain zones, pipe supports, weld material, monitoring system and pressure test. The trench

MAGNITUDE D1.1 - CARTOGRAPHY OF THE FLEXIBILITY SERVICES PROVIDED BY HEATING/COOLING, STORAGE AND GAS TECHNOLOGY AND SYSTEMS TO THE ELECTRICITY SYSTEM – R2.0
©MAGNITUDE Consortium 117 February 2019
costs include the trench work (excavation, sand bedding, backfilling, and restoring the earth's surface). Not included are the X-ray of welds, the relocation of utility lines and any traffic regulations.
Figure A2-11: Specific investment cost for rigid plastic jacket pipes for underground installation divided
into piping and construction cost for the trench [79]
Installation cost Digging and pipe laying costs: Figure A2-12

MAGNITUDE D1.1 - CARTOGRAPHY OF THE FLEXIBILITY SERVICES PROVIDED BY HEATING/COOLING, STORAGE AND GAS TECHNOLOGY AND SYSTEMS TO THE ELECTRICITY SYSTEM – R2.0
©MAGNITUDE Consortium 118 February 2019
Figure A2-12: Digging and laying cost [80]
Operation cost Maintainance costs = leakage detection inspections (periodical), replacement of damaged sections (funds are allocated each year) Operation costs = electricity for water pumping. Cost depends on length of network, water speed, pipe material conditions
Environmental friendly (such as GWP and ODP) No environmental impact (pipes passive component).
Related bottlenecks (production, sales, contracts) Needed temperatures at the substations (which are usually contractualised). If operating temperatures can contractually be changed, the size of the available pipes and exchangers needs to be checked (the lower the temperatures, the higher the circulating flow rate).
Constraint of application Minimum heat density for economically viable DH (changes depending on the country). Heat Roadmap Europe (http://www.heatroadmap.eu/): 0 - 30 (DH almost impossible), 30 - 100 (potential for 4th generation DH), 100 - 300 (DH currently possible), and above 300 TJ/km2 (DH highly feasible)
Technology coupling (with which technologies?) All heat production and storage technologies (heat production and storage can be localised only in central heating plants, or also in substations)

MAGNITUDE D1.1 - CARTOGRAPHY OF THE FLEXIBILITY SERVICES PROVIDED BY HEATING/COOLING, STORAGE AND GAS TECHNOLOGY AND SYSTEMS TO THE ELECTRICITY SYSTEM – R2.0
©MAGNITUDE Consortium 119 February 2019
Potential services (to the electricity grid-rough proposal)
FLEXIBILITY OPTIONS: _ Using the thermal inertia of the water/heated pipes as heat storage to shift (anticipate/postpone) the heat production of the different plants connected to the network _ Heat "sink" (depending on the required temperature and the heat demand curve) for heat produced by power-to-heat technologies (heat pumps, electric boilers, electric boosters). According to the annual heat demand curve and the supply/return temperature levels (which depend on the type of buildings - residential, tertiary, industries...- connected to the network and on the network control strategy), the heat storage potential represented by the newtork changes.