Optimization of District Heating Systems: European Energy ...
Upload
khangminh22Category
view
3download
0
Jurnal STEI Ekonomi, Vol XX, No XX, JUNI 2020 1
ANALYSIS OF QUEUE SYSTEMS IN
OPTIMIZATION OF SERVICES AT BANK BJB
RAWAMANGUN BRANCH OFFICE
Febriyani Daud Utami Sekolah Tinggi Ilmu Ekonomi Indonesia, Jakarta
Abstract This study to determine the queuing system that is currently applied by “bank bjb”
Branch Rawamangun in providing service to customers by using queuing theory and
then evaluating the queue system to optimize company service.
The result showed that queue model used in “bank bjb” Branch Rawamangun was a
Multiple Channel-Single Phase (M/M/S) by implementing service discipline, namely
First Come-First Serve (FCFS). Data analysis method uses “POM-QM Software V5
Module Waiting Lines”. Based on research for 10 working days starting at 08.30-
15.30 WIB. “bank bjb” Branch Rawamangun has 2 tellers with an average customer
arrival rate per hour (λ) is 10 customers, average service level per hour (µ) is 30
customers, average level of service utility (ρ) is not optimal that is equal to 17,33% of
the working time and the value is still far from the number 1 or 100%. The average
probability of no customers in the system (P₀) is 70,58%. The average time spent by a
customer in the system (Ws) is 2,06456 minutes and the average time spent by a
customer to wait in the queue (Wq) is 0,06556 minutes. This shows that the teller
service at “bank bjb” Branch Rawamangun is less than optimal because the level of
facility utilization is still low.
To optimize the number of tellers, the writer evaluates the queue system by reducing
the number of tellers to 1 teller. Based on the results of the calculation it appears that
after the teller reduction becomes 1 teller. “bank bjb” Branch Rawamangun has
average level of service utility (ρ) of 34,67%. This shows the level of utility facility (ρ)
is higher than using 2 tellers, and shows if the idle teller time is lower and the average
probability of no customers in the system (P₀) is 65,33%.
Keywords : Queue System, Service, Teller
I. INTRODUCTION
In order to meet the needs of the community in carrying out its activities, banks
must also provide fast, precise and optimal services including the queue system, according
to the wishes and needs of customers in order to provide the best service, given the
importance of maintaining the quality of customer service. This is where the bank is
required to see customer dissatisfaction, to avoid this, the bank must really pay attention to
the customer time wasted while waiting in queues.
In service, the thing that cannot be avoided is queues. Queue is a system that
includes customers who come to get service. Customers who are waiting to be served, then
customers will form a queue and be in the queue until the customer gets a turn to be served.
In this situation, a person is required to wait, even though waiting is an activity that requires
time and is less fun, especially if the queue is very long and it takes too long to get service,
if this is allowed then in the future the level of customer that the company has achieved

Jurnal STEI Ekonomi, Vol XX, No XX, JUNI 2020 2
now can be reduced, due to decreased performance in terms of services that are no longer
trusted to customers.
II. LITERATURE REVIEW 2.1 Research Review
The first research was conducted by Harahap (2014). This study aims to determine
the performance of the queuing system at PT. Bank Negara Indonesia (Persero) Tbk USU
Branch Offices at the teller section. After going through the process of data collection,
calculation and data processing using a multiple line queuing model with customer arrival
rates with a Possion distribution and service time with an exponential distribution using the
Chi Square test. This study determines the queuing model based on Kendall notation. The
author calculates utilization by measuring Steady State. The results showed that the average
number of customers in the system per hour per hour was 10.809 people, while the average
number of customers in the queue was 5.1602 people. The average waiting time for
customers in the system is 0.2244 hours or 13.4613 minutes, and the customer queue time
is 0.1526 hours or 9.1579 minutes. The system performance is effective because of the
utilization factor so that it meets the Steady state conditions. The utilization value obtained
was 82.48% from working hours, and the teller idle time was less per day. The strength of
this research is the performance of the queuing system at PT. Bank Negara Indonesia
(persero) Tbk. The Main Branch Office of USU has been effective because each server is
busy on average 82.48% of working hours, not much server time is idle. The weakness in
this study is the long waiting time for customers in the queue to get service.
The second research was conducted by Aulele (2014). The purpose of this study is
to determine the optimal number of tellers at Bank Mandiri Ambon Branch. The analysis
was carried out on the number of customer arrivals as many as 351 people using 3 tellers.
Based on existing data, the arrival rate is 1.019 minutes / customer, so the arrival rate will
be obtained (λ is 0.981 customers / minute. Based on the results of research with 3 tellers,
the level of utilization of the queuing system (ρ) is 113.94%, where this is shows that the
queuing system using 3 tellers works beyond the service capacity The author tries to add
more tellers to 4 tellers, with the utilization rate of the queuing system (ρ) is 85.45%. This
shows the system is working with maximum capacity, and average time which is spent by
a customer in the system (Ws) is 4.009 minutes The results showed that the time of arrival
of the customer and service time at Bank Mandiri Ambon branch has an exponential
distribution. The optimal number of tellers to serve customers is 4. The strength in this
study is the level of results. utilization of the queuing system in accordance with the
stipulated company that the employees share n tellers work not less than 85% or use of
facilities at 85%. The weakness in this study is that the author should add up to 5 tellers,
because with 4 tellers the average time spent by customers is still quite long, namely 4.009
minutes, while the Standard Operating Procedure (SOP) set by Bank Mandiri Ambon
Branch is 2 minutes.
The third research was conducted by Botutihe and Sumarauw (2018). The purpose
of this study is to determine the queuing system at Bank Negara Indonesia (BNI) 46 Branch
Unit Campus Manado. The analysis method uses the software "POM-QM for Windows"
with the Waiting Lines module. From the calculation of the average customer, the number
of customers who waited in the longest system in the period 10.00-15.00 was 27 people.
Meanwhile, the average number of customers who waited in the shortest system occurred
in the time period 08.00-10.00, namely 3 people. The average number of customers in the
queue occurred in the period 10.00-15.00, namely 24 people. The results of this study
indicate that the queuing system performance of Bank BNI 46 Branch Unit of the Manado
Campus is not optimal, and to improve the performance of the queuing system, the Bank
can consider the level of customer arrival and the level of queues that occur every day. So
Jurnal STEI Ekonomi, Vol XX, No XX, JUNI 2020 3
that the operational performance of BNI 46 Branch Unit Kmpus Manado can run optimally
so as not to make customers queue too long.
The fourth research was conducted by Arwindy and Rosmaini (2014). The purpose
of this study is to analyze the queuing system at Bank ABC. Analysis of the queuing system
shows that the current queuing model at Bank ABC is (M / M / 1): (FIFO / ~ / ~) for each
type of service. The queuing model at the teller is changed to a model (M / M / c): (GD / ~
/ ~) with a value of c = 2.For this model, the E (Tt) value of the teller is 3.51 minutes, so
the optimal is by adding more officers. teller becomes 2 people. To determine the optimal,
a simulation method is used. After analyzing the simulation data, it was found that only
with the addition of 1 teller, the bank's expectations were fulfilled. The simulation method
uses a data distribution test with Easyfit. Based on the results of this study, with the addition
of teller officers, the average time for customers in the system (E (Tt)) changed from 11.11
minutes per person to 3.51 minutes per person for observational data. As for the simulation
data, the E (Tt) changes from 9.09 minutes per person to 3.32 minutes per person. The
strength of this research is that the authors conduct research on Monday to Friday with
three conditions, namely quiet conditions (08.00 - 10.20), busy conditions (10.20 - 12.40
hours), and normal conditions (12.40 - 15.00 hours), which uses queuing theory. then the
research results will be optimal. The weakness in this research is the long waiting time for
customers in the queue to get service.
The fifth research was conducted by Sucihati and Gusferdiansyah (2014). This
study aims to analyze the effectiveness of queuing theory and model, as well as
optimization of services using this theory. The method of analysis uses software POM-QM
for Windows Version 3.0 with the Waiting Lines module, and in this study using a multi-
channel-single phase queuing system model, which has a single queue through several
service facilities. The results of this study indicate that the performance of the queuing
system with 3 tellers is optimal in providing services, because the average teller service
time (Ws) per customer is 2 minutes 14 seconds with the waiting time (Wq) of customers
in the queue is 14 seconds. The strength of this research is the performance of the existing
queuing system has been running very optimally, because the results of the service time
obtained are very good even less than the Standard Operating Procedure (SOP) set by BRI
Bank Sumbawa Branch Office, which is 3 minutes. The weakness of this research is that
BRI Bank Sumbawa Branch Office has a low level of customer arrival at the time the
researcher was doing the research, because the research date was not a busy date.
The sixth study was conducted by Chinwuko (2014). This study aims to analyze
the queuing system to determine the optimal number of tellers at First Bank PLC, Nigeria.
The queue system analysis shows that their number of servers is insufficient for customer
service. This suggests the need to increase the number of servers to better serve customers.
The analysis shows that the number of servers needed to serve customers is 5 servers (or
channels), not 3 servers (or channels) at this time. This shows that the number of servers is
inadequate for customers and there must be an increase in the number of servers in order
to serve customers well. This server upgrade reduces waiting times, and the probability that
the arrival must wait for service is 0.056. However, system utilization was observed to be
0.235 for one hour. Furthermore, the system capacity of 5 servers was observed to be 92.7
for one hour. The strength of this research is the research conducted at PLC Bank Nigeria
starting from operational hours, starting at 8 A.M - 3 P.M, so that it can get optimal results.
The weakness in this research is that the number of servers currently in use is insufficient
for customers.
The seventh research was conducted by Bakari and Chamalwa (2014). The purpose
of this study is to examine the performance characteristics of the Bank Fidelity Plc which
is located in WestEnd, Maiduguri. Data is collected by observation, where the number of
customers arriving at the facility is recorded, as well as their respective arrivals and service
times. The data collection period is 10 business days during peak hours from 8:00 am to
4:00 pm. Based on the arrival patterns and system services, and assumptions made during
Jurnal STEI Ekonomi, Vol XX, No XX, JUNI 2020 4
data collection, the M / M / 1 queuing system is used to analyze the data collected using
Microsoft computer MS60 software. The result of the analysis shows that the traffic
intensity (ρ) becomes 0.96. Thus, the traffic intensity value, which is the probability that
the system is busy, that 95% of the time period considered during data collection, the
system is busy compared to 4% of the idle time. This indicates that the system utilization
is high. The results of the analysis through MS60 software on the effectiveness measure
for M / M / 1: (∞ / FCFS) put the traffic intensity at 45%, the average number of customers
in the system is around 5 while the average number of customers in the queue is 4.
Likewise, a customer spends an average of 0.063 hours on the system while the queue waits
for a customer for an average of 0.014 hours. The strength of this research is the research
conducted at Bank Fidelity Plc Maiduguri starting from operational hours, namely 8:00 am
to 4:00 pm, so that optimal results can be obtained. The weakness in this research is the
long waiting time for customers in the queue to get service.
The eighth research was conducted by Agyei (2015). This study aims to find the
trade-off between minimizing total economic costs (waiting fees and service fees) and
providing satisfactory and possibly the shortest service time for customers, to assist bank
management in deciding the optimal number of tellers needed. The data for this study were
collected in Ghana Commercial bank Ltd, Kumasi Main Branch for one month through
observation, interviews and questionnaires and informed as a multi-server single line
queuing model. Data were analyzed using TORA Optimization software and using
descriptive analysis methods. Multi-channel queuing system in Ghana commercial bank
Ltd. Main Branch Kumasi with average arrival rate (λ) = 75 customers / hour, service level
(µ) = 26 customers / hour, and number of tellers (k) = 3 have been completed using TORA
optimization software to evaluate the steps of the queue performance measure. The analysis
results show that using a 5 teller system is better than a 4 or 6 teller system in terms of
average waiting time and total economic costs. Therefore, the researcher recommends that
management should adopt the teller 5 model to reduce total economic costs and increase
customer satisfaction. The strength of this research is that the research was conducted for
one month through observation, interviews and questionnaires, so that optimal results could
be obtained. The weakness in this study is to increase the number of tellers to make it more
effective and reduce customer waiting time than with the service of 3 tellers.
2.2 Definition of Operations Management
According to Heizer and Render (2016: 3) operations management is an activity
related to the creation of goods and services through the transformation process from input
(input) to output (result).
Based on the above definition, it can be concluded that operations management is a
series of processes in creating goods or services through the process of input to output
which ultimately produces the product or service that humans need.
2.3 Definition of Service
According to Kotler in Lupioyadi (2014: 7) service is any action or activity that can
be offered by one party to another, basically intangible and does not result in any transfer
of ownership. The production of services may or may not be related to physical products.
Based on the above definition, it can be concluded that services are all economic
activities that are intangible, but have benefits that can be felt and the performance shown
to other parties does not result in any ownership.
2.4 Definition of Bank
According to Law Number 10 of 1998 a bank is a business entity that collects funds
from the public in the form of savings and distributes them to the public in the form of
credit and / or other forms in order to improve the standard of living of the people at large.

Jurnal STEI Ekonomi, Vol XX, No XX, JUNI 2020 5
Based on the above definition, it can be concluded that a bank is collecting funds,
distributing funds, and providing other bank services. Fundraising activities, in the form of
collecting funds from the public in the form of current accounts, savings and time deposits.
Activities to channel funds, in the form of providing loans to the community. Meanwhile,
other banking services are provided to support the smooth running of these main activities.
2.5 Definition of Queuing Theory
According to Heizer and Render (2016: 852) states that queuing theory is a collection
of knowledge about waiting lines (goods or people in lines waiting for services).
Meanwhile, according to Jacobs and Chase (2015: 269) a queue is a line for people who
are waiting, work, something, or the like that is waiting to be done.
Based on the above definition, it can be concluded that queuing is a process
associated with a person's arrival at a service facility, then waiting in a queue and finally
leaving the facility. Thus, a queuing system is a collection of customers, services and a rule
that governs the arrival of customers and processing of the problem.
III.RESEARCH METHODS
This study used a survey approach because to obtain information and data the
researcher had to communicate or ask the respondent's opinion on the statements listed in
the questionnaire. Apart from that, a survey was also conducted to complete the information
related to the variables studied. The answers to the data obtained from this survey are then
processed with a quantitative approach, for this analysis the researcher uses a quantitative
approach, quantitative can be interpreted as a research method based on the positivism
philosophy, used to research on certain populations or samples, data collection using
research instruments, data analysis is quantitative or statistical, with the aim of describing
and testing the hypotheses that have been determined (Sugiyono, 2018: 15). It is hoped that
the results of the quantitative study can answer research questions in an associative form
between variables in the study. Associative research is research that aims to determine the
relationship between two or more variables, looking for roles, influences, and causal
relationships, namely between independent / exogenous variables and dependent /
endogenous variables (Sugiyono, 2018: 51).
3.1 Research Strategy
The research strategy used is a descriptive research strategy. The research was
conducted with a field case study, where the research was carried out by direct survey to
PT. Regional Development Bank of West Java and Banten, Tbk. (hereinafter referred to as
"bank bjb" or the Company) Rawamangun Branch Office to obtain information regarding
the object to be investigated.
According to Sugiyono (2017: 35) descriptive research is research conducted to
determine the existence of independent variables, either only in one or more variables
(independent variables or independent variables) without making comparisons of the
variables themselves and looking for relationships with other variables.
3.2 Research Population
According to Sugiyono (2017: 80) population is a generalization area consisting of:
objects / subjects that have certain qualities and characteristics that are determined by the
researcher to be studied and then draw conclusions. Thus the population in this study were
all customers at the "bank bjb" Rawamangun Branch Office. Thus all these customers will
be the basis for calculations in the queuing system.

Jurnal STEI Ekonomi, Vol XX, No XX, JUNI 2020 6
3.3 Data and Data Collection Methods
3.3.1 Primary Data
According to Sugiyono (2017: 225) primary data is a source of data that directly
provides data to data collection, and secondary data is a source that does not directly
provide data to collectors. In collecting data in the field, the researcher analyzes directly
the object being studied with the intention of obtaining primary data, such as the average
number of customer arrivals per hour, the number of customers served by tellers per hour
on each line, where data collection is by means of observation or observation.
Observation data obtained by the author is the level of customer arrival, customer
service level and how many tellers are opened by the “bank bjb” Rawamangun Branch
Office.
3.3.2 Secondary Data
According to Sugiyono (2017: 225) secondary data is a source of data that does not
directly provide data to data collectors. This secondary data is data that supports primary
data needs such as books, literature and reading related to and to support this research.
The data taken is the vision and mission of "bank bjb", "bank bjb" profile and other
data related to research.
3.4 Variable Operationalization
In this research, the optimal variable in the system is the queuing system. The
queuing system occurs when the customer comes to the service place, the customer waits
in a queue to be served, then the customer leaves the service system if it has been served.
The length of the queue or the length of waiting time to get service is sometimes a measure
for a company's services. Queues arise because of an imbalance between those served and
their services. To solve this problem is to use the queuing theory.
"Bank bjb" Rawamangun branch office has 2 (two) tellers, this shows that the
existing service system in the company is a single phase Multi channel, meaning that there
are two or more service facilities flowed by a single queue. Meanwhile, the discipline or
service rules used by "bank bjb" Rawamangun Branch Office is the First Come Fisrt Serve
(FCFS), where customers who come first will be served first.
3.5 Data Analysis Methods
In this study, the data that the researcher has obtained will be processed using the
POM-QM for Windows V5 software according to Asmara (2010), the POM-QM for
Windows software is a software designed to perform the calculations required by
management in making decisions. The data used in this application includes customer
arrival data and customer service data.
Analysis of customer arrival data to the teller in 60 minute intervals for 7 hours in
one day. The 60 minute interval is used to see the number of customer arrivals per hour (λ).
Standard service time is 2 minutes / customer, then within 1 hour that can be served by
every teller is 30 customers / hour (µ).
"Bank bjb" Rawamangun branch office has 2 tellers who operate to serve customers
who come. The queue model structure at "bank bjb" Rawamangun Branch Office is
Multiple Channel Single Phase (M / M / S), is a multiple line queue with one stage, to
optimize service can use the queuing formula Model B (M / M / S).
3.5.1 How to Process the Data Collection
In this study the authors used the POM-QM for Windows V5 software. This is
done to make it easier to process data more quickly and accurately.

Jurnal STEI Ekonomi, Vol XX, No XX, JUNI 2020 7
3.5.2 Way of Presenting Data
The data obtained in this study will be presented in the form of tables and figures
to be more systematic in understanding and analyzing the data presented.
3.5.3 Statistical Data Analysis Tools
3.5.3.1 The Queue for Model A with a Single Server System is also named M/M/1
In this model with Poisson distributed arrivals and exponential service
time. In this situation, arrivals form a single line to be served by a single station.
It is assumed that the system is in the following conditions:Kedatangan dilayani
atas dasar first-in, first-out (FIFO).
a. Comings are not tied to previous arrivals.
b. Arrivals are described as a Poisson probability distribution and come from an
infinite (or very large) population.
c. Service times vary from customer to customer and are independent of each
other, but the average level of service time is known.
d. Exponential service time distribution.
e. The service level is faster than the arrival rate.
The queue formula for model A is as follows:
M = Number of open paths
λ = Average number of arrivals per time period
µ = Average number of people served per time period
Table 2.2. Queue Formulas Model A (M/M/1)
No. Formula Information Unit
1 Ls =𝜆
µ − 𝜆
Average number of units (customers)
in the system (waiting and to be
served)
Customer
2 Ws =1
µ − 𝜆
Unit average time spent in the system
(waiting time plus service time) Minute
3 Lq =𝜆²
µ − 𝜆
Average number of units waiting in
queue Customer
4 Wq =𝜆
µ(µ − 𝜆)=
Lq
𝜆
Average unit time spent waiting in
queue Minute
5 ρ = 𝜆
µ Utility factor for the system Minute
6 P₀ = 1 −𝜆
µ
Probability of 0 units in the system
(service units idle) Minute
7 Pn˃k = (𝜆
µ)𝑘₊1
Probability of more than k units in the
system, where n is the number of units
in the system
Minute

Jurnal STEI Ekonomi, Vol XX, No XX, JUNI 2020 8
Source: Heizer dan Render (2016:860)
3.5.3.2 The Queue for Model B with System Multiple Servers, also called M/M/S
In the model B queuing system, there are two or more service lines or stations
available to serve incoming customers. The assumption is that customers waiting for
service form a line to be served at the first available service station at that time. The
multiple path system assumes that the arrival pattern follows a Poisson distribution and
the service time follows an exponential distribution. Services are provided first-in,
first-out (FIFO) and all service stations are assumed to have the same level of service.
Other assumptions contained in model A also apply to this model.
The queue formula for model B is as follows:
M = the number of open paths
λ = the number of arrivals per unit average time
µ = number of people served per unit time on each line
Table 2.3. Queue Formulas Model B (M/M/S)
No. Formula Information Unit
1 P0 =
1
{∑1𝑛! (
𝜆µ) ⁿ𝑀−1
𝑛=0 } + 1
𝑀! (𝜆µ) ᴹ
𝑀µ𝑀µ − 𝜆
for M µ > λ
The probability that
there are 0 people or
units in the system
Minute
2 Ls = 𝜆µ (
𝜆µ)𝑀
(𝑀 − 1)! (𝑀µ − 𝜆)² P0 +
𝜆
µ
Average number of
people or units in the
system
Custom
er
3 Ws = Ls
𝜆
Average unit time
spent in the system Minute
4 Lq = Ls −𝜆
µ
Average number of
people or units in the
queue
Custom
er
5 Wq = Ws −1
µ=
𝐿𝑞
𝜆
Average time spent
by a person in queue Minute
Source: Heizer dan Render (2016:863)
3.5.3.3 The Queue for Model C with Constant Service, also called M/D/1
Some service systems have a fixed service time, and do not have an exponential
distribution as usual. When customers are processed according to a certain cycle, such
as in the case of automatic car theft or amusement rides, the service time is generally
constant. Therefore, this time constant level is constant, so the values of Lq, Wq, Lₛ,
and Wₛ are always smaller than the values in model A, which has variable service
levels.
Table 2.4. Queue Formulas Model C (M/D/1)
No. Formula Information Unit
1 Lq = 𝜆2
2 µ (µ − 𝜆) Average number of customers in queue Customer
2 Wq =𝜆
2 µ (µ − 𝜆)
Average time a customer spends queuing
or being served Minute

Jurnal STEI Ekonomi, Vol XX, No XX, JUNI 2020 9
3 Ls = Lq + 𝜆
µ
Average number of customers waiting in
the system Customer
4 Ws = Wq + 1
µ
Average time spent by a customer waiting
in the system Minute
Source: Heizer dan Render (2016:867)
3.5.3.4 The Queue for Model D is the Limited Population Formula
This model is different from the three previous queuing models, because currently
there is an interdependent relationship between queue length and arrival rate. For
example this model will be used for equipment repair work in a factory with 5 engines,
to maintain a fleet of 10 planes or to run a 20 bed hospital. The limited population
model allows considering any number of people serving services.
The Population Queue formula for Model D is as follows:
D = The probability that a customer will have to wait in a queue
F = Efficiency factor
H = Average number of customers being served
J = Average number of customers in the queue
L = Average number of units waiting to be served
M = Number of service lines
N = Number of potential customers
T = Service time is average
U = Average time between customers who need service
W = Average time a customer waits in a queue
X = Service factor
Table 2.5. Queue Formulas Model D (Limited Population)
No. Formula Information Unit
1 X = 𝑇
𝑇 + 𝑈 Service factor -
2 L = N (1 − F) Average number of queues Unit
3 W = 𝐿 (𝑇 − 𝑈)
𝑁 − 𝐿=
𝑇(1 − 𝐹)
𝑋𝐹 Wait time is average Minute
4 J = NF (1 − X) Average number of services Unit
5 H = FNX Amount in service is average Unit
6 N = J + L + H Total population Customer
Source: Heizen dan Render (2016:869)

Jurnal STEI Ekonomi, Vol XX, No XX, JUNI 2020 10
IV. RESEARCH RESULT AND DISCUSSION
4.1 Description of Research Result
The observation result of the queue structure model applied by “bank bjb”
Rawamangun Branch Office is Multi Channel Single Phase
Picture 4.1. Queue Model “bank bjb” Rawamangun Branch Office
Source: “bank bjb” Kantor Cabang Rawamangun (2019)
4.2 Description of Observation Result Data
The following is the data on the arrival of customers at “bank bjb”
Rawamangun Branch Office based on observations (observations) for 10
working days: Table 4.1. Daily Customer Arrival Date
No Date Working days Number of Customer Arrivals Working
hours
1 09/12/2019 Monday 56 7 hours
2 10/12/2019 Tuesday 78 7 hours
3 11/12/2019 Wednesday 68 7 hours
4 12/12/2019 Thursday 58 7 hours
5 13/12/2019 Friday 80 7 hours
6 16/12/2019 Monday 84 7 hours
7 17/12/2019 Tuesday 68 7 hours
8 18/12/2019 Wednesday 70 7 hours
9 19/12/2019 Thursday 66 7 hours
10 20/12/2019 Friday 102 7 hours
Customer
Comes
Take Queue
Number
Customers
Queue
Teller 1
Teller 2
Exit Queue
and
Service
Completed
Jurnal STEI Ekonomi, Vol XX, No XX, JUNI 2020 11
Total 730
Source: Processed data (2019)
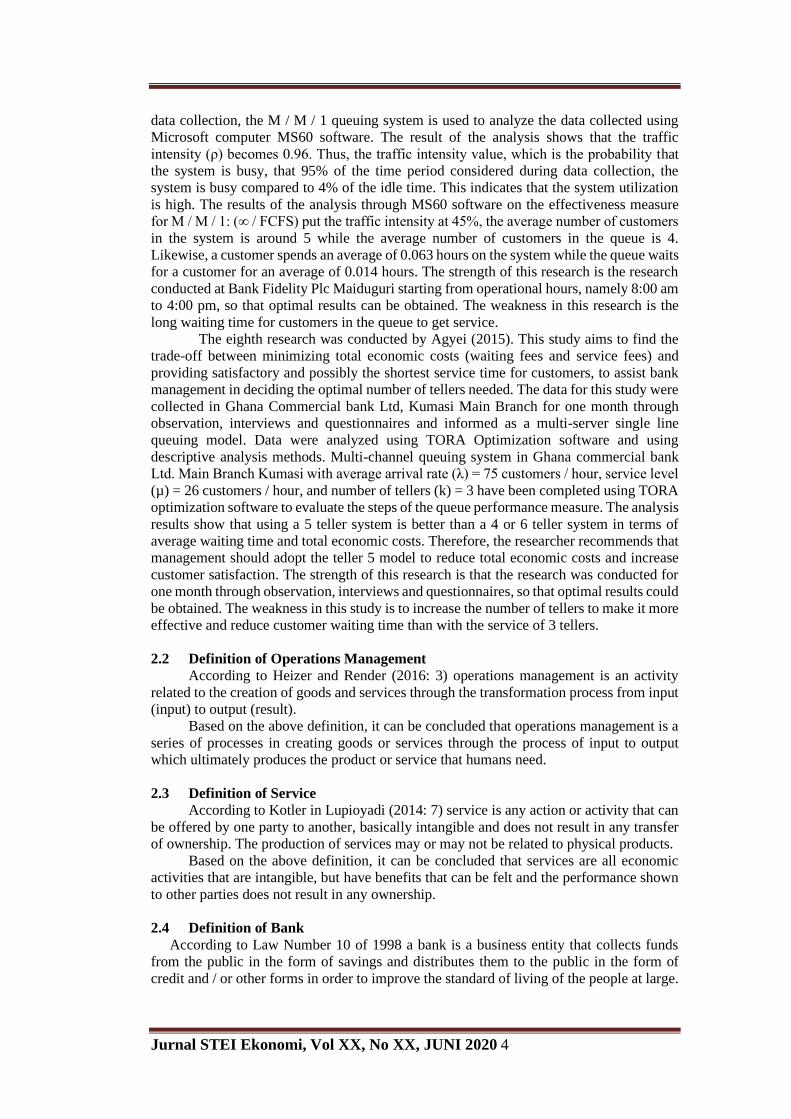
Table 4.2. Hourly Customer Arrival Date
No Date Working
days
Working hours
Number
of
Customers
08
.30
- 0
9.3
0
09
.31
- 1
0.3
0
10
.31
- 1
1.3
0
11
.31
- 1
2.3
0
12
.31
- 1
3.3
0
13
.31
- 1
4.3
0
14
.31
- 1
5.3
0
1 09/12/2019 Monday
10 4 6 10 10 12 4 56
2 10/12/2019 Tuesday
14 8 10 12 12 12 10 78
3 11/12/2019 Wednesday
18 4 12 8 8 12 6 68
4 12/12/2019 Thursday
16 4 10 8 8 8 4 58
5 13/12/2019 Friday
18 10 8 12 14 10 8 80
6 16/12/2019 Monday
16 12 4 12 12 20 8 84
7 17/12/2019 Tuesday
14 10 8 12 12 4 8 68
8 18/12/2019 Wednesday
4 12 16 10 10 8 10 70
9 19/12/2019 Thursday
8 12 10 10 14 10 2 66
10 20/12/2019 Friday
25 10 4 8 10 16 29 102
Total Customers / Hour 70 43 44 51 55 56 45 730
Source: Processed data (2019)
From Table 4.2, the data on hourly customer arrivals for 10 working days
of observation can be concluded that the most customer arrivals are at 08.30 - 09.30
and the lowest customer arrivals are at 09.31 - 10.30. The highest number of
customers on Friday, 20/12/2019 was 102 customers, while the lowest number of
customers was on Monday, 9/12/2019, amounting to 56 customers.
4.3 Analysis of the Queuing System Using the M/M/S Queuing Model
Based on customer arrival data, researchers can analyze queuing performance
using the POM-QM for Windows V5 Waiting Lines Module software. POM-QM for
Windows is a software designed to perform the calculations required by management in
making decisions. Researchers must know, among other things, the number of open lines
(M), in this case the number of tellers, while the number of tellers in the “bank bjb”
Rawamangun Branch Office is 2 tellers, where customers who will make transactions must
queue before they are served . The average customer arrival rate (λ) and the average level
of service (µ). This value is obtained from data from observations (observations).

Jurnal STEI Ekonomi, Vol XX, No XX, JUNI 2020 12
"Bank bjb" Branch Office Rawamangun has a standard service time, which is 2
minutes with a time interval of 60 minutes, then the average number of service levels (µ)
is 30 customers.
The next calculation is to find the values of ρ, P₀, Ls, Ws, Lq, Wq, to find these
values the author uses software. The software used is the POM-QM software for Windows
V5 Waiting Line Module, and the following is the data on the arrival of customers who
transact at “bank bjb” Rawamangun Branch Office at:
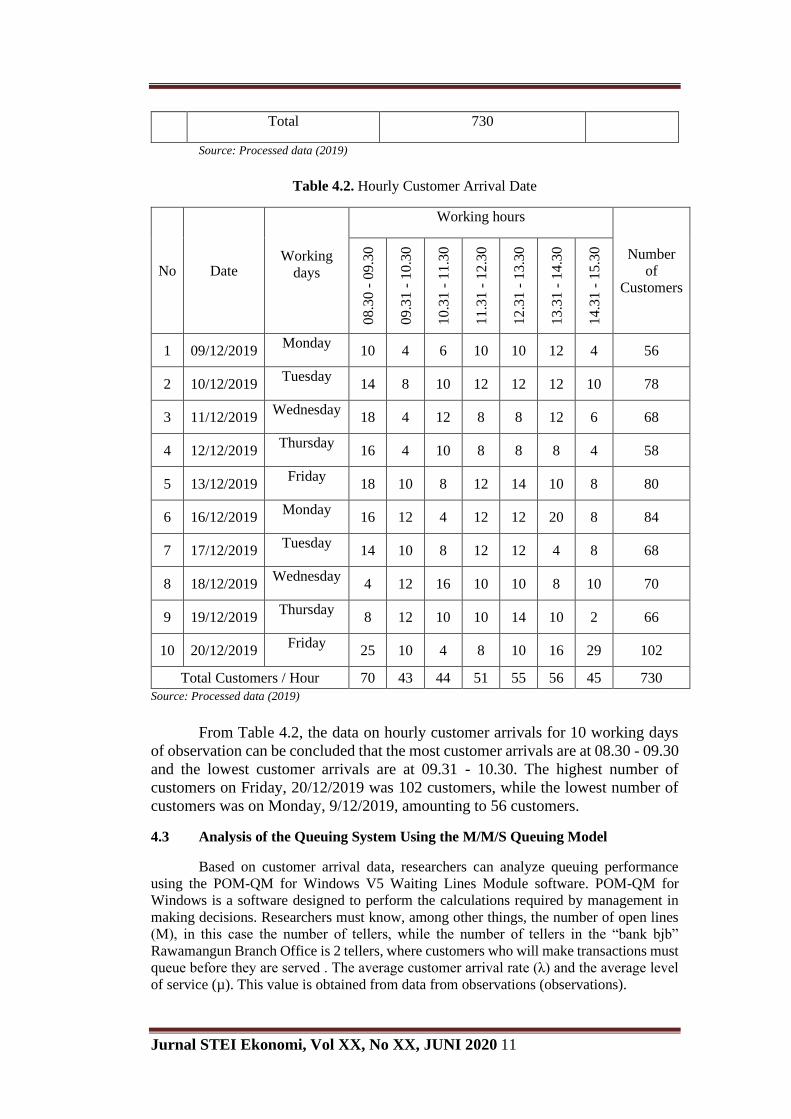
Monday, December 9, 2019
Waiting Lines Results
Parameter Value Parameter Value Minutes Seconds
M/M/s Average server
utilization 0,13333
Arrival rate (lamda) 8 Average number in
the queue (Lq) 0,00483
Service rate (mu) 30 Average number in
the system(L) 0,27149
Number of servers 2 Average time in the
quenue (Wq) 0,0006 0,0362 2,17195
Average time in the
system (W) 0,03394 2,0362 122,172
Table of Probabilities
k Prob (num in sys = k) Prob (num in sys <= k) Prob (num in sys > k)
0 0,76471 0,76471 0,23529
1 0,20392 0,96863 0,03137
2 0,02719 0,99582 0,00418
3 0,00363 0,99944 0,00056
4 0,00048 0,99993 0,00007
5 0,00006 1 0,00001
Graphs of Probabilities

Jurnal STEI Ekonomi, Vol XX, No XX, JUNI 2020 13
The following is the data on the arrival of customers who transact at “bank bjb”
Rawamangun Branch Office for 10 days of observation:
Table 4.3. Results of Queuing System Performance at “bank bjb” Rawamangun Branch
Office for 10 Days (Service with 2 tellers)
Variable
Name
Number of Customers (Person)
Monday
09/12/2019
Tuesday
10/12/2019
Wednesday
11/12/2019
Thursday
12/12/2019
Friday
13/12/2019
λ 8 11 10 8 11
µ 30 30 30 30 30
M 2 2 2 2 2
ρ 0,13333 0,18333 0,16667 0,13333 0,18333
P₀ 0,76471 0,69014 0,71429 0,76471 0,69014
Ls 0,27149 0,37942 0,34286 0,27149 0,37942
Ws 2,0362 2,06956 2,05714 2,0362 2,06956
Lq 0,00483 0,01275 0,00952 0,00483 0,01275
Wq 0,0362 0,06956 0,05714 0,0362 0,06956
Variable
Name
Number of Customers (Person)
Monday
16/12/2019
Tuesday
17/12/2019
Wednesday
18/12/2019
Thursday
19/12/2019
Friday
20/12/2019
0
0.1
0.2
0.3
0.4
0.5
0.6
0.7
0.8
0.9
0 1 2 3 4 5
Senin, 09 Desember 2019Probabilities P(N=k)
Number in System
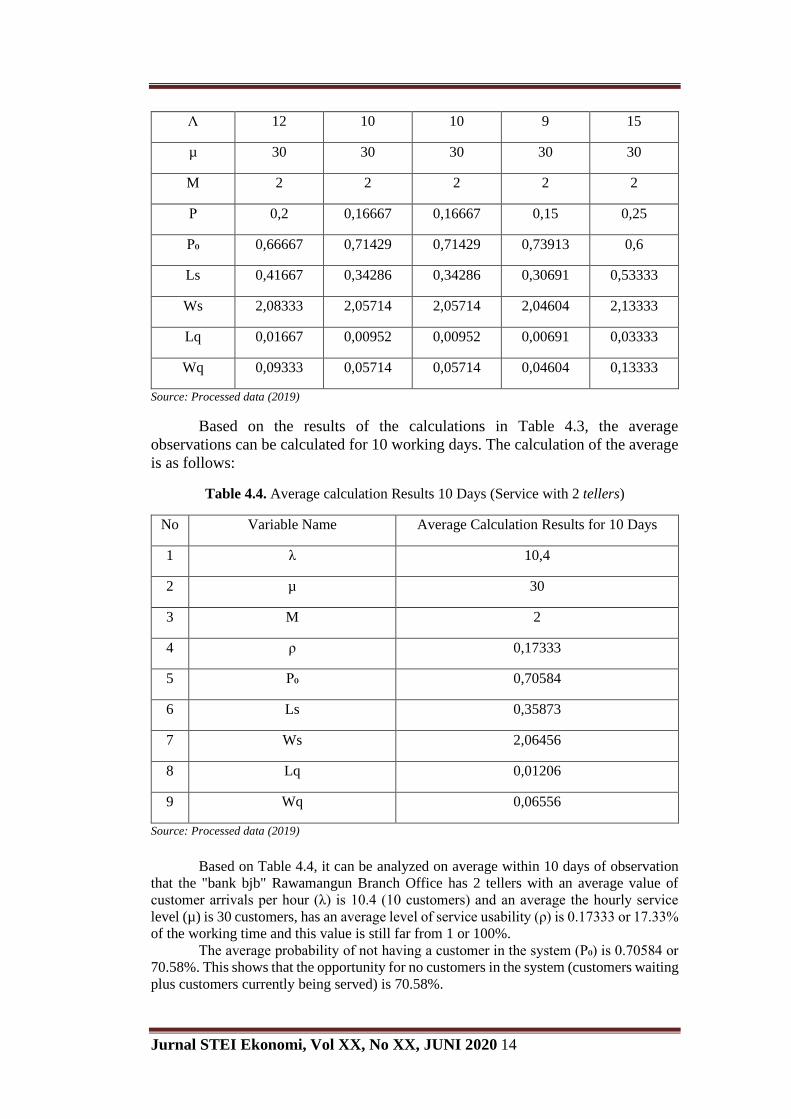
Jurnal STEI Ekonomi, Vol XX, No XX, JUNI 2020 14
Λ 12 10 10 9 15
µ 30 30 30 30 30
M 2 2 2 2 2
Ρ 0,2 0,16667 0,16667 0,15 0,25
P₀ 0,66667 0,71429 0,71429 0,73913 0,6
Ls 0,41667 0,34286 0,34286 0,30691 0,53333
Ws 2,08333 2,05714 2,05714 2,04604 2,13333
Lq 0,01667 0,00952 0,00952 0,00691 0,03333
Wq 0,09333 0,05714 0,05714 0,04604 0,13333
Source: Processed data (2019)
Based on the results of the calculations in Table 4.3, the average
observations can be calculated for 10 working days. The calculation of the average
is as follows:
Table 4.4. Average calculation Results 10 Days (Service with 2 tellers)
No Variable Name Average Calculation Results for 10 Days
1 λ 10,4
2 µ 30
3 M 2
4 ρ 0,17333
5 P₀ 0,70584
6 Ls 0,35873
7 Ws 2,06456
8 Lq 0,01206
9 Wq 0,06556
Source: Processed data (2019)
Based on Table 4.4, it can be analyzed on average within 10 days of observation
that the "bank bjb" Rawamangun Branch Office has 2 tellers with an average value of
customer arrivals per hour (λ) is 10.4 (10 customers) and an average the hourly service
level (µ) is 30 customers, has an average level of service usability (ρ) is 0.17333 or 17.33%
of the working time and this value is still far from 1 or 100%. The average probability of not having a customer in the system (P₀) is 0.70584 or
70.58%. This shows that the opportunity for no customers in the system (customers waiting
plus customers currently being served) is 70.58%.

Jurnal STEI Ekonomi, Vol XX, No XX, JUNI 2020 15
The average number of customers in the system (Ls) is 0.35873. This indicates that
the number of customers in the system (customers in queues and in service or being served)
is less than 1 person.
The average time spent by a customer in the system (Ws) is 2.06456 minutes. This
shows that the customer spends as much as 2 minutes in the system (the length of time the
customer is being served and in the queue).
The average number of customers waiting in queue (Lq) is 0.01206 or 0 customers
and the average time a customer spends waiting in queue (Wq) is 0.06556 minutes. This
indicates that the teller service available at the “bank bjb” Rawamangun Branch Office is
low (less than optimal) because it has 0 customers in the average number waiting in the
queue.
From the analysis and calculations above shows that the queuing system that occurs
at "bank bjb" Rawamangun Branch Office is an average customer arrival of 10 customers
per hour and a standard service time of 2 minutes by having 2 tellers is optimal, because
customers spend time as much as 2.06456 minutes in the system (length of time the
customer is being served and in a queue) according to the standard time set by the “bank
bjb” Rawamangun Branch Office of 2 minutes / customer.
4.4 Research Findings
The results showed that the queuing system at "bank bjb" Rawamangun Branch
Office was not optimal because the level of utility was low at 17.33% and this value was
still far from 100%. There were 0.35873 customers in the system or less than 1 customer.
However, the probability (opportunity) of not having a customer in the system (P₀) is still
high at 0.70584 or 70.58%. The average probability of not having a customer in the system
(Ws) is 2.06456 minutes and the average time spent waiting in a queue (Wq) is 0.06556
minutes in accordance with the service time standards set by "bank bjb “The Rawamangun
branch office is 2 minutes per customer and there is a need for teller performance
evaluation.
These results are not much different from research conducted by Botutihe and
Sumarauw (2018), research conducted by Aulele (2014) and research conducted by
Arwindy and Rosmaini (2014). Research conducted by Aulele was not optimal when using
3 tellers, because the level of utilization of the queuing system (ρ) was 113.94%, and the
optimal number of tellers to serve customers was 4 tellers. Research conducted by
Sya'diyah and Suryowati was not optimal using 6 tellers, because the average time spent
by a customer in a queue was 6.9156 minutes and the average time spent by a customer in
the system was 13.3136 minutes, in this case the addition of 10 tellers is considered
effective. Research conducted by Arwindy and Rosmaini (2014) with the addition of 1
teller, the expectations of the bank can be fulfilled. However, it is different from the
research conducted by Harahap (2014) which has been effective with the utilization value
obtained, namely 82.48% of working hours and the teller idle time per day is less. Research
from Sucihati and Gusferdiansyah has been optimal in providing services, because the
average teller service time (Ws) per customer is 2 minutes 14 seconds with the waiting time
(Wq) for customers in the queue is 14 seconds.
V. CONCLUSIONS AND SUGGESTIONS
5.1 Conclusions
Based on the calculations that the author has done using the QM-PM Software for
Windows V5, the following conclusions can be drawn:

Jurnal STEI Ekonomi, Vol XX, No XX, JUNI 2020 16
1. The type of queuing system specified in the “bank bjb” Rawamangun branch office is
a type of queuing system model of Multi channel-single phase (M / M / S) or single-
stage multiple line system. Where there are several tellers who can serve their
customers, but the steps that customers go through to make transactions through the
teller are only one time.
2. Service discipline set in “bank bjb” Rawamangun Branch is First Come First Served
(FCFS) service discipline or first come, first served, meaning that customers who come
first will be served first. Where customers who come first take the queue number
provided by the bank. After that, wait to be called according to the number sequence
that has been taken to get service from the teller.
3. From the results of data processing, it is known that the performance of the queuing
system at "bank bjb" Rawamangun Branch, which has 2 tellers is less than optimal,
with an average value of customer arrivals per hour (λ) is 10.4 (10 customers) and an
average The average hourly service level (µ) is 30 customers, has an average level of
service use (ρ) is 0.17333 or 17.33% of the working time and this value is still far from
1 or 100%. This shows that tellers have a lot of idle time in their working hours. The
average probability of not having a customer in the system (P₀) is high, namely 0.70584
or 70.58%. This shows that the opportunity for no customers in the system (customers
waiting plus customers currently being served) is 70.58%. The average number of
customers in the system (Ls) is 0.35873. This shows that the number of customers in
the system (customers in queues and in service or being served) is less than 1 person.
The average time spent by a customer in the system (Ws) is 2.06456 minutes. This
shows that the customer spends as much as 2 minutes in the system (long time the
customer is being served and in the queue). The average number of customers waiting
in queue (Lq) is 0.01206 or 0 customers and the average time a customer spends
waiting in queue (Wq) is 0.06556 minutes. This indicates that the teller service
available at the “bank bjb” Rawamangun Branch Office is low (less than optimal)
because it has 0 customers in the average number waiting in the queue. This shows that
the teller service in the “bank bjb” Rawamangun Branch Office is not optimal because
the level of utility is still low.
4. Based on the results of the study, to improve the performance of the queuing system at
teller services, the researchers suggest evaluation by reducing one teller, namely
becoming one teller, with a reduction of 1 "bank bjb" teller, the Rawamangun Branch
Office still serves its customers optimally, because it has the level of usefulness of the
facility (ρ) was higher than using 2 tellers, namely 34.67%. This shows if the teller idle
time is lower and the teller's busy level is high, but does not ignore customer waiting
time in queuing, because the waiting time using 1 teller is 1.09608 minutes and the
average probability of not having a customer in the system (P₀ ) is 65.33% (customers
who are waiting plus customers who are being served).
5.2 Suggestions
Researchers suggest "bank bjb" Rawamangun Branch Office to make efforts to
measure customer satisfaction such as complaints and suggestions, as well as regular
customer satisfaction surveys. This was done in order to make it easier for the “bank bjb”
of the Rawamangun Branch Office to improve service performance and it is better if the
operational network system should be repaired regularly because at certain times the offline
system often occurs which results in customers waiting longer and queues will be long.
5.3 Research Limitations and Future Research Development

Jurnal STEI Ekonomi, Vol XX, No XX, JUNI 2020 17
1. The number of customer arrivals was not too busy because the author examined
it not on the busy date. Future research is expected to be able to choose a date
where there is a high level of customer arrival so that the application of the
queuing theory can be maximized.
2. This study does not compare costs arising from reducing the number of tellers.
Future research is expected to add costs so as to get more optimal results.
REFERENCES
Agyei, W. et. al. 2015. Modeling and Analysis of Queuing System in Banks: (Studi of
Ghana Commercial Bank Ltd. Kumasi Main Branch). International Journal of
Scientific & Technology Research, Vol. 04, No. 07, ISSN 2277-8616 Hal. 160-
165.
Arwindy, Faradhika. et. al. . 2014. Analisis dan Simulasi Sistem Antrian Pada Bank
ABC. Jurnal Saintia Matematika, Vo, 02, No. 02, ISSN 2337-9197, Hal. 147-
162, SK no. 005.0207/JI.3.02/SK.ISSN/2013.03.
Aulele, Salmon Notje. 2014. Analisis Sistem Antrian pada Bank Mandiri Cabang
Ambon. Jurnal Bakereng: Ilmu Matematika dan Terapan, Vol. 08, No. 01,
ISSN 2615-3017, Hal. 49-45, SK no. 0005.26153017/JI.3.1/SK.ISSN/2018.02
- 15 Februari 2018 (mulai edisi Vol. 12, No. 1, Maret 2018)
Bakari, H. R., et. al. 2014. Queuing Process and Its Application to Customer Service
Delivery (A Case study of Fidelity Bank Plc, Maiduguri). International Journal
of Mathematics and Statistics Invention (IJMSI), Vol. 02, No. 01, ISSN 2321-
4759, Hal. 14-21.
Botutihe, Kartika, et. al. 2018. Analisis Sistem Antrian Teller Guna Optimalisasi
Pelayanan Pada PT. Bank Negara Indonesia (BNI) 46 Cabang Unit Kampus
Manado. Jurnal EMBA, Vol. 06, No. 03, ISSN 2303-1174, Hal. 1388-1397, SK
no. 0005.26226219/JI.3.1/SK.ISSN/2018.08 - 27 Agustus 2018 (mulai edisi
Vol. 6, No. 1, Desember 2018)
Chinwuko, Chuka Emmanuel. et. al. 2014. Analysis of a Queuing System in an
Organization (a case study of First Bank PLC, Nigeria). American Journal of
Engineering Research (AJER), Vol. 03, No. 02, ISSN 2320-0936, Hal. 1-11.
Fandy Tjiptono dan Gregorius Chandra, 2016, Service, Quality & Satisfaction,
(Yogyakarta : Andi).
Griffin, Ricky W., Management : Principles, 11th International Edition, (South Western
: Cengange Learning, 2013).
Handoko, T. Hani,. Dasar-dasar Manajemen Produksi dan Operasi, (Yogyakarta :
BPFE, 2011), Hal. 10.
Harahap, Siti Arina R., et. al. 2014. Analisis Sistem Antrian Pelayanan Nasabah di
PT. Bank Negara Indonesia (Persero) Tbk Kantor Cabang Utama USU. Jurnal
Saintia Matematika, Vol. 02, No. 03, ISSN 2337-9197, Hal. 277-278, SK no.
005.0207/JI.3.02/SK.ISSN/2013.03.
Heizer, Jay and Barry Render, Operations Management, edisi 11, (Jakarta : Salemba
Empat, 2016), Hal. 852.
Jacobs, Robert dan Richard Chase. 2015. Operations and Supply Chain Management.
(Jakarta : Salemba Empat). Hal. 269.
Kasmir. 2014. Dasar-dasar Perbankan. Edisi Revisi. (Jakarta : PT Raja Grafindo
Persada).
Kotler, Philip and Gery Amstrong, 2016, Prinsip-prinsip Pemasaran, Edisi 13, Jilid 1,
(Jakarta : Erlangga), Hal. 223.
Latumaerissa, Julius R., Bank dan Lembaga Keuangan Lain, (Jakarta : Salemba Empat,
2012), Hal. 135.

Jurnal STEI Ekonomi, Vol XX, No XX, JUNI 2020 18
Lupioyadi, Rambat., Manajemen Pemasaran, Edisi 3, (Jakarta : Salemba Empat, 2014),
Hal. 7.
Sucihati, Roos Nana dan Rizki Gusferdiansyah. 2017. Analisis Sistem Antrian dan
Optimalisasi Layanan Teller (Studi Pada Bank BRI Kantor Cabang Sumbawa).
Jurnal Ekonomi dan Bisnis, Vol. 14, No. 03, ISSN 2580-7285, Hal. 229-243,
SK no. 0005.25807285/JI.3.1/SK.ISSN/2017.07 - 7 Juli 2017 (mulai edisi
Vol. 7, No. 2, Juni 2017).
Sugiyono. Metode Penelitian Kuantitatif, Kualitatif, dan R&D, (Bandung : Alfabeta,
2017).
________. Metode Penelitian Pendidikan (Pendekatan kuantitatif, kualitatif dan R&D.
(Bandung : Alfabeta, 2015). Hal. 53.
Copyright © 2022 FDOKUMEN