Analysis of Automatic Toll Gate Payment Queue System - IEOM
13
Analysis of Automatic Toll Gate Payment Queue System Najibatul Mujahidah and Hasna Rafifah Azmi Student, Industrial Engineering Department, Faculty of Engineering Veteran National Development University of Jakarta, Indonesia [email protected], [email protected] Akhmad Nidhomuz Zaman Lecturer, Industrial Engineering Department, Faculty of Engineering Veteran National Development University of Jakarta, Indonesia [email protected] Fitra Lestari Department of Industrial Engineering Member, IEOM Indonesia Chapter Sultan Syarif Kasim State Islamic Unversity, Riau, Indonesia [email protected] Analysis of Automatic Toll Gate Payment Queue System Today, many motorists want a smooth ride. Toll roads are considered freeways that can provide smoothness, comfort, and safety to their users. Therefore, we conducted research that aims to create a system that regulates toll road payment queues. This is done so that the toll road queue can run more smoothly, effectively, and efficiently in the system. In this study, we used a discrete simulation model by designing a simulation system and made two improvements using the arena simulation application. This makes it easier for us to analyze the designed simulation. From the research with two improvements. Based on the table and the results of the histogram comparison of waiting times on the GTO Kalimalang 2 queuing system, the waiting time on the actual system is 2.29303595 minutes, and on the proposed system 1 the waiting time is 1.68561362 minutes, and in the proposed system 2 the waiting time is 1.47913723 minutes. So, the largest waiting time is in the actual system while the smallest waiting time is in the proposed system 2. This indicates that the system proposed in the second improvement has better performance than the first proposed improvement and the actual system performance. Keywords Model, System Simulation, System Analysis, Arena Simulation, Waiting Time 1. Introduction Having conducted research using the study of literature, both with the reading of the article and see from the video data, Gate Toll Kalimalang 2 which is located in Bekasi, Indonesia is getting results the condition of the gate toll has 3 GTO which is a kind of gate toll that only serve the payment of money demand deposits (using cards). The transition to the money electronically to conduct transactions at Gate Toll Auto (GTO) is expected to reduce the cost of managing the money in cash to increase the efficiency of transactions and parse congestion. However, approximately at 05:00 pm upward, the flow of vehicles at the gate of the toll Kalimalang 2 observed solid and get a line that crowded when the clock is busy, for example, when the hours of homework. Besides that, there is indifference among users Gate Toll Kalimalang 2's. For example with the occurrence of a user who grabs from the left and makes their line. The queue at the payment at the gates of the toll it contained some sequence, which begins with the arrival of the vehicle which is waiting at the gate 1,2 and 3, and then do a tap e-toll on the sensor GTO, after it entered into the process of waiting, then the balance of the e-toll truncated or the money has been paid, followed by waiting for the receipt and the toll gate to open. After that, the vehicle is allowed to go. Based on the explanation previously obtained Activity Cycle Diagrams (ACD) of Simulation Queue Payment of Toll is a form of visual of the flow of work that contains the activities and actions, which also can contain selection, repetition, and concurrency. In the Unified Proceedings of the Second Asia Pacific International Conference on Industrial Engineering and Operations Management Surakarta, Indonesia, September 14-16, 2021 © IEOM Society International 1936
-
Upload
khangminh22 -
Category
Documents
-
view
3 -
download
0
Transcript of Analysis of Automatic Toll Gate Payment Queue System - IEOM

Analysis of Automatic Toll Gate Payment Queue System Najibatul Mujahidah and Hasna Rafifah Azmi
Student, Industrial Engineering Department, Faculty of Engineering Veteran National Development University of Jakarta, Indonesia
[email protected], [email protected]
Akhmad Nidhomuz Zaman Lecturer, Industrial Engineering Department, Faculty of Engineering
Veteran National Development University of Jakarta, Indonesia [email protected]
Fitra Lestari Department of Industrial Engineering
Member, IEOM Indonesia Chapter Sultan Syarif Kasim State Islamic Unversity, Riau, Indonesia
Analysis of Automatic Toll Gate Payment Queue System
Today, many motorists want a smooth ride. Toll roads are considered freeways that can provide smoothness, comfort, and safety to their users. Therefore, we conducted research that aims to create a system that regulates toll road payment queues. This is done so that the toll road queue can run more smoothly, effectively, and efficiently in the system. In this study, we used a discrete simulation model by designing a simulation system and made two improvements using the arena simulation application. This makes it easier for us to analyze the designed simulation. From the research with two improvements. Based on the table and the results of the histogram comparison of waiting times on the GTO Kalimalang 2 queuing system, the waiting time on the actual system is 2.29303595 minutes, and on the proposed system 1 the waiting time is 1.68561362 minutes, and in the proposed system 2 the waiting time is 1.47913723 minutes. So, the largest waiting time is in the actual system while the smallest waiting time is in the proposed system 2. This indicates that the system proposed in the second improvement has better performance than the first proposed improvement and the actual system performance.
Keywords Model, System Simulation, System Analysis, Arena Simulation, Waiting Time
1. Introduction
Having conducted research using the study of literature, both with the reading of the article and see from the video data, Gate Toll Kalimalang 2 which is located in Bekasi, Indonesia is getting results the condition of the gate toll has 3 GTO which is a kind of gate toll that only serve the payment of money demand deposits (using cards). The transition to the money electronically to conduct transactions at Gate Toll Auto (GTO) is expected to reduce the cost of managing the money in cash to increase the efficiency of transactions and parse congestion. However, approximately at 05:00 pm upward, the flow of vehicles at the gate of the toll Kalimalang 2 observed solid and get a line that crowded when the clock is busy, for example, when the hours of homework. Besides that, there is indifference among users Gate Toll Kalimalang 2's. For example with the occurrence of a user who grabs from the left and makes their line.
The queue at the payment at the gates of the toll it contained some sequence, which begins with the arrival of the vehicle which is waiting at the gate 1,2 and 3, and then do a tap e-toll on the sensor GTO, after it entered into the process of waiting, then the balance of the e-toll truncated or the money has been paid, followed by waiting for the receipt and the toll gate to open. After that, the vehicle is allowed to go. Based on the explanation previously obtained Activity Cycle Diagrams (ACD) of Simulation Queue Payment of Toll is a form of visual of the flow of work that contains the activities and actions, which also can contain selection, repetition, and concurrency. In the Unified
Proceedings of the Second Asia Pacific International Conference on Industrial Engineering and Operations Management Surakarta, Indonesia, September 14-16, 2021
© IEOM Society International 1936

Modeling Language, activity diagrams are created to describe both computer activities and the flow of activities in an organization. Previously, the number of transactions at the Jabodetabek toll gates reached 3.2 million transactions per day, the normal capacity at the toll gates is only 2.4 million transactions. Excess many as 800 thousand transactions it, which according to him, makes the density at the door toll. (Jasa Marga Director of Operations, Hasanudin). Because of that, the problem faced in the case of paying for the Kalimalang 2 toll gate is the occurrence of queues which cause a fairly large waiting time in toll payment activities. In addition, sometimes some motorists do not carry electronic money (e-toll) or the balance is insufficient. Then another problem with some riders who have withdrawn their cards before the portal goes up. This causes the rider to stick the card again until the portal goes up and that is quite time-consuming. As a result of this problem, many parties, especially toll road users, have complained. This problem is very detrimental to the toll road users because the time required for the trip will increase and disrupt the schedule of other activities. The following is a picture of the queue taken at the Kalimalang 2 Toll Gate during peak hours. Simulations are made is intended to minimize the waiting time (time waiting) in the queue at the gate of the toll Kalimalang 2. Time to wait in the system is when the user tolls or riders who come want to pay at the gate of the toll. Queues that were long can lead to a buildup of the vehicle so detrimental to all parties, for example, when traveling became more lengthy and activities of others are distracted. It is very potential for lowering the level of satisfaction of the customer to the service that was given by the manager of the gate toll (PT. Jasa Marga). By because it is, minimizing the time waiting into things that are very important to do. • Space Scope of Simulation
Here is a space scope of simulations were made:
a. Simulations were carried out using the Arena software; b. The actual system has working hours for 24 hours per day; c. The mechanical ability between gates 1,2 and 3 is the same; and d. There is no priority between gates 1,2 and 3.
2. Literature Review
Entities that are in the modeling system queue at the gate toll Kalimalang 2 are as follows:
a. Motorists or toll road users; b. 4 Wheel Vehicles; and c. Toll Gate Officer (PT Jasa Marga).
The system is started with the arrival of the riders who want to do the payment road toll by way of lining up on the road toward the gate of the toll. After lining up, the rider can perform the payment by selecting two gate tolls that already exist, namely by attaching the card electronically (e-toll), but if it happens the constraints are associated with the payment, some officers will be petrified. Once the payment is done, the balance automatically is truncated and receipt of payment will come out after the riders are welcome to enter into road tolls and alternate with the riders in the line next to do the payment. The following is an ERD of a toll payment system using an electronic card.
On the activities of payment road toll in Kalimalang 2, there are three GTOs are used by way of transactions online using the card electronic (e-toll), then to the gate tolls are three gates that can be passed by a vehicle with a category that has been determined, in addition to it there is attendant road toll which is derived from PT. Jasa Marga is always helping motorists who have problems with the toll road payment system. Diagram flow chart flow, or chart the flow is a type of diagram that represents an algorithm, a flow of work or process, which displays the steps in the form of symbols of the graphics, and the order is connected with arrows. This diagram represents an illustration or depiction of problem-solving. The following is a flowchart of the toll road payment activities at the Kalimalang 2 toll gate.
Proceedings of the Second Asia Pacific International Conference on Industrial Engineering and Operations Management Surakarta, Indonesia, September 14-16, 2021
© IEOM Society International 1937

Figure 1. Toll Gate Queue Flowchart
Diagram cycle of activity (Activity Cycle Diagrams/ACD) is one of the embodiments of the shape model of the conceptual which is quite easy to use and systematically to describe the structure of the existence of the system. The diagram is suitable at all for the system discrete-probabilistic. 3. Study Methodology
• Flowchart / Research
Here is a flowchart of the research that was conducted:
Proceedings of the Second Asia Pacific International Conference on Industrial Engineering and Operations Management Surakarta, Indonesia, September 14-16, 2021
© IEOM Society International 1938

Figure 2. Research Flowchart
3.1 Structural Data
The data structure that is required in the research of this are:
Table 1. Research Data
Entity • Motorists / Toll Road Users • 4 Wheeled Vehicle. • Toll Gate
Source / Resources Toll Road Officer (PT. Jasa Marga) Location Kalimalang 2 Toll Gate, Bekasi, Indonesia
Proceedings of the Second Asia Pacific International Conference on Industrial Engineering and Operations Management Surakarta, Indonesia, September 14-16, 2021
© IEOM Society International 1939

At this stage, it explains the structure and payment flow at the toll gate, starting from the arrival of the driver, choosing the toll gate to be passed, then waiting for the queue, tapping the e-toll on the GTO sensor, followed by the waiting process. Then if the balance is sufficient, the balance is automatically deducted and the receipt is issued, after which the gate opens. Meanwhile, if the balance is insufficient, it will remain at the toll gate to top up so that it can pass through the toll gate. This flow contains all processes available in it so that it can be a reference for observations to analyze the queuing system. The following is a Simulation of the Activity Cycle Diagram (ACD) of the Toll Payment Queue at the Kalimalang 2 Toll Gate which describes the relationship between entities.
Figure 3. Activity Cycle Diagram of Toll Payment Queues
3.2 Operational Data The first step is to create a structural data transformation model in operational data so that operations are related to operational strategies between entities. The toll gate payment system at Kalimalang 2 Toll Road applies the FCFS (First Come First Serve) system. Motorists who first came to queuing will receive the right to perform payment gateway toll up first, then followed by a rider who came to queue afterward. The following is a picture of the queue taken at the Kalimalang 2 Toll Gate. The data operations are needed in the research of this are:
Table 2. Operational Data
Operating System Actual When Operates every day for 24 hours Where Kalimalang 2 Toll Gate, Bekasi, Indonesia
How
• Toll road users or motorists come to the toll gate; • Motorists do queue on the road toward the gate toll; • Motorists choose between tollgates 1,2 and 3; • When there is no queue, the driver can make payment; • Payments are made using an electronic card (e-toll); • After that, the electronic card balance will be automatically deducted; • Receipt of payment out through the machinery of payment; • The toll gate sign is open; and • The rider can pass a signpost and go enter into the road toll.
Proceedings of the Second Asia Pacific International Conference on Industrial Engineering and Operations Management Surakarta, Indonesia, September 14-16, 2021
© IEOM Society International 1940

The suggestions that we can give based on the research and conclusions that have been made are to make two suggestions. The first suggestion improvement system is to add one manual toll gate for cars that do not have or have left their e-tolls behind, so they can still enter the toll gates. While the second suggestion improvement system is to add emergency cars and emergency toll gates so that when there is an emergency car such as an ambulance, there is no need to queue when you want to enter a regular GTO. The addition of these two suggestion improvement systems will save waiting time so that the payment process at toll gates will be more effective and efficient. 3.3 Numerical Data
In this study, there are eight types of operating data needed to represent the relationship between toll road users, 4-wheeled vehicles, and toll gates. The data is the arrival of big cars, the arrival of small cars, toll gate 1, toll gate 2, toll gate 3, pasting e-toll on the GTO server, truncated balance, and taking receipts and open gates. The following is data on the sequence of activities in making payments at the Kalimalang 2 toll gate:
Table 3. Numerical Data
Operation Resource Expression Time
Big Car Arrival 4 Wheeled Vehicle Weibull 1.5 + (5.37, 2.03) minutes Small Car Arrival 4 Wheeled Vehicle Normal (5.48, 2.11) minutes
Toll Gate 1 Toll Gate Triangular (5.5, 10, 12.5) minutes Toll Gate 2 Toll Gate Poisson (8.9) minutes Toll Gate 3 Toll Gate Triangular (3.5, 5.84, 14.5) minutes
Attaching the E-Toll to the GTO Sensor Toll Road Users Gamma 0.5 + (1.23, 4.15) minutes Deducted Balance Toll Gate Poisson (3.5) minutes
Take Receipt and Open Gate Toll Road Users and Toll Gate Normal (2.78, 1.61) minutes 4. Performance Measurement
Performance measurement is carried out to assess the attributes that have been obtained through arena software modeling that represents the relationship of toll road users who want to pay tolls at the Kalimalang tollgate 2. Performance measurement is obtained through several steps including problem formulation, conceptual modeling, verification and validation, experimentation, and analysis of results. This data collection stage was carried out to collect the data needed for research. The data used in this research is secondary data. Secondary Data This is a type of research data whose data sources are obtained and collected by researchers not directly but with others. For example, in a reference search research from a journal entitled Simulation model of discrete events applied to the planning and operation of a toll plaza and Simulation of Refinery-Supplier Relationship. Proceedings of the International MultiConference of Engineers and Computer Scientists 2016 (IMECS 2016) then proceed to more advanced analysis and make improvements and provide two suggestions for improvements to better results than previous research. 4.1 Problem Formulation
The main attribute to be measured is waiting time. After the waiting time is obtained from the actual system, suggestion improvement systems 1 and 2, a comparison is made to get the best system to create an increase in the effectiveness and efficiency of the payment system performance at the Kalimalang 2 toll gate. Waiting time is obtained from the reduction of final time, arrival time, and processing start time.
a. Utilization (r) is measured using the arrival rate of drivers (l) and also the level of service that workers
can perform in 1 hour (m).
r = l/sm
b. Waiting time is obtained from the reduction of final time, arrival time, and processing start time.
Waiting time = Final time – process time – arrival time
Proceedings of the Second Asia Pacific International Conference on Industrial Engineering and Operations Management Surakarta, Indonesia, September 14-16, 2021
© IEOM Society International 1941

4.2 Verification and Validation
Data verification is a way to find out whether the simulation model created can run smoothly or not (error). It can be seen in the image below that there is no error in the queue simulation system, so the server will display a text box. This means that the simulation model has been verified. so that a notification appears that no errors were found in the simulation model as shown in Figure 4.
Figure 4. Verification of the Queue System at the Toll Gate
In the simulation modeling of the GTO queuing system in the Kalimalang 2 area, 3 toll gates are operating and we made three models, namely, the actual system, proposed system 1, and proposed system 2. From each modeling, data will be obtained as a result of running with the ARENA software, and some indicators are used as comparisons between one system and another. This research focuses on the resulting waiting time indicator, as well as the number of cars that exit the system after completing all processes. The smaller the waiting time produced by the system, the better the system will be, and vice versa. The greater the number of cars that come out of the system, the better the simulation will be. Determination of the performance of each system will be presented in the following table. Validation is done by comparing the average waiting time on the actual system with the situation in suggestion improvement systems 1 and 2 as shown in Table 4.
Table 4. System Performance Table
Average Waiting Time
Actual System Suggestion Improvement System 1
Suggestion Improvement System 2
GTO1 X minutes X minutes X minutes GTO2 X minutes X minutes X minutes GTO3 X minutes X minutes X minutes
Emergency GT X minutes X minutes X minutes GT Manual X minutes X minutes X minutes Tap E-toll X minutes X minutes X minutes
Deducted Balance X minutes X minutes X minutes Open Gate X minutes X minutes X minutes
Amount of Average waiting time X minutes X minutes X minutes Amount Number Out X cars X cars X cars
4.3 Experimentation, Result, and Analysis
The following is an actual simulation model of the GTO system with Arena software.
Proceedings of the Second Asia Pacific International Conference on Industrial Engineering and Operations Management Surakarta, Indonesia, September 14-16, 2021
© IEOM Society International 1942

Figure 5. Actual Queuing System for GTO Kalimalang 2
From the modeling above, obtained an average waiting time for each process as in the image below is a screenshot (screenshot) in the queue simulation system GTO Kalimalang 2 with software Arena.
Figure 6. Report of the GTO Kalimalang Actual Queuing System 2 Sistem
4.4 Proposed Improvement
The simulation results in a fairly high level of waiting time and utilization, so improvements are needed to make the system runs optimally. Suggestion improvement systems are given in two improvement scenarios.
a. Suggestion Improvement System 1 The first improvement proposed by the author is to add a manual toll gate for cars that do not have or have left their e-toll, so they can still enter the toll gate.
Figure 7. Proposed System 1 Queue GTO Kalimalang 2
Proceedings of the Second Asia Pacific International Conference on Industrial Engineering and Operations Management Surakarta, Indonesia, September 14-16, 2021
© IEOM Society International 1943

From the first proposed system, the average waiting time is obtained, which can be seen in the following figure.
Figure 8. Proposed Report 1 Queue of GTO Kalimalang 2
b. Suggestion Improvement System 2
The second improvement proposed by the author is to add the arrival of emergency cars and emergency toll gates so that when there is an emergency car such as an ambulance, there is no need to queue when you want to enter a regular GTO.
Figure 9. Proposed System 2 Queue GTO Kalimalang 2
From this second proposed system, the average waiting time is obtained, which can be seen in the following figure.
Proceedings of the Second Asia Pacific International Conference on Industrial Engineering and Operations Management Surakarta, Indonesia, September 14-16, 2021
© IEOM Society International 1944

Figure 10. Proposed System 2 Queue GTO Kalimalang
c. Utility Comparison
Table 5. Comparison of the utility of the actual system and the proposed system
System Average Utility Actual System 0.7311
Suggestion Improvement System 1 0.6153 Suggestion Improvement System 2 0.6142
Figure 11. Utility Comparison Histogram
Based on the table and the results of the utility comparison histogram on the GTO Kalimalang 2 queuing system, it was found that the largest utility is in the actual system while the smallest utility is in the proposed system 2. This means that suggestion improvement system 2 is better used in the GTO Kalimalang 2 queuing system.
Proceedings of the Second Asia Pacific International Conference on Industrial Engineering and Operations Management Surakarta, Indonesia, September 14-16, 2021
© IEOM Society International 1945
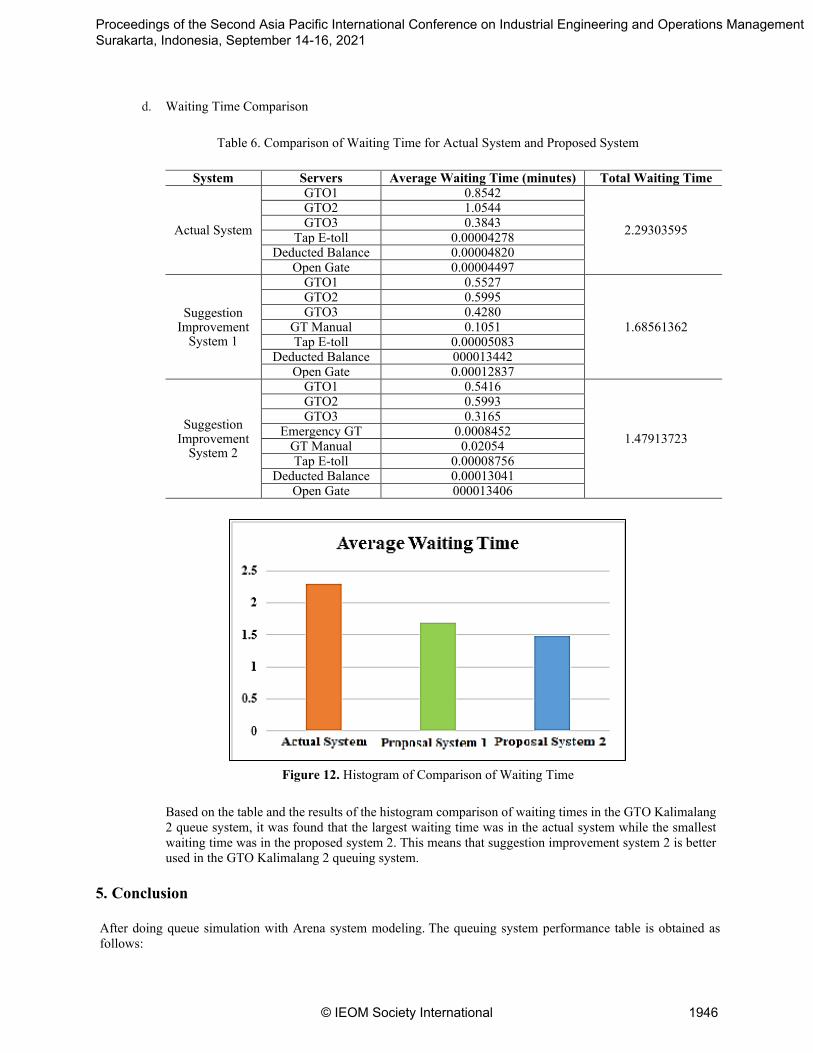
d. Waiting Time Comparison
Table 6. Comparison of Waiting Time for Actual System and Proposed System
Figure 12. Histogram of Comparison of Waiting Time
Based on the table and the results of the histogram comparison of waiting times in the GTO Kalimalang 2 queue system, it was found that the largest waiting time was in the actual system while the smallest waiting time was in the proposed system 2. This means that suggestion improvement system 2 is better used in the GTO Kalimalang 2 queuing system.
5. Conclusion
After doing queue simulation with Arena system modeling. The queuing system performance table is obtained as follows:
System Servers Average Waiting Time (minutes) Total Waiting Time
Actual System
GTO1 0.8542
2.29303595
GTO2 1.0544 GTO3 0.3843
Tap E-toll 0.00004278 Deducted Balance 0.00004820
Open Gate 0.00004497
Suggestion Improvement
System 1
GTO1 0.5527
1.68561362
GTO2 0.5995 GTO3 0.4280
GT Manual 0.1051 Tap E-toll 0.00005083
Deducted Balance 000013442 Open Gate 0.00012837
Suggestion Improvement
System 2
GTO1 0.5416
1.47913723
GTO2 0.5993 GTO3 0.3165
Emergency GT 0.0008452 GT Manual 0.02054 Tap E-toll 0.00008756
Deducted Balance 0.00013041 Open Gate 000013406
Proceedings of the Second Asia Pacific International Conference on Industrial Engineering and Operations Management Surakarta, Indonesia, September 14-16, 2021
© IEOM Society International 1946

Table 7. Average Waiting Time
Average Waiting Time
Actual System Suggestion Improvement System 1
Suggestion Improvement System 2
GTO1 0.8542 minutes 0.5527 minutes 0.5416 minutes GTO2 1.0544 minutes 0.5995 minutes 0.5993 minutes GTO3 0.3843 minutes 0.4280 minutes 0.3165 minutes
Emergency GT - - 0.0008452 minutes GT Manual - 0.1051 minutes 0.02054 minutes Tap E-toll 0.00004278 minutes 0.00005083 minutes 0.00008756 minutes
Deducted Balance 0.00004820 minutes 000013442 minutes 0.00013041 minutes Open Gate 0.00004497 minutes 0.00012837 minutes 000013406 minutes
Amount of Average waiting time 2.29303595 minutes 1.68561362 minutes 1.47913723 minutes
Amount Number Out 478 cars 492 cars 633 cars From the table above, it can be seen that the proposed system 2, namely the addition of manual toll gates and emergency toll gates specifically for emergency care such as ambulances, produces the least average waiting time compared to the actual system and suggestion improvement system 1. cars out of the system is also the most out of other systems. Thus, the proposed system 2 can be said to be the best system. From the conclusions obtained, it is better to add toll gates in the Kalimalang 2 area, namely by adding manual toll gates (cash payments) for cars that do not have e-toll cards and emergency gates for cars with emergency conditions. The additional gate will reduce the waiting time on the system which has an impact on traffic congestion on the toll road. Acknowledgments
Thank you very much and respect to the university and the writer's parents who have to assist this research both materially and non-material.
References Caldas, M. A. D. F., & Sacramento, K. T. (2016). Simulation model of discrete events applied to the planning and
operation of a toll plaza. Journal of Transport Literature, 10, 40-44.
Lestari, F., Ismail, K., Abdul Hamid, AB., Supriyanto, E., and Sutupo, W. Simulation of Refinery-Supplier Relationship. Proceedings of the International MultiConference of Engineers and Computer Scientists 2016 (IMECS 2016), Vol II, March 16 - 18, 2016, Hong Kong, pp.740-744. 2016.
Pompigna, A., and Mauro, R. (2021). A multi-class time-dependent model for the analysis of waiting phenomena at a motorway tollgate. Journal of Traffic and Transportation Engineering (English Edition), 8(2), 237-256.
Rosalendro Eddy Nugroho, Mohamad Jihan, and AnggaHarismawan. (2020). Analysis of Gate Queue in Cikupa Toll PT Marga Mandala Sakti Using Deterministic Queue Model. IOSR Journal of Business and Management (IOSR-JBM), (Vol. 22, Issue 1. Ser. I (January. 2020), PP 38-44.
Sihotang, E., Ispriyanti, D., Prahutama, A., and Rachman, A. (2020, April). Analysis of queue and performance of automatic toll booths with a normal distribution (case study: automatic booths toll gate muktiharjo). In Journal of Physics: Conference Series (Vol. 1524, No. 1, p. 012093). IOP Publishing.
Vadlamudi, J. C. (2016). How a Discrete event simulation model can relieve congestion at a RORO terminal gate system (Doctoral dissertation, Masters thesis, Faculty of Computing, Blekinge Institute of Technology, SE371 79 Karlskrona, Sweden. Available via http://www. diva-portal. org/smash/get/diva2: 911878/FULLTEXT02. pdf).
Proceedings of the Second Asia Pacific International Conference on Industrial Engineering and Operations Management Surakarta, Indonesia, September 14-16, 2021
© IEOM Society International 1947

Biographies Najibatul Mujahidah is a college student in Industrial Engineering Department at National Development Veteran University, Jakarta, Indonesia. Her areas of interest are Supply Chain Management, Quality Control, System Modeling, and Production System. Hasna Rafifah Azmi is a college student in Industrial Engineering Department at National Development Veteran University, Jakarta, Indonesia. His areas of interest are Computer Simulation, Production Planning, and Inventory Control and Manufacturing. Akhmad Nidhomuz Zaman is a lecturer at the Department of Industrial Engineering, UPNVJ, Indonesia. He earned his master's degree in the Department of Quality Management and Manufacturing, Sepuluh Nopember Institute of Technology. The courses taught are Production Systems, Production Control, and Planning, Lean Manufacturing, Industrial Organization, and Management. Fitra Lestari is an Associate Professor and Head of the Industrial Engineering Department at Sultan Syarif Kasim State Islamic University, Indonesia. He finished his Ph.D. project with a major area in Supply Chain Management at Universiti Teknologi Malaysia. He is currently a member of IEOM and has published several articles in international journals about Supply Chain Management, Logistics, and Performance Measurement.
Proceedings of the Second Asia Pacific International Conference on Industrial Engineering and Operations Management Surakarta, Indonesia, September 14-16, 2021
© IEOM Society International 1948