
Elastic image registration for landslide deformation detection

Journal of Asian Earth Sciences xxx (2012) xxx–xxx
Contents lists available at SciVerse ScienceDirect
Journal of Asian Earth Sciences
journal homepage: www.elsevier .com/locate / jseaes
Analysis of landslide dams induced by the 2008 Wenchuan earthquake
Xuanmei Fan a,b,⇑, Cees J. van Westen b, Qiang Xu a, Tolga Gorum b, Fuchu Dai c
a The State Key Laboratory of Geohazards Prevention and Geoenvironment Protection, Chengdu University of Technology, Chengdu, Sichuan, Chinab Faculty of Geo-Information Science and Earth Observation (ITC), University of Twente, 7500 AE, Enschede, P.O. Box 217, The Netherlandsc Institute of Geology and Geophysics, Chinese Academy of Sciences, P.O. Box 9825, Beijing, China
a r t i c l e i n f o a b s t r a c t
Article history:Received 15 January 2012Received in revised form 7 April 2012Accepted 4 June 2012Available online xxxx
Keywords:Landslide damWenchuan earthquakeQuake lakeFailure rate
1367-9120/$ - see front matter � 2012 Elsevier Ltd. Ahttp://dx.doi.org/10.1016/j.jseaes.2012.06.002
⇑ Corresponding author at: Faculty of Geo-InfoObservation (ITC), University of Twente, 7500 AE, ENetherlands. Tel.: +31 (0)53 487 4416.
E-mail address: [email protected] (X. Fan).
Please cite this article in press as: Fan, X., et al(2012), http://dx.doi.org/10.1016/j.jseaes.2012.0
Landslide dams caused by earthquakes are extremely hazardous disruptions of the flow of water and sed-iment in mountain rivers, capable of delivering large outburst floods that may devastate downstreamareas. We analyzed a unique inventory of 828 landslide dams triggered by the Mw 7.9 2008 Wenchuantectonic earthquake, China, constituting �1.4% of the >60,000 coseismic slope failures mapped and attrib-uted to this event. While 501 landslides blocked the rivers completely, the remainder caused only partialdamming or channel diversion. The spatial distribution of landslide dams follows the same trend of thatof the total landslide distribution, with landslide dams being most abundant in the steep watersheds ofthe hanging wall of the Yingxiu-Beichuan Thrust Fault, and in the northeastern part of the strike-slip faultnear Qingchuan. Besides the co-seismic landslide density, the river width also played a key role in deter-mining the landslide dam formation. Narrow rivers are more prone to be dammed than the wide rivers.The correlation between river width and landslide dam volume follows a linear relation, which can beused to roughly estimate the dam formation possibility. However, the applicability of this correlationneeds to be validated in other regions. The decay (failure) rate of dams, defined here as the percentageof the number and area of landslide dams that have failed over time, shows that �25% of dams accountingfor �30% of total landslide dam area failed one week after the earthquake. These percentages increased to�60% within 1 month, and to >90% within 1 year. The geomorphometric parameters were analyzed,revealing power-law relations between landslide area and dam width, landslide source area and damarea, as well as lake area and lake volume. The inventory presented in this study will enrich the world-wide earthquake-induced landslide dam database and will also contribute to a better understanding ofthe post-earthquake dam decay.
� 2012 Elsevier Ltd. All rights reserved.
1. Introduction
Landslide dams are ubiquitous and often potentially dangerousresults of river-blocking landslides, and occur frequently in tecton-ically active mountains with narrow and steep valleys (Costa andSchuster, 1988). Strong earthquakes are among the prime trigger-ing factors of landslides and landslide dams (Keefer, 1984; Evanset al., 2011). Studies on earthquake-induced landslide inventories,and the analysis of their controlling factors, causal mechanism andsusceptibility or hazard assessment have been carried out by Jib-son et al. (2000), Lee et al. (2008), Owen et al. (2008), and Yinet al. (2010). The Mw 7.9 Wenchuan earthquake that struck China’sSichuan Province on 12 May 2008 triggered �60,000 landslides(Dai et al., 2011; Gorum et al., 2011), i.e. significantly in excess ofthose triggered by other recent earthquakes, such as the 1999
ll rights reserved.
rmation Science and Earthnschede, P.O. Box 217, The
. Analysis of landslide dams ind6.002
Chi-Chi earthquake (Mw 7.6; Khazai and Sitar, 2003) and the2005 Kashmir earthquake in Pakistan (Mw 7.6; Sato et al., 2007).
A number of landslide-dam inventories (Costa and Schuster,1988, 1991; Chai et al., 1995; Casagli and Ermini, 1999; Korup,2004; Hewitt, 2006, 2011; Hermanns et al., 2011; Weidinger,2011) have been created by compiling and reconstructing historiclarge events. However, there is hardly any work specifically onearthquake-induced landslide dams (Adams, 1981; Hancox et al.,1997; Evans et al., 2011), due to the scarcity of well-documentedinventories. Much previous work is scattered in local case studies(e.g. Dunning et al., 2006; Harp and Crone, 2006; Nash et al.,2008; Duman, 2009; Schneider, 2009) and mainly focused on thehistoric occurrences, instead of a systematic compilation of a com-prehensive dataset on size and stability. Little work exists on sys-tematical analysis of the regional distribution patterns and therelated controlling factors, the post-event failure rate and the lon-gevity of coseismic landslide dams. In this paper we aim to contrib-ute to the systematic analysis of earthquake-induced landslidedams. We present one of the first and largest complete event-basedlandslide-dam inventories, with detailed geomorphometric
uced by the 2008 Wenchuan earthquake. Journal of Asian Earth Sciences

2 X. Fan et al. / Journal of Asian Earth Sciences xxx (2012) xxx–xxx
parameters of landslide dams and quake lakes. Using detailed re-mote sensing interpretation and fieldwork, we created a uniquedatabase of >800 landslide dams triggered by the Wenchuan earth-quake. In order to reduce the potential for dam-break floods, theChinese army created artificial spillways in 32 of the dams usingexplosives and heavy machinery. Q. Xu et al. (2009) qualified thehazard of these 32 dams by considering dam height, dam compo-sition and maximum capacity of the landslide-dammed lakes.
To our best knowledge, this event-based inventory is unprece-dented in size, and provides a unique opportunity to study theimmediate post-earthquake dynamics of landslide dams, their geo-morphometric features and the spatial distribution pattern at theregional scale. We assess methods to quantify the mean failuretime of landslide dams and failure rate. A detailed understandingof the post-earthquake behavior of landslide dams will contributeto a better understanding of landslide dam formation andlongevity.
2. Tectonic and geomorphic setting
The devastating 2008 (Mw 7.9) Wenchuan earthquake with a fo-cal depth of 14–19 km occurred on the NE-trending Longmenshanthrust fault zone (LTFZ) that separates the Sichuan basin from thesteep and heavily dissected eastern margin of the Tibetan Plateau
Fig. 1. Topography of the study area (inset shows location). Major rivers are shown in bRiver (QR), and 7 smaller rivers (P1–P7) in the Pengguan Massif bounded by the whiPengguan fault; JGF: Jiangyou-Guanxian fault; QCF: Qingchuan fault; HYF: Huya fault; MJ(For interpretation of the references to colour in this figure legend, the reader is referre
Please cite this article in press as: Fan, X., et al. Analysis of landslide dams ind(2012), http://dx.doi.org/10.1016/j.jseaes.2012.06.002
in China. The LTFZ consists of three major sub-parallel faults: theWenchuan-Maowen (WMF), Yingxiu-Beichuan (YBF) and Peng-guan faults (PF) (Fig. 1). The coseismic rupture initiated near Ying-xiu town (31.061�N, 103.333�E) and propagated unilaterallytowards the northeast, generating a 240-km long surface rupturealong the Yingxiu Beichuan fault, and a 72-km long rupture alongthe Pengguan fault (X. Xu et al., 2009; Lin et al., 2009; Shen et al.,2009). Prior to the occurrence of the Wenchuan earthquake, Li et al.(2008) reported 66 earthquakes with Ms > 4.7 mainly concentratedon the Minjiang fault and the southern part of the Longmenshanfault zone since 638 AD. For instance, in 1933, the Diexi earthquake(Ms 7.5) was induced by the tectonic activity along the Minjiangfault zone.
The LTFZ runs through a mountain range with elevations rang-ing from 500 m in the Sichuan Basin to >5,000 m over a distance of�50 km, with tributaries of the Yangtze River flowing oblique orperpendicular from the north or northwest to south or southeast.Major river basins draining the study area include the Min andits tributaries, the Hei Shui and Tsakahao rivers in the west, as wellas the Jian, Fu and Baishui rivers in the east. Besides, a series ofsmall channels (P1–P7) drain the Pengguan Massif in front of theLongmenshan zone adjacent to the Sichuan Basin (Fig. 1). The low-er part of the Min river (also called Minjiang) turns southwest andflows along the Wenchuan-Maowen fault, and then crosses the
lue. The major catchments are: Min river (MJR), Jian river (JJR), Fu river (FJR), Qingte dashed line. WMF: Wenchuan-Maowen fault; YBF: Yingxiu-Beichuan fault; PF:F: Minjiang fault (after X. Xu et al., 2009). The epicenter location is from USGS, 2008.d to the web version of this article.)
uced by the 2008 Wenchuan earthquake. Journal of Asian Earth Sciences

X. Fan et al. / Journal of Asian Earth Sciences xxx (2012) xxx–xxx 3
Pengguan Massif to drain into the Sichuan Basin. The Hei Shui andTsakahao rivers join the Min river west of the Pengguan Massif.Deeply incised bedrock rivers are flanked by hillslopes commonly>30� steep within the LTFZ, and underlain by deformed Paleozoicsediments and metamorphic rocks, Mesozoic sediments, and Pre-cambrian crystalline and metamorphic rocks (Burchfiel et al.,1995; Kirby et al., 2003).
Some large-scale landslide dams and catastrophic dam breakfloods were reported in the study area. On June 1, 1786, a strongearthquake (M 7.75) occurred in the Kangding-Luding area, result-ing in a large landslide dam that blocked the Dadu river. Ten dayslater, the sudden breaching of the dam caused catastrophic down-stream flooding and 100,000 fatalities (Dai et al., 2005). Besides,the Diexi earthquake (Ms 7.5) of August 25, 1933 produced ninelarge landslide dams. Three of these dams (Dahaizi, Xiaohaizi,and Deixi, see Fig. 1) had a maximum height of 160 m above theMin River. After seven weeks the three lakes merged, and emptiedin a dam-break flood that rushed downstream for a distance of250 km, killing more than 2,500 people (Chai et al., 2000).
3. Landslide dam inventory
Event-based landslide inventories at a catchment- or regionalscale aim at mapping all slope failures following a single landslidetriggering episodes, such as an earthquake, intense rainstorms orsignificant snowmelt, and is essential for generating landslide sus-ceptibility and hazard maps (e.g. Kamp et al., 2008; Lee et al., 2008;van Westen et al., 2008 and Cui et al., 2009). Landslide susceptibil-ity and hazard assessments are often based on the assumption thatthe past is the key to the future, and therefore inventories of pastlandslides and their causal relationships can be used to predict fu-ture ones. For triggering earthquake events that have relativelylarge return periods, this creates the difficulty that it is very unli-kely that such an event occurred in recent times, and that the land-slides can be mapped. This is one of the reasons that earthquakeinduced landslide susceptibility assessment still is done usingfairly simple methods (Jibson et al., 2000).
3.1. Source data for landslide and landslide dam mapping
Gorum et al. (2011) described the method for mappinglandslides in the earthquake-affected Wenchuan region using 52
Fig. 2. Pre- and post-earthquake image
Please cite this article in press as: Fan, X., et al. Analysis of landslide dams ind(2012), http://dx.doi.org/10.1016/j.jseaes.2012.06.002
pre- and post-earthquake satellite images. The same data was usedin this study, complemented by EO-1 (10-m spatial resolution) ofJuly 2008 and ASTER images (15 m) of July, 2010 for mapping thelandslide dams and impounded lakes. Fig. 2 indicates the spatialcoverage of the satellite images. The pre-earthquake images con-sisted of multispectral data such as ASTER (15-m spatial resolu-tion) and ALOS AVNIR-2 (10 m) as well as panchromatic datafrom ALOS PRISM (2.5 m) and the Indian Cartosat-1 (2.5 m). Post-earthquake images included SPOT-5 (2.5 m), IKONOS (2.5 m), AS-TER, ALOS AVNIR-2 and PRISM data as well as a limited numberof aerial photos (0.3 m) which covered some large landslides (seethe Supplementary material Table S1). To precisely identify the po-sition of the landslide dams, the aerial photographs and satelliteimages were geometrically corrected using ground-control points(GCPs) measured in the field by DGPS and points selected fromthe 1:50,000-scale digital topographical maps. A pre-earthquakeDEM with 25 m � 25 m grid spacing was produced from 1:50,000scale digital topographical maps, by interpolating the contour lineswith contour intervals ranging between 10 m for low relief moun-tain areas and 20 m for high relief areas. According to the Chinesenational standard, the horizontal and vertical accuracy of the 25 mDEM at a 90% level of confidence is better than 20 m and 10 m,respectively.
3.2. Mapping and image interpretation
Landslide dams were mapped through visual interpretation bycomparing pre- and post-earthquake false color composites orpanchromatic images, assisted by field checks in accessible areascontaining about 60% of dams. The coseismic landslides are clearlyrecognizable from change detection of monoscopic images, usingimage characteristics such as tone, texture, pattern and shape.Although stereoscopic image interpretation would have been bet-ter for optimal landslide interpretation, it was not practically feasi-ble to generate stereo images for such an extensive area of about35,000 km2. Therefore, the stereo-based interpretation was carriedout for selected areas around large landslide dams. These wereidentified by diagnostic features such as a higher reflectance com-pared to the surrounding areas with vegetation cover; and geomor-phic features such as scarps; bare rock-fall talus; and asymmetrichummocky deposits featuring flow lobes, and transverse or longi-tudinal ridges. The resolution of the available images did not allow
coverage map. See also Table S1.
uced by the 2008 Wenchuan earthquake. Journal of Asian Earth Sciences

4 X. Fan et al. / Journal of Asian Earth Sciences xxx (2012) xxx–xxx
to map landslides and lakes that were less than 200 m2. We classi-fied landslide dams into two classes: (1) full blockage, where land-slide debris completely obstructed rivers, forming a lake and (2)partial blockage, where debris obstructed the river without form-ing an impoundment.
We mapped scar and deposit areas for landslides completely orpartly blocking the rivers, as well as any associated quake lakes.The area of quake lakes changes with time because of incomingwater and sediment discharge. Therefore, we compared the mul-ti-temporal images and assumed the largest area derived fromimages to represent the full lake area, and mapped the lakes beforeany artificial breaching was carried out. Some medium-resolutionimages precluded the distinction between landslide scar and de-posit areas (Fig. 3a and b). While the high-resolution images allowus to map in detail the initiation, transportation and accumulationarea for 64% of the landslide dams. Cross checking of pre- and post-earthquake images revealed that some pre-existing landslideswere enlarged or reactivated during the earthquake, while severaldams failed shortly after they were formed (Fig. 3c–f). We used pansharpening of high-resolution panchromatic images (PRISM) to in-crease the resolution of multispectral images (ALOS AVNIR-2) to al-low for more details, such as coarse grained rock slide deposits andthe linear bedding structure (Fig. 3 g and h).
Fig. 4 shows the distribution of the landslide dams in relation tothe overall landslide distribution mapped by Gorum et al. (2011).Fig. 5 shows the detailed inventory of landslide dams in a smallpart of the area indicated in Fig. 4. The types of river-blocking land-slides, following the terminology of Cruden and Varnes (1996) areindicated in the inset of Fig. 4. Rock slides are the most common
Fig. 3. Examples of medium (a and c) and high resolution images (b and d) showing landsZ), transportation (Trans-Z) and accumulation (Accu-Z) parts of damming landslides, wheimages. Complete and partial blockages as well as the reactivated landslides can be obsdissected by rivers already several hours after they were formed (e and f). A landslide d
Please cite this article in press as: Fan, X., et al. Analysis of landslide dams ind(2012), http://dx.doi.org/10.1016/j.jseaes.2012.06.002
type and account for 35% of the data, because the fractured rockslopes were found very susceptible to seismic shaking (Chigiraet al., 2010). The largest coseismic landslide caused by the Wench-uan earthquake (indicated in Fig. 4) was the Daguangbao landslide,with an area of 7.1 km2 and an estimated volume of 7.5 � 108 m3
(Huang et al., 2012). The Tangjiashan landslide dam had im-pounded the largest lake with an estimated maximum volume of3 � 108 m3. The dam is located �85 km upstream of Mianyang city,i.e. the second largest in Sichuan with a population of �1.2 million.The Chinese authorities decided to evacuate parts of Mianyang city(Liu et al., 2009), until the Tangjiashan landslide dam was artifi-cially breached, and the lake was drained.
Our inventory contains 828 river-blocking landslides; 501 (61%)caused complete damming of rivers, while 327 (39%) only partiallydammed the rivers. Partially damming landslides ranged in areafrom 768 m2 to 1.3 � 106 m2, which are slightly smaller than thecompletely damming landslides with areas ranging from1,249 m2 to 7.1 � 106 m2. Quake lake areas varied from 217 m2 to6.5 � 106 m2. The landslides triggered by the Wenchuan earth-quake cover an estimated total area of �811 km2 (Dai et al.,2011), and the damming landslides covered an area of �54 km2,which is �7% of the total landslide area.
4. Spatial distribution analysis of landslide dams
We estimated the spatial density of all coseismic landslides(Gorum et al., 2011) and landslide dams within a circular movingwindow of 1 km2 radius, obtaining maximum values of 54.1 land-slides/km2 and 4.5 landslide dams/km2 respectively (Fig. 6A and B).
lide dam polygon mapping. Detailed mapping allowed delineating the initiation (Ini-reas the landslides can only be mapped as single polygons using medium resolutionerved by comparing pre- and post-earthquake images. Some landslide dams weream can be formed by several landslides (e.g. �1; �2and � 3) jointly as shown in g.
uced by the 2008 Wenchuan earthquake. Journal of Asian Earth Sciences

Fig. 4. Distribution of landslide dams triggered by the Wenchuan earthquake, China. The high landslide density zone is defined by a landslide area density >0.1 km�2; alsoshown are epicenters of historical earthquakes (USGS, 2008) and historical Diexi landslide dams. White polygons are unmapped due to the presence of clouds and shadows inpost-earthquake imagery. The major fault and river names are indicated in Fig. 1.
X. Fan et al. / Journal of Asian Earth Sciences xxx (2012) xxx–xxx 5
A swath profile along the fault in a 240 km long and 25 km widerectangular zone (Fig. 6C) as well as four perpendicular 25 km by20 km long swaths (Fig. 6C1–C4) illustrate the mean normalizedpoint density of landslides and landslide dams. A swath profilewidth of 25 km was selected, because it represents the extent ofthe surface projection of the hanging wall of the Yingxiu-Beichuanfault. Fig. 6C shows the variation of mean normalized point densi-ties for landslides and landslide dams along the fault from SW toNE. Both follow the same trend, with peaks in the SW section fromYingxiu to Beichuan and near the fault tip near Qingchuan. Thelandslide-dam density peaks at several river junctions. Landslidedensity in sections of the fault with dominant thrust componentwas much higher than on sections with steep fault dip angles dom-inated by strike slip. Four swath cross sections (Fig. 6C1–C4) showthat peaks in landslide density near the drainage network coincidewith a high density of landslide dams. Both landslide and land-slide-dam densities are higher on the hanging wall of the Yingxi-Beichuan fault (YBF) than on the footwall. However, this differenceis not so apparent for the cross-section 2, where the footwall of YBFis also the hanging wall of the Penguan fault (PF).
Landslide dams are most abundant in a region with 7 steepwatersheds (named P1–P7, since they don’t have specific names)in the Pengguan Massif and the Min river (MJR) (Fig. 6B). Different
Please cite this article in press as: Fan, X., et al. Analysis of landslide dams ind(2012), http://dx.doi.org/10.1016/j.jseaes.2012.06.002
from the dams in the Pengguan Massif, most of dams (>90%) alongthe deeply incised Min River have mainly caused the partial block-age, since the Min river has large discharge and width. In general,landslide density directly affects landslide-dam density, althoughwe found that the correlation between landslide volume and riverwidth also played a key role. We estimated the landslide volumeby applying volume-area (V-A) scaling parameters using the equa-tion presented by Larsen et al. (2010), because it was obtainedfrom >4000 landslides and also took landslide material (soil or bed-rock) into account.
V ¼ 0:146A1:332 ð1Þ
The river width was estimated by the following scaling relation(Finnegan et al., 2005; Whittaker et al., 2007):
W � A3=8S�3=16 ð2Þ
where W is the channel width; A is drainage area (as a proxy for dis-charge, Q); and S is channel bed slope, which was extracted from theDEM following the method of Kirby et al. (2003). We analyzed thelandslide dam volume variation in the main catchments, and the re-sults are presented in Fig. 7, in which also the channel width of riv-ers is indicated (the red line in Fig. 7). Landslide dams that blockedthe wider rivers (e.g. Jian and Fu rivers) usually have larger
uced by the 2008 Wenchuan earthquake. Journal of Asian Earth Sciences

Fig. 5. An example showing landslide dam polygon mapping in an area indicated in Fig. 4.
6 X. Fan et al. / Journal of Asian Earth Sciences xxx (2012) xxx–xxx
volumes. An exception is for the Min river, where partial blockinglandslides were more abundant (Figs. 7 and 8). Narrow rivers witha small catchment area are more prone to be dammed, thus land-slide dam density is higher along the P1–P7 rivers (with a widthof <15 m and catchment area of 132–463 km2) than along the Jianand Fu rivers with a width of >30 m and catchment area of4100 km2 and 2400 km2, respectively (Fig. 7). The correlation be-tween river width and landslide dam volume follows a linear rela-tion (Fig. 8)
5. Analysis of geomorphometric parameters
A number of geomorphometric parameters of the landslidedams and associated quake lakes have been considered importantfor a first-order empirical assessment of dam stability and poten-tial hazard of dam-break floods (Fig. 9). We derived these attri-butes following the terminologies defined in previous work(Costa and Schuster, 1988; Dong et al., 2009).
Most of the parameters such as the landslide dam length, width,area and quake lake area, can be directly extracted from landslidedam and lake polygons, while others (e.g. landslide dam height andvolume as well as the quake lake depth and volume) require fur-ther calculations. We assumed the height difference between thehighest and the lowest point under the related lake polygon asthe lake depth, which was calculated based on the pre-earthquakeDEM with the vertical accuracy of 10 m. The dam height was con-sidered to be equal to the lake depth if the lake is full. The lake vol-ume was calculated using GIS-based volumetric algorithms (the‘‘TIN Polygon Volume’’ function). To reduce possible errors thatmight be caused by the DEM accuracy, we only calculated the vol-ume for 319 lakes with a depth more than 10 m and an areaexceeding 1000 m2. The results were validated using field mea-surement data of 24 lakes that were surveyed by a Chinese expertteam and the Chinese army directly after the earthquake (Q. Xuet al., 2009; Fig. 10). The lake volume was estimated by field mea-sured lake area and average lake depth by using the handheld GPS,
Please cite this article in press as: Fan, X., et al. Analysis of landslide dams ind(2012), http://dx.doi.org/10.1016/j.jseaes.2012.06.002
Laser distance finder, and boat with sonar (or rope and weight)(Zhang, 2010).
The calculated and field measured lake volumes with logarith-mic axes are shown in the inset of Fig. 10, which show a good fit.To better underpin the contribution of smaller lakes, we excludedthe Tangjiashan lake from Fig. 10. The results demonstrate that ourlake volume calculations show a good match with the field mea-surement data (R2 = 0.89). For the Tangjiashan dam, the calculateddam height and lake volume is 115 m and �3.5 � 108 m3, respec-tively, which are close to the field measurements with the damheight ranging from 82 to 124 m and the lake volume of3.0 � 108 m3. The calculated volumes of large lakes are more vari-able than those of smaller lakes, since slight changes in lake depthwill lead to large volumetric changes.
Based on our inventory, we extracted the geomorphometricparameters from the full blockages indicated in Fig. 9 and analyzedsome empirical relationships between these parameters as shownin Fig. 11. The results show a power-law relationship (R2 = 0.72)between the landslide area and the resulting landslide dam widthalong the valley, implying that the landslide area is a good indica-tor for predicting dam width (Fig. 11A). A total length of �76 km ofriver reaches was directly covered by damming landslide debris.Fig. 11B shows that the landslide source (initiation) area can beused to estimate the landslide dam area. The relation betweenthe quake lake volume and the dam height is less clear(R2 = 0.53), and can be related to several additional factors suchas the local valley morphometry, upper catchment area and terrain(Fig. 11C). The empirical scaling relationship between lake area andvolume that we constrained by field measurements is clear, show-ing a positive power-law relation (R2 = 0.8), with the VL varyingover 6 magnitude orders from 103 m3 to 109 m3 (Fig. 11D). The lakevolume is an essential parameter for dam failure hazard and riskassessment, which has been used in various empirical equationsto predict dam-break flood peak discharge (Evans, 1986; Costaand Schuster, 1988; Walder and O’Connor, 1997). Therefore, therelation in Fig. 11D can also be applied in similar regions for a rapid
uced by the 2008 Wenchuan earthquake. Journal of Asian Earth Sciences
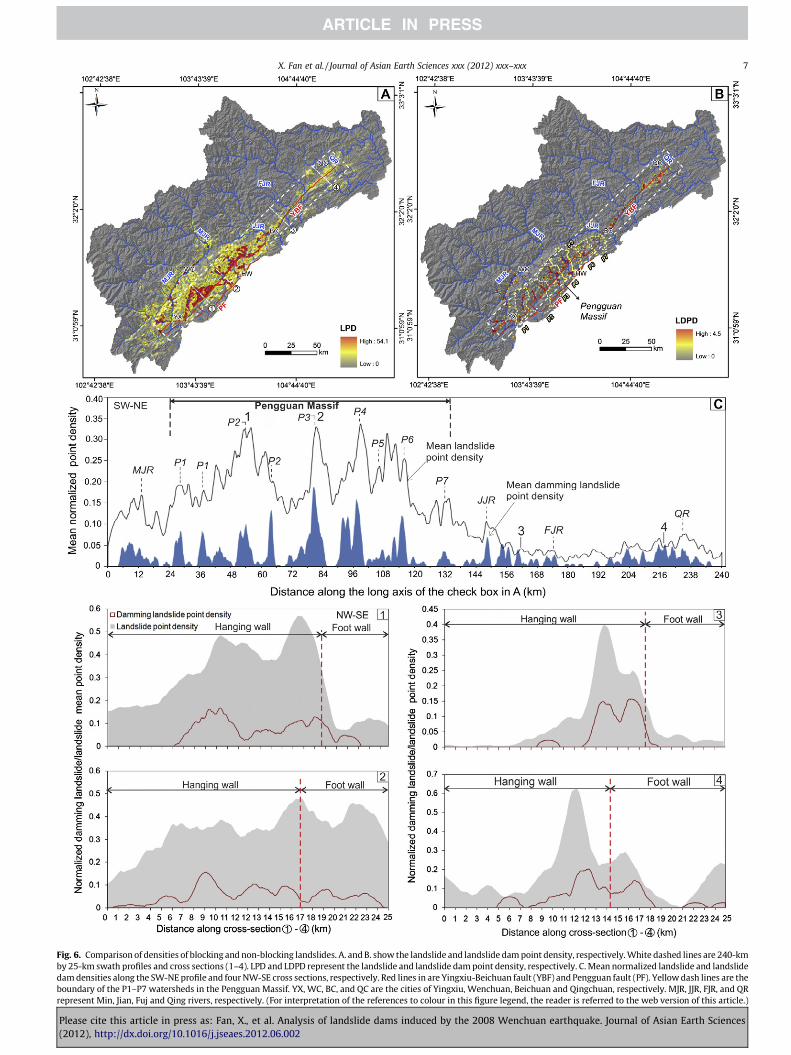
Fig. 6. Comparison of densities of blocking and non-blocking landslides. A. and B. show the landslide and landslide dam point density, respectively. White dashed lines are 240-kmby 25-km swath profiles and cross sections (1–4). LPD and LDPD represent the landslide and landslide dam point density, respectively. C. Mean normalized landslide and landslidedam densities along the SW-NE profile and four NW-SE cross sections, respectively. Red lines in are Yingxiu-Beichuan fault (YBF) and Pengguan fault (PF). Yellow dash lines are theboundary of the P1–P7 watersheds in the Pengguan Massif. YX, WC, BC, and QC are the cities of Yingxiu, Wenchuan, Beichuan and Qingchuan, respectively. MJR, JJR, FJR, and QRrepresent Min, Jian, Fuj and Qing rivers, respectively. (For interpretation of the references to colour in this figure legend, the reader is referred to the web version of this article.)
X. Fan et al. / Journal of Asian Earth Sciences xxx (2012) xxx–xxx 7
Please cite this article in press as: Fan, X., et al. Analysis of landslide dams induced by the 2008 Wenchuan earthquake. Journal of Asian Earth Sciences(2012), http://dx.doi.org/10.1016/j.jseaes.2012.06.002

Fig. 7. Box and whisker plot of landslide dam volume in major catchments with comparison of river width. The spectrum shows the variation of mean landslide dam pointdensity along the SW-NE swath profile in Fig. 6.
Fig. 8. Correlation between the mean landslide dam volume in different catch-ments (in Fig. 7) and the river width. Because most dams are partial blockage withcomparatively small volume regarding to the river width, the Min river catchmentappears to be an outlier.
8 X. Fan et al. / Journal of Asian Earth Sciences xxx (2012) xxx–xxx
estimation of lake volume, and the related hazard evaluation andmitigation.
6. Analysis of the failure rate of landslide dams
Most landslide dams, particularly those that caused only partialobstruction, were dissected shortly after the earthquake. We definethe failure rate of full-blockage dams as the percentage of the damsthat have failed over the time intervals bracketed by multi-tempo-ral remote sensing data (Table 1; Fig. 12). The percentage can beexpressed based on landslide area or on the number of landslides.An analysis of landslide dams that had remained intact as revealedfrom ASTER images dated July 2010 and covering nearly the fullstudy area, indicates that 23 of the 501 (4.6%) completely river-blocking landslide dams were still in place 26 months after theearthquake. These 23 landslide dams accounted for 20% of the total
Please cite this article in press as: Fan, X., et al. Analysis of landslide dams ind(2012), http://dx.doi.org/10.1016/j.jseaes.2012.06.002
landslide dam area, and were mainly formed by complex deep-seated slope failures. Computation of the failure rate in the inter-mediate periods was limited to imagery covering the Beichuanand Pengzhou regions (Table 1; Table S1). Altogether, some 60%of dams, constituting �43% of the total landslide dam area, failedwithin 1 month after the earthquake, showing a sharp decreasefrom 501 to 215 intact dams (Table 1; Fig. 12). This decrease lev-eled off 2 months after the earthquake. Three heavy rainstormshit the earthquake region in the first 3 years after the earthquake.One event occurred 4 months after the earthquake, on September24, 2008, triggering 72 debris flows in the epicenter region (Tanget al., 2009). In the Beichuan area, 56 debris flows and reactivatedlandslides were detected through cross-checking remote sensingimages. Three of them blocked rivers, while the others delivereda large amount of sediments to the rivers. Many of the coseismiclandslide dams failed during or after this rainfall event. Anotherrainfall event occurred in 2009, but its effects are poorly docu-mented. A rainstorm on 12–14 August, 2010 triggered 11 debrisflows in Qingping, Mianzhu and about 50 debris flows in Dujiang-yan, forming new dams. One of the dams in Dujiangyan caused theinundation of the relocation site for the new town of Yingxiu.Based on this information, three triangle symbols were plotted inFig. 12 to show the three post-earthquake rainfall events.
7. Discussion and conclusions
The temporary or permanent blockage of streams by landslidesis a characteristic secondary hazard in mountainous areas affectedby strong earthquakes or major rainfall events. It is also possible tohappen without recognized triggers, i.e. the Mayunmarca landslidedam occurred in 1974, Peru (Hutchinson and Kojan, 1975). Suchimpoundments may pose a large risk to downstream areas giventhe potential for catastrophic lake outbreak flooding. Our inventoryof landslide dams caused by the Wenchuan earthquake is unprec-edented in that it records abundant river blockage following a sin-gle regional landslide triggering event. It presents the spatialdistribution pattern of landslide dams with comparison to all co-seismic landslides. They are most abundant in the Pengguan mas-sif, along the thrusting part of the Yingxiu-Beichuan fault (YBF),due to following reasons:
uced by the 2008 Wenchuan earthquake. Journal of Asian Earth Sciences

Fig. 9. Sketch of geomorphometric properties of landslide dam and impounded lakes.
Fig. 10. Validation of the quake-lake volume estimates using field measurement data. Inset has logarithmic axes for better displaying the extreme dimensions of theTangjiashan dam.
X. Fan et al. / Journal of Asian Earth Sciences xxx (2012) xxx–xxx 9
(1) Steep and rough terrain with hillslope inclinations >30� areprone to generate landslides. Fig. 13 depicts the elevationvariation along the Yingxiu-Beichuan fault, showing thatthe mean elevation in the Pengguan Massif is about 400 mhigher than that in the northeast from Beichuan to the endof the fault. This difference contributes to the higher land-slide and landslide dam densities in the Pengguan massif.
Please cite this article in press as: Fan, X., et al. Analysis of landslide dams ind(2012), http://dx.doi.org/10.1016/j.jseaes.2012.06.002
(2) The Pengguan Massif is composed of fragmented Precam-brian crystalline gneisses and granitoids separated from aseries of Triassic mudstones by the Yingxiu-Beichuan fault(Chigira et al., 2010). Field investigation revealed that thepervasively fragmented rocks favor landslide (dam) occur-rences. Most of large rock avalanches occurred there inintensely jointed granite rock masses.
uced by the 2008 Wenchuan earthquake. Journal of Asian Earth Sciences

Fig. 11. (A) Plot of landslide dam width along valley (WD) versus landslide dam area (AD); (B) Plot of landslide source area (As) versus landslide dam area (AD); (C) Plot of quakelake volume (VL) versus landslide dam height (HD); (D) Plot of quake lake volume (VL) versus lake area (AL). Filled circles in D. represent lakes with flied measured volume asshown in Fig. 10. Thick black lines are best fit obtained by the Reduced Major Axis Regression (RMA). Dashed grey lines show 95% confidence intervals.
Table 1Summary of multi-temporal remote sensing data used for assessing the full-blockage landslide dam failure rate.
Data covered region Date Sensor Resolution(m)
Number of faileddams
Failure rate
Percentage of damnumber (%)
Percentage of damarea (%)
Around Beichuan area, including 65landslide dams
May 18,2008
ALOS PRISM/Aerialphotos
2.5/0.3 16 24.60 29.80
October 13,2008
SPOT-5 2.5 61 93.80 78.60
January 24,2009
CARTOSAT-1 2.5 62 95.40 79.80
July 19, 2010 ASTER 15 62 95.40 79.80Pengzhou area, including 77 landslide
damsJune 4, 2008 ALOS AVNIR-2 10 44 57.10 42.30
July 8, 2008 EO-1 10 59 76.60 57.20
10 X. Fan et al. / Journal of Asian Earth Sciences xxx (2012) xxx–xxx
(3) The changes of fault geometry and slip rate from the south-west to the northeast were quantified by GPS and InSAR data(Yarai et al., 2008; Hao et al., 2009), showing that in the
Please cite this article in press as: Fan, X., et al. Analysis of landslide dams ind(2012), http://dx.doi.org/10.1016/j.jseaes.2012.06.002
Pengguan Massif the fault plane dips moderately to thenorthwest, becoming nearly vertical in the northeast (fromBeichuan to Qingchuan region), associated with a change
uced by the 2008 Wenchuan earthquake. Journal of Asian Earth Sciences

Fig. 12. Decay of the number of remaining intact full-blockage landslide dams with time.
Fig. 13. Elevation profile along the Yingxiu-Beichuan fault. The dashed lines represent the mean elevation in the Pengguan Massif and the northeast part of the fault. Greyboxes delimit the ±1 standard deviation (SD) from the mean.
X. Fan et al. / Journal of Asian Earth Sciences xxx (2012) xxx–xxx 11
from predominantly thrusting to strike-slip motion. Highfault-slip rate (large seismic energy) concentrated in thethrusting part of the fault in the Penguan Massif (Gorumet al., 2011).
(4) Deeply incised narrow valleys (P1–P7 in Fig. 13) with smallcatchment areas varying from 132 to 463 km2 were readilyblocked.
The correlation between landslide dam volume and river widthrelies on the empirical scaling relationships we used, although thechanges of the scaling relationship will not change the relativecomparison of landslide dam volume and river width in differentcatchments. The landslide volume-area scaling relationship weused from Larsen et al. (2010) takes the landslide type and materialinto account, thus was considered appropriate. The one for esti-mating the river width (Eq. 2) is also considered to be most suit-able for the rivers in the tectonically active mountainous regionscompared to the conventional scaling relationship (W � A0.5)(Finnegan et al., 2005). The correlation between river width and
Please cite this article in press as: Fan, X., et al. Analysis of landslide dams ind(2012), http://dx.doi.org/10.1016/j.jseaes.2012.06.002
landslide dam volume we extracted from this study follows a lin-ear relation, demonstrating that damming of wide rivers generallyrequires landslides with large volume. However, the applicabilityof this correlation is still unknown before being validated in otherregions.
To put our analysis of dam longevity and decay into a broadercontext, we compiled three databases as shown in Fig. 14. The datafrom Costa and Schuster (1988), and Ermini and Casagli (2003)comprise 73 and 205 worldwide historical cases, respectively.Fig. 14 shows that the Wenchuan earthquake database fits to thefunction:
Pf ¼ 0:973e�10:88=tðR2 ¼ 0:97Þ ð3Þ
It demonstrates the relationship between cumulative percent offailed landslide dams (Pf) with time in days (t). Fig. 14 indicates thatabout 30% of dams that reportedly failed did so within one weekafter their formation, while >90% failed within a year. This figurealso suggests that the survival time of landslide dams induced by
uced by the 2008 Wenchuan earthquake. Journal of Asian Earth Sciences

Fig. 14. Longevity of full-blockage dams with comparison of two worldwide datasets.
12 X. Fan et al. / Journal of Asian Earth Sciences xxx (2012) xxx–xxx
the Wenchuan earthquake is generally shorter than that of theother two databases, most probably because the Wenchuan data-base contains a larger amount of small landslide dams than theother two. Besides, the landslide dam survival time is controlledby, among others, the geomorphometric parameters, dam composi-tion materials, the lake capacity and the discharge of the inflowingstream (Weidinger, 2011).
The Wenchuan earthquake provided a unique opportunity togenerate an event-based landslide dam inventory of 828 individuallandslide dams, of which 501 completely blocked rivers. This veryrare occasion provides insights on the spatio-temporal clusteringand decay of coseismic landslide dams. We focused on the imme-diate post-earthquake dynamics of landslide dams at the regionalscale and longevity of the landslide dams in a global context, be-cause they are extremely important for hazard assessment andmitigation. Further research is directed towards analyzing the seis-mic, geological, topographic and hydrological factors that deter-mine the occurrence of landslide dams, with the ultimate aim tocome to a conceptual model for landslide dam susceptibility andhazard assessment. Besides, the long-term effect of landslide damson valley morphology and sediment budgets is another aspect thatdeserves further research attention. The deposition of lacustrine,alluvial, or deltaic sediments in reservoirs can result in changesof stream gradient, surface morphology, and superficial geologyupstream from the dam, whereas dam-break floods or debris flowmay rework downstream reaches.
Acknowledgements
This research was financially supported by the National NaturalScience Foundation of the People’s Republic of China (41130745)and the Creative Team Program of Ministry of Education of China(IRT0812), in collaboration with the United Nations University –ITC Centre for Spatial Analysis and Disaster Risk Management ofthe University of Twente, the Netherlands. We acknowledge Prof.Oliver Korup for his valuable comments and editing of the manu-script. Comments by Prof. Alexander Strom, Prof. Theo van Aschand other anonymous reviewers are very helpful on improving ear-lier drafts. We appreciate that the Japan Aerospace ExplorationAgency (JAXA), GeoEye foundation, and Indian Space ResearchOrganisation (ISRO) for providing the data for this research.
Please cite this article in press as: Fan, X., et al. Analysis of landslide dams ind(2012), http://dx.doi.org/10.1016/j.jseaes.2012.06.002
Appendix A. Supplementary material
Supplementary data associated with this article can be found, inthe online version, at http://dx.doi.org/10.1016/j.jseaes.2012.06.002.
References
Adams, J., 1981. Earthquake-dammed lakes in New Zealand. Geological Society ofAmerica, Geology 9, 215–219.
Burchfiel, B., Zhiliang, C., Yuping, L., Royden, L., 1995. Tectonic of the Longmen Shanand adjacent regions, central China. International Geology Review 37, 661–735.
Casagli, N., Ermini, L., 1999. Geomorphic analysis of landslide dams in the NorthernApennine. Transactions of the Japanese Geomorphological Union 20, 219–249.
Chai, H., Liu, H., Zhang, Z., 1995. The catalog of Chinese landslide dam events.Journal of Geological Hazards and Environment Preservation 6 (4), 1–9 (InChinese).
Chai, H., Liu, H., Zhang, Z., Xu, Z., 2000. The distribution, causes and effects ofdamming landslides in China. Journal of the Chengdu Institute of Technology27, 302–307.
Chigira, M., Xu, X., Inokuchi, T., Wang, G., 2010. Landslides induced by the 2008Wenchuan earthquake, Sichuan, China. Geomorphology 118 (3–4), 225–238.
Costa, J.E., Schuster, R.L., 1988. The formation and failure of natural dams.Geological Society of America Bulletin 100, 1054–1068.
Costa, J.E., Schuster, R.L., 1991. Documented historical landslide dams from aroundthe world. US Geological Survey Open-File Report 91-239, p. 486.
Cruden, D.M., Varnes, D.J., 1996. Landslide types and processes. In: Turner, A.K.,Schuster, R.L. (Eds.), Landslides, Investigation and Mitigation. Special Report,vol. 247. Transportation Research Board, National Research Council, pp. 36–75.
Cui, P., Zhu, Y., Han, Y., Chen, X., Zhuang, J., 2009. The 12 May Wenchuanearthquake-induced landslide lakes: distribution and preliminary riskevaluation. Landslides 6, 209–223.
Dai, F., Lee, C., Deng, J., Tham, L.G., 2005. The 1786 earthquake-triggered landslidedam and subsequent dam-break flood on the Dadu River, southwestern China.Geomorphology 65, 205–221.
Dai, F., Xu, C., Yao, X., Xu, L., Tu, X., Gong, Q., 2011. Spatial distribution of landslidestriggered by the 2008 Ms 8.0 Wenchuan earthquake, China. Journal of AsianEarth Sciences 40 (4), 883–895.
Dong, J.J., Tung, Y.H., Chen, C.C., Liao, J.J., Pan, Y.W., 2009. Discriminant analysis ofthe geomorphic characteristics and stability of landslide dams. Geomorphology110, 162–171.
Duman, T.Y., 2009. The largest landslide dam in Turkey: Tortum landslide.Engineering Geology 104, 66–79.
Dunning, S.A., Rosser, N.J., Petley, D.N., Massey, C.R., 2006. Formation and failure ofthe Tsatichhu landslide dam, Bhutan. Landslides 3, 107–113.
Ermini, L., Casagli, N., 2003. Prediction of the behavior of landslide dams using ageomorphological dimensionless index. Earth Surface Processes and Landforms28, 31–47.
Evans, S.G., 1986. The maximum discharge of outburst floods caused by thebreaching of man-made and natural dams. Canadian Geotechnical Journal 23,385–387.
uced by the 2008 Wenchuan earthquake. Journal of Asian Earth Sciences

X. Fan et al. / Journal of Asian Earth Sciences xxx (2012) xxx–xxx 13
Evans, S.G., Delaney, K.B., Hermanns, R.L., Strom, A., Scarascia-Mugnozza, G., 2011.The formation and behaviour of natural and artificial rockslide dams;implications for engineering performance and hazard management. In: Evans,S.G., Hermanns, R.L., Strom, A.L., Scarascia Mugnozza, G. (Eds.), Natural andartificial rockslide dams. Lecture Series in Earth Sciences. Springer, Berlin, pp. 1–76.
Finnegan, N.j., Roe, G., Montgomery, D.R., Hallet, B., 2005. Controls on the channelwidth of rivers: implications for modeling fluvial incision of bedrock. Geology33 (3), 229–232.
Gorum, T., Fan, X., van Westen, C.J., Huang, R., Xu, Q., Tang, C., Wang, G., 2011.Distribution pattern of earthquake-induced landslides triggered by the 12 May2008 Wenchuan earthquake. Geomorphology 133, 152–167.
Hancox, G.T., Perrin, N.D., Dellow, G.D., 1997. Earthquake-induced landsliding inNew Zealand and implications for MM intensity and seismic hazard assessment.Lower Hutt: Institute of Geological and Nuclear Sciences Client Report 43601BPrepared for Earthquake Commission Research Foundation, 85 pp.
Hao, K., Si, H., Fujiwara, H., Ozawa, T., 2009. Coseismic surface-ruptures and crustaldeformations of the 2008 Wenchuan earthquake Mw 7.9, China. GeophysicalResearch Letters 36 (11), 2–6.
Harp, E.L., Crone, A.J., 2006. Landslides Triggered by the October 8, 2005, PakistanEarthquake and Associated Landslide-Dammed Reservoirs. US GeologicalSurvey Open-file Report: 2006-1052, p. 13.
Hermanns, R.L., Folguera, A., Penna, I., Fauqué, L., Niedermann, S., 2011. Landslidedams in the central Andes of Argentina (Northern Patagonia and the ArgentineNorthwest). In: Evans, S.G., Hermanns, R.L., Strom, A.L., Scarascia Mugnozza, G.(Eds.), Natural and Artificial Rockslide Dams. Lecture Series in Earth Sciences.Springer, Berlin, pp. 147–176.
Hewitt, K., 2006. Disturbance regime landscapes: mountain drainage systemsinterrupted by large rockslides. Progress in Physical Geography 30, 365–393.
Hewitt, K., Gosse, J., Clague, J.J., 2011. Rock avalanches and the pace of latequaternary development of river valleys in the Karakoram Himalaya. GeologicalSociety of America Bulletin 123, 1836–1850.
Huang, R., Pei, X., Fan, X., Zhang, W., Li, S., Li, B., 2012. The characteristics and failuremechanism of the largest landslide triggered by the Wenchuan earthquake,May 12, 2008, China. Landslides 9, 131–142.
Hutchinson, J.N., Kojan, E., 1975. The Mayunmarca Landslide of 25th April, 1974,Peru. UNESCO Report Serial No. 3124 Paris, UNESCO.
Jibson, R.W., Harp, E.L., Michael, J.A., 2000. A method for producing digitalprobabilistic seismic landslide hazard maps. Engineering Geology 58, 271–289.
Kamp, U., Growley, B.J., Khattak, G.A., Owen, L.A., 2008. GIS-based landslidesusceptibility mapping for the 2005 Kashmir earthquake region.Geomorphology 101, 631–642.
Keefer, D.K., 1984. Landslides caused by earthquakes. Geological Society of AmericaBulletin 95, 406–421.
Khazai, B., Sitar, N., 2003. Evaluation of factors controlling earthquake-inducedlandslides caused by Chi-Chi earthquake and comparison with the Northridgeand Loma Prieta events. Engineering Geology 71, 79–95.
Kirby, E., Whipple, K.X., Tang, W., Chen, Z., 2003. Distribution of active rock upliftalong the eastern margin of Tibetan Plateau: inferences from bedrock channellongitudinal profiles. Journal of Geophysical Research 108, 1–24.
Korup, O., 2004. Geomorphometric characteristics of New Zealand landslide dams.Engineering Geology 73, 13–35.
Larsen, I.J., Montgomery, D.R., Korup, O., 2010. Landslide erosion controlled byhillslope material. Nature Geoscience 3, 247–251.
Lee, C.T., Huang, C.C., Lee, J.F., Pan, K.L., Lin, M.L., Dong, J.J., 2008. Statistical approachto earthquake-induced landslide susceptibility. Engineering Geology 100 (1–2),43–58.
Please cite this article in press as: Fan, X., et al. Analysis of landslide dams ind(2012), http://dx.doi.org/10.1016/j.jseaes.2012.06.002
Li, X., Zhou, Z., Yu, H., Wen, R., Huang, M., Zhou, Y., Cu, J., 2008. Strong motionobservations and recordings from the great Wenchuan earthquake. EarthquakeEngineering and Engineering Vibration 7 (3), 235–246.
Lin, A., Ren, Z., Jia, D., Wu, X., 2009. Co-seismic thrusting rupture and slipdistribution produced by the 2008 Mw 7.9 Wenchuan earthquake, China.Tectonophysics 471, 203–215.
Liu, N., Zhang, J., Lin, W., Cheng, W., Chen, Z., 2009. Draining Tangjiashan BarrierLake after Wenchuan earthquake and the flood propagation after the dambreak. Science in China Series E-technological Sciences 52 (4), 801–809.
Nash, T., Bell, D., Davies, T., Nathan, S., 2008. Analysis of the formation and failure ofRam Creek landslide dam, South Island, New Zealand. New Zealand Journal ofGeology & Geophysics 51, 187–193.
Owen, L.A., Kamp, U., Khattak, G.A., Harp, E.L., Keefer, D.K., Bauer, M.A., 2008.Landslides triggered by the 8 October 2005 Kashmir earthquake.Geomorphology 94 (1–2), 1–9.
Sato, H.P., Hasegawa, H., Fujiwara, S., Tobita, M., Koarai, M., Une, H., Iwahashi, J.,2007. Interpretation of landslide distribution triggered by the 2005 NorthernPakistan earthquake using SPOT 5 imagery. Landslides 4, 113–122.
Schneider, J.F., 2009. Seismically reactivated Hattian slide in Kashmir, NorthernPakistan. Journal of Seismology 13 (3), 387–398.
Shen, Z., Sun, J., Zhang, P., Wan, Y., Wang, M., Bürgmann, R., Zeng, Y., Gan, W., Liao,H., Wang, Q., 2009. Slip maxima at fault junctions and rupturing of barriersduring the 2008 Wenchuan earthquake. Nature Geoscience 2, 718–724.
Tang, C., Zhu, J., Li, W., Liang, J., 2009. Rainfall-triggered debris flow following theWenchuan earthquake. Bulletin of Engineering Geology and the Environment,68, 187–194.
USGS (US Geological Survey), 2008. Magnitude 7.9-Eastern Sichuan, China, 2008May 12 06:28:01UTC. <http://earthquake.usgs.gov/earthquakes/eqinthenews/2008/us2008ryan/>.
van Westen, C.J., Castellanos, E., Kuriakose, S.L., 2008. Spatial data for landslidesusceptibility, hazard, and vulnerability assessment: an overview. EngineeringGeology 102, 112–131.
Walder, J.S., O’Connor, J.E., 1997. Methods for predicting peak discharge of floodscaused by failure of natural and constructed earthen dams. Water ResourcesResearch 33, 2337–2348.
Weidinger, J.T., 2011. Stability and life span of landslide dams in the Himalayas(India, Nepal) and the Qin Ling Mountains (China). In: Evans, S.G., Hermanns,R.L., Strom, A.L., Scarascia Mugnozza, G. (Eds.), Natural and Artificial RockslideDams. Lecture Series in Earth Sciences. Springer, Berlin, pp. 243–278.
Whittaker, A.C., Cowie, P.A., Attal, M., Tucker, G.E., Roberts, G.P., 2007. Bedrockchannel adjustment to tectonic forcing: implications for predicting riverincision rates. Geology 35 (2), 103–106.
Xu, Q., Fan, X., Huang, R., van Westen, C.J., 2009a. Landslide dams triggered by theWenchuan earthquake, Sichuan Province, south west China. Bulletin ofEngineering Geology and the Environment, 68 (3), 373–386.
Xu, X., Wen, X., Yu, G., Chen, G., Klinger, Y., Hubbard, J., Shaw, J., 2009b. Coseismicreverse- and oblique-slip surface faulting generated by the 2008 Mw 7.9Wenchuan earthquake, China. Geology 37, 515–518.
Yarai, H., Nishimura, T., Tobita, M., Amagai, T., Suzuki, A., Suito, H., Ozawa, S.,Imakiire, T., Masaharu, H., 2008. A fault model of the 2008 Wenchuanearthquake estimated from SAR measurements. 7th ASC Meeting, X2–040.
Yin, J., Chen, J., Xu, X., Wang, X., Zheng, Y., 2010. The characteristics of the landslidestriggered by the Wenchuan Ms 8.0 earthquake from Anxian to Beichuan. Journalof Asian Earth Sciences 37, 452–459.
Zhang, X.J., 2010. Preliminary study on hydrological emergency monitoring schemefor dammed lakes. Automation in Water Recourses and Hydrology 1 (1), 1–5 (inChinese).
uced by the 2008 Wenchuan earthquake. Journal of Asian Earth Sciences
Copyright © 2022 FDOKUMEN