Reliability assessment of granular filters in embankment dams
19
INTERNATIONAL JOURNAL FOR NUMERICAL AND ANALYTICAL METHODS IN GEOMECHANICS Int. J. Numer. Anal. Meth. Geomech., 2006; 30:1019–1037 Published online 21 April 2006 in Wiley InterScience (www.interscience.wiley.com). DOI: 10.1002/nag.511 Reliability assessment of granular filters in embankment dams Roberto Mı´nguez 1,2,n,y,k,nn , Fernando Delgado 3,z,yy , Ignacio Escuder 4,},zz and Manuel G. de Membrillera 4,},}} 1 Department of Applied Mathematics, University of Castilla-La Mancha, 13071 Ciudad Real, Spain 2 Department of Social Statistics, Cornell University, 14853-3901 Ithaca, NY, U.S.A. 3 Department of Structural Mechanics and Hydraulic Engineering, University of Granada, 18071 Granada, Spain 4 Department of Hydraulic and Environmental Engineering, Polytechnical University of Valencia, 46071 Valencia, Spain SUMMARY Empirical criteria have been used successfully to design filters of most embankment large dam projects throughout the world. However, these empirical rules are only applicable to a particular range of soils tested in laboratory and do not take into account the variability of the base material and filter particle sizes. In addition, it is widely accepted that the safety of fill dams is mainly dependent on the reliability of their filter performance. The work herein presented consists in a new general method for assessing the prob- ability of fulfilling any empirical filter design criteria accounting for base and filter heterogeneity by means of first-order reliability methods (FORM), so that reliability indexes and probabilities of fulfilling any particular criteria are obtained. This method will allow engineers to estimate the safety of existing filters in terms of probability of fulfilling their design criteria and might also be used as a decision tool on sampling needs and material size tolerances during construction. In addition, sensitivity analysis makes possible to analyse how reliabilities are influenced by different sources of input data. Finally, in case of a portfolio risk assessment, this method will allow engineers to compare the safety of several existing dams in order to prioritize safety investments and it is expected to be a very useful tool to evaluate probabilities of failure due to internal erosion. Copyright # 2006 John Wiley & Sons, Ltd. KEY WORDS: embankment dams; erosion; filtration; granular filters; level II (FORM) methods; risk assessment; system reliability Contract/grant sponsor: Ministry of Science and Education; contract/grant numbers: BIA2003-08327, BIA2005-07802-C02-01 Contract/grant sponsor: Junta de Comunidades de Castilla-La Mancha; contract/grant number: PBI-05-053 Contract/grant sponsor: University of Castilla-La Mancha; contract/grant number: 0111001321 Program 541 A Contract/grant sponsor: Hydrographic Confederation of the Guadalquivir River (Spanish Ministry of Environment) Contract/grant sponsor: Fulbright Commission Received 20 February 2006 Accepted 21 February 2006 Copyright # 2006 John Wiley & Sons, Ltd. y E-mail: [email protected] z E-mail: [email protected] } E-mail: [email protected] } E-mail: [email protected] k Assistant Professor. nn FulBright Scholar. yy Associate Professor. n Correspondence to: Roberto Mı´nguez, Department of Applied Mathematics, University of Castilla-La Mancha, 13071 Ciudad Real, Spain. zz Professor. }} Ph.D. Student.
Transcript of Reliability assessment of granular filters in embankment dams
INTERNATIONAL JOURNAL FOR NUMERICAL AND ANALYTICAL METHODS IN GEOMECHANICSInt. J. Numer. Anal. Meth. Geomech., 2006; 30:1019–1037Published online 21 April 2006 in Wiley InterScience (www.interscience.wiley.com). DOI: 10.1002/nag.511
Reliability assessment of granular filters in embankment dams
Roberto Mınguez1,2,n,y,k,nn, Fernando Delgado3,z,yy, Ignacio Escuder4,},zz
and Manuel G. de Membrillera4,},}}
1Department of Applied Mathematics, University of Castilla-La Mancha, 13071 Ciudad Real, Spain2Department of Social Statistics, Cornell University, 14853-3901 Ithaca, NY, U.S.A.
3Department of Structural Mechanics and Hydraulic Engineering, University of Granada, 18071 Granada, Spain4Department of Hydraulic and Environmental Engineering, Polytechnical University of Valencia, 46071 Valencia, Spain
SUMMARY
Empirical criteria have been used successfully to design filters of most embankment large dam projectsthroughout the world. However, these empirical rules are only applicable to a particular range of soilstested in laboratory and do not take into account the variability of the base material and filter particle sizes.In addition, it is widely accepted that the safety of fill dams is mainly dependent on the reliability of theirfilter performance. The work herein presented consists in a new general method for assessing the prob-ability of fulfilling any empirical filter design criteria accounting for base and filter heterogeneity by meansof first-order reliability methods (FORM), so that reliability indexes and probabilities of fulfilling anyparticular criteria are obtained. This method will allow engineers to estimate the safety of existing filters interms of probability of fulfilling their design criteria and might also be used as a decision tool on samplingneeds and material size tolerances during construction. In addition, sensitivity analysis makes possible toanalyse how reliabilities are influenced by different sources of input data. Finally, in case of a portfolio riskassessment, this method will allow engineers to compare the safety of several existing dams in order toprioritize safety investments and it is expected to be a very useful tool to evaluate probabilities of failuredue to internal erosion. Copyright # 2006 John Wiley & Sons, Ltd.
KEY WORDS: embankment dams; erosion; filtration; granular filters; level II (FORM) methods; riskassessment; system reliability
Contract/grant sponsor: Ministry of Science and Education; contract/grant numbers: BIA2003-08327, BIA2005-07802-C02-01
Contract/grant sponsor: Junta de Comunidades de Castilla-La Mancha; contract/grant number: PBI-05-053
Contract/grant sponsor: University of Castilla-La Mancha; contract/grant number: 0111001321 Program 541 A
Contract/grant sponsor: Hydrographic Confederation of the Guadalquivir River (Spanish Ministry of Environment)
Contract/grant sponsor: Fulbright Commission
Received 20 February 2006Accepted 21 February 2006Copyright # 2006 John Wiley & Sons, Ltd.
yE-mail: [email protected]: [email protected]}E-mail: [email protected]}E-mail: [email protected] Professor.nnFulBright Scholar.yyAssociate Professor.
nCorrespondence to: Roberto Mınguez, Department of Applied Mathematics, University of Castilla-La Mancha, 13071Ciudad Real, Spain.
zzProfessor.}}Ph.D. Student.

1. INTRODUCTION AND MOTIVATION
It is now well known that cracks can develop within a well constructed dam core, leading toconcentrated seepage and high erosion rates, which can compromise the safety of the embank-ment dam. As a matter of fact, internal erosion is one of the most important causes of failure inembankment dams. The annual probability of failure due to internal erosion of a large moderndam during operation is estimated (based on historical data) in 10�5; slightly less thanthe probability of failure due to overtopping, but well ahead of failure due to sliding (seeReference [1]).
The sequence of events leading to the failure of a dam by internal erosion with a concentratedleak is described in Figure 1. The best way to prevent internal erosion is using adequate granularfilters (or geotextiles) in the transition areas where important hydraulic gradients can appear. Incase of cracking and erosion, if the filter is capable of retaining the eroded particles, then thecrack will seal and the dam safety will be ensured. Hence, granular filters are one of the mostimportant elements in embankment dams. The trust in these filters is such that Sherard andDunningan [3] affirmed: ‘By providing a conservative downstream filter, we can quit worryingabout possible concentrated leaks through the core’.
Filters are mainly designed using simply to apply empirical criteria. These criteria havebeen proposed by researches as the result of a correlation between different base soil (‘basesoil’ refers to any material of the dam or foundation that is able to suffer internal erosionand must be protected, for example, the clay core of an embankment dam) and filter variablesthat produce a satisfactory behaviour if they are tested in laboratory under extreme condi-tions. These empirical criteria indirectly take into account all the factors affecting filtrationbut are only applicable to the range of soils tested and depend on testing methods, definitions offailure, etc.
Although no dam designed in accordance with modern filter requirements has ever sufferedincidents related to internal erosion (see Reference [1]), if we attempt to design a new dam or toevaluate the safety of a existing dam, it is very difficult to analyse the reliability of the filterbecause the empirical criteria do not take into account the variability of the base and filter
Concentratedleakor
Suffusion
Zoning withoutfilter, or filter
omittedor
Filter holds crackor
Filter allowsexcessive or
continuing erosion
Piping holeforms
Pipe remainsopen
Pipe collapses
Crest settlement orsinkhole on dam
orGross enlargement
of pipe
or
Unravelling of toe
or
Saturation/highpore pressures ind/s slope
Crest settlementor sinkhole
Downstreamslide
Crestovertopping
Breach
INITIATIONOF EROSION
CONTINUATIONOF EROSION
PROGRESSIONTO FORM A PIPE
FORMATION OF ABREACH MECHANISM
(for low permeability d/s zone)
Dam storageempties
Crest subsidesleading toovertopping
Crestovertopping
Figure 1. Failure path diagram for failure by pipping through the embankment (see Reference [2]).
Copyright # 2006 John Wiley & Sons, Ltd. Int. J. Numer. Anal. Meth. Geomech. 2006; 30:1019–1037
R. MINGUEZ ET AL.1020

particle size along the filter and the core of the dam, so that it is not possible to establish the realsafety level or the probability of failure of the filter. Note that in this paper, the failure of thefilter–base system is related to the no satisfaction of the empirical criteria.
In spite of the simplicity and good behaviour of dams designed using these empirical criteria,this traditional design procedure presents the following shortcomings:
1. Statistical variability of filter and base size is not taken into account.2. It is not possible to determine the safety level of the filter. Either it holds the empirical
criteria or it does not, but not intermediate situations are possible.3. It is very difficult to compare the levels of risk between different dams, for example, in
order to prioritize the rehabilitation investments.4. It is very difficult to carry out a sensitivity analysis, which would allow identifying the most
important variables to be controlled strictly.
The reliability assessment method proposed in this paper is based on considering ‘failure’of the filter–base system the non-fulfillment of the empirical design criteria. For illustrationpurposes we have selected the most common widely accepted criteria but it is very importantto highlight that the method is very flexible and allows an easy modification of thedifferent criteria.
In addition to the reliability assessment, some interest is shown by people in knowing howsensitive are the reliabilities to data values. A sensitivity analysis provides excellent informationon the extent to which a small change in the parameters or assumptions (data) modifies theresulting reliabilities.
The aims of this paper are: (a) to present a method for evaluating the safety level related to thedifferent empirical design criteria, and (b) to provide tools to perform a sensitivity analysis.
The paper is structured as follows. In Section 2, the proposed method for reliability assess-ment is presented. Section 3 shows the analytical solution for certain kind of problems using theproposed method. In Section 4, a technique for performing a sensitivity analysis is explained.Section 5 presents the numerical results for some specific base–filter systems. And finally,in Section 6 some conclusions are given.
2. PROPOSED METHOD FOR RELIABILITY ASSESSMENT
The reliability analysis applied to different engineering works (such as dams, breakwaters, slopestabilizations, etc.), assumes that there are some random variables ðX1; . . . ;XnÞ involved. How-ever, in the methodology herein proposed, no distinction is made between random and deter-ministic variables. In consequence, it is assumed that all variables are random, and deterministicvariables are only particular cases of them. Upper-case letters are used to refer to randomvariables, and the corresponding lowercase letters are used to refer to particular instantiations ofthese variables. They belong to an n-dimensional space, which, for each mode of failure, can bedivided into two zones: the so-called safe and the failure regions:
Safe region : S � fðx1;x2; . . . ;xnÞgjgmðx1; x2; . . . ; xnÞ > 0g
Failure region : F � fðx1; x2; . . . ;xnÞgjgmðx1;x2; . . . ; xnÞ40g
); m 2M ð1Þ
where M is the set of all modes of failure.
Copyright # 2006 John Wiley & Sons, Ltd. Int. J. Numer. Anal. Meth. Geomech. 2006; 30:1019–1037
RELIABILITY ASSESSMENT OF GRANULAR FILTERS IN EMBANKMENT DAMS 1021
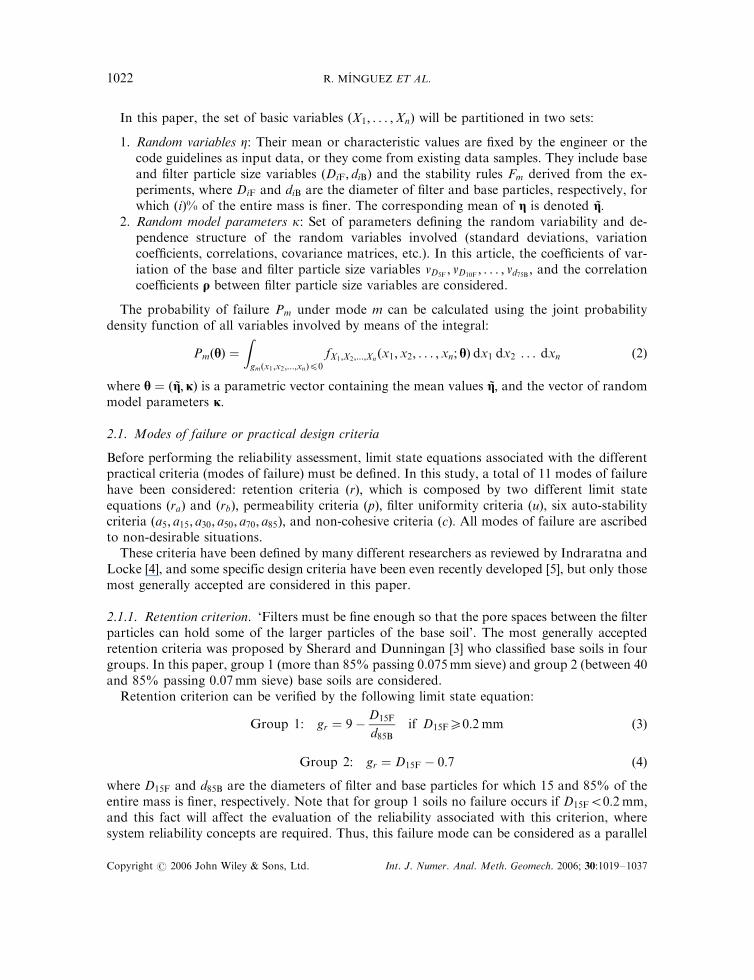
In this paper, the set of basic variables ðX1; . . . ;XnÞ will be partitioned in two sets:
1. Random variables Z: Their mean or characteristic values are fixed by the engineer or thecode guidelines as input data, or they come from existing data samples. They include baseand filter particle size variables (DiF; diB) and the stability rules Fm derived from the ex-periments, where DiF and diB are the diameter of filter and base particles, respectively, forwhich ðiÞ% of the entire mass is finer. The corresponding mean of g is denoted *g:
2. Random model parameters k: Set of parameters defining the random variability and de-pendence structure of the random variables involved (standard deviations, variationcoefficients, correlations, covariance matrices, etc.). In this article, the coefficients of var-iation of the base and filter particle size variables vD5F
; vD10F; . . . ; vd75B ; and the correlation
coefficients q between filter particle size variables are considered.
The probability of failure Pm under mode m can be calculated using the joint probabilitydensity function of all variables involved by means of the integral:
PmðhÞ ¼Zgmðx1;x2;...;xnÞ40
fX1;X2;...;Xnðx1; x2; . . . ; xn; hÞ dx1 dx2 . . . dxn ð2Þ
where h ¼ ð *g; jÞ is a parametric vector containing the mean values *g; and the vector of randommodel parameters j:
2.1. Modes of failure or practical design criteria
Before performing the reliability assessment, limit state equations associated with the differentpractical criteria (modes of failure) must be defined. In this study, a total of 11 modes of failurehave been considered: retention criteria ðrÞ; which is composed by two different limit stateequations ðraÞ and ðrbÞ; permeability criteria ðpÞ; filter uniformity criteria (u), six auto-stabilitycriteria ða5; a15; a30; a50; a70; a85Þ; and non-cohesive criteria ðcÞ: All modes of failure are ascribedto non-desirable situations.
These criteria have been defined by many different researchers as reviewed by Indraratna andLocke [4], and some specific design criteria have been even recently developed [5], but only thosemost generally accepted are considered in this paper.
2.1.1. Retention criterion. ‘Filters must be fine enough so that the pore spaces between the filterparticles can hold some of the larger particles of the base soil’. The most generally acceptedretention criteria was proposed by Sherard and Dunningan [3] who classified base soils in fourgroups. In this paper, group 1 (more than 85% passing 0.075mm sieve) and group 2 (between 40and 85% passing 0.07mm sieve) base soils are considered.
Retention criterion can be verified by the following limit state equation:
Group 1: gr ¼ 9�D15F
d85Bif D15F50:2 mm ð3Þ
Group 2: gr ¼ D15F � 0:7 ð4Þ
where D15F and d85B are the diameters of filter and base particles for which 15 and 85% of theentire mass is finer, respectively. Note that for group 1 soils no failure occurs if D15F50:2 mm;and this fact will affect the evaluation of the reliability associated with this criterion, wheresystem reliability concepts are required. Thus, this failure mode can be considered as a parallel
Copyright # 2006 John Wiley & Sons, Ltd. Int. J. Numer. Anal. Meth. Geomech. 2006; 30:1019–1037
R. MINGUEZ ET AL.1022

system composed by two components:
gra ¼ 9�D15F
d85Bð5Þ
grb ¼ 0:2�D15F ð6Þ
where the failure of the system requires the failure of both components simultaneously. In thecase of group 2 soils, a unique limit state equation, which is not dependent on the variability ofthe base soil, is required.
2.1.2. Permeability criterion. ‘Filter must be coarse enough to allow seepage flow to passthrough the filter, preventing build up of high pressures and hydraulic gradients’. Filter and soilbase permeabilities must be considered directly or by means of correlations with their particlesize distributions.
Permeability criterion can be verified by the following limit state equation:
gp ¼D15F
d15B� 4 ð7Þ
where D15F and d15B are the diameters of filter and base particles for which 15% of the entiremass is finer.
2.1.3. Filter uniformity criterion. Filter uniformity criterion can be verified by the followinglimit state equation:
gu ¼ 20�D60F
D10Fð8Þ
where D60F and D10F are the diameters of filter particles for which 60 and 10% of the entire massis finer, respectively.
2.1.4. Auto-stability criteria. When water flows through the filter, its fine particles should notmove within the skeleton of the coarse ones leading to erosion. Auto-stability criteria can beverified by the following limit state equations proposed by Kenney and Lau [6]:
gai ¼ 5�Dð15þiÞF
DiF; i 2 f5; 15; 30; 50; 70; 85g ð9Þ
where Dð15þiÞF and DiF are the diameters of filter particles for which ð15þ iÞ and i% of the entiremass is finer, respectively.
2.1.5. Non-cohesive criterion. If a filter has cohesion it may sustain a crack where base particlescan pass through. To ensure that the filter has no cohesion, it should contain no more than 5%fines passing 0:075 mm sieve and such fines should be non-plastic. Non-cohesive criterion can beverified by the following limit state equation:
gc ¼ D5F � 0:075 ð10Þ
where D5F is the diameter of filter particle for which 5% of the entire mass is finer.Note that failure for each individual criterion is considered when the corresponding limit state
equations (3)–(10) are lower than zero.
Copyright # 2006 John Wiley & Sons, Ltd. Int. J. Numer. Anal. Meth. Geomech. 2006; 30:1019–1037
RELIABILITY ASSESSMENT OF GRANULAR FILTERS IN EMBANKMENT DAMS 1023
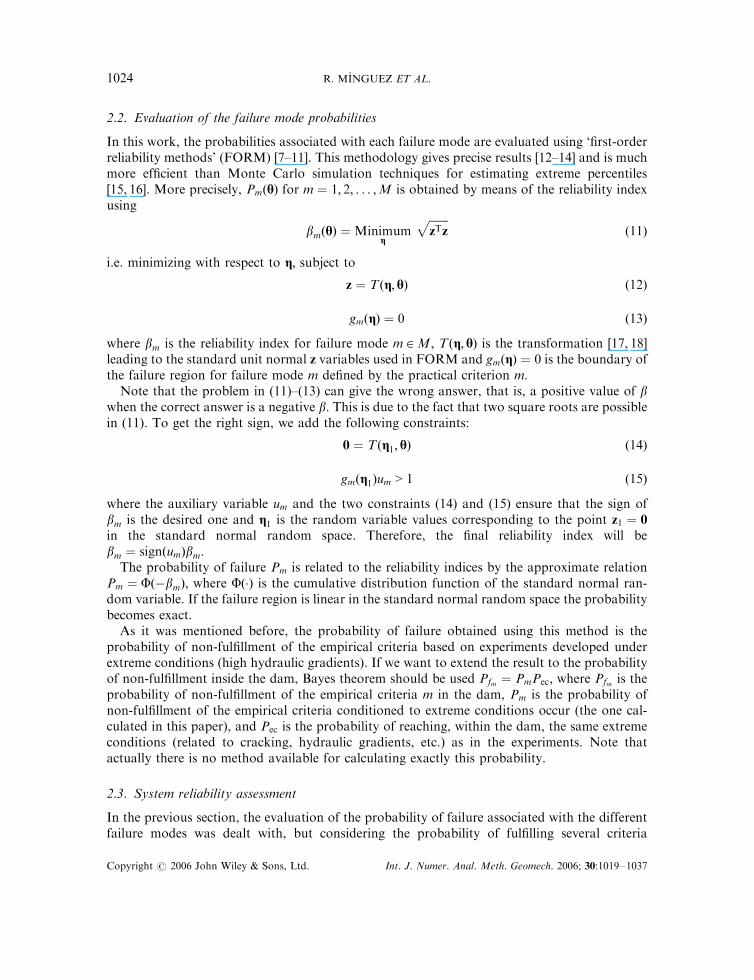
2.2. Evaluation of the failure mode probabilities
In this work, the probabilities associated with each failure mode are evaluated using ‘first-orderreliability methods’ (FORM) [7–11]. This methodology gives precise results [12–14] and is muchmore efficient than Monte Carlo simulation techniques for estimating extreme percentiles[15, 16]. More precisely, PmðhÞ for m ¼ 1; 2; . . . ;M is obtained by means of the reliability indexusing
bmðhÞ ¼Minimumg
ffiffiffiffiffiffiffizTz
pð11Þ
i.e. minimizing with respect to g; subject to
z ¼ Tðg; hÞ ð12Þ
gmðgÞ ¼ 0 ð13Þ
where bm is the reliability index for failure mode m 2M; Tðg; hÞ is the transformation [17, 18]leading to the standard unit normal z variables used in FORM and gmðgÞ ¼ 0 is the boundary ofthe failure region for failure mode m defined by the practical criterion m:
Note that the problem in (11)–(13) can give the wrong answer, that is, a positive value of bwhen the correct answer is a negative b: This is due to the fact that two square roots are possiblein (11). To get the right sign, we add the following constraints:
0 ¼ Tðg1; hÞ ð14Þ
gmðg1Þum > 1 ð15Þ
where the auxiliary variable um and the two constraints (14) and (15) ensure that the sign ofbm is the desired one and g1 is the random variable values corresponding to the point z1 ¼ 0
in the standard normal random space. Therefore, the final reliability index will bebm ¼ signðumÞbm:
The probability of failure Pm is related to the reliability indices by the approximate relationPm ¼ Fð�bmÞ; where Fð�Þ is the cumulative distribution function of the standard normal ran-dom variable. If the failure region is linear in the standard normal random space the probabilitybecomes exact.
As it was mentioned before, the probability of failure obtained using this method is theprobability of non-fulfillment of the empirical criteria based on experiments developed underextreme conditions (high hydraulic gradients). If we want to extend the result to the probabilityof non-fulfillment inside the dam, Bayes theorem should be used Pfm ¼ PmPec; where Pfm is theprobability of non-fulfillment of the empirical criteria m in the dam, Pm is the probability ofnon-fulfillment of the empirical criteria conditioned to extreme conditions occur (the one cal-culated in this paper), and Pec is the probability of reaching, within the dam, the same extremeconditions (related to cracking, hydraulic gradients, etc.) as in the experiments. Note thatactually there is no method available for calculating exactly this probability.
2.3. System reliability assessment
In the previous section, the evaluation of the probability of failure associated with the differentfailure modes was dealt with, but considering the probability of fulfilling several criteria
Copyright # 2006 John Wiley & Sons, Ltd. Int. J. Numer. Anal. Meth. Geomech. 2006; 30:1019–1037
R. MINGUEZ ET AL.1024

at the same time ‘structural system’ reliability assessment methods are required. The following‘structural systems’ are going to be considered in this paper:
1. The retention criterion gr (3) composed by two failure modes gra and grb ((5) and (6))(group 1 soils).
2. Filter system where only the failure of the filter is considered. It is composed by thefollowing failure modes: MF 2 fgu; gai ; i 2 f5; 15; 30; 50; 70; 85g and gcg:
3. Global filter–base system where we consider all the practical criteria MFþB:
The first system is a parallel system because it fails if all the components (criteria) failsimultaneously. The probability of failure of a parallel system is the intersection of the prob-abilities of failure for m modes:
Pfp ¼ Pr\Mk¼1
fXk4� bkg
" #¼ Fmð�b;RÞ ð16Þ
where b is the vector of reliability indexes for all the failure modes considered, R is thecorrelation matrix between any two failure modes and Fm is the multivariate normal distri-bution function.
The filter system is a series system because it fails if any of the components (criteria) fails. Theprobability of failure of a series system is the union of the probabilities of failure for m modes:
Pfs ¼ Pr[mk¼1
fXk4� bkg
" #¼ 1� Pr
\mk¼1
f�Xk4bkg
" #¼ 1� Fmðb;RÞ ð17Þ
The global filter–base system composed by all the practical criteria. For group 1 soils isa series–parallel system that fails if any of the following modes fails: MFþB 2 fgr; gp; gu; gai ; i 2f5; 15; 30; 50; 70; 85g and gcg; where gr fails if all its components gra and grb fail simultaneously.In the case of group 2 soils, is a series system.
Using first-order system reliability theory, each non-linear limit state function gm is approx-imated by linear functions in the normal random space:
gnm ¼ aTmzþ bm; m ¼ 1; . . . ;M ð18Þ
where z is the vector of uncorrelated standard normal random variables, and am ¼ ð�zm1=bm; . . . ;�zmn=bmÞ
T is the vector of normalized influence coefficients for the mth mode withaTmam ¼ 1: The correlation matrix elements Rij are evaluated using Rij ¼ aTi aj :
Clearly, the computation of the multinormal integrals is a necessary step for estimating theprobability of failure of structural systems. There are several approaches (see Reference [14]) butin this paper, the product of conditional marginals (PCM) method (see Reference [19]) thatshows high accuracy and simplicity of computation is used.
Whereas the evaluation of the probability of failure for systems using expressions (16) and(17) and first-order reliability concepts is approachable with a sufficient accuracy for mostpractical applications, the evaluation of the probability of failure of a series–parallel system (forgroup 1 soils) is a very difficult task, and Monte Carlo simulation methods will be used.
Copyright # 2006 John Wiley & Sons, Ltd. Int. J. Numer. Anal. Meth. Geomech. 2006; 30:1019–1037
RELIABILITY ASSESSMENT OF GRANULAR FILTERS IN EMBANKMENT DAMS 1025
2.4. Statistical assumptions
To perform a probabilistic study in the filter–base system, the joint probability density functionof all variables is required. As the size of the particles in the base and filter cannot have negativevalues, the particle sizes are modelled as log-normal random variables.
Filter and base particle sizes are considered independent one form each other, this hypothesisis reasonable because filter and base materials usually come from different sources. However, asfilter material comes from the same source, their particle sizes are not independent and thevalues of the correlation coefficients (q) are required.
In this paper, for the sake of simplicity, no other sources of uncertainty are considered, butother random variables could be added easily for considering model uncertainty, for instance,variables Fm could be considered random. Obviously, this assumption would require the cal-ibration using laboratory test results in order to establish an adequate distribution.
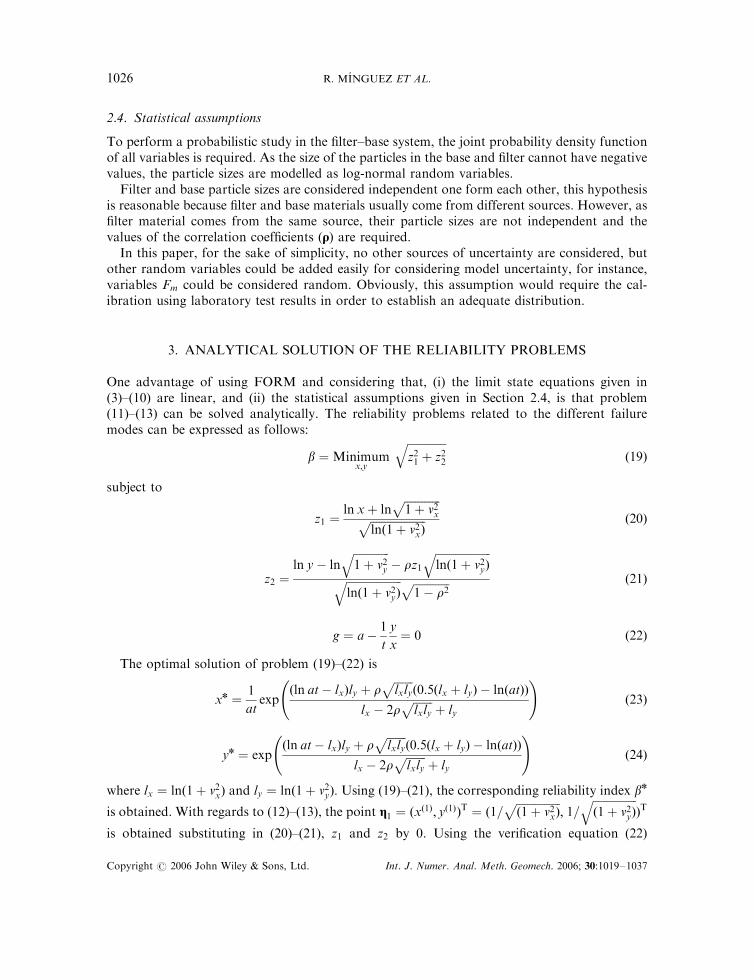
3. ANALYTICAL SOLUTION OF THE RELIABILITY PROBLEMS
One advantage of using FORM and considering that, (i) the limit state equations given in(3)–(10) are linear, and (ii) the statistical assumptions given in Section 2.4, is that problem(11)–(13) can be solved analytically. The reliability problems related to the different failuremodes can be expressed as follows:
b ¼Minimumx;y
ffiffiffiffiffiffiffiffiffiffiffiffiffiffiz21 þ z22
qð19Þ
subject to
z1 ¼ln xþ ln
ffiffiffiffiffiffiffiffiffiffiffiffiffi1þ v2x
pffiffiffiffiffiffiffiffiffiffiffiffiffiffiffiffiffiffiffiffilnð1þ v2xÞ
p ð20Þ
z2 ¼ln y� ln
ffiffiffiffiffiffiffiffiffiffiffiffiffi1þ v2y
q� rz1
ffiffiffiffiffiffiffiffiffiffiffiffiffiffiffiffiffiffiffiffilnð1þ v2yÞ
qffiffiffiffiffiffiffiffiffiffiffiffiffiffiffiffiffiffiffiffilnð1þ v2yÞ
q ffiffiffiffiffiffiffiffiffiffiffiffiffi1� r2
p ð21Þ
g ¼ a�1
t
y
x¼ 0 ð22Þ
The optimal solution of problem (19)–(22) is
xn ¼1
atexp
ðln at� lxÞly þ rffiffiffiffiffiffiffilxly
pð0:5ðlx þ lyÞ � lnðatÞÞ
lx � 2rffiffiffiffiffiffiffilxly
pþ ly
!ð23Þ
yn ¼ expðln at� lxÞly þ r
ffiffiffiffiffiffiffilxly
pð0:5ðlx þ lyÞ � lnðatÞÞ
lx � 2rffiffiffiffiffiffiffilxly
pþ ly
!ð24Þ
where lx ¼ lnð1þ v2xÞ and ly ¼ lnð1þ v2yÞ: Using (19)–(21), the corresponding reliability index bn
is obtained. With regards to (12)–(13), the point g1 ¼ ðxð1Þ; yð1ÞÞT ¼ ð1=
ffiffiffiffiffiffiffiffiffiffiffiffiffiffiffiffið1þ v2xÞ
p; 1=
ffiffiffiffiffiffiffiffiffiffiffiffiffiffiffiffið1þ v2yÞ
qÞT
is obtained substituting in (20)–(21), z1 and z2 by 0. Using the verification equation (22)
Copyright # 2006 John Wiley & Sons, Ltd. Int. J. Numer. Anal. Meth. Geomech. 2006; 30:1019–1037
R. MINGUEZ ET AL.1026

particularized for g1; the sign of the reliability index will be obtained as follows:
g1 ¼ a�1
t
yð1Þ
xð1Þ¼ a�
1
t
ffiffiffiffiffiffiffiffiffiffiffiffiffiffiffiffið1þ v2xÞ
pffiffiffiffiffiffiffiffiffiffiffiffiffiffiffiffið1þ v2yÞ
q if g1 > 0 then bn ¼ bn
if g140 then bn ¼ �bn
(ð25Þ
Note that when g1 > 0; the point z1 is in the safe region and the sign obtained from solving(19)–(22) is right. Otherwise, the point z1 is in the failure region and the sign changes (prob-ability of failure bigger than 0.5).
For example, for the filter uniformity criteria, and comparing to problem (19)–(22), it can beconcluded that x ¼ D10F=mD10F
; y ¼ D60F=mD60F; t ¼ mD10F
=mD60F; and a ¼ 20: Substituting in
(23)–(25) the solution, the uniformity reliability problem is obtained.The solution of problem (11)–(13) associated with verification equations that involve only one
particle size distribution variable (rb; c) is straightforward.
3.1. Retention failure
As the most important failure mode from the safety point of view is, usually, the retentioncriteria (r), which in the case of group 1 soils involve two verification equations (ra and rb), wewill solve and analyse the solution for different values of the variables involved.
Considering first the retention criteria ðraÞ; and comparing to problem (19)–(22), it is shownthat x ¼ d85B=md85B ; y ¼ D15F=mD615F
; t ¼ md85B=mD15F; and a ¼ 9: Substituting in (23)–(25) the
solution, the uniformity reliability problem is obtained.The problem associated with the second retention constraint ðrbÞ is
brbðhÞ ¼MinimumD15F
ffiffiffiffiffiffiffiffiz22;rb
qsubject to
z2;rb ¼lnD15F � mln D15F
sln D15F
¼lnD15F � lnðmD15F
=ffiffiffiffiffiffiffiffiffiffiffiffiffiffiffiffiffiffi1þ v2D15F
qÞffiffiffiffiffiffiffiffiffiffiffiffiffiffiffiffiffiffiffiffiffiffiffiffiffi
lnð1þ v2D15FÞ
q
grb ¼ 0:2�D15F ¼ 0
whose optimal solution is
Dn
15F ¼ 0:2; zn2;rb ¼ln 0:2� lnðmD15F
=ffiffiffiffiffiffiffiffiffiffiffiffiffiffiffiffiffiffi1þ v2D15F
qÞffiffiffiffiffiffiffiffiffiffiffiffiffiffiffiffiffiffiffiffiffiffiffiffiffi
lnð1þ v2D15FÞ
q ; bn
rb¼ zn2;rb ð26Þ
Note that the sign of the reliability index brb coincides with the z2;rb sign.Once the reliability related to the failure modes ra and rb has been obtained, the parallel
system reliability has to be calculated as it is shown in Section 2.3:
Pfr ¼ Fmð�br;RrÞ ð27Þ
where
ara ¼ �zn1;rabra
;�zn2;rabra
� �Tð28Þ
Copyright # 2006 John Wiley & Sons, Ltd. Int. J. Numer. Anal. Meth. Geomech. 2006; 30:1019–1037
RELIABILITY ASSESSMENT OF GRANULAR FILTERS IN EMBANKMENT DAMS 1027
arb ¼ �zn1;rbbrb
;�zn2;rbbrb
� �T¼ ð0;�1ÞT ð29Þ
Rr ¼1 zn2;ra=bra
zn2;ra=bra 1
!ð30Þ
br ¼ ðbra ; brb ÞT ð31Þ
Expression (27) can be solved using the PCM method (see Reference [19]) as follows:
Pfr ¼ Fmð�br;RrÞ ¼ Fð�bra ÞF�brb � mrb jra
srb jra
� �ð32Þ
where mrb jra and srb jra are the conditional mean and standard deviation, respectively, given by
mrb jra ¼ �zn2;rabra
fð�braÞFð�bra Þ
ð33Þ
srb jra ¼
ffiffiffiffiffiffiffiffiffiffiffiffiffiffiffiffiffiffiffiffiffiffiffiffiffiffiffiffiffiffiffiffiffiffiffiffiffiffiffiffiffiffiffiffiffiffiffiffiffiffiffiffiffiffiffiffiffiffiffiffiffiffiffiffiffiffiffiffiffiffiffiffiffiffiffiffiffiffi1�
zn2;rabra
� �2fð�braÞFð�bra Þ
�bra þfð�bra ÞFð�braÞ
� �sð34Þ
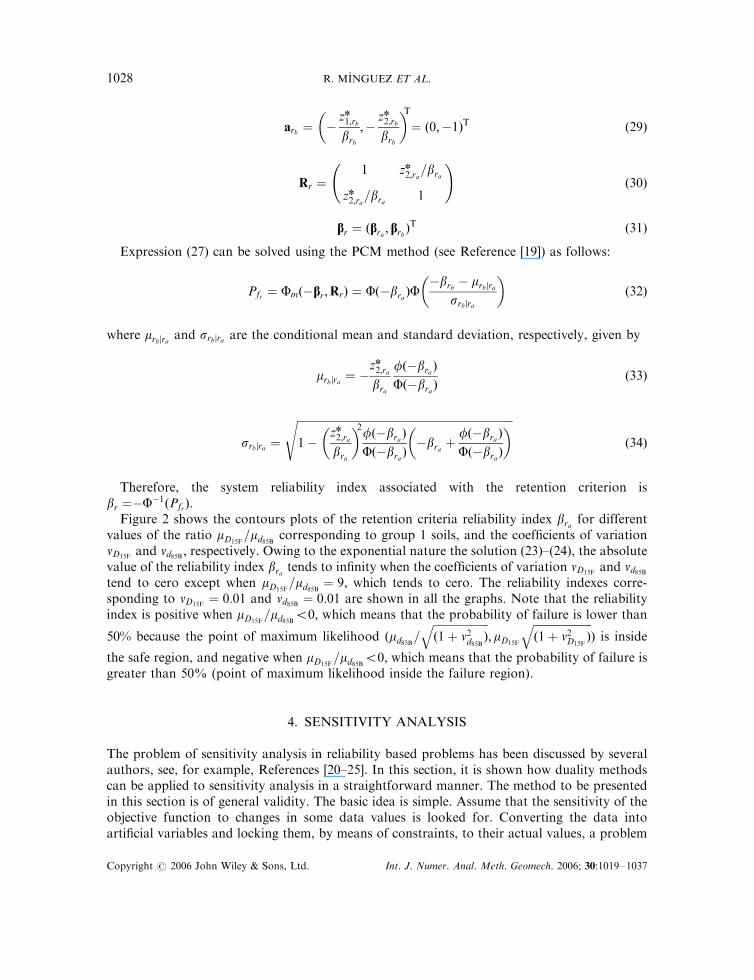
Therefore, the system reliability index associated with the retention criterion isbr ¼�F
�1ðPfrÞ:Figure 2 shows the contours plots of the retention criteria reliability index bra for different
values of the ratio mD15F=md85B corresponding to group 1 soils, and the coefficients of variation
vD15Fand vd85B ; respectively. Owing to the exponential nature the solution (23)–(24), the absolute
value of the reliability index bra tends to infinity when the coefficients of variation vD15Fand vd85B
tend to cero except when mD15F=md85B ¼ 9; which tends to cero. The reliability indexes corre-
sponding to vD15F¼ 0:01 and vd85B ¼ 0:01 are shown in all the graphs. Note that the reliability
index is positive when mD15F=md85B50; which means that the probability of failure is lower than
50% because the point of maximum likelihood ðmd85B=ffiffiffiffiffiffiffiffiffiffiffiffiffiffiffiffiffiffiffiffið1þ v2d85B Þ
q;mD15F
ffiffiffiffiffiffiffiffiffiffiffiffiffiffiffiffiffiffiffiffiffið1þ v2D15F
Þq
Þ is inside
the safe region, and negative when mD15F=md85B50; which means that the probability of failure is
greater than 50% (point of maximum likelihood inside the failure region).
4. SENSITIVITY ANALYSIS
The problem of sensitivity analysis in reliability based problems has been discussed by severalauthors, see, for example, References [20–25]. In this section, it is shown how duality methodscan be applied to sensitivity analysis in a straightforward manner. The method to be presentedin this section is of general validity. The basic idea is simple. Assume that the sensitivity of theobjective function to changes in some data values is looked for. Converting the data intoartificial variables and locking them, by means of constraints, to their actual values, a problem
Copyright # 2006 John Wiley & Sons, Ltd. Int. J. Numer. Anal. Meth. Geomech. 2006; 30:1019–1037
R. MINGUEZ ET AL.1028

0 0.1 0.2 0.3 0.4 0.50
0.1
0.2
0.3
0.4
0.5
-45
0 0.1 0.2 0.3 0.4 0.5
-49
0 0.1 0.2 0.3 0.4 0.5
-53
0 0.1 0.2 0.3 0.4 0.5
-56
0
0.1
0.2
0.3
0.4
-26 -31 -36 -41
0
0.1
0.2
0.3
0.4
0.5
-7 -14 -20
0
0.1
0.2
0.3
0.4
0.5
42 29 18 8
0
0.1
0.2
0.3
0.4
0.5v d
85B
v d85
Bv d
85B
v d85
Bv d
85B
vD15FvD15F
vD15FvD15F
t = 1 t = 1/2 t = 1/3 t = 1/4
t = 1/5 t = 1/6 t = 1/7 t = 1/8
t = 1/9 t = 1/10 t = 1/11 t = 1/12
155 106 78 57
5
5
2
2
34
5
6
58
101015
1
1
1
1
0.5
-1.5
-1.5-1
-2-1
-0.5
-0.5
0.50.25
0.75
2
2
23
34
-0.125-0.8
-0.55
-0.05
-0.3
0.125
0
-1.5
-1
-1
-1
-3-3
-4-2
-2-2
-1
-3
-4
-2
-2.5
-1
-3
-4
-2-2
-4
-5
-3
-2
-4
-5
-3
-2
-5
-6
-3
-4
t = 1/13 t = 1/14 t = 1/15 t = 1/16
t = 1/17 t = 1/18 t = 1/19 t = 1/20
Figure 2. Contours plots of the retention criteria reliability index bra for different values of theratio t ¼ md85B=mD15F
and vD15Fand vd85B :
Copyright # 2006 John Wiley & Sons, Ltd. Int. J. Numer. Anal. Meth. Geomech. 2006; 30:1019–1037
RELIABILITY ASSESSMENT OF GRANULAR FILTERS IN EMBANKMENT DAMS 1029
that is equivalent to the initial optimization problem but has a constraint such that the values ofthe dual variables associated with them give the desired sensitivities is obtained.
To this aim, in problem (11)–(15), variable h is replaced by the artificial variable hn and thefollowing constraint is added:
hn ¼ h : km ð35Þ
Converting the data h ¼ ð *g;jÞ into artificial variables hn and setting them, by means ofconstraint (35), to their actual values h; the values of the dual variables km; associated withconstraint (35) multiplied by signðumÞ give the sensitivities of the reliability indexes for mode mwith respect to h ¼ ð *g;jÞ: These sensitivities allow determining for example how the reliability ofan engineering design changes when its design values and the statistical parameters of therandom variables involved are modified.
If the sensitivities (lm) of the probability of failure (using FORM) with respect to the dataparameters are looked for, the following formula should be used:
lm ¼ signðumÞexpð�b2m=2Þffiffiffiffiffiffi
2pp km ð36Þ
Note that this method requires the use of optimization techniques for solving the reliabilityproblems related to the different failure modes (11)–(13), alternative methods for sensitivityanalysis that would allow the use of the analytical expressions given in Section 3 are shown inReferences [26, 27].
5. PRACTICAL EXAMPLES
In this section, the proposed reliability assessment method is carried out on two differentexamples: case study A, which uses a group 1 base soil, and case study B, which uses theBalderhead Dam data (group 2 base soil).
5.1. Case study A: (group 1 base soil)
In this example, both the filter and the base soil grain size distributions have been obtained froma real dam but their values have been intentionally modified to best represent the performanceof the method.
5.2. Statistical data
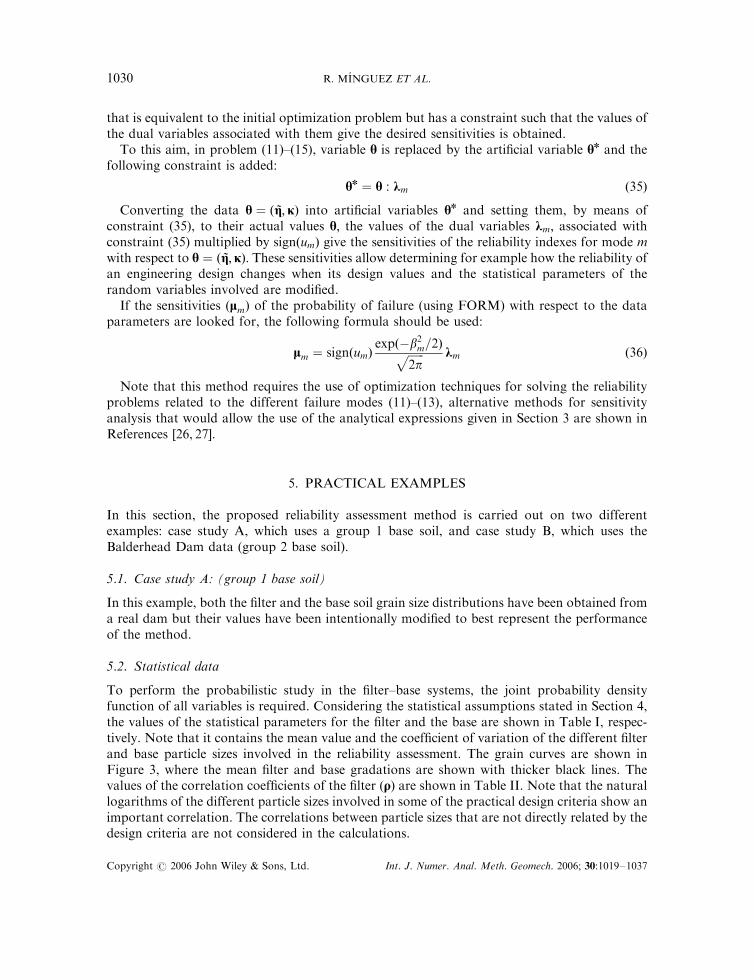
To perform the probabilistic study in the filter–base systems, the joint probability densityfunction of all variables is required. Considering the statistical assumptions stated in Section 4,the values of the statistical parameters for the filter and the base are shown in Table I, respec-tively. Note that it contains the mean value and the coefficient of variation of the different filterand base particle sizes involved in the reliability assessment. The grain curves are shown inFigure 3, where the mean filter and base gradations are shown with thicker black lines. Thevalues of the correlation coefficients of the filter (q) are shown in Table II. Note that the naturallogarithms of the different particle sizes involved in some of the practical design criteria show animportant correlation. The correlations between particle sizes that are not directly related by thedesign criteria are not considered in the calculations.
Copyright # 2006 John Wiley & Sons, Ltd. Int. J. Numer. Anal. Meth. Geomech. 2006; 30:1019–1037
R. MINGUEZ ET AL.1030
Note that d85B is less than 0.074mm, therefore, retention criteria for soil group 1 must be used.
5.3. Reliability assessment results
First of all, reliability indexes and probabilities of failure are evaluated solving problem(11)–(15) for each failure mode. The solution could be obtained using both numerical methodsor the analytical solution presented in Section 3. We have used numerical methods in order toobtain the sensitivity analysis at the same time.
Table I. Filter DxF and base dxB values (mm) for the practical example (group 1 soil).
Ref. D5F D10F D15F D20F D30F D45F D50F D60F D65F D70F D85F D100F d15B d85B
mX 0.093 0.163 0.210 0.267 0.395 0.690 0.890 1.419 1.709 2.056 3.319 10.000 0.001 0.0314
vX 0.136 0.093 0.074 0.088 0.075 0.124 0.143 0.097 0.084 0.076 0.035 0.000 0.497 0.392
mln X �2.388 �1.818 �1.565 �1.325 �0.932 0.379 �0.127 0.345 0.532 0.718 1.199 2.303 �7.001 �3.531sln X 0.136 0.093 0.074 0.088 0.075 0.123 0.142 0.097 0.084 0.076 0.035 0.000 0.470 0.378
-4 -3 -2 -1 0 1
20
40
60
80
100
log(x)
%
Base soil
Filter soil
Figure 3. Sample grain curves of the filter and base particle sizes (grey lines) for the practicalexample (group 1 soil).
Table II. Correlations between the involved filter particle sizes DxF (group 1 soil).
D5F D10F D15F D20F D30F D45F D50F D60F D65F D70F D85F D100F
D5F 1.000 } } 0.337 } } } } } } } }D10F } 1.000 } } } } } 0.145 } } } }D15F } } 1.000 } 0.869 0.521 } } } } } }D20F 0.337 } } 1.000 } } } } } } } }D30F } } 0.869 } 1.000 0.865 } } } } } }D45F } } 0.521 } 0.865 1.000 } } } } } }D50F } } } } } } 1.000 } 0.968 } } }D60F } 0.145 } } } } } 1.000 } } } }D65F } } } } } } 0.968 } 1.000 } } }D70F } } } } } } } } } 1.000 0.965 }D85F } } } } } } } } } 0.965 1.000 }D100F } } } } } } } } } } } 1.000
Copyright # 2006 John Wiley & Sons, Ltd. Int. J. Numer. Anal. Meth. Geomech. 2006; 30:1019–1037
RELIABILITY ASSESSMENT OF GRANULAR FILTERS IN EMBANKMENT DAMS 1031

The proposed method has been implemented in general algebraic modelling system (GAMS)(see Reference [28]) using the generalized reduced gradient method (for more details, seeReferences [29, 30] that has shown good convergence properties when the variables areconstrained.
The results of the proposed method are given in Table III, where bm is the reliability indexfor mode m; g is the design point, failure point or point of maximum likelihood in theoriginal random space, which is the point whose density function value under the statisticalassumptions made is the biggest. It represents the most likely values of the random valueswhere failure occurs. z is the design point in the standard normal random space. Note thatboth are related by means of the Rosenblatt transformation (12), and Pm is the probabilityof failure for each practical criteria using either FORM methods, Monte Carlo simulationor both. With respect the Monte Carlo simulation it is worth mentioning that 106 samplepoints were used.
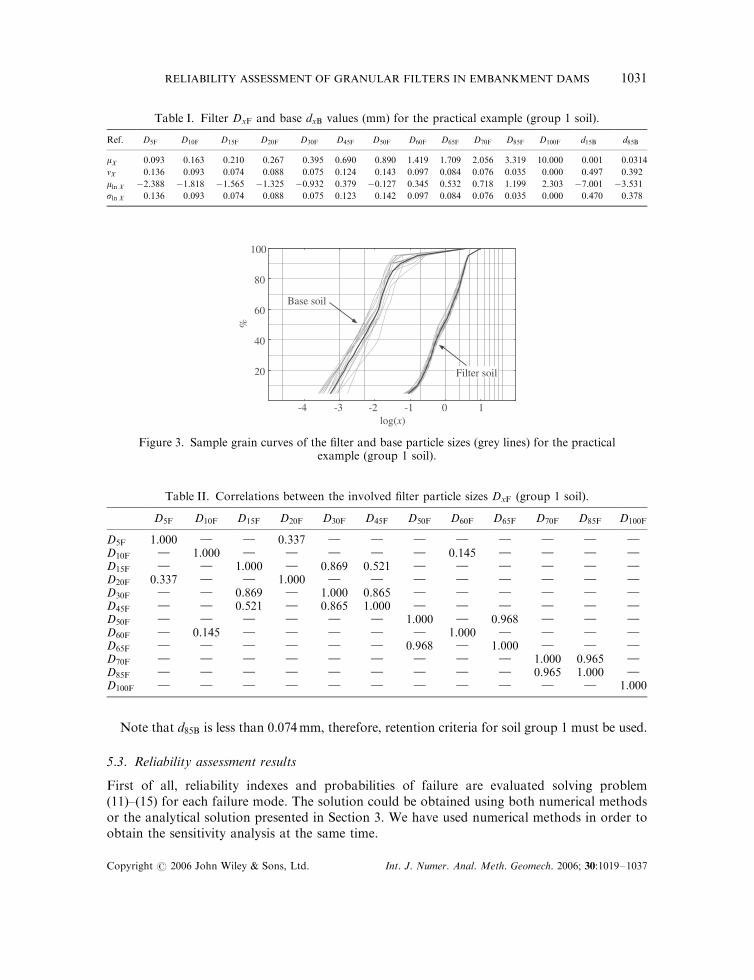
One advantage of the practical criteria is the simplicity of the limit state equations, whichconsidering the random variables as in Section 2.4, allows making the graph of the bi-variatestandard normal random variable in 2-D and 3-D. In Figure 4, the probability density functioncontours, the limit state equations ra and rb (linear), the design points and the reliability indexesbra and brb in the standard normal random space are shown. Note that the FORM method isexact for linear limit state equations.
Table III also shows the system reliability evaluations using the PCMmethod, which has beenimplemented in Matlab. The bm-values and the correlation matrix elements Rij are used. Notethat the correlation elements are obtained using Rij ¼ aTi aj ; where a
Ti ¼ ð�zi1=bi; �zi2=biÞ: Note
that the term ‘correlation’ used in the statement refers to correlation between failure modes,different from the correlation between filter particle sizes.
From Table III the following conclusions can be drawn:
1. The most important failure mode is the retention criteria with a system probability offailure of � 22:07%:
Table III. Independent failure criteria reliability assessment for the practical example (group 1 soil).
m bm z1 z2 g Pm (FORM) Pm (Monte Carlo)
ra 0.598 �0.586 0.115 0.023 0.211 0.27506 0.27512rb �0.603 } �0.603 } 0.200 0.72690 0.72686p 8.518 8.414 �1.331 0.047 0.189 0.00000 0.00000u 6.706 �4.239 5.197 0.110 2.193 0.00000 0.00000a5 4.059 �3.206 2.489 0.059 0.297 0.00002 0.00002a15 25.547 �5.928 24.849 0.135 0.673 0.00000 0.00000a30 15.206 6.887 13.557 0.661 3.307 0.00000 0.00000a50 14.637 �13.835 4.776 0.123 0.614 0.00000 0.00000a70 26.105 �25.515 5.520 0.294 1.472 0.00000 0.00000a85 14.440 �14.440 0.000 2.000 10.000 0.00000 0.00000c 1.486 �1.486 } 0.075 } 0.06865 0.06899
System reliabilityr } } } } } 0.22068 0.22063MF } } } } } 0.06865 0.06901MFþB } } } } } } 0.27429
Copyright # 2006 John Wiley & Sons, Ltd. Int. J. Numer. Anal. Meth. Geomech. 2006; 30:1019–1037
R. MINGUEZ ET AL.1032
2. The failure of the filter itself is less probable, but the probability of the percentage of finespassing 0.075mm sieve being greater than 5% is significant (� 7%). Additional test shouldbe performed to verify if they are plastic.
3. The probability of failure associated with the filter uniformity criteria and autostabilitybetween diameter filters are negligible.
4. The global probability of non-fulfilling the practical criteria is � 27:43%:
The method also gives the sensitivities associated with the b-values. Only the sensitivities of theretention criteria reliability index are shown in Table IV. The term @bra=@x represents the change inthe reliability index bra when the data x increases one unit, whereas the term ð@bra=@xÞjxj is therelative sensitivity, which allows comparing sensitivities between parameters with different mag-nitudes, the bigger the value, the more sensitive the parameter is. It is useful to know how much theb-values change due to a small change in a single data value (e.g. the means or the coefficients ofvariation). Note, for example, that a unit increase in the coefficients of variation vDF15
and vdB15(uncertainty increase) leads to a �0:105 and �2:248 decrease of the retention reliability index (bra)(see the corresponding entrance @bra=@x in Table IV), respectively.
raβ
Safe region
Failure region
z1
z2
Joint densityfunction contours
Limit stateequation (ra)
Limit stateequation (rb)
Design or Maximumlikelihood point (ra)
(-0.586, 0.115)
Design or Maximumlikelihood point (rb)
(0, -0.603)
-2 -1 1 2
-2
-1
1
2
rbβ
Joint densityfunction
Limit stateequation
z1
z2
-2
0
2
-202
Saferegion
z2
z14 -4
-2
0
2
4
-4-2
02
Failureregion
Saferegion
Figure 4. 2-D and 3-D graphical illustration of the reliability problem associated with the retentioncriteria r for the practical example (group 1 soil).
Table IV. Reliability index sensitivity with respect the parameters for theretention criteria (group 1 soil).
x mdB85 mDF15vdB85 vDF15
Fra
@bra@x
82.478 �12.362 �2.248 �0.105 0.288
@bra@xjxj 2.593 �2.593 �0.882 �0.008 2.593
Copyright # 2006 John Wiley & Sons, Ltd. Int. J. Numer. Anal. Meth. Geomech. 2006; 30:1019–1037
RELIABILITY ASSESSMENT OF GRANULAR FILTERS IN EMBANKMENT DAMS 1033

As it is expected, for example, increasing the uncertainty in the retention criterion ra(coefficient of variation) decreases the reliability index increasing the probability of failure.
5.4. Case study B: Balderhead Dam (group 2 base soil)
In this section, in order to add comparisons with experimental data form the literature, theproposed reliability assessment method is performed using data from a real dam. In this caseBalderhead Dam data (group 2 base soil) has been selected.
Balderhead Dam is located in Northern England. Designed in 1959 and completed in 1965,the clay core cracked by hydraulic fracture just before the reservoir reached top water levelin February 1966. Internal erosion followed and, 14 months later, two sink holes developedat the crest over the upstream boundary of the clay core. The failure and subsequent inves-tigation of Balderhead Dam is described in detail by Vaughan and Soares [31]. A crack erosionmodel and the reduced particle size distribution method were used by Locke [32] to predict whythe dam failed.
5.5. Statistical data
Considering the statistical assumptions stated in Section 4, the values of the statistical param-eters for the filter and the base are shown in Table V. Note that it contains the mean value andthe coefficient of variation of the different filter and base particle sizes involved in the reliability
Table V. Filter DxF values (mm) for the Balderhead dam filter (group 2 soil).
Filter ref. D5F D10F D15F D20F D30F D45F D50F D60F D65F D70F D85F D100F
mX 0.82 1.19 2.01 2.72 5.13 8.55 9.84 13.55 15.59 20.29 35.62 50.68vX 0.92 1.10 1.03 0.92 0.80 0.70 0.72 0.52 0.49 0.37 0.19 0.16mln X �0.51 �0.22 0.34 0.69 1.39 1.95 2.08 2.48 2.64 2.94 3.56 3.91sln X 0.78 0.89 0.85 0.78 0.70 0.63 0.64 0.49 0.46 0.36 0.19 0.16
Table VI. Independent failure criteria reliability assessment for the Balderhead damexample (group 2 soil).
m bm z1 z2 g Pm (FORM) Pm (Monte Carlo)
rb �0.817 } �0.817 } 0.700 0.79296 0.79317u 0.282 �0.247 0.136 0.642 12.834 0.38887 0.38896a5 0.366 �0.259 0.259 0.490 2.449 0.35724 0.35782a15 0.507 �0.390 0.324 1.005 5.026 0.30595 0.30579a30 1.108 �0.824 0.741 2.238 11.189 0.13385 0.13331a50 1.323 �1.073 0.774 4.011 20.055 0.09294 0.09276a70 2.448 �2.176 1.122 8.634 43.169 0.00718 0.00720a85 5.040 �3.790 3.322 17.233 86.164 0.00000 0.00000c 2.654 �2.654 } 0.075 } 0.00398 0.00398
System reliabilityMF } } } } } 0.797653 0.798369MFþB } } } } } 0.989798 0.989922
Copyright # 2006 John Wiley & Sons, Ltd. Int. J. Numer. Anal. Meth. Geomech. 2006; 30:1019–1037
R. MINGUEZ ET AL.1034
assessment. This data are obtained considering that the logarithm of the maximum value cor-responds to the 98% quantile. According to them, Balderhead Dam core soil has between 70and 40% passing 0.075mm sieve, thus, soil group 2 retention criteria has to be used.
5.6. Reliability assessment results
The results of the proposed method are given in Table VI, from this table the followingconclusions can be drawn:
1. The most important failure mode is the retention criteria with a probability of failure of� 79:3%:
2. The failure of the filter itself is very high, � 80%:3. The global probability of non-fulfilling the practical criteria is � 99%:
Note that the method shows that the probability of failure for this particular case is very high,confirming the risk associated with its filter design.
6. CONCLUSIONS
The method presented in this paper is specially suitable for assessing the probability of fulfillingthe empirical criteria considering the statistical behaviour of the filter and base soil particle size.This method allows practical engineers establish the safety level of existing filters to know howfar the filter is from fulfilling the established practical criteria. In addition, sensitivity analysiscan be easily performed by transforming the input parameters into artificial variables, which areconstrained to take their associated constant values.
Additional advantages of the proposed method include:
1. The method is simple and allows and easy connection with optimization frameworks.2. Statistical variability of filter and base size is taken into account allowing to determine the
safety level of the filter by means of the probability of non-fulfillment of individual criteriaor the total system.
3. It is very flexible allowing easy substitution of the limit state equations associated with thedifferent failure modes.
4. This method allows comparison between filters in different dams in order to prioritize therehabilitation investments.
5. Sensitivity values with respect to the target reliability indexes (or probabilities of failure)are given, without additional effort, by the values of the dual variables. This allows toidentify the most important variables to be controlled, which might be very useful duringconstruction.
6. It allows obtaining sensitivity values with respect to the data samples. This provides auseful tool for outlier or erroneous data detection.
Finally, the methodology, it is expected to be a very useful tool in order to approach prob-abilities of failure in the context of risk assessment of embankment dams. With that purpose,future research should be focused on estimating load (hydraulic gradients) probabilities andtransforming the existing empirical criteria in real limit state equations.
Copyright # 2006 John Wiley & Sons, Ltd. Int. J. Numer. Anal. Meth. Geomech. 2006; 30:1019–1037
RELIABILITY ASSESSMENT OF GRANULAR FILTERS IN EMBANKMENT DAMS 1035
ACKNOWLEDGEMENTS
The authors are indebted to the Ministry of Science and Education of Spain through CICYT ProjectsBIA2003-08327 and BIA2005-07802-C02-01, the Junta de Comunidades de Castilla-La Mancha throughproject PBI-05-053, the University of Castilla-La Mancha through project 0111001321 Program 541 A, theHydrographic Confederation of the Guadalquivir River (Spanish Ministry of Environment), and theFulbright Commission for partial support of this work.
REFERENCES
1. Fry J, Brun P, Lautrin D, Albalat C, Droux J, Mercier A, Riesterer J, Thareau L, Degoutte G. Typologiede l’erosion interne et d’etection. XIX ICOLD, vol. Q73, R47, Florencia, 1997.
2. Foster M, Fell R. A framework for estimating the probability of failure of embankment dams by internal erosionand piping using event tree methods. UNICIV R-377, University of New South Wales, Australia, 1999.
3. Sherard J, Dunningan L. Filters and leakage control in embankment dams. In Proceedings, Symposium on Seepageand Leakage from Dams and Impoundments, Volpe RL, Kelly W (eds). ASCE: New York, 1985; 1–30.
4. Indraratna B, Locke M. Design methods for granular filters}critical review. Proceedings of the Institution of CivilEngineers}Geotechnical Engineering 1999; 137:137–147.
5. Delgado F. Variables which influence the efficiency of granular filters against internal erosion of cohesive soils.Ph.D. Thesis, University of Granada, Granada, Spain, 2000 (in Spanish).
6. Kenney T, Lau D. Internal stability of granular filters. Canadian Geotechnical Journal 1985; 22:215–225.7. Freudenthal AN. Safety and the probability of structural failure. Transactions (ASCE) 1956; 121:1337–1397.8. Hasofer AM, Lind NC. Exact and invariant second moment code format. Journal of Engineering Mechanics 1974;
100(EM1):111–121.9. Rackwitz R, Fiessler B. Structural reliability under combined load sequences. Computers and Structures 1978;
9:484–494.10. Hohenbichler M, Rackwitz R. Non-normal dependent vectors in structural safety. Journal of the Engineering
Mechanics Division (ASCE) 1981; 107(6):1227–1238.11. Ditlevsen O. Principle of normal tail approximation. Journal of the Engineering Mechanics Division (ASCE) 1981;
107(EM6):1191–1208.12. Madsen HD, Krenk S, Lind NC. Methods of Structural Safety (2nd edn). Prentice-Hall Inc.: Englewood Cliffs,
NY, 1986.13. Ditlevsen O, Madsen HO. Structural Reliability Methods. Wiley: Chichester, NY, 1996.14. Melchers RE. Structural Reliability Analysis and Prediction (2nd edn). Wiley: New York, 1999.15. Wirsching PH, Wu YT. Advanced reliability methods for structural evaluation. Journal of the Engineering
Mechanics Division (ASCE) 1987; 109(2):19–23.16. Haskin FE, Staple BD, Ding C. Efficient uncertainty analyses using fast probability integration. Nuclear Engineering
and Design 1996; 166(2):225–248.17. Rosenblatt M. Remarks on a multivariate transformation. Annals of Mathematical Statistics 1952; 23(3):470–472.18. Nataf A. Determination des distribution dont les marges sont donnees. Comptes Rendus de l’Academie des Sciences
1962; 225:42–43.19. Pandey MD. An effective approximation to evaluate multinormal integrals. Structural Safety 1998; 20:51–67.20. Frangopol DM. Sensitivity of reliability-based optimum design. Journal of Structural Engineering (ASCE) 1985;
111(8):1703–1721.21. Enevoldsen I. Sensitivity analysis of reliability-based optimal solutions. Journal of Engineering Mechanics 1994;
120(1):198–205.22. Sorensen JD, Enevoldsen I. Sensitivity analysis in reliability-based shape optimization. In NATO ASI, Topping
BHV (ed.), E, vol. 221. Kluwer Academic Publishers: Dordrecht, The Netherlands, 1992; 617–638.23. Mınguez R. Seguridad, Fiabilidad y Analisis de Sensibilidad en Obras de Ingenierıa Civil Mediante Tecnicas de
Optimizacion por Descomposicion. Aplicaciones. Ph.D. Thesis, Universidad de Cantabria, Santander, Espana, 2003.24. Mınguez R, Castillo E, Hadi AS. Solving the inverse reliability problem using decomposition techniques. Structural
Safety 2005; 27:1–23.25. Mınguez R, Castillo E, Hadi AS. Sensitivity analysis in reliability based optimization. Proceedings of the 4th
International Conference on Mathematical Methods in Reliability. Methodology and Practice, Series on Quality,Reliability and Engineering Statistics, Santa Fe, New Mexico, 2004.
26. Castillo E, Conejo A, Castillo C, Mınguez R, Ortigosa D. A perturbation approach to sensitivity analysis innonlinear programming. Journal of Optimization Theory and Applications 2006; 128(1):49–74.
27. Castillo E, Conejo A, Mınguez R, Castillo C. A closed formula for local sensitivity analysis in mathematicalprogramming. Engineering Optimization 2006; 93–112.
Copyright # 2006 John Wiley & Sons, Ltd. Int. J. Numer. Anal. Meth. Geomech. 2006; 30:1019–1037
R. MINGUEZ ET AL.1036

28. Castillo E, Conejo A, Pedregal P, Garcıa R, Alguacil N. Building and Solving Mathematical Programming Models inEngineering and Science. Pure and Applied Mathematics: A Wiley-Interscience Series of Texts, Monographs andTracts. Wiley: New York, 2001.
29. Vanderplaats GN. Numerical Optimization Techniques for Engineering Design. McGraw-Hill: New York, 1984.30. Bazaraa MS, Jarvis JJ, Sherali HD. Linear Programming and Network Flows (2nd edn). Wiley: New York, 1990.31. Vaughan PR, Soares HF. Design of filters for clay cores of dams. Journal of Geotechnical Division (ASCE) 1982;
108:17–31.32. Locke M. Analytical and laboratory modelling of granular filters for embankment dams. Ph.D. Thesis, University of
Wollongong, Australia, 2001.
Copyright # 2006 John Wiley & Sons, Ltd. Int. J. Numer. Anal. Meth. Geomech. 2006; 30:1019–1037
RELIABILITY ASSESSMENT OF GRANULAR FILTERS IN EMBANKMENT DAMS 1037