Evaluating the Design Criteria for Light Embankment Piling
32
Citation: Gunnvard, P.; Mattsson, H.; Laue, J. Evaluating the Design Criteria for Light Embankment Piling: Timber Piles in Road and Railway Foundations. Appl. Sci. 2022, 12, 166. https://doi.org/10.3390/app12010166 Academic Editors: Gye-Chun Cho and Ilhan Chang Received: 10 November 2021 Accepted: 10 December 2021 Published: 24 December 2021 Publisher’s Note: MDPI stays neutral with regard to jurisdictional claims in published maps and institutional affil- iations. Copyright: © 2021 by the authors. Licensee MDPI, Basel, Switzerland. This article is an open access article distributed under the terms and conditions of the Creative Commons Attribution (CC BY) license (https:// creativecommons.org/licenses/by/ 4.0/). applied sciences Article Evaluating the Design Criteria for Light Embankment Piling: Timber Piles in Road and Railway Foundations Per Gunnvard * , Hans Mattsson and Jan Laue Department of Civil, Environmental and Natural Resources Engineering, Luleå University of Technology, 971 87 Luleå, Sweden; [email protected] (H.M.); [email protected] (J.L.) * Correspondence: [email protected]; Tel.: +46-920-493-582 Abstract: Three-dimensional finite element (FE) simulations were performed to further develop the Swedish design guidelines for geogrid-reinforced timber pile-supported embankments, also known as lightly piled embankments. Lightly piled embankments are constructed mainly in areas which typically have highly compressible soils, and the method utilises untreated timber piles as its key feature. The timber piles are installed in a triangular arrangement instead of the more common square arrangement, with a centre-to-centre distance of 0.8–1.2 m. The aim of this study was to evaluate the current standard using FE modelling setups with square and triangular pile arrangements with varying centre-to-centre distances, based on a typical road foundation case. The evaluation mainly focused on comparing the embankment settlements, as well as the load and stress distribution in the embankment, the piles and the geosynthetic reinforcement. As part of the evaluation, a state- of-the-art study was done on international design guidelines and analytical models. From the FE simulations, no evident difference in mechanical behaviour was found between the triangular and square piling patterns. The maximum allowed centre-to-centre distance between piles can potentially be increased to 1.4 m, decreasing the number of piles by as much as one third. Keywords: geosynthetic-reinforced pile-supported embankments; timber piles; square grid; triangular grid; arching; FEM 1. Introduction Piled embankments with basal reinforcement are widely used as a foundation method for roads and railways on soft soils. This foundation method, known as geosynthetic- reinforced pile-supported embankment (GRPSE), has a short construction time and creates an efficient reduction of both the vertical and the horizontal displacements. The geosyn- thetic reinforcement used in GRPSE consists of one or more layers of woven textiles or synthetic polymeric textiles or grids. Currently there is some uncertainty in the Swedish industry concerning the optimum design of GRPSE with untreated timber piles, also called the lightly piled embankment method. The uncertainty lies in the optimal centre-to-centre pile spacing and pile arrangement, as well as the need for geosynthetic reinforcement to fulfil the serviceability state of the road or railway construction. The lightly piled embank- ment method is currently used in Sweden mainly for loose clays and silts, with untreated timber piles as its key feature. The method is used solely for settlement reduction, as the increase in stability is not considered in current Swedish practice. The goal of the Swedish Transport Administration is to make the method an accepted and widely used road and railway foundation option for soft soils, as timber piles are more sustainable than steel and concrete piles. Aside from Sweden, timber piles are also widely used in the US, Canada, Australia, and the Netherlands [1]. Notable GRPSE projects with timber piles include the Kyoto Road in Giessenburg, the Netherlands [2] and the Port Mann Highway 1 Improvement Project in Vancouver, British Columbia, Canada [3]. However, Sweden is the only country with an Appl. Sci. 2022, 12, 166. https://doi.org/10.3390/app12010166 https://www.mdpi.com/journal/applsci
-
Upload
khangminh22 -
Category
Documents
-
view
1 -
download
0
Transcript of Evaluating the Design Criteria for Light Embankment Piling
�����������������
Citation: Gunnvard, P.; Mattsson, H.;
Laue, J. Evaluating the Design
Criteria for Light Embankment Piling:
Timber Piles in Road and Railway
Foundations. Appl. Sci. 2022, 12, 166.
https://doi.org/10.3390/app12010166
Academic Editors: Gye-Chun Cho
and Ilhan Chang
Received: 10 November 2021
Accepted: 10 December 2021
Published: 24 December 2021
Publisher’s Note: MDPI stays neutral
with regard to jurisdictional claims in
published maps and institutional affil-
iations.
Copyright: © 2021 by the authors.
Licensee MDPI, Basel, Switzerland.
This article is an open access article
distributed under the terms and
conditions of the Creative Commons
Attribution (CC BY) license (https://
creativecommons.org/licenses/by/
4.0/).
applied sciences
Article
Evaluating the Design Criteria for Light Embankment Piling:Timber Piles in Road and Railway Foundations
Per Gunnvard * , Hans Mattsson and Jan Laue
Department of Civil, Environmental and Natural Resources Engineering, Luleå University of Technology,971 87 Luleå, Sweden; [email protected] (H.M.); [email protected] (J.L.)* Correspondence: [email protected]; Tel.: +46-920-493-582
Abstract: Three-dimensional finite element (FE) simulations were performed to further develop theSwedish design guidelines for geogrid-reinforced timber pile-supported embankments, also knownas lightly piled embankments. Lightly piled embankments are constructed mainly in areas whichtypically have highly compressible soils, and the method utilises untreated timber piles as its keyfeature. The timber piles are installed in a triangular arrangement instead of the more common squarearrangement, with a centre-to-centre distance of 0.8–1.2 m. The aim of this study was to evaluatethe current standard using FE modelling setups with square and triangular pile arrangements withvarying centre-to-centre distances, based on a typical road foundation case. The evaluation mainlyfocused on comparing the embankment settlements, as well as the load and stress distribution inthe embankment, the piles and the geosynthetic reinforcement. As part of the evaluation, a state-of-the-art study was done on international design guidelines and analytical models. From the FEsimulations, no evident difference in mechanical behaviour was found between the triangular andsquare piling patterns. The maximum allowed centre-to-centre distance between piles can potentiallybe increased to 1.4 m, decreasing the number of piles by as much as one third.
Keywords: geosynthetic-reinforced pile-supported embankments; timber piles; square grid; triangulargrid; arching; FEM
1. Introduction
Piled embankments with basal reinforcement are widely used as a foundation methodfor roads and railways on soft soils. This foundation method, known as geosynthetic-reinforced pile-supported embankment (GRPSE), has a short construction time and createsan efficient reduction of both the vertical and the horizontal displacements. The geosyn-thetic reinforcement used in GRPSE consists of one or more layers of woven textiles orsynthetic polymeric textiles or grids. Currently there is some uncertainty in the Swedishindustry concerning the optimum design of GRPSE with untreated timber piles, also calledthe lightly piled embankment method. The uncertainty lies in the optimal centre-to-centrepile spacing and pile arrangement, as well as the need for geosynthetic reinforcement tofulfil the serviceability state of the road or railway construction. The lightly piled embank-ment method is currently used in Sweden mainly for loose clays and silts, with untreatedtimber piles as its key feature. The method is used solely for settlement reduction, as theincrease in stability is not considered in current Swedish practice. The goal of the SwedishTransport Administration is to make the method an accepted and widely used road andrailway foundation option for soft soils, as timber piles are more sustainable than steel andconcrete piles.
Aside from Sweden, timber piles are also widely used in the US, Canada, Australia,and the Netherlands [1]. Notable GRPSE projects with timber piles include the Kyoto Roadin Giessenburg, the Netherlands [2] and the Port Mann Highway 1 Improvement Project inVancouver, British Columbia, Canada [3]. However, Sweden is the only country with an
Appl. Sci. 2022, 12, 166. https://doi.org/10.3390/app12010166 https://www.mdpi.com/journal/applsci
Appl. Sci. 2022, 12, 166 2 of 32
explicit standard or recommendation for GRPSE with untreated timber piles. In Indonesia,there exist guidelines for thinner timber piles (8–10 cm in diameter) or bamboo piles [4].
The aims of the main project, of which the present study is part, are to clarify themechanical behaviour of lightly piled embankments and to create a guide for optimaldesign for different conditions that involve road or railway embankments on soft subsoil.The focus of this project is on Swedish conditions with soft clay or silt layers on glacialtill. However, similar conditions are frequently found globally, making the results of theproject applicable outside of Sweden as well. A theoretical analysis of the construction wasperformed based on three-dimensional (3D) finite element (FE) modelling, verified by fieldand laboratory experiments.
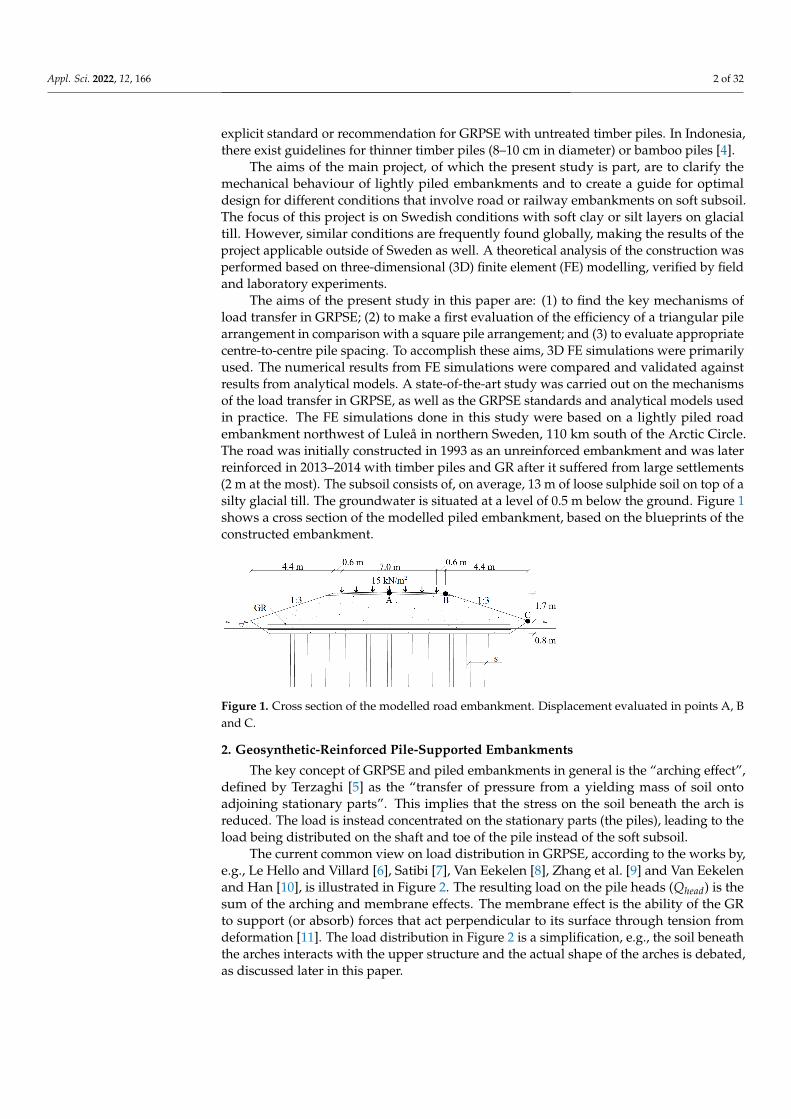
The aims of the present study in this paper are: (1) to find the key mechanisms ofload transfer in GRPSE; (2) to make a first evaluation of the efficiency of a triangular pilearrangement in comparison with a square pile arrangement; and (3) to evaluate appropriatecentre-to-centre pile spacing. To accomplish these aims, 3D FE simulations were primarilyused. The numerical results from FE simulations were compared and validated againstresults from analytical models. A state-of-the-art study was carried out on the mechanismsof the load transfer in GRPSE, as well as the GRPSE standards and analytical models usedin practice. The FE simulations done in this study were based on a lightly piled roadembankment northwest of Luleå in northern Sweden, 110 km south of the Arctic Circle.The road was initially constructed in 1993 as an unreinforced embankment and was laterreinforced in 2013–2014 with timber piles and GR after it suffered from large settlements(2 m at the most). The subsoil consists of, on average, 13 m of loose sulphide soil on top of asilty glacial till. The groundwater is situated at a level of 0.5 m below the ground. Figure 1shows a cross section of the modelled piled embankment, based on the blueprints of theconstructed embankment.
Appl. Sci. 2022, 12, x FOR PEER REVIEW 2 of 33
Road in Giessenburg, the Netherlands [2] and the Port Mann Highway 1 Improvement Project in Vancouver, British Columbia, Canada [3]. However, Sweden is the only country with an explicit standard or recommendation for GRPSE with untreated timber piles. In Indonesia, there exist guidelines for thinner timber piles (8–10 cm in diameter) or bamboo piles [4].
The aims of the main project, of which the present study is part, are to clarify the mechanical behaviour of lightly piled embankments and to create a guide for optimal design for different conditions that involve road or railway embankments on soft subsoil. The focus of this project is on Swedish conditions with soft clay or silt layers on glacial till. However, similar conditions are frequently found globally, making the results of the project applicable outside of Sweden as well. A theoretical analysis of the construction was performed based on three-dimensional (3D) finite element (FE) modelling, verified by field and laboratory experiments.
The aims of the present study in this paper are: (1) to find the key mechanisms of load transfer in GRPSE; (2) to make a first evaluation of the efficiency of a triangular pile arrangement in comparison with a square pile arrangement; and (3) to evaluate appropriate centre-to-centre pile spacing. To accomplish these aims, 3D FE simulations were primarily used. The numerical results from FE simulations were compared and validated against results from analytical models. A state-of-the-art study was carried out on the mechanisms of the load transfer in GRPSE, as well as the GRPSE standards and analytical models used in practice. The FE simulations done in this study were based on a lightly piled road embankment northwest of Luleå in northern Sweden, 110 km south of the Arctic Circle. The road was initially constructed in 1993 as an unreinforced embankment and was later reinforced in 2013–2014 with timber piles and GR after it suffered from large settlements (2 m at the most). The subsoil consists of, on average, 13 m of loose sulphide soil on top of a silty glacial till. The groundwater is situated at a level of 0.5 m below the ground. Figure 1 shows a cross section of the modelled piled embankment, based on the blueprints of the constructed embankment.
Figure 1. Cross section of the modelled road embankment. Displacement evaluated in points A, B and C.
2. Geosynthetic-Reinforced Pile-Supported Embankments The key concept of GRPSE and piled embankments in general is the “arching effect”,
defined by Terzaghi [5] as the “transfer of pressure from a yielding mass of soil onto adjoining stationary parts”. This implies that the stress on the soil beneath the arch is reduced. The load is instead concentrated on the stationary parts (the piles), leading to the load being distributed on the shaft and toe of the pile instead of the soft subsoil.
The current common view on load distribution in GRPSE, according to the works by, e.g., Le Hello and Villard [6], Satibi [7], Van Eekelen [8], Zhang et al. [9] and Van Eekelen and Han [10], is illustrated in Figure 2. The resulting load on the pile heads (𝑄 ) is the sum of the arching and membrane effects. The membrane effect is the ability of the GR to support (or absorb) forces that act perpendicular to its surface through tension from deformation [11]. The load distribution in Figure 2 is a simplification, e.g., the soil beneath
Figure 1. Cross section of the modelled road embankment. Displacement evaluated in points A, Band C.
2. Geosynthetic-Reinforced Pile-Supported Embankments
The key concept of GRPSE and piled embankments in general is the “arching effect”,defined by Terzaghi [5] as the “transfer of pressure from a yielding mass of soil ontoadjoining stationary parts”. This implies that the stress on the soil beneath the arch isreduced. The load is instead concentrated on the stationary parts (the piles), leading to theload being distributed on the shaft and toe of the pile instead of the soft subsoil.
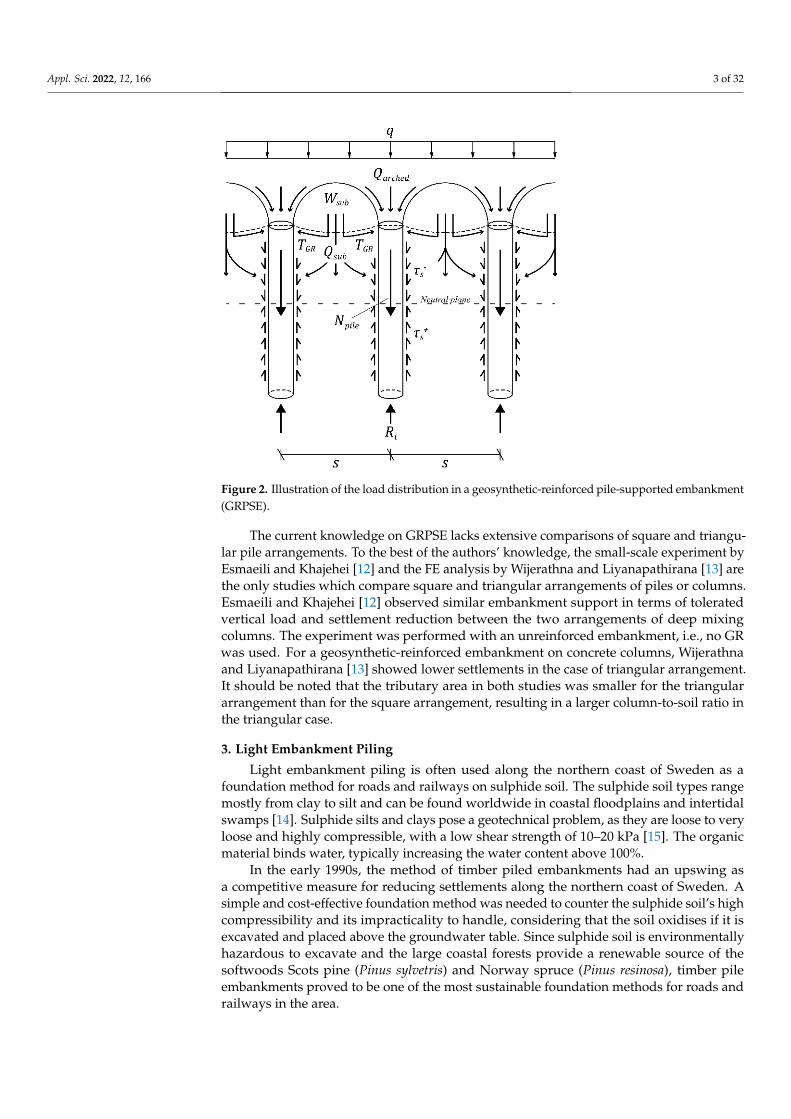
The current common view on load distribution in GRPSE, according to the works by,e.g., Le Hello and Villard [6], Satibi [7], Van Eekelen [8], Zhang et al. [9] and Van Eekelenand Han [10], is illustrated in Figure 2. The resulting load on the pile heads (Qhead) is thesum of the arching and membrane effects. The membrane effect is the ability of the GRto support (or absorb) forces that act perpendicular to its surface through tension fromdeformation [11]. The load distribution in Figure 2 is a simplification, e.g., the soil beneaththe arches interacts with the upper structure and the actual shape of the arches is debated,as discussed later in this paper.
Appl. Sci. 2022, 12, 166 3 of 32
Appl. Sci. 2022, 12, x FOR PEER REVIEW 3 of 33
the arches interacts with the upper structure and the actual shape of the arches is debated, as discussed later in this paper.
Figure 2. Illustration of the load distribution in a geosynthetic-reinforced pile-supported embankment (GRPSE).
The current knowledge on GRPSE lacks extensive comparisons of square and triangular pile arrangements. To the best of the authors’ knowledge, the small-scale experiment by Esmaeili and Khajehei [12] and the FE analysis by Wijerathna and Liyanapathirana [13] are the only studies which compare square and triangular arrangements of piles or columns. Esmaeili and Khajehei [12] observed similar embankment support in terms of tolerated vertical load and settlement reduction between the two arrangements of deep mixing columns. The experiment was performed with an unreinforced embankment, i.e., no GR was used. For a geosynthetic-reinforced embankment on concrete columns, Wijerathna and Liyanapathirana [13] showed lower settlements in the case of triangular arrangement. It should be noted that the tributary area in both studies was smaller for the triangular arrangement than for the square arrangement, resulting in a larger column-to-soil ratio in the triangular case.
3. Light Embankment Piling Light embankment piling is often used along the northern coast of Sweden as a
foundation method for roads and railways on sulphide soil. The sulphide soil types range mostly from clay to silt and can be found worldwide in coastal floodplains and intertidal swamps [14]. Sulphide silts and clays pose a geotechnical problem, as they are loose to very loose and highly compressible, with a low shear strength of 10–20 kPa [15]. The organic material binds water, typically increasing the water content above 100%.
In the early 1990s, the method of timber piled embankments had an upswing as a competitive measure for reducing settlements along the northern coast of Sweden. A simple and cost-effective foundation method was needed to counter the sulphide soil’s high compressibility and its impracticality to handle, considering that the soil oxidises if it is excavated and placed above the groundwater table. Since sulphide soil is environmentally hazardous to excavate and the large coastal forests provide a renewable source of the softwoods Scots pine (Pinus sylvetris) and Norway spruce (Pinus resinosa),
Figure 2. Illustration of the load distribution in a geosynthetic-reinforced pile-supported embankment(GRPSE).
The current knowledge on GRPSE lacks extensive comparisons of square and triangu-lar pile arrangements. To the best of the authors’ knowledge, the small-scale experiment byEsmaeili and Khajehei [12] and the FE analysis by Wijerathna and Liyanapathirana [13] arethe only studies which compare square and triangular arrangements of piles or columns.Esmaeili and Khajehei [12] observed similar embankment support in terms of toleratedvertical load and settlement reduction between the two arrangements of deep mixingcolumns. The experiment was performed with an unreinforced embankment, i.e., no GRwas used. For a geosynthetic-reinforced embankment on concrete columns, Wijerathnaand Liyanapathirana [13] showed lower settlements in the case of triangular arrangement.It should be noted that the tributary area in both studies was smaller for the triangulararrangement than for the square arrangement, resulting in a larger column-to-soil ratio inthe triangular case.
3. Light Embankment Piling
Light embankment piling is often used along the northern coast of Sweden as afoundation method for roads and railways on sulphide soil. The sulphide soil types rangemostly from clay to silt and can be found worldwide in coastal floodplains and intertidalswamps [14]. Sulphide silts and clays pose a geotechnical problem, as they are loose to veryloose and highly compressible, with a low shear strength of 10–20 kPa [15]. The organicmaterial binds water, typically increasing the water content above 100%.
In the early 1990s, the method of timber piled embankments had an upswing asa competitive measure for reducing settlements along the northern coast of Sweden. Asimple and cost-effective foundation method was needed to counter the sulphide soil’s highcompressibility and its impracticality to handle, considering that the soil oxidises if it isexcavated and placed above the groundwater table. Since sulphide soil is environmentallyhazardous to excavate and the large coastal forests provide a renewable source of thesoftwoods Scots pine (Pinus sylvetris) and Norway spruce (Pinus resinosa), timber pileembankments proved to be one of the most sustainable foundation methods for roads andrailways in the area.
Appl. Sci. 2022, 12, 166 4 of 32
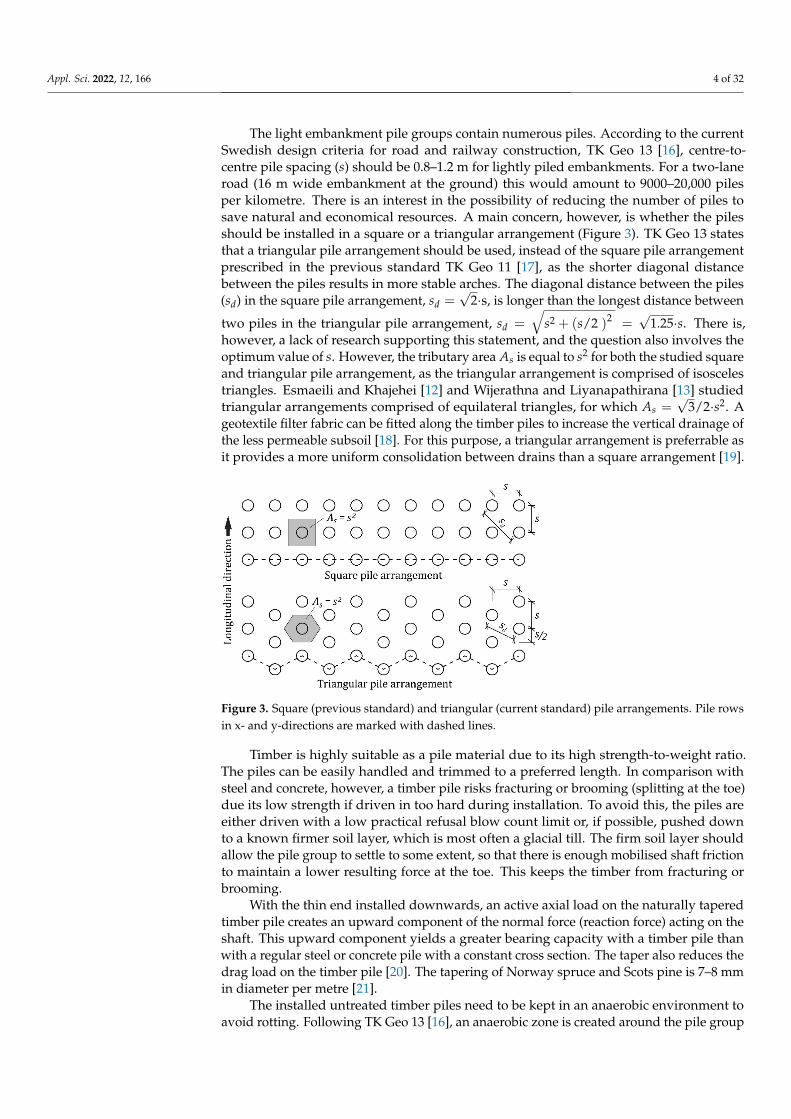
The light embankment pile groups contain numerous piles. According to the currentSwedish design criteria for road and railway construction, TK Geo 13 [16], centre-to-centre pile spacing (s) should be 0.8–1.2 m for lightly piled embankments. For a two-laneroad (16 m wide embankment at the ground) this would amount to 9000–20,000 pilesper kilometre. There is an interest in the possibility of reducing the number of piles tosave natural and economical resources. A main concern, however, is whether the pilesshould be installed in a square or a triangular arrangement (Figure 3). TK Geo 13 statesthat a triangular pile arrangement should be used, instead of the square pile arrangementprescribed in the previous standard TK Geo 11 [17], as the shorter diagonal distancebetween the piles results in more stable arches. The diagonal distance between the piles(sd) in the square pile arrangement, sd =
√2·s, is longer than the longest distance between
two piles in the triangular pile arrangement, sd =√
s2 + (s/2 )2 =√
1.25·s. There is,however, a lack of research supporting this statement, and the question also involves theoptimum value of s. However, the tributary area As is equal to s2 for both the studied squareand triangular pile arrangement, as the triangular arrangement is comprised of isoscelestriangles. Esmaeili and Khajehei [12] and Wijerathna and Liyanapathirana [13] studiedtriangular arrangements comprised of equilateral triangles, for which As =
√3/2·s2. A
geotextile filter fabric can be fitted along the timber piles to increase the vertical drainage ofthe less permeable subsoil [18]. For this purpose, a triangular arrangement is preferrable asit provides a more uniform consolidation between drains than a square arrangement [19].
Appl. Sci. 2022, 12, x FOR PEER REVIEW 4 of 33
timber pile embankments proved to be one of the most sustainable foundation methods for roads and railways in the area.
The light embankment pile groups contain numerous piles. According to the current Swedish design criteria for road and railway construction, TK Geo 13 [16], centre-to-centre pile spacing (𝑠) should be 0.8–1.2 m for lightly piled embankments. For a two-lane road (16 m wide embankment at the ground) this would amount to 9000–20,000 piles per kilometre. There is an interest in the possibility of reducing the number of piles to save natural and economical resources. A main concern, however, is whether the piles should be installed in a square or a triangular arrangement (Figure 3). TK Geo 13 states that a triangular pile arrangement should be used, instead of the square pile arrangement prescribed in the previous standard TK Geo 11 [17], as the shorter diagonal distance between the piles results in more stable arches. The diagonal distance between the piles ( 𝑠 ) in the square pile arrangement, 𝑠 = √2 · s , is longer than the longest distance between two piles in the triangular pile arrangement, 𝑠 = 𝑠 + (𝑠/2 ) = √1.25 · 𝑠. There is, however, a lack of research supporting this statement, and the question also involves the optimum value of 𝑠. However, the tributary area 𝐴 is equal to 𝑠 for both the studied square and triangular pile arrangement, as the triangular arrangement is comprised of isosceles triangles. Esmaeili and Khajehei [12] and Wijerathna and Liyanapathirana [13] studied triangular arrangements comprised of equilateral triangles, for which 𝐴 = √3/2 · 𝑠 . A geotextile filter fabric can be fitted along the timber piles to increase the vertical drainage of the less permeable subsoil [18]. For this purpose, a triangular arrangement is preferrable as it provides a more uniform consolidation between drains than a square arrangement [19].
Figure 3. Square (previous standard) and triangular (current standard) pile arrangements. Pile rows in x- and y-directions are marked with dashed lines.
Timber is highly suitable as a pile material due to its high strength-to-weight ratio. The piles can be easily handled and trimmed to a preferred length. In comparison with steel and concrete, however, a timber pile risks fracturing or brooming (splitting at the toe) due its low strength if driven in too hard during installation. To avoid this, the piles are either driven with a low practical refusal blow count limit or, if possible, pushed down to a known firmer soil layer, which is most often a glacial till. The firm soil layer should allow the pile group to settle to some extent, so that there is enough mobilised shaft friction to maintain a lower resulting force at the toe. This keeps the timber from fracturing or brooming.
With the thin end installed downwards, an active axial load on the naturally tapered timber pile creates an upward component of the normal force (reaction force) acting on the shaft. This upward component yields a greater bearing capacity with a timber pile than with a regular steel or concrete pile with a constant cross section. The taper also
Figure 3. Square (previous standard) and triangular (current standard) pile arrangements. Pile rowsin x- and y-directions are marked with dashed lines.
Timber is highly suitable as a pile material due to its high strength-to-weight ratio.The piles can be easily handled and trimmed to a preferred length. In comparison withsteel and concrete, however, a timber pile risks fracturing or brooming (splitting at the toe)due its low strength if driven in too hard during installation. To avoid this, the piles areeither driven with a low practical refusal blow count limit or, if possible, pushed downto a known firmer soil layer, which is most often a glacial till. The firm soil layer shouldallow the pile group to settle to some extent, so that there is enough mobilised shaft frictionto maintain a lower resulting force at the toe. This keeps the timber from fracturing orbrooming.
With the thin end installed downwards, an active axial load on the naturally taperedtimber pile creates an upward component of the normal force (reaction force) acting on theshaft. This upward component yields a greater bearing capacity with a timber pile thanwith a regular steel or concrete pile with a constant cross section. The taper also reduces thedrag load on the timber pile [20]. The tapering of Norway spruce and Scots pine is 7–8 mmin diameter per metre [21].
The installed untreated timber piles need to be kept in an anaerobic environment toavoid rotting. Following TK Geo 13 [16], an anaerobic zone is created around the pile group
Appl. Sci. 2022, 12, 166 5 of 32
by the saturated subsoil and a 10 cm layer of dense soil with high capillarity placed ontop of the pile heads. The life expectancy of an untreated timber pile encased within apermanently fully saturated soil can be almost indefinite. As per common internationalpractice, if the groundwater level is too deep, the timber piles are extended by a precastconcrete upper section such that the concrete section reaches below the lowest predictedground water level after driving.
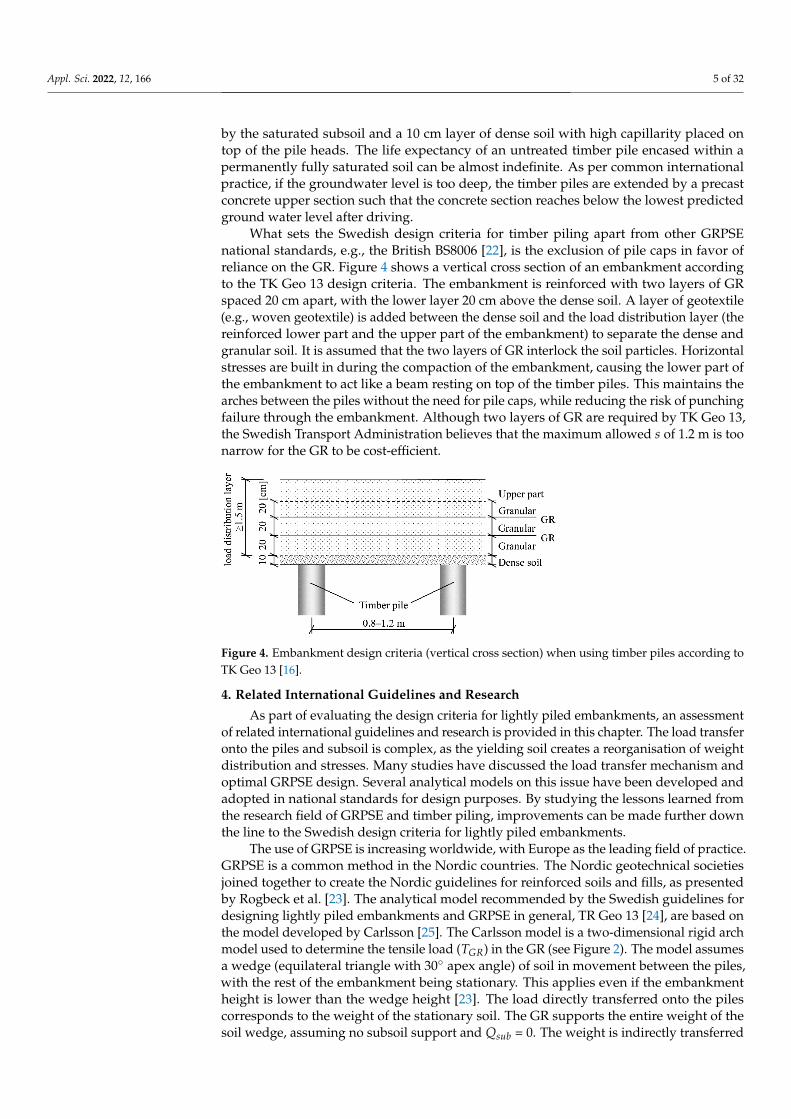
What sets the Swedish design criteria for timber piling apart from other GRPSEnational standards, e.g., the British BS8006 [22], is the exclusion of pile caps in favor ofreliance on the GR. Figure 4 shows a vertical cross section of an embankment accordingto the TK Geo 13 design criteria. The embankment is reinforced with two layers of GRspaced 20 cm apart, with the lower layer 20 cm above the dense soil. A layer of geotextile(e.g., woven geotextile) is added between the dense soil and the load distribution layer (thereinforced lower part and the upper part of the embankment) to separate the dense andgranular soil. It is assumed that the two layers of GR interlock the soil particles. Horizontalstresses are built in during the compaction of the embankment, causing the lower part ofthe embankment to act like a beam resting on top of the timber piles. This maintains thearches between the piles without the need for pile caps, while reducing the risk of punchingfailure through the embankment. Although two layers of GR are required by TK Geo 13,the Swedish Transport Administration believes that the maximum allowed s of 1.2 m is toonarrow for the GR to be cost-efficient.
Appl. Sci. 2022, 12, x FOR PEER REVIEW 5 of 33
reduces the drag load on the timber pile [20]. The tapering of Norway spruce and Scots pine is 7–8 mm in diameter per metre [21].
The installed untreated timber piles need to be kept in an anaerobic environment to avoid rotting. Following TK Geo 13 [16], an anaerobic zone is created around the pile group by the saturated subsoil and a 10 cm layer of dense soil with high capillarity placed on top of the pile heads. The life expectancy of an untreated timber pile encased within a permanently fully saturated soil can be almost indefinite. As per common international practice, if the groundwater level is too deep, the timber piles are extended by a precast concrete upper section such that the concrete section reaches below the lowest predicted ground water level after driving.
What sets the Swedish design criteria for timber piling apart from other GRPSE national standards, e.g., the British BS8006 [22], is the exclusion of pile caps in favor of reliance on the GR. Figure 4 shows a vertical cross section of an embankment according to the TK Geo 13 design criteria. The embankment is reinforced with two layers of GR spaced 20 cm apart, with the lower layer 20 cm above the dense soil. A layer of geotextile (e.g., woven geotextile) is added between the dense soil and the load distribution layer (the reinforced lower part and the upper part of the embankment) to separate the dense and granular soil. It is assumed that the two layers of GR interlock the soil particles. Horizontal stresses are built in during the compaction of the embankment, causing the lower part of the embankment to act like a beam resting on top of the timber piles. This maintains the arches between the piles without the need for pile caps, while reducing the risk of punching failure through the embankment. Although two layers of GR are required by TK Geo 13, the Swedish Transport Administration believes that the maximum allowed 𝑠 of 1.2 m is too narrow for the GR to be cost-efficient.
Figure 4. Embankment design criteria (vertical cross section) when using timber piles according to TK Geo 13 [16].
4. Related International Guidelines and Research As part of evaluating the design criteria for lightly piled embankments, an
assessment of related international guidelines and research is provided in this chapter. The load transfer onto the piles and subsoil is complex, as the yielding soil creates a reorganisation of weight distribution and stresses. Many studies have discussed the load transfer mechanism and optimal GRPSE design. Several analytical models on this issue have been developed and adopted in national standards for design purposes. By studying the lessons learned from the research field of GRPSE and timber piling, improvements can be made further down the line to the Swedish design criteria for lightly piled embankments.
The use of GRPSE is increasing worldwide, with Europe as the leading field of practice. GRPSE is a common method in the Nordic countries. The Nordic geotechnical societies joined together to create the Nordic guidelines for reinforced soils and fills, as presented by Rogbeck et al. [23]. The analytical model recommended by the Swedish guidelines for designing lightly piled embankments and GRPSE in general, TR Geo 13 [24], are based on the model developed by Carlsson [25]. The Carlsson model is a two-
Figure 4. Embankment design criteria (vertical cross section) when using timber piles according toTK Geo 13 [16].
4. Related International Guidelines and Research
As part of evaluating the design criteria for lightly piled embankments, an assessmentof related international guidelines and research is provided in this chapter. The load transferonto the piles and subsoil is complex, as the yielding soil creates a reorganisation of weightdistribution and stresses. Many studies have discussed the load transfer mechanism andoptimal GRPSE design. Several analytical models on this issue have been developed andadopted in national standards for design purposes. By studying the lessons learned fromthe research field of GRPSE and timber piling, improvements can be made further downthe line to the Swedish design criteria for lightly piled embankments.
The use of GRPSE is increasing worldwide, with Europe as the leading field of practice.GRPSE is a common method in the Nordic countries. The Nordic geotechnical societiesjoined together to create the Nordic guidelines for reinforced soils and fills, as presentedby Rogbeck et al. [23]. The analytical model recommended by the Swedish guidelines fordesigning lightly piled embankments and GRPSE in general, TR Geo 13 [24], are based onthe model developed by Carlsson [25]. The Carlsson model is a two-dimensional rigid archmodel used to determine the tensile load (TGR) in the GR (see Figure 2). The model assumesa wedge (equilateral triangle with 30◦ apex angle) of soil in movement between the piles,with the rest of the embankment being stationary. This applies even if the embankmentheight is lower than the wedge height [23]. The load directly transferred onto the pilescorresponds to the weight of the stationary soil. The GR supports the entire weight of thesoil wedge, assuming no subsoil support and Qsub = 0. The weight is indirectly transferred
Appl. Sci. 2022, 12, 166 6 of 32
onto the pile heads as the GR is suspended between the piles. Thus, the piles are assumedto carry the sum of the embankment and traffic load. The model focuses primarily onthe membrane effect, and secondarily on the arching effect. Rogbeck et al. [26] added amultiplier to the Carlsson model for the calculation of TGR in three dimensions, i.e., TGRper pile instead of per metre. This Extended Carlsson model is the recommended analyticalmodel in Sweden for the design of GRPSE and lightly piled embankments [24].
As an alternative to the Extended Carlsson model, the Nordic guidelines mention amodel developed by the Foundation for Scientific and Industrial Research (SINTEF) inNorway and published in Svanø et al. [27]. As in the Extended Carlsson model, the SINTEFmodel assumes a rigid wedge-shaped arch of soil in movement between the piles andno subsoil support. The main difference between the Extended Carlsson model and theSINTEF model is that the SINTEF model focuses primarily on the arching effect and onlysecondarily on the membrane effect, while the Extended Carlsson model focuses on themin the reverse order. In the SINTEF model, the arched soil acting directly on a pile cap isassumed to form as an upside-down truncated square pyramid. To calculate the weight ofthe soil wedge between the piles, the wedge apex angle can be varied between roughly 30◦
and 45◦. Svanø et al. [27] recommends an apex angle closer to 30◦ for small pile caps, thesame as the fixed apex angle for the Extended Carlsson model. The Extended Carlsson andSINTEF models agree well when the embankment height is higher than the wedge height,i.e., when both models assume full arching [27]. In case of partial arching, i.e., when thearch (wedge) height is higher than the embankment height, the SINTEF model excludesthe top part of the wedge that is higher than the embankment height, and an eventualsurcharge load is instead added over this area. The SINTEF model is not implementedas a national standard. In accordance with the Nordic guidelines, the Norwegian PublicRoads Administration (NPRA) prescribes the Extended Carlsson model in the Norwegianguidelines, Håndbok V221 [28].
Among the other European national standards and recommendations for geotechnicalengineering, there exist several limit equilibrium (LE) models for the design of GRPSE.To the best of the authors’ knowledge, aside from the Extended Carlsson model the threemost commonly used models for GRPSE design are: (1) The H&R model by Hewlett andRandolph [29], used in the British BS8006 [22] and the French ASIRI [30]; (2) the Zaeske [31]model, used in the German EBGEO [32]; and (3) the Concentric Arches (CA) model byVan Eekelen [8], implemented in the Dutch CUR226 [33,34]. All three models consider thetransfer of the load through the arch in limit equilibrium, with the difference being theformation of the arch. The H&R model assumes a single semi-circular arch between thepiles, the Zaeske model assumes nonconcentric semielliptical arches, and the CA modelassumes concentric semicircular arches. The H&R model considers no subsoil support,whereas the Zaeske and CA models take subsoil support into consideration.
Numerical analyses of GRPSE have been performed more often in recent years, bothin the design of single cases and in the verification of new analytical models. Le Helloand Villard [6] coupled discrete element (DE) and FE (DE modelled soil particles and FEmodelled GR), with an emphasis on the membrane effect. Zaeske [31] and Van Eekelen [8]used the FE method to verify the shape of the arches assumed in the Zaeske and CAmodels. Lai et al. [35] studied the formation of soil arching in GRPSE using DE methodsimulations. Bhasi and Rajagopal [36] observed in their FE analysis that the arching effectis not instantaneous, and that the arches fully develop during the consolidation processafter final construction. All of these studies show that it is possible to clearly visualisethe formation of arches with numerical simulations. The effective major principal stress(σ′1) vectors will align tangentially to the arch [8,31,36] and the effective vertical stress (σ′v)will reduce underneath the arches and concentrate around the piles [37], as illustrated inFigure 5.

Appl. Sci. 2022, 12, 166 7 of 32
Appl. Sci. 2022, 12, x FOR PEER REVIEW 7 of 33
after final construction. All of these studies show that it is possible to clearly visualise the formation of arches with numerical simulations. The effective major principal stress (𝜎 ) vectors will align tangentially to the arch [8,31,36] and the effective vertical stress (𝜎𝘷) will reduce underneath the arches and concentrate around the piles [37], as illustrated in Figure 5.
Figure 5. Illustration of the vertical stress reduction due to arching, based on Zaeske [31], and the major principal effective stress (𝜎 ) vectors. Arch shape according to the Concentric Arches model [8].
Rui et al. [38] observed a triangular arch in an unreinforced piled embankment, i.e., no GR, by geotechnical centrifuge trapdoor tests and DE analysis and assuming uniform displacement between the piles. Under similar conditions, da Silva et al. [39] also observed triangular arch formation. Iglesia et al. [40] also used centrifuge trapdoor tests, and showed that the arch in an unreinforced piled embankment changes from curved to triangular, with increasing settlement of the soil beneath the arch.
With one layer of GR lying directly on the pile heads, Van der Peet and Van Eekelen [41] observed the formation of arches in relation to the shear stresses in the load distribution layer in their FE analysis. They observed formation of triangular arches prior to reaching the maximum shear strength, i.e., at ultimate limit state (ULS). Concentric semi-elliptical arches were observed when the subsoil support was removed and the mobilised shear stress reached the maximum shear strength (ULS was reached). In practice, road and railway construction design aims to not reach ULS in order to avoid differential settlements at the surface of the embankment. Semi-elliptical concentric arches were also observed by da Silva et al. [39] in their geotechnical centrifuge trapdoor tests when placing one layer of GR at the base of the embankment and removing the subsoil support (by lowering the trapdoor). Nevertheless, no differential settlement developed at the surface. Rui et al. [37] concluded that the height of a geosynthetic-reinforced embankment needs to be at least 1.5 times the clear spacing between pile caps to avoid differential settlements at the surface. From the combined results of Van der Peet and Van Eekelen [41] and da Silva et al. [39], either triangular or semi-elliptical arches can form in a GRPSE without reaching ULS. The shape of the arch in a GRPSE depends on the displacement of the GR, which in turn is dependent on the subsoil support (and GR stiffness). Subsequently, both the arching and membrane effects depend on subsoil support. In both the FE analysis by Bhasi and Rajagopal [36] and the medium-scale experiment by Van Eekelen [8], the arching effect increased because of the increased GR displacement as the subsoil consolidated. In the tests by Van Eekelen [8], the membrane effect increased as a result of subsoil settlement. The results of the geotechnical centrifuge trapdoor tests by King et al. [42] showed that the maximum arching effect occurs between
Figure 5. Illustration of the vertical stress reduction due to arching, based on Zaeske [31], and themajor principal effective stress (σ′1) vectors. Arch shape according to the Concentric Arches model [8].
Rui et al. [38] observed a triangular arch in an unreinforced piled embankment, i.e.,no GR, by geotechnical centrifuge trapdoor tests and DE analysis and assuming uniformdisplacement between the piles. Under similar conditions, da Silva et al. [39] also observedtriangular arch formation. Iglesia et al. [40] also used centrifuge trapdoor tests, and showedthat the arch in an unreinforced piled embankment changes from curved to triangular, withincreasing settlement of the soil beneath the arch.
With one layer of GR lying directly on the pile heads, Van der Peet and Van Eekelen [41]observed the formation of arches in relation to the shear stresses in the load distributionlayer in their FE analysis. They observed formation of triangular arches prior to reachingthe maximum shear strength, i.e., at ultimate limit state (ULS). Concentric semi-ellipticalarches were observed when the subsoil support was removed and the mobilised shearstress reached the maximum shear strength (ULS was reached). In practice, road andrailway construction design aims to not reach ULS in order to avoid differential settlementsat the surface of the embankment. Semi-elliptical concentric arches were also observed byda Silva et al. [39] in their geotechnical centrifuge trapdoor tests when placing one layerof GR at the base of the embankment and removing the subsoil support (by lowering thetrapdoor). Nevertheless, no differential settlement developed at the surface. Rui et al. [37]concluded that the height of a geosynthetic-reinforced embankment needs to be at least1.5 times the clear spacing between pile caps to avoid differential settlements at the surface.From the combined results of Van der Peet and Van Eekelen [41] and da Silva et al. [39],either triangular or semi-elliptical arches can form in a GRPSE without reaching ULS.The shape of the arch in a GRPSE depends on the displacement of the GR, which in turnis dependent on the subsoil support (and GR stiffness). Subsequently, both the archingand membrane effects depend on subsoil support. In both the FE analysis by Bhasi andRajagopal [36] and the medium-scale experiment by Van Eekelen [8], the arching effectincreased because of the increased GR displacement as the subsoil consolidated. In thetests by Van Eekelen [8], the membrane effect increased as a result of subsoil settlement.The results of the geotechnical centrifuge trapdoor tests by King et al. [42] showed thatthe maximum arching effect occurs between 2 and 4% GR deflection in relation to thepile spacing. Thus, the amount of required subsoil support depends on the stiffness andstrength of the GR, and vice versa.
5. Numerical Modelling of Light Embankment Piling
A road embankment resting on a pile group with a square arrangement can be ap-proximately modelled in a plane strain condition with out-of-plane pile columns as wallswith equivalent rigidity. In the case of a triangular arrangement, the in-plane arrangementis repeated, but in cycles and in the out-of-plane direction, as shown in Figure 3. Trian-
Appl. Sci. 2022, 12, 166 8 of 32
gular arrangements are therefore modelled as a three-dimensional problem. The squarearrangement was primarily modelled in three dimensions in order to compare the twoarrangements under the same conditions. The effects of freezing/thawing were not takeninto consideration in the model.
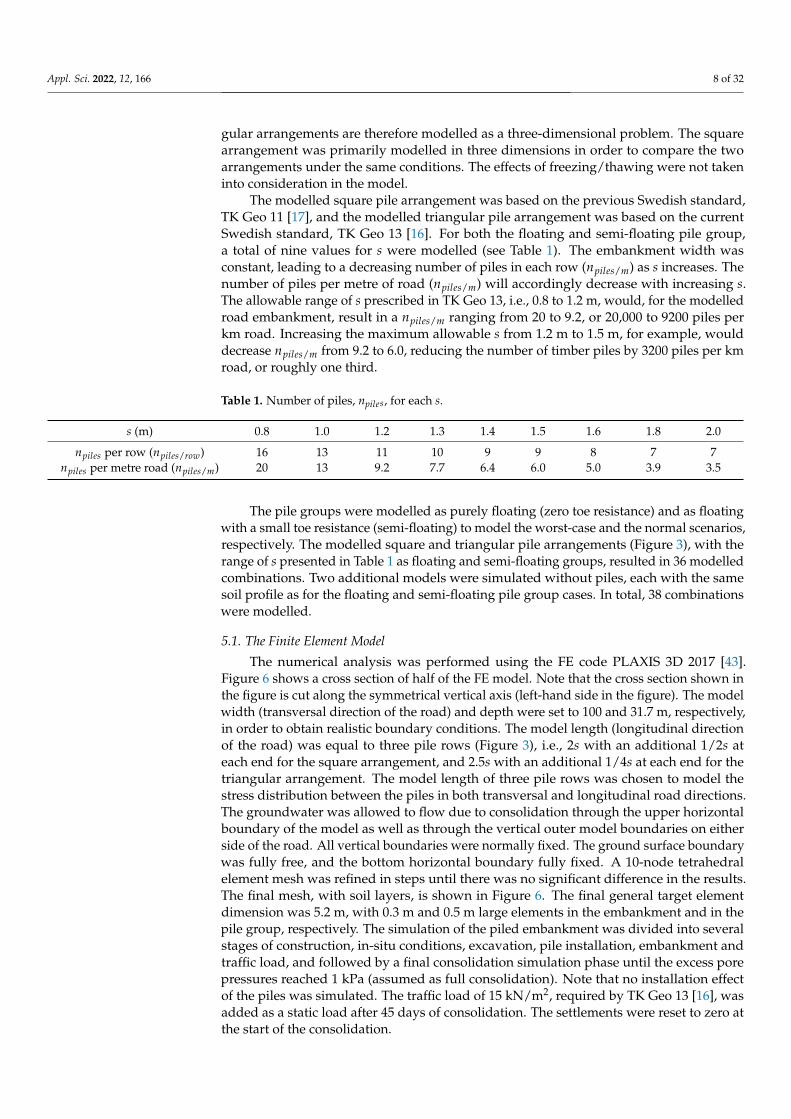
The modelled square pile arrangement was based on the previous Swedish standard,TK Geo 11 [17], and the modelled triangular pile arrangement was based on the currentSwedish standard, TK Geo 13 [16]. For both the floating and semi-floating pile group,a total of nine values for s were modelled (see Table 1). The embankment width wasconstant, leading to a decreasing number of piles in each row (npiles/m) as s increases. Thenumber of piles per metre of road (npiles/m) will accordingly decrease with increasing s.The allowable range of s prescribed in TK Geo 13, i.e., 0.8 to 1.2 m, would, for the modelledroad embankment, result in a npiles/m ranging from 20 to 9.2, or 20,000 to 9200 piles perkm road. Increasing the maximum allowable s from 1.2 m to 1.5 m, for example, woulddecrease npiles/m from 9.2 to 6.0, reducing the number of timber piles by 3200 piles per kmroad, or roughly one third.
Table 1. Number of piles, npiles, for each s.
s (m) 0.8 1.0 1.2 1.3 1.4 1.5 1.6 1.8 2.0
npiles per row (npiles/row) 16 13 11 10 9 9 8 7 7npiles per metre road (npiles/m) 20 13 9.2 7.7 6.4 6.0 5.0 3.9 3.5
The pile groups were modelled as purely floating (zero toe resistance) and as floatingwith a small toe resistance (semi-floating) to model the worst-case and the normal scenarios,respectively. The modelled square and triangular pile arrangements (Figure 3), with therange of s presented in Table 1 as floating and semi-floating groups, resulted in 36 modelledcombinations. Two additional models were simulated without piles, each with the samesoil profile as for the floating and semi-floating pile group cases. In total, 38 combinationswere modelled.
5.1. The Finite Element Model
The numerical analysis was performed using the FE code PLAXIS 3D 2017 [43].Figure 6 shows a cross section of half of the FE model. Note that the cross section shown inthe figure is cut along the symmetrical vertical axis (left-hand side in the figure). The modelwidth (transversal direction of the road) and depth were set to 100 and 31.7 m, respectively,in order to obtain realistic boundary conditions. The model length (longitudinal directionof the road) was equal to three pile rows (Figure 3), i.e., 2s with an additional 1/2s ateach end for the square arrangement, and 2.5s with an additional 1/4s at each end for thetriangular arrangement. The model length of three pile rows was chosen to model thestress distribution between the piles in both transversal and longitudinal road directions.The groundwater was allowed to flow due to consolidation through the upper horizontalboundary of the model as well as through the vertical outer model boundaries on eitherside of the road. All vertical boundaries were normally fixed. The ground surface boundarywas fully free, and the bottom horizontal boundary fully fixed. A 10-node tetrahedralelement mesh was refined in steps until there was no significant difference in the results.The final mesh, with soil layers, is shown in Figure 6. The final general target elementdimension was 5.2 m, with 0.3 m and 0.5 m large elements in the embankment and in thepile group, respectively. The simulation of the piled embankment was divided into severalstages of construction, in-situ conditions, excavation, pile installation, embankment andtraffic load, and followed by a final consolidation simulation phase until the excess porepressures reached 1 kPa (assumed as full consolidation). Note that no installation effectof the piles was simulated. The traffic load of 15 kN/m2, required by TK Geo 13 [16], wasadded as a static load after 45 days of consolidation. The settlements were reset to zero atthe start of the consolidation.

Appl. Sci. 2022, 12, 166 9 of 32
Appl. Sci. 2022, 12, x FOR PEER REVIEW 9 of 33
The final general target element dimension was 5.2 m, with 0.3 m and 0.5 m large elements in the embankment and in the pile group, respectively. The simulation of the piled embankment was divided into several stages of construction, in-situ conditions, excavation, pile installation, embankment and traffic load, and followed by a final consolidation simulation phase until the excess pore pressures reached 1 kPa (assumed as full consolidation). Note that no installation effect of the piles was simulated. The traffic load of 15 kN/m2, required by TK Geo 13 [16], was added as a static load after 45 days of consolidation. The settlements were reset to zero at the start of the consolidation.
Figure 6. Cross-section of the semi-floating pile group model and element mesh. Soil layer thickness for the floating pile group model is in parentheses.
5.1.1. The Piles In FE modelling, piles are typically modelled as mesh element clusters with the actual
geometry and properties of the real pile, referred to in this paper as “volume piles” (Figure 7d). Pile–soil interaction (toe resistance and shaft friction) is manually applied with an interface, permitting soil arching to be modelled locally along the pile. The interface simulates the thin zone of intensely shearing soil at the contact between the pile outer surface and the soil, as the pile is expected to settle relative to the soil during loading of the pile group. The use of volume piles is limited by the size of a pile in relation to the overall model size. The common practice in FE modelling is to use larger and fewer mesh elements when possible in order to keep the computation time shorter, since every mesh element requires computation. Volume piles require a small ratio between the mesh element size and the pile diameter to maintain sufficient simulation accuracy. The mesh element size is dependent on the model size.
Figure 6. Cross-section of the semi-floating pile group model and element mesh. Soil layer thicknessfor the floating pile group model is in parentheses.
5.1.1. The Piles
In FE modelling, piles are typically modelled as mesh element clusters with theactual geometry and properties of the real pile, referred to in this paper as “volume piles”(Figure 7d). Pile–soil interaction (toe resistance and shaft friction) is manually applied withan interface, permitting soil arching to be modelled locally along the pile. The interfacesimulates the thin zone of intensely shearing soil at the contact between the pile outersurface and the soil, as the pile is expected to settle relative to the soil during loading of thepile group. The use of volume piles is limited by the size of a pile in relation to the overallmodel size. The common practice in FE modelling is to use larger and fewer mesh elementswhen possible in order to keep the computation time shorter, since every mesh elementrequires computation. Volume piles require a small ratio between the mesh element sizeand the pile diameter to maintain sufficient simulation accuracy. The mesh element size isdependent on the model size.
Appl. Sci. 2022, 12, x FOR PEER REVIEW 10 of 33
Figure 7. Illustration of ways of modelling piles: (a) embedded beam with pile head in level with the transition between embankment and subsoil; (b) embedded beam with an extension, length 𝐿 , into the embankment with shaft resistance 𝜏 ; (c) embedded beam with a plate fixed to the node at the pile head; and (d) volume pile. 𝐿 is the pile length.
In the work presented in this paper, the pile diameter was too small in relation to the model size to generate a time-efficient mesh for volume piles. Instead, each pile was modelled as an embedded beam (EB) (Figure 7a–c). An EB consists of a line element (beam) with a stiffness equivalent to, in this case, a timber pile. The pile–soil interface is modelled with a node-to-node interaction in the form of two linear elastic-perfectly plastic springs for each pair of nodes; one elastic-perfectly plastic spring models the gap displacement and the other models slip displacement. In addition, a region of the soil surrounding the EB is given elastic properties, to give an overall behaviour similar to that of a volume pile. This elastic region is divided into two parts: a cylindrical region around the pile shaft and a hemispherical region encasing the pile toe. Both geometrical parts have a diameter equal to that of the modelled pile. In contrast to volume piles, EBs go through the generated mesh, allowing a continuous mesh. Thus, EBs can be used for cases where the pile diameter is small in relation to the model size, saving computation time. The mesh size controls the resolution of springs in the pile–soil interface, not the line element itself. More information about EBs can be found in the study by Tschuchnigg and Schweiger [44].
Modelling a GRPSE and piled embankments in general requires realistic modelling of the load transferred directly onto the piles through the arches (𝑄 ). With no pile caps prescribed for lightly piled embankments [16], 𝑄 is carried directly by the pile head. As an EB has no true volume, and thus no pile head surface, the axial load is subsequently zero at the pile head (𝑄 = 0) when modelling in Figure 7a. In addition, any expected moment at the pile head is zero. Transferring a load onto the top node of an embedded beam (in this case the pile head) is done either by applying a point load on the top node or by attaching the top node to a structure, e.g., a plate element. A third option is to extend the pile into the embankment (Figure 7b) according to 𝑄 = 𝜏 ∙ 𝜃 ∙ 𝐿 (1)
where 𝜏 is the shaft resistance of the extension, 𝜃 is the circumference of the extension, and 𝐿 is the extension length. Each variable of Equation (1) is set to result in a pre-known value of 𝑄 , giving the correct load onto the pile heads in the FE model. This also allows moment forces in level with the pile head. However, neither the case shown in Figure 7a nor that in Figure 7b generates arching. The lack of arching in the case of Figure 7a was observed by Gunnvard et al. [45] in the FE simulations presented in the same road embankment case as simulated in this paper. For the simulations presented in
Figure 7. Illustration of ways of modelling piles: (a) embedded beam with pile head in level with thetransition between embankment and subsoil; (b) embedded beam with an extension, length Lext, intothe embankment with shaft resistance τext; (c) embedded beam with a plate fixed to the node at thepile head; and (d) volume pile. Lpile is the pile length.
In the work presented in this paper, the pile diameter was too small in relation tothe model size to generate a time-efficient mesh for volume piles. Instead, each pile was

Appl. Sci. 2022, 12, 166 10 of 32
modelled as an embedded beam (EB) (Figure 7a–c). An EB consists of a line element (beam)with a stiffness equivalent to, in this case, a timber pile. The pile–soil interface is modelledwith a node-to-node interaction in the form of two linear elastic-perfectly plastic springsfor each pair of nodes; one elastic-perfectly plastic spring models the gap displacement andthe other models slip displacement. In addition, a region of the soil surrounding the EB isgiven elastic properties, to give an overall behaviour similar to that of a volume pile. Thiselastic region is divided into two parts: a cylindrical region around the pile shaft and ahemispherical region encasing the pile toe. Both geometrical parts have a diameter equal tothat of the modelled pile. In contrast to volume piles, EBs go through the generated mesh,allowing a continuous mesh. Thus, EBs can be used for cases where the pile diameter issmall in relation to the model size, saving computation time. The mesh size controls theresolution of springs in the pile–soil interface, not the line element itself. More informationabout EBs can be found in the study by Tschuchnigg and Schweiger [44].
Modelling a GRPSE and piled embankments in general requires realistic modelling ofthe load transferred directly onto the piles through the arches (Qhead). With no pile capsprescribed for lightly piled embankments [16], Qhead is carried directly by the pile head. Asan EB has no true volume, and thus no pile head surface, the axial load is subsequentlyzero at the pile head (Qhead = 0) when modelling in Figure 7a. In addition, any expectedmoment at the pile head is zero. Transferring a load onto the top node of an embeddedbeam (in this case the pile head) is done either by applying a point load on the top node orby attaching the top node to a structure, e.g., a plate element. A third option is to extendthe pile into the embankment (Figure 7b) according to
Qhead = τext·θext·Lext (1)
where τext is the shaft resistance of the extension, θext is the circumference of the extension,and Lext is the extension length. Each variable of Equation (1) is set to result in a pre-known value of Qhead, giving the correct load onto the pile heads in the FE model. Thisalso allows moment forces in level with the pile head. However, neither the case shownin Figure 7a nor that in Figure 7b generates arching. The lack of arching in the case ofFigure 7a was observed by Gunnvard et al. [45] in the FE simulations presented in thesame road embankment case as simulated in this paper. For the simulations presented inthis paper, the pile head was added as a rigid plate (Figure 7c) to generate arching. Therigid plate is defined as a completely rigid surface element that can move but cannot bedeformed. Displacement and rotation of the rigid plate is based on the stiffness of themedia connected to it (in this case the EB in the soft subsoil) and its moment of inertia,respectively. The connection between the top and the rigid plate is fully rigid. Thus, bymodelling the embedded beams as in Figure 7c, the load is transferred through the pilehead onto the pile in a similar fashion as for a volume pile, while also allowing arches toform. The rigid plate was modelled as an octagon to keep the contour as simple as possiblefor the meshing algorithm. The long diagonal of the octagonal rigid plate was equal to thepile diameter. An interface was added to the top of the rigid plate, with its thickness setequal to the height of an equilateral triangle of stationary soil on top of the pile head, withthe apex angle equal to the friction angle of the embankment soil material [46].
To test the method of modelling each pile as an EB with a rigid plate, comparisons ofthe axial pile load as well as Qhead and the effective major principal stress (σ′1) vectors weremade for the methods of modelling in Figure 7. A separate simplified model of a single pilein a square pile group with s = 1.4 m was simulated. The embankment height (H) was set to2.0 m, the average height of the embankment in Figure 1, with a unit weight of 20 kN/m3.For the comparison, the maximum shaft and toe resistance of each EB was set equal to theshear strength of the modelled adjacent soil to equal the maximum shaft and toe resistancesof the volume pile. The extension of the embedded beam with extension (Figure 7c) hada length (Lext) of 0.4 m and the shaft resistance (τext) was set according to Equation (1)to give a load at the pile head (Qhead) equal to the simulated Qhead of the volume pile.The embedded beam with extension (Figure 7b) and plate (Figure 7c) resulted in similar
Appl. Sci. 2022, 12, 166 11 of 32
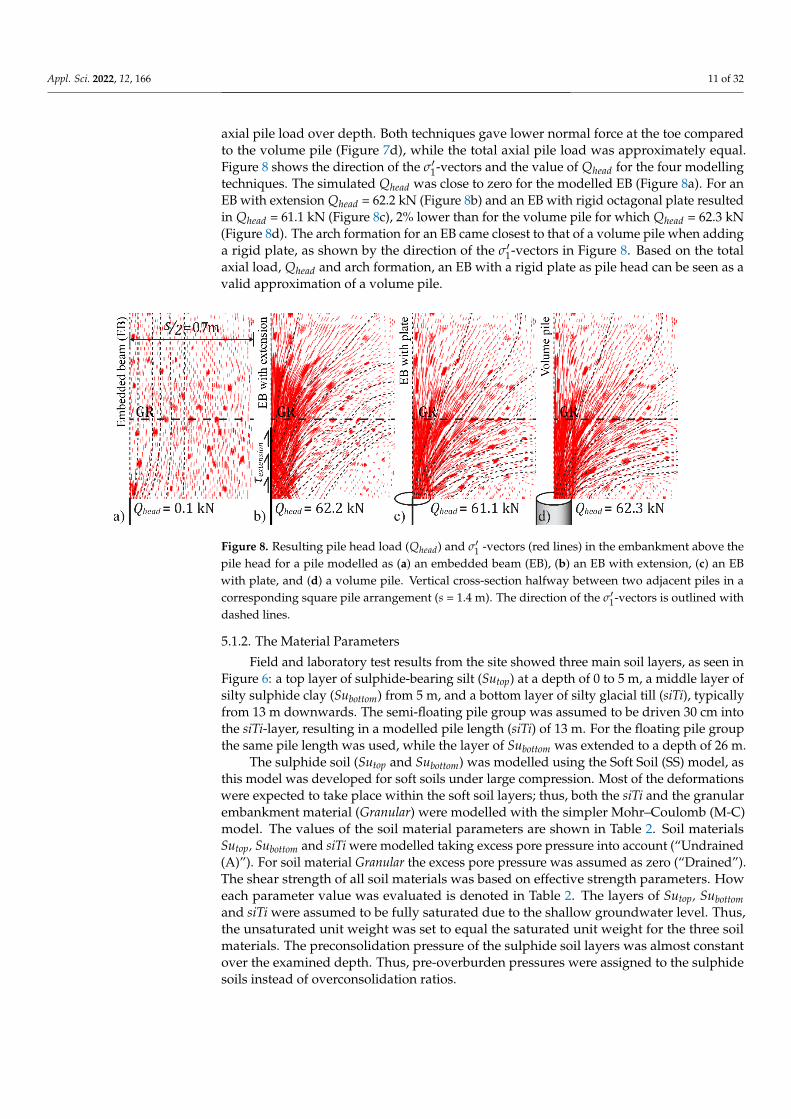
axial pile load over depth. Both techniques gave lower normal force at the toe comparedto the volume pile (Figure 7d), while the total axial pile load was approximately equal.Figure 8 shows the direction of the σ′1-vectors and the value of Qhead for the four modellingtechniques. The simulated Qhead was close to zero for the modelled EB (Figure 8a). For anEB with extension Qhead = 62.2 kN (Figure 8b) and an EB with rigid octagonal plate resultedin Qhead = 61.1 kN (Figure 8c), 2% lower than for the volume pile for which Qhead = 62.3 kN(Figure 8d). The arch formation for an EB came closest to that of a volume pile when addinga rigid plate, as shown by the direction of the σ′1-vectors in Figure 8. Based on the totalaxial load, Qhead and arch formation, an EB with a rigid plate as pile head can be seen as avalid approximation of a volume pile.
Appl. Sci. 2022, 12, x FOR PEER REVIEW 11 of 33
this paper, the pile head was added as a rigid plate (Figure 7c) to generate arching. The rigid plate is defined as a completely rigid surface element that can move but cannot be deformed. Displacement and rotation of the rigid plate is based on the stiffness of the media connected to it (in this case the EB in the soft subsoil) and its moment of inertia, respectively. The connection between the top and the rigid plate is fully rigid. Thus, by modelling the embedded beams as in Figure 7c, the load is transferred through the pile head onto the pile in a similar fashion as for a volume pile, while also allowing arches to form. The rigid plate was modelled as an octagon to keep the contour as simple as possible for the meshing algorithm. The long diagonal of the octagonal rigid plate was equal to the pile diameter. An interface was added to the top of the rigid plate, with its thickness set equal to the height of an equilateral triangle of stationary soil on top of the pile head, with the apex angle equal to the friction angle of the embankment soil material [46].
To test the method of modelling each pile as an EB with a rigid plate, comparisons of the axial pile load as well as 𝑄 and the effective major principal stress (𝜎 ) vectors were made for the methods of modelling in Figure 7. A separate simplified model of a single pile in a square pile group with 𝑠 = 1.4 m was simulated. The embankment height (𝐻) was set to 2.0 m, the average height of the embankment in Figure 1, with a unit weight of 20 kN/m3. For the comparison, the maximum shaft and toe resistance of each EB was set equal to the shear strength of the modelled adjacent soil to equal the maximum shaft and toe resistances of the volume pile. The extension of the embedded beam with extension (Figure 7c) had a length (𝐿 ) of 0.4 m and the shaft resistance (𝜏 ) was set according to Equation (1) to give a load at the pile head (𝑄 ) equal to the simulated 𝑄 of the volume pile. The embedded beam with extension (Figure 7b) and plate (Figure 7c) resulted in similar axial pile load over depth. Both techniques gave lower normal force at the toe compared to the volume pile (Figure 7d), while the total axial pile load was approximately equal. Figure 8 shows the direction of the 𝜎 -vectors and the value of 𝑄 for the four modelling techniques. The simulated 𝑄 was close to zero for the modelled EB (Figure 8a). For an EB with extension 𝑄 = 62.2 kN (Figure 8b) and an EB with rigid octagonal plate resulted in 𝑄 = 61.1 kN (Figure 8c), 2% lower than for the volume pile for which 𝑄 = 62.3 kN (Figure 8d). The arch formation for an EB came closest to that of a volume pile when adding a rigid plate, as shown by the direction of the 𝜎 -vectors in Figure 8. Based on the total axial load, 𝑄 and arch formation, an EB with a rigid plate as pile head can be seen as a valid approximation of a volume pile.
Figure 8. Resulting pile head load (𝑄 ) and 𝜎 -vectors (red lines) in the embankment above the pile head for a pile modelled as (a) an embedded beam (EB), (b) an EB with extension, (c) an EB with plate, and (d) a volume pile. Vertical cross-section halfway between two adjacent piles in a corresponding square pile arrangement (𝑠 = 1.4 m). The direction of the 𝜎 -vectors is outlined with dashed lines.
5.1.2. The Material Parameters
Figure 8. Resulting pile head load (Qhead) and σ′1 -vectors (red lines) in the embankment above thepile head for a pile modelled as (a) an embedded beam (EB), (b) an EB with extension, (c) an EBwith plate, and (d) a volume pile. Vertical cross-section halfway between two adjacent piles in acorresponding square pile arrangement (s = 1.4 m). The direction of the σ′1-vectors is outlined withdashed lines.
5.1.2. The Material Parameters
Field and laboratory test results from the site showed three main soil layers, as seen inFigure 6: a top layer of sulphide-bearing silt (Sutop) at a depth of 0 to 5 m, a middle layer ofsilty sulphide clay (Subottom) from 5 m, and a bottom layer of silty glacial till (siTi), typicallyfrom 13 m downwards. The semi-floating pile group was assumed to be driven 30 cm intothe siTi-layer, resulting in a modelled pile length (siTi) of 13 m. For the floating pile groupthe same pile length was used, while the layer of Subottom was extended to a depth of 26 m.
The sulphide soil (Sutop and Subottom) was modelled using the Soft Soil (SS) model, asthis model was developed for soft soils under large compression. Most of the deformationswere expected to take place within the soft soil layers; thus, both the siTi and the granularembankment material (Granular) were modelled with the simpler Mohr–Coulomb (M-C)model. The values of the soil material parameters are shown in Table 2. Soil materialsSutop, Subottom and siTi were modelled taking excess pore pressure into account (“Undrained(A)”). For soil material Granular the excess pore pressure was assumed as zero (“Drained”).The shear strength of all soil materials was based on effective strength parameters. Howeach parameter value was evaluated is denoted in Table 2. The layers of Sutop, Subottomand siTi were assumed to be fully saturated due to the shallow groundwater level. Thus,the unsaturated unit weight was set to equal the saturated unit weight for the three soilmaterials. The preconsolidation pressure of the sulphide soil layers was almost constantover the examined depth. Thus, pre-overburden pressures were assigned to the sulphidesoils instead of overconsolidation ratios.
Appl. Sci. 2022, 12, 166 12 of 32
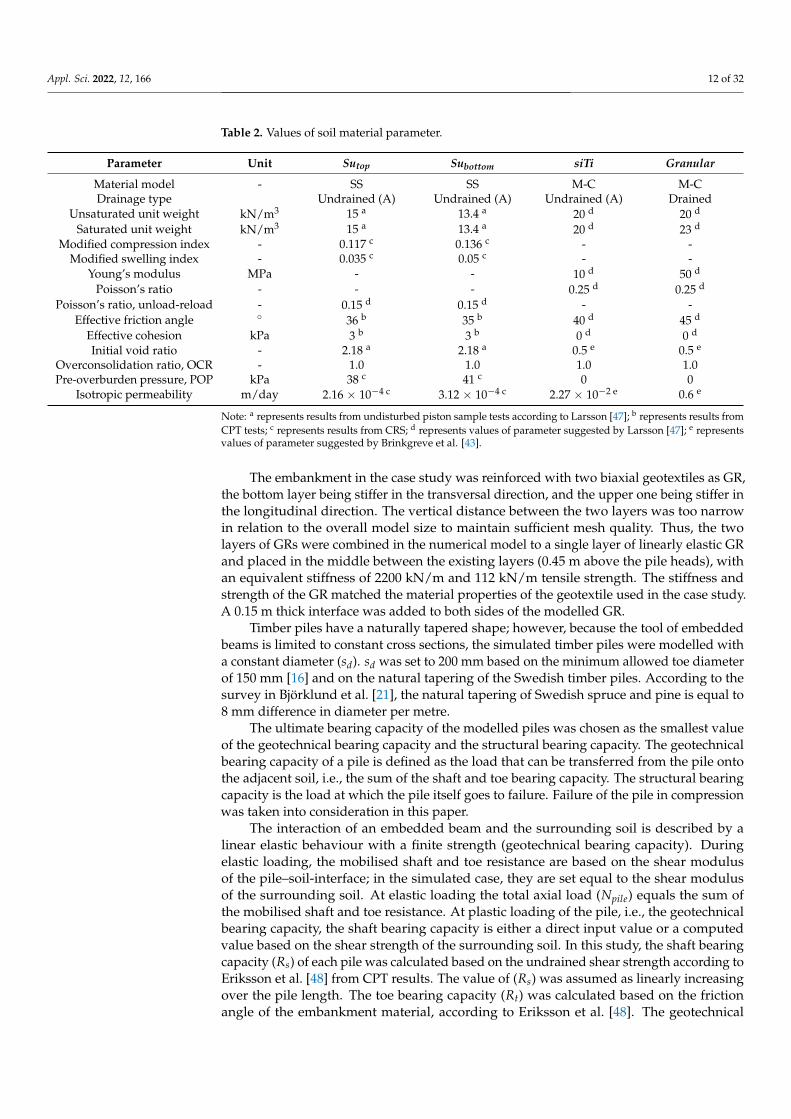
Table 2. Values of soil material parameter.
Parameter Unit Sutop Subottom siTi Granular
Material model - SS SS M-C M-CDrainage type Undrained (A) Undrained (A) Undrained (A) Drained
Unsaturated unit weight kN/m3 15 a 13.4 a 20 d 20 d
Saturated unit weight kN/m3 15 a 13.4 a 20 d 23 d
Modified compression index - 0.117 c 0.136 c - -Modified swelling index - 0.035 c 0.05 c - -
Young’s modulus MPa - - 10 d 50 d
Poisson’s ratio - - - 0.25 d 0.25 d
Poisson’s ratio, unload-reload - 0.15 d 0.15 d - -Effective friction angle ◦ 36 b 35 b 40 d 45 d
Effective cohesion kPa 3 b 3 b 0 d 0 d
Initial void ratio - 2.18 a 2.18 a 0.5 e 0.5 e
Overconsolidation ratio, OCR - 1.0 1.0 1.0 1.0Pre-overburden pressure, POP kPa 38 c 41 c 0 0
Isotropic permeability m/day 2.16 × 10⁻⁴ c 3.12 × 10⁻⁴ c 2.27 × 10⁻² e 0.6 e
Note: a represents results from undisturbed piston sample tests according to Larsson [47]; b represents results fromCPT tests; c represents results from CRS; d represents values of parameter suggested by Larsson [47]; e representsvalues of parameter suggested by Brinkgreve et al. [43].
The embankment in the case study was reinforced with two biaxial geotextiles as GR,the bottom layer being stiffer in the transversal direction, and the upper one being stiffer inthe longitudinal direction. The vertical distance between the two layers was too narrowin relation to the overall model size to maintain sufficient mesh quality. Thus, the twolayers of GRs were combined in the numerical model to a single layer of linearly elastic GRand placed in the middle between the existing layers (0.45 m above the pile heads), withan equivalent stiffness of 2200 kN/m and 112 kN/m tensile strength. The stiffness andstrength of the GR matched the material properties of the geotextile used in the case study.A 0.15 m thick interface was added to both sides of the modelled GR.
Timber piles have a naturally tapered shape; however, because the tool of embeddedbeams is limited to constant cross sections, the simulated timber piles were modelled witha constant diameter (sd). sd was set to 200 mm based on the minimum allowed toe diameterof 150 mm [16] and on the natural tapering of the Swedish timber piles. According to thesurvey in Björklund et al. [21], the natural tapering of Swedish spruce and pine is equal to8 mm difference in diameter per metre.
The ultimate bearing capacity of the modelled piles was chosen as the smallest valueof the geotechnical bearing capacity and the structural bearing capacity. The geotechnicalbearing capacity of a pile is defined as the load that can be transferred from the pile ontothe adjacent soil, i.e., the sum of the shaft and toe bearing capacity. The structural bearingcapacity is the load at which the pile itself goes to failure. Failure of the pile in compressionwas taken into consideration in this paper.
The interaction of an embedded beam and the surrounding soil is described by alinear elastic behaviour with a finite strength (geotechnical bearing capacity). Duringelastic loading, the mobilised shaft and toe resistance are based on the shear modulusof the pile–soil-interface; in the simulated case, they are set equal to the shear modulusof the surrounding soil. At elastic loading the total axial load (Npile) equals the sum ofthe mobilised shaft and toe resistance. At plastic loading of the pile, i.e., the geotechnicalbearing capacity, the shaft bearing capacity is either a direct input value or a computedvalue based on the shear strength of the surrounding soil. In this study, the shaft bearingcapacity (Rs) of each pile was calculated based on the undrained shear strength according toEriksson et al. [48] from CPT results. The value of (Rs) was assumed as linearly increasingover the pile length. The toe bearing capacity (Rt) was calculated based on the frictionangle of the embankment material, according to Eriksson et al. [48]. The geotechnical
Appl. Sci. 2022, 12, 166 13 of 32
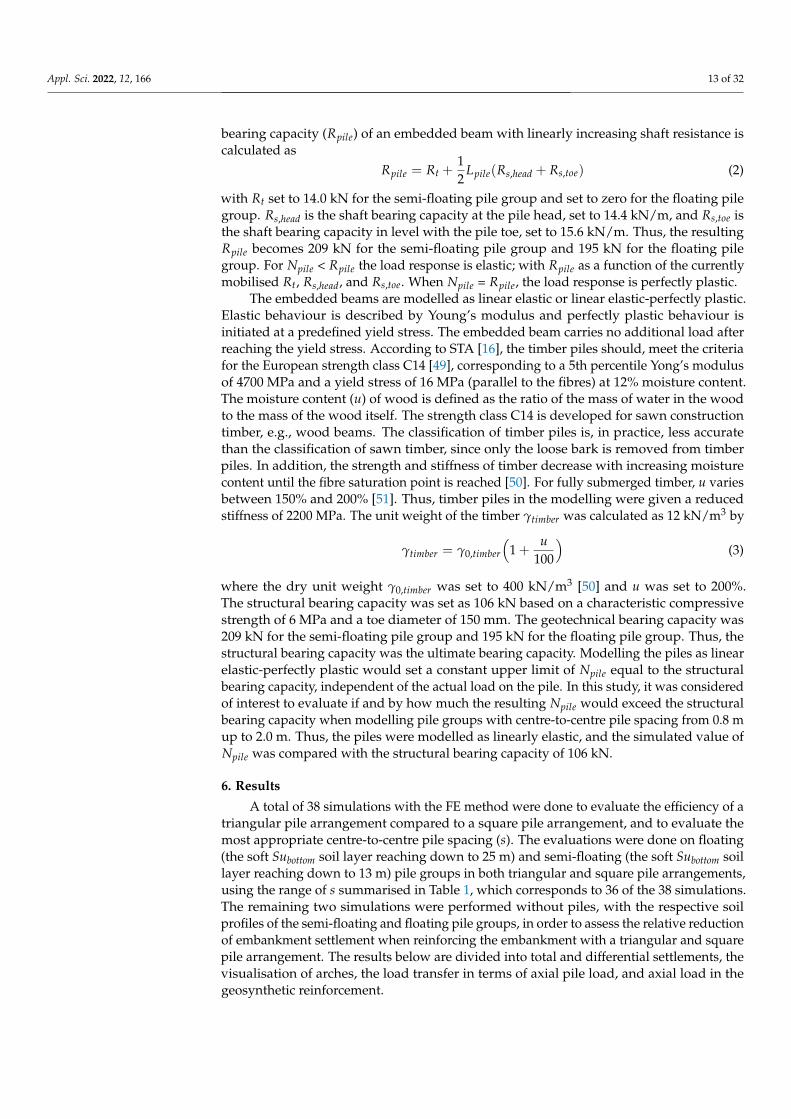
bearing capacity (Rpile) of an embedded beam with linearly increasing shaft resistance iscalculated as
Rpile = Rt +12
Lpile(Rs,head + Rs,toe) (2)
with Rt set to 14.0 kN for the semi-floating pile group and set to zero for the floating pilegroup. Rs,head is the shaft bearing capacity at the pile head, set to 14.4 kN/m, and Rs,toe isthe shaft bearing capacity in level with the pile toe, set to 15.6 kN/m. Thus, the resultingRpile becomes 209 kN for the semi-floating pile group and 195 kN for the floating pilegroup. For Npile < Rpile the load response is elastic; with Rpile as a function of the currentlymobilised Rt, Rs,head, and Rs,toe. When Npile = Rpile, the load response is perfectly plastic.
The embedded beams are modelled as linear elastic or linear elastic-perfectly plastic.Elastic behaviour is described by Young’s modulus and perfectly plastic behaviour isinitiated at a predefined yield stress. The embedded beam carries no additional load afterreaching the yield stress. According to STA [16], the timber piles should, meet the criteriafor the European strength class C14 [49], corresponding to a 5th percentile Yong’s modulusof 4700 MPa and a yield stress of 16 MPa (parallel to the fibres) at 12% moisture content.The moisture content (u) of wood is defined as the ratio of the mass of water in the woodto the mass of the wood itself. The strength class C14 is developed for sawn constructiontimber, e.g., wood beams. The classification of timber piles is, in practice, less accuratethan the classification of sawn timber, since only the loose bark is removed from timberpiles. In addition, the strength and stiffness of timber decrease with increasing moisturecontent until the fibre saturation point is reached [50]. For fully submerged timber, u variesbetween 150% and 200% [51]. Thus, timber piles in the modelling were given a reducedstiffness of 2200 MPa. The unit weight of the timber γtimber was calculated as 12 kN/m3 by
γtimber = γ0,timber
(1 +
u100
)(3)
where the dry unit weight γ0,timber was set to 400 kN/m3 [50] and u was set to 200%.The structural bearing capacity was set as 106 kN based on a characteristic compressivestrength of 6 MPa and a toe diameter of 150 mm. The geotechnical bearing capacity was209 kN for the semi-floating pile group and 195 kN for the floating pile group. Thus, thestructural bearing capacity was the ultimate bearing capacity. Modelling the piles as linearelastic-perfectly plastic would set a constant upper limit of Npile equal to the structuralbearing capacity, independent of the actual load on the pile. In this study, it was consideredof interest to evaluate if and by how much the resulting Npile would exceed the structuralbearing capacity when modelling pile groups with centre-to-centre pile spacing from 0.8 mup to 2.0 m. Thus, the piles were modelled as linearly elastic, and the simulated value ofNpile was compared with the structural bearing capacity of 106 kN.
6. Results
A total of 38 simulations with the FE method were done to evaluate the efficiency of atriangular pile arrangement compared to a square pile arrangement, and to evaluate themost appropriate centre-to-centre pile spacing (s). The evaluations were done on floating(the soft Subottom soil layer reaching down to 25 m) and semi-floating (the soft Subottom soillayer reaching down to 13 m) pile groups in both triangular and square pile arrangements,using the range of s summarised in Table 1, which corresponds to 36 of the 38 simulations.The remaining two simulations were performed without piles, with the respective soilprofiles of the semi-floating and floating pile groups, in order to assess the relative reductionof embankment settlement when reinforcing the embankment with a triangular and squarepile arrangement. The results below are divided into total and differential settlements, thevisualisation of arches, the load transfer in terms of axial pile load, and axial load in thegeosynthetic reinforcement.
Appl. Sci. 2022, 12, 166 14 of 32
6.1. Settlements
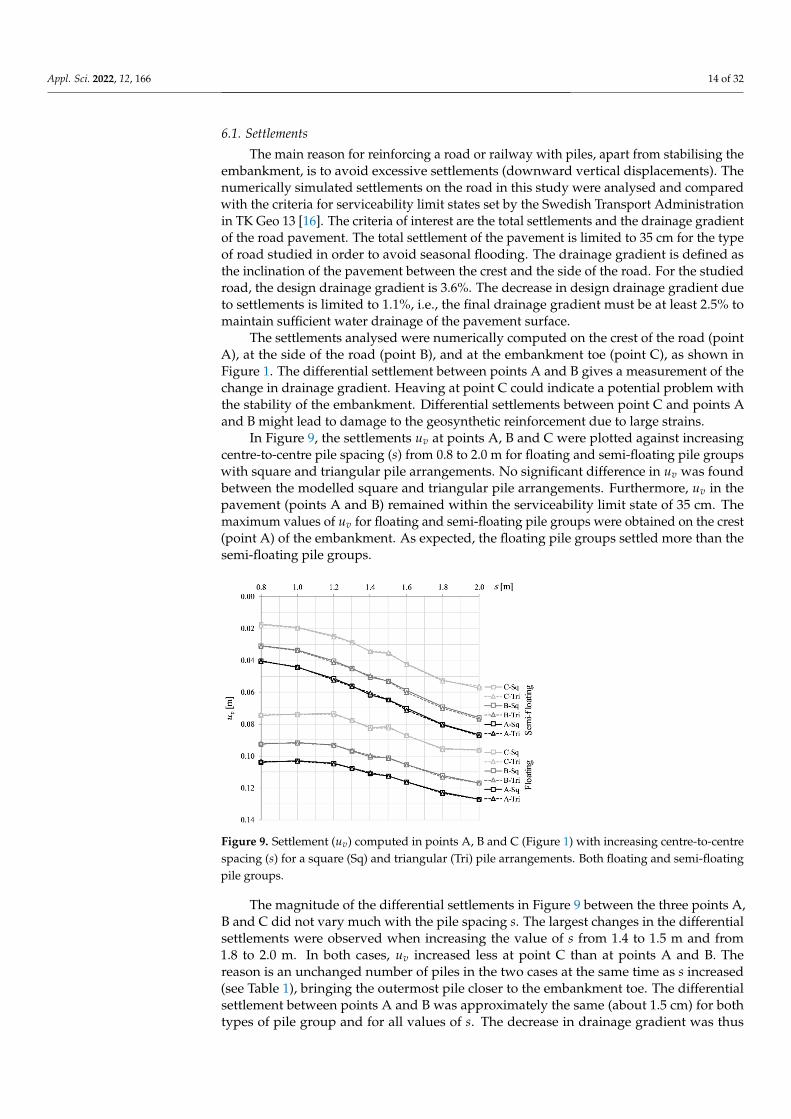
The main reason for reinforcing a road or railway with piles, apart from stabilising theembankment, is to avoid excessive settlements (downward vertical displacements). Thenumerically simulated settlements on the road in this study were analysed and comparedwith the criteria for serviceability limit states set by the Swedish Transport Administrationin TK Geo 13 [16]. The criteria of interest are the total settlements and the drainage gradientof the road pavement. The total settlement of the pavement is limited to 35 cm for the typeof road studied in order to avoid seasonal flooding. The drainage gradient is defined asthe inclination of the pavement between the crest and the side of the road. For the studiedroad, the design drainage gradient is 3.6%. The decrease in design drainage gradient dueto settlements is limited to 1.1%, i.e., the final drainage gradient must be at least 2.5% tomaintain sufficient water drainage of the pavement surface.
The settlements analysed were numerically computed on the crest of the road (pointA), at the side of the road (point B), and at the embankment toe (point C), as shown inFigure 1. The differential settlement between points A and B gives a measurement of thechange in drainage gradient. Heaving at point C could indicate a potential problem withthe stability of the embankment. Differential settlements between point C and points Aand B might lead to damage to the geosynthetic reinforcement due to large strains.
In Figure 9, the settlements uv at points A, B and C were plotted against increasingcentre-to-centre pile spacing (s) from 0.8 to 2.0 m for floating and semi-floating pile groupswith square and triangular pile arrangements. No significant difference in uv was foundbetween the modelled square and triangular pile arrangements. Furthermore, uv in thepavement (points A and B) remained within the serviceability limit state of 35 cm. Themaximum values of uv for floating and semi-floating pile groups were obtained on the crest(point A) of the embankment. As expected, the floating pile groups settled more than thesemi-floating pile groups.
Appl. Sci. 2022, 12, x FOR PEER REVIEW 15 of 33
maximum values of 𝑢 for floating and semi-floating pile groups were obtained on the crest (point A) of the embankment. As expected, the floating pile groups settled more than the semi-floating pile groups.
Figure 9. Settlement (𝑢 ) computed in points A, B and C (Figure 1) with increasing centre-to-centre spacing (𝑠) for a square (Sq) and triangular (Tri) pile arrangements. Both floating and semi-floating pile groups.
The magnitude of the differential settlements in Figure 9 between the three points A, B and C did not vary much with the pile spacing s. The largest changes in the differential settlements were observed when increasing the value of s from 1.4 to 1.5 m and from 1.8 to 2.0 m. In both cases, 𝑢 increased less at point C than at points A and B. The reason is an unchanged number of piles in the two cases at the same time as s increased (see Table 1), bringing the outermost pile closer to the embankment toe. The differential settlement between points A and B was approximately the same (about 1.5 cm) for both types of pile group and for all values of 𝑠. The decrease in drainage gradient was thus approximately 0.3% for all models, which is within the serviceability limit state of 1.1%. No local differential settlements (depressions) between the piles were observed in the pavement in the simulations. For the semi-floating pile group, the differential settlements between points B and C increased from 1.3 cm when 𝑠 = 0.8 m to 2.0 cm when 𝑠 = 2.0 m. For the floating pile group, it remained almost constant at 1.9 cm for the full range of 𝑠. The differential settlements observed in Figure 9 are not of a magnitude that could damage the GR by plastic strains. No heaving was observed at point C, which is good from a stability point of view.
The results for 𝑢𝑣 shown in Figure 9 were compared with 𝑢 for the case of no piles in order to quantify the reduction in 𝑢 from pile-reinforcing the embankment. Two reference simulations were done without piles for the corresponding soil profiles of a floating and a semi-floating pile group; 𝑢 , % is the average value of the settlement reduction in points A, B and C defined as a percentage
𝑢 , % = 13 1 − 𝑢 (𝐴)𝑢 (𝐴 ) + 1 − 𝑢 (𝐵)𝑢 (𝐵 ) + 1 − 𝑢 (𝐶)𝑢 (𝐶 ) ∙ 100 (4)
where 𝑢 (𝐴) is 𝑢 at point A on the crest of a piled embankment, and 𝑢 (𝐴 ) is 𝑢 at point A on the crest of an embankment without pile reinforcement. The quantities 𝑢 (𝐵), 𝑢 (𝐵 ) , 𝑢 (𝐶) , and 𝑢 (𝐶 ) follow the same notation for points B and C. For an embankment with no pile group support, 𝑢 at points A, B and C was 19, 18 and 12 cm, respectively, for the case of floating piles. The respective values were 17, 15 and 9 cm for the case of semi-floating piles. In Figure 10a, 𝑢 , % was plotted against 𝑠 for floating
Figure 9. Settlement (uv) computed in points A, B and C (Figure 1) with increasing centre-to-centrespacing (s) for a square (Sq) and triangular (Tri) pile arrangements. Both floating and semi-floatingpile groups.
The magnitude of the differential settlements in Figure 9 between the three points A,B and C did not vary much with the pile spacing s. The largest changes in the differentialsettlements were observed when increasing the value of s from 1.4 to 1.5 m and from1.8 to 2.0 m. In both cases, uv increased less at point C than at points A and B. Thereason is an unchanged number of piles in the two cases at the same time as s increased(see Table 1), bringing the outermost pile closer to the embankment toe. The differentialsettlement between points A and B was approximately the same (about 1.5 cm) for bothtypes of pile group and for all values of s. The decrease in drainage gradient was thus
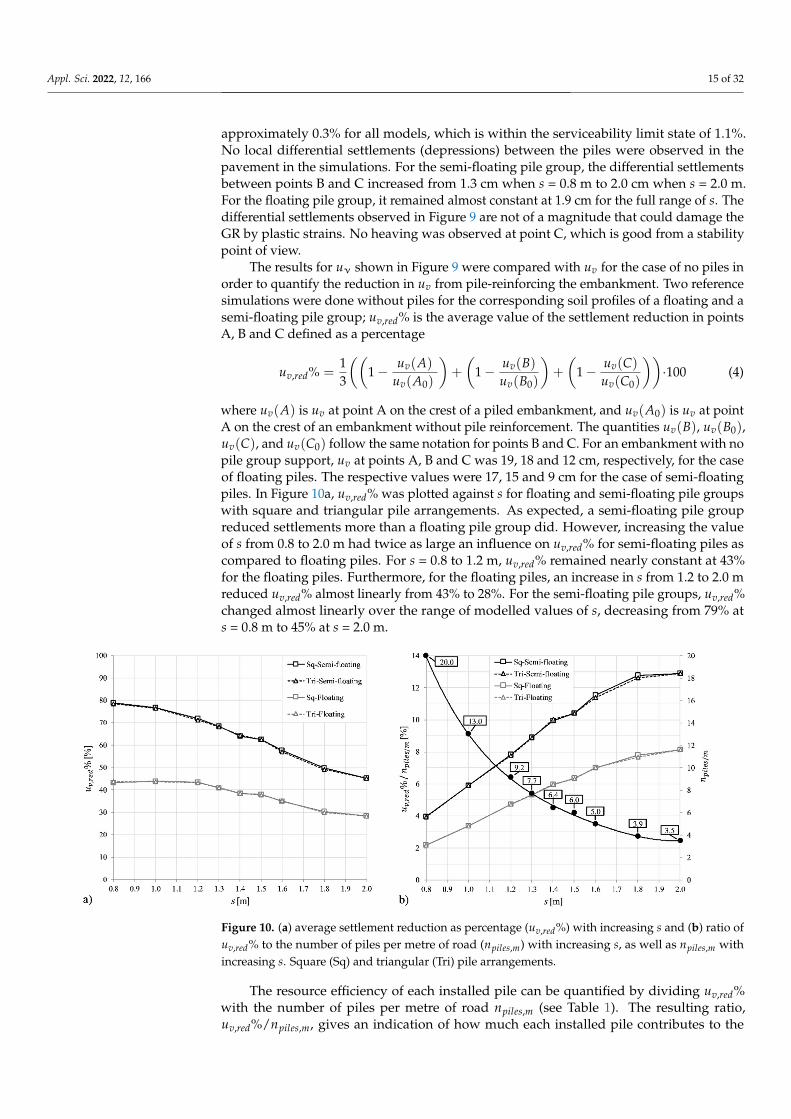
Appl. Sci. 2022, 12, 166 15 of 32
approximately 0.3% for all models, which is within the serviceability limit state of 1.1%.No local differential settlements (depressions) between the piles were observed in thepavement in the simulations. For the semi-floating pile group, the differential settlementsbetween points B and C increased from 1.3 cm when s = 0.8 m to 2.0 cm when s = 2.0 m.For the floating pile group, it remained almost constant at 1.9 cm for the full range of s. Thedifferential settlements observed in Figure 9 are not of a magnitude that could damage theGR by plastic strains. No heaving was observed at point C, which is good from a stabilitypoint of view.
The results for uν shown in Figure 9 were compared with uv for the case of no piles inorder to quantify the reduction in uv from pile-reinforcing the embankment. Two referencesimulations were done without piles for the corresponding soil profiles of a floating and asemi-floating pile group; uv,red% is the average value of the settlement reduction in pointsA, B and C defined as a percentage
uv,red% =13
((1− uv(A)
uv(A0)
)+
(1− uv(B)
uv(B0)
)+
(1− uv(C)
uv(C0)
))·100 (4)
where uv(A) is uv at point A on the crest of a piled embankment, and uv(A0) is uv at pointA on the crest of an embankment without pile reinforcement. The quantities uv(B), uv(B0),uv(C), and uv(C0) follow the same notation for points B and C. For an embankment with nopile group support, uv at points A, B and C was 19, 18 and 12 cm, respectively, for the caseof floating piles. The respective values were 17, 15 and 9 cm for the case of semi-floatingpiles. In Figure 10a, uv,red% was plotted against s for floating and semi-floating pile groupswith square and triangular pile arrangements. As expected, a semi-floating pile groupreduced settlements more than a floating pile group did. However, increasing the valueof s from 0.8 to 2.0 m had twice as large an influence on uv,red% for semi-floating piles ascompared to floating piles. For s = 0.8 to 1.2 m, uv,red% remained nearly constant at 43%for the floating piles. Furthermore, for the floating piles, an increase in s from 1.2 to 2.0 mreduced uv,red% almost linearly from 43% to 28%. For the semi-floating pile groups, uv,red%changed almost linearly over the range of modelled values of s, decreasing from 79% ats = 0.8 m to 45% at s = 2.0 m.
Appl. Sci. 2022, 12, x FOR PEER REVIEW 16 of 33
and semi-floating pile groups with square and triangular pile arrangements. As expected, a semi-floating pile group reduced settlements more than a floating pile group did. However, increasing the value of 𝑠 from 0.8 to 2.0 m had twice as large an influence on 𝑢 , % for semi-floating piles as compared to floating piles. For 𝑠 = 0.8 to 1.2 m, 𝑢 , % remained nearly constant at 43% for the floating piles. Furthermore, for the floating piles, an increase in s from 1.2 to 2.0 m reduced 𝑢 , % almost linearly from 43% to 28%. For the semi-floating pile groups, 𝑢 , % changed almost linearly over the range of modelled values of 𝑠, decreasing from 79% at 𝑠 = 0.8 m to 45% at 𝑠 = 2.0 m.
The resource efficiency of each installed pile can be quantified by dividing 𝑢 , % with the number of piles per metre of road 𝑛 , (see Table 1). The resulting ratio, 𝑢 , %/𝑛 , , gives an indication of how much each installed pile contributes to the settlement reduction for a given value of 𝑠. In Figure 10b, 𝑛 , and 𝑢 , %/𝑛 , were plotted on separate vertical axes against 𝑠 for floating and semi-floating pile groups with square and triangular pile arrangements. 𝑢 , %/𝑛 , increased with the increasing value of 𝑠, meaning that each individual pile contributed more to reducing the settlements as 𝑛 , was reduced. For both the floating and semi-floating piles, 𝑢 , %/𝑛 , increased almost linearly from 𝑠 = 0.8 to 1.4 m. For 𝑠 > 1.4 m, 𝑢 , %/𝑛 , still increased, although more slowly than between the simulated values of 𝑠. The gain in resource efficiency when increasing the value of 𝑠 was less for 𝑠 > 1.4 m compared to what was achieved in the interval 0.8 ≤ 𝑠 ≤ 1.4 m. Thus, the pile spacing where 𝑠 = 1.4 m is interesting as a design value. As previously mentioned, the pile spacing criterion in TK Geo 13 [16] is 0.8 ≤ 𝑠 ≤ 1.2 m. By increasing 𝑠 above the maximum value, from 1.2 to 1.4 m, the simulated value of 𝑢 , %/𝑛 , increased by almost 1.3 times for both the floating and semi-floating piles. The value of 𝑛 , decreased from 9.2 to 6.4 when increasing 𝑠 from 1.2 to 1.4 m, reducing the number of piles by almost one third.
Figure 10. (a) average settlement reduction as percentage (𝑢 , %) with increasing 𝑠 and (b) ratio of 𝑢 , % to the number of piles per metre of road (𝑛 , ) with increasing 𝑠, as well as 𝑛 , with increasing 𝑠. Square (Sq) and triangular (Tri) pile arrangements.
Based on these results, it can be concluded that the pile arrangement, square or triangular, has no significant influence on the settlements in the road pavement or embankment toe of a lightly piled embankment. Furthermore, the serviceability limit state criteria in TK Geo 13 [16] regarding total settlements and drainage gradient were not exceeded for the modelled range of 𝑠. It was also found that changes in 𝑠 had greater influence on the magnitude of the settlements if the pile group is semi-floating instead of floating. The settlements with a floating pile group were approximately the same for any
Figure 10. (a) average settlement reduction as percentage (uv,red%) with increasing s and (b) ratio ofuv,red% to the number of piles per metre of road (npiles,m) with increasing s, as well as npiles,m withincreasing s. Square (Sq) and triangular (Tri) pile arrangements.
The resource efficiency of each installed pile can be quantified by dividing uv,red%with the number of piles per metre of road npiles,m (see Table 1). The resulting ratio,uv,red%/npiles,m, gives an indication of how much each installed pile contributes to the
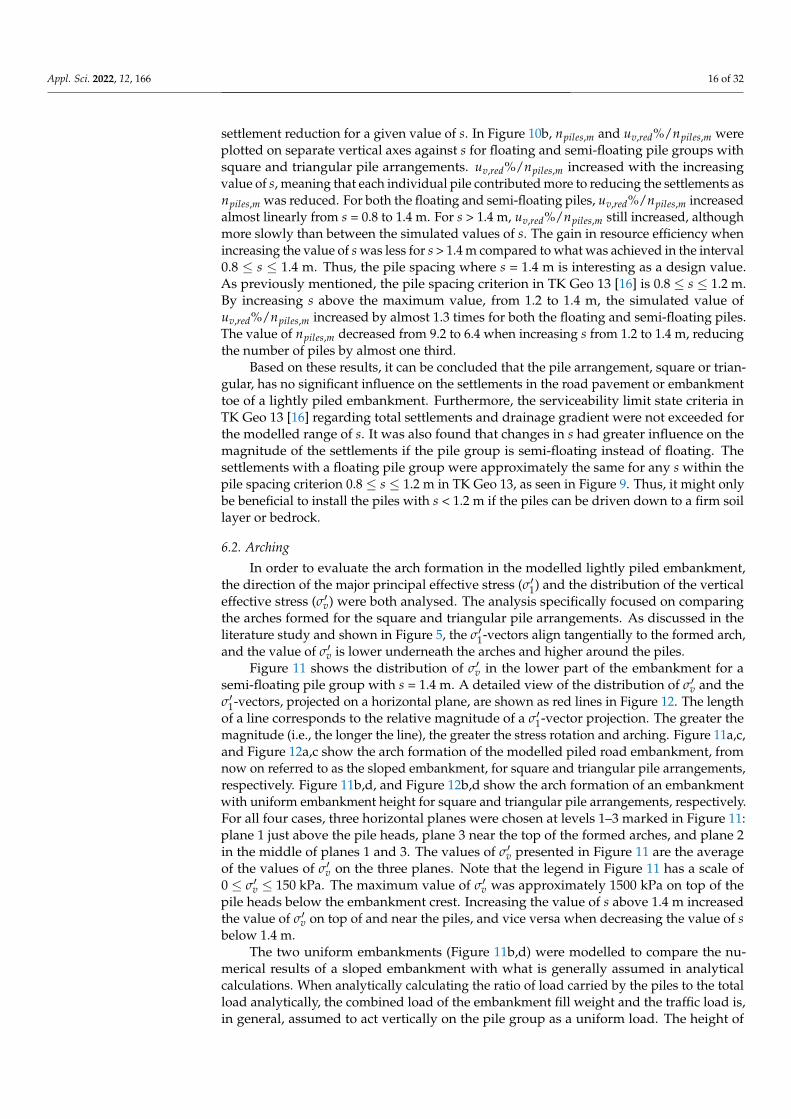
Appl. Sci. 2022, 12, 166 16 of 32
settlement reduction for a given value of s. In Figure 10b, npiles,m and uv,red%/npiles,m wereplotted on separate vertical axes against s for floating and semi-floating pile groups withsquare and triangular pile arrangements. uv,red%/npiles,m increased with the increasingvalue of s, meaning that each individual pile contributed more to reducing the settlements asnpiles,m was reduced. For both the floating and semi-floating piles, uv,red%/npiles,m increasedalmost linearly from s = 0.8 to 1.4 m. For s > 1.4 m, uv,red%/npiles,m still increased, althoughmore slowly than between the simulated values of s. The gain in resource efficiency whenincreasing the value of s was less for s > 1.4 m compared to what was achieved in the interval0.8 ≤ s ≤ 1.4 m. Thus, the pile spacing where s = 1.4 m is interesting as a design value.As previously mentioned, the pile spacing criterion in TK Geo 13 [16] is 0.8 ≤ s ≤ 1.2 m.By increasing s above the maximum value, from 1.2 to 1.4 m, the simulated value ofuv,red%/npiles,m increased by almost 1.3 times for both the floating and semi-floating piles.The value of npiles,m decreased from 9.2 to 6.4 when increasing s from 1.2 to 1.4 m, reducingthe number of piles by almost one third.
Based on these results, it can be concluded that the pile arrangement, square or trian-gular, has no significant influence on the settlements in the road pavement or embankmenttoe of a lightly piled embankment. Furthermore, the serviceability limit state criteria inTK Geo 13 [16] regarding total settlements and drainage gradient were not exceeded forthe modelled range of s. It was also found that changes in s had greater influence on themagnitude of the settlements if the pile group is semi-floating instead of floating. Thesettlements with a floating pile group were approximately the same for any s within thepile spacing criterion 0.8 ≤ s ≤ 1.2 m in TK Geo 13, as seen in Figure 9. Thus, it might onlybe beneficial to install the piles with s < 1.2 m if the piles can be driven down to a firm soillayer or bedrock.
6.2. Arching
In order to evaluate the arch formation in the modelled lightly piled embankment,the direction of the major principal effective stress (σ′1) and the distribution of the verticaleffective stress (σ′v) were both analysed. The analysis specifically focused on comparingthe arches formed for the square and triangular pile arrangements. As discussed in theliterature study and shown in Figure 5, the σ′1-vectors align tangentially to the formed arch,and the value of σ′v is lower underneath the arches and higher around the piles.
Figure 11 shows the distribution of σ′v in the lower part of the embankment for asemi-floating pile group with s = 1.4 m. A detailed view of the distribution of σ′v and theσ′1-vectors, projected on a horizontal plane, are shown as red lines in Figure 12. The lengthof a line corresponds to the relative magnitude of a σ′1-vector projection. The greater themagnitude (i.e., the longer the line), the greater the stress rotation and arching. Figure 11a,c,and Figure 12a,c show the arch formation of the modelled piled road embankment, fromnow on referred to as the sloped embankment, for square and triangular pile arrangements,respectively. Figure 11b,d, and Figure 12b,d show the arch formation of an embankmentwith uniform embankment height for square and triangular pile arrangements, respectively.For all four cases, three horizontal planes were chosen at levels 1–3 marked in Figure 11:plane 1 just above the pile heads, plane 3 near the top of the formed arches, and plane 2in the middle of planes 1 and 3. The values of σ′v presented in Figure 11 are the averageof the values of σ′v on the three planes. Note that the legend in Figure 11 has a scale of0 ≤ σ′v ≤ 150 kPa. The maximum value of σ′v was approximately 1500 kPa on top of thepile heads below the embankment crest. Increasing the value of s above 1.4 m increasedthe value of σ′v on top of and near the piles, and vice versa when decreasing the value of sbelow 1.4 m.
The two uniform embankments (Figure 11b,d) were modelled to compare the nu-merical results of a sloped embankment with what is generally assumed in analyticalcalculations. When analytically calculating the ratio of load carried by the piles to the totalload analytically, the combined load of the embankment fill weight and the traffic load is,in general, assumed to act vertically on the pile group as a uniform load. The height of
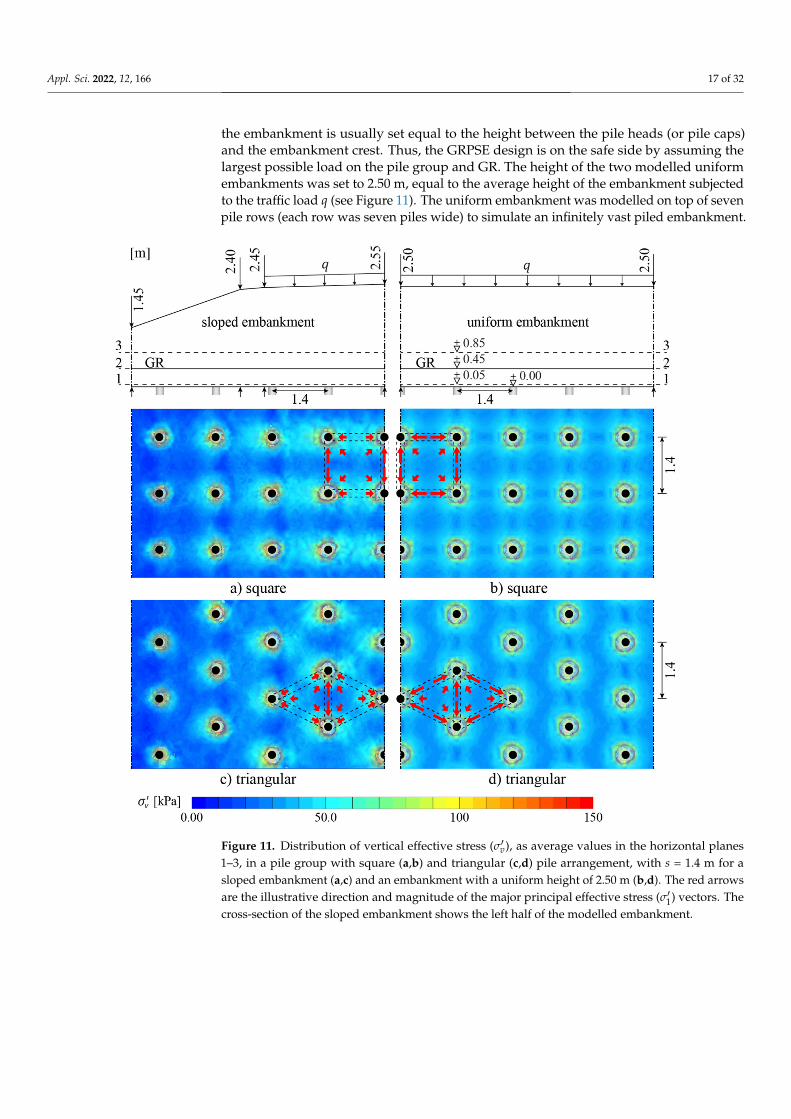
Appl. Sci. 2022, 12, 166 17 of 32
the embankment is usually set equal to the height between the pile heads (or pile caps)and the embankment crest. Thus, the GRPSE design is on the safe side by assuming thelargest possible load on the pile group and GR. The height of the two modelled uniformembankments was set to 2.50 m, equal to the average height of the embankment subjectedto the traffic load q (see Figure 11). The uniform embankment was modelled on top of sevenpile rows (each row was seven piles wide) to simulate an infinitely vast piled embankment.
Appl. Sci. 2022, 12, x FOR PEER REVIEW 18 of 33
Figure 11. Distribution of vertical effective stress (𝜎𝘷), as average values in the horizontal planes 1–3, in a pile group with square (a,b) and triangular (c,d) pile arrangement, with 𝑠 = 1.4 m for a sloped embankment (a,c) and an embankment with a uniform height of 2.50 m (b,d). The red arrows are the illustrative direction and magnitude of the major principal effective stress (𝜎 ) vectors. The cross-section of the sloped embankment shows the left half of the modelled embankment.
Figure 11. Distribution of vertical effective stress (σ′v), as average values in the horizontal planes1–3, in a pile group with square (a,b) and triangular (c,d) pile arrangement, with s = 1.4 m for asloped embankment (a,c) and an embankment with a uniform height of 2.50 m (b,d). The red arrowsare the illustrative direction and magnitude of the major principal effective stress (σ′1) vectors. Thecross-section of the sloped embankment shows the left half of the modelled embankment.
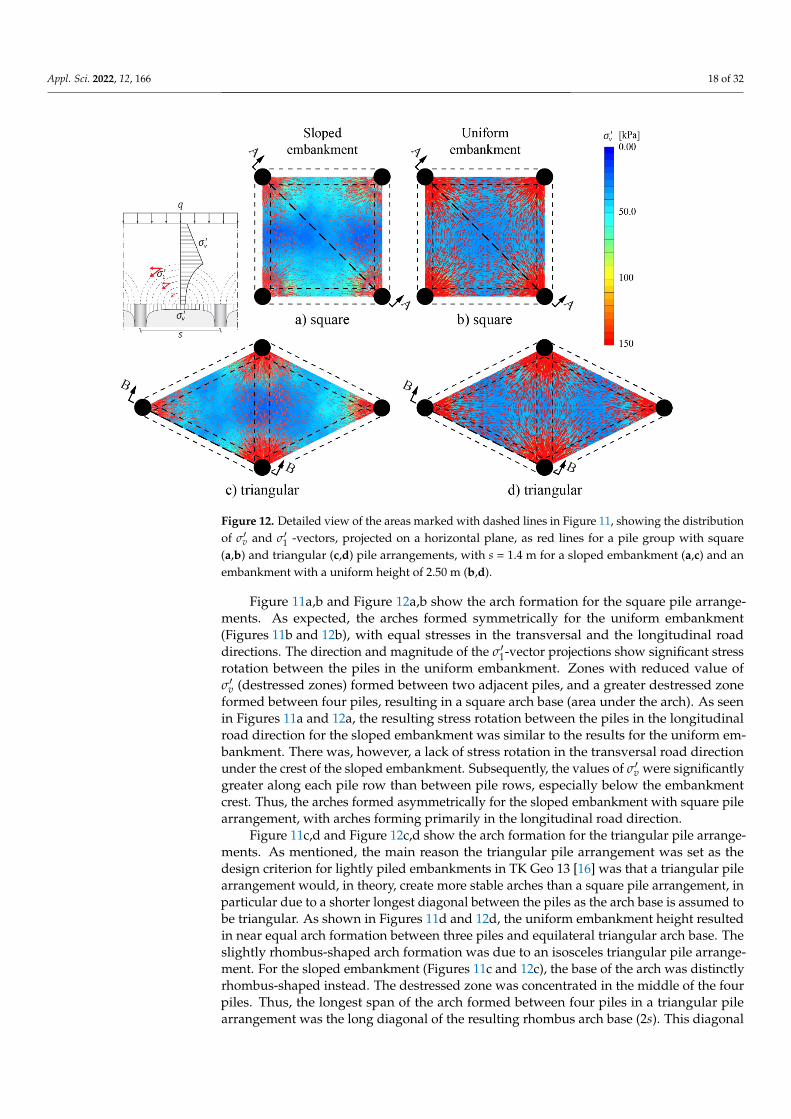
Appl. Sci. 2022, 12, 166 18 of 32Appl. Sci. 2022, 12, x FOR PEER REVIEW 19 of 33
Figure 12. Detailed view of the areas marked with dashed lines in Figure 11, showing the distribution of 𝜎𝘷 and 𝜎 -vectors, projected on a horizontal plane, as red lines for a pile group with square (a,b) and triangular (c,d) pile arrangements, with 𝑠 = 1.4 m for a sloped embankment (a,c) and an embankment with a uniform height of 2.50 m (b,d).
The two uniform embankments (Figure 11b,d) were modelled to compare the numerical results of a sloped embankment with what is generally assumed in analytical calculations. When analytically calculating the ratio of load carried by the piles to the total load analytically, the combined load of the embankment fill weight and the traffic load is, in general, assumed to act vertically on the pile group as a uniform load. The height of the embankment is usually set equal to the height between the pile heads (or pile caps) and the embankment crest. Thus, the GRPSE design is on the safe side by assuming the largest possible load on the pile group and GR. The height of the two modelled uniform embankments was set to 2.50 m, equal to the average height of the embankment subjected to the traffic load 𝑞 (see Figure 11). The uniform embankment was modelled on top of seven pile rows (each row was seven piles wide) to simulate an infinitely vast piled embankment.
Figures 11a,b and 12a,b show the arch formation for the square pile arrangements. As expected, the arches formed symmetrically for the uniform embankment (Figures 11b and 12b), with equal stresses in the transversal and the longitudinal road directions. The direction and magnitude of the 𝜎 -vector projections show significant stress rotation between the piles in the uniform embankment. Zones with reduced value of 𝜎𝘷 (destressed zones) formed between two adjacent piles, and a greater destressed zone formed between four piles, resulting in a square arch base (area under the arch). As seen in Figures 11a and 12a, the resulting stress rotation between the piles in the longitudinal road direction for the sloped embankment was similar to the results for the uniform embankment. There was, however, a lack of stress rotation in the transversal road direction under the crest of the sloped embankment. Subsequently, the values of 𝜎𝘷 were significantly greater along each pile row than between pile rows, especially below the embankment crest. Thus, the arches formed asymmetrically for the sloped embankment with square pile arrangement, with arches forming primarily in the longitudinal road direction.
Figure 12. Detailed view of the areas marked with dashed lines in Figure 11, showing the distributionof σ′v and σ′1 -vectors, projected on a horizontal plane, as red lines for a pile group with square(a,b) and triangular (c,d) pile arrangements, with s = 1.4 m for a sloped embankment (a,c) and anembankment with a uniform height of 2.50 m (b,d).
Figure 11a,b and Figure 12a,b show the arch formation for the square pile arrange-ments. As expected, the arches formed symmetrically for the uniform embankment(Figures 11b and 12b), with equal stresses in the transversal and the longitudinal roaddirections. The direction and magnitude of the σ′1-vector projections show significant stressrotation between the piles in the uniform embankment. Zones with reduced value ofσ′v (destressed zones) formed between two adjacent piles, and a greater destressed zoneformed between four piles, resulting in a square arch base (area under the arch). As seenin Figures 11a and 12a, the resulting stress rotation between the piles in the longitudinalroad direction for the sloped embankment was similar to the results for the uniform em-bankment. There was, however, a lack of stress rotation in the transversal road directionunder the crest of the sloped embankment. Subsequently, the values of σ′v were significantlygreater along each pile row than between pile rows, especially below the embankmentcrest. Thus, the arches formed asymmetrically for the sloped embankment with square pilearrangement, with arches forming primarily in the longitudinal road direction.
Figure 11c,d and Figure 12c,d show the arch formation for the triangular pile arrange-ments. As mentioned, the main reason the triangular pile arrangement was set as thedesign criterion for lightly piled embankments in TK Geo 13 [16] was that a triangular pilearrangement would, in theory, create more stable arches than a square pile arrangement, inparticular due to a shorter longest diagonal between the piles as the arch base is assumed tobe triangular. As shown in Figures 11d and 12d, the uniform embankment height resultedin near equal arch formation between three piles and equilateral triangular arch base. Theslightly rhombus-shaped arch formation was due to an isosceles triangular pile arrange-ment. For the sloped embankment (Figures 11c and 12c), the base of the arch was distinctlyrhombus-shaped instead. The destressed zone was concentrated in the middle of the fourpiles. Thus, the longest span of the arch formed between four piles in a triangular pilearrangement was the long diagonal of the resulting rhombus arch base (2s). This diagonal
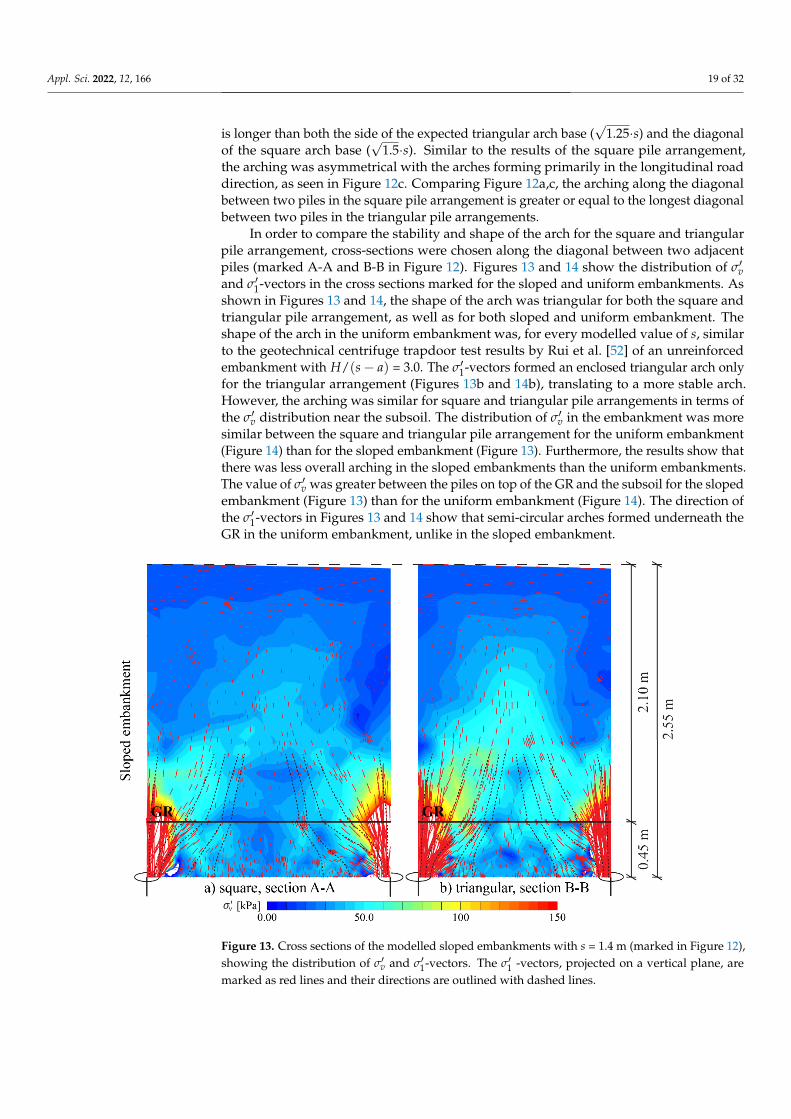
Appl. Sci. 2022, 12, 166 19 of 32
is longer than both the side of the expected triangular arch base (√
1.25·s) and the diagonalof the square arch base (
√1.5·s). Similar to the results of the square pile arrangement,
the arching was asymmetrical with the arches forming primarily in the longitudinal roaddirection, as seen in Figure 12c. Comparing Figure 12a,c, the arching along the diagonalbetween two piles in the square pile arrangement is greater or equal to the longest diagonalbetween two piles in the triangular pile arrangements.
In order to compare the stability and shape of the arch for the square and triangularpile arrangement, cross-sections were chosen along the diagonal between two adjacentpiles (marked A-A and B-B in Figure 12). Figures 13 and 14 show the distribution of σ′vand σ′1-vectors in the cross sections marked for the sloped and uniform embankments. Asshown in Figures 13 and 14, the shape of the arch was triangular for both the square andtriangular pile arrangement, as well as for both sloped and uniform embankment. Theshape of the arch in the uniform embankment was, for every modelled value of s, similarto the geotechnical centrifuge trapdoor test results by Rui et al. [52] of an unreinforcedembankment with H/(s− a) = 3.0. The σ′1-vectors formed an enclosed triangular arch onlyfor the triangular arrangement (Figures 13b and 14b), translating to a more stable arch.However, the arching was similar for square and triangular pile arrangements in terms ofthe σ′v distribution near the subsoil. The distribution of σ′v in the embankment was moresimilar between the square and triangular pile arrangement for the uniform embankment(Figure 14) than for the sloped embankment (Figure 13). Furthermore, the results show thatthere was less overall arching in the sloped embankments than the uniform embankments.The value of σ′v was greater between the piles on top of the GR and the subsoil for the slopedembankment (Figure 13) than for the uniform embankment (Figure 14). The direction ofthe σ′1-vectors in Figures 13 and 14 show that semi-circular arches formed underneath theGR in the uniform embankment, unlike in the sloped embankment.
Appl. Sci. 2022, 12, x FOR PEER REVIEW 21 of 33
the spreading effect of the embankment slopes and subsequent asymmetrical arch formation is excluded in the GRPSE design.
Figure 13. Cross sections of the modelled sloped embankments with 𝑠 = 1.4 m (marked in Figure 12), showing the distribution of 𝜎𝘷 and 𝜎 -vectors. The 𝜎 -vectors, projected on a vertical plane, are marked as red lines and their directions are outlined with dashed lines.
Figure 14. Cross sections (marked in Figure 12) of the modelled embankments with uniform height of 2.50 m and 𝑠 = 1.4 m (marked in Figure 12), showing the distribution of 𝜎𝘷 and 𝜎 -vectors. The 𝜎 -vectors, projected on a vertical plane, are marked as red lines and their directions are outlined with dashed lines.
Figure 13. Cross sections of the modelled sloped embankments with s = 1.4 m (marked in Figure 12),showing the distribution of σ′v and σ′1-vectors. The σ′1 -vectors, projected on a vertical plane, aremarked as red lines and their directions are outlined with dashed lines.
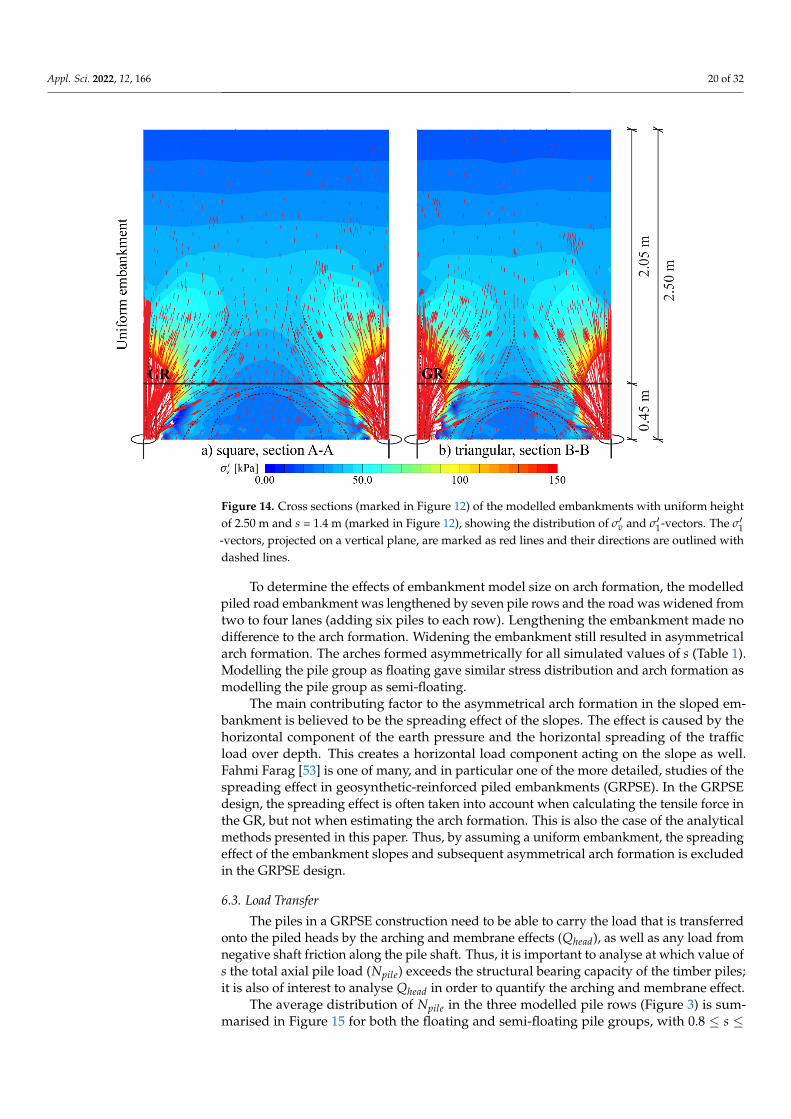
Appl. Sci. 2022, 12, 166 20 of 32
Appl. Sci. 2022, 12, x FOR PEER REVIEW 21 of 33
the spreading effect of the embankment slopes and subsequent asymmetrical arch formation is excluded in the GRPSE design.
Figure 13. Cross sections of the modelled sloped embankments with 𝑠 = 1.4 m (marked in Figure 12), showing the distribution of 𝜎𝘷 and 𝜎 -vectors. The 𝜎 -vectors, projected on a vertical plane, are marked as red lines and their directions are outlined with dashed lines.
Figure 14. Cross sections (marked in Figure 12) of the modelled embankments with uniform height of 2.50 m and 𝑠 = 1.4 m (marked in Figure 12), showing the distribution of 𝜎𝘷 and 𝜎 -vectors. The 𝜎 -vectors, projected on a vertical plane, are marked as red lines and their directions are outlined with dashed lines.
Figure 14. Cross sections (marked in Figure 12) of the modelled embankments with uniform heightof 2.50 m and s = 1.4 m (marked in Figure 12), showing the distribution of σ′v and σ′1-vectors. The σ′1-vectors, projected on a vertical plane, are marked as red lines and their directions are outlined withdashed lines.
To determine the effects of embankment model size on arch formation, the modelledpiled road embankment was lengthened by seven pile rows and the road was widened fromtwo to four lanes (adding six piles to each row). Lengthening the embankment made nodifference to the arch formation. Widening the embankment still resulted in asymmetricalarch formation. The arches formed asymmetrically for all simulated values of s (Table 1).Modelling the pile group as floating gave similar stress distribution and arch formation asmodelling the pile group as semi-floating.
The main contributing factor to the asymmetrical arch formation in the sloped em-bankment is believed to be the spreading effect of the slopes. The effect is caused by thehorizontal component of the earth pressure and the horizontal spreading of the trafficload over depth. This creates a horizontal load component acting on the slope as well.Fahmi Farag [53] is one of many, and in particular one of the more detailed, studies of thespreading effect in geosynthetic-reinforced piled embankments (GRPSE). In the GRPSEdesign, the spreading effect is often taken into account when calculating the tensile force inthe GR, but not when estimating the arch formation. This is also the case of the analyticalmethods presented in this paper. Thus, by assuming a uniform embankment, the spreadingeffect of the embankment slopes and subsequent asymmetrical arch formation is excludedin the GRPSE design.
6.3. Load Transfer
The piles in a GRPSE construction need to be able to carry the load that is transferredonto the piled heads by the arching and membrane effects (Qhead), as well as any load fromnegative shaft friction along the pile shaft. Thus, it is important to analyse at which value ofs the total axial pile load (Npile) exceeds the structural bearing capacity of the timber piles;it is also of interest to analyse Qhead in order to quantify the arching and membrane effect.
The average distribution of Npile in the three modelled pile rows (Figure 3) is sum-marised in Figure 15 for both the floating and semi-floating pile groups, with 0.8 ≤ s ≤
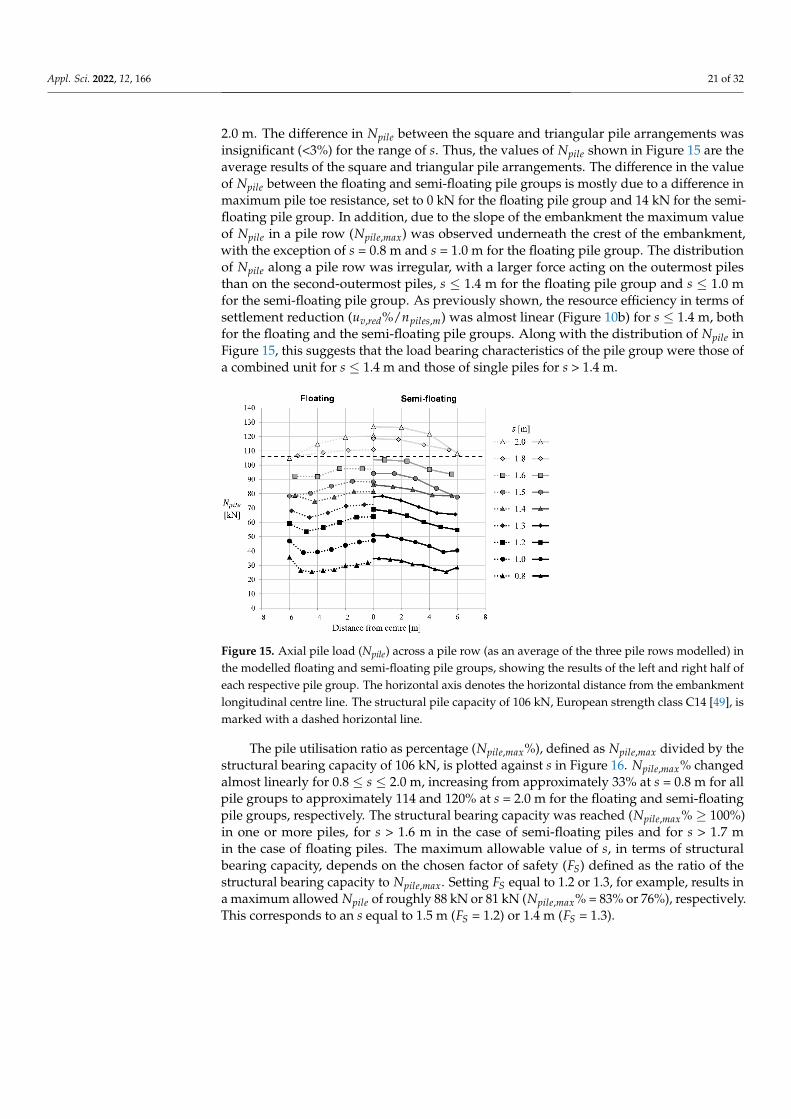
Appl. Sci. 2022, 12, 166 21 of 32
2.0 m. The difference in Npile between the square and triangular pile arrangements wasinsignificant (<3%) for the range of s. Thus, the values of Npile shown in Figure 15 are theaverage results of the square and triangular pile arrangements. The difference in the valueof Npile between the floating and semi-floating pile groups is mostly due to a difference inmaximum pile toe resistance, set to 0 kN for the floating pile group and 14 kN for the semi-floating pile group. In addition, due to the slope of the embankment the maximum valueof Npile in a pile row (Npile,max) was observed underneath the crest of the embankment,with the exception of s = 0.8 m and s = 1.0 m for the floating pile group. The distributionof Npile along a pile row was irregular, with a larger force acting on the outermost pilesthan on the second-outermost piles, s ≤ 1.4 m for the floating pile group and s ≤ 1.0 mfor the semi-floating pile group. As previously shown, the resource efficiency in terms ofsettlement reduction (uv,red%/npiles,m) was almost linear (Figure 10b) for s ≤ 1.4 m, bothfor the floating and the semi-floating pile groups. Along with the distribution of Npile inFigure 15, this suggests that the load bearing characteristics of the pile group were those ofa combined unit for s ≤ 1.4 m and those of single piles for s > 1.4 m.
Appl. Sci. 2022, 12, x FOR PEER REVIEW 22 of 33
6.3. Load Transfer The piles in a GRPSE construction need to be able to carry the load that is transferred
onto the piled heads by the arching and membrane effects (𝑄 ), as well as any load from negative shaft friction along the pile shaft. Thus, it is important to analyse at which value of s the total axial pile load (𝑁 ) exceeds the structural bearing capacity of the timber piles; it is also of interest to analyse 𝑄 in order to quantify the arching and membrane effect.
The average distribution of 𝑁 in the three modelled pile rows (Figure 3) is summarised in Figure 15 for both the floating and semi-floating pile groups, with 0.8 ≤ 𝑠 ≤ 2.0 m. The difference in 𝑁 between the square and triangular pile arrangements was insignificant (<3%) for the range of 𝑠. Thus, the values of 𝑁 shown in Figure 15 are the average results of the square and triangular pile arrangements. The difference in the value of 𝑁 between the floating and semi-floating pile groups is mostly due to a difference in maximum pile toe resistance, set to 0 kN for the floating pile group and 14 kN for the semi-floating pile group. In addition, due to the slope of the embankment the maximum value of 𝑁 in a pile row ( 𝑁 , ) was observed underneath the crest of the embankment, with the exception of 𝑠 = 0.8 m and 𝑠 = 1.0 m for the floating pile group. The distribution of 𝑁 along a pile row was irregular, with a larger force acting on the outermost piles than on the second-outermost piles, 𝑠 ≤ 1.4 m for the floating pile group and 𝑠 ≤ 1.0 m for the semi-floating pile group. As previously shown, the resource efficiency in terms of settlement reduction (𝑢 , %/𝑛 , ) was almost linear (Figure 10b) for 𝑠 ≤ 1.4 m, both for the floating and the semi-floating pile groups. Along with the distribution of 𝑁 in Figure 15, this suggests that the load bearing characteristics of the pile group were those of a combined unit for 𝑠 ≤ 1.4 m and those of single piles for 𝑠 > 1.4 m.
Figure 15. Axial pile load (𝑁𝑝𝑖𝑙𝑒) across a pile row (as an average of the three pile rows modelled) in the modelled floating and semi-floating pile groups, showing the results of the left and right half of each respective pile group. The horizontal axis denotes the horizontal distance from the embankment longitudinal centre line. The structural pile capacity of 106 kN, European strength class C14 [49], is marked with a dashed horizontal line.
The pile utilisation ratio as percentage (𝑁 , %), defined as 𝑁 , divided by the structural bearing capacity of 106 kN, is plotted against 𝑠 in Figure 16. 𝑁 , % changed almost linearly for 0.8 ≤ 𝑠 ≤ 2.0 m, increasing from approximately 33% at 𝑠 = 0.8 m for all pile groups to approximately 114 and 120% at 𝑠 = 2.0 m for the floating and semi-floating pile groups, respectively. The structural bearing capacity was reached (𝑁 , % ≥ 100%) in one or more piles, for 𝑠 > 1.6 m in the case of semi-floating piles and for 𝑠 > 1.7 m in the case of floating piles. The maximum allowable value of 𝑠 , in terms of
Figure 15. Axial pile load (Npile) across a pile row (as an average of the three pile rows modelled) inthe modelled floating and semi-floating pile groups, showing the results of the left and right half ofeach respective pile group. The horizontal axis denotes the horizontal distance from the embankmentlongitudinal centre line. The structural pile capacity of 106 kN, European strength class C14 [49], ismarked with a dashed horizontal line.
The pile utilisation ratio as percentage (Npile,max%), defined as Npile,max divided by thestructural bearing capacity of 106 kN, is plotted against s in Figure 16. Npile,max% changedalmost linearly for 0.8 ≤ s ≤ 2.0 m, increasing from approximately 33% at s = 0.8 m for allpile groups to approximately 114 and 120% at s = 2.0 m for the floating and semi-floatingpile groups, respectively. The structural bearing capacity was reached (Npile,max% ≥ 100%)in one or more piles, for s > 1.6 m in the case of semi-floating piles and for s > 1.7 min the case of floating piles. The maximum allowable value of s, in terms of structuralbearing capacity, depends on the chosen factor of safety (FS) defined as the ratio of thestructural bearing capacity to Npile,max. Setting FS equal to 1.2 or 1.3, for example, results ina maximum allowed Npile of roughly 88 kN or 81 kN (Npile,max% = 83% or 76%), respectively.This corresponds to an s equal to 1.5 m (FS = 1.2) or 1.4 m (FS = 1.3).
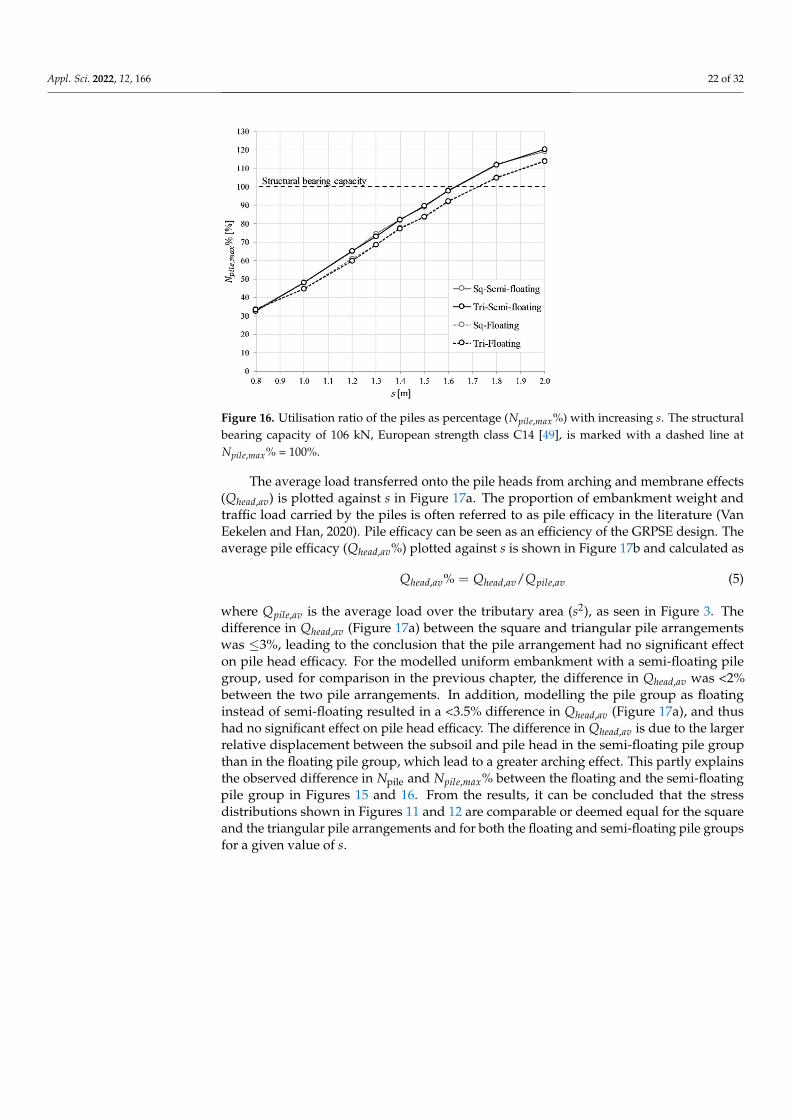
Appl. Sci. 2022, 12, 166 22 of 32
Appl. Sci. 2022, 12, x FOR PEER REVIEW 23 of 33
structural bearing capacity, depends on the chosen factor of safety (𝐹 ) defined as the ratio of the structural bearing capacity to 𝑁 , . Setting 𝐹 equal to 1.2 or 1.3, for example, results in a maximum allowed 𝑁 of roughly 88 kN or 81 kN (𝑁 , % = 83% or 76%), respectively. This corresponds to an s equal to 1.5 m (𝐹 = 1.2) or 1.4 m (𝐹 = 1.3).
Figure 16. Utilisation ratio of the piles as percentage (𝑁 , %) with increasing 𝑠. The structural bearing capacity of 106 kN, European strength class C14 [49], is marked with a dashed line at 𝑁 , % = 100%.
The average load transferred onto the pile heads from arching and membrane effects (𝑄 , ) is plotted against 𝑠 in Figure 17a. The proportion of embankment weight and traffic load carried by the piles is often referred to as pile efficacy in the literature (Van Eekelen and Han, 2020). Pile efficacy can be seen as an efficiency of the GRPSE design. The average pile efficacy (𝑄 , % ) plotted against 𝑠 is shown in Figure 17b and calculated as 𝑄 , % = 𝑄 , /𝑄 , (5)
where 𝑄 , is the average load over the tributary area (𝑠 ), as seen in Figure 3. The difference in 𝑄 , (Figure 17a) between the square and triangular pile arrangements was ≤3%, leading to the conclusion that the pile arrangement had no significant effect on pile head efficacy. For the modelled uniform embankment with a semi-floating pile group, used for comparison in the previous chapter, the difference in 𝑄 , was <2% between the two pile arrangements. In addition, modelling the pile group as floating instead of semi-floating resulted in a <3.5% difference in 𝑄 , (Figure 17a), and thus had no significant effect on pile head efficacy. The difference in 𝑄 , is due to the larger relative displacement between the subsoil and pile head in the semi-floating pile group than in the floating pile group, which lead to a greater arching effect. This partly explains the observed difference in 𝑁 and 𝑁 , % between the floating and the semi-floating pile group in Figures 15 and 16. From the results, it can be concluded that the stress distributions shown in Figures 11 and 12 are comparable or deemed equal for the square and the triangular pile arrangements and for both the floating and semi-floating pile groups for a given value of 𝑠.
Figure 16. Utilisation ratio of the piles as percentage (Npile,max%) with increasing s. The structuralbearing capacity of 106 kN, European strength class C14 [49], is marked with a dashed line atNpile,max% = 100%.
The average load transferred onto the pile heads from arching and membrane effects(Qhead,av) is plotted against s in Figure 17a. The proportion of embankment weight andtraffic load carried by the piles is often referred to as pile efficacy in the literature (VanEekelen and Han, 2020). Pile efficacy can be seen as an efficiency of the GRPSE design. Theaverage pile efficacy (Qhead,av%) plotted against s is shown in Figure 17b and calculated as
Qhead,av% = Qhead,av/Qpile,av (5)
where Qpile,av is the average load over the tributary area (s2), as seen in Figure 3. Thedifference in Qhead,av (Figure 17a) between the square and triangular pile arrangementswas ≤3%, leading to the conclusion that the pile arrangement had no significant effecton pile head efficacy. For the modelled uniform embankment with a semi-floating pilegroup, used for comparison in the previous chapter, the difference in Qhead,av was <2%between the two pile arrangements. In addition, modelling the pile group as floatinginstead of semi-floating resulted in a <3.5% difference in Qhead,av (Figure 17a), and thushad no significant effect on pile head efficacy. The difference in Qhead,av is due to the largerrelative displacement between the subsoil and pile head in the semi-floating pile groupthan in the floating pile group, which lead to a greater arching effect. This partly explainsthe observed difference in Npile and Npile,max% between the floating and the semi-floatingpile group in Figures 15 and 16. From the results, it can be concluded that the stressdistributions shown in Figures 11 and 12 are comparable or deemed equal for the squareand the triangular pile arrangements and for both the floating and semi-floating pile groupsfor a given value of s.
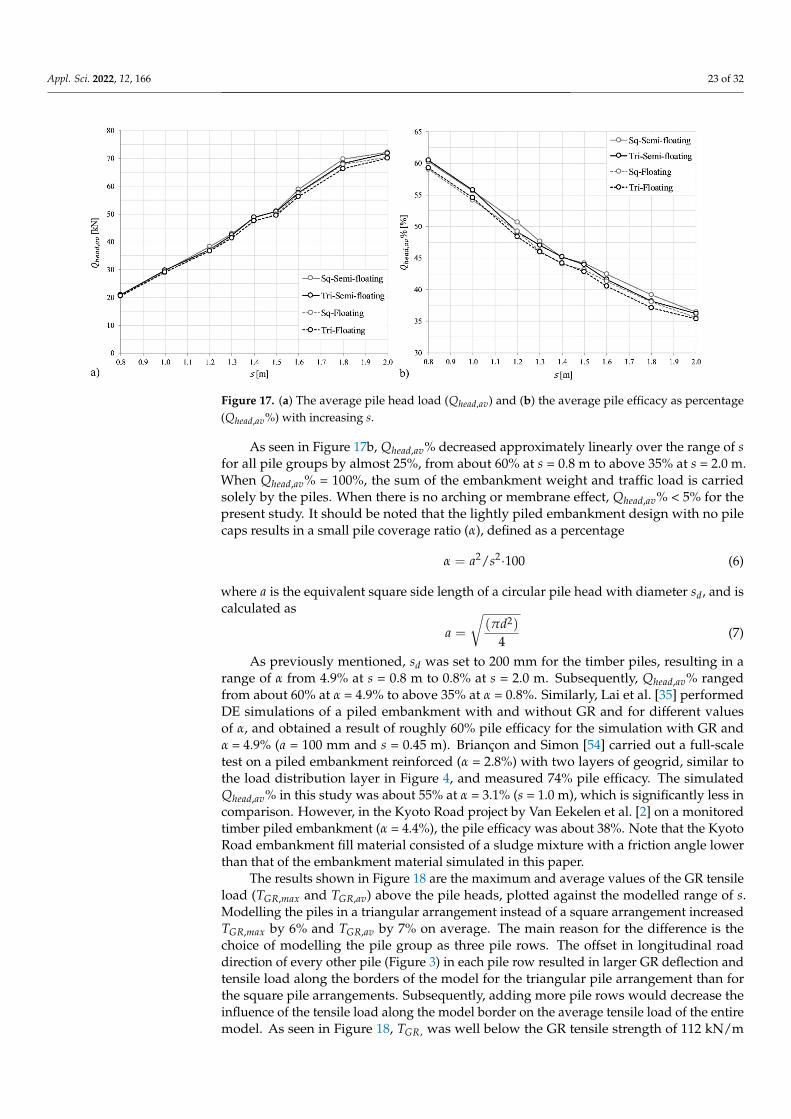
Appl. Sci. 2022, 12, 166 23 of 32Appl. Sci. 2022, 12, x FOR PEER REVIEW 24 of 33
Figure 17. (a) The average pile head load (𝑄 , ) and (b) the average pile efficacy as percentage (𝑄 , %) with increasing 𝑠.
As seen in Figure 17b, 𝑄 , % decreased approximately linearly over the range of 𝑠 for all pile groups by almost 25%, from about 60% at 𝑠 = 0.8 m to above 35% at 𝑠 = 2.0 m. When 𝑄 , % = 100%, the sum of the embankment weight and traffic load is carried solely by the piles. When there is no arching or membrane effect, 𝑄 , % < 5% for the present study. It should be noted that the lightly piled embankment design with no pile caps results in a small pile coverage ratio (𝛼), defined as a percentage 𝛼 = 𝑎 /𝑠 ∙ 100 (6)
where 𝑎 is the equivalent square side length of a circular pile head with diameter 𝑠 , and is calculated as
𝑎 = (𝜋𝑑 )4 (7)
As previously mentioned, 𝑠 was set to 200 mm for the timber piles, resulting in a range of 𝛼 from 4.9% at 𝑠 = 0.8 m to 0.8% at 𝑠 = 2.0 m. Subsequently, 𝑄 , % ranged from about 60% at 𝛼 = 4.9% to above 35% at 𝛼 = 0.8%. Similarly, Lai et al. [35] performed DE simulations of a piled embankment with and without GR and for different values of 𝛼, and obtained a result of roughly 60% pile efficacy for the simulation with GR and 𝛼 = 4.9% (𝑎 = 100 mm and 𝑠 = 0.45 m). Briançon and Simon [54] carried out a full-scale test on a piled embankment reinforced (𝛼 = 2.8%) with two layers of geogrid, similar to the load distribution layer in Figure 4, and measured 74% pile efficacy. The simulated 𝑄 , % in this study was about 55% at 𝛼 = 3.1% (𝑠 = 1.0 m), which is significantly less in comparison. However, in the Kyoto Road project by Van Eekelen et al. [2] on a monitored timber piled embankment (𝛼 = 4.4%), the pile efficacy was about 38%. Note that the Kyoto Road embankment fill material consisted of a sludge mixture with a friction angle lower than that of the embankment material simulated in this paper.
The results shown in Figure 18 are the maximum and average values of the GR tensile load (𝑇 , and 𝑇 , ) above the pile heads, plotted against the modelled range of 𝑠. Modelling the piles in a triangular arrangement instead of a square arrangement increased 𝑇 , by 6% and 𝑇 , by 7% on average. The main reason for the difference is the choice of modelling the pile group as three pile rows. The offset in longitudinal road direction of every other pile (Figure 3) in each pile row resulted in larger GR deflection and tensile load along the borders of the model for the triangular pile arrangement than for the square pile arrangements. Subsequently, adding more pile rows would decrease
Figure 17. (a) The average pile head load (Qhead,av) and (b) the average pile efficacy as percentage(Qhead,av%) with increasing s.
As seen in Figure 17b, Qhead,av% decreased approximately linearly over the range of sfor all pile groups by almost 25%, from about 60% at s = 0.8 m to above 35% at s = 2.0 m.When Qhead,av% = 100%, the sum of the embankment weight and traffic load is carriedsolely by the piles. When there is no arching or membrane effect, Qhead,av% < 5% for thepresent study. It should be noted that the lightly piled embankment design with no pilecaps results in a small pile coverage ratio (α), defined as a percentage
α = a2/s2·100 (6)
where a is the equivalent square side length of a circular pile head with diameter sd, and iscalculated as
a =
√(πd2)
4(7)
As previously mentioned, sd was set to 200 mm for the timber piles, resulting in arange of α from 4.9% at s = 0.8 m to 0.8% at s = 2.0 m. Subsequently, Qhead,av% rangedfrom about 60% at α = 4.9% to above 35% at α = 0.8%. Similarly, Lai et al. [35] performedDE simulations of a piled embankment with and without GR and for different valuesof α, and obtained a result of roughly 60% pile efficacy for the simulation with GR andα = 4.9% (a = 100 mm and s = 0.45 m). Briançon and Simon [54] carried out a full-scaletest on a piled embankment reinforced (α = 2.8%) with two layers of geogrid, similar tothe load distribution layer in Figure 4, and measured 74% pile efficacy. The simulatedQhead,av% in this study was about 55% at α = 3.1% (s = 1.0 m), which is significantly less incomparison. However, in the Kyoto Road project by Van Eekelen et al. [2] on a monitoredtimber piled embankment (α = 4.4%), the pile efficacy was about 38%. Note that the KyotoRoad embankment fill material consisted of a sludge mixture with a friction angle lowerthan that of the embankment material simulated in this paper.
The results shown in Figure 18 are the maximum and average values of the GR tensileload (TGR,max and TGR,av) above the pile heads, plotted against the modelled range of s.Modelling the piles in a triangular arrangement instead of a square arrangement increasedTGR,max by 6% and TGR,av by 7% on average. The main reason for the difference is thechoice of modelling the pile group as three pile rows. The offset in longitudinal roaddirection of every other pile (Figure 3) in each pile row resulted in larger GR deflection andtensile load along the borders of the model for the triangular pile arrangement than forthe square pile arrangements. Subsequently, adding more pile rows would decrease theinfluence of the tensile load along the model border on the average tensile load of the entiremodel. As seen in Figure 18, TGR , was well below the GR tensile strength of 112 kN/m
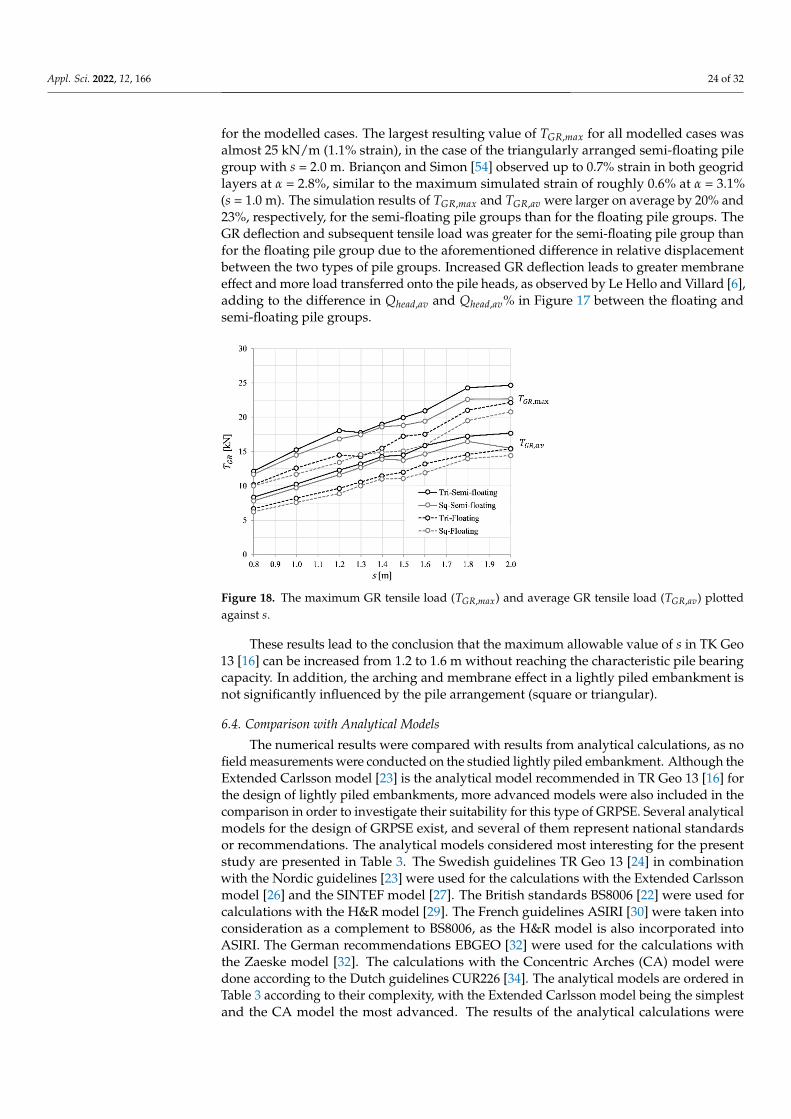
Appl. Sci. 2022, 12, 166 24 of 32
for the modelled cases. The largest resulting value of TGR,max for all modelled cases wasalmost 25 kN/m (1.1% strain), in the case of the triangularly arranged semi-floating pilegroup with s = 2.0 m. Briançon and Simon [54] observed up to 0.7% strain in both geogridlayers at α = 2.8%, similar to the maximum simulated strain of roughly 0.6% at α = 3.1%(s = 1.0 m). The simulation results of TGR,max and TGR,av were larger on average by 20% and23%, respectively, for the semi-floating pile groups than for the floating pile groups. TheGR deflection and subsequent tensile load was greater for the semi-floating pile group thanfor the floating pile group due to the aforementioned difference in relative displacementbetween the two types of pile groups. Increased GR deflection leads to greater membraneeffect and more load transferred onto the pile heads, as observed by Le Hello and Villard [6],adding to the difference in Qhead,av and Qhead,av% in Figure 17 between the floating andsemi-floating pile groups.
Appl. Sci. 2022, 12, x FOR PEER REVIEW 25 of 33
the influence of the tensile load along the model border on the average tensile load of the entire model. As seen in Figure 18, 𝑇 , was well below the GR tensile strength of 112 kN/m for the modelled cases. The largest resulting value of 𝑇 , for all modelled cases was almost 25 kN/m (1.1% strain), in the case of the triangularly arranged semi-floating pile group with 𝑠 = 2.0 m. Briançon and Simon [54] observed up to 0.7% strain in both geogrid layers at 𝛼 = 2.8%, similar to the maximum simulated strain of roughly 0.6% at 𝛼 = 3.1% (𝑠 = 1.0 m). The simulation results of 𝑇 , and 𝑇 , were larger on average by 20% and 23%, respectively, for the semi-floating pile groups than for the floating pile groups. The GR deflection and subsequent tensile load was greater for the semi-floating pile group than for the floating pile group due to the aforementioned difference in relative displacement between the two types of pile groups. Increased GR deflection leads to greater membrane effect and more load transferred onto the pile heads, as observed by Le Hello and Villard [6], adding to the difference in 𝑄 , and 𝑄 , % in Figure 17 between the floating and semi-floating pile groups.
Figure 18. The maximum GR tensile load (𝑇 , ) and average GR tensile load (𝑇 , ) plotted against 𝑠.
These results lead to the conclusion that the maximum allowable value of 𝑠 in TK Geo 13 [16] can be increased from 1.2 to 1.6 m without reaching the characteristic pile bearing capacity. In addition, the arching and membrane effect in a lightly piled embankment is not significantly influenced by the pile arrangement (square or triangular).
6.4. Comparison with Analytical Models The numerical results were compared with results from analytical calculations, as no
field measurements were conducted on the studied lightly piled embankment. Although the Extended Carlsson model [23] is the analytical model recommended in TR Geo 13 [16] for the design of lightly piled embankments, more advanced models were also included in the comparison in order to investigate their suitability for this type of GRPSE. Several analytical models for the design of GRPSE exist, and several of them represent national standards or recommendations. The analytical models considered most interesting for the present study are presented in Table 3. The Swedish guidelines TR Geo 13 [24] in combination with the Nordic guidelines [23] were used for the calculations with the Extended Carlsson model [26] and the SINTEF model [27]. The British standards BS8006 [22] were used for calculations with the H&R model [29]. The French guidelines ASIRI [30] were taken into consideration as a complement to BS8006, as the H&R model is also incorporated into ASIRI. The German recommendations EBGEO [32] were used for the calculations with the Zaeske model [32]. The calculations with the Concentric Arches (CA)
Figure 18. The maximum GR tensile load (TGR,max) and average GR tensile load (TGR,av) plottedagainst s.
These results lead to the conclusion that the maximum allowable value of s in TK Geo13 [16] can be increased from 1.2 to 1.6 m without reaching the characteristic pile bearingcapacity. In addition, the arching and membrane effect in a lightly piled embankment isnot significantly influenced by the pile arrangement (square or triangular).
6.4. Comparison with Analytical Models
The numerical results were compared with results from analytical calculations, as nofield measurements were conducted on the studied lightly piled embankment. Although theExtended Carlsson model [23] is the analytical model recommended in TR Geo 13 [16] forthe design of lightly piled embankments, more advanced models were also included in thecomparison in order to investigate their suitability for this type of GRPSE. Several analyticalmodels for the design of GRPSE exist, and several of them represent national standardsor recommendations. The analytical models considered most interesting for the presentstudy are presented in Table 3. The Swedish guidelines TR Geo 13 [24] in combinationwith the Nordic guidelines [23] were used for the calculations with the Extended Carlssonmodel [26] and the SINTEF model [27]. The British standards BS8006 [22] were used forcalculations with the H&R model [29]. The French guidelines ASIRI [30] were taken intoconsideration as a complement to BS8006, as the H&R model is also incorporated intoASIRI. The German recommendations EBGEO [32] were used for the calculations withthe Zaeske model [32]. The calculations with the Concentric Arches (CA) model weredone according to the Dutch guidelines CUR226 [34]. The analytical models are ordered inTable 3 according to their complexity, with the Extended Carlsson model being the simplestand the CA model the most advanced. The results of the analytical calculations were
Appl. Sci. 2022, 12, 166 25 of 32
compared to the numerical results on pile head load (Qhead), pile efficacy (Qhead%), andmaximum GR tensile load (TGR,max).
Table 3. Summary of the analytical models used for comparison and the guidelines (or standards)they are incorporated in.
Model Guideline Type Pile Arrangement Arch Shape Subsoil Support
Extended Carlsson [26] TR Geo 13 [24] Rigid Square Triangular NoneSINTEF [27] - Rigid Square Triangular None
Hewlett & Randolph (H&R) [29] BS8006 [22] & ASIRI [30] LE Square Semi-circle None
Zaeske [31] EBGEO [32] LE Square/liubinTriangular a
Non-concentricliubinsemi-ellipses Subgrade modulus, ks
Concentric Arches (CA) [8] CUR226 [34] LE Square Concentricsemi-circles Subgrade modulus, ks
Note: a represents a 45◦ rotated square grid. LE = Limit equilibrium.
Among the analytical models included in the comparison with the numerical model,the Zaeske model is the only one that supports a triangular pile arrangement. However, theonly triangular pile arrangement supported in EBGEO is a square pile arrangement rotated45 degrees. Thus, the formulas in Zaeske [31] for a triangular pile arrangement were used,as they support the geometry of the TK Geo 13 triangular pile arrangement utilised in thisstudy. Note that ASIRI presents geometrical recommendations but no analytical modelsfor triangular pile arrangements. Furthermore, the Zaeske model is the only one of theincluded analytical models that takes into consideration an elevated GR, i.e., a verticaldistance z between the pile head and the GR layer, when calculating the vertical stresseson the GR. The EBGEO [32] contains recommendations for GR elevations; however, noelevation is included as a variable when calculating the vertical stress on the GR. Thus,the vertical stresses on the GR were calculated using the formulas derived by Zaeske [31]for vertical stresses underneath the arch at z metres above the pile heads (where z = 0 mis in level with the pile heads), which are based on the same mechanical principles as theformulas prescribed in EBGEO. As previously mentioned, z = 0.45 m for the numericallymodelled lightly piled embankment.
According to the analytical models included in the comparison and the correspondingguidelines (Table 3), the calculated value of TGR,max is the sum of the tensile load in theGR due to the membrane effect (TGR,M) and the added tensile load in the GR due to thespreading effect (TGR,S) in the transversal road direction. The calculation of TGR, M differsbetween the included analytical models, and each method is briefly described further below.TGR, S is calculated similarly for all of the analytical models. In the Extended Carlsson,SINTEF and H&R model, TGR, S is calculated as
TGR,S = Ka H(
12
γH + q)
(8)
where Ka is the coefficient of active earth pressure, H is the embankment height of 2.5 m,γ is the unit weight of the embankment material (calculated as 21.7 kN/m3 for the par-tially saturated embankment), and q is the surcharge (traffic) load of 15 kPa, resulting inTGR,S = 18.1 kN/m. In the Zaeske and CA models, z is subtracted from H, which resultedto TGR,S = 13.1 kN/m.
The Extended Carlsson, SINTEF, and H&R models, and their corresponding standardsor recommendations consider no subsoil support. A void is assumed to form underneaththe GR due to soil consolidation and creep strains. That means that the entire embankmentweight and surcharge load are transferred onto the pile heads, directly through the archingeffect and indirectly through the membrane effect. Thus, Qhead% = 100% for the ExtendedCarlsson, SINTEF and H&R models. TGR,M is based on the geometry, load on the GR, GRstiffness, and maximum GR strain (εGR,max). The value of εGR,max is chosen based on theallowed short- and long-term strains. εGR,max was set to 6% for the calculations with the
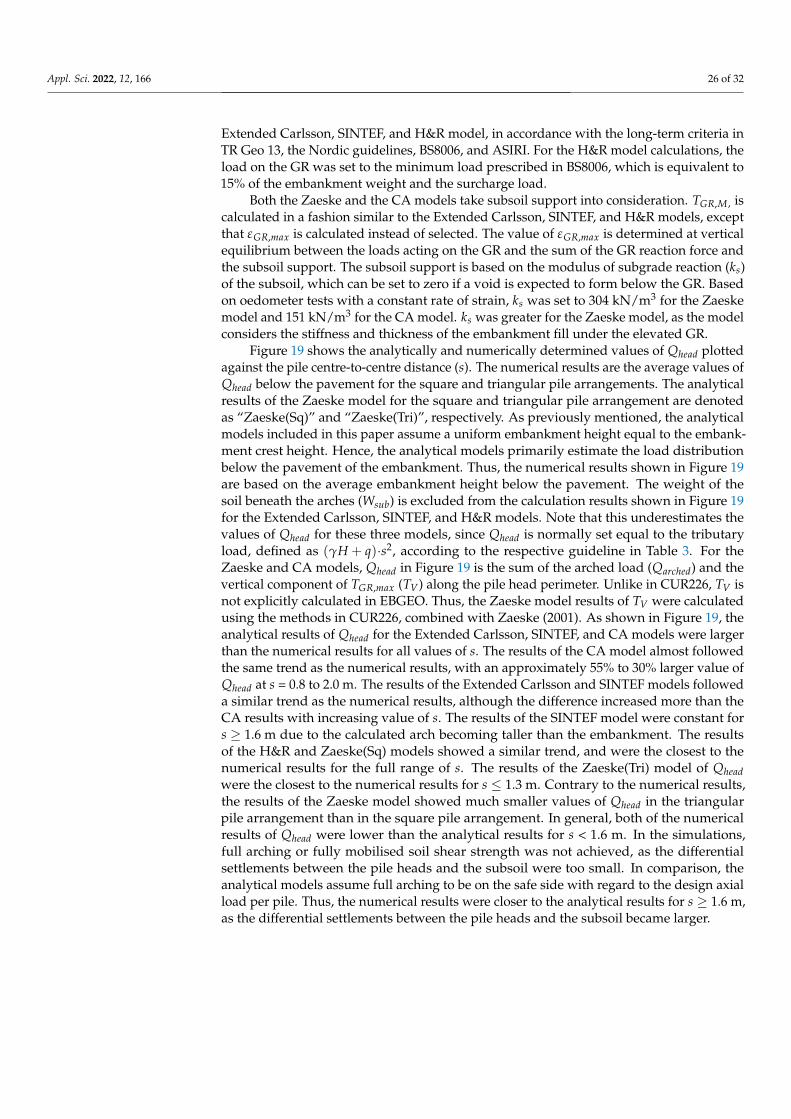
Appl. Sci. 2022, 12, 166 26 of 32
Extended Carlsson, SINTEF, and H&R model, in accordance with the long-term criteria inTR Geo 13, the Nordic guidelines, BS8006, and ASIRI. For the H&R model calculations, theload on the GR was set to the minimum load prescribed in BS8006, which is equivalent to15% of the embankment weight and the surcharge load.
Both the Zaeske and the CA models take subsoil support into consideration. TGR,M , iscalculated in a fashion similar to the Extended Carlsson, SINTEF, and H&R models, exceptthat εGR,max is calculated instead of selected. The value of εGR,max is determined at verticalequilibrium between the loads acting on the GR and the sum of the GR reaction force andthe subsoil support. The subsoil support is based on the modulus of subgrade reaction (ks)of the subsoil, which can be set to zero if a void is expected to form below the GR. Basedon oedometer tests with a constant rate of strain, ks was set to 304 kN/m3 for the Zaeskemodel and 151 kN/m3 for the CA model. ks was greater for the Zaeske model, as the modelconsiders the stiffness and thickness of the embankment fill under the elevated GR.
Figure 19 shows the analytically and numerically determined values of Qhead plottedagainst the pile centre-to-centre distance (s). The numerical results are the average values ofQhead below the pavement for the square and triangular pile arrangements. The analyticalresults of the Zaeske model for the square and triangular pile arrangement are denotedas “Zaeske(Sq)” and “Zaeske(Tri)”, respectively. As previously mentioned, the analyticalmodels included in this paper assume a uniform embankment height equal to the embank-ment crest height. Hence, the analytical models primarily estimate the load distributionbelow the pavement of the embankment. Thus, the numerical results shown in Figure 19are based on the average embankment height below the pavement. The weight of thesoil beneath the arches (Wsub) is excluded from the calculation results shown in Figure 19for the Extended Carlsson, SINTEF, and H&R models. Note that this underestimates thevalues of Qhead for these three models, since Qhead is normally set equal to the tributaryload, defined as (γH + q)·s2, according to the respective guideline in Table 3. For theZaeske and CA models, Qhead in Figure 19 is the sum of the arched load (Qarched) and thevertical component of TGR,max (TV) along the pile head perimeter. Unlike in CUR226, TV isnot explicitly calculated in EBGEO. Thus, the Zaeske model results of TV were calculatedusing the methods in CUR226, combined with Zaeske (2001). As shown in Figure 19, theanalytical results of Qhead for the Extended Carlsson, SINTEF, and CA models were largerthan the numerical results for all values of s. The results of the CA model almost followedthe same trend as the numerical results, with an approximately 55% to 30% larger value ofQhead at s = 0.8 to 2.0 m. The results of the Extended Carlsson and SINTEF models followeda similar trend as the numerical results, although the difference increased more than theCA results with increasing value of s. The results of the SINTEF model were constant fors ≥ 1.6 m due to the calculated arch becoming taller than the embankment. The resultsof the H&R and Zaeske(Sq) models showed a similar trend, and were the closest to thenumerical results for the full range of s. The results of the Zaeske(Tri) model of Qheadwere the closest to the numerical results for s ≤ 1.3 m. Contrary to the numerical results,the results of the Zaeske model showed much smaller values of Qhead in the triangularpile arrangement than in the square pile arrangement. In general, both of the numericalresults of Qhead were lower than the analytical results for s < 1.6 m. In the simulations,full arching or fully mobilised soil shear strength was not achieved, as the differentialsettlements between the pile heads and the subsoil were too small. In comparison, theanalytical models assume full arching to be on the safe side with regard to the design axialload per pile. Thus, the numerical results were closer to the analytical results for s ≥ 1.6 m,as the differential settlements between the pile heads and the subsoil became larger.
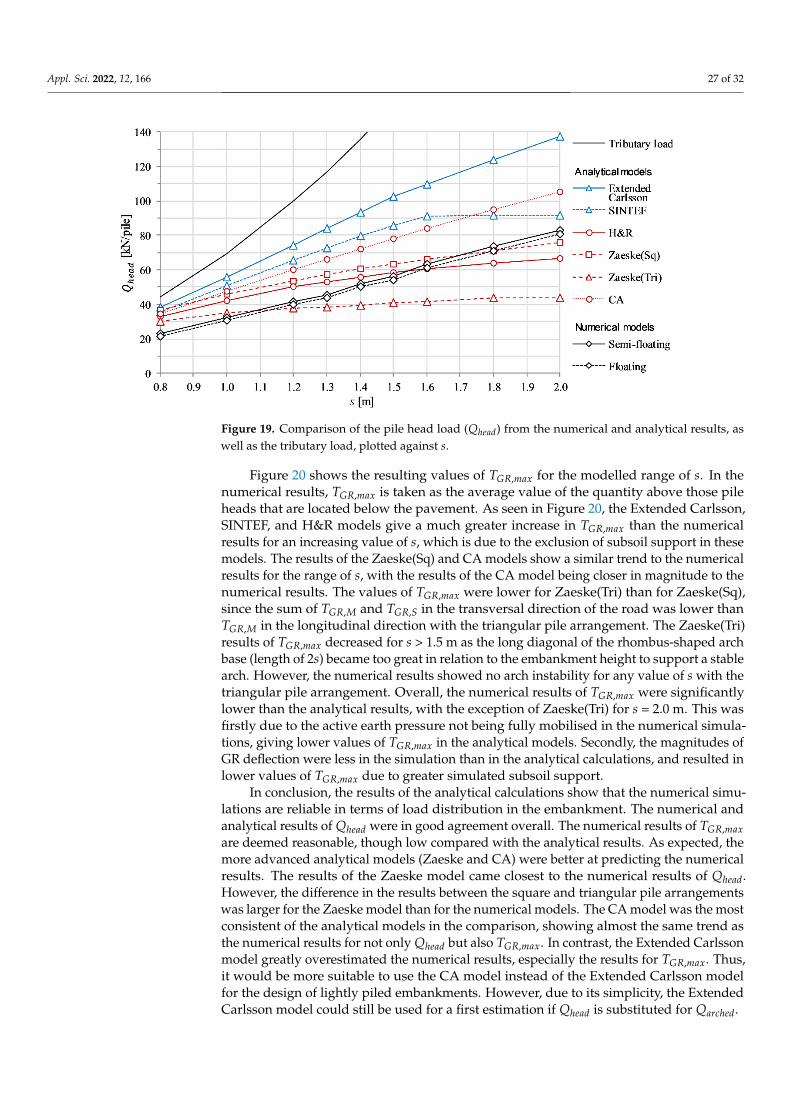
Appl. Sci. 2022, 12, 166 27 of 32
Appl. Sci. 2022, 12, x FOR PEER REVIEW 28 of 33
arrangement. In general, both of the numerical results of 𝑄 were lower than the analytical results for 𝑠 < 1.6 m. In the simulations, full arching or fully mobilised soil shear strength was not achieved, as the differential settlements between the pile heads and the subsoil were too small. In comparison, the analytical models assume full arching to be on the safe side with regard to the design axial load per pile. Thus, the numerical results were closer to the analytical results for 𝑠 ≥ 1.6 m, as the differential settlements between the pile heads and the subsoil became larger.
Figure 19. Comparison of the pile head load (𝑄 ) from the numerical and analytical results, as well as the tributary load, plotted against 𝑠.
Figure 20 shows the resulting values of 𝑇 , for the modelled range of 𝑠. In the numerical results, 𝑇 , is taken as the average value of the quantity above those pile heads that are located below the pavement. As seen in Figure 20, the Extended Carlsson, SINTEF, and H&R models give a much greater increase in 𝑇 , than the numerical results for an increasing value of 𝑠, which is due to the exclusion of subsoil support in these models. The results of the Zaeske(Sq) and CA models show a similar trend to the numerical results for the range of 𝑠, with the results of the CA model being closer in magnitude to the numerical results. The values of 𝑇 , were lower for Zaeske(Tri) than for Zaeske(Sq), since the sum of 𝑇 , and 𝑇 , in the transversal direction of the road was lower than 𝑇 , in the longitudinal direction with the triangular pile arrangement. The Zaeske(Tri) results of 𝑇 , decreased for 𝑠 > 1.5 m as the long diagonal of the rhombus-shaped arch base (length of 2𝑠) became too great in relation to the embankment height to support a stable arch. However, the numerical results showed no arch instability for any value of s with the triangular pile arrangement. Overall, the numerical results of 𝑇 , were significantly lower than the analytical results, with the exception of Zaeske(Tri) for 𝑠 = 2.0 m. This was firstly due to the active earth pressure not being fully mobilised in the numerical simulations, giving lower values of 𝑇 , in the analytical models. Secondly, the magnitudes of GR deflection were less in the simulation than in the analytical calculations, and resulted in lower values of 𝑇 , due to greater simulated subsoil support.
Figure 19. Comparison of the pile head load (Qhead) from the numerical and analytical results, aswell as the tributary load, plotted against s.
Figure 20 shows the resulting values of TGR,max for the modelled range of s. In thenumerical results, TGR,max is taken as the average value of the quantity above those pileheads that are located below the pavement. As seen in Figure 20, the Extended Carlsson,SINTEF, and H&R models give a much greater increase in TGR,max than the numericalresults for an increasing value of s, which is due to the exclusion of subsoil support in thesemodels. The results of the Zaeske(Sq) and CA models show a similar trend to the numericalresults for the range of s, with the results of the CA model being closer in magnitude to thenumerical results. The values of TGR,max were lower for Zaeske(Tri) than for Zaeske(Sq),since the sum of TGR,M and TGR,S in the transversal direction of the road was lower thanTGR,M in the longitudinal direction with the triangular pile arrangement. The Zaeske(Tri)results of TGR,max decreased for s > 1.5 m as the long diagonal of the rhombus-shaped archbase (length of 2s) became too great in relation to the embankment height to support a stablearch. However, the numerical results showed no arch instability for any value of s with thetriangular pile arrangement. Overall, the numerical results of TGR,max were significantlylower than the analytical results, with the exception of Zaeske(Tri) for s = 2.0 m. This wasfirstly due to the active earth pressure not being fully mobilised in the numerical simula-tions, giving lower values of TGR,max in the analytical models. Secondly, the magnitudes ofGR deflection were less in the simulation than in the analytical calculations, and resulted inlower values of TGR,max due to greater simulated subsoil support.
In conclusion, the results of the analytical calculations show that the numerical simu-lations are reliable in terms of load distribution in the embankment. The numerical andanalytical results of Qhead were in good agreement overall. The numerical results of TGR,maxare deemed reasonable, though low compared with the analytical results. As expected, themore advanced analytical models (Zaeske and CA) were better at predicting the numericalresults. The results of the Zaeske model came closest to the numerical results of Qhead.However, the difference in the results between the square and triangular pile arrangementswas larger for the Zaeske model than for the numerical models. The CA model was the mostconsistent of the analytical models in the comparison, showing almost the same trend asthe numerical results for not only Qhead but also TGR,max. In contrast, the Extended Carlssonmodel greatly overestimated the numerical results, especially the results for TGR,max. Thus,it would be more suitable to use the CA model instead of the Extended Carlsson modelfor the design of lightly piled embankments. However, due to its simplicity, the ExtendedCarlsson model could still be used for a first estimation if Qhead is substituted for Qarched.
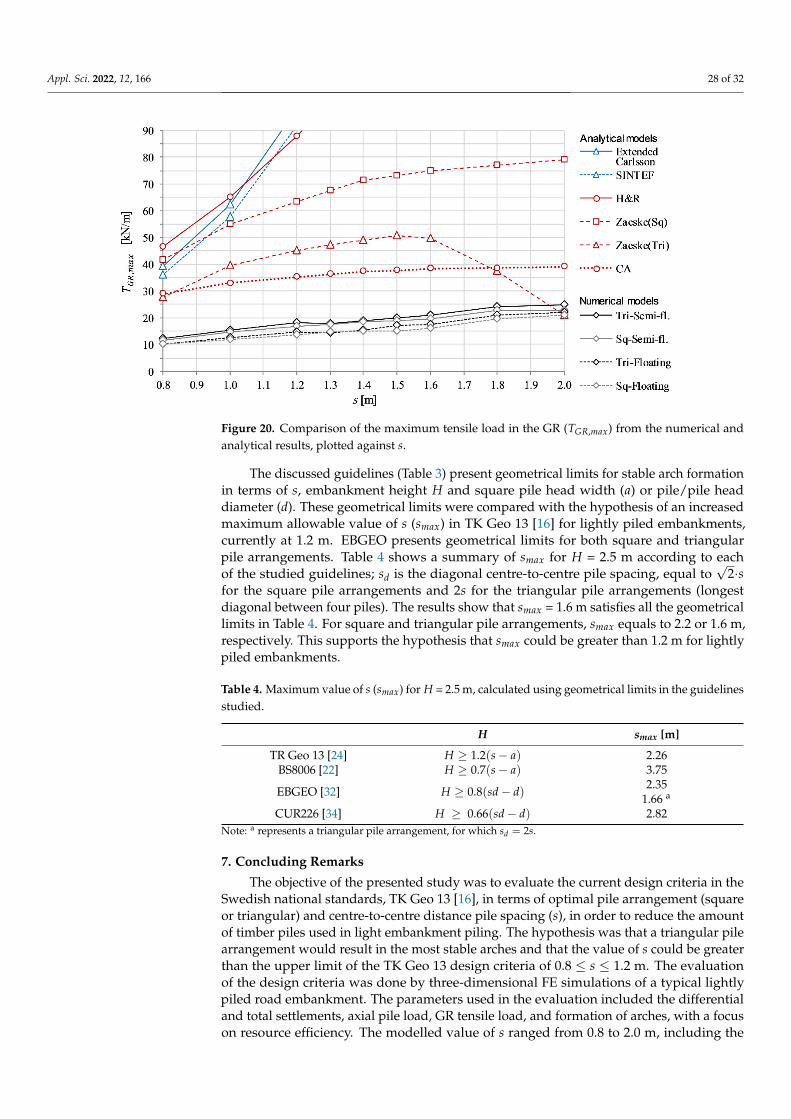
Appl. Sci. 2022, 12, 166 28 of 32Appl. Sci. 2022, 12, x FOR PEER REVIEW 29 of 33
Figure 20. Comparison of the maximum tensile load in the GR (𝑇 , ) from the numerical and analytical results, plotted against 𝑠.
In conclusion, the results of the analytical calculations show that the numerical simulations are reliable in terms of load distribution in the embankment. The numerical and analytical results of 𝑄 were in good agreement overall. The numerical results of 𝑇 , are deemed reasonable, though low compared with the analytical results. As expected, the more advanced analytical models (Zaeske and CA) were better at predicting the numerical results. The results of the Zaeske model came closest to the numerical results of 𝑄 . However, the difference in the results between the square and triangular pile arrangements was larger for the Zaeske model than for the numerical models. The CA model was the most consistent of the analytical models in the comparison, showing almost the same trend as the numerical results for not only 𝑄 but also 𝑇 , . In contrast, the Extended Carlsson model greatly overestimated the numerical results, especially the results for 𝑇 , . Thus, it would be more suitable to use the CA model instead of the Extended Carlsson model for the design of lightly piled embankments. However, due to its simplicity, the Extended Carlsson model could still be used for a first estimation if 𝑄 is substituted for 𝑄 .
The discussed guidelines (Table 3) present geometrical limits for stable arch formation in terms of 𝑠 , embankment height 𝐻 and square pile head width (𝑎 ) or pile/pile head diameter (𝑑). These geometrical limits were compared with the hypothesis of an increased maximum allowable value of 𝑠 (𝑠 ) in TK Geo 13 [16] for lightly piled embankments, currently at 1.2 m. EBGEO presents geometrical limits for both square and triangular pile arrangements. Table 4 shows a summary of 𝑠 for 𝐻 = 2.5 m according to each of the studied guidelines; 𝑠 is the diagonal centre-to-centre pile spacing, equal to √2 · 𝑠 for the square pile arrangements and 2𝑠 for the triangular pile arrangements (longest diagonal between four piles). The results show that 𝑠 = 1.6 m satisfies all the geometrical limits in Table 4. For square and triangular pile arrangements, 𝑠 equals to 2.2 or 1.6 m, respectively. This supports the hypothesis that 𝑠 could be greater than 1.2 m for lightly piled embankments.
Figure 20. Comparison of the maximum tensile load in the GR (TGR,max) from the numerical andanalytical results, plotted against s.
The discussed guidelines (Table 3) present geometrical limits for stable arch formationin terms of s, embankment height H and square pile head width (a) or pile/pile headdiameter (d). These geometrical limits were compared with the hypothesis of an increasedmaximum allowable value of s (smax) in TK Geo 13 [16] for lightly piled embankments,currently at 1.2 m. EBGEO presents geometrical limits for both square and triangularpile arrangements. Table 4 shows a summary of smax for H = 2.5 m according to eachof the studied guidelines; sd is the diagonal centre-to-centre pile spacing, equal to
√2·s
for the square pile arrangements and 2s for the triangular pile arrangements (longestdiagonal between four piles). The results show that smax = 1.6 m satisfies all the geometricallimits in Table 4. For square and triangular pile arrangements, smax equals to 2.2 or 1.6 m,respectively. This supports the hypothesis that smax could be greater than 1.2 m for lightlypiled embankments.
Table 4. Maximum value of s (smax) for H = 2.5 m, calculated using geometrical limits in the guidelinesstudied.
H smax [m]
TR Geo 13 [24] H ≥ 1.2(s− a) 2.26BS8006 [22] H ≥ 0.7(s− a) 3.75
EBGEO [32] H ≥ 0.8(sd− d) 2.351.66 a
CUR226 [34] H ≥ 0.66(sd− d) 2.82Note: a represents a triangular pile arrangement, for which sd = 2s.
7. Concluding Remarks
The objective of the presented study was to evaluate the current design criteria in theSwedish national standards, TK Geo 13 [16], in terms of optimal pile arrangement (squareor triangular) and centre-to-centre distance pile spacing (s), in order to reduce the amountof timber piles used in light embankment piling. The hypothesis was that a triangular pilearrangement would result in the most stable arches and that the value of s could be greaterthan the upper limit of the TK Geo 13 design criteria of 0.8 ≤ s ≤ 1.2 m. The evaluationof the design criteria was done by three-dimensional FE simulations of a typical lightlypiled road embankment. The parameters used in the evaluation included the differentialand total settlements, axial pile load, GR tensile load, and formation of arches, with a focuson resource efficiency. The modelled value of s ranged from 0.8 to 2.0 m, including the
Appl. Sci. 2022, 12, 166 29 of 32
TK Geo 13 design criterion of 0.8 ≤ s ≤ 1.2 m. Both floating and semi-floating pile groupswere modelled, with either square or triangular pile arrangements, resulting in 38 differentcases in total. The limiting states were set as the maximum allowed total and differentialsettlements in TK Geo 13 as well as the structural bearing capacity of the piles and GR.
A state-of-the-art study was carried out on the mechanisms of load transfer in GRPSE,as well as the GRPSE guidelines and analytical models used in practice. The numerical re-sults from FE simulations were compared and validated against results from five analyticalmodels implemented in European national standards or recommendations, namely, theExtended Carlsson model by Rogbeck et al. [26] and the Concentric Arches (CA) modelby Van Eekelen [8], the former being the prescribed analytical model in TR Geo 13 [24]for the design of lightly piled embankments. The results of the comparison show that thenumerical simulations are reliable in terms of load distribution in the embankment. Thenumerical results of the GR tensile load were low in magnitude in comparison with theanalytical results, but deemed reasonable. Overall, the Extended Carlsson model greatlyoverestimated the numerical results. Thus, it is recommended to use the CA model primar-ily instead of the Extended Carlsson model for the design of lightly piled embankments.However, the simpler Extended Carlsson model could still be used for a first estimationwhen designing them.
Mostly triangular arches were observed between the piles, due to lack of differentialsettlements between the piles and subsoil for semi-circular arches to form. Stable archesshould in the present study form for s ≤ 1.6 m, following the geometrical limits of thestudied national standards and recommendations. The simulations showed no significantarch instabilities for the modelled range of s, i.e., 0.8 ≤ s ≤ 2.0 m. However, the slopesof the embankment had a significant influence on the overall arch formation. Due to thespreading effect of the embankment slopes arch formation was asymmetrical, with archesprimarily forming in the longitudinal road direction. By modelling an embankment withuniform height instead, the arch formation was symmetrical in the transversal and thelongitudinal road directions. The overall arching effect was also greater compared with thesloped embankment. In the GRPSE design, the embankments are in general assumed tobe uniform when calculating the arching and membrane effect, and the spreading effect isonly considered when calculating the tensile force in the GR. Thus, assuming a uniformembankment in GRPSE design may neglect asymmetrical arch formation caused by thespreading effect of the embankment slopes.
The simulations show that the pile arrangement, square or triangular, has no significantinfluence on the settlements of a lightly piled embankment, nor does the type of pilearrangement have any significant influence on the arching and the membrane effect. Theseresults indicate that the maximum allowable value of s in TK Geo 13 can increase from 1.2 to1.6 m without reaching the characteristic bearing capacity of the timber piles. The structuralbearing capacity of the GR was far from being exceeded for any value of s. Furthermore,the settlements did not exceed the serviceability limits in TK Geo 13 for the modelled rangeof s. The settlements of embankments with a floating pile group remained almost constantfor 0.8 ≤ s ≤ 1.2 m. In contrast, the settlements increased by roughly 30% on average forthe semi-floating pile groups when increasing s from 0.8 to 1.2 m. Thus, it might onlybe beneficial in terms of settlement reduction to install piles with s < 1.2 m if the pilescan be driven down to a firm soil layer or bedrock. By increasing s from 1.2 to 1.4 m, theresource efficiency in terms of settlement reduction per pile increased by 30% for both thefloating and semi-floating piles, and the number of piles was reduced by almost one third.Increasing s above 1.4 m resulted in significantly less gain in resource efficiency. Based onthe results, it is recommended to consider setting the TK Geo 13 design criterion of s to0.8 ≤ s ≤ 1.4 m for lightly piled embankments. It should be noted that the geometry of theFE simulations is exact, which is not the case in reality. There are variations in pile headdiameter, pile position and pile curvature, for example. No probabilistic model was usedto take these variations into account. The piles can be expected to be driven within ±5 cmaccuracy of the suggested design criterion of s.

Appl. Sci. 2022, 12, 166 30 of 32
In the future, our research group is planning to examine the arching and membraneeffect in lightly piled embankments for different embankment heights and locations ofthe GR, as well as to test the hypothesis of increased allowable s to 1.4 m. A newly builtthree-lane motorway is currently being monitored. The monitoring results will be used tocalibrate a physical model and an FE model of the motorway embankment.
Author Contributions: Conceptualization, P.G. and H.M.; methodology, P.G.; software, P.G.; valida-tion, P.G. and H.M.; formal analysis, P.G.; investigation, P.G.; resources, H.M.; data curation, P.G.;writing—original draft preparation, P.G.; writing—review and editing, P.G., H.M. and J.L.; visualiza-tion, P.G.; supervision, H.M. and J.L.; project administration, H.M. and J.L.; funding acquisition, H.M.All authors have read and agreed to the published version of the manuscript.
Funding: This work was funded by the Swedish Transport Administration (STA) and the Swedishjoint research program for road and railway geotechnology, Branschsamverkan i grunden (BIG) [grantnumber B2015-21].
Institutional Review Board Statement: Not applicable.
Informed Consent Statement: Not applicable.
Data Availability Statement: The data that support the findings of this study are available from thecorresponding author upon reasonable request.
Conflicts of Interest: The authors declare no conflict of interest. The funders had no role in the designof the study; in the collection, analyses, or interpretation of data; in the writing of the manuscript, orin the decision to publish the results.
References1. Reynolds, T.N. Timber Piles and Foundations, BRE Digest 479; Building Research Establishment (BRE), BRE Bookshop: London,
UK, 2003.2. Van Eekelen, S.J.M.; Meindert, A.V.; Bezuijen, A. The Kyoto Road, a full-scale test. Measurements and calculations. In Proceedings
of the 14th European Conference on Soils Mechanics and Geotechnical Engineering, Madrid, Spain, 24–27 September 2007;Millpress: Rotterdam, The Netherland, 2007; Volume 1, pp. 1533–1538.
3. Logheed, A. The Use of Geosynthetic Reinforced Pile-Supported Embankments on Port Mann Highway 1 Improvement Project. InProceedings of the 6th International Young Geotechnical Engineers Conference, Seoul, Korea, 16–17 September 2017; InternationalSociety for Soil Mechanics and Geotechnical Engineering: London, UK, 2017; pp. 92–93. [CrossRef]
4. Nurdin, S.; Sawada, K.; Moriguchi, S. Design Criterion of Reinforcement on Thick Soft Clay Foundations of TraditionalConstruction Method in Indonesia. MATEC Web Conf. 2019, 258, 03010. [CrossRef]
5. Terzaghi, K. Theoretical Soil Mechanics; Wiley: New York, NY, USA, 1943.6. Le Hello, B.; Villard, P. Embankments reinforced by piles and geosynthetics—Numerical and experimental studies dealing with
the transfer of load on the soil embankment. Eng. Geol. 2009, 106, 78–91. [CrossRef]7. Satibi, S. Numerical Analysis and Design Criteria of Embankments on Floating Piles. Ph.D. Thesis, Institute for Geotechnical
Engineering, University of Stuttgart, Stuttgart, Germany, 2009.8. Van Eekelen, S.J.M. Basal Reinforced Piled Embankment—Experiments, Field Studies and the Development and Validation of a
New Analytical Design Model. Ph.D. Thesis, Delft University of Technology, Delft, The Netherland, 2015. [CrossRef]9. Zhang, C.; Jiang, G.; Liu, X.; Buzzi, O. Arching in geogrid-reinforced pile-supported embankments over silty clay of medium
compressibility: Field data and analytical solution. Comput. Geotech. 2016, 77, 11–25. [CrossRef]10. Van Eekelen, S.J.M.; Han, J. Geosynthetic-reinforced pile-supported embankments: State of the art. Geosynth. Int. 2020, 27,
112–141. [CrossRef]11. Gourc, J.P.; Villard, P. Reinforcement by membrane effect: Application to embankments on soil liable to subsidence. In Proceedings
of the 2nd Asian Geosynthetics Conference, Kuala Lumpur, Malaysia, 29–31 May 2000; The Institution of Engineers Malaysia:Kuala Lumpur, Malaysia, 2000; Volume 1, pp. 55–72.
12. Esmaeili, M.; Khajehei, H. Mechanical behavior of embankments overlying on loose subgrade stabilized by deep mixed columns.J. Rock Mech. Geotech. Eng. 2016, 8, 651–659. [CrossRef]
13. Wijerathna, M.; Liyanapathirana, D.S. Load transfer mechanism in geosynthetic reinforced column-supported embankments.Geosynth. Int. 2020, 27, 236–248. [CrossRef]
14. Dent, D. Acid Sulphate Soils: A Baseline for Research and Development; International Institute for Land Reclamation and Improvement(ILRI): Wageningen, The Netherlands, 1986.
15. Pousette, K. Miljöteknisk Bedömning Och Hantering Av Sulfidjordsmassor (Environmental Assessment and Management of Sulfide RichSoils); Luleå University of Technology: Luleå, Sweden, 2010. (In Swedish)
Appl. Sci. 2022, 12, 166 31 of 32
16. STA. Trafikverkets Tekniska Krav för Geokonstruktioner-TK Geo 13; Publ. 2013:0667, Version 2.0; The Swedish Transport Administration(STA): Borlänge, Sweden, 2016. (In Swedish)
17. STA. Trafikverkets Tekniska Krav för Geokonstruktioner-TK Geo 11; Publ. 2011:047; The Swedish Transport Administration (STA):Borlänge, Sweden, 2011. (In Swedish)
18. Chai, X.J.; Deng, K.; He, C.F.; Xiong, Y.F. Laboratory Model Tests on Consolidation Performance of Soil Column with Drained-Timber Rod. Adv. Civ. Eng. 2021, 2021, 1–8. [CrossRef]
19. Rixner, J.J.; Kraemer, S.R.; Smith, A.D. Prefabricated Vertical Drains; Federal Highway Administration: Washington, DC, USA, 1986;Volume I.
20. Olson, S.J. Eisenhower Bridge North Abutment and Approach Settlement: A Case History of Timber Pile Downdrag andComparative Downdrag Effect on Steel Piles. In Proceedings of the Geo-Congress 2020, Minneapolis, MN, USA, 25–28 February2020; American Society of Civil Engineers (ASCE): Reston, VA, USA, 2020.
21. Björklund, L.; Hesselman, J.; Lundgren, C.; Nylinder, M. Jämförelser Mellan Metoder för Fastvolymbestämning av Stockar; Institutionenför Skoglig Resurshållning (Department of Forest Resource Management) Report 15; Swedish University of Agricultural Sciences:Uppsala, Sweden, 2009. (In Swedish)
22. BSI. British Standard BS8006-1Code of Practice for Strengthened/Reinforced Soils and Other Fills, British Standards Institution (BSI):London, UK, 2010.
23. Rogbeck, Y.; Alén, C.; Franzén, G.; Kjeld, A.; Odén, K.; Rathmayer, H.; Watn, A. Nordic Guidelines for Reinforced Soils and Fills;Revision B; The Nordic Geotechnical Societies and Nordic Industrial Fund: Linköping, Sweden, 2005.
24. STA. Trafikverkets Tekniska Råd för Geokonstruktioner-TR Geo 13; Publ. 2013:0668, Version 2.0; The Swedish Transport Administration(STA): Borlänge, Sweden, 2016. (In Swedish)
25. Carlsson, B. Armerad Jord Beräkningsprinciper för Vertikala Väggar, Branta Slänter, Bankar på Lös Undergrund, Bankar på Pålar;Terratema AB: Linköping, Sweden, 1987. (In Swedish)
26. Rogbeck, Y.; Gustavsson, S.; Södergren, I.; Lindquist, D. Reinforced Piled Embankments in Sweden—Design Aspects. InProceedings of the 6th International Conference on Geosynthetics, Atlanta, Georgia, 25–29 March 1998; International GeosyntheticsSociety: Jupiter, FL, USA, 1998; pp. 755–762.
27. Svanø, G.; Ilstad, T.; Eiksund, G.; Want, A. Alternative calculation principle for design of piled embankments with basereinforcement. In Proceedings of the 4th International Conference on Ground Improvement Geosystems, Helsinki, Finland, 7–9June 2000; International Geosynthetics Society: Jupiter, FL, USA, 2000; pp. 541–548.
28. NPRA. Grunnforsterkning, Fyllinger og Skråninger, Håndbok V221, 2nd ed.; The Norwegian Public Roads Administration (NPRA):Oslo, Norway, 2014; (In Norwegian).
29. Hewlett, W.J.; Randolph, M.F. Analysis of piled embankments. Ground Eng. 1988, 21, 12–18.30. IREX. ASIRI National Project—Recommendations for the Design, Construction and Control of Rigid Inclusion Ground Improvements;
Institut Pour la Recherche Appliquée et L’expérimentation en Génie Civil (IREX): Paris, France, 2013.31. Zaeske, D. Zur Wirkungsweise von Unbewehrten und bewehrten Mineralischen Tragschichten Über Pfahlartigen Gründungselementen;
University of Kassel: Kassel, Germany, 2001. (In German)32. DGGT. Recommendations for Design and Analysis of Earth Structures using Geosynthetic Reinforcements—EBGEO, 2nd ed.; English
Translation; Reinforced Earth Structures over Point or Linear Bearing Elements; Wilhelm Ernst & Sohn: Berlin, Germany, 2011;pp. 151–200.
33. Van Eekelen, S.J.M. The 2016-update of the Dutch Design Guidelines for Basal Reinforced Piled Embankments. In Proceedings ofthe 3rd International Conference on Transportation Geotechnics, Guimarães, Portugal, 4–7 September 2016; International Societyfor Soil Mechanics and Geotechnical Engineering: London, UK, 2016; Volume 143, pp. 582–589. [CrossRef]
34. SBRCURnet. CUR226 Design Guideline Basal Reinforced Piled Embankments; Publ. CUR226:2016; SBRCURnet: Delft, The Netherland,2016.
35. Lai, H.-J.; Zheng, J.-J.; Zhang, J.; Zhang, R.-J.; Cui, L. DEM analysis of “soil”-arching within geogrid-reinforced and unreinforcedpile-supported embankments. Comput. Geotech. 2014, 61, 13–23. [CrossRef]
36. Bhasi, A.; Rajagopal, K. Numerical study of basal reinforced embankments supported on floating/end bearing piles consideringpile–soil interaction. Geotext. Geomembranes 2015, 43, 524–536. [CrossRef]
37. Rui, R.; Ye, Y.-Q.; Han, J.; Zhai, Y.-X.; Wan, Y.; Chen, C.; Zhang, L. Two-dimensional soil arching evolution in geosynthetic-reinforced pile-supported embankments over voids. Geotext. Geomembranes 2022, 50, 82–98. [CrossRef]
38. Rui, R.; van Tol, F.; Xia, X.-L.; van Eekelen, S.; Hu, G.; Xia, Y.-Y. Evolution of soil arching; 2D DEM simulations. Comput. Geotech.2016, 73, 199–209. [CrossRef]
39. da Silva, T.S.; Elshafie, M.Z.E.B.; Madabhushi, G.S.P. Physical modelling of geosynthetic-reinforced soils spanning voids. InProceedings of the 6th European Geosynthetics Congress, Ljubljana, Slovenia, 25–28 September 2016; Turkish Chapter ofInternational Geosynthetics Society: Istanbul, Turkey, 2016; pp. 774–781.
40. Iglesia, G.R.; Einstein, H.H.; Whitman, R.V. Investigation of Soil Arching with Centrifuge Tests. J. Geotech. Geoenviron. Eng. 2014,140, 04013005. [CrossRef]
41. Van der Peet, T.C.; Van Eekelen, S.J.M. 3D numerical analysis of basal reinforced piled embankments. In Proceedings of the 10thInternational Conference on Geosynthetics, Berlin, Germany, 21–25 September 2014; International Geosynthetics Society: Jupiter,FL, USA, 2014; Volume 3.
Appl. Sci. 2022, 12, 166 32 of 32
42. King, D.; Bouazza, A.; Gniel, J.R.; Rowe, R.K.; Bui, H.H. Load-transfer platform behaviour in embankments supported onsemi-rigid columns: Implications of the ground reaction curve. Can. Geotech. J. 2017, 54, 1158–1175. [CrossRef]
43. Brinkgreve, R.B.J.; Kumarswarmy, S.; Swolfs, W.M.; Foria, F. PLAXIS 3D 2017—Manual; Plaxis bv: Delft, The Netherlands, 2017.44. Tschuchnigg, F.; Schweiger, H. The embedded pile concept—Verification of an efficient tool for modelling complex deep
foundations. Comput. Geotech. 2015, 63, 244–254. [CrossRef]45. Gunnvard, P.; Mattsson, H.; Laue, J. Numerical Analysis of the Mechanical Behaviour of Light Embankment Piling. In Proceedings
of the 19th International Conference on Soil Mechanics and Geotechnical Engineering, Seoul, Korea, 17–22 September 2017;Korean Geotechnical Society: Seoul, Korea, 2017; Volume 1, pp. 749–752.
46. Hong, W.P.; Hong, S.; Song, J.S. Load Transfer by Punching Shear in Pile-Supported Embankments on Soft Grounds. Mar.Georesour. Geotechnol. 2011, 29, 279–298. [CrossRef]
47. Larsson, R. Information 1—Jords Egenskaper, 5th ed.; Swedish Geotechnical Institute: Linköping, Sweden, 2008. (In Swedish)48. Eriksson, P.; Jendeby, L.; Olsson, T.; Svensson, T. Kohesionspålar; Report 100; Pålkommissionen (Commission on Pile Research):
Linköping, Sweden, 2004. (In Swedish)49. SIS. SS-EN 338:2016Structural Timber—Strength Classes, Swedish Standards Institute (SIS): Stockholm, Sweden, 2016.50. Dinwoodie, J.M. Timber; Its Nature and Behaviour; Taylor & Francis e-Library [e-book]: Milton Park, UK, 2004; ISBN 0-203-47787-1.51. Ingströmer, P.; Lindblad, E. Hygro-Mekaniskt Beteende Hos Trä Vid Olika Klimatförhållanden. Master’s Thesis, Lund Institute of
Technology, Lund, Sweden, 1998. (In Swedish).52. Rui, R.; Zhai, Y.X.; Han, J.; Van Eekelen, S.J.M.; Chen, C. Deformations in trapdoor tests and piled embankments. Geosynth. Int.
2020, 27, 219–235. [CrossRef]53. Fahmi Farag, G.S. Lateral Spreading in Basal Reinforced Embankments Supported by Pile-Like Elements; University of Kassel: Kassel,
Germany, 2008.54. Briançon, L.; Simon, B. Performance of Pile-Supported Embankment over Soft Soil: Full-Scale Experiment. J. Geotech. Geoenviron.
Eng. 2012, 138, 551–561. [CrossRef]