Large-scale association analysis identifies 13 new susceptibility loci for coronary artery disease
Upload
independentCategory
view
0download
0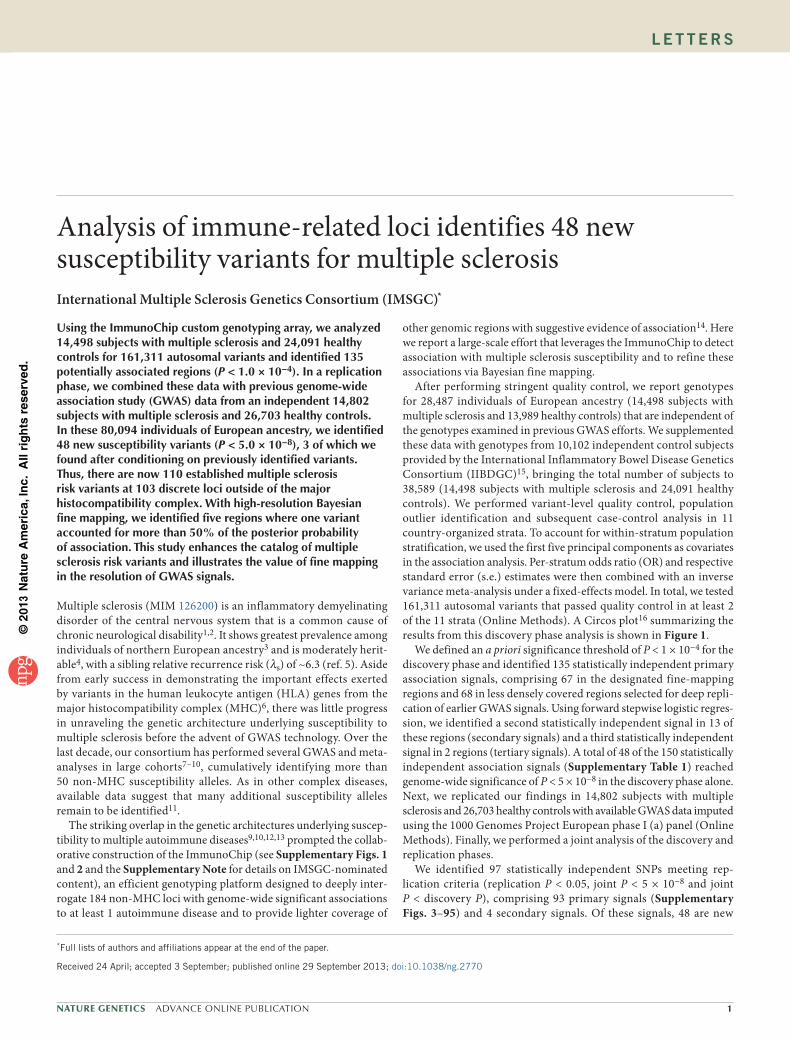
©20
13 N
atu
re A
mer
ica,
Inc.
All
rig
hts
res
erve
d.
Nature GeNetics ADVANCE ONLINE PUBLICATION �
l e t t e r s
Using the ImmunoChip custom genotyping array, we analyzed �4,498 subjects with multiple sclerosis and 24,09� healthy controls for �6�,3�� autosomal variants and identified �35 potentially associated regions (P < �.0 × �0−4). In a replication phase, we combined these data with previous genome-wide association study (GWAS) data from an independent �4,802 subjects with multiple sclerosis and 26,703 healthy controls. In these 80,094 individuals of European ancestry, we identified 48 new susceptibility variants (P < 5.0 × �0−8), 3 of which we found after conditioning on previously identified variants. Thus, there are now ��0 established multiple sclerosis risk variants at �03 discrete loci outside of the major histocompatibility complex. With high-resolution Bayesian fine mapping, we identified five regions where one variant accounted for more than 50% of the posterior probability of association. This study enhances the catalog of multiple sclerosis risk variants and illustrates the value of fine mapping in the resolution of GWAS signals.
Multiple sclerosis (MIM 126200) is an inflammatory demyelinating disorder of the central nervous system that is a common cause of chronic neurological disability1,2. It shows greatest prevalence among individuals of northern European ancestry3 and is moderately herit-able4, with a sibling relative recurrence risk (λs) of ~6.3 (ref. 5). Aside from early success in demonstrating the important effects exerted by variants in the human leukocyte antigen (HLA) genes from the major histocompatibility complex (MHC)6, there was little progress in unraveling the genetic architecture underlying susceptibility to multiple sclerosis before the advent of GWAS technology. Over the last decade, our consortium has performed several GWAS and meta-analyses in large cohorts7–10, cumulatively identifying more than 50 non-MHC susceptibility alleles. As in other complex diseases, available data suggest that many additional susceptibility alleles remain to be identified11.
The striking overlap in the genetic architectures underlying suscep-tibility to multiple autoimmune diseases9,10,12,13 prompted the collab-orative construction of the ImmunoChip (see Supplementary Figs. 1 and 2 and the Supplementary Note for details on IMSGC-nominated content), an efficient genotyping platform designed to deeply inter-rogate 184 non-MHC loci with genome-wide significant associations to at least 1 autoimmune disease and to provide lighter coverage of
other genomic regions with suggestive evidence of association14. Here we report a large-scale effort that leverages the ImmunoChip to detect association with multiple sclerosis susceptibility and to refine these associations via Bayesian fine mapping.
After performing stringent quality control, we report genotypes for 28,487 individuals of European ancestry (14,498 subjects with multiple sclerosis and 13,989 healthy controls) that are independent of the genotypes examined in previous GWAS efforts. We supplemented these data with genotypes from 10,102 independent control subjects provided by the International Inflammatory Bowel Disease Genetics Consortium (IIBDGC)15, bringing the total number of subjects to 38,589 (14,498 subjects with multiple sclerosis and 24,091 healthy controls). We performed variant-level quality control, population outlier identification and subsequent case-control analysis in 11 country-organized strata. To account for within-stratum population stratification, we used the first five principal components as covariates in the association analysis. Per-stratum odds ratio (OR) and respective standard error (s.e.) estimates were then combined with an inverse variance meta-analysis under a fixed-effects model. In total, we tested 161,311 autosomal variants that passed quality control in at least 2 of the 11 strata (Online Methods). A Circos plot16 summarizing the results from this discovery phase analysis is shown in Figure 1.
We defined an a priori significance threshold of P < 1 × 10⁻⁴ for the discovery phase and identified 135 statistically independent primary association signals, comprising 67 in the designated fine-mapping regions and 68 in less densely covered regions selected for deep repli-cation of earlier GWAS signals. Using forward stepwise logistic regres-sion, we identified a second statistically independent signal in 13 of these regions (secondary signals) and a third statistically independent signal in 2 regions (tertiary signals). A total of 48 of the 150 statistically independent association signals (Supplementary Table 1) reached genome-wide significance of P < 5 × 10⁻⁸ in the discovery phase alone. Next, we replicated our findings in 14,802 subjects with multiple sclerosis and 26,703 healthy controls with available GWAS data imputed using the 1000 Genomes Project European phase I (a) panel (Online Methods). Finally, we performed a joint analysis of the discovery and replication phases.
We identified 97 statistically independent SNPs meeting rep-lication criteria (replication P < 0.05, joint P < 5 × 10⁻⁸ and joint P < discovery P), comprising 93 primary signals (Supplementary Figs. 3–95) and 4 secondary signals. Of these signals, 48 are new
Analysis of immune-related loci identifies 48 new susceptibility variants for multiple sclerosisInternational Multiple Sclerosis Genetics Consortium (IMSGC)*
*Full lists of authors and affiliations appear at the end of the paper.
Received 24 April; accepted 3 September; published online 29 September 2013; doi:10.1038/ng.2770

©20
13 N
atu
re A
mer
ica,
Inc.
All
rig
hts
res
erve
d.
2 ADVANCE ONLINE PUBLICATION Nature GeNetics
l e t t e r s
to multiple sclerosis (Table 1), and 49 correspond to previously identified suscep-tibility loci for multiple sclerosis (Table 2). An additional 11 independent SNPs showed suggestive evidence of association (joint P < 1 × 10⁻⁶) (Supplementary Table 2).
The strongest newly associated SNP, rs12087340 (joint P = 1.1 × 10⁻²⁰; OR = 1.21), lies between BCL10 (encoding B cell CLL/lymphoma 10) and DDAH1 (encoding dimethylarginine dimethylaminohylaminohydrolase 1). The protein encoded by BCL10 contains a caspase recruitment domain (CARD) and has been shown to activate nuclear factor (NF)-κB signaling17. This signaling molecule has an important role in controlling gene expression in inflammation, immunity, cell proliferation and apop-tosis. It has been pursued as a potential therapeutic target for multiple sclerosis18. BCL10 is also reported to interact with other CARD domain–containing proteins, including CARD11 (ref. 19). We addi-tionally identified a new association for rs1843938 (joint P = 1.2 × 10⁻¹⁰; OR = 1.08), which is only 30 kb away from CARD11.
One newly associated SNP, rs2288904 (joint P = 1.6 × 10⁻¹¹; OR = 1.10), was found within an exon, representing a missense variant in SLC44A2 (encoding solute carrier family 44, member 2). Notably, this variant is also reported as a monocyte-specifc cis-acting expres-sion quantitative trait locus (eQTL) for the antisense transcript of the nearby ILF3 gene (encoding interleukin enhancer–binding factor 3)20. The ILF3 protein was first discovered as a subunit of a nuclear factor found in activated T cells, which is required for T cell expression of IL2, an important molecule that regulates many aspects of inflammation.
Of the 49 previously identified risk loci9,10,21, 37 are in designated fine-mapping regions, and 23 of these 37 signals were localized to a single gene on the basis of genomic position (Supplementary Table 3). Although proximity does not necessarily indicate that these genes are functionally relevant, this observation nevertheless emphasizes the usefulness of dense mapping in localizing signals from a genome-wide screen. Our ImmunoChip analysis furthers the understanding of previously proposed secondary signals at three loci (Supplementary Tables 4–6 and Supplementary Note); in particular, we showed that the effects of two previously proposed independent associations at the IL2RA locus7,22 are driven by a single variant, rs2104286.
In an effort to define the functionally relevant variants underlying these associations, we further studied the regions surrounding the 97 associated SNPs using both Bayesian and frequentist approaches in 6,356 subjects with multiple sclerosis and 9,617 healthy controls from the UK (Online Methods)23. As determined by examining imputation quality, fine mapping was possible in 68 regions (Supplementary Table 7), including 66 of 93 primary (Fig. 2a) and 2 of 4 secondary signals. Eight of the 68 regions were fine mapped to high resolution (Fig. 2b, Table 3 and Supplementary Fig. 96). One-third of the vari-ants identified in these eight regions were imputed, indicating the value of imputation, even with dense genotyping coverage.
To assess whether functional annotation24 provides clues about the molecular mechanisms associated with genetic risk, we considered the relationship of variants to annotated coding and regulatory fea-tures in these eight regions. Although we found no variants with mis-sense or nonsense effects, there was a notable enrichment for variants with functional effects, including one variant known to affect splic-ing25, three variants known to correlate with RNA or serum protein levels22,26,27 and several variants overlapping transcription factor binding sites and DNase I hypersensitive sites28,29. Four of the 18 variants in the fine-mapped regions are within conserved regions (GERP > 2)30. The overall lack of functional annotation likely reflects the limited repertoire of reference expression and epigenomic profiles and suggests that the function of the variants may be specific to cell type or cell state, as has been reported for many eQTLs in immune cell types20.
To determine the Gene Ontology (GO) processes of the 97 asso-ciated variants, we used MetaCore from Thomson Reuters (Online Methods). We found that the majority of the 97 variants lie within 50 kb of genes having immunological function. Of the 86 unique genes
VMP1
TNFSF14
TYK2
IFI30CD40
DKKL1
CYP24A
1
MAPK1
SLC44A
2EPS15L1
SLC
9A8
SLC
2ARG
NPEPPSSTAT3IRF8
IKZF3MAXWWAXCDH3
MAPK3RMI2CLEC16AIQGAP1CTSH
TRAF3GALCZFP36L1
MIR548AN
PITPNM2
TSFM
CD69
LTBR
CXCR
5
TREH
PRDX5
CD6
AGBL2
HHEX
ZMIZ1
C10orf55
Inte
rgen
ic
Inte
rgen
icZC2H
C1A
IL2RA
MIR1208
PVT1
TNFRS
F1A
MMEL1
PLE
KHG5
LOC646626
DDAH1
PHGDH
FCRL1
SLAMF7
CENPO
STAT4
Intergenic
CCR4
FOXP1
Intergenic
TIMMDC1
IQCB1
CD86
IL12A
MANBA
IL7R
BACH2
AHI1
IL22RA2
TNFAIP3
TAGAP
Intergenic
Intergenic
Intergenic
IntergenicCARD11
JAZF1
ELMO1
IKZF1
ANKRD55
TCF7NDFIP1
PXT1
RGS14
TET2
FLJ16341
EVI5
C1orf106
Inte
rgen
icPLEK
SP140
EOME
S
RGS1VCAM1
CD58
17
18
1920
21 221
2
3
4
5
6
78
9
10
11
1213
14
15
16
Figure 1 Discovery phase results. Circos plot showing primary association analysis of 161,311 autosomal variants in the discovery phase (14,498 cases and 24,091 healthy controls). The outermost track shows the numbered autosomal chromosomes. The second track indicates the gene closest to the most associated SNP meeting all replication criteria. Previously identified associations are indicated in gray. The third track indicates the physical position of the 184 fine-mapping intervals (green). The innermost track indicates −log(P) (two-sided) for each SNP (scaled from 0–12, which truncates the signal in several regions; supplementary table 1). Additionally, contour lines are given at the a priori discovery (−log(P) = 4) and genome-wide significance (−log(P) = 7.3) thresholds. Orange indicates −log(P) ≥ 4 and <7.3, and red indicates −log(P) ≥ 7.3. Details of the full discovery phase results can be found in ImmunoBase (see URLs).

©20
13 N
atu
re A
mer
ica,
Inc.
All
rig
hts
res
erve
d.
Nature GeNetics ADVANCE ONLINE PUBLICATION 3
l e t t e r s
represented, 35 are linked to the GO immune system process (Tables 1 and 2). We did not see substantial over- or under-representation of certain GO processes when comparing the newly discovered and previously identified loci, but this may represent a limitation of the ImmunoChip in targeting genomic loci enriched for immunologically active genes, as more subtle distinctions between such loci might not be adequately captured by broad annotations such as GO processes.
Finally, we explored the overlap between our findings and those in other autoimmune diseases with reported ImmunoChip analyses. We calculated the percentage of multiple sclerosis signals (110 non-MHC; Supplementary Table 8) overlapping with those of other autoimmune diseases by requiring r2 ≥ 0.8 between the best variants reported in each study using SNAP31. In total, we found that ~22% of our signals overlapped at least one other autoimmune disease signal.
table 1 results for 48 new non-MHC variants associated with multiple sclerosis at a genome-wide significance levelDiscovery Replication Joint
SNP Chr. Positiona RA RAF P OR RAF P OR P OR Geneb Function
rs3007421 1 6530189 A 0.12 9.6 × 10⁻⁷ 1.12 0.13 8.8 × 10⁻⁵ 1.10 4.7 × 10⁻¹⁰ 1.11 PLEKHG5 Intronic
rs12087340 1 85746993 A 0.09 5.1 × 10⁻¹² 1.22 0.09 2.9 × 10⁻¹⁰ 1.20 1.1 × 10⁻²⁰ 1.21 BCL10 Intergenic
rs11587876 1 85915183 A 0.79 8.4 × 10⁻⁸ 1.12 0.81 2.9 × 10⁻³ 1.06 4.4 × 10⁻⁹ 1.09 DDAH1 Intronic
rs666930 1 120258970 G 0.53 7.5 × 10⁻⁸ 1.09 0.53 1.3 × 10⁻⁵ 1.07 6.0 × 10⁻¹² 1.08 PHGDH Intronic
rs2050568 1 157770241 G 0.53 1.3 × 10⁻⁶ 1.08 0.54 2.3 × 10⁻⁵ 1.07 1.5 × 10⁻¹⁰ 1.08 FCRL1 Intronic
rs35967351 1 160711804 A 0.67 1.7 × 10⁻⁶ 1.09 0.68 5.9 × 10⁻⁶ 1.09 4.4 × 10⁻¹¹ 1.09 SLAMF7 Intronic
rs4665719 2 25017860 G 0.25 6.8 × 10⁻⁶ 1.09 0.25 1.1 × 10⁻⁴ 1.08 3.1 × 10⁻⁹ 1.08 CENPO Intronic
rs842639 2 61095245 A 0.65 1.7 × 10⁻⁹ 1.11 0.67 1.4 × 10⁻⁶ 1.09 2.0 × 10⁻¹⁴ 1.10 FLJ16341 Noncoding RNA
rs9967792 2 191974435 G 0.62 1.8 × 10⁻⁹ 1.11 0.64 1.2 × 10⁻⁴ 1.07 3.5 × 10⁻¹² 1.09 STAT4 Intronic
rs11719975 3 18785585 C 0.27 5.4 × 10⁻⁶ 1.09 0.28 4.1 × 10⁻⁴ 1.07 1.1 × 10⁻⁸ 1.08 Intergenic
rs4679081 3 33013483 G 0.52 1.2 × 10⁻⁵ 1.08 0.55 3.7 × 10⁻⁴ 1.07 2.2 × 10⁻⁹ 1.07 CCR4 Intergenic
rs9828629 3 71530346 G 0.62 5.5 × 10⁻⁶ 1.08 0.64 8.5 × 10⁻⁶ 1.08 1.9 × 10⁻¹⁰ 1.08 FOXP1 Intronic
rs2726518 4 106173199 C 0.55 1.2 × 10⁻⁵ 1.09 0.58 4.7 × 10⁻⁴ 1.06 3.9 × 10⁻⁸ 1.07 TET2 Intronic
rs756699 5 133446575 A 0.87 3.0 × 10⁻⁶ 1.12 0.88 6.5 × 10⁻⁶ 1.11 8.8 × 10⁻¹¹ 1.12 TCF7 Intergenic
Nonec 5 141506564 C 0.61 6.0 × 10⁻⁵ 1.07 0.62 1.5 × 10⁻⁵ 1.08 3.6 × 10⁻⁹ 1.07 NDFIP1 Intronic
rs4976646 5 176788570 G 0.34 1.0 × 10⁻¹² 1.13 0.36 5.0 × 10⁻⁷ 1.10 4.4 × 10⁻¹⁸ 1.12 RGS14 Intronic
rs17119 6 14719496 A 0.81 1.9 × 10⁻⁶ 1.11 0.80 1.2 × 10⁻⁵ 1.10 1.0 × 10⁻¹⁰ 1.10 Intergenic
rs941816 6 36375304 G 0.18 4.5 × 10⁻⁹ 1.13 0.20 8.3 × 10⁻⁵ 1.08 3.9 × 10⁻¹² 1.11 PXT1 Intronic
rs1843938 7 3113034 A 0.44 2.2 × 10⁻⁶ 1.08 0.44 1.1 × 10⁻⁵ 1.08 1.2 × 10⁻¹⁰ 1.08 CARD11 Intergenic
rs706015 7 27014988 C 0.18 1.3 × 10⁻⁹ 1.14 0.18 9.9 × 10⁻³ 1.06 1.1 × 10⁻⁹ 1.10 Intergenic
rs917116 7 28172739 C 0.20 2.1 × 10⁻⁸ 1.12 0.21 5.8 × 10⁻³ 1.06 3.3 × 10⁻⁹ 1.09 JAZF1 Intronic
rs60600003 7 37382465 C 0.10 2.5 × 10⁻⁸ 1.16 0.10 4.2 × 10⁻⁷ 1.14 6.0 × 10⁻¹⁴ 1.15 ELMO1 Intronic
rs201847125d 7 50325567 G 0.70 2.9 × 10⁻⁸ 1.11 0.70 6.7 × 10⁻⁵ 1.09 1.2 × 10⁻¹¹ 1.10 IKZF1 Intergenic
rs2456449 8 128192981 G 0.36 2.2 × 10⁻⁸ 1.10 0.37 3.8 × 10⁻³ 1.05 1.8 × 10⁻⁹ 1.08 Intergenic
rs793108 10 31415106 A 0.50 5.6 × 10⁻⁸ 1.09 0.51 1.8 × 10⁻⁵ 1.07 6.1 × 10⁻¹² 1.08 Intergenic
rs2688608 10 75658349 A 0.55 6.4 × 10⁻⁵ 1.07 0.56 2.0 × 10⁻⁴ 1.06 4.6 × 10⁻⁸ 1.07 C10orf55 Intergenic
rs7120737 11 47702395 G 0.15 7.6 × 10⁻⁸ 1.13 0.15 1.0 × 10⁻³ 1.08 1.0 × 10⁻⁹ 1.10 AGBL2 Intronic
rs694739 11 64097233 A 0.62 1.3 × 10⁻⁵ 1.08 0.62 3.8 × 10⁻⁵ 1.07 2.0 × 10⁻⁹ 1.07 PRDX5 Intergenic
rs9736016 11 118724894 T 0.63 2.2 × 10⁻⁸ 1.10 0.63 2.6 × 10⁻⁸ 1.10 3.0 × 10⁻¹⁵ 1.10 CXCR5 Intergenic
rs12296430 12 6503500 C 0.19 3.6 × 10⁻¹⁰ 1.14 0.21 1.7 × 10⁻⁵ 1.09 7.2 × 10⁻¹⁴ 1.12 LTBR Intergenic
rs4772201 13 100086259 A 0.82 1.7 × 10⁻⁷ 1.12 0.83 1.1 × 10⁻⁴ 1.09 1.3 × 10⁻¹⁰ 1.10 MIR548AN Intergenic
rs12148050 14 103263788 A 0.35 1.5 × 10⁻⁵ 1.08 0.36 4.3 × 10⁻⁹ 1.10 5.1 × 10⁻¹³ 1.09 TRAF3 Intronic
rs59772922 15 79207466 A 0.83 4.0 × 10⁻⁶ 1.11 0.83 5.4 × 10⁻⁴ 1.08 1.2 × 10⁻⁸ 1.09 CTSH Intergenic
rs8042861 15 90977333 A 0.44 9.8 × 10⁻⁷ 1.08 0.45 3.4 × 10⁻⁴ 1.06 2.2 × 10⁻⁹ 1.07 IQGAP1 Intronic
rs6498184 16 11435990 G 0.81 2.1 × 10⁻¹⁰ 1.15 0.82 6.5 × 10⁻⁹ 1.14 7.4 × 10⁻¹⁸ 1.15 RMI2 Intergenic
rs7204270e 16 30156963 G 0.50 9.3 × 10⁻⁸ 1.09 0.49 3.7 × 10⁻⁵ 1.08 1.6 × 10⁻¹¹ 1.09 MAPK3 Intergenic
rs1886700 16 68685905 A 0.14 8.8 × 10⁻⁶ 1.11 0.14 3.2 × 10⁻⁴ 1.08 1.3 × 10⁻⁸ 1.10 CDH3 Intronic
rs12149527 16 79110596 A 0.47 1.7 × 10⁻⁶ 1.08 0.47 4.3 × 10⁻⁶ 1.08 3.3 × 10⁻¹¹ 1.08 WWOX Intronic
rs7196953 16 79649394 A 0.29 2.6 × 10⁻⁵ 1.08 0.30 7.9 × 10⁻⁷ 1.09 1.0 × 10⁻¹⁰ 1.09 MAF Intergenic
rs12946510 17 37912377 A 0.47 8.5 × 10⁻⁶ 1.08 0.48 8.0 × 10⁻⁵ 1.07 2.9 × 10⁻⁹ 1.07 IKZF3 Intergenic
rs4794058 17 45597098 A 0.50 1.6 × 10⁻⁵ 1.07 0.52 3.5 × 10⁻¹⁰ 1.11 1.0 × 10⁻¹³ 1.09 NPEPPS Intergenic
rs2288904 19 10742170 G 0.77 9.6 × 10⁻¹⁰ 1.14 0.78 5.4 × 10⁻⁴ 1.07 1.6 × 10⁻¹¹ 1.10 SLC44A2 Exonic
rs1870071 19 16505106 G 0.29 5.7 × 10⁻¹⁰ 1.12 0.30 4.6 × 10⁻⁷ 1.09 2.0 × 10⁻¹⁵ 1.10 EPS15L1 Intronic
rs17785991 20 48438761 A 0.35 6.4 × 10⁻⁷ 1.09 0.34 5.9 × 10⁻³ 1.05 4.2 × 10⁻⁸ 1.07 SLC9A8 Intronic
rs2256814 20 62373983 A 0.19 8.3 × 10⁻⁷ 1.11 0.21 6.4 × 10⁻⁴ 1.08 3.5 × 10⁻⁹ 1.09 SLC2A4RG Intronic
secondary
rs7769192f 6 137962655 G 0.55 1.3 × 10⁻⁵ 1.08 0.54 5.1 × 10⁻⁵ 1.07 3.3 × 10⁻⁹ 1.08 Intergenic
rs533646g 11 118566746 G 0.68 3.6 × 10⁻⁷ 1.10 0.68 3.9 × 10⁻⁵ 1.08 7.6 × 10⁻¹¹ 1.09 TREH Intergenic
rs4780346h 16 11288806 A 0.23 6.8 × 10⁻⁶ 1.09 0.25 1.5 × 10⁻⁵ 1.09 4.4 × 10⁻¹⁰ 1.09 CLEC16A Intergenic
All listed signals had discovery P ≤ 1.0 × 10⁻⁴, replication P ≤ 5.0 × 10⁻² and joint P ≤ 5.0 × 10⁻⁸. All P values are two-sided. Chr., chromosome; RA, risk allele; RAF, risk allele frequency.aPosition is based on hg19 and dbSNP Build 137. bThe nearest gene is listed if it lies within 50 kb of the signal. Bold font indicates genes that are part of the GO immune system process. cProxy SNP rs1036207 (r2 = 0.99) was used in replication. dProxy SNP rs716719 (r2 = 1.00) was used in replication. eThe primary SNP was rs11865086 (P = 1.77 × 10⁻⁸) in the discovery phase, but this SNP (or a good proxy) was not available in replication, so the next best discovery SNP was used. fP values and OR values shown are after conditioning on rs67297943 (table 2). gP values and OR values shown are after condi-tioning on rs9736016 (table 2). hP values and OR values shown are after conditioning on rs12927355 (table 2).
©20
13 N
atu
re A
mer
ica,
Inc.
All
rig
hts
res
erve
d.
4 ADVANCE ONLINE PUBLICATION Nature GeNetics
l e t t e r s
More specifically, ~9.1% overlapped signals in inflammatory bowel disease, ~7.3% overlapped signals in ulcerative colitis, ~9.1% over-lapped signals in Crohn’s disease15, ~9.1% overlapped signals in primary biliary cirrhosis32,33, ~4.5% overlapped signals in celiac dis-ease34, ~4.5% overlapped signals in rheumatoid arthritis35, ~0.9% overlapped signals in psoriasis36, and ~2.7% overlapped signals in autoimmune thyroid disease37. We report at seven loci the same top variant seen in primary biliary cirrhosis. We also note that our best
TYK2 variant (rs34536443)38 is also the most associated TYK2 vari-ant for primary biliary cirrhosis, psoriasis and rheumatoid arthritis. Lastly, variants have been reported for autoimmune thyroid disease, celiac disease, primary biliary cirrhosis and rheumatoid arthritis that have pairwise r2 ≥ 0.8 with the multiple sclerosis risk variant near MMEL1 (Supplementary Table 8)39.
In summary, we have identified 48 new susceptibility variants for mul-tiple sclerosis. These newly discovered loci expand our understanding
table 2 results for 49 known non-MHC variants associated with multiple sclerosis at genome-wide significanceDiscovery Replication Joint
SNP Chr. Positiona RA RAF P OR RAF P OR P OR Geneb Function
rs3748817 1 2525665 A 0.64 1.3 × 10⁻¹² 1.14 0.65 1.2 × 10⁻¹⁵ 1.15 1.3 × 10⁻²⁶ 1.14 MMEL1 Intronic
rs41286801 1 92975464 A 0.14 7.9 × 10⁻¹⁶ 1.20 0.16 2.1 × 10⁻¹² 1.17 1.4 × 10⁻²⁶ 1.19 EVI5 3′ UTR
rs7552544c 1 101240893 A 0.56 3.7 × 10⁻⁶ 1.08 0.43 3.3 × 10⁻¹² 1.12 1.9 × 10⁻¹⁶ 1.10 VCAM1 Intergenic
rs6677309 1 117080166 A 0.88 1.5 × 10⁻²⁸ 1.34 0.88 4.1 × 10⁻¹⁶ 1.24 5.4 × 10−42 1.29 CD58 Intronic
rs1359062 1 192541472 C 0.82 1.8 × 10⁻¹³ 1.18 0.83 2.1 × 10⁻⁸ 1.13 4.8 × 10⁻²⁰ 1.15 RGS1 Intergenic
rs55838263 1 200874728 A 0.71 1.4 × 10⁻⁹ 1.12 0.71 3.9 × 10⁻¹¹ 1.13 4.0 × 10⁻¹⁹ 1.13 C1orf106 Intronic
rs2163226 2 43361256 A 0.71 7.0 × 10⁻⁸ 1.10 0.73 3.8 × 10⁻¹⁰ 1.14 2.1 × 10⁻¹⁶ 1.12 Intergenic
rs7595717 2 68587477 A 0.26 3.3 × 10⁻⁷ 1.10 0.27 6.8 × 10⁻⁸ 1.10 1.2 × 10⁻¹³ 1.10 PLEK Intergenic
rs9989735 2 231115454 C 0.18 7.8 × 10⁻¹⁴ 1.17 0.19 6.8 × 10⁻¹¹ 1.14 4.2 × 10⁻²³ 1.16 SP140 Intronic
rs2371108 3 27757018 A 0.38 2.1 × 10⁻⁶ 1.08 0.39 5.8 × 10⁻¹¹ 1.12 1.5 × 10⁻¹⁵ 1.10 EOMES downstream
rs1813375 3 28078571 A 0.47 5.7 × 10⁻¹⁸ 1.15 0.49 4.4 × 10⁻¹⁶ 1.15 1.9 × 10⁻³² 1.15 Intergenic
rs1131265 3 119222456 C 0.80 2.0 × 10⁻¹⁵ 1.19 0.81 4.8 × 10⁻¹⁰ 1.14 1.4 × 10⁻²³ 1.17 TIMMDC1 Exonic
rs1920296c 3 121543577 C 0.64 6.8 × 10⁻¹⁵ 1.14 0.64 5.5 × 10⁻⁹ 1.10 6.5 × 10⁻²² 1.12 IQCB1 Intronic
rs2255214c 3 121770539 C 0.52 5.3 × 10⁻¹³ 1.13 0.52 3.3 × 10⁻¹³ 1.13 1.2 × 10⁻²⁴ 1.13 CD86 Intergenic
rs1014486 3 159691112 G 0.43 1.2 × 10⁻⁹ 1.11 0.44 1.4 × 10⁻¹⁰ 1.11 1.1 × 10⁻¹⁸ 1.11 IL12A Intergenic
rs7665090 4 103551603 G 0.52 2.4 × 10⁻⁶ 1.08 0.53 5.0 × 10⁻⁴ 1.13 1.0 × 10⁻⁸ 1.09 MANBA Intergenic
rs6881706 5 35879156 C 0.72 4.9 × 10⁻⁹ 1.12 0.73 1.7 × 10⁻⁹ 1.12 4.3 × 10⁻¹⁷ 1.12 IL7R Intergenic
rs6880778 5 40399096 G 0.60 1.7 × 10⁻⁸ 1.10 0.61 3.9 × 10⁻¹³ 1.13 8.1 × 10⁻²⁰ 1.12 Intergenic
rs71624119 5 55440730 G 0.76 2.7 × 10⁻⁹ 1.12 0.76 1.9 × 10⁻⁵ 1.09 3.4 × 10⁻¹³ 1.11 ANKRD55 Intronic
rs72928038 6 90976768 A 0.17 7.6 × 10⁻⁷ 1.11 0.19 9.0 × 10⁻¹¹ 1.17 1.5 × 10⁻¹⁵ 1.14 BACH2 Intronic
rs11154801 6 135739355 A 0.37 2.3 × 10⁻⁹ 1.11 0.37 1.0 × 10⁻¹² 1.13 1.8 × 10⁻²⁰ 1.12 AHI1 Intronic
rs17066096 6 137452908 G 0.23 5.9 × 10⁻¹² 1.14 0.25 4.1 × 10⁻¹³ 1.15 1.6 × 10⁻²³ 1.14 IL22RA2 Intergenic
rs67297943 6 138244816 A 0.78 4.8 × 10⁻⁸ 1.12 0.80 2.5 × 10⁻⁶ 1.11 5.5 × 10⁻¹³ 1.11 TNFAIP3 Intergenic
rs212405 6 159470559 T 0.62 1.4 × 10⁻¹⁵ 1.15 0.64 1.8 × 10⁻⁷ 1.10 8.0 × 10⁻²¹ 1.12 TAGAP Intergenic
rs1021156 8 79575804 A 0.24 5.6 × 10⁻¹⁰ 1.12 0.26 2.1 × 10⁻⁸ 1.11 8.5 × 10⁻¹⁷ 1.11 ZC2HC1A Intergenic
rs4410871 8 128815029 G 0.72 2.0 × 10⁻⁹ 1.12 0.72 3.4 × 10⁻⁸ 1.11 4.3 × 10⁻¹⁶ 1.11 MIR1204 Intergenic
rs759648 8 129158945 C 0.31 2.8 × 10⁻⁶ 1.09 0.31 3.7 × 10⁻⁵ 1.08 5.0 × 10⁻¹⁰ 1.08 MIR1208 Intergenic
rs2104286 10 6099045 A 0.72 7.6 × 10⁻²³ 1.21 0.73 3.6 × 10⁻²⁶ 1.23 2.3 × 10−47 1.22 IL2RA Intronic
rs1782645 10 81048611 A 0.43 4.3 × 10⁻⁷ 1.09 0.41 6.2 × 10⁻¹⁰ 1.11 2.5 × 10⁻¹⁵ 1.10 ZMIZ1 Intronic
rs7923837 10 94481917 G 0.61 4.6 × 10⁻⁹ 1.11 0.62 2.0 × 10⁻⁹ 1.11 4.3 × 10⁻¹⁷ 1.11 HHEX Intergenic
rs34383631 11 60793330 A 0.40 5.7 × 10⁻¹⁰ 1.11 0.39 4.5 × 10⁻¹⁵ 1.15 3.7 × 10⁻²³ 1.13 CD6 Intergenic
rs1800693 12 6440009 G 0.40 6.9 × 10⁻¹⁶ 1.14 0.41 1.0 × 10⁻¹³ 1.14 6.7 × 10⁻²⁸ 1.14 TNFRSF1A Intronic
rs11052877 12 9905690 G 0.36 5.4 × 10⁻⁹ 1.10 0.38 1.2 × 10⁻⁵ 1.08 5.6 × 10⁻¹³ 1.09 CD69 3′ UTR
rs201202118d 12 58182062 A 0.67 7.4 × 10⁻¹³ 1.14 0.67 1.6 × 10⁻¹⁰ 1.12 9.0 × 10⁻²² 1.13 TSFM Intronic
rs7132277 12 123593382 A 0.19 1.9 × 10⁻⁶ 1.10 0.19 1.4 × 10⁻⁸ 1.13 1.9 × 10⁻¹³ 1.12 PITPNM2 Intronic
rs2236262 14 69261472 A 0.50 1.2 × 10⁻⁵ 1.08 0.50 3.8 × 10⁻⁸ 1.09 2.5 × 10⁻¹² 1.08 ZFP36L1 Intronic
rs74796499 14 88432328 C 0.95 8.5 × 10⁻¹¹ 1.31 0.95 4.5 × 10⁻¹¹ 1.33 2.4 × 10⁻²⁰ 1.32 GALC Intronic
rs12927355 16 11194771 G 0.68 8.2 × 10⁻²⁷ 1.21 0.69 4.3 × 10⁻²¹ 1.18 6.4 × 10−46 1.20 CLEC16A Intronic
rs35929052 16 85994484 G 0.89 3.3 × 10⁻⁷ 1.14 0.88 3.6 × 10⁻⁶ 1.15 5.9 × 10⁻¹² 1.15 IRF8 Intergenic
rs4796791 17 40530763 A 0.36 1.8 × 10⁻⁸ 1.10 0.36 1.2 × 10⁻¹³ 1.14 3.7 × 10⁻²⁰ 1.12 STAT3 Intronic
rs8070345 17 57816757 A 0.45 5.4 × 10⁻¹⁶ 1.14 0.46 1.9 × 10⁻⁹ 1.10 2.2 × 10⁻²³ 1.12 VMP1 Intronic
rs1077667 19 6668972 G 0.79 3.5 × 10⁻¹³ 1.16 0.79 8.4 × 10⁻¹³ 1.16 1.7 × 10⁻²⁴ 1.16 TNFSF14 Intronic
rs34536443 19 10463118 C 0.95 1.2 × 10⁻⁸ 1.28 0.96 2.9 × 10⁻⁷ 1.30 1.8 × 10⁻¹⁴ 1.29 TYK2 Exonic
rs11554159 19 18285944 G 0.73 2.6 × 10⁻¹³ 1.15 0.74 1.4 × 10⁻¹² 1.15 1.9 × 10⁻²⁴ 1.15 IFI30 Exonic
rs8107548 19 49870643 G 0.25 2.0 × 10⁻⁶ 1.09 0.26 2.5 × 10⁻¹⁰ 1.13 5.7 × 10⁻¹⁵ 1.11 DKKL1 Intronic
rs4810485 20 44747947 A 0.25 1.8 × 10⁻⁵ 1.08 0.25 1.4 × 10⁻¹² 1.14 7.7 × 10⁻¹⁶ 1.11 CD40 Intronic
rs2248359 20 52791518 G 0.60 9.8 × 10⁻⁵ 1.07 0.62 8.2 × 10⁻¹¹ 1.12 2.0 × 10⁻¹³ 1.09 CYP24A1 Intergenic
rs2283792 22 22131125 C 0.51 1.1 × 10⁻⁶ 1.08 0.53 5.4 × 10⁻¹¹ 1.11 5.5 × 10⁻¹⁶ 1.10 MAPK1 Intronic
secondary
rs523604e 11 118755738 A 0.53 2.5 × 10⁻⁷ 1.09 0.54 4.0 × 10⁻⁹ 1.11 6.2 × 10⁻¹⁵ 1.10 CXCR5 Intronic
All listed signals had discovery P ≤ 1.0 × 10⁻⁴, replication P ≤ 5.0 × 10⁻² and joint P ≤ 5.0 × 10⁻⁸. All P values are two-sided. Chr., chromosome; RA, risk allele; RAF, risk allele frequency.aPosition is based on hg19 and dbSNP Build 137. bThe nearest gene is listed if it lies within 50 kb of the signal. Bold font indicates genes that are part of GO immune system process. cThese three SNPs were not primary in the 2011 GWAS9 (two were secondary, and the third was tertiary in that study). dA proxy SNP (rs10431552; r2 = 0.99) was used in replication. eThe P values and OR values shown are after conditioning on rs9736016 and rs533646 (table 1).

©20
13 N
atu
re A
mer
ica,
Inc.
All
rig
hts
res
erve
d.
Nature GeNetics ADVANCE ONLINE PUBLICATION 5
l e t t e r s
of the immune system processes implicated in multiple sclerosis. We estimate that the 110 established non-MHC risk variants explain 20% of the sibling recurrence risk, 28% when including the already identified MHC effects9 (Supplementary Note). Additionally, we have identified five previously associated regions (TNFSF14, IL2RA, TNFRSF1A, IL12A and STAT4) where consistent high-resolution fine mapping implicated one variant that accounted for more than 50% of the posterior probability of association. Our study further implicates NF-κB in multiple sclerosis pathobiology18, emphasizes the value of dense fine mapping in large follow-up data sets and exposes the urgent need for functional annotation in relevant tissues. Understanding the implicated networks and their relationship to environmental risk factors will promote the development of rational therapies and may enable the development of preventive strategies.
URLs. ImmunoBase, http://www.immunobase.org/; eQTL browser, http://eqtl.uchicago.edu/; MetaCore, https://portal.genego.com/.
METhodSMethods and any associated references are available in the online version of the paper.
Note: Any Supplementary Information and Source Data files are available in the online version of the paper.
ACknowledGMentSWe thank the participants, the referring nurses, the physicians and the funders. Funding was provided by the US National Institutes of Health, the Wellcome Trust, the UK MS Society, the UK Medical Research Council, the US National MS Society, the Cambridge National Institute for Health Research (NIHR) Biomedical Research Centre, DeNDRon, the Bibbi and Niels Jensens Foundation, the Swedish Brain Foundation, the Swedish Research Council, the Knut and Alice Wallenberg Foundation, the Swedish Heart-Lung Foundation, the Foundation for Strategic Research, the Stockholm County Council, Karolinska Institutet, INSERM, Fondation d’Aide pour la Recherche sur la Sclérose en Plaques, Association Française contre les Myopathies, Infrastrutures en Biologie Santé et Agronomie (GIS-IBISA), the German Ministry for Education and Research, the German Competence Network MS, Deutsche Forschungsgemeinschaft,
90% 50% Overlap
Position (Mb) (GRCh37)
Bay
es fa
ctor
/107
2.0
1.5
1.0
0.5
0
0.5
1.0
1.5
2.0
6.61 6.64 6.66 6.68 6.71 6.72 6.75
rs1077667
Unconditional typedUnconditional imputedConditional typedConditional imputed
TNFSF14
C3
GPR108
TRIP10
SH2D3A
0.04
32.22
ba
Credible interval width (kb)
01−
45−
9
10−4
9
50−9
9>9
9
Cou
nts
0
5
10
15
20
25
30
35
40
45
0
5
10
15
20
25
30
35
40
45
12−
45−
9
10−1
4
15−1
9
20−4
9>4
9
Cou
nts
Number of variants Number of genes
0
5
10
15
20
25
30
35
40
45
Cou
nts
0 12−
45−
9 >9
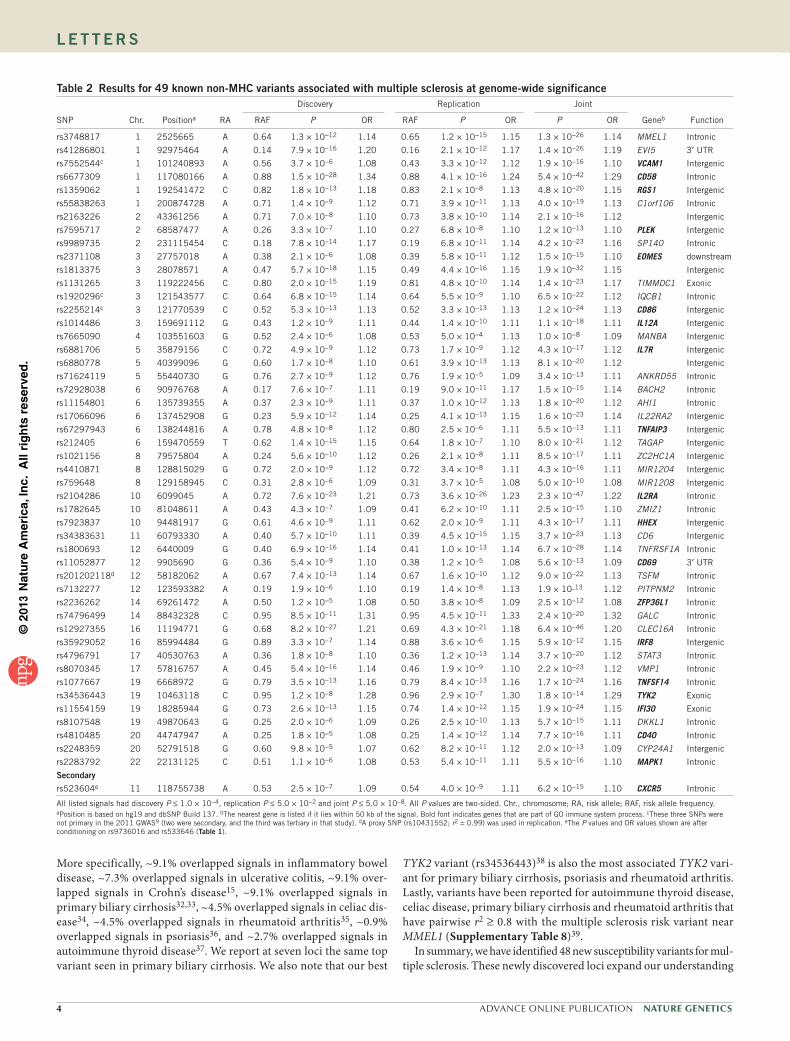
Figure 2 Bayesian fine mapping within primary regions of association. (a) Summary of the extent of fine mapping across 66 regions in 6,356 subjects with multiple sclerosis and 9,617 healthy controls from the UK, showing the physical extent of the number of variants and the number of genes spanned by the posterior 90% and 50% credible sets. (b) Details of fine mapping in the region encompassing TNFSF14. Bayes factors summarizing evidence for association of the SNPs before conditioning on the lead SNP (rs1077667) are shown above the x axis (blue markers), and the Bayes factors after conditioning are shown below the x axis.
table 3 results for 18 variants from the 8 regions with consistent high-resolution fine mappingGene SNP Chr. Positiona Posterior GERP Functional annotationb
IL2RA rs2104286 10 6099045 0.93 −0.47 Intronic, correlates with soluble IL-2RA levelsTNFSF14 rs1077667 19 6668972 0.74 −3.89 Intronic, TFBS or DNase I peak, correlates with serum levels of TNFSF14
TNFRSF1A rs1800693 12 6440009 0.69 2.53 Intronic, causes splicing defect and truncated soluble TNFRSF1A
rs4149580c 12 6446990 0.10 2.06 intronic
IL12A rs1014486 3 159691112 0.67 0.24 –
STAT4 rs78712823 2 191958581 0.59 −3.98 Intronic
TNFAIP3 rs632574 6 137959118 0.27 −1.15 –
rs498549c 6 137984935 0.20 0.52 –
rs651973 6 137996134 0.17 2.41 Downstream of RP11-95M15.1 lincRNA gene
rs536331 6 137993049 0.15 0.19 Upstream of RP11-95M15.1 lincRNA gene
CD58 rs35275493c 1 117095502 0.24 0.75 Intronic (insertion)
rs10754324c 1 117093035 0.22 0.32 Intronic
rs6677309 1 117080166 0.21 −1.18 Intronic, TFBS or DNase I peak
rs1335532 1 117100957 0.17 −1.32 Intronic
CD6 rs34383631 11 60793330 0.20 1.66 –
rs4939490c 11 60793651 0.14 −0.53 –
rs4939491c 11 60793722 0.14 −0.37 –
rs4939489 11 60793648 0.10 3.25 –
All listed variants have posterior probability ≥0.1 in regions where ≤5 variants explain the top 50% of the posterior probability, and the top SNP from the frequentist analysis resides in the 90% confidence interval; SNPs are ordered by maximum posterior probability within each region. Posterior probability is the probability of any variant driving association23. GERP denotes Genomic Evolutionary Rate Profiling. Chr., chromosome; TFBS, transcription factor binding site; lncRNA, long noncoding RNA.aPosition is based on hg19 and dbSNP Build 137. bFunctional data are from VEP, the eQTL browser, Fairfax et al.20, PubMed searches and the 1000 Genomes Project. Minus signs indicate intergenic signals with no additional annotation and no reported regulatory consequence. cImputed variant.

©20
13 N
atu
re A
mer
ica,
Inc.
All
rig
hts
res
erve
d.
6 ADVANCE ONLINE PUBLICATION Nature GeNetics
l e t t e r s
Munich Biotec Cluster M4, the Fidelity Biosciences Research Initiative, Research Foundation Flanders, Research Fund KU Leuven, the Belgian Charcot Foundation, Gemeinnützige Hertie Stiftung, University Zurich, the Danish MS Society, the Danish Council for Strategic Research, the Academy of Finland, the Sigrid Juselius Foundation, Helsinki University, the Italian MS Foundation, Fondazione Cariplo, the Italian Ministry of University and Research, the Torino Savings Bank Foundation, the Italian Ministry of Health, the Italian Institute of Experimental Neurology, the MS Association of Oslo, the Norwegian Research Council, the South-Eastern Norwegian Health Authorities, the Australian National Health and Medical Research Council, the Dutch MS Foundation and Kaiser Permanente. We acknowledge the British 1958 Birth Cohort, the UK National Blood Service, Vanderbilt University Medical Center’s BioVU DNA Resources Core, Centre de Ressources Biologiques du Réseau Français d’Etude Génétique de la Sclérose en Plaques, the Norwegian Bone Marrow Registry, the Norwegian MS Registry and Biobank, the North American Research Committee on MS Registry, the Brigham and Women’s Hospital PhenoGenetic Project and DILGOM, funded by the Academy of Finland. See the Supplementary Note for details.
AUtHoR ContRIBUtIonSM.F.D., D. Booth, A.O., J.S., B. Fontaine, B.H., C. Martin, F.Z., S.D., F.M.-B., B.T., H.F.H., I. Kockum, J. Hillert, T.O., J.R.O., R.H., L.F.B., C. Agliardi, L.A., L. Bernardinelli, V.B., S.B., B.B., L. Brundin, D. Buck, H. Butzkueven, W. Camu, P.C., E.G.C., I.C., G.C., I.C.-R., B.A.C.C., G.D., S.R.D., A.d.S., B.D., M.D., I.E., F.E., N.E., J.F., A.F., I.Y.F., D.G., C. Graetz, A. Graham, C. Guaschino, C. Halfpenny, G. Hall, J. Harley, T.H., C. Hawkins, C. Hillier, J. Hobart, M.H., I.J., A.J., B.K., A. Kermode, T. Kilpatrick, K.K., T. Korn, H.K., C.L.-F., J.L.-S., M.H.L., M.A.L., G.L., B.A.L., C.M.L., F.L., J. Lycke, S.M., C.P.M., R.M., V.M., D.M., G. Mazibrada, J.M., K.-M.M., G.N., R.N., P.N., F.P., S.E.P., H.Q., M. Reunanen, W.R., N.P.R., M. Rodegher, D.R., M. Salvetti, F.S., R.C.S., C. Schaefer, S. Shaunak, L.S., S. Shields, V.S., M. Slee, P.S.S., M. Sospedra, A. Spurkland, V.T., J.T., A.T., P.T., C.v.D., E.M.V., S.V., J.S.W., A.W., J.F.W., J.Z., E.Z., J.L.H., M.A.P.-V., G.S., D.H., S.L.H., A.C., P.D.J., S.J.S. and J.L.M. were involved with case ascertainment and phenotyping. A. Kemppinen, D. Booth, A. Goris, A.O., B. Fontaine, S.D., F.M.-B., H.F.H., I. Kockum, M.B., J.R.O., L.F.B., IIBDGC, H.B.S., A. Baker, N.B., L. Bergamaschi, I.L.B., P.B., D. Buck, S.J.C., L. Corrado, L. Cosemans, I.C.-R., V.D., J.F., A.F., V.G., I.J., I. Konidari, V.L., C.M.L., M. Lindén, J. Link, C. McCabe, I.-L.M., H.Q., M. Sorosina, E.S., H.W., P.D.J., S.J.S. and J.L.M. processed the DNA. A. Kemppinen, A.O., B. Fontaine, M.B., R.H., L.F.B., WTCCC2, IIBDGC, R.A., H.B.S., N.B., T.M.C.B., H. Blackburn, P.B., W. Carpentier, L. Corrado, I.C.-R., D.C., V.D., P. Deloukas, S.E., A.F., H.H., P.H., A. Hamsten, S.E.H., I.J., I. Konidari, C.L., M. Larsson, M. Lathrop, F.M., I.-L.M., J.M., H.Q., F.S., M. Sorosina, C.v.D., J.W., D.H., P.D.J., S.J.S. and J.L.M. conducted and supervised the genotyping of samples. A.H.B., N.A.P., D.K.X., M.F.D., A. Kemppinen, C.C., T.S.S., C. Spencer, M.B., IIBDGC, C. Anderson, S.E.B., A.T.D., P. Donnelly, B. Fiddes, P.-A.G., G. Hellenthal, S.E.H., L.M., M.P., N.C.S.-B., J.L.H., M.A.P.-V., G. McVean, P.D.J., S.J.S. and J.L.M. performed the statistical analysis. A.H.B., N.A.P., D.K.X., M.F.D., A. Kemppinen, C.C., T.S.S., C. Spencer, D. Booth, A. Goris, A.O., J.S., B. Fontaine, B.H., F.Z., S.D., F.M.-B., H.F.H., I. Kockum, M.B., R.H., L.F.B., C. Agliardi, M.A., C. Anderson, R.A., H.B.S., A. Baker, G.B., N.B., J.B., C.B., L. Bernardinelli, A. Berthele, V.B., T.M.C.B., H. Blackburn, I.L.B., B.B., D. Buck, S.J.C., W. Camu, P.C., E.G.C., I.C., G.C., L. Corrado, L. Cosemans, I.C.-R., B.A.C.C., D.C., G.D., S.R.D., P. Deloukas, A.d.S., A.T.D., P. Donnelly, B.D., M.D., S.E., F.E., N.E., B. Fiddes, J.F., A.F., C.F., D.G., C. Gieger, C. Graetz, A. Graham, V.G., C. Guaschino, A. Hadjixenofontos, H.H., C. Halfpenny, P.H., G. Hall, A. Hamsten, J. Harley, T.H., C. Hawkins, G. Hellenthal, C. Hillier, J. Hobart, M.H., S.E.H., I.J., A.J., B.K., I. Konidari, H.K., C.L., M. Larsson, M. Lathrop, C.L.-F., M.A.L., V.L., G.L., B.A.L., C.M.L., F.M., C.P.M., R.M., V.M., G. Mazibrada, C. McCabe, I.-L.M., L.M., K.-M.M., R.N., M.P., S.E.P., H.Q., N.P.R., M. Rodegher, D.R., M. Salvetti, N.C.S.-B., R.C.S., C. Schaefer, S. Shaunak, L.S., S. Shields, M. Sospedra, A. Strange, J.T., A.T., E.M.V., A.W., J.F.W., J.W., J.Z., J.L.H., A.J.I., G. McVean, P.D.J., S.J.S. and J.L.M. collected and managed the project data. A.H.B., N.A.P., M.F.D., A. Kemppinen, C.C., T.S.S., C. Spencer, J.S., B.H., F.Z., S.D., F.M.-B., H.F.H., J. Hillert, T.O., M.B., J.R.O., R.H., L.F.B., L.A., C. Anderson, G.B., J.B., C.B., A. Berthele, E.G.C., G.C., P. Donnelly, F.E., C.F., C. Gieger, C. Graetz, G. Hellenthal, M.J., T. Korn, M.A.L., R.M., M.P., M. Sospedra, A. Spurkland, A. Strange, J.W., J.L.H., M.A.P.-V., A.J.I., G.S., D.H., S.L.H., A.C., G. McVean, P.D.J., S.J.S. and J.L.M. contributed to the study concept and design. A.H.B., N.A.P., D.K.X., G. McVean, P.D.J., S.J.S. and J.L.M. prepared the manuscript. All authors reviewed the final manuscript.
CoMPetInG FInAnCIAl InteReStSThe authors declare no competing financial interests.
Reprints and permissions information is available online at http://www.nature.com/reprints/index.html.
1. Gourraud, P.A., Harbo, H.F., Hauser, S.L. & Baranzini, S.E. The genetics of multiple sclerosis: an up-to-date review. Immunol. Rev. 248, 87–103 (2012).
2. Nylander, A. & Hafler, D.A. Multiple sclerosis. J. Clin. Invest. 122, 1180–1188 (2012).
3. Compston, A. et al. McAlpine’s Multiple Sclerosis (Churchill Livingstone, London, 2006).4. Dyment, D.A., Yee, I.M., Ebers, G.C. & Sadovnick, A.D. Multiple sclerosis in
stepsiblings: recurrence risk and ascertainment. J. Neurol. Neurosurg. Psychiatry 77, 258–259 (2006).
5. Hemminki, K., Li, X., Sundquist, J., Hillert, J. & Sundquist, K. Risk for multiple sclerosis in relatives and spouses of patients diagnosed with autoimmune and related conditions. Neurogenetics 10, 5–11 (2009).
6. Jersild, C., Svejgaard, A. & Fog, T. HL-A antigens and multiple sclerosis. Lancet 1, 1240–1241 (1972).
7. International Multiple Sclerosis Genetics Consortium. Risk alleles for multiple sclerosis identified by a genomewide study. N. Engl. J. Med. 357, 851–862 (2007).
8. De Jager, P.L. et al. Meta-analysis of genome scans and replication identify CD6, IRF8 and TNFRSF1A as new multiple sclerosis susceptibility loci. Nat. Genet. 41, 776–782 (2009).
9. International Multiple Sclerosis Genetics Consortium & Wellcome Trust Case Control Consortium 2. Genetic risk and a primary role for cell-mediated immune mechanisms in multiple sclerosis. Nature 476, 214–219 (2011).
10. Patsopoulos, N.A. et al. Genome-wide meta-analysis identifies novel multiple sclerosis susceptibility loci. Ann. Neurol. 70, 897–912 (2011).
11. International Multiple Sclerosis Genetics Consortium. Evidence for polygenic susceptibility to multiple sclerosis—the shape of things to come. Am. J. Hum. Genet. 86, 621–625 (2010).
12. Baranzini, S.E. The genetics of autoimmune diseases: a networked perspective. Curr. Opin. Immunol. 21, 596–605 (2009).
13. Cotsapas, C. et al. Pervasive sharing of genetic effects in autoimmune disease. PLoS Genet. 7, e1002254 (2011).
14. Cortes, A. & Brown, M.A. Promise and pitfalls of the Immunochip. Arthritis Res. Ther. 13, 101 (2011).
15. Jostins, L. et al. Host-microbe interactions have shaped the genetic architecture of inflammatory bowel disease. Nature 491, 119–124 (2012).
16. Krzywinski, M. et al. Circos: an information aesthetic for comparative genomics. Genome Res. 19, 1639–1645 (2009).
17. Willis, T.G. et al. Bcl10 is involved in t(1;14)(p22;q32) of MALT B cell lymphoma and mutated in multiple tumor types. Cell 96, 35–45 (1999).
18. Yan, J. & Greer, J.M. NF-κB, a potential therapeutic target for the treatment of multiple sclerosis. CNS Neurol. Disord. Drug Targets 7, 536–557 (2008).
19. Wegener, E. & Krappmann, D. CARD-Bcl10-Malt1 signalosomes: missing link to NF-κB. Sci. STKE 2007, pe21 (2007).
20. Fairfax, B.P. et al. Genetics of gene expression in primary immune cells identifies cell type–specific master regulators and roles of HLA alleles. Nat. Genet. 44, 502–510 (2012).
21. Lill, C.M. et al. Genome-wide significant association of ANKRD55 rs6859219 and multiple sclerosis risk. J. Med. Genet. 50, 140–143 (2013).
22. Maier, L.M. et al. IL2RA genetic heterogeneity in multiple sclerosis and type 1 diabetes susceptibility and soluble interleukin-2 receptor production. PLoS Genet. 5, e1000322 (2009).
23. Maller, J.B. et al. Bayesian refinement of association signals for 14 loci in 3 common diseases. Nat. Genet. 44, 1294–1301 (2012).
24. McLaren, W. et al. Deriving the consequences of genomic variants with the Ensembl API and SNP Effect Predictor. Bioinformatics 26, 2069–2070 (2010).
25. Gregory, A.P. et al. TNF receptor 1 genetic risk mirrors outcome of anti-TNF therapy in multiple sclerosis. Nature 488, 508–511 (2012).
26. De Jager, P.L. et al. The role of the CD58 locus in multiple sclerosis. Proc. Natl. Acad. Sci. USA 106, 5264–5269 (2009).
27. Malmeström, C. et al. Serum levels of LIGHT in MS. Mult. Scler. 19, 871–876 (2013).28. ENCODE Project Consortium. An integrated encyclopedia of DNA elements in the
human genome. Nature 489, 57–74 (2012).29. Schaub, M.A., Boyle, A.P., Kundaje, A., Batzoglou, S. & Snyder, M. Linking disease
associations with regulatory information in the human genome. Genome Res. 22, 1748–1759 (2012).
30. Davydov, E.V. et al. Identifying a high fraction of the human genome to be under selective constraint using GERP++. PLoS Comput. Biol. 6, e1001025 (2010).
31. Johnson, A.D. et al. SNAP: a web-based tool for identification and annotation of proxy SNPs using HapMap. Bioinformatics 24, 2938–2939 (2008).
32. Juran, B.D. et al. Immunochip analyses identify a novel risk locus for primary biliary cirrhosis at 13q14, multiple independent associations at four established risk loci and epistasis between 1p31 and 7q32 risk variants. Hum. Mol. Genet. 21, 5209–5221 (2012).
33. Liu, J.Z. et al. Dense fine-mapping study identifies new susceptibility loci for primary biliary cirrhosis. Nat. Genet. 44, 1137–1141 (2012).
34. Trynka, G. et al. Dense genotyping identifies and localizes multiple common and rare variant association signals in celiac disease. Nat. Genet. 43, 1193–1201 (2011).
35. Eyre, S. et al. High-density genetic mapping identifies new susceptibility loci for rheumatoid arthritis. Nat. Genet. 44, 1336–1340 (2012).
36. Tsoi, L.C. et al. Identification of 15 new psoriasis susceptibility loci highlights the role of innate immunity. Nat. Genet. 44, 1341–1348 (2012).
37. Cooper, J.D. et al. Seven newly identified loci for autoimmune thyroid disease. Hum. Mol. Genet. 21, 5202–5208 (2012).
38. Ban, M. et al. Replication analysis identifies TYK2 as a multiple sclerosis susceptibility factor. Eur. J. Hum. Genet. 17, 1309–1313 (2009).
39. Ban, M. et al. A non-synonymous SNP within membrane metalloendopeptidase–like 1 (MMEL1) is associated with multiple sclerosis. Genes Immun. 11, 660–664 (2010).

©20
13 N
atu
re A
mer
ica,
Inc.
All
rig
hts
res
erve
d.
Nature GeNetics ADVANCE ONLINE PUBLICATION 7
l e t t e r s
Ashley H Beecham1,127, nikolaos A Patsopoulos2–6,127, dionysia k Xifara7, Mary F davis8, Anu kemppinen9, Chris Cotsapas10–12, tejas S Shah13, Chris Spencer7, david Booth14, An Goris15, Annette oturai16, Janna Saarela17, Bertrand Fontaine18, Bernhard Hemmer19–21, Claes Martin22, Frauke Zipp23, Sandra d’Alfonso24,25, Filippo Martinelli-Boneschi26,27, Bruce taylor28, Hanne F Harbo29,30, Ingrid kockum31, Jan Hillert31, tomas olsson31, Maria Ban9, Jorge R oksenberg32, Rogier Hintzen33, lisa F Barcellos34–36, wellcome trust Case Control Consortium 2 (wtCCC2)37, International IBd Genetics Consortium (IIBdGC)37, Cristina Agliardi38, lars Alfredsson39, Mehdi Alizadeh40, Carl Anderson13, Robert Andrews13, Helle Bach Søndergaard16, Amie Baker9, Gavin Band7, Sergio e Baranzini32, nadia Barizzone24,25, Jeffrey Barrett13, Céline Bellenguez7, laura Bergamaschi24,25, luisa Bernardinelli41, Achim Berthele19, Viola Biberacher19, thomas M C Binder42, Hannah Blackburn13, Izaura l Bomfim31, Paola Brambilla26, Simon Broadley43, Bruno Brochet44, lou Brundin31, dorothea Buck19, Helmut Butzkueven45,46, Stacy J Caillier32, william Camu47, wassila Carpentier48, Paola Cavalla49,50, elisabeth G Celius29, Irène Coman51, Giancarlo Comi26,27, lucia Corrado24,25, leentje Cosemans15, Isabelle Cournu-Rebeix18, Bruce A C Cree32, daniele Cusi52, Vincent damotte18, Gilles defer53, Silvia R delgado54, Panos deloukas13, Alessia di Sapio55, Alexander t dilthey7, Peter donnelly7, Bénédicte dubois15, Martin duddy56, Sarah edkins13, Irina elovaara57, Federica esposito26,27, nikos evangelou58, Barnaby Fiddes9, Judith Field59, Andre Franke60, Colin Freeman7, Irene Y Frohlich2, daniela Galimberti61,62, Christian Gieger63, Pierre-Antoine Gourraud32, Christiane Graetz23, Andrew Graham64, Verena Grummel19, Clara Guaschino26,27, Athena Hadjixenofontos1, Hakon Hakonarson65,66, Christopher Halfpenny67, Gillian Hall68, Per Hall69, Anders Hamsten70, James Harley71, timothy Harrower72, Clive Hawkins73, Garrett Hellenthal74, Charles Hillier75, Jeremy Hobart76, Muni Hoshi19, Sarah e Hunt13, Maja Jagodic31, Ilijas Jelčić77,78, Angela Jochim19, Brian kendall79, Allan kermode80,81, trevor kilpatrick82, keijo koivisto83, Ioanna konidari1, thomas korn19, Helena kronsbein19, Cordelia langford13, Malin larsson84, Mark lathrop85–87, Christine lebrun-Frenay88, Jeannette lechner-Scott89, Michelle H lee2, Maurizio A leone90, Virpi leppä17, Giuseppe liberatore26,27, Benedicte A lie30,91, Christina M lill23,92, Magdalena lindén31, Jenny link31, Felix luessi23, Jan lycke93, Fabio Macciardi94,95, Satu Männistö96, Clara P Manrique1, Roland Martin77,78, Vittorio Martinelli27, deborah Mason97, Gordon Mazibrada98, Cristin McCabe10, Inger-lise Mero29,30,91, Julia Mescheriakova33, loukas Moutsianas7, kjell-Morten Myhr99, Guy nagels100, Richard nicholas101, Petra nilsson102, Fredrik Piehl31, Matti Pirinen7, Siân e Price103, Hong Quach34, Mauri Reunanen104,105, wim Robberecht106–108, neil P Robertson109, Mariaemma Rodegher27, david Rog110, Marco Salvetti111, nathalie C Schnetz-Boutaud8, Finn Sellebjerg16, Rebecca C Selter19, Catherine Schaefer36, Sandip Shaunak112, ling Shen36, Simon Shields113, Volker Siffrin23, Mark Slee114, Per Soelberg Sorensen16, Melissa Sorosina26, Mireia Sospedra77,78, Anne Spurkland115, Amy Strange7, emilie Sundqvist31, Vincent thijs106–108, John thorpe116, Anna ticca117, Pentti tienari118, Cornelia van duijn119, elizabeth M Visser120, Steve Vucic14, Helga westerlind31, James S wiley59, Alastair wilkins121, James F wilson122, Juliane winkelmann19,20,123,124, John Zajicek76, eva Zindler23, Jonathan l Haines8, Margaret A Pericak-Vance1, Adrian J Ivinson125, Graeme Stewart14, david Hafler10,11,126, Stephen l Hauser32, Alastair Compston9, Gil McVean7, Philip de Jager2,5,10,127,128, Stephen J Sawcer9,127,128 & Jacob l McCauley1,127,128
1John P. Hussman Institute for Human Genomics, University of Miami, Miller School of Medicine, Miami, Florida, USA. 2Department of Neurology, Program in Translational NeuroPsychiatric Genomics, Institute for the Neurosciences, Brigham & Women’s Hospital, Boston, Massachusetts, USA. 3Department of Psychiatry, Program in Translational NeuroPsychiatric Genomics, Institute for the Neurosciences, Brigham & Women’s Hospital, Boston, Massachusetts, USA. 4Department of Medicine, Division of Genetics, Brigham & Women’s Hospital, Harvard Medical School, Boston, Massachusetts, USA. 5Harvard Medical School, Boston, Massachusetts, USA. 6Broad Institute of Harvard and MIT, Cambridge, Massachusetts, USA. 7The Wellcome Trust Centre for Human Genetics, University of Oxford, Oxford, UK. 8Center for Human Genetics Research, Vanderbilt University Medical Center, Nashville, Tennessee, USA. 9Department of Clinical Neurosciences, Addenbrooke’s Hospital, University of Cambridge, Cambridge, UK. 10Program in Medical and Population Genetics, Broad Institute of Harvard and MIT, Cambridge, Massachusetts, USA. 11Department of Neurology, Yale University School of Medicine, New Haven, Connecticut, USA. 12Department of Genetics, Yale University School of Medicine, New Haven, Connecticut, USA. 13Wellcome Trust Sanger Institute, Wellcome Trust Genome Campus, Hinxton, Cambridge, UK. 14Westmead Millennium Institute, University of Sydney, Westmead, New South Wales, Australia. 15Section of Experimental Neurology, Laboratory for Neuroimmunology, KU Leuven, Leuven, Belgium. 16Department of Neurology, Danish Multiple Sclerosis Center, Copenhagen University Hospital, Copenhagen, Denmark. 17Institute for Molecular Medicine Finland, University of Helsinki, Helsinki, Finland. 18Département de Neurologie, INSERM UMRS 975 Centre de Recherche de l’Institut du Cerveau et la Moelle Epinière (CRICM), Université Pierre et Marie Curie (UPMC), Pitié-Salpêtrière, Paris, France. 19Department of Neurology, Klinikum Rechts der Isar, Technische Universität München, Munich, Germany. 20Munich Cluster for Systems Neurology (SyNergy), Munich, Germany. 21German Competence Network Multiple Sclerosis (KKNMS), Munich, Germany. 22Department of Clinical Sciences, Danderyd Hospital, Karolinska Institutet, Stockholm, Sweden. 23Focus Program Translational Neuroscience (FTN), Rhine Main Neuroscience Network (rmn2), Johannes Gutenberg University Medical Center, Mainz, Germany. 24Department of Health Sciences, University of Eastern Piedmont, Novara, Italy. 25Interdisciplinary Research Center of Autoimmune Diseases (IRCAD), University of Eastern Piedmont, Novara, Italy. 26Laboratory of Genetics of Neurological Complex Disorders, Institute of Experimental Neurology (INSPE), Division of Neuroscience, San Raffaele

©20
13 N
atu
re A
mer
ica,
Inc.
All
rig
hts
res
erve
d.
8 ADVANCE ONLINE PUBLICATION Nature GeNetics
l e t t e r s
Scientific Institute, Milan, Italy. 27Department of Neurology, INSPE, Division of Neuroscience, San Raffaele Scientific Institute, Milan, Italy. 28Menzies Research Institute Tasmania, University of Tasmania, Hobart, Tasmania, Australia. 29Department of Neurology, Oslo University Hospital, Ullevål, Oslo, Norway. 30University of Oslo, Oslo, Norway. 31Department of Neuroscience, Karolinska Institutet, Stockholm, Sweden. 32Department of Neurology, University of California, San Francisco, Sandler Neurosciences Center, San Francisco, California, USA. 33Department of Neurology, Erasmus MC, Erasmus University Medical Centre, Rotterdam, The Netherlands. 34Division of Epidemiology, Genetic Epidemiology and Genomics Laboratory, School of Public Health, University of California, Berkeley, Berkeley, California, USA. 35California Institute for Quantitative Biosciences (QB3), University of California, Berkeley, Berkeley, California, USA. 36Kaiser Permanente Division of Research, Oakland, California, USA. 37Full lists of members and affiliations appear in the supplementary Note. 38Laboratory of Molecular Medicine and Biotechnology, Don C. Gnocchi Foundation Organizzazione Non Lucrativa di Utilità Sociale (ONLUS), Istituto di Ricovero e Cura a Carattere Scientifico (IRCCS) Santa Maria Nascente, Milan, Italy. 39Institute of Environmental Medicine, Karolinska Institutet, Stockholm, Sweden. 40Laboratoire d’Immunologie, Université Rennes 1, Rennes, France. 41Medical Research Council Biostatistics Unit, Cambridge, UK. 42Department of Transfusion Medicine, University Medical Center Hamburg-Eppendorf, Hamburg, Germany. 43School of Medicine, Griffith University, Gold Coast, Queensland, Australia. 44Centre Hospitalier Universitaire (CHU) Pellegrin, Université Bordeaux 2, Bordeaux, France. 45Department of Medicine, University of Melbourne, Melbourne, Victoria, Australia. 46Department of Neurology, Box Hill Hospital, Monash University, Box Hill, Victoria, Australia. 47Service de Neurologie, Centre Hospitalier Universitaire Régional Montpellier, Montpellier, France. 48Plateforme Post-Génomique P3S, Université Pierre et Marie Curie, INSERM, Paris, France. 49Department of Neuroscience, Multiple Sclerosis Center, Azienda Ospedaliera Città della Salute e della Scienza di Torino, Turin, Italy. 50Department of Neuroscience, University of Turin, Turin, Italy. 51Service de Neurologie, Hôpital Avicenne, Bobigny, France. 52Department of Health Sciences, San Paolo Hospital and Filarete Foundation, University of Milan, Milan, Italy. 53Service de Neurologie, CHU de Caen and INSERM U919–Groupement d’Intérêt Public Cyceron, Caen, France. 54Department of Neurology, Multiple Sclerosis Division, Miller School of Medicine, University of Miami, Miami, Florida, USA. 55Neurologia 2–Regional Multiple Sclerosis Centre, Azienda Ospedaliera Universitaria San Luigi, Orbassano, Turin, Italy. 56Department of Neurology, Royal Victoria Infirmary, Newcastle-upon-Tyne, UK. 57Department of Neurology, University of Tampere, Medical School, Tampere, Finland. 58Division of Clinical Neurology, Nottingham University Hospital, Nottingham, UK. 59Florey Institute of Neuroscience and Mental Health, University of Melbourne, Melbourne, Victoria, Australia. 60Institute of Clinical Molecular Biology, Christian Albrechts University of Kiel, Kiel, Germany. 61Department of Pathophysiology and Transplantation, Neurology Unit, University of Milan, Milan, Italy. 62Fondazione IRCCS Cà Granda Ospedale Maggiore Policlinico, Milan, Italy. 63Kora-gen, Helmholtz Zentrum München–German Research Center for Environmental Health, Institute of Genetic Epidemiology, Neuherberg, Germany. 64Department of Clinical Neurology, The Ipswich Hospital National Health Service (NHS) Trust, Ipswich, UK. 65Center for Applied Genomics, The Children’s Hospital of Philadelphia, Philadelphia, Pennsylvania, USA. 66Department of Pediatrics, The Perelman School of Medicine, University of Pennsylvania, Philadelphia, Pennsylvania, USA. 67Wellcome Trust Clinical Research Facility, Southampton General Hospital, Southampton, UK. 68Department of Neurology, Aberdeen Royal Infirmary, Aberdeen, UK. 69Department of Medical Epidemiology and Biostatistics, Karolinska Institutet, Stockholm, Sweden. 70Department of Medicine at Karolinska University Hospital Solna, Atherosclerosis Research Unit, Center for Molecular Medicine, Karolinska Institutet, Stockholm, Sweden. 71Department of Neurology, Hull Royal Infirmary, Hull, UK. 72Department of Neurology, Royal Devon and Exeter Foundaton Trust Hospital, Exeter, UK. 73Keele University Medical School, University Hospital of North Staffordshire, Stoke-on-Trent, UK. 74UCL Genetics Institute (UGI), University College London, London, UK. 75Department of Neurology, Poole General Hospital, Poole, UK. 76Plymouth University Peninsula Schools of Medicine and Dentistry, Plymouth, UK. 77Institute for Neuroimmunology and Clinical Multiple Sclerosis Research (inims), Center for Molecular Neurobiology (ZMNH), University Medical Center Hamburg-Eppendorf, Hamburg, Germany. 78Department of Neuroimmunology and Multiple Sclerosis Research, Neurology Clinic, University Hospital Zürich, Zürich, Switzerland. 79Department of Neurology, Division of Clinical Neurology, Leicester Royal Infirmary, Leicester, UK. 80Australian Neuromuscular Research Institute, University of Western Australia, Nedlands, Western Australia, Australia. 81Institute for Immunology and Infectious Diseases, Murdoch University, Murdoch, Western Australia, Australia. 82Melbourne Neuroscience Institute, University of Melbourne, Melbourne, Victoria, Australia. 83Department of Neurology, Seinäjoki Central Hospital, Seinäjoki, Finland. 84Department of Physics, Chemistry and Biology (IFM) Bioinformatics, Linköping University, Linköping, Sweden. 85Fondation Jean Dausset–Centre d’Etude du Polymorphisme Humain, Paris, France. 86Commissariat à l’Energie Atomique, Institut Génomique, Centre National de Génotypage, Evry, France. 87McGill University and Génome Québec Innovation Centre, Montreal, Quebec, Canada. 88Service de Neurologie, Hôpital Pasteur, CHRU Nice, France. 89Hunter Medical Research Institute, University of Newcastle, Newcastle, New South Wales, Australia. 90Department of Neurology, Ospedale Maggiore, Novara, Italy. 91Department of Medical Genetics, Oslo University Hospital, Ullevål, Oslo, Norway. 92Department of Vertebrate Genomics, Neuropsychiatric Genetics Group, Max Planck Institute for Molecular Genetics, Berlin, Germany. 93Department of Clinical Neurosciences and Rehabilitation, Institute of Neuroscience and Physiology, Sahlgrenska Academy, Göteborgs Universitet, Göteborg, Sweden. 94Department of Psychiatry and Human Behavior, School of Medicine, University of California–Irvine, Irvine, California, USA. 95Department of Pharmacological and Biomolecular Sciences, University of Milan, Milan, Italy. 96Department of Chronic Disease Prevention, National Institute for Health and Welfare, Helsinki, Finland. 97Canterbury District Health Board, Christchurch, New Zealand. 98Department of Neurology, Queen Elizabeth Medical Centre, Edgbaston, Birmingham, UK. 99Department of Neurology, The Norwegian Multiple Sclerosis Registry and Biobank, Haukeland University Hospital, Bergen, Norway. 100National Multiple Sclerosis Center Melsbroek, Melsbroek, Belgium. 101Neurology Department, Charing Cross Hospital, London, UK. 102Department of Clinical Sciences, Lund University, Lund, Sweden. 103Department of Neurology, Royal Hallamshire Hospital, Sheffield, UK. 104Department of Neurology, University of Oulu, Oulu, Finland. 105Department of Neurology, University Hospital of Oulu, Oulu, Finland. 106Laboratory of Neurobiology, Vesalius Research Center, Leuven, Belgium. 107Experimental Neurology, Leuven Research Institute for Neurodegenerative Diseases (LIND), University of Leuven (KU Leuven), Leuven, Belgium. 108Department of Neurology, University Hospitals Leuven, Leuven, Belgium. 109Institute of Psychological Medicine and Clinical Neuroscience, Cardiff University, University Hospital of Wales, Cardiff, UK. 110Department of Neurology, Greater Manchester Neurosciences Centre, Salford Royal NHS Foundation Trust, Salford, UK. 111Department of Neuroscience, Centre for Experimental Neurological Therapies, Mental Health and Sensory Organs, Sapienza Università di Roma, Rome, Italy. 112Department of Neurology, Royal Preston Hospital, Preston, UK. 113Department of Neurology, Norfolk and Norwich Hospital, Norwich, UK. 114Department of Neurology, Flinders University, Adelaide, South Australia, Australia. 115Institute of Basic Medical Sciences, University of Oslo, Oslo, Norway. 116Department of Neurology, Peterborough City Hospital, Peterborough, UK. 117Neurology and Stroke Unit, San Francesco Hospital, Nuoro, Italy. 118Department of Neurology, Helsinki University Central Hospital and Molecular Neurology Programme, Biomedicum, University of Helsinki, Helsinki, Finland. 119Department of Epidemiology, Erasmus Medical Center, Rotterdam, The Netherlands. 120Division of Applied Health Sciences, University of Aberdeen, Foresterhill, Aberdeen, UK. 121Institute of Clinical Neurosciences, University of Bristol, Frenchay Hospital, Bristol, UK. 122Centre for Population Health Sciences, University of Edinburgh, Edinburgh, UK. 123Institut für Humangenetik, Technische Universität München, Munich, Germany. 124Institut für Humangenetik, Helmholtz Zentrum München–Munich, Germany. 125Harvard NeuroDiscovery Center, Harvard Medical School, Boston, Massachusetts, USA. 126Department of Immunobiology, Yale University School of Medicine, New Haven, Connecticut, USA. 127These authors contributed equally to this work. 128These authors jointly directed this work. Correspondence should be addressed to J.L.M. ([email protected]).

©20
13 N
atu
re A
mer
ica,
Inc.
All
rig
hts
res
erve
d.
Nature GeNeticsdoi:10.1038/ng.2770
oNLINE METhodSImmunoChip data (discovery set). Details of case ascertainment, processing and genotyping for the discovery phase are provided in the Supplementary Note (see also Supplementary Table 9). All cases and controls involved in this study gave valid informed consent in accordance with approval from the relevant local ethical committees or institutional review boards (IRBs). The investigators were not blinded to allocation during experiments and outcome assessment. Genotype calling for all samples was performed using Opticall40. Samples that performed poorly or were determined to be related were removed (Supplementary Table 10). Data were organized into 11 country-level strata: ANZ (Australia and New Zealand), Belgium, Denmark, Finland, France, Germany, Italy, Norway, Sweden, the UK and the United States. SNP-level quality control (Supplementary Table 11) and population outlier identifi-cation using principal-components analysis (Supplementary Fig. 97) were carried out in each stratum separately. No statistical method was used to pre-determine sample size.
Discovery set analysis. We applied logistic regression, assuming a per-allelic genetic model for each data set, including the first five principal components as covariates to correct for population stratification (Supplementary Table 12 lists the genomic inflation factors for each data set, λ). We then performed an inverse variance meta-analysis of the 11 strata under a fixed-effects model, as implemented in PLINK41. To be more conservative and account for any residual inflation in the test statistic, we applied the genomic control equiva-lent to the per-SNP standard error in each stratum. Specifically, we corrected the standard errors for SNPs by multiplying them by the square root of the raw genomic inflation factor, λ, for each data set if λ was >1.
Within the designated fine-mapping intervals, we applied a forward stepwise logistic regression to identify statistically independent effects. The primary SNP in each interval was included as a covariate, and association analysis was repeated for the remaining SNPs. This process was repeated until no SNPs reached the minimum level of significance (P < 1 × 10⁻⁴). Outside of the designated fine-mapping intervals, all SNPs having association P < 1 × 10⁻⁴ were identified and grouped into sets on the basis of being sepa-rated by a physical distance of less than 2 Mb, and a similar stepwise regres-sion model was applied. Any SNPs that entered the model with association P < 1 × 10⁻⁴ after conditioning were considered to be statistically independent primary signals.
In addition, because of the close physical proximity of some fine- mapping intervals and SNP sets, independence was tested for all identified signals within 2 Mb of one another. Forest and cluster plots (Supplementary Fig. 98) of all independent SNPs were examined, and a SNP was excluded if cluster plots were unsatisfactory. If a SNP was excluded, forward stepwise logistic regression within the corresponding fine-mapping interval or SNP set was repeated after removal of the SNP. During this process, 17 additional SNPs were excluded on the basis of cluster or forest plot review.
Replication set. The replication phase included GWAS data organized into 15 strata. Within each stratum, poorly performing samples (call rate < 95%, sex discordance or excess heterozygosity) and poorly performing SNPs (Hardy-Weinberg equilibrium P < 1 × 10⁻⁶, minor allele frequency (MAF) < 1% or call rate < 95%) were removed. Principal-components analysis was performed to identify population outliers for each stratum, and the genomic control inflation factor was < 1.1 for each. Data included in the final discovery and replication analyses are summarized in Supplementary Tables 13 and 14. All samples used in the replication set were unrelated to those in the discovery set, as verified by identity-by-descent analysis.
We attempted replication of all non-MHC independent signals that reached discovery P < 1 × 10⁻⁴ in a meta-analysis set of GWAS. Each data set was imputed with the 1000 Genomes Project European phase I (a) panel using BEAGLE42 to maximize the overlap between the ImmunoChip SNP content and the GWAS data. Post-imputation genotypic probabilities were used in a logistic regression model, for each stratum, to estimate SNP effect sizes and P values. By using the post-imputation genotypic probabilities, we penalized SNPs that did not have good imputation quality, thus ensuring a conserva-tive analysis. Furthermore, we accounted for population stratification in each data set by including the first five principal components in the logistic model.
We then performed meta-analysis of the effect sizes and respective stand-ard errors of the 15 strata using a fixed-effects, inverse variance method. We applied the genomic control equivalent to the per-SNP standard error in each stratum, controlling for the respective genomic inflation factor, λ (Supplementary Table 14).
To replicate the primary SNPs with identified signal in the discovery phase, we determined the replication effect sizes and respective standard errors. For the secondary and tertiary SNPs, we fitted the same exact models as in the discovery phase for each data set. We then performed fixed-effects meta-analysis to estimate an effect size that corresponded to the same logis-tic model. In the case that a SNP was not present in the replication set, we replaced it with a perfectly tagging SNP, i.e., a SNP that had r2 and D′ values equal to 1. If a perfectly tagging SNP was not available, we selected a SNP that had equivalent MAF and the highest possible r2 and D′ values. Estimation of r2 and D′ values for this objective were based on data from ImmunoChip control samples.
Joint analysis (discovery and replication sets). We performed meta-analysis of the effect sizes and respective standards errors from the discovery and replication phases under a fixed-effects model. A SNP was considered to have replicated when all three of the following criteria were met: (i) replication P < 5.0 × 10⁻²; (ii) joint P < 5 × 10⁻⁸; and (iii) the joint P value was more statistically significant than the discovery P value. SNPs that reached P < 1 × 10⁻⁶ but did not pass the genome-wide significance threshold were defined as having suggestive signals if criteria (i) and (iii) were met.
Fine mapping of association signals. To fine map association signals, we used a combination of imputation and Bayesian methodology23. Around each of the 97 associated SNPs, we isolated 2 Mb of sequence in the discovery and replication phase UK data as well as in the European samples from Phase 1 of the 1000 Genomes Project28. Forming the single largest cohort, only UK samples were considered to minimize the effects of differential imputation quality between populations of different ancestry. In addition to the previ-ous quality control, SNPs with failed alignment or difference in MAF > 10% between the typed cohorts and the 1000 Genomes Project samples, MAF < 1% or Hardy-Weinberg equilibrium P < 1.0 × 10⁻⁴ were removed.
Imputation was performed separately for the UK discovery and replica-tion cohorts on each 2-Mb region using the default settings of IMPUTEv2 (refs. 43,44). Missing genotypes for the genotyped SNPs were not imputed, and any imputed SNP that failed to reach the Hardy-Weinberg equilibrium and MAF thresholds was subsequently removed. We carried out frequentist and Bayesian association tests on all SNPs in each cohort separately, assuming additivity, using the default settings of SNPTESTv2 (ref. 45). Frequentist fixed-effects meta-analysis was carried out using the software META46. Bayesian meta-analysis was carried out using an independence prior (near-identical results were obtained using a fixed-effects Bayesian meta-analysis).
To identify regions where reliable fine mapping could be achieved, we used the information score (INFO, obtained from IMPUTEv2) as determined from the 1000 Genomes Project samples. Specifically, we measured the fraction of variants having both r2 > 0.5 and r2 > 0.8 with the primary associated variant and having greater than 50% and 80% INFO scores, respectively. Regions where any SNP with r2 > 0.5 had INFO < 50% were excluded. We also excluded regions where the top hit from imputation had an INFO score less than 80%. Regions were considered to be fine mapped with high quality when all vari-ants with r2 > 0.8 had an INFO score of at least 80%. Within these regions, we excluded variants where the inferred direction of association was opposite between the UK discovery and replication cohorts.
To measure the posterior probability that any single variant drives associa-tion, we calculated the Bayes factor. Under the assumption that there is a single causal variant in the region, the Bayes factor is proportional to the probability that the variant drives the association23. We identified the smallest set of variants that contained 90% and 50% of the posterior probability. We called a region successfully and consistently fine mapped it if there were at most five variants in the 50% confidence interval and the top SNP from the frequentist analysis was contained in the 90% confidence interval. For these regions, we annotated variants with information about evolutionary conservation, pre-dicted coding consequences, regulation, published associations to expression

©20
13 N
atu
re A
mer
ica,
Inc.
All
rig
hts
res
erve
d.
Nature GeNetics doi:10.1038/ng.2770
or DNase I hypersensitive sites using ANNOVAR47, VEP24 and the eQTL browser, a recent study of expression in immune cells20 and other literature.
GO classification. To determine the GO processes in which our 97 associated variants were involved, we used MetaCore from Thomson Reuters. We anno-tated the processes for the unique genes within 50 kb of the variants.
Cross-disease comparisons. To explore the potential overlap with variants identified across other autoimmune diseases, we calculated the percentage overlap of reported variants found in other ImmunoChip reports to our ImmunoChip results. The top variants reported as either newly discovered or previously known in other ImmunoChip reports were compared with the 110 variants representing both our new and previous discoveries in multiple sclerosis. For a signal to be considered to be overlapping, we required r2 ≥ 0.8 using the Pairwise LD function of the SNAP tool in European samples31.
Secondary analyses. We performed a severity-based analysis of the Multiple Sclerosis Severity Score (MSSS) in cases only from the discovery phase
(Supplementary Fig. 99). In addition, a transmission disequilibrium test was performed in 633 trios to test for transmission of the 97 identified risk alleles (Supplementary Fig. 100). Details are given in the Supplementary Note.
40. Shah, T.S. et al. optiCall: a robust genotype-calling algorithm for rare, low-frequency andcommon variants. Bioinformatics 28, 1598–1603 (2012).
41. Purcell, S. et al. PLINK: a tool set for whole-genome association and population-based linkage analyses. Am. J. Hum. Genet. 81, 559–575 (2007).
42. Browning, B.L. & Yu, Z. Simultaneous genotype calling and haplotype phasing improves genotype accuracy and reduces false-positive associations for genome-wide association studies. Am. J. Hum. Genet. 85, 847–861 (2009).
43. Marchini, J., Howie, B., Myers, S., McVean, G. & Donnelly, P. A new multipoint method for genome-wide association studies by imputation of genotypes. Nat. Genet. 39, 906–913 (2007).
44. Howie, B., Marchini, J. & Stephens, M. Genotype imputation with thousands of genomes. G3 1, 457–470 (2011).
45. Marchini, J. & Howie, B. Genotype imputation for genome-wide association studies. Nat. Rev. Genet. 11, 499–511 (2010).
46. Liu, J.Z. et al. Meta-analysis and imputation refines the association of 15q25 with smoking quantity. Nat. Genet. 42, 436–440 (2010).
47. Wang, K., Li, M. & Hakonarson, H. ANNOVAR: functional annotation of genetic variants from high-throughput sequencing data. Nucleic Acids Res. 38, e164 (2010).
Copyright © 2022 FDOKUMEN