A meta-analysis identifies new loci associated with body mass index in individuals of African...
9
690 VOLUME 45 | NUMBER 6 | JUNE 2013 NATURE GENETICS LETTERS Genome-wide association studies (GWAS) have identified 36 loci associated with body mass index (BMI), predominantly in populations of European ancestry. We conducted a meta- analysis to examine the association of >3.2 million SNPs with BMI in 39,144 men and women of African ancestry and followed up the most significant associations in an additional 32,268 individuals of African ancestry. We identified one new locus at 5q33 (GALNT10, rs7708584, P = 3.4 × 10 −11 ) and another at 7p15 when we included data from the GIANT consortium (MIR148A-NFE2L3, rs10261878, P = 1.2 × 10 −10 ). We also found suggestive evidence of an association at a third locus at 6q16 in the African-ancestry sample (KLHL32, rs974417, P = 6.9 × 10 −8 ). Thirty-two of the 36 previously established BMI variants showed directionally consistent effect estimates in our GWAS (binomial P = 9.7 × 10 −7 ), five of which reached genome-wide significance. These findings provide strong support for shared BMI loci across populations, as well as for the utility of studying ancestrally diverse populations. There are notable racial and ethnic disparities in the prevalence of obesity in the United States; nearly 50% of African-American adults are classified as obese compared to 35% of non-Hispanic whites 1 . GWAS have identified 36 BMI loci at statistically signifi- cant levels (P < 5 × 10 −8 ) 2–13 , 32 of which were identified in indi- viduals of European ancestry 3–8 and 4 of which were identified in east Asian populations 9,10 . Large GWAS of BMI in populations of African ancestry are lacking and will be important for identifying genetic variants that are unique and/or of greater importance to this population 14–17 . In this study we conducted a large GWAS meta- analysis of BMI in men and women of African ancestry to search for new loci and tested associations with common variation at the 36 known loci to better understand their relevance in populations of African ancestry. We included 36 GWAS, totaling 39,144 men and women of African ancestry, in the stage 1 meta-analysis of as many as 3,283,202 (minor allele frequency (MAF) >1%) genotyped and imputed SNPs (Online Methods, Supplementary Tables 1–3 and Supplementary Note). After applying both study-specific and overall stage 1 genomic- control corrections (Supplementary Table 2), 11 SNPs at five loci achieved genome-wide significance (P < 5 × 10 −8 ) (Table 1, Fig. 1 and Supplementary Fig. 1). Four of these loci are known BMI loci (1q25, SEC16B; 4p12, GNPDA2; 16q12, FTO; and 18q21, MC4R). The fifth locus, at 5q33 (rs7708584, approximately 27 kb upstream of GALNT10, P = 8.02 × 10 −9 ), has not been previously associated with BMI at genome-wide significant levels in any population. We subsequently selected the 1,500 most significantly asso- ciated SNPs from stage 1 (P < 1.19 × 10 −3 ) and examined asso- ciations with BMI in an independent sample of 6,817 men and women of African ancestry from seven additional studies (stage 2) (Online Methods, Supplementary Tables 1–3 and Supplementary Note). Of these 1,500 SNPs, 179 replicated at nominal significance (P < 0.05) and had effects that were directionally consistent with those in stage 1 (Supplementary Table 4). A meta-analysis of stages 1 and 2 revealed a second new locus, 6q16 (rs974417, located in an intronic region of KLHL32; stage 2 P = 3.5 × 10 −3 , combined stages 1 and 2 P = 2.2 × 10 −8 ), and confirmed our finding at rs7708584 on 5q33 near GALNT10 (stage 2 P = 9.4 × 10 −3 , combined stages 1 and 2 P = 2.2 × 10 −10 ). We further examined the associations of these two variants in a third stage composed of 25,451 individuals of African ancestry from an additional 12 studies. We found support for an asso- ciation with both variants, although the strength of the association was greater for rs7708584 (GALNT10, P = 7.1 × 10 −3 ) than for rs974417 (KLHL32, P = 0.09). In combining results across all three stages (n = 71,412), rs7708584 (GALNT10) was significantly associated with BMI (P = 3.4 × 10 −11 ), whereas rs974417 (KLHL32) was nearly genome-wide significant (P = 6.9 × 10 −8 ) (Table 1 and Fig. 2a,b). To identify additional new loci that may be of importance across populations, we examined the 1,500 most significant SNPs from stage 1 in publicly available data from the GIANT consortium of ~124,000 individuals European ancestry 7 (Online Methods). rs7708584 (GALNT10) was significantly associated with BMI in European- ancestry populations (effect allele frequency (EAF) = 0.42, P = 1.2 × 10 −5 ) but rs974417 (KLHL32) was not (EAF = 0.85, P = 0.45), although it was directionally consistent. Through a meta-analysis of individuals of European and African ancestry, we identified an additional new variant at 7p15 (rs10261878) that was also associated with BMI in European-ancestry populations (GIANT EAF = 0.94, P = 2.2 × 10 −5 ). rs10261878 on 7p15 is located in an intergenic region 39 kb upstream of MIR148A (encoding miRNA-148a) and approxi- mately 241 kb upstream of NFE2L3. This variant was positively asso- ciated with BMI in stages 1 (P = 1.7 × 10 −4 ) and 3 (P = 1.0 × 10 −3 ) in the African-ancestry GWAS, with a directionally consistent but nonsignificant association in the smaller stage 2 (P = 0.33) (Fig. 2c and Supplementary Table 5). In combining results across studies of African (stages 1, 2 and 3) and European ancestry (combined n = 194,247), both rs7708584 (GALNT10, P = 5.1 × 10 −14 ) and A meta-analysis identifies new loci associated with body mass index in individuals of African ancestry A full list of authors and affiliations appears at the end of the paper. Received 5 September 2012; accepted 18 March 2013; published online 14 April 2013; doi:10.1038/ng.2608 npg © 2013 Nature America, Inc. All rights reserved.
Transcript of A meta-analysis identifies new loci associated with body mass index in individuals of African...

690 VOLUME 45 | NUMBER 6 | JUNE 2013 Nature GeNetics
l e t t e r s
Genome-wideassociationstudies(GWAS)haveidentified36lociassociatedwithbodymassindex(BMI),predominantlyinpopulationsofEuropeanancestry.Weconductedameta-analysistoexaminetheassociationof>3.2millionSNPswithBMIin39,144menandwomenofAfricanancestryandfollowedupthemostsignificantassociationsinanadditional32,268individualsofAfricanancestry.Weidentifiedonenewlocusat5q33(GALNT10,rs7708584,P=3.4×10−11)andanotherat7p15whenweincludeddatafromtheGIANTconsortium(MIR148A-NFE2L3,rs10261878,P=1.2×10⁻¹⁰).Wealsofoundsuggestiveevidenceofanassociationatathirdlocusat6q16intheAfrican-ancestrysample(KLHL32,rs974417,P=6.9×10−8).Thirty-twoofthe36previouslyestablishedBMIvariantsshoweddirectionallyconsistenteffectestimatesinourGWAS(binomialP=9.7×10−7),fiveofwhichreachedgenome-widesignificance.ThesefindingsprovidestrongsupportforsharedBMIlociacrosspopulations,aswellasfortheutilityofstudyingancestrallydiversepopulations.
There are notable racial and ethnic disparities in the prevalence of obesity in the United States; nearly 50% of African-American adults are classified as obese compared to 35% of non-Hispanic whites1. GWAS have identified 36 BMI loci at statistically signifi-cant levels (P < 5 × 10⁻⁸)2–13, 32 of which were identified in indi-viduals of European ancestry3–8 and 4 of which were identified in east Asian populations9,10. Large GWAS of BMI in populations of African ancestry are lacking and will be important for identifying genetic variants that are unique and/or of greater importance to this population14–17. In this study we conducted a large GWAS meta-analysis of BMI in men and women of African ancestry to search for new loci and tested associations with common variation at the 36 known loci to better understand their relevance in populations of African ancestry.
We included 36 GWAS, totaling 39,144 men and women of African ancestry, in the stage 1 meta-analysis of as many as 3,283,202 (minor allele frequency (MAF) >1%) genotyped and imputed SNPs (Online Methods, Supplementary Tables 1–3 and Supplementary Note). After applying both study-specific and overall stage 1 genomic-control corrections (Supplementary Table 2), 11 SNPs at five loci achieved genome-wide significance (P < 5 × 10⁻⁸) (Table 1, Fig. 1 and Supplementary Fig. 1). Four of these loci are known BMI loci (1q25, SEC16B; 4p12, GNPDA2; 16q12, FTO; and 18q21, MC4R). The fifth locus, at 5q33 (rs7708584, approximately 27 kb upstream
of GALNT10, P = 8.02 × 10⁻⁹), has not been previously associated with BMI at genome-wide significant levels in any population.
We subsequently selected the 1,500 most significantly asso-ciated SNPs from stage 1 (P < 1.19 × 10⁻³) and examined asso-ciations with BMI in an independent sample of 6,817 men and women of African ancestry from seven additional studies (stage 2) (Online Methods, Supplementary Tables 1–3 and Supplementary Note). Of these 1,500 SNPs, 179 replicated at nominal significance (P < 0.05) and had effects that were directionally consistent with those in stage 1 (Supplementary Table 4). A meta-analysis of stages 1 and 2 revealed a second new locus, 6q16 (rs974417, located in an intronic region of KLHL32; stage 2 P = 3.5 × 10⁻³, combined stages 1 and 2 P = 2.2 × 10⁻⁸), and confirmed our finding at rs7708584 on 5q33 near GALNT10 (stage 2 P = 9.4 × 10⁻³, combined stages 1 and 2 P = 2.2 × 10⁻¹⁰). We further examined the associations of these two variants in a third stage composed of 25,451 individuals of African ancestry from an additional 12 studies. We found support for an asso-ciation with both variants, although the strength of the association was greater for rs7708584 (GALNT10, P = 7.1 × 10⁻³) than for rs974417 (KLHL32, P = 0.09). In combining results across all three stages (n = 71,412), rs7708584 (GALNT10) was significantly associated with BMI (P = 3.4 × 10⁻¹¹), whereas rs974417 (KLHL32) was nearly genome-wide significant (P = 6.9 × 10⁻⁸) (Table 1 and Fig. 2a,b).
To identify additional new loci that may be of importance across populations, we examined the 1,500 most significant SNPs from stage 1 in publicly available data from the GIANT consortium of ~124,000 individuals European ancestry7 (Online Methods). rs7708584 (GALNT10) was significantly associated with BMI in European-ancestry populations (effect allele frequency (EAF) = 0.42, P = 1.2 × 10⁻⁵) but rs974417 (KLHL32) was not (EAF = 0.85, P = 0.45), although it was directionally consistent. Through a meta-analysis of individuals of European and African ancestry, we identified an additional new variant at 7p15 (rs10261878) that was also associated with BMI in European-ancestry populations (GIANT EAF = 0.94, P = 2.2 × 10⁻⁵). rs10261878 on 7p15 is located in an intergenic region 39 kb upstream of MIR148A (encoding miRNA-148a) and approxi-mately 241 kb upstream of NFE2L3. This variant was positively asso-ciated with BMI in stages 1 (P = 1.7 × 10⁻⁴) and 3 (P = 1.0 × 10⁻³) in the African-ancestry GWAS, with a directionally consistent but nonsignificant association in the smaller stage 2 (P = 0.33) (Fig. 2c and Supplementary Table 5). In combining results across studies of African (stages 1, 2 and 3) and European ancestry (combined n = 194,247), both rs7708584 (GALNT10, P = 5.1 × 10⁻¹⁴) and
A meta-analysis identifies new loci associated with body mass index in individuals of African ancestry
A full list of authors and affiliations appears at the end of the paper.
Received 5 September 2012; accepted 18 March 2013; published online 14 April 2013; doi:10.1038/ng.2608
npg
© 2
013
Nat
ure
Am
eric
a, In
c. A
ll rig
hts
rese
rved
.
Nature GeNetics VOLUME 45 | NUMBER 6 | JUNE 2013 691
l e t t e r s
rs10261878 (MIR148A-NFE2L3, P = 1.2 × 10⁻¹⁰) were significantly associated with BMI; rs974417 (KLHL32) did not meet the genome-wide significance threshold (P = 5.7 × 10⁻⁶). In individuals of east Asian descent from the AGEN10 and RIKEN9 consortia (n = 27,715 and n = 26,620, respectively) (Fig. 3, Supplementary Table 6 and Online Methods), rs7708584 (GALNT10, P = 0.002) and rs974417 (KLHL32, P = 0.023) were directionally consistent and significantly associated with BMI, whereas rs10261878 (MIR148A-NFE2L3) was neither directionally consistent nor statistically significantly associ-ated with BMI (P = 0.053). We then examined the associations with BMI in children of African ancestry (n = 3,751) (Online Methods) and found that for all three SNPs, the associations were direction-ally consistent but did not reach statistical significance (P > 0.05) (Supplementary Table 7).
To further understand differences by ancestral background as well as characterize the functional and genetic epidemiologic architecture of the two new BMI loci (5q33, GALNT10; and 7p15, MIR148A-NFE2L3) and the suggestive locus at 6q16 (KLHL32), we performed several additional analyses. Local ancestry adjustment (in 69% of the stage 1 sample; Online Methods) resulted in numeri-cally similar effect estimates (Supplementary Table 8), and we did not detect evidence of significant effect heterogeneity in analyses stratified by local ancestry (Supplementary Table 9). We found that the three BMI loci were associated with waist circumference (among n ≈ 20,000 individuals, many of which overlap those studied here) but not with BMI-adjusted waist circumference, waist-to-hip ratio or height18 (Supplementary Table 10); however, SNPs in this region have been associated with waist-to-hip ratio in Europeans, although at SNPs that are not in linkage disequilibrium (LD) with our index SNP19. We found no evidence of pleiotropy with
adiposity-related metabolic traits using GWAS data provided by trait-specific consortia in men and women predominantly of European ancestry20–24 (Supplementary Table 11).
We examined associations with BMI in our African-ancestry stage 1 sample of the index SNPs reported for the 36 previously established BMI loci in the European and Asian populations7,9,10 (Fig. 3 and Supplementary Table 12). The associations were direc-tionally consistent with the effects reported in the original papers for 32 of the 36 established BMI loci (binomial test of direction P = 9.7 × 10⁻⁷), 16 of which associated with BMI at P < 0.01 (binomial test P < 1.0 × 10⁻¹⁵) (Supplementary Table 12).
12 Previous BMI lociNew BMI loci
Chromosome
SEC16B
GNPDA2
MC4R
FTO
ADCY3
GALNT10
KLHL32
NFE2L3
10
8
6
–log
10 (P
)
4
2
0
1 2 3 4 5 6 7 8 9 10 11 12 13 14 15 16 17 18 19 20 21 22
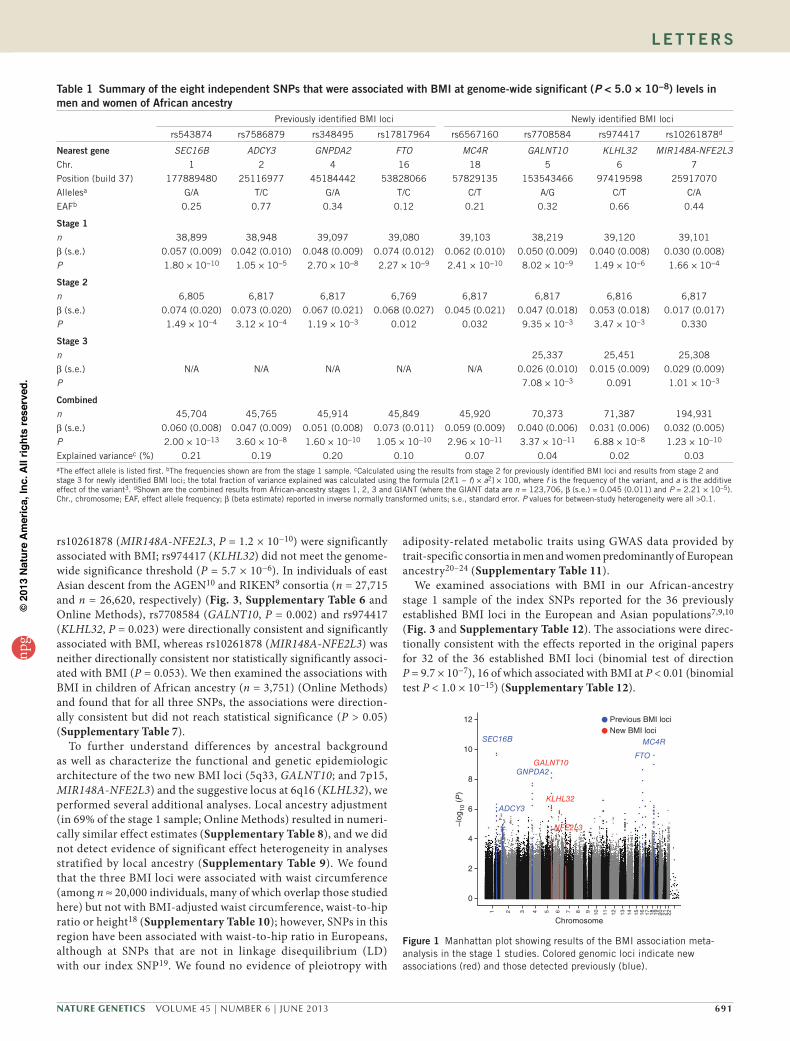
Figure 1 Manhattan plot showing results of the BMI association meta-analysis in the stage 1 studies. Colored genomic loci indicate new associations (red) and those detected previously (blue).
table 1 summary of the eight independent sNPs that were associated with BMI at genome-wide significant (P < 5.0 × 10⁻⁸) levels in men and women of African ancestry
Previously identified BMI loci Newly identified BMI loci
rs543874 rs7586879 rs348495 rs17817964 rs6567160 rs7708584 rs974417 rs10261878d
Nearest gene SEC16B ADCY3 GNPDA2 FTO MC4R GALNT10 KLHL32 MIR148A-NFE2L3Chr. 1 2 4 16 18 5 6 7
Position (build 37) 177889480 25116977 45184442 53828066 57829135 153543466 97419598 25917070
Allelesa G/A T/C G/A T/C C/T A/G C/T C/A
EAFb 0.25 0.77 0.34 0.12 0.21 0.32 0.66 0.44
stage 1n 38,899 38,948 39,097 39,080 39,103 38,219 39,120 39,101
β (s.e.) 0.057 (0.009) 0.042 (0.010) 0.048 (0.009) 0.074 (0.012) 0.062 (0.010) 0.050 (0.009) 0.040 (0.008) 0.030 (0.008)
P 1.80 × 10⁻¹⁰ 1.05 × 10⁻⁵ 2.70 × 10⁻⁸ 2.27 × 10⁻⁹ 2.41 × 10⁻¹⁰ 8.02 × 10⁻⁹ 1.49 × 10⁻⁶ 1.66 × 10⁻⁴
stage 2n 6,805 6,817 6,817 6,769 6,817 6,817 6,816 6,817
β (s.e.) 0.074 (0.020) 0.073 (0.020) 0.067 (0.021) 0.068 (0.027) 0.045 (0.021) 0.047 (0.018) 0.053 (0.018) 0.017 (0.017)
P 1.49 × 10⁻⁴ 3.12 × 10⁻⁴ 1.19 × 10⁻³ 0.012 0.032 9.35 × 10⁻³ 3.47 × 10⁻³ 0.330
stage 3n 25,337 25,451 25,308
β (s.e.) N/A N/A N/A N/A N/A 0.026 (0.010) 0.015 (0.009) 0.029 (0.009)
P 7.08 × 10⁻³ 0.091 1.01 × 10⁻³
Combinedn 45,704 45,765 45,914 45,849 45,920 70,373 71,387 194,931
β (s.e.) 0.060 (0.008) 0.047 (0.009) 0.051 (0.008) 0.073 (0.011) 0.059 (0.009) 0.040 (0.006) 0.031 (0.006) 0.032 (0.005)
P 2.00 × 10⁻¹³ 3.60 × 10⁻⁸ 1.60 × 10⁻¹⁰ 1.05 × 10⁻¹⁰ 2.96 × 10⁻¹¹ 3.37 × 10⁻¹¹ 6.88 × 10⁻⁸ 1.23 × 10⁻¹⁰
Explained variancec (%) 0.21 0.19 0.20 0.10 0.07 0.04 0.02 0.03aThe effect allele is listed first. bThe frequencies shown are from the stage 1 sample. cCalculated using the results from stage 2 for previously identified BMI loci and results from stage 2 and stage 3 for newly identified BMI loci; the total fraction of variance explained was calculated using the formula [2f(1 − f) × a2] × 100, where f is the frequency of the variant, and a is the additive effect of the variant3. dShown are the combined results from African-ancestry stages 1, 2, 3 and GIANT (where the GIANT data are n = 123,706, β (s.e.) = 0.045 (0.011) and P = 2.21 × 10⁻⁵). Chr., chromosome; EAF, effect allele frequency; β (beta estimate) reported in inverse normally transformed units; s.e., standard error. P values for between-study heterogeneity were all >0.1.
npg
© 2
013
Nat
ure
Am
eric
a, In
c. A
ll rig
hts
rese
rved
.

692 VOLUME 45 | NUMBER 6 | JUNE 2013 Nature GeNetics
l e t t e r s
Using the results from the stage 1 meta-analysis, we searched for common variants within the established loci that better captured the association of the index SNP reported in the European and Asian populations. Seven regions (PTBP2, TMEM18, DNAJC27 (previously known as RBJ), NUDT3, BDNF, FTO and MC4R) harbored at least one variant that was correlated with the index SNP in the referent population (r2 ≥ 0.4) and was associated with BMI in the African-ancestry GWAS at a significance level that was at least one order of magnitude greater than that observed for the index SNP (Online Methods, Supplementary Table 13 and Supplementary Fig. 2a–g). These variants were also associated with BMI in the GIANT consor-tium (Supplementary Table 13) and are probably better markers of the biologically functional allele, at least in populations of African ancestry. We also interrogated the evidence for possible independent secondary signals by visual inspection of all P values of SNP-BMI associations for SNPs with r2 < 0.2 within the 1-Mb region of the index SNP. We did not detect evidence of independent secondary
signals at any of the known BMI loci at P < 6.7 × 10⁻⁶ (Online Methods). For most loci, the genetic data from African-ancestry populations may assist in refining the location of the risk variant, as there are fewer markers correlated with the strongest signals and/or a more narrowed region in which any proxies reside in this popula-tion (Supplementary Fig. 3).
To direct us to positional candidate genes, we examined the cis asso-ciations between the index SNP and expression of gene transcripts within the flanking 1-Mb region (500 kb on each side) in human brain, subcutaneous and omental adipose tissue and liver25–28 (Online Methods and Supplementary Table 14). rs7708584 near GALNT10 showed nominally significant (P < 0.05) associations with GALNT10 expression (for two of the three transcripts available) in liver, omental fat and subcutaneous fat (P = 0.048, P = 0.00010 and P = 0.00017, respectively). We also found suggestive cis associations for rs10261878 near NFE2L3 with NFE2L3 expression in the same three tissues (P = 0.039, P = 0.015 and P = 0.036 for liver, omental fat and subcuta-neous fat, respectively). However, despite the consistent associations observed for our lead SNPs in the GALNT10 and NFE2L3 loci, other nearby SNPs showed stronger association with the expression levels of the respective transcripts (Supplementary Fig. 4). Subsequent condi-tional analyses adjusting for the most significant expression quantita-tive trait locus (eQTL) SNP in the region abolished the cis associations between the BMI-associated SNPs and the respective transcript expres-sion levels (Supplementary Table 15). Taken together, these eQTL analyses could not confirm that the identified BMI-associated SNPs affect GALNT10 and NFE2L3 expression directly.
100
80
60
40
20
0
rs7708584
FAM114A2
MFAP3
GALNT10
Obs
erve
d –l
og10
(P
)
Recom
bination rate (cM/M
b)
12
a
10
8
6
4
2
0
153,300 153,500 153,700
Chromosome 5 position (kb)
r2
>0.80.6–0.80.4–0.60.2–0.4<0.2
b100
80
60
40
20
0
rs974417
GPR63NDUFAF4
KLHL32
C6orf167
MIR548H3
Obs
erve
d –l
og10
(P
)R
ecombination rate (cM
/Mb)
10
8
6
4
2
0
97,200 97,400 97,600
Chromosome 6 position (kb)
r2
>0.80.6–0.80.4–0.60.2–0.4<0.2
c100
80
60
40
20
0
rs10261878
NFE2L3SNX10
HNRNPA2B1
LOC441204MIR148A
CBX3
Recom
bination rate (cM/M
b)Obs
erve
d –l
og10
(P
)
10
8
6
4
2
0
25,700 26,000 26,300
Chromosome 7 position (kb)
r2
>0.80.6–0.80.4–0.60.2–0.4<0.2
Figure 2 Regional plots of three new genome-wide significant loci identified in men and women of African ancestry. (a–c) rs7708584 (in the GALNT10 region; a), rs974417 (in the KLHL32 region; b) and rs10261878 (in the MIR148A-NFE2L3 region; c). In a and b, the stage 1 P value is represented by a purple circle, and the combined stages 1, 2 and 3 P value is represented by a purple square; in c, the stage 1 P value is represented by a purple circle, the African-ancestry combined stages 1, 2 and 3 P value is represented by a purple diamond, and the combined African ancestry and GIANT consortium P value is represented by a purple square. SNPs are plotted by their position within 500 kb on either side of the index SNP on the chromosome against their association (−log10 P) with BMI using the stage 1 data. SNPs surrounding the top SNPs are colored to indicate the local LD structure using pairwise r2 data from the May 2012 AFR panel of 1000 Genomes.
Figure 3 Effect estimates (95% confidence intervals) per BMI-increasing allele for the three new loci discovered in individuals of African ancestry (shown in the first section in descending order of the effect size in this population), the 32 loci discovered in individuals of European ancestry (shown in the second section in descending order of their effect size) and the 4 loci discovered in individuals of Asian ancestry (shown in the third section in descending order of their effect size). Results for individuals of African ancestry are depicted as red dots (combined stages 1, 2 and 3 for new loci and stage 1 for previously discovered loci); results for individuals of European ancestry are depicted as black squares7, and results for individuals of Asian ancestry are depicted as green triangles9,10.
GALNT10 TMEM160
RPL27A
FANCL
FLl35779
TNNI3K
KCTD15
NUDT3
PTBP2
ZNF608
GP2
KLF9
CDKAL1
PCSK1
AfricandescentEuropeandescentAsiandescent
ETV5
QPCTL
NEGR1
MAP2K5
LRP1B
SH2B1
RBJ
FAIM2
NRXN3
CADM2
MTIF3
LRRN6C
MTCH2
MIR148A-NFE2L3
FTO
TMEM18
MC4R
PRKD1
SLC39A8
SEC16B
BDNF
GPRC5B
GNPDA2
TFAP2B
–0.10 –0.05 0.05 0.10 0.15 0.20
BMI (kg/m2)
0 –0.10 –0.05 0.05 0.10 0.15 0.20
BMI (kg/m2)
0 –0.10 –0.05 0.05 0.10 0.15 0.20
BMI (kg/m2)
0
Afr
ican
des
cent
Eur
opea
n de
scen
t
Eur
opea
n de
scen
t
Asi
an d
esce
ntE
urop
ean
desc
ent
KLHL32
npg
© 2
013
Nat
ure
Am
eric
a, In
c. A
ll rig
hts
rese
rved
.
Nature GeNetics VOLUME 45 | NUMBER 6 | JUNE 2013 693
l e t t e r s
We did not find nonsynonymous SNPs in GALNT10, NFE2L3 or KLHL32 that were correlated (r2 > 0.2) with the most signifi-cant SNPs in the 1000 Genomes Project African-ancestry popula-tions (AFR). However, we did detect a number of correlated SNPs (r2 > 0.5) in regulatory sequences determined on the basis of overlapping chromatin marks in multiple cell types, including brain and adipose tissue (Online Methods). Many of these SNPs (or good proxies in the 1000 Genomes Project AFR, with an r2 range of 0.59–1.0), which are located in putative enhancer and promoter regions, had only marginally weaker associations in stage 1 than the most signifi-cant SNPs reported in these regions (Supplementary Tables 16–19 and Supplementary Fig. 5a–c). Together these data suggest that the biologically relevant variants in all three regions may be regulatory in function.
The variant rs7708584 at chromosome 5q33 is located upstream of GALNT10 (encoding UDP-N-acetyl-α-D-galactosamine:polypeptide N-acetylgalactosaminyltransferase 10), which cata-lyzes the first step in the synthesis of mucin-type oligosaccha-rides (Supplementary Note). GALNT10 is highly expressed in the small intestine and at intermediate levels in the stomach, pancreas, ovary, thyroid gland and spleen29. Suggestive associa-tions between BMI and GALNT10 have been observed in a smaller sample of African Americans14 that was included in the present stage 1 meta-analysis, although the lead SNP differed (rs2033195) and showed only moderate LD (r2 = 0.27) with the lead SNP we discov-ered here. The variant at 7p15, rs10261878, is intergenic and located 39 kb from a microRNA-encoding gene (MIR148A), which has been found to be significantly upregulated during adipogenesis30, as well as in human adipocytes31. In addition, human miR-148a has been shown to regulate CCKBR (encoding cholecystokinin B receptor), which has been reported to have a regulatory role in the control of food intake32. The next closest gene (241 kb from rs10261878) is NFE2L3 (encoding the nuclear factor (erythroid-derived 2)-like 3), a transcription factor that binds to antioxidant response elements of target genes and seems to have a role in differentiation, inflammation and carcinogenesis33.
The most significant SNP at chromosome 6q16 (rs974417) is intronic in KLHL32 (encoding kelch-like 32). Kelch-like genes have propeller domains that bind substrate proteins, promoting substrate ubiquitination, which modulates protein function. We also detected evidence of recent positive selection in and downstream of KLHL32 (Supplementary Figs. 6–9 and Supplementary Note).
In the largest GWAS meta-analysis of African-ancestry popula-tions so far, we identified two new loci and one highly suggestive locus influencing BMI. The most informative SNPs in each of these three loci explain 0.10% of the variance in BMI in African-ancestry populations compared to 0.05% in Europeans and 0.03% in Asians (Table 1 and Supplementary Table 6). Using the most significant ancestry-specific markers from each locus, the 36 known BMI loci explain 1.30% of the variance in BMI in men and women of African ancestry compared with 1.67% and 1.25% in European and Asian-ancestry populations, respectively (Supplementary Tables 12 and 13). We provide evidence for a shared genetic influence on BMI across populations, as we found directionally consistent associations with the majority of known BMI risk variants. This observation suggests that the biologically functional alleles are ancient and probably arose before migrations out of Africa. In addition, we were able to refine the window of association of some of the previously established BMI loci, which may eventually help identify the biologically functional variant(s). In this study we did not identify common variants for BMI that are likely to contribute to population differences in the
prevalence of obesity. The ability to map new loci and replicate sig-nals at established loci found in other populations reflects differences in allele frequency and effect size, which are influenced by popu-lation differences in recent demographic history and LD with the functional variant, as well as genetic and environmental modifying factors. Further studies will be needed to test the biologically func-tional alleles at the known loci, as well as the contribution of less common variation that have not yet been adequately surveyed by genome-wide SNP arrays. Taken together these findings demonstrate the importance of conducting genetic studies in diverse populations to identify new susceptibility loci for common traits.
METhodSMethods and any associated references are available in the online version of the paper.
Note: Supplementary information is available in the online version of the paper.
AcknowledgmentsA full listing of acknowledgments is detailed in the Supplementary Note.
AUtHoR contRIBUtIonsDesign and/or management of the individual studies: A.A., A.A.A., C.B.A., C.I.A., D.K.A., L.A., M.C.A., M.A.A., S.A., C.H.B., D.M.B., D.W.B., E.P.B., E.V.B., G.B., I.B.B., J.P.B., L.B., S.I.B., W.J.B., C.S.C., G. Casey, G.K.C., J.C., L.C., M.C., N.E.C., Q.C., R.S.C., S.J.C., J.D., P.D., R.W.D., S.L.D.-H., M.K.E., T.L.E., C.F., J.K.F., E.M.G., P.J.G., S.F.A.G., A.H., A.J.M.H., B.E.H., B.V.H., C.A.H., C.C.H., D.H., H.H., K.J.H., J.J.H., J.N.H., V.J.H., S.A.I., E.M.J., J.M.J., C.K., D.L.K., E.A.K., E.K.K., L.N.K., L.H.K., R.A.K., S.J.K., S. Kolb, L.L.M., A.M.L., R.J.F.L., S.L., Yongmei Liu, A.B.M., B.M., K.R.M., R.C.M., T.H.M., J.H.M., J.C.M., I.M.-B., K.E.N., M.C.Y.N., S.N., C.N.-D., U.N., B.N., K.L.N., T.O.O., O.O., O.I.O., B.P., U.P., B.M.P., C.A.P., G.J.P., J.R.P., M.F.P., P.A.P., S.R.P., E.A.R.-N., B.A.R., C.N.R., S.R., J.L.R.-G., A.B.S., A.G.S., J.L.S., L.B.S., P.J.S., S.B.S., S.W.-S., M.R.S., M.M.S., I.J.S., S.S.S., H.T., M.J.T., M.A.T., M.V., J.S.W., X.W., J.K.W., S.M.W., L.K.W., M.W., J.J.Y., N.A.Z., R.G.Z., W. Zheng, A.B.Z., K.A.Z., Y.Z. and X.Z.
Genotyping: A.B., U.B., S.J.C., Y.-D.I.C., D.D., T.L.E., S.F.A.G., X.G., D.G.H., J.N.H., T.D.H., T. Haritunians, K.C.J., Yongmei Liu, Y. Lu, W.M., R.N., J.R.P., N.D.P., S.B.S. and D.J.V.D.B.
Phenotyping: A.A.A., D.K.A., M.A.A., E.P.B., R.S.C., E.D., B.I.F., O.G., S.F.A.G., J.N.H., T. Haritunians, K.C.J., A.K., C.K., E.K.K., S.L., J.E.M., M.N., R.N., A.O., H.O.-B., B.M.P., J.R.P., S.R.P., C.N.R., E.R., S.R., B.S., D.S., L.S., B.O.T. and T.R.Y.
Statistical methods and data analysis: A.A.A., D.K.A., L.F.B., C.W.K.C., G.K.C., G. Casey, N.E.C., W.-M.C., G.A.C., Y.-D.I.C., J.D., P.D., T.L.E., C.F., M.F.F., J.P.B., E.M.G., M.G., O.G., X.G., C.A.H., M.R.I., A.K., B.J.K., C.K., E.K.K., S.J.K., C.D.L., G. Lettre, G. Li, H.L., K.L., L.A.L., R.J.F.L., V.L., Yongmei Liu, Youfang Liu, Y. Lu, B.M., K.L.M., Y.A.M., A.N., K.E.N., M.A.N., M.C.Y.N., C.P., J.R.P., E.A.R.-N., S.K.R., B.P., A.P.R., L.J.R.-T., D.A.S., E.K.S., E.E.S., Y.V.S., B.O.T., K.C.T., D.R.V.E., M.K.W., Z.W., L.K.W., T.W.W., L.R.Y., J.Z., J.H.Z., N.A.Z., J.M.Z., W. Zhao, the NABEC Consortium, the UKBEC Consortium, the BioBank Japan Project and the AGEN Consortium.
Writing group: G.K.C., T.L.E., M.G., B.E.H., J.N.H., R.J.F.L., C.A.H., L.A.L., K.L.M., K.E.N., M.C.Y.N., C.P., G.J.P., A.P.R. and K.C.T.
Critical review of the manuscript: A.A.A., A.A., C.B.A., C.I.A., D.K.A., L.A., M.A.A., M.C.A., S.A., A.B., C.H.B., D.M.B., D.W.B., E.P.B., E.V.B., G.B., I.B.B., J.P.B., L.F.B., L.B., S.I.B., U.B., W.J.B., C.W.K.C., C.S.C., F.C., G.A.C., G.K.C., G. Casey, G. Chen, J.C., L.C., M.C., N.E.C., Q.C., R.S.C., S.J.C., W.-M.C., Y.-D.I.C., D.D., E.D., J.D., P.D., R.W.D., S.L.D.-H., M.K.E., T.L.E., C.F., J.K.F., M.F.F., B.I.F., Y.F., E.M.G., G.S.G., M.G., O.G., P.J.G., S.F.A.G., W.T.G., X.G., A.J.M.H., A.H., B.E.H., B.V.H., C.A.H., C.C.H., D.G.H., D.H., H.H., J.J.H., J.N.H., K.J.H., T.D.H., T. Haritunians, T. Harris, V.J.H., J.H.M., M.R.I., S.A.I., E.M.J., J.M.J., K.C.J., A.K., B.J.K., C.K., D.L.K., E.A.K., E.K.K., L.N.K., L.H.K., R.A.K., S.J.K., S.L.R.K., S. Kolb, S. Ketkar, A.M.L., C.D.L., G. Lettre, G. Li, H.L., K.L., L.A.L., L.L., M.C.L., R.J.F.L., S.L., V.L., Yongmei Liu, Youfang Liu, Y. Lu, A.B.M., B.M., J.C.M., J.E.M., L.H.M., K.L.M., K.R.M., R.C.M., T.H.M., W.M., Y.A.M., I.M.-B., A.N., B.N., K.E.N., K.L.N., M.A.N., M.C.Y.N., M.N., R.N., S.N., U.N., C.N.-D., O.I.O., O.O., T.O.O., A.O., H.O.-B., B.M.P., B.P., C.A.P., C.P., G.J.P., J.R.P., M.F.P., N.D.P., P.A.P., S.R.P., U.P., A.P.R., B.A.R., C.N.R., E.R., S.K.R., S.R., J.L.R.-G., E.A.R.-N., L.J.R.-T., A.B.S., A.G.S.,
npg
© 2
013
Nat
ure
Am
eric
a, In
c. A
ll rig
hts
rese
rved
.

694 VOLUME 45 | NUMBER 6 | JUNE 2013 Nature GeNetics
l e t t e r s
B.S., D.A.S., D.S., E.K.S., E.E.S., I.J.S., J.L.S., L.B.S., L.S., M.M.S., M.R.S., P.J.S., S.B.S., S.S.S., Y.V.S., B.O.T., K.C.T., M.A.T., H.T., M.J.T., M.V., D.J.V.D.B., D.R.V.E., J.K.W., M.W., S.M.W., S.-Y.W., S.W.-S., T.W.W., X.W., Z.W., L.K.W., J.S.W., M.K.W., J.J.Y., L.R.Y., T.R.Y., A.B.Z., J.Z., J.M.Z., J.H.Z., K.A.Z., N.A.Z., R.G.Z., W. Zhao, W Zheng, X.Z. and Y.Z.
comPetIng FInAncIAl InteRestsThe authors declare no competing financial interests.
Reprints and permissions information is available online at http://www.nature.com/reprints/index.html.
1. Flegal, K.M., Carroll, M.D., Kit, B.K. & Ogden, C.L. Prevalence of obesity and trends in the distribution of body mass index among US adults, 1999–2010. J. Am. Med. Assoc. 307, 491–497 (2012).
2. Bradfield, J.P. et al. A genome-wide association meta-analysis identifies new childhood obesity loci. Nat. Genet. 44, 526–531 (2012).
3. Thorleifsson, G. et al. Genome-wide association yields new sequence variants at seven loci that associate with measures of obesity. Nat. Genet. 41, 18–24 (2009).
4. Frayling, T.M. et al. A common variant in the FTO gene is associated with body mass index and predisposes to childhood and adult obesity. Science 316, 889–894 (2007).
5. Scuteri, A. et al. Genome-wide association scan shows genetic variants in the FTO gene are associated with obesity-related traits. PLoS Genet. 3, e115 (2007).
6. Loos, R.J.F. et al. Common variants near MC4R are associated with fat mass, weight and risk of obesity. Nat. Genet. 40, 768–775 (2008).
7. Speliotes, E.K. et al. Association analyses of 249,796 individuals reveal 18 new loci associated with body mass index. Nat. Genet. 42, 937–948 (2010).
8. Willer, C.J. et al. Six new loci associated with body mass index highlight a neuronal influence on body weight regulation. Nat. Genet. 41, 25–34 (2009).
9. Okada, Y. et al. Common variants at CDKAL1 and KLF9 are associated with body mass index in east Asian populations. Nat. Genet. 44, 302–306 (2012).
10. Wen, W. et al. Meta-analysis identifies common variants associated with body mass index in east Asians. Nat. Genet. 44, 307–311 (2012).
11. Chambers, J.C. et al. Common genetic variation near MC4R is associated with waist circumference and insulin resistance. Nat. Genet. 40, 716–718 (2008).
12. Meyre, D. et al. Genome-wide association study for early-onset and morbid adult obesity identifies three new risk loci in European populations. Nat. Genet. 41, 157–159 (2009).
13. Scherag, A. et al. Two new loci for body-weight regulation identified in a joint analysis of genome-wide association studies for early-onset extreme obesity in French and german study groups. PLoS Genet. 6, e1000916 (2010).
14. Ng, M.C. et al. Genome-wide association of BMI in African Americans. Obesity (Silver Spring) 20, 622–627 (2012).
15. Kang, S.J. et al. Genome-wide association of anthropometric traits in African- and African-derived populations. Hum. Mol. Genet. 19, 2725–2738 (2010).
16. Shifman, S., Kuypers, J., Kokoris, M., Yakir, B. & Darvasi, A. Linkage disequilibrium patterns of the human genome across populations. Hum. Mol. Genet. 12, 771–776 (2003).
17. Campbell, M.C. & Tishkoff, S.A. African genetic diversity: implications for human demographic history, modern human origins, and complex disease mapping. Annu. Rev. Genomics Hum. Genet. 9, 403–433 (2008).
18. N’Diaye, A. et al. Identification, replication, and fine-mapping of loci associated with adult height in individuals of african ancestry. PLoS Genet. 7, e1002298 (2011).
19. Heid, I.M. et al. Meta-analysis identifies 13 new loci associated with waist-hip ratio and reveals sexual dimorphism in the genetic basis of fat distribution. Nat. Genet. 42, 949–960 (2010).
20. Teslovich, T.M. et al. Biological, clinical and population relevance of 95 loci for blood lipids. Nature 466, 707–713 (2010).
21. Dupuis, J. et al. New genetic loci implicated in fasting glucose homeostasis and their impact on type 2 diabetes risk. Nat. Genet. 42, 105–116 (2010).
22. Saxena, R. et al. Genetic variation in GIPR influences the glucose and insulin responses to an oral glucose challenge. Nat. Genet. 42, 142–148 (2010).
23. Voight, B.F. et al. Twelve type 2 diabetes susceptibility loci identified through large-scale association analysis. Nat. Genet. 42, 579–589 (2010).
24. Ehret, G.B. et al. Genetic variants in novel pathways influence blood pressure and cardiovascular disease risk. Nature 478, 103–109 (2011).
25. Nalls, M.A. et al. Imputation of sequence variants for identification of genetic risks for Parkinson’s disease: a meta-analysis of genome-wide association studies. Lancet 377, 641–649 (2011).
26. Hernandez, D.G. et al. Distinct DNA methylation changes highly correlated with chronological age in the human brain. Hum. Mol. Genet. 20, 1164–1172 (2011).
27. Zhong, H., Yang, X., Kaplan, L.M., Molony, C. & Schadt, E.E. Integrating pathway analysis and genetics of gene expression for genome-wide association studies. Am. J. Hum. Genet. 86, 581–591 (2010).
28. Myers, A.J. et al. A survey of genetic human cortical gene expression. Nat. Genet. 39, 1494–1499 (2007).
29. Cheng, L. et al. Characterization of a novel human UDP-GalNAc transferase, pp-GalNAc-T10. FEBS Lett. 531, 115–121 (2002).
30. Xie, H., Lim, B. & Lodish, H.F. MicroRNAs induced during adipogenesis that accelerate fat cell development are downregulated in obesity. Diabetes 58, 1050–1057 (2009).
31. Ortega, F.J. et al. MiRNA expression profile of human subcutaneous adipose and during adipocyte differentiation. PLoS ONE 5, e9022 (2010).
32. Clerc, P. et al. Involvement of cholecystokinin 2 receptor in food intake regulation: hyperphagia and increased fat deposition in cholecystokinin 2 receptor-deficient mice. Endocrinology 148, 1039–1049 (2007).
33. Chevillard, G. & Blank, V. NFE2L3 (NRF3): the Cinderella of the Cap’n’Collar transcription factors. Cell Mol. Life Sci. 68, 3337–3348 (2011).
keri l monda1,2,156, gary k chen3,156, kira c taylor2,4,156, cameron Palmer5–7,156, todd l edwards8,156, leslie A lange9, maggie c Y ng10,11, Adebowale A Adeyemo12, matthew A Allison13, lawrence F Bielak14, guanjie chen12, mariaelisa graff2, marguerite R Irvin15, suhn k Rhie3,16, guo li17, Yongmei liu18, Youfang liu19, Yingchang lu20, michael A nalls21, Yan V sun22, mary k wojczynski23, lisa R Yanek24, melinda c Aldrich25–27, Adeyinka Ademola28, christopher I Amos29,30, elisa V Bandera31, cathryn H Bock32, Angela Britton21, Ulrich Broeckel33, Quiyin cai25,26, neil e caporaso34, chris s carlson35, John carpten36, graham casey3,16, wei-min chen37, Fang chen37, Yii-der I chen38, charleston w k chiang39, gerhard A coetzee3,16,40, ellen demerath41, sandra l deming-Halverson25,26, Ryan w driver42, Patricia dubbert43–45, mary F Feitosa23, Ye Feng3, Barry I Freedman46, elizabeth m gillanders47, omri gottesman20, Xiuqing guo38, talin Haritunians38, tamara Harris48, curtis c Harris49, Anselm J m Hennis50–53, dena g Hernandez21, lorna H mcneill54,55, timothy d Howard11, Barbara V Howard56,57, Virginia J Howard15, karen c Johnson58, sun J kang59, Brendan J keating60, suzanne kolb35, lewis H kuller61, Abdullah kutlar62, carl d langefeld63, guillaume lettre64, kurt lohman63, Vaneet lotay20, Helen lyon65,66, JoAnn e manson67, william maixner68, Yan A meng69, kristine R monroe3, Imran morhason-Bello70, Adam B murphy71, Josyf c mychaleckyj37, Rajiv nadukuru20, katherine l nathanson72, Uma nayak37, Amidou n’diaye65, Barbara nemesure50, suh-Yuh wu50, m cristina leske50, christine neslund-dudas73, marian neuhouser74, sarah nyante75,76, Heather ochs-Balcom77, Adesola ogunniyi78, temidayo o ogundiran28, oladosu ojengbede70, olufunmilayo I olopade79, Julie R Palmer80, edward A Ruiz-narvaez80, nicholette d Palmer10,11, michael F Press81, evandine Rampersaud82, laura J Rasmussen-torvik83, Jorge l Rodriguez-gil84,85, Babatunde salako78, eric e schadt86,87, Ann g schwartz32, daniel A shriner10, david siscovick17,88,
npg
© 2
013
Nat
ure
Am
eric
a, In
c. A
ll rig
hts
rese
rved
.
Nature GeNetics VOLUME 45 | NUMBER 6 | JUNE 2013 695
l e t t e r s
shad B smith68, sylvia wassertheil-smoller89, elizabeth k speliotes90–93, margaret R spitz94, lara sucheston95, Herman taylor96, Bamidele o tayo97, margaret A tucker34, david J Van den Berg3,16, digna R Velez edwards98,99, Zhaoming wang100, John k wiencke101,102, thomas w winkler20,103, John s witte104, margaret wrensch101,102, Xifeng wu29, James J Yang73, Albert m levin73, taylor R Young93, neil A Zakai105, mary cushman105, krista A Zanetti47,49, Jing Hua Zhao106, wei Zhao107, Yonglan Zheng79, Jie Zhou10, Regina g Ziegler34, Joseph m Zmuda61, Jyotika k Fernandes108, gary s gilkeson108, diane l kamen108, kelly J Hunt108, Ida J spruill109, christine B Ambrosone95, stefan Ambs49, donna k Arnett15, larry Atwood110,155, diane m Becker24, sonja I Berndt34, leslie Bernstein111, william J Blot25,26,112, Ingrid B Borecki23, erwin P Bottinger20, donald w Bowden10,11,46, gregory Burke113, stephen J chanock34, Richard s cooper97, Jingzhong ding114, david duggan36, michele k evans115, caroline Fox116–118, w timothy garvey119, Jonathan P Bradfield120,121, Hakon Hakonarson120–123, struan F A grant120–123, Ann Hsing124–126, lisa chu126, Jennifer J Hu84,85, dezheng Huo127, sue A Ingles3, esther m John124–126, Joanne m Jordan19, edmond k kabagambe25, sharon l R kardia107, Rick A kittles128, Phyllis J goodman129, eric A klein130, laurence n kolonel131, loic le marchand131, simin liu132, Barbara mcknight17,133, Robert c millikan75,76,155, thomas H mosley96, Badri Padhukasahasram134, l keoki williams134,135, sanjay R Patel136, Ulrike Peters35, curtis A Pettaway137, Patricia A Peyser107, Bruce m Psaty17,138,139, susan Redline140, charles n Rotimi12, Benjamin A Rybicki73, michèle m sale141–143, Pamela J schreiner41, lisa B signorello144, Andrew B singleton21, Janet l stanford35, sara s strom29, michael J thun42, mara Vitolins113, wei Zheng25,26, Jason H moore145–147, scott m williams145,146, shamika ketkar148, Xiaofeng Zhu149, Alan B Zonderman150, nABec consortium151, UkBec consortium151, BioBank Japan Project151, Agen consortium151, charles kooperberg35, george J Papanicolaou152, Brian e Henderson3,16, Alex P Reiner35, Joel n Hirschhorn5–7,39, Ruth J F loos20,106,153,154, kari e north2,157 & christopher A Haiman3,16,157
1The Center for Observational Research, Amgen, Inc. Thousand Oaks, California, USA. 2Department of Epidemiology, University of North Carolina at Chapel Hill, Chapel Hill, North Carolina, USA. 3Department of Preventive Medicine, Keck School of Medicine, University of Southern California, Los Angeles, California, USA. 4Department of Epidemiology and Population Health, University of Louisville, Louisville, Kentucky, USA. 5Program in Medical and Population Genetics, Broad Institute of Harvard and MIT, Cambridge, Massachusetts, USA. 6Division of Genetics, Children’s Hospital, Boston, Massachusetts, USA. 7Division of Endocrinology, Children’s Hospital, Boston, Massachusetts, USA. 8Center for Human Genetics Research, Vanderbilt Epidemiology Center, Department of Medicine, Vanderbilt University, Nashville, Tennessee, USA. 9Department of Genetics, University of North Carolina at Chapel Hill School of Medicine, Chapel Hill, North Carolina, USA. 10Center for Diabetes Research, Wake Forest School of Medicine, Winston-Salem, North Carolina, USA. 11Center for Genomics and Personalized Medicine Research, Wake Forest School of Medicine, Winston-Salem, North Carolina, USA. 12Center for Research on Genomics and Global Health, National Human Genome Research Institute, National Institutes of Health (NIH), Bethesda, Maryland, USA. 13Department of Family and Preventive Medicine, University of California San Diego, La Jolla, California, USA. 14Department of Epidemiology, School of Public Health, University of Michigan, Ann Arbor, Michigan, USA. 15Department of Epidemiology, School of Public Health, University of Alabama at Birmingham, Birmingham, Alabama, USA. 16Norris Comprehensive Cancer Center, University of Southern California, Los Angeles, California, USA. 17Cardiovascular Health Research Unit, Department of Medicine, University of Washington, Seattle, Washington, USA. 18Department of Epidemiology and Prevention, Division of Public Health Sciences, Wake Forest School of Medicine, Winston-Salem, North Carolina, USA. 19Thurston Arthritis Research Center, University of North Carolina at Chapel Hill, Chapel Hill, North Carolina, USA. 20The Charles Bronfman Institute of Personalized Medicine, The Icahn School of Medicine at Mount Sinai, New York, New York, USA. 21Laboratory of Neurogenetics, National Institute on Aging (NIA), NIH, Bethesda, Maryland, USA. 22Department of Epidemiology, Rollins School of Public Health, Emory University, Atlanta, Georgia, USA. 23Department of Genetics, Washington University School of Medicine, St. Louis, Missouri, USA. 24Division of General Internal Medicine, Department of Medicine, Johns Hopkins University School of Medicine, Baltimore, Maryland, USA. 25Division of Epidemiology, Department of Medicine, Vanderbilt Epidemiology Center, Vanderbilt University School of Medicine, Nashville, Tennessee, USA. 26The Vanderbilt-Ingram Cancer Center, Vanderbilt University School of Medicine, Nashville, Tennessee, USA. 27Department of Thoracic Surgery, Vanderbilt University School of Medicine, Nashville, Tennessee, USA. 28Department of Surgery, College of Medicine, University of Ibadan, Ibadan, Nigeria. 29Department of Epidemiology, Division of Cancer Prevention and Population Sciences, The University of Texas MD Anderson Cancer Center, Houston, Texas, USA. 30Department of Family and Community Medicine, Geissel School of Medicine, Dartmouth College, Hanover, New Hampshire, USA. 31The Cancer Institute of New Jersey, New Brunswick, New Jersey, USA. 32Karmanos Cancer Institute, Wayne State University, Detroit, Michigan, USA. 33Department of Pediatrics, Section of Genomic Pediatrics, Medical College of Wisconsin, Milwaukee, Wisconsin, USA. 34Division of Cancer Epidemiology and Genetics, National Cancer Institute (NCI), NIH, Bethesda, Maryland, USA. 35Division of Public Health Sciences, Fred Hutchinson Cancer Research Center, Seattle, Washington, USA. 36The Translational Genomics Research Institute, Phoenix, Arizona, USA. 37Center for Public Health Genomics, Department of Public Health Sciences, University of Virginia, Charlottesville, Virginia, USA. 38Medical Genetics Institute, Cedars Sinai Medical Center, Los Angeles, California, USA. 39Department of Genetics, Harvard Medical School, Boston, Massachusetts, USA. 40Department of Urology, Keck School of Medicine, University of Southern California, Los Angeles, California, USA. 41Division of Epidemiology and Community Health, University of Minnesota School of Public Health, Minneapolis, Minnesota, USA. 42Epidemiology Research Program, American Cancer Society, Atlanta, Georgia, USA. 43South Central VA Mental Illness, Research and Clinical Center, Little Rock, Arkansas, USA. 44VA Geriatric Research, Education and Clinical Center, Little Rock, Arkansas, USA. 45Division of Health Services Research, Department of Psychiatry, University of Arkansas for Medical Sciences, Little Rock, Arkansas, USA. 46Department of Internal Medicine, Wake Forest School of Medicine, Winston-Salem, North Carolina, USA. 47Division of Cancer Control and Population Sciences, NCI, NIH, Bethesda, Maryland, USA. 48Laboratory of Epidemiology and Population Science, NIA, NIH, Bethesda, Maryland, USA. 49Laboratory of Human Carcinogenesis, Center for Cancer Research, NCI, NIH, Bethesda, Maryland, USA. 50Department of Preventive Medicine, Stony Brook University, Stony Brook, New York, USA. 51Chronic Disease Research Centre, University of the West Indies, Bridgetown, Barbados. 52Faculty of Medical Sciences, University of the West Indies, Bridgetown, Barbados. 53Ministry of Health, Bridgetown, Barbados. 54Department of Health Disparities Research, Division of the Office of the Vice President (OVP), Cancer Prevention and Population Sciences, The University of Texas MD Anderson Cancer Center, Houston, Texas, USA. 55Center for Community-Engaged Translational Research, Duncan Family Institute, The University of Texas MD Anderson Cancer Center, Houston, Texas, USA. 56MedStar Health Research Institute, Washington DC, USA. 57Georgetown-Howard Universities Center for Clinical and Translational Sciences, Washington, DC, USA. 58Department of Preventive Medicine, University of Tennessee Health Science Center, Memphis, Tennessee, USA. 59Henri Begleiter Neurodynamics Laboratory, Department of
npg
© 2
013
Nat
ure
Am
eric
a, In
c. A
ll rig
hts
rese
rved
.

696 VOLUME 45 | NUMBER 6 | JUNE 2013 Nature GeNetics
Psychiatry and Behavioral Sciences, State University of New York Downstate Medical Center, Brooklyn, New York, USA. 60Institute of Translational Medicine and Therapeutics, University of Pennsylvania, Philadelphia, Pennsylvania, USA. 61Department of Epidemiology, Graduate School of Public Health, University of Pittsburgh, Pittsburgh, Pennsylvania, USA. 62Sickle Cell Center, Department of Medicine, Georgia Health Sciences University, Augusta, Georgia, USA. 63Department of Biostatistical Sciences, Wake Forest School of Medicine, Winston-Salem, North Carolina, USA. 64Montreal Heart Institute, Université de Montréal, Montréal, Québec, Canada. 65Program in Genomics and Endocrinology, Division of Genetics, Children’s Hospital, Boston, Massachusetts, USA. 66Department of Pediatrics, Harvard Medical School, Boston, Massachusetts, USA. 67Department of Medicine, Brigham and Women’s Hospital, Harvard Medical School, Boston, Massachusetts, USA. 68Regional Center for Neurosensory Disorders, School of Dentistry, University of North Carolina at Chapel Hill, Chapel Hill, North Carolina, USA. 69Broad Institute of Harvard and MIT, Metabolic Disease Initiative, Cambridge, Massachusetts, USA. 70Center for Population and Reproductive Health, College of Medicine, University of Ibadan, Ibadan, Nigeria. 71Department of Urology, Northwestern University, Chicago, Illinois, USA. 72Department of Medicine, Perelman School of Medicine at the University of Pennsylvania, Philadelphia, Pennsylvania, USA. 73Department of Public Health Sciences, Henry Ford Hospital, Detroit, Michigan, USA. 74Cancer Prevention Program, Fred Hutchinson Cancer Research Center, Seattle, Washington, USA. 75Department of Epidemiology, Gillings School of Global Public Health, University of North Carolina, Chapel Hill, North Carolina, USA. 76Lineberger Comprehensive Cancer Center, University of North Carolina, Chapel Hill, North Carolina, USA. 77Department of Social and Preventive Medicine, University at Buffalo, Buffalo, New York, USA. 78Department of Medicine, University of Ibadan, Ibadan, Nigeria. 79Department of Medicine, University of Chicago, Chicago, Illinois, USA. 80Slone Epidemiology Center at Boston University, Boston, Massachusetts, USA. 81Department of Pathology, Keck School of Medicine, University of Southern California, Los Angeles, California, USA. 82Department of Human Genetics, Miller School of Medicine, University of Miami, Miami, Florida, USA. 83Department of Preventive Medicine, Northwestern University Feinberg School of Medicine, Chicago, Illinois, USA. 84Department of Epidemiology and Public Health, University of Miami Miller School of Medicine, Miami, Florida, USA. 85Sylvester Comprehensive Cancer Center, University of Miami Miller School of Medicine, Miami, Florida, USA. 86Department of Genetics and Genomic Sciences, The Icahn School of Medicine at Mount Sinai, New York, New York, USA. 87Icahn Institute for Genomics and Multiscale Biology, The Icahn School of Medicine at Mount Sinai, New York, New York, USA. 88Department of Epidemiology, University of Washington, Seattle, Washington, USA. 89Department of Epidemiology and Population Health, Albert Einstein College of Medicine, Bronx, New York, USA. 90Department of Internal Medicine, Division of Gastroenterology, University of Michigan, Ann Arbor, Michigan, USA. 91Center for Computational Medicine and Bioinformatics, University of Michigan, Ann Arbor, Michigan, USA. 92Division of Gastroenterology. Massachusetts General Hospital, Boston, Massachusetts, USA. 93The Broad Institute, Cambridge, Massachusetts, USA. 94Dan L. Duncan Cancer Center, Baylor College of Medicine, Houston, Texas, USA. 95Department of Cancer Prevention and Control, Roswell Park Cancer Institute, Buffalo, New York, USA. 96Department of Medicine, University of Mississippi Medical Center, Jackson, Mississippi, USA. 97Department of Preventive Medicine and Epidemiology, Loyola University Chicago Stritch School of Medicine, Maywood, Illinois, USA. 98Center for Human Genetics Research, Vanderbilt Epidemiology Center, Vanderbilt University, Nashville, Tennessee, USA. 99Vanderbilt Epidemiology Center, Department of Obstetrics and Gynecology, Vanderbilt University, Nashville, Tennessee, USA. 100Core Genotype Facility, SAIC-Frederick, Inc., NCI-Frederick, Frederick, Maryland, USA. 101Institute for Human Genetics, University of California San Francisco, San Francisco, California, USA. 102Department of Neurological Surgery, University of California San Francisco, San Francisco, California, USA. 103Department of Genetic Epidemiology, Institute of Epidemiology and Preventive Medicine, University of Regensburg, Regensburg, Germany. 104Department of Epidemiology and Biostatistics, Institute for Human Genetics, University of California, San Francisco, San Francisco, California, USA. 105Department of Medicine, University of Vermont College of Medicine, Burlington, Vermont, USA. 106Medical Research Council Epidemiology Unit, Institute of Metabolic Science, Addenbrooke’s Hospital, Cambridge, UK. 107Department of Epidemiology, School of Public Health, University of Michigan, Ann Arbor, Michigan, USA. 108Department of Medicine, Medical University of South Carolina, Charleston, South Carolina, USA. 109College of Nursing, Medical University of South Carolina, Charleston, South Carolina, USA. 110Framingham Heart Study, Boston University School of Medicine, Boston, Massachusetts, USA. 111Division of Cancer Etiology, Department of Population Science, Beckman Research Institute, City of Hope, Duarte. California, USA. 112International Epidemiology Institute, Rockville, Maryland, USA. 113Division of Public Health Sciences, Wake Forest University School of Medicine, Winston-Salem, North Carolina, USA. 114Section on Gerontology and Geriatric Medicine, Department of Internal Medicine, Wake Forest School of Medicine, Winston-Salem, North Carolina, USA. 115Health Disparities Research Section, Laboratory of Population Science, NIA, NIH, Baltimore, Maryland, USA. 116National Heart, Lung and Blood Institute (NHLBI) Framingham Heart Study, Framingham, Massachusetts, USA. 117NHLBI Center for Population Studies, Framingham, Massachusetts, USA. 118Division of Endocrinology, Brigham and Women’s Hospital and Harvard Medical School, Boston, Massachusetts, USA. 119Department of Nutrition Sciences, University of Alabama at Birmingham and the Birmingham VA Medical Center, Birmingham, Alabama, USA. 120The Center for Applied Genomics, The Children’s Hospital of Philadelphia Research Institute, The Children’s Hospital of Philadelphia, Philadelphia, Pennsylvania, USA. 121Division of Human Genetics, The Children’s Hospital of Philadelphia Research Institute, The Children’s Hospital of Philadelphia, Philadelphia, Pennsylvania, USA. 122Department of Pediatrics, Perelman School of Medicine at the University of Pennsylvania, Philadelphia, Pennsylvania, USA. 123Institute of Diabetes, Obesity and Metabolism, Perelman School of Medicine at the University of Pennsylvania, Philadelphia, Pennsylvania, USA. 124Cancer Prevention Institute of California, Fremont, California, USA. 125Division of Epidemiology, Department of Health Research and Policy, Stanford University School of Medicine, Stanford, California, USA. 126Stanford Cancer Institute, Stanford University School of Medicine, Stanford, California, USA. 127Department of Health Studies, University of Chicago, Chicago, Illinois, USA. 128Department of Medicine, University of Illinois at Chicago, Chicago, Illinois, USA. 129Southwest Oncology Group (SWOG) Statistical Center, Seattle, Washington, USA. 130Glickman Urologic and Kidney Institute, Cleveland Clinic, Cleveland, Ohio, USA. 131Epidemiology Program, University of Hawaii Cancer Center, Honolulu, Hawaii, USA. 132Department of Epidemiology, School of Public Health, University of California at Los Angeles, Los Angeles, California, USA. 133Department of Biostatistics, University of Washington, Seattle, Washington, USA. 134Center for Health Policy and Health Services Research, Henry Ford Health System, Detroit, Michigan, USA. 135Department of Internal Medicine, Henry Ford Health System, Detroit, Michigan, USA. 136Division of Sleep Medicine, Brigham and Women’s Hospital, Boston, Massachusetts, USA. 137Department of Urology, The University of Texas MD Anderson Cancer Center, Houston, Texas, USA. 138Department of Epidemiology and Health Services, University of Washington, Seattle, Washington, USA. 139Group Health Research Institute, Group Health Cooperative, Seattle, Washington, USA. 140Department of Medicine, Brigham and Women’s Hospital, Boston, Massachusetts, USA. 141Center for Public Health Genomics, University of Virginia, Charlottesville, Virginia, USA. 142Department of Medicine, University of Virginia, Charlottesville, Virginia, USA. 143Department of Biochemistry and Molecular Genetics, University of Virginia, Charlottesville, Virginia, USA. 144Department of Epidemiology, Harvard School of Public Health, Boston, Massachusetts, USA. 145Institute for Quantitative Biomedical Sciences, The Geisel School of Medicine, Dartmouth College, Lebanon, New Hampshire, USA. 146Department of Genetics, The Geisel School of Medicine, Dartmouth College, Lebanon, New Hampshire, USA. 147Department of Community and Family Medicine, The Geisel School of Medicine, Dartmouth College, Lebanon, New Hampshire, USA. 148Division of Biology and Biomedical Sciences, Human and Statistical Genetics Program, Washington University, St. Louis, Missouri, USA. 149Department of Epidemiology and Biostatistics, Case Western Reserve University, Cleveland, Ohio, USA. 150Behavioral Epidemiology Section, Laboratory of Population Science, NIA, NIH, Baltimore, Maryland, USA. 151A list of contributing members appears in the supplementary Note. 152Division of Prevention and Population Sciences, NHLBI, NIH, Bethesda, Maryland, USA. 153The Genetics of Obesity and Related Metabolic Traits Program, The Icahn School of Medicine at Mount Sinai, New York, New York, USA. 154The Mindich Child Health and Development Institute, The Icahn School of Medicine at Mount Sinai, New York, New York, USA. 155Deceased. 156These authors contributed equally to this work. 157These authors jointly directed this work. Correspondence should be addressed to K.E.N. ([email protected]) or C.A.H. ([email protected]).
l e t t e r snp
g©
201
3 N
atur
e A
mer
ica,
Inc.
All
right
s re
serv
ed.
Nature GeNeticsdoi:10.1038/ng.2608
oNLINEMEThodSStudy design. We used a three-stage design consisting of a GWAS meta-analysis (stage 1), a follow-up of 1,500 SNPs (stage 2) and a focused follow-up of the three new loci (stage 3). Stage 1 included results from 36 GWAS of 39,144 men and women of African ancestry (37,956 African American and 1,188 African; Supplementary Table 1). We took forward the 1,500 most significantly associ-ated SNPs (P < 0.0003) for examination in 6,817 additional men and women of African ancestry from seven GWAS (stage 2, all African American). The three SNPs that reached genome-wide significance (P < 5 × 10⁻⁸) after the meta-analysis of the results from stages 1 and 2 were taken forward for further confirmation in 25,451 additional African-ancestry subjects from 12 stud-ies. All participants in these studies provided written informed consent for the research, and approval for the study was obtained from the ethics review boards at all participating institutions. A description of each participating study as well as details regarding the measurement and collection of height and weight data are provided in the Supplementary Note.
Genotyping and quality control. Genotyping in each study was conducted using Illumina or Affymetrix genome-wide SNP arrays. The size of each study ranged from 50 to 8,421 individuals. The details of the array, genotyping quality- control procedures and sample exclusions for each study that contributed data are listed in Supplementary Tables 1 and 2.
Statistical analyses. In all GWAS, imputation to phased haplotype data from the founders of the CEU and YRI HapMap phase 2 samples (build 21) was performed using MACH34, IMPUTE2 (ref. 35) or BEAGLE36. SNPs with lower imputation quality scores (r2 < 0.3) (Supplementary Table 2) as well as SNPs with a small number of allele counts after stratifying by sex and case-control status were excluded from the analyses. Local ancestry, defined as the number of European chromosomes (continuous between 0 and 2), was estimated for the majority of the stage 1 African-ancestry studies (Supplementary Table 8) using HAPMIX37. To evaluate the effect of admixture on the allele distribution between the African and European segments, we stratified the analysis of each variant by local ancestry at each locus (Supplementary Table 9).
Stage 1. Genome-wide association analyses were performed by each of the participating studies. BMI was regressed on age, age squared and study site (if needed) to obtain residuals, separately by sex and case-control status, if needed. Residuals were inverse-normally transformed to obtain a stand-ard normal distribution with a mean of 0 and an s.d. of 1. For studies with unrelated subjects, each SNP was tested for additive association with BMI by regressing the transformed residuals on the number of copies of the SNP effect allele adjusting for population structure as measured by the first ten eigenvectors calculated for each study. Analyses were stratified by sex and case-control status (if needed). For studies that included related individuals, family based association tests were conducted that took into consideration the genetic relationships among the individuals. Study-specific λ values ranged from 0.95 to 1.08 (Supplementary Table 2). We applied genomic control in the stage 1 analysis (that is, we divided by the median of all χ2 statistics for each study) to eliminate any remaining overdispersion before combining the GWAS in the meta-analysis. In stage 1, we conducted a fixed-effect meta-analysis using the inverse variance–weighted method implemented in the program METAL38. We performed a second genomic control correction of the stage 1 meta-analysis results (λ = 1.136) before selecting SNPs for follow-up.
Stages 2 and 3. The 1,500 most significant SNPs from stage 1 were examined in an additional 6,817 individuals, with each SNP being analyzed as described for stage 1 and meta-analyzed using the inverse-variance method using METAL. As in stage 1, each SNP was tested for association with BMI by regressing the transformed residuals on the number of copies of the SNP effect allele adjusting for population structure as measured by the first ten eigenvectors calculated for each study. Further testing of the three new variants was con-ducted in an additional 25,451 individuals (stage 3). Results from all stages were meta-analyzed using the inverse-variance method in METAL.
Examination in individuals of European ancestry. We also examined the 1,500 most statistically significant SNPs from stage 1 in the GIANT consortium
(n = 123,706 individuals of European ancestry)7. Of these, 1,390 were geno-typed or imputed in GIANT, and 1,328 had data for n > 50,000 individuals and MAF > 1%. We conducted a meta-analysis of stages 1, 2 and 3 plus GIANT in the same manner as described above. The three new variants were also examined in the AGEN and RIKEN consortia9,10 and the Pediatric Research Consortium (PeRC) (Supplementary Note).
Estimation of variance explained. The total fraction of variance explained was calculated using the formula 2f(1 – f) × a2, where f is the frequency of the variant, and a is the additive effect of the variant3. When calculating percentage variance explained in the African-ancestry sample for the previously discov-ered BMI variants that were not genome-wide significant in stage 1, we used data from the stage 1 sample; for those that were genome-wide significant in stage 1, we used data from the stage 2 sample; and for the new BMI variants, we used data from the combined stage 2 and 3 samples to avoid inflating the estimates as a result of winner’s curse. When summing percentage variance explained for the 36 previously discovered BMI variants (Supplementary Table 12), we used the more informative SNP discovered through fine mapping at the seven loci (Supplementary Table 13). However, for these seven variants, the stage 1 results were used, and estimates may be biased; stage 2 and 3 studies only participated in the look-up of the top SNPs from the preceding stages.
Bioinformatic analysis of the new BMI loci. In an attempt to identify func-tionality in noncoding regions at the three loci, we used FunciSNP version 0.99 (ref. 39), which systematically integrates the 1,000 Genomes SNP data (1KGP, April 2012) with chromatin features of interest. To capture regula-tory elements, we used 73 different chromatin features generated by next- generation sequencing technologies in brain and adipose tissues from the NIH Epigenomics Roadmap40, as well as known DNaseI hypersensitive locations, formaldehyde-assisted isolation of regulatory elements sequencing (FAIRE-seq) peaks and CTCF binding sites from more than 100 different cell types, which were collected from the ENCODE data41. All SNPs with r2 > 0.5 with each index SNP in the 1KGP AFR populations in a 1-Mb window around each index variant were cataloged. We used the UCSC Genome Browser (http://genome.ucsc.edu/) to illustrate the correlated SNPs that overlap chromatin features from these tissues, as well as chromatin features from seven cell lines used in the ENCODE Project (Supplementary Fig. 5a–c). The results from these analyses are provided in Supplementary Tables 16–19.
eQTL analyses. Liver, subcutaneous fat and omental fat tissue. The determi-nation of eQTLs in liver, subcutaneous fat and omental fat tissue have been described in detail previously27. In brief, liver, subcutaneous fat and omental fat tissue were obtained from patients of European ancestry who underwent bariatric surgery. Expression of a total of 39,280 oligonucleotide probes target-ing transcripts representing 34,266 known and predicted genes was assessed. All patients were genotyped on a genome-wide SNP array, and association between SNPs and gene expression data was adjusted for age, race, gender and surgery year using linear regression. Results are presented in Supplementary Table 14 and Supplementary Figure 4.
Brain cortical tissue. We examined the cis associations (defined as genes within 1 Mb) between each of the BMI-associated SNPs and expression of nearby genes in brain (cortical tissue)28. The eQTL analyses have been described in detail previously (Gene Expression Omnibus (GEO) database GSE8919)28. In brief, DNA and RNA of neuropathologically normal cortical brain samples of 193 individuals (average age (range), 81 (65–100) years) of European ancestry were isolated and genotyped for a genome-wide SNP array, and HapMap genotypes were imputed. RNA expression was assessed for 24,357 transcripts, of which 14,078 transcripts met the quality-control criteria. Association analyses between SNPs and expression data assumed an additive model and were adjusted for sex and age at death. Results are presented in Supplementary Table 14 and Supplementary Figure 4.
Association testing of previously established BMI loci. To characterize alleles that might better represent the biologically functional variant at the 36 previ-ously discovered BMI loci, we searched for LD proxies among individuals
npg
© 2
013
Nat
ure
Am
eric
a, In
c. A
ll rig
hts
rese
rved
.
Nature GeNetics doi:10.1038/ng.2608
of African ancestry. Using HapMap data (CEU or JPT/CHB) to estimate LD, we identified all SNPs that were correlated (r2 ≥ 0.4) with the index SNP (within 250 kb or larger to include a nearby gene). Next we tested these SNPs for asso-ciation with BMI in the stage 1 African-ancestry sample. We applied a locus- specific significance criterion, α, which accounts for multiple testing (the number of tag SNPs in the HapMap YRI population that capture (at r2 ≥ 0.8) all common SNPs (with MAF ≥ 0.05) correlated with the index signal in the HapMap CEU or JPT/CHB populations). This α level does not account for the number of regions evaluated and reflects a balance between the need to correct for multiple comparisons and the prior knowledge that each region harbors a risk variant for BMI. We also looked for new independent associations, focus-ing on the genotyped and imputed SNPs that were uncorrelated with the index signal in the initial GWAS populations (r2 < 0.2). We applied a Bonferroni correction for defining new associations as significant in each region as 0.05 divided by the total number of tags needed to capture (at r2 ≥ 0.8) all common risk alleles across all risk regions in the YRI population (α = 6.7 × 10⁻⁶).
Detection of recent positive selection in Africans and Europeans at a new BMI locus. We evaluated the evidence for recent positive selection at our new loci using several statistical techniques, the BioVU African-American GWAS data and data from the International HapMap Project and the Human Genome Diversity Project (HGDP). We compared adjusted allele frequencies among BioVU and HapMap phase 3 participants from the west African Yoruban (YRI) and east African Luhya (LWK) populations using Treeselect42. The LWK sample is differentiated from the YRI sample and samples of African Americans43. Allele frequencies in the African-American sample were adjusted by subtracting the expected contribution of European alleles, where pAA is the allele frequency in African Americans obtained from experimental data, pEA is the allele frequency in Europeans obtained from HapMap, pAF is the estimated allele frequency in African founders and α is the average propor-tion of ancestry from Europeans, or 0.2. The adjustment is then performed by solving the following expression for pAF:
p p pAF
AA EA= −−aa( )1
We also evaluated the HapMap phase 2 and HGDP data with the integrated haplotype score (iHS)44 and Haplotter and the crosspopulation-extended haplotype homozygosity (XP-EHH) statistic using the HGDP selection browser45,46. We also evaluated the BioVU data using 5,000 random autosomal SNPs with STRUCTURE v2.3.3, and on average, the participants were 20.7% European and 79.3% of African ancestry47,48.
We observed evidence for recent selection near KLHL32 within the YRI HapMap data using iHS (Supplementary Fig. 4) and in the HGPD African participants (Supplementary Fig. 5a–d). Nominal evidence of selection was observed within the YRI and African-American populations using the Treeselect statistic with the transcription factor binding–site SNP rs1206131 (P = 0.003 in
the African Americans and P = 0.005 in YRI) and at the SNP rs9387284 (P = 0.004 in the YRI and P = 0.026 in the African Americans) (Supplementary Fig. 6a,b). The Treeselect method also demonstrated a significant allele frequency dif-ferentiation between African and African-ancestry populations (Fst ~0.01) at the transcription factor binding–site SNP rs1206131. rs1206131 is the most significant SNP for this test in the region ±400 kb. The test from the African-American branch of the tree was slightly less significant at rs1206131, and the most significant SNP was downstream, which is also under the iHS and XP-EHH peaks from Africans in the HGDP and HapMap data. The graph of HGDP allele frequencies at this SNP shows that the ancestral T allele has increased frequencies throughout Africa relative to other major global populations (Supplementary Fig. 7). The average (s.d., maximum) Fst value in this region between the YRI and African-American populations was 0.001 (0.001, 0.015), between the YRI and CEU populations was 0.040 (0.045, 0.304) and between the African-American and CEU populations was 0.011 (0.013, 0.082).
34. Li, Y., Willer, C.J., Ding, J., Scheet, P. & Abecasis, G.R. MaCH: using sequence and genotype data to estimate haplotypes and unobserved genotypes. Genet. Epidemiol. 34, 816–834 (2010).
35. Howie, B.N., Donnelly, P. & Marchini, J. A flexible and accurate genotype imputation method for the next generation of genome-wide association studies. PLoS Genet. 5, e1000529 (2009).
36. Browning, S.R. & Browning, B.L. Rapid and accurate haplotype phasing and missing-data inference for whole-genome association studies by use of localized haplotype clustering. Am. J. Hum. Genet. 81, 1084–1097 (2007).
37. Price, A.L. et al. Sensitive detection of chromosomal segments of distinct ancestry in admixed populations. PLoS Genet. 5, e1000519 (2009).
38. Willer, C.J., Li, Y. & Abecasis, G.R. METAL: fast and efficient meta-analysis of genomewide association scans. Bioinformatics 26, 2190–2191 (2010).
39. Coetzee, S.G., Rhie, S.K., Berman, B.P., Coetzee, G.A. & Noushmehr, H. FunciSNP: an R/bioconductor tool integrating functional non-coding data sets with genetic association studies to identify candidate regulatory SNPs. Nucleic Acids Res. 40, e139 (2012).
40. Bernstein, B.E. et al. The NIH Roadmap Epigenomics Mapping Consortium. Nat. Biotechnol. 28, 1045–1048 (2010).
41. Ernst, J. et al. Mapping and analysis of chromatin state dynamics in nine human cell types. Nature 473, 43–49 (2011).
42. Bhatia, G. et al. Genome-wide comparison of African-ancestry populations from CARe and other cohorts reveals signals of natural selection. Am. J. Hum. Genet. 89, 368–381 (2011).
43. Murray, T. et al. African and non-African admixture components in African Americans and an African Caribbean population. Genet. Epidemiol. 34, 561–568 (2010).
44. Voight, B.F., Kudaravalli, S., Wen, X. & Pritchard, J.K. A map of recent positive selection in the human genome. PLoS Biol. 4, e72 (2006).
45. Pickrell, J.K. et al. Signals of recent positive selection in a worldwide sample of human populations. Genome Res. 19, 826–837 (2009).
46. Sabeti, P.C. et al. Genome-wide detection and characterization of positive selection in human populations. Nature 449, 913–918 (2007).
47. Pritchard, J.K., Stephens, M. & Donnelly, P. Inference of population structure using multilocus genotype data. Genetics 155, 945–959 (2000).
48. Falush, D., Stephens, M. & Pritchard, J.K. Inference of population structure using multilocus genotype data: linked loci and correlated allele frequencies. Genetics 164, 1567–1587 (2003).
npg
© 2
013
Nat
ure
Am
eric
a, In
c. A
ll rig
hts
rese
rved
.