Genome-wide association and large-scale follow up identifies 16 new loci influencing lung function
11
© 2011 Nature America, Inc. All rights reserved. © 2011 Nature America, Inc. All rights reserved. 1082 VOLUME 43 | NUMBER 11 | NOVEMBER 2011 NATURE GENETICS ARTICLES Pulmonary function measures reflect respiratory health and are used in the diagnosis of chronic obstructive pulmonary disease. We tested genome-wide association with forced expiratory volume in 1 second and the ratio of forced expiratory volume in 1 second to forced vital capacity in 48,201 individuals of European ancestry with follow up of the top associations in up to an additional 46,411 individuals. We identified new regions showing association (combined P < 5 × 10 −8 ) with pulmonary function in or near MFAP2, TGFB2, HDAC4, RARB, MECOM (also known as EVI1), SPATA9, ARMC2, NCR3, ZKSCAN3, CDC123, C10orf11, LRP1, CCDC38, MMP15, CFDP1 and KCNE2. Identification of these 16 new loci may provide insight into the molecular mechanisms regulating pulmonary function and into molecular targets for future therapy to alleviate reduced lung function. by ever-smoking versus never-smoking status. We performed the meta-analyses of the smoking strata within each study and of the study-specific results using inverse-variance weighting (and used the inverse of the standard error squared as the weight). We applied genomic control twice at the study level (to each smoking stratum separately and to the study-level pooled estimates) and also at the meta-analysis level to avoid inflation of the test statistics caused by cryptic population structure or relatedness (see Supplementary Table 1a for study-level estimates). Our application of genomic control at the three stages is likely to be overly conservative because it has recently been shown that in large meta-analyses, test statistics are expected to be elevated under polygenic inheritance even when there is no population structure 12 . The test statistic inflation (λ GC ) before apply- ing genomic control at the meta-analysis level was 1.12 for FEV 1 and 1.09 for FEV 1 /FVC. Genomic inflation estimates increase with sample size, as has been shown for other traits 13–15 ; the standardized estimates to a sample of 1,000 individuals (λ GC_1,000 ) were 1.002 for FEV 1 and 1.002 for FEV 1 /FVC. Plots of the meta-analysis P values for FEV 1 and FEV 1 /FVC against a uniform distribution of P values expected under the null hypothesis showed deviations which were attenuated, but which persisted, after removal of SNPs in loci reported previously, consistent with additional loci being associated with lung function (Supplementary Fig. 1a). Follow-up analysis (stage 2) Twenty-nine new loci showing evidence of association with lung function (P < 3 × 10 −6 ) in stage 1 were followed up in stage 2 by using in silico data from seven studies and by undertaking additional genotyping in ten studies for the ten highest ranked SNPs (Fig. 1). Full details of the SNP selection are given in the Online Methods. We performed an inverse-variance–weighting meta-analysis across stages 1 and 2 and obtained two-sided P values for the pooled estimates. Sixteen new loci reached genome-wide significance (P < 5 × 10 −8 ) and showed consistent direction of effects in both stages, comprising 12 new loci for FEV 1 /FVC, 3 new loci for FEV 1 and 1 new locus reaching Genome-wide association and large-scale follow up identifies 16 new loci influencing lung function Pulmonary function, reliably measurable by spirometry, is a herit- able trait reflecting the physiological state of the airways and lungs 1 . Pulmonary function measures are important predictors of population morbidity and mortality 2–4 and are used in the diagnosis of chronic obstructive pulmonary disease (COPD), which ranks among the leading causes of death in developed and developing countries 5,6 . A reduced ratio of forced expiratory volume in 1 second (FEV 1 ) to forced vital capacity (FVC) is used to define airway obstruction, and a reduced FEV 1 is used to grade the severity of airway obstruction 7 . Recently, two large genome-wide association studies (GWAS), each comprising discovery sets of more than 20,000 individuals of European ancestry, identified new loci for lung function 8,9 . Recognizing the need for larger data sets to increase the power to detect loci of indi- vidually modest effect size, we conducted a meta-analysis of 23 lung function GWAS comprising a total of 48,201 individuals of European ancestry (stage 1) and followed up potentially new loci in 17 further studies comprising up to 46,411 individuals (stage 2). We identified 16 additional new loci for lung function and provided evidence corrobo- rating the association of loci previously associated with lung func- tion 8–11 . Our findings implicate a number of different mechanisms underlying regulation of lung function and highlight loci shared with complex traits and diseases, including height, lung cancer and myo- cardial infarction. RESULTS Genome-wide analysis (stage 1) We undertook meta-analyses for cross-sectional lung function meas- ures for approximately 2.5 million genotyped or imputed SNPs across 23 studies with a combined sample size of 48,201 adult individu- als of European ancestry. Characteristics of the cohort participants and the genotyping are shown in Supplementary Table 1a and b. We adjusted FEV 1 and FEV 1 /FVC measures for ancestry principal components, age, age 2 , sex and height as covariates. Our association testing of the inverse-normal–transformed residuals for FEV 1 and FEV 1 /FVC assumed an additive genetic model and was stratified A full list of author affiliations appears at the end of the paper. Received 20 April; accepted 19 August; published online 25 September 2011; doi:10.1038/ng.941
-
Upload
independent -
Category
Documents
-
view
1 -
download
0
Transcript of Genome-wide association and large-scale follow up identifies 16 new loci influencing lung function

© 2
011
Nat
ure
Am
eric
a, In
c. A
ll ri
gh
ts r
eser
ved
.©
201
1 N
atu
re A
mer
ica,
Inc.
All
rig
hts
res
erve
d.
1082 VOLUME 43 | NUMBER 11 | NOVEMBER 2011 Nature GeNetics
A rt i c l e s
Pulmonaryfunctionmeasuresreflectrespiratoryhealthandareusedinthediagnosisofchronicobstructivepulmonarydisease.Wetestedgenome-wideassociationwithforcedexpiratoryvolumein1secondandtheratioofforcedexpiratoryvolumein1secondtoforcedvitalcapacityin48,201individualsofEuropeanancestrywithfollowupofthetopassociationsinuptoanadditional46,411individuals.Weidentifiednewregionsshowingassociation(combinedP<5×10⁻⁸)withpulmonaryfunctioninornearMFAP2,TGFB2,HDAC4,RARB,MECOM(alsoknownasEVI1),SPATA9,ARMC2,NCR3,ZKSCAN3,CDC123,C10orf11,LRP1,CCDC38,MMP15,CFDP1andKCNE2.Identificationofthese16newlocimayprovideinsightintothemolecularmechanismsregulatingpulmonaryfunctionandintomoleculartargetsforfuturetherapytoalleviatereducedlungfunction.
by ever-smoking versus never-smoking status. We performed the meta-analyses of the smoking strata within each study and of the study-specific results using inverse-variance weighting (and used the inverse of the standard error squared as the weight). We applied genomic control twice at the study level (to each smoking stratum separately and to the study-level pooled estimates) and also at the meta-analysis level to avoid inflation of the test statistics caused by cryptic population structure or relatedness (see Supplementary Table 1a for study-level estimates). Our application of genomic control at the three stages is likely to be overly conservative because it has recently been shown that in large meta-analyses, test statistics are expected to be elevated under polygenic inheritance even when there is no population structure12. The test statistic inflation (λGC) before apply-ing genomic control at the meta-analysis level was 1.12 for FEV1 and 1.09 for FEV1/FVC. Genomic inflation estimates increase with sample size, as has been shown for other traits13–15; the standardized estimates to a sample of 1,000 individuals (λGC_1,000) were 1.002 for FEV1 and 1.002 for FEV1/FVC. Plots of the meta-analysis P values for FEV1 and FEV1/FVC against a uniform distribution of P values expected under the null hypothesis showed deviations which were attenuated, but which persisted, after removal of SNPs in loci reported previously, consistent with additional loci being associated with lung function (Supplementary Fig. 1a).
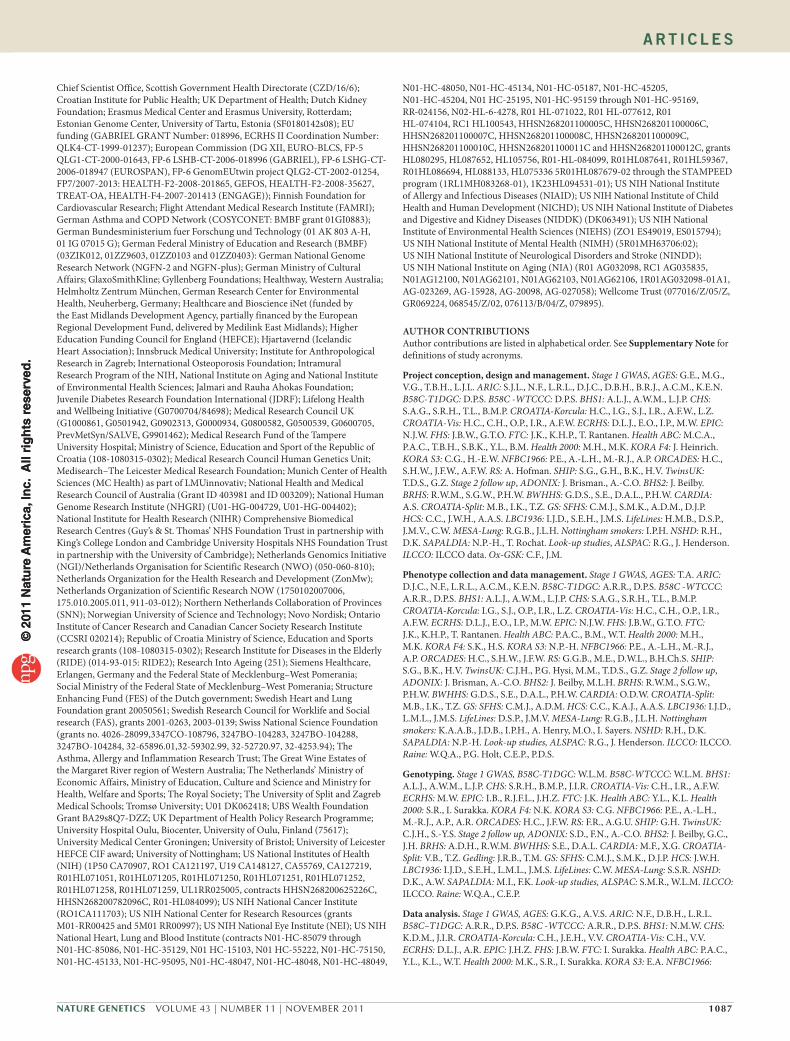
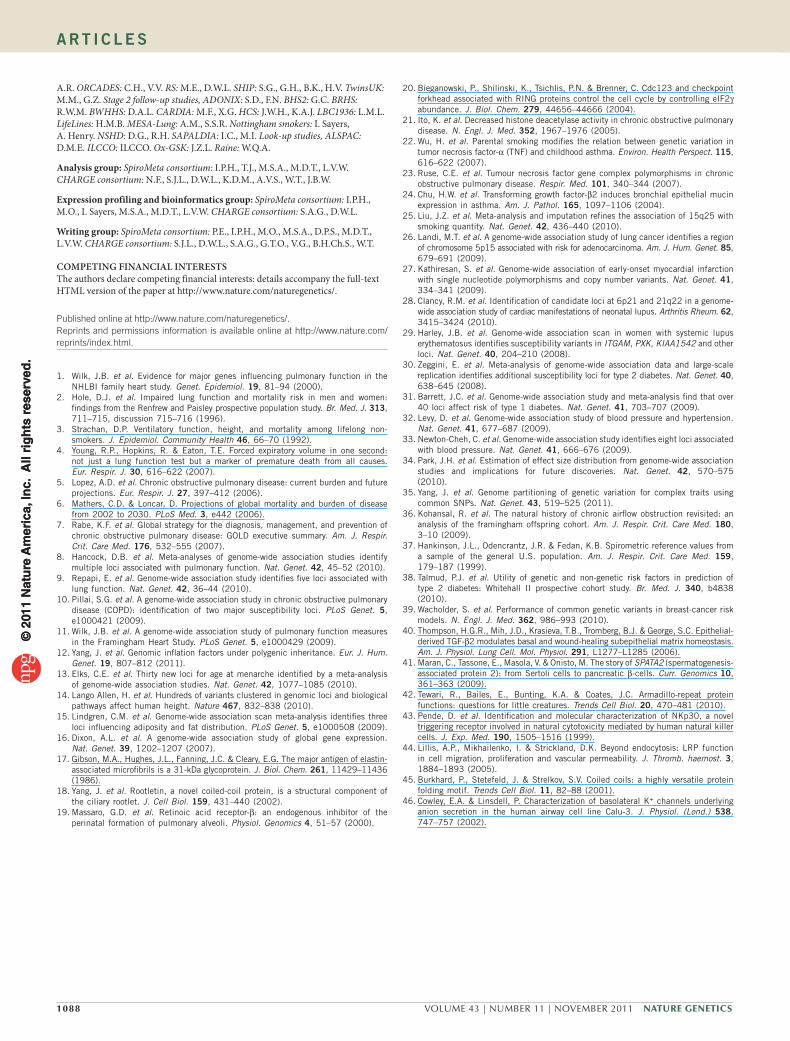
Follow-upanalysis(stage2)Twenty-nine new loci showing evidence of association with lung function (P < 3 × 10⁻⁶) in stage 1 were followed up in stage 2 by using in silico data from seven studies and by undertaking additional genotyping in ten studies for the ten highest ranked SNPs (Fig. 1). Full details of the SNP selection are given in the Online Methods. We performed an inverse-variance–weighting meta-analysis across stages 1 and 2 and obtained two-sided P values for the pooled estimates. Sixteen new loci reached genome-wide significance (P < 5 × 10⁻⁸) and showed consistent direction of effects in both stages, comprising 12 new loci for FEV1/FVC, 3 new loci for FEV1 and 1 new locus reaching
Genome-wide association and large-scale follow up identifies 16 new loci influencing lung function
Pulmonary function, reliably measurable by spirometry, is a herit-able trait reflecting the physiological state of the airways and lungs1. Pulmonary function measures are important predictors of population morbidity and mortality2–4 and are used in the diagnosis of chronic obstructive pulmonary disease (COPD), which ranks among the leading causes of death in developed and developing countries5,6. A reduced ratio of forced expiratory volume in 1 second (FEV1) to forced vital capacity (FVC) is used to define airway obstruction, and a reduced FEV1 is used to grade the severity of airway obstruction7.
Recently, two large genome-wide association studies (GWAS), each comprising discovery sets of more than 20,000 individuals of European ancestry, identified new loci for lung function8,9. Recognizing the need for larger data sets to increase the power to detect loci of indi-vidually modest effect size, we conducted a meta-analysis of 23 lung function GWAS comprising a total of 48,201 individuals of European ancestry (stage 1) and followed up potentially new loci in 17 further studies comprising up to 46,411 individuals (stage 2). We identified 16 additional new loci for lung function and provided evidence corrobo-rating the association of loci previously associated with lung func-tion8–11. Our findings implicate a number of different mechanisms underlying regulation of lung function and highlight loci shared with complex traits and diseases, including height, lung cancer and myo-cardial infarction.
RESULTSGenome-wideanalysis(stage1)We undertook meta-analyses for cross-sectional lung function meas-ures for approximately 2.5 million genotyped or imputed SNPs across 23 studies with a combined sample size of 48,201 adult individu-als of European ancestry. Characteristics of the cohort participants and the genotyping are shown in Supplementary Table 1a and b. We adjusted FEV1 and FEV1/FVC measures for ancestry principal components, age, age2, sex and height as covariates. Our association testing of the inverse-normal–transformed residuals for FEV1 and FEV1/FVC assumed an additive genetic model and was stratified
A full list of author affiliations appears at the end of the paper.
Received 20 April; accepted 19 August; published online 25 September 2011; doi:10.1038/ng.941

© 2
011
Nat
ure
Am
eric
a, In
c. A
ll ri
gh
ts r
eser
ved
.©
201
1 N
atu
re A
mer
ica,
Inc.
All
rig
hts
res
erve
d.
Nature GeNetics VOLUME 43 | NUMBER 11 | NOVEMBER 2011 1083
A rt i c l e s
genome-wide significance for both traits (Fig. 2 and Table 1). To assess the heterogeneity across the studies included in stage 1 and 2, we performed χ2 tests for all 16 SNPs, and none of these SNPs was statistically significant after applying a Bonferroni correction for 16 tests. The sentinel SNPs at these loci were in or near MFAP2 (1p36.13), TGFB2-LYPLAL1 (1q41), HDAC4-FLJ43879 (2q37.3), RARB (3p24.2), MECOM (also known as EVI1) (3q26.2), SPATA9-RHOBTB3 (5q15), ARMC2 (6q21), NCR3-AIF1 (6p21.33), ZKSCAN3 (6p22.1), CDC123 (10p13), C10orf11 (10q22.3), LRP1 (12q13.3), CCDC38 (12q22), MMP15 (16q13), CFDP1 (16q23.1) and KCNE2-LINC00310 (also known as C21orf82) (21q22.11) (Supplementary Fig. 1b,c). The strongest signals in AGER (rs2070600)8,9 and two of the new signals (rs6903823 in ZKSCAN3 and rs2857595, upstream of NCR3) lie within a ~3.8-Mb interval at 6p21.32-22.1 that is char-acterized by long-range linkage disequilibrium (LD). Nevertheless, the leading SNPs in these regions, which are within the major his-tocompatibility complex (MHC), were statistically independent (Supplementary Note).
GeneexpressionWe investigated mRNA expression of the nearest gene for each of the 16 new loci in human lung tissue and a range of human primary cells including lung, brain, airway smooth muscle cells and bronchial epithelial cells. We detected transcripts for all the selected genes in lung tissue except CCDC38, and we also detected transcripts for most genes in airway smooth muscle cells and in bronchial epithelial cells (Table 2). As we were unable to detect expression of CCDC38 in any tissue, we also examined expression of SNPRF, which is the gene adjacent to CCDC38 (Table 2), and found its expression in all four cell types. TGFB2, MFAP2, EVI1 and MMP15 were expressed in one or more lung cell types but not in peripheral blood mononuclear cells, providing evidence that these genes may show tissue-specific expression.
We assessed whether SNPs in these new regions or their prox-ies (r2 > 0.6) were associated with gene expression using a data-base of expression-associated SNPs in lymphoblastoid cell lines16. Four loci showed regional (cis) effects on expression (P < 1 × 10⁻⁷; Supplementary Note). A proxy for our sentinel SNP in CFDP1, rs2865531, coincided with the peak of the expression signal for CFDP1, and the strongest proxy for rs6903823 in ZKSCAN3 coincided with the peak of expression for ZSCAN12.
PlausiblepathwaysforlungfunctioninvolvingnewlociThe putative function of the genes within, or closest to, the asso-ciation peaks identify a range of plausible mechanisms for affect-ing lung function. The most statistically significant new signal for FEV1/FVC (P = 7.5 × 10⁻¹⁶) was in the gene encoding MFAP2, an antigen of elastin-associated microfibrils17, although correlated SNPs in the region potentially implicate other genes that could plausibly influence lung function, such as CROCC, which encodes rootletin, a component of cilia18. Our second strongest new signal, also for FEV1/FVC, was in RARB, the gene encoding the retinoic acid recep-tor β. Rarb-null knockout mice have premature alveolar septation19. The third most statistically significant new signal for FEV1/FVC, and the most statistically significant new signal for FEV1, was in CDC123.
20a bFEV1/FVC FEV1
18161412
12
MFAP2 RARB
SPATA9NCR3
CDC123
LRP1
CCDC38 CFDP1 MECOM
ZKSCAN3
CDC123C10orf11
MMP15KCNE2ARMC2
HDAC4TGFB2
108–l
og10
P
–log
10 P
6420
10
8
6
4
2
01 2 3 4 5 6 7 8
Chromosome Chromosome9 11 13 1 2 3 4 5 6 7 8 9 11 13 15 18 2215 18 22
Figure 2 Manhattan plots of association results for FEV1/FVC and FEV1 (analysis stage 1). The Manhattan plots for FEV1/FVC (a) and FEV1 (b) are ordered by chromosome position. SNPs for which −log10 P > 5 are indicated in red. Newly associated regions that reached genome-wide significance after meta-analysis of stages 1 and 2 are labeled.
Stage 1 (genome-wideassociation studies)n = 48,201
AGES (n = 1,689) ADONIX (n = 1,410)
rs10067603
rs11172113
rs12447804
rs12716852
rs12914385
rs1344555
rs153916
rs1541374
rs1878798
rs1928168
rs2036527
rs2544527
rs2647044
+
rs2798641
rs2855812
rs3094548
rs3734729
rs3769124
rs4762767
rs6903823
rs8040868
rs9310995
rs993925
rs9978142
BRHS (n = 3,862)
BHS2 (n = 3,038)
BWHHS (n = 3,635)
Gedling (n = 1,266)
HCS (n = 2,848)
Nottingham Smokers (n = 521)
NSHD (n = 2,511)
SAPALDIA (n = 5,646)
CARDIA (n = 1,626)*
CROATIA-SPLIT (n = 491)*
GS:SFHS (n = 10,399)#
LBC1936 (n = 991)*
LifeLines (n = 3,078)*
MESA-Lung (n = 1,469)*
RS-III (n = 1,247)*
TwinsUK-II (n = 2,373)*
ARIC (n = 9,078)B58C T1DGC (n = 2,343)B58C WTCCC (n = 1,372)BHS1 (n = 1,168)CHS (n = 3,140)CROATIA-Korcula (n = 825)CROATIA-Vis (n = 769)ECRHS (n = 1,594)EPIC obese cases (n = 1,104)EPIC population based (n = 2,336)FHS (n = 7,911)FTC (n = 134)Health ABC (n = 1,472)Health 2000 (n = 821)KORA F4 (n = 904)KORA S3 (n = 555)NFBC1966 (n = 4,556)ORCADES (n = 692)RS-I (n = 1,224)RS-II (n = 852)SHIP (n = 1,777)Twins UK-I (n = 1,885)
Stage 2 (follow up of10 SNPs only)n = 24,737
Stage 2 (follow up of up to 34 SNPs)n = 21,674
SNPsfollowed up
rs1036429rs11001819rs12477314rs1529672rs1551943rs2284746rs2857595rs2865531rs3743563rs7068966
Figure 1 Study design. We followed up in stage 2 a total of 34 SNPs showing new evidence of association (P < 3 × 10⁻⁶) with FEV1 and/or FEV1/FVC in a meta-analysis of the stage 1 studies. Studies with a combined total of 24,737 individuals undertook genotyping and association testing of the top ten SNPs. Seven studies (marked with an asterisk) with a combined total of 11,275 individuals had genome-wide association data and provided results for up to 34 SNPs. Researchers from GS: SFHS (marked with #) undertook genotyping on a 32-SNP multiplex genotyping platform and so included the 32 top ranking SNPs (including proxies and both SNPs from regions that showed association with both FEV1 and FEV1/FVC). This assay failed for one SNP (rs3769124), which was subsequently replaced with the thirty-third SNP (rs4762767). We excluded rs2284746 because of poor clustering. Although rs3743563 was chosen as proxy for rs12447804, which had an effective N < 80% in the stage 1 meta-analysis, researchers from BHS2 were unable to genotype rs3743563 and so undertook genotyping for rs12447804 instead. See table 1 for definitions of all study abbreviations.

© 2
011
Nat
ure
Am
eric
a, In
c. A
ll ri
gh
ts r
eser
ved
.©
201
1 N
atu
re A
mer
ica,
Inc.
All
rig
hts
res
erve
d.
1084 VOLUME 43 | NUMBER 11 | NOVEMBER 2011 Nature GeNetics
A rt i c l e s
This was the only new region to show genome-wide association with both traits. CDC123 encodes a homolog of a yeast cell-division–cycle protein that plays a critical role in modulating eukaryotic initiation factor 2 in times of cell stress20. The fourth signal for FEV1/FVC is downstream of HDAC4, which encodes a histone deacetylase; reductions in the expression of other histone deacetylases (specifi-cally HDAC2, HDAC5 and HDAC8) have been noted in COPD21. The regions we observed in the MHC are much more difficult to local-ize, with multiple genes being tagged by the top SNP, including non-synonymous SNPs in ZKSCAN3, PGBD1, ZSCAN12, ZNF323, TCF19, LTA, C6orf15 and GPANK1 (also known as BAT4) (Supplementary Table 2). At 6p21.33, we observed the strongest association with lung function for rs2857595, which is in LD (r2 = 0.47) with a non- synonymous SNP in LTA (encoding lymphotoxin α) and with a SNP in the upstream promoter region of TNFA (encoding tumor necrosis factor α) (r2 = 0.86), both of which are plausible candidates22,23. Our top SNP in MMP15 is in strong LD (r2 = 1) with a non-synonymous SNP (rs3743563, which has an association with FEV1/FVC at P = 1.8 × 10⁻⁷) within the same gene. Among the plausible mecha-nisms implicated by the other new signals of association with lung function reported here is TGF-β signaling; TGFB2 expression is upregulated in bronchial epithelial cells in asthma24. The putative
function of key genes (as defined by LD with the leading SNP) in each of the 16 loci, and relevant findings from animal models, are summa-rized in Table 2 and are detailed in Supplementary Table 2.
AssociationswithlungfunctioninchildrenAlleles representing 11 of the 16 new loci showed directionally con-sistent effects on lung function in 6,281 children (7–9 years of age) (Supplementary Table 3a), suggesting that genetic determination of lung function in adults may in part act through effects on lung development, or alternatively, that some genetic determinants of lung growth and lung function decline are shared.
AssociationoflungfunctionlociwithothertraitsAlthough we stratified for ever smoking versus never smoking, we did not adjust for the amount smoked. In order to investigate the possibility that the associations at any of our 16 new regions were driven by an effect of the SNP on smoking behavior, we evaluated in silico data for associations with smoking amount from the Oxford-GlaxoSmithKline (Ox-GSK) consortium25 for the leading SNPs in these 16 regions. None of these 16 SNPs showed statistically significant association with the number of cigarettes smoked per day (Supplementary Table 3b).
table 1 loci associated with lung functionStage 1 Stage 2 Joint meta-analysis of all stages
SNP ID Chr.NCBI36 position
Nearest gene
Coded allele Measure β (s.e.m.) P
Coded allele freq. N β (s.e.m.) P
Coded allele freq. N β (s.e.m.) P
rs2284746 1 17,179,262 MFAP2 (intron)
G FEV1/FVC FEV1
−0.042 (0.007) 0.008 (0.007)
2.47 × 10⁻⁹ 2.78 × 10⁻¹
0.516 45,944 −0.038 (0.007) 0.006 (0.007)
2.64 × 10⁻⁷ 3.70 × 10⁻¹
0.522 35,371 −0.04 (0.005) 0.007 (0.005)
7.50 × 10⁻¹⁶ 1.48 × 10⁻¹
rs993925 1 216,926,691 TGFB2 (downstream)
T FEV1/FVC FEV1
0.040 (0.007) 0.025 (0.007)
2.54 × 10⁻⁷ 1.51 × 10⁻³
0.308 42,402 0.023 (0.01) 0.003 (0.007)
1.76 × 10⁻² 7.29 × 10⁻¹
0.348 21,414 0.034 (0.006) 0.014 (0.005)
1.16 × 10⁻⁸ 8.71 × 10⁻³
rs12477314 2 239,542,085 HDAC4 (downstream)
T FEV1/FVC 0.052 (0.008) 4.48 × 10⁻⁹ 0.202 45,585 0.031 (0.008) 8.41 × 10⁻⁵ 0.206 45,821 0.041 (0.006) 1.68 × 10⁻¹²
FEV1 0.032 (0.008) 2.77 × 10⁻⁴ 0.025 (0.007) 1.82 × 10⁻⁴ 0.028 (0.005) 1.02 × 10⁻⁷
rs1529672 3 25,495,586 RARB (intron)
C FEV1/FVC −0.060 (0.009) 7.75 × 10⁻¹⁰ 0.829 40,624 −0.038 (0.009) 1.16 × 10⁻⁵ 0.831 45,466 −0.048 (0.006) 3.97 × 10⁻¹⁴
FEV1 −0.037 (0.009) 1.78 × 10⁻⁴ −0.011 (0.007) 9.33 × 10⁻² −0.020 (0.006) 2.16 × 10⁻⁴
rs1344555 3 170,782,913 MECOM (intron)
T FEV1/FVC −0.019 (0.008) 2.61 × 10⁻² 0.205 46,067 −0.017 (0.012) 1.55 × 10⁻¹ 0.209 21,313 −0.018 (0.007) 6.65 × 10⁻³
FEV1 −0.042 (0.008) 1.91 × 10⁻⁶ −0.025 (0.009) 6.44 × 10⁻³ −0.034 (0.006) 2.65 × 10⁻⁸
rs153916 5 95,062,456 SPATA9 (upstream)
T FEV1/FVC −0.033 (0.007) 2.06 × 10⁻⁶ 0.552 47,530 −0.025 (0.009) 6.67 × 10⁻³ 0.535 21,647 −0.031 (0.005) 2.12 × 10⁻⁸
FEV1 −0.001 (0.007) 8.91 × 10⁻¹ 0.004 (0.007) 6.22 × 10⁻¹ 0.001 (0.005) 8.20 × 10⁻¹
rs6903823 6 28,430,275 ZKSCAN3 (intron)/ ZNF323 (intron)
G FEV1/FVC −0.027 (0.008) 2.28 × 10⁻³ 0.209 47,057 −0.013 (0.011) 2.34 × 10⁻¹ 0.246 21,489 −0.021 (0.007) 1.19 × 10⁻³
FEV1 −0.046 (0.008) 2.00 × 10⁻⁷ −0.029 (0.008) 4.75 × 10⁻⁴ −0.037 (0.006) 2.18 × 10⁻¹⁰
rs2857595 6 31,676,448 NCR3 (upstream)
G FEV1/FVC 0.049 (0.009) 7.86 × 10⁻⁸ 0.809 45,540 0.028 (0.008) 5.36 × 10⁻⁴ 0.796 46,107 0.037 (0.006) 2.28 × 10⁻¹⁰
FEV1 0.040 (0.009) 1.46 × 10⁻⁵ 0.017 (0.007) 9.41 × 10⁻³ 0.025 (0.005) 1.30 × 10⁻⁶
rs2798641 6 109,374,743 ARMC2 (intron)
T FEV1/FVC −0.047 (0.009) 2.81 × 10⁻⁷ 0.183 46,369 −0.030 (0.012) 1.57 × 10⁻² 0.179 21,173 −0.041 (0.007) 8.35 × 10⁻⁹
FEV1 −0.046 (0.009) 5.39 × 10⁻⁷ −0.009 (0.01) 3.35 × 10⁻¹ −0.030 (0.006) 4.69 × 10⁻⁶
rs7068966 10 12,317,998 CDC123 (intron)
T FEV1/FVC 0.045 (0.007) 1.28 × 10⁻¹⁰ 0.519 47,085 0.023 (0.006) 3.86 × 10⁻⁴ 0.518 46,067 0.033 (0.005) 6.13 × 10⁻¹³
FEV1 0.040 (0.007) 1.19 × 10⁻⁸ 0.022 (0.005) 3.56 × 10⁻⁵ 0.029 (0.004) 2.82 × 10⁻¹²
rs11001819 10 77,985,230 C10orf11 (intron)
G FEV1/FVC −0.019 (0.007) 6.50 × 10⁻³ 0.522 45,546 −0.006 (0.006) 3.17 × 10⁻¹ 0.506 45,932 −0.012 (0.005) 7.58 × 10⁻³
FEV1 −0.041 (0.007) 1.42 × 10⁻⁸ −0.022 (0.005) 3.10 × 10⁻⁵ −0.029 (0.004) 2.98 × 10⁻¹²
rs11172113 12 55,813,550 LRP1 (intron)
T FEV1/FVC −0.035 (0.007) 1.36 × 10⁻⁶ 0.607 45,387 −0.026 (0.01) 5.83 × 10⁻³ 0.590 20,509 −0.032 (0.006) 1.24 × 10⁻⁸
FEV1 −0.021 (0.007) 3.55 × 10⁻³ −0.003 (0.007) 6.94 × 10⁻¹ −0.013 (0.005) 1.19 × 10⁻²
rs1036429 12 94,795,559 CCDC38 (intron)
T FEV1/FVC 0.049 (0.008) 1.24 × 10⁻⁸ 0.200 47,814 0.028 (0.008) 3.35 × 10⁻⁴ 0.214 46,311 0.038 (0.006) 2.30 × 10⁻¹¹
FEV1 0.010 (0.008) 2.67 × 10⁻¹ 0.004 (0.006) 5.38 × 10⁻¹ 0.006 (0.005) 2.26 × 10⁻¹
rs12447804 16 56,632,783 MMP15 (intron)
T FEV1/FVC −0.053 (0.009) 7.12 × 10⁻⁸ 0.208 35,123 −0.021 (0.01) 4.20 × 10⁻² 0.222 24,398 −0.038 (0.007) 3.59 × 10⁻⁸
FEV1 −0.017 (0.009) 8.02 × 10⁻² 0.004 (0.007) 5.71 × 10⁻¹ −0.004 (0.006) 4.73 × 10⁻¹
rs2865531 16 73,947,817 CFDP1 (intron)
T FEV1/FVC 0.039 (0.007) 2.30 × 10⁻⁸ 0.418 47,594 0.024 (0.006) 1.94 × 10⁻⁴ 0.409 46,304 0.031 (0.005) 1.77 × 10⁻¹¹
FEV1 0.024 (0.007) 6.30 × 10⁻⁴ 0.011 (0.005) 3.89 × 10⁻² 0.016 (0.004) 1.09 × 10⁻⁴
rs9978142 21 34,574,109 KCNE2 (upstream)
T FEV1/FVC −0.048 (0.009) 8.23 × 10⁻⁷ 0.156 44,577 −0.031 (0.013) 1.75 × 10⁻² 0.149 20,944 −0.043 (0.008) 2.65 × 10⁻⁸
FEV1 −0.012 (0.009) 2.47 × 10⁻¹ −0.015 (0.01) 1.35 × 10⁻¹ −0.013 (0.007) 5.57 × 10⁻²
Shown are FEV1 and FEV1/FVC results for the leading SNPs, ordered by chromosome and position for each independent locus associated (P < 5 × 10⁻⁸) with FEV1 or FEV1/FVC in a joint analysis of up to 94,612 individuals of European ancestry from the SpiroMeta-CHARGE GWAS (stage 1) and follow up (stage 2). Two-sided P values are given for stage 1, stage 2 and the joint meta-analysis of all stages. P values reaching genome-wide significance (P < 5 × 10⁻⁸) in the joint meta-analysis of all stages are indicated in bold. SNPs reaching independent replication in stage 2 (P = 0.05/34 = 1.47 × 10⁻³) are indicated with their stage 2 P value in bold. The sample sizes (N) shown are the effective sample sizes. The effective sample size within each study is the product of sample size and the imputation quality metric. The joint meta-analysis includes data from stage 1 and stage 2. β values reflect effect-size estimates on an inverse-normal transformed scale after adjustments for age, age2, sex, height and ancestry principal components. The estimated proportion of the variance explained by each SNP can be found in supplementary table 6. Chr., chromosome; freq., frequency.

© 2
011
Nat
ure
Am
eric
a, In
c. A
ll ri
gh
ts r
eser
ved
.©
201
1 N
atu
re A
mer
ica,
Inc.
All
rig
hts
res
erve
d.
Nature GeNetics VOLUME 43 | NUMBER 11 | NOVEMBER 2011 1085
A rt i c l e s
In addition, in our stage 1 and 2 datasets combined, we assessed whether the estimated effect sizes of the variants on lung function phenotypes differed substantially between ever smokers and never smokers (Supplementary Table 4) across the 16 loci. For the most strongly associated trait at each locus, we tested the SNP interaction with ever smoking versus never smoking. None of the 16 new loci showed a significant interaction (Bonferroni-corrected threshold for 16 independent SNPs P = 0.003125). These analyses suggest that the genetic effects we have identified underlie lung function variability irrespective of smoking exposure.
We adjusted our lung function associations for height, but there are some overlaps between loci associated with height and those associated with lung function. Therefore, we evaluated in silico data for height associations of our new regions in the GIANT consortium14 dataset. The G allele of rs2284746 (in an intron of MFAP2), which was associated with decreased FEV1/FVC, was associated with increased height (Supplementary Table 3c).
Given reported associations between lung cancer and either COPD or lung function decline, we also assessed in silico data for sentinel or proxy SNPs in these 16 regions for associations with lung cancer in the International Lung Cancer Consortium (ILCCO) GWAS meta-analysis26. Alleles associated with reduced lung function were associated with risk of lung cancer at the strongest available proxy SNP for rs2857595 (upstream of NCR3) at 6p21.33 (rs3099844, r2 = 0.67) and for the strongest proxy SNP for rs6903823 (a SNP in an intron of ZKSCAN3 and ZNF323) at 6p22.1 (rs209181, r2 = 0.69) (lung cancer associations at P = 2.2 × 10⁻⁷ and P = 3.4 × 10⁻⁵, respectively; Supplementary Table 3d). We saw no significant associations with lung cancer at the other new loci (proxy SNPs were available for 15 of the 16 loci, Bonferroni-corrected P < 0.0033).
In addition to the effects on height, smoking and lung cancer described above, we examined the literature for evidence of associations with other traits for each of the 16 new loci (detailed in Supplementary Table 2). Genome-wide significant associations (P < 5 × 10⁻⁸) have been reported in KCNE2 with myocardial infarction27 and at 6p21.33 near NCR3-AIF1 with neonatal lupus28 and systemic lupus erythema-tosus29. Other significant complex disease associations have also been noted in the regions of CDC123 (type 2 diabetes30), CFDP1 (type 1 diabetes31) and MECOM (blood pressure32,33), but with weaker LD (r2 < 0.3) being seen between the reported SNP and the sentinel SNP for lung function in the region (Supplementary Table 2).
ProportionofvarianceexplainedbylocidiscoveredtodateAssociations in ten loci previously reported for lung function8,9 reached genome-wide significance (P < 5 × 10⁻⁸) in our stage 1 data, namely loci in or near TNS1, FAM13A, GSTCD-NPNT, HHIP, HTR4, ADAM19, AGER, GPR126, PTCH1 and TSHD4 (Supplementary Table 5a). Thus, a total of 26 regions showed genome-wide significant associa-tion with lung function in our study. In aggregate, variants at these 26 regions explain approximately 3.2% of the additive polygenic variance for FEV1/FVC and 1.5% of the variance for FEV1 (Supplementary Note). Following the approach previously described34, we estimated that there are a total of 102 (95% confidence interval 57–155) inde-pendent variants with similar effect sizes to the 26 variants we report here. In combination, these 102 variants, comprising 26 discovered variants and 76 putative undiscovered variants, collectively explain around 7.5% of the additive polygenic variance for FEV1/FVC and 3.4% of the variance for FEV1 (Online Methods, Supplementary Table 6 and Supplementary Note).
table 2 expression profiling of candidate genes in the lung and peripheryTissue
Sentinel SNP (relationship to gene) Chr. Gene Putative function of encoded protein Lung HASM HBEC PBMC
rs993925 (intron) 1 TGFB2 Cytokine with roles in pro-fibrotic cytokine modulating epithelial repair mechanisms and extracellular matrix homeostasis including collagen deposition40.
+ + − −
rs2284746 (intron) 1 MFAP2 Major antigen of elastin-associated microfibrils17 and a candidate for involvement in the etiology of inherited connective tissue diseases.
+ + + −
rs12477314 (downstream) 2 HDAC4 Deacetylase of histone surrounding DNA thus influencing transcription factor access to the DNA and possibly repressing gene transcription.
+ + + +
rs1344555 (intron) 3 EVI1 Zinc finger transcription factor, encoded as part of MECOM (MDS1-EVI1 complex locus). + + + −
rs1529672 (intron) 3 RARB Nuclear retinoic acid receptor responsive to retinoic acid, a vitamin A derivative and which also controls cell proliferation and differentiation.
+ + + +
rs153916 (intron) 5 SPATA9 Initially identified as a mediator of spermatogenesis, other family members may have a role in pancreatic development and β-cell proliferation41.
+ + + +
rs2798641 (intron) 6 ARMC2 Function unknown, although other family members have been identified as having roles in cell signaling, protein degradation and cytoskeleton functions42.
+ + + +
rs2857595 (upstream) 6 NCR3 Required for efficient cytotoxicity responses by natural killer cells against normal cells and tumors43. + − − +
rs6903823 (intron) 6 ZKSCAN3 Transcription factor involved in cell growth, cell cycle and signal transduction. + + + +
rs7068966 (intron) 10 CDC123 Homolog in yeast shown to be a critical control protein modulating eukaryotic initiation factor 2 in times of cell stress.
+ + + +
rs11001819 (intron) 10 C10orf11 Function unknown. + + + +
rs11172113 (intron) 12 LRP1 Potentially diverse roles including cell signaling and migration44. + + + +
rs1036429 (intron) 12 CCDC38 Function unknown, although other family members involved in a diverse array of functions skeletal and motor function45.
− − − −
rs1036429 (r2 = 0.96 with rs4762633 in SNRPF)
12 SNRPF Small nuclear ribonucleoprotein F. + + + +
rs12447804 (intron) 16 MMP15 Member of a large protease family with diverse functional roles via protease activity and specificity including tissue remodeling, wound healing, angiogenesis and tumor invasion.
+ + + −
rs2865531 (intron) 16 CFDP1 Craniofacial development protein 1. + + + +
rs9978142 (upstream) 21 KCNE2 KCNQ1-KCNE2 K+ channels may modulate transepithelial anion secretion in Calu3 airway epithelial cells46. + − − +
Reference gene 12 GAPDH + + + +
+ indicates the gene is expressed in the cell type used, and − indicates that we did not detect the gene expression at the mRNA level following 40 cycles of PCR. PCR profiling of gene transcripts in the human lung showed expression of all candidates except CCDC38, for which two sets of primers were designed and tested under different optimization conditions. None of these assays detected expression of CCDC38 in the cell types analyzed. We instead assayed SNRPF, which neighbors CCDC38 and harbors SNPs in strong LD with CCDC38’s sentinel SNP. All PCR products were sequence verified. We used GAPDH (encoding glyceraldehyde-3-phosphate dehydrogenase) as a positive control for the complementary DNA, and this gene was expressed in all tissues. Chr., chromosome; HASM, human airway smooth muscle; HBEC, human bronchial epithelial cells; PBMC, peripheral blood mononuclear cells.

© 2
011
Nat
ure
Am
eric
a, In
c. A
ll ri
gh
ts r
eser
ved
.©
201
1 N
atu
re A
mer
ica,
Inc.
All
rig
hts
res
erve
d.
1086 VOLUME 43 | NUMBER 11 | NOVEMBER 2011 Nature GeNetics
A rt i c l e s
DISCUSSIONIn meta-analysis of 23 studies comprising 48,201 individuals of European ancestry and follow up in 17 studies comprising up to 46,411 individuals, we report genome-wide significant associations with an additional 12 regions for FEV1/FVC, an additional 3 regions for FEV1 and 1 additional region associated with both FEV1 and FEV1/FVC. We also confirmed genome-wide association with ten regions previ-ously associated with lung function, bringing to 26 the total number of loci associated with lung function from analyses of these datasets. Most of the new loci are in regions not previously suspected to have been involved in lung development, the control of pulmonary func-tion or the risk of developing COPD. Elucidating the mechanisms through which these regions influence lung function should lead to a more complete understanding of lung function regulation and the pathogenesis of COPD. Four of the new loci (MFAP2, ZKSCAN3, near NCR3 and near KCNE2) that we showed to be associated with lung function are also associated with other complex traits and diseases (with P < 5 × 10⁻⁸ for the other trait at a SNP having r2 > 0.3 with the top lung function SNP in the region). Understanding the intermedi-ates underlying these pleiotropic effects could also lead to crucial insights into the pathophysiology of lung disease. One potential expla-nation is that these loci underlie control of the mechanisms regulat-ing the development and resolution of inflammation and subsequent tissue remodeling in a range of tissues.
The effect sizes of the variants in the 26 loci associated with lung function collectively explain a modest proportion of the additive genetic variance in FEV1/FVC and in FEV1, even after accounting for putative undetected variants with a similar distribution of effect sizes34. Our findings are consistent with those from other common complex traits, where it is thought that many as yet unidentified common and rare sequence variants, and potentially structural variants, could explain the remaining heritability35. That our study more than doubled the number of loci known to be associated with lung function underlines the utility of large sample sizes to achieve the power to detect common variants associated with complex traits. Nevertheless, it is likely that additional variants with similar effect sizes remain undiscovered14. In addition, our study was not designed to detect rare variants or structural variants associated with lung function. Identification of rare variants associated with lung function could be helpful in narrowing the scope of ongoing functional work to those genes most likely to be causally related to the association signals we detected.
Our study focused on cross-sectional measures of lung function. Adult lung function at a particular time point is influenced by the peak lung function achieved by 25–35 years of age as well as the rate of decline of lung function after that peak36. The 26 loci now confirmed to be associated with lung function could affect either pre- or post-natal lung development and growth or decline in lung function during adulthood, or both. We showed consistent directions of estimated effects on lung function between adults and children 7–9 years of age for SNPs at 11 of the 16 new loci and 8 of the 10 previously reported loci (Supplementary Table 3a). The results we show for lung function in children provide some indication that these loci affect lung function development, although studies in larger populations of children would provide greater clarity for SNPs in the new loci. Further investigations will be required in large populations with longitudinal data to deline-ate the influence of these variants on the rates of development of, and decline in, lung function and on the risk of developing COPD.
Of the sentinel SNPs at the 16 new loci associated with lung function, only rs2284746 (MFAP2) was associated with height in the GIANT consortium14 dataset. The G allele of rs2284746 was associated with both increased height and reduced lung function. A similar relationship
between lung function and height was previously reported for the G allele of rs3817928 in GPR126 (refs. 8,14), which is associated with decreased height but with increased FEV1/FVC. A further 3 of the 180 loci found to be associated with height14 showed association (for the 180 loci, we used a Bonferroni-corrected threshold of P = 2.8 × 10⁻⁴) with either FEV1 (CLIC4 and BMP6) or FEV1/FVC (PIP4K2B) (Supplementary Table 3e). In each case, the allele associated with an increase in height was associated with a decrease in lung function. This is not the case for the association of rs1032296 near HHIP, which has shown consistent directions of effects on lung function and height11,14. However, the strongest SNP associated with height in the HHIP region lies within an intron of HHIP but shows no association with FEV1 or FEV1/FVC. Furthermore, although height is an important predictor of FEV1, this is not true for its ratio to FVC37. These observations argue against the associations with lung function at these loci being simply caused by incomplete adjustment for height.
We stratified by ever- and never-smoker status in our analyses, and in our investigation of amount smoked in the Ox-GSK consortium25, none of the sentinel SNPs in the 16 new regions showed association with the number of cigarettes smoked per day. Additionally, none of these regions was associated with ever smoking in the Ox-GSK con-sortium data (Supplementary Table 3b). Thus, the SNP associations with lung function we observed are unlikely to have arisen simply as a consequence of inadequate adjustment for smoking.
We did not observe any interactions with ever smoking for any of the sentinel SNPs in the 16 new regions that exceeded a Bonferroni-corrected significance level (for 16 SNPs). Thus, the effects on lung function of the newly associated variants we identified are apparent in both ever smokers and in never smokers, and the effects of smoking and of these genetic variants may be independent and additive.
In other common complex diseases, follow-up studies that incor-porate common genetic risk variants into models to predict disease have not been shown to add substantially to existing risk models, particularly when such models already include family history38,39. The same may also prove to be true for the 26 genetic variants described in this paper, as the effect size of any individual variant is small, but further work is required in this area. The major utility of our findings will be in the knowledge they provide about previously unknown pathways underlying lung function. Elucidating the mechanisms that these genes are involved in will lead to improved understanding of the regulation of lung function and potentially to new therapeutic targets for COPD.
URLs. R, http://www.r-project.org/.
METhODSMethods and any associated references are available in the online version of the paper at http://www.nature.com/naturegenetics/.
Note: Supplementary information is available on the Nature Genetics website.
AcknowledgmentsWe thank the many colleagues who contributed to collection and phenotypic characterization of the clinical sampling, genotyping and analysis of the data. We especially thank those who kindly agreed to participate in the studies.Major funding for this work is from the following sources (alphabetical): Academy of Finland (project grants 104781, 120315, 129269, 1114194, Center of Excellence in Complex Disease Genetics (213506 and 129680) and SALVE); Althingi (Icelandic Parliament); Arthritis Research Campaign; Asthma UK; AstraZeneca; AXA Research Fund; Biotechnology and Biological Sciences Research Council (BBSRC) (BB/F019394/1, G20234); British Heart Foundation (PG/97012, PG/06/154/22043, FS05/125); British Lung Foundation; Canadian Institutes of Health Research (Grant ID MOP-82893); Cancer Research United Kingdom;
© 2
011
Nat
ure
Am
eric
a, In
c. A
ll ri
gh
ts r
eser
ved
.©
201
1 N
atu
re A
mer
ica,
Inc.
All
rig
hts
res
erve
d.
Nature GeNetics VOLUME 43 | NUMBER 11 | NOVEMBER 2011 1087
A rt i c l e s
Chief Scientist Office, Scottish Government Health Directorate (CZD/16/6); Croatian Institute for Public Health; UK Department of Health; Dutch Kidney Foundation; Erasmus Medical Center and Erasmus University, Rotterdam; Estonian Genome Center, University of Tartu, Estonia (SF0180142s08); EU funding (GABRIEL GRANT Number: 018996, ECRHS II Coordination Number: QLK4-CT-1999-01237); European Commission (DG XII, EURO-BLCS, FP-5 QLG1-CT-2000-01643, FP-6 LSHB-CT-2006-018996 (GABRIEL), FP-6 LSHG-CT-2006-018947 (EUROSPAN), FP-6 GenomEUtwin project QLG2-CT-2002-01254, FP7/2007-2013: HEALTH-F2-2008-201865, GEFOS, HEALTH-F2-2008-35627, TREAT-OA, HEALTH-F4-2007-201413 (ENGAGE)); Finnish Foundation for Cardiovascular Research; Flight Attendant Medical Research Institute (FAMRI); German Asthma and COPD Network (COSYCONET: BMBF grant 01GI0883); German Bundesministerium fuer Forschung und Technology (01 AK 803 A-H, 01 IG 07015 G); German Federal Ministry of Education and Research (BMBF) (03ZIK012, 01ZZ9603, 01ZZ0103 and 01ZZ0403): German National Genome Research Network (NGFN-2 and NGFN-plus); German Ministry of Cultural Affairs; GlaxoSmithKline; Gyllenberg Foundations; Healthway, Western Australia; Helmholtz Zentrum München, German Research Center for Environmental Health, Neuherberg, Germany; Healthcare and Bioscience iNet (funded by the East Midlands Development Agency, partially financed by the European Regional Development Fund, delivered by Medilink East Midlands); Higher Education Funding Council for England (HEFCE); Hjartavernd (Icelandic Heart Association); Innsbruck Medical University; Institute for Anthropological Research in Zagreb; International Osteoporosis Foundation; Intramural Research Program of the NIH, National Institute on Aging and National Institute of Environmental Health Sciences; Jalmari and Rauha Ahokas Foundation; Juvenile Diabetes Research Foundation International (JDRF); Lifelong Health and Wellbeing Initiative (G0700704/84698); Medical Research Council UK (G1000861, G0501942, G0902313, G0000934, G0800582, G0500539, G0600705, PrevMetSyn/SALVE, G9901462); Medical Research Fund of the Tampere University Hospital; Ministry of Science, Education and Sport of the Republic of Croatia (108-1080315-0302); Medical Research Council Human Genetics Unit; Medisearch–The Leicester Medical Research Foundation; Munich Center of Health Sciences (MC Health) as part of LMUinnovativ; National Health and Medical Research Council of Australia (Grant ID 403981 and ID 003209); National Human Genome Research Institute (NHGRI) (U01-HG-004729, U01-HG-004402); National Institute for Health Research (NIHR) Comprehensive Biomedical Research Centres (Guy’s & St. Thomas’ NHS Foundation Trust in partnership with King’s College London and Cambridge University Hospitals NHS Foundation Trust in partnership with the University of Cambridge); Netherlands Genomics Initiative (NGI)/Netherlands Organisation for Scientific Research (NWO) (050-060-810); Netherlands Organization for the Health Research and Development (ZonMw); Netherlands Organization of Scientific Research NOW (1750102007006, 175.010.2005.011, 911-03-012); Northern Netherlands Collaboration of Provinces (SNN); Norwegian University of Science and Technology; Novo Nordisk; Ontario Institute of Cancer Research and Canadian Cancer Society Research Institute (CCSRI 020214); Republic of Croatia Ministry of Science, Education and Sports research grants (108-1080315-0302); Research Institute for Diseases in the Elderly (RIDE) (014-93-015: RIDE2); Research Into Ageing (251); Siemens Healthcare, Erlangen, Germany and the Federal State of Mecklenburg–West Pomerania; Social Ministry of the Federal State of Mecklenburg–West Pomerania; Structure Enhancing Fund (FES) of the Dutch government; Swedish Heart and Lung Foundation grant 20050561; Swedish Research Council for Worklife and Social research (FAS), grants 2001-0263, 2003-0139; Swiss National Science Foundation (grants no. 4026-28099,3347CO-108796, 3247BO-104283, 3247BO-104288, 3247BO-104284, 32-65896.01,32-59302.99, 32-52720.97, 32-4253.94); The Asthma, Allergy and Inflammation Research Trust; The Great Wine Estates of the Margaret River region of Western Australia; The Netherlands’ Ministry of Economic Affairs, Ministry of Education, Culture and Science and Ministry for Health, Welfare and Sports; The Royal Society; The University of Split and Zagreb Medical Schools; Tromsø University; U01 DK062418; UBS Wealth Foundation Grant BA29s8Q7-DZZ; UK Department of Health Policy Research Programme; University Hospital Oulu, Biocenter, University of Oulu, Finland (75617); University Medical Center Groningen; University of Bristol; University of Leicester HEFCE CIF award; University of Nottingham; US National Institutes of Health (NIH) (1P50 CA70907, RO1 CA121197, U19 CA148127, CA55769, CA127219, R01HL071051, R01HL071205, R01HL071250, R01HL071251, R01HL071252, R01HL071258, R01HL071259, UL1RR025005, contracts HHSN268200625226C, HHSN268200782096C, R01-HL084099); US NIH National Cancer Institute (RO1CA111703); US NIH National Center for Research Resources (grants M01-RR00425 and 5M01 RR00997); US NIH National Eye Institute (NEI); US NIH National Heart, Lung and Blood Institute (contracts N01-HC-85079 through N01-HC-85086, N01-HC-35129, N01 HC-15103, N01 HC-55222, N01-HC-75150, N01-HC-45133, N01-HC-95095, N01-HC-48047, N01-HC-48048, N01-HC-48049,
N01-HC-48050, N01-HC-45134, N01-HC-05187, N01-HC-45205, N01-HC-45204, N01 HC-25195, N01-HC-95159 through N01-HC-95169, RR-024156, N02-HL-6-4278, R01 HL-071022, R01 HL-077612, R01 HL-074104, RC1 HL100543, HHSN268201100005C, HHSN268201100006C, HHSN268201100007C, HHSN268201100008C, HHSN268201100009C, HHSN268201100010C, HHSN268201100011C and HHSN268201100012C, grants HL080295, HL087652, HL105756, R01-HL-084099, R01HL087641, R01HL59367, R01HL086694, HL088133, HL075336 5R01HL087679-02 through the STAMPEED program (1RL1MH083268-01), 1K23HL094531-01); US NIH National Institute of Allergy and Infectious Diseases (NIAID); US NIH National Institute of Child Health and Human Development (NICHD); US NIH National Institute of Diabetes and Digestive and Kidney Diseases (NIDDK) (DK063491); US NIH National Institute of Environmental Health Sciences (NIEHS) (ZO1 ES49019, ES015794); US NIH National Institute of Mental Health (NIMH) (5R01MH63706:02); US NIH National Institute of Neurological Disorders and Stroke (NINDD); US NIH National Institute on Aging (NIA) (R01 AG032098, RC1 AG035835, N01AG12100, N01AG62101, N01AG62103, N01AG62106, 1R01AG032098-01A1, AG-023269, AG-15928, AG-20098, AG-027058); Wellcome Trust (077016/Z/05/Z, GR069224, 068545/Z/02, 076113/B/04/Z, 079895).
AUtHoR contRIBUtIonsAuthor contributions are listed in alphabetical order. See Supplementary Note for definitions of study acronyms.
Project conception, design and management. Stage 1 GWAS, AGES: G.E., M.G., V.G., T.B.H., L.J.L. ARIC: S.J.L., N.F., L.R.L., D.J.C., D.B.H., B.R.J., A.C.M., K.E.N. B58C-T1DGC: D.P.S. B58C -WTCCC: D.P.S. BHS1: A.L.J., A.W.M., L.J.P. CHS: S.A.G., S.R.H., T.L., B.M.P. CROATIA-Korcula: H.C., I.G., S.J., I.R., A.F.W., L.Z. CROATIA-Vis: H.C., C.H., O.P., I.R., A.F.W. ECRHS: D.L.J., E.O., I.P., M.W. EPIC: N.J.W. FHS: J.B.W., G.T.O. FTC: J.K., K.H.P., T. Rantanen. Health ABC: M.C.A., P.A.C., T.B.H., S.B.K., Y.L., B.M. Health 2000: M.H., M.K. KORA F4: J. Heinrich. KORA S3: C.G., H.-E.W. NFBC1966: P.E., A.-L.H., M.-R.J., A.P. ORCADES: H.C., S.H.W., J.F.W., A.F.W. RS: A. Hofman. SHIP: S.G., G.H., B.K., H.V. TwinsUK: T.D.S., G.Z. Stage 2 follow up, ADONIX: J. Brisman., A.-C.O. BHS2: J. Beilby. BRHS: R.W.M., S.G.W., P.H.W. BWHHS: G.D.S., S.E., D.A.L., P.H.W. CARDIA: A.S. CROATIA-Split: M.B., I.K., T.Z. GS: SFHS: C.M.J., S.M.K., A.D.M., D.J.P. HCS: C.C., J.W.H., A.A.S. LBC1936: I.J.D., S.E.H., J.M.S. LifeLines: H.M.B., D.S.P., J.M.V., C.W. MESA-Lung: R.G.B., J.L.H. Nottingham smokers: I.P.H. NSHD: R.H., D.K. SAPALDIA: N.P.-H., T. Rochat. Look-up studies, ALSPAC: R.G., J. Henderson. ILCCO: ILCCO data. Ox-GSK: C.F., J.M.
Phenotype collection and data management. Stage 1 GWAS, AGES: T.A. ARIC: D.J.C., N.F., L.R.L., A.C.M., K.E.N. B58C-T1DGC: A.R.R., D.P.S. B58C -WTCCC: A.R.R., D.P.S. BHS1: A.L.J., A.W.M., L.J.P. CHS: S.A.G., S.R.H., T.L., B.M.P. CROATIA-Korcula: I.G., S.J., O.P., I.R., L.Z. CROATIA-Vis: H.C., C.H., O.P., I.R., A.F.W. ECRHS: D.L.J., E.O., I.P., M.W. EPIC: N.J.W. FHS: J.B.W., G.T.O. FTC: J.K., K.H.P., T. Rantanen. Health ABC: P.A.C., B.M., W.T. Health 2000: M.H., M.K. KORA F4: S.K., H.S. KORA S3: N.P.-H. NFBC1966: P.E., A.-L.H., M.-R.J., A.P. ORCADES: H.C., S.H.W., J.F.W. RS: G.G.B., M.E., D.W.L., B.H.Ch.S. SHIP: S.G., B.K., H.V. TwinsUK: C.J.H., P.G. Hysi, M.M., T.D.S., G.Z. Stage 2 follow up, ADONIX: J. Brisman, A.-C.O. BHS2: J. Beilby, M.L.H. BRHS: R.W.M., S.G.W., P.H.W. BWHHS: G.D.S., S.E., D.A.L., P.H.W. CARDIA: O.D.W. CROATIA-Split: M.B., I.K., T.Z. GS: SFHS: C.M.J., A.D.M. HCS: C.C., K.A.J., A.A.S. LBC1936: I.J.D., L.M.L., J.M.S. LifeLines: D.S.P., J.M.V. MESA-Lung: R.G.B., J.L.H. Nottingham smokers: K.A.A.B., J.D.B., I.P.H., A. Henry, M.O., I. Sayers. NSHD: R.H., D.K. SAPALDIA: N.P.-H. Look-up studies, ALSPAC: R.G., J. Henderson. ILCCO: ILCCO. Raine: W.Q.A., P.G. Holt, C.E.P., P.D.S.
Genotyping. Stage 1 GWAS, B58C-T1DGC: W.L.M. B58C-WTCCC: W.L.M. BHS1: A.L.J., A.W.M., L.J.P. CHS: S.R.H., B.M.P., J.I.R. CROATIA-Vis: C.H., I.R., A.F.W. ECRHS: M.W. EPIC: I.B., R.J.F.L., J.H.Z. FTC: J.K. Health ABC: Y.L., K.L. Health 2000: S.R., I. Surakka. KORA F4: N.K. KORA S3: C.G. NFBC1966: P.E., A.-L.H., M.-R.J., A.P., A.R. ORCADES: H.C., J.F.W. RS: F.R., A.G.U. SHIP: G.H. TwinsUK: C.J.H., S.-Y.S. Stage 2 follow up, ADONIX: S.D., F.N., A.-C.O. BHS2: J. Beilby, G.C., J.H. BRHS: A.D.H., R.W.M. BWHHS: S.E., D.A.L. CARDIA: M.F., X.G. CROATIA-Split: V.B., T.Z. Gedling: J.R.B., T.M. GS: SFHS: C.M.J., S.M.K., D.J.P. HCS: J.W.H. LBC1936: I.J.D., S.E.H., L.M.L., J.M.S. LifeLines: C.W. MESA-Lung: S.S.R. NSHD: D.K., A.W. SAPALDIA: M.I., F.K. Look-up studies, ALSPAC: S.M.R., W.L.M. ILCCO: ILCCO. Raine: W.Q.A., C.E.P.
Data analysis. Stage 1 GWAS, AGES: G.K.G., A.V.S. ARIC: N.F., D.B.H., L.R.L. B58C–T1DGC: A.R.R., D.P.S. B58C -WTCCC: A.R.R., D.P.S. BHS1: N.M.W. CHS: K.D.M., J.I.R. CROATIA-Korcula: C.H., J.E.H., V.V. CROATIA-Vis: C.H., V.V. ECRHS: D.L.J., A.R. EPIC: J.H.Z. FHS: J.B.W. FTC: I. Surakka. Health ABC: P.A.C., Y.L., K.L., W.T. Health 2000: M.K., S.R., I. Surakka. KORA S3: E.A. NFBC1966:
© 2
011
Nat
ure
Am
eric
a, In
c. A
ll ri
gh
ts r
eser
ved
.©
201
1 N
atu
re A
mer
ica,
Inc.
All
rig
hts
res
erve
d.
1088 VOLUME 43 | NUMBER 11 | NOVEMBER 2011 Nature GeNetics
A rt i c l e s
A.R. ORCADES: C.H., V.V. RS: M.E., D.W.L. SHIP: S.G., G.H., B.K., H.V. TwinsUK: M.M., G.Z. Stage 2 follow-up studies, ADONIX: S.D., F.N. BHS2: G.C. BRHS: R.W.M. BWHHS: D.A.L. CARDIA: M.F., X.G. HCS: J.W.H., K.A.J. LBC1936: L.M.L. LifeLines: H.M.B. MESA-Lung: A.M., S.S.R. Nottingham smokers: I. Sayers, A. Henry. NSHD: D.G., R.H. SAPALDIA: I.C., M.I. Look-up studies, ALSPAC: D.M.E. ILCCO: ILCCO. Ox-GSK: J.Z.L. Raine: W.Q.A.
Analysis group: SpiroMeta consortium: I.P.H., T.J., M.S.A., M.D.T., L.V.W. CHARGE consortium: N.F., S.J.L., D.W.L., K.D.M., A.V.S., W.T., J.B.W.
Expression profiling and bioinformatics group: SpiroMeta consortium: I.P.H., M.O., I. Sayers, M.S.A., M.D.T., L.V.W. CHARGE consortium: S.A.G., D.W.L.
Writing group: SpiroMeta consortium: P.E., I.P.H., M.O., M.S.A., D.P.S., M.D.T., L.V.W. CHARGE consortium: S.J.L., D.W.L., S.A.G., G.T.O., V.G., B.H.Ch.S., W.T.
comPetIng FInAncIAl InteRestsThe authors declare competing financial interests: details accompany the full-text HTML version of the paper at http://www.nature.com/naturegenetics/.
Published online at http://www.nature.com/naturegenetics/. Reprints and permissions information is available online at http://www.nature.com/reprints/index.html.
1. Wilk, J.B. et al. Evidence for major genes influencing pulmonary function in the NHLBI family heart study. Genet. Epidemiol. 19, 81–94 (2000).
2. Hole, D.J. et al. Impaired lung function and mortality risk in men and women: findings from the Renfrew and Paisley prospective population study. Br. Med. J. 313, 711–715, discussion 715–716 (1996).
3. Strachan, D.P. Ventilatory function, height, and mortality among lifelong non-smokers. J. Epidemiol. Community Health 46, 66–70 (1992).
4. Young, R.P., Hopkins, R. & Eaton, T.E. Forced expiratory volume in one second: not just a lung function test but a marker of premature death from all causes. Eur. Respir. J. 30, 616–622 (2007).
5. Lopez, A.D. et al. Chronic obstructive pulmonary disease: current burden and future projections. Eur. Respir. J. 27, 397–412 (2006).
6. Mathers, C.D. & Loncar, D. Projections of global mortality and burden of disease from 2002 to 2030. PLoS Med. 3, e442 (2006).
7. Rabe, K.F. et al. Global strategy for the diagnosis, management, and prevention of chronic obstructive pulmonary disease: GOLD executive summary. Am. J. Respir. Crit. Care Med. 176, 532–555 (2007).
8. Hancock, D.B. et al. Meta-analyses of genome-wide association studies identify multiple loci associated with pulmonary function. Nat. Genet. 42, 45–52 (2010).
9. Repapi, E. et al. Genome-wide association study identifies five loci associated with lung function. Nat. Genet. 42, 36–44 (2010).
10. Pillai, S.G. et al. A genome-wide association study in chronic obstructive pulmonary disease (COPD): identification of two major susceptibility loci. PLoS Genet. 5, e1000421 (2009).
11. Wilk, J.B. et al. A genome-wide association study of pulmonary function measures in the Framingham Heart Study. PLoS Genet. 5, e1000429 (2009).
12. Yang, J. et al. Genomic inflation factors under polygenic inheritance. Eur. J. Hum. Genet. 19, 807–812 (2011).
13. Elks, C.E. et al. Thirty new loci for age at menarche identified by a meta-analysis of genome-wide association studies. Nat. Genet. 42, 1077–1085 (2010).
14. Lango Allen, H. et al. Hundreds of variants clustered in genomic loci and biological pathways affect human height. Nature 467, 832–838 (2010).
15. Lindgren, C.M. et al. Genome-wide association scan meta-analysis identifies three loci influencing adiposity and fat distribution. PLoS Genet. 5, e1000508 (2009).
16. Dixon, A.L. et al. A genome-wide association study of global gene expression. Nat. Genet. 39, 1202–1207 (2007).
17. Gibson, M.A., Hughes, J.L., Fanning, J.C. & Cleary, E.G. The major antigen of elastin-associated microfibrils is a 31-kDa glycoprotein. J. Biol. Chem. 261, 11429–11436 (1986).
18. Yang, J. et al. Rootletin, a novel coiled-coil protein, is a structural component of the ciliary rootlet. J. Cell Biol. 159, 431–440 (2002).
19. Massaro, G.D. et al. Retinoic acid receptor-β: an endogenous inhibitor of the perinatal formation of pulmonary alveoli. Physiol. Genomics 4, 51–57 (2000).
20. Bieganowski, P., Shilinski, K., Tsichlis, P.N. & Brenner, C. Cdc123 and checkpoint forkhead associated with RING proteins control the cell cycle by controlling eIF2γ abundance. J. Biol. Chem. 279, 44656–44666 (2004).
21. Ito, K. et al. Decreased histone deacetylase activity in chronic obstructive pulmonary disease. N. Engl. J. Med. 352, 1967–1976 (2005).
22. Wu, H. et al. Parental smoking modifies the relation between genetic variation in tumor necrosis factor-α (TNF) and childhood asthma. Environ. Health Perspect. 115, 616–622 (2007).
23. Ruse, C.E. et al. Tumour necrosis factor gene complex polymorphisms in chronic obstructive pulmonary disease. Respir. Med. 101, 340–344 (2007).
24. Chu, H.W. et al. Transforming growth factor-β2 induces bronchial epithelial mucin expression in asthma. Am. J. Pathol. 165, 1097–1106 (2004).
25. Liu, J.Z. et al. Meta-analysis and imputation refines the association of 15q25 with smoking quantity. Nat. Genet. 42, 436–440 (2010).
26. Landi, M.T. et al. A genome-wide association study of lung cancer identifies a region of chromosome 5p15 associated with risk for adenocarcinoma. Am. J. Hum. Genet. 85, 679–691 (2009).
27. Kathiresan, S. et al. Genome-wide association of early-onset myocardial infarction with single nucleotide polymorphisms and copy number variants. Nat. Genet. 41, 334–341 (2009).
28. Clancy, R.M. et al. Identification of candidate loci at 6p21 and 21q22 in a genome-wide association study of cardiac manifestations of neonatal lupus. Arthritis Rheum. 62, 3415–3424 (2010).
29. Harley, J.B. et al. Genome-wide association scan in women with systemic lupus erythematosus identifies susceptibility variants in ITGAM, PXK, KIAA1542 and other loci. Nat. Genet. 40, 204–210 (2008).
30. Zeggini, E. et al. Meta-analysis of genome-wide association data and large-scale replication identifies additional susceptibility loci for type 2 diabetes. Nat. Genet. 40, 638–645 (2008).
31. Barrett, J.C. et al. Genome-wide association study and meta-analysis find that over 40 loci affect risk of type 1 diabetes. Nat. Genet. 41, 703–707 (2009).
32. Levy, D. et al. Genome-wide association study of blood pressure and hypertension. Nat. Genet. 41, 677–687 (2009).
33. Newton-Cheh, C. et al. Genome-wide association study identifies eight loci associated with blood pressure. Nat. Genet. 41, 666–676 (2009).
34. Park, J.H. et al. Estimation of effect size distribution from genome-wide association studies and implications for future discoveries. Nat. Genet. 42, 570–575 (2010).
35. Yang, J. et al. Genome partitioning of genetic variation for complex traits using common SNPs. Nat. Genet. 43, 519–525 (2011).
36. Kohansal, R. et al. The natural history of chronic airflow obstruction revisited: an analysis of the framingham offspring cohort. Am. J. Respir. Crit. Care Med. 180, 3–10 (2009).
37. Hankinson, J.L., Odencrantz, J.R. & Fedan, K.B. Spirometric reference values from a sample of the general U.S. population. Am. J. Respir. Crit. Care Med. 159, 179–187 (1999).
38. Talmud, P.J. et al. Utility of genetic and non-genetic risk factors in prediction of type 2 diabetes: Whitehall II prospective cohort study. Br. Med. J. 340, b4838 (2010).
39. Wacholder, S. et al. Performance of common genetic variants in breast-cancer risk models. N. Engl. J. Med. 362, 986–993 (2010).
40. Thompson, H.G.R., Mih, J.D., Krasieva, T.B., Tromberg, B.J. & George, S.C. Epithelial-derived TGF-β2 modulates basal and wound-healing subepithelial matrix homeostasis. Am. J. Physiol. Lung Cell. Mol. Physiol. 291, L1277–L1285 (2006).
41. Maran, C., Tassone, E., Masola, V. & Onisto, M. The story of SPATA2 (spermatogenesis-associated protein 2): from Sertoli cells to pancreatic β-cells. Curr. Genomics 10, 361–363 (2009).
42. Tewari, R., Bailes, E., Bunting, K.A. & Coates, J.C. Armadillo-repeat protein functions: questions for little creatures. Trends Cell Biol. 20, 470–481 (2010).
43. Pende, D. et al. Identification and molecular characterization of NKp30, a novel triggering receptor involved in natural cytotoxicity mediated by human natural killer cells. J. Exp. Med. 190, 1505–1516 (1999).
44. Lillis, A.P., Mikhailenko, I. & Strickland, D.K. Beyond endocytosis: LRP function in cell migration, proliferation and vascular permeability. J. Thromb. haemost. 3, 1884–1893 (2005).
45. Burkhard, P., Stetefeld, J. & Strelkov, S.V. Coiled coils: a highly versatile protein folding motif. Trends Cell Biol. 11, 82–88 (2001).
46. Cowley, E.A. & Linsdell, P. Characterization of basolateral K+ channels underlying anion secretion in the human airway cell line Calu-3. J. Physiol. (Lond.) 538, 747–757 (2002).
© 2
011
Nat
ure
Am
eric
a, In
c. A
ll ri
gh
ts r
eser
ved
.©
201
1 N
atu
re A
mer
ica,
Inc.
All
rig
hts
res
erve
d.
Nature GeNetics VOLUME 43 | NUMBER 11 | NOVEMBER 2011 1089
A rt i c l e s
1Department of Health Sciences, University of Leicester, Leicester, UK. 2Department of Genetics, University of Leicester, Leicester, UK. 3Department of Epidemiology, Erasmus MC, Rotterdam, The Netherlands. 4Inspectorate of Healthcare, The Hague, The Netherlands. 5Center for Lung Biology, University of Washington, Seattle, Washington, USA. 6Department of Medicine, University of Washington, Seattle, Washington, USA. 7Division of Therapeutics and Molecular Medicine, Nottingham Respiratory Biomedical Research Unit, University Hospital of Nottingham, Nottingham, London, UK. 8Division of Nutritional Sciences, Cornell University Ithaca, New York, USA. 9Department of Twin Research and Genetic Epidemiology, King’s College London, London, UK. 10Discipline of Genetics, Faculty of Medicine, Memorial University of Newfoundland, St. John’s, Newfoundland, Canada. 11Medical Research Council (MRC) Epidemiology Unit, Institute of Metabolic Science, Addenbrooke’s Hospital, Cambridge, UK. 12Icelandic Heart Association, Kopavogur, Iceland. 13University of Iceland, Reykjavik, Iceland. 14MRC Human Genetics Unit, Institute of Genetics and Molecular Medicine, Western General Hospital, Edinburgh, UK. 15Institute of Genetic Epidemiology, Helmholtz Zentrum München-German Research Center for Environmental Health, Neuherberg, Germany. 16School of Medicine, University of St. Andrews, St. Andrews, Scotland, UK. 17MRC Centre for Causal Analyses in Translational Epidemiology, School of Social and Community Medicine, University of Bristol, Bristol, UK. 18Genetic Epidemiology and Biostatistics Platform, Ontario Institute for Cancer Research, Toronto, Ontario, Canada. 19Prosserman Centre for Health Research, Samuel Lunenfeld Research Institute, Toronto, Ontario, Canada. 20Brown Foundation Institute of Molecular Medicine, University of Texas at Houston, Houston, Texas, USA. 21Human Genetics Center, School of Public Health, University of Texas at Houston, Houston, Texas, USA. 22Center for Public Health Genomics, University of Virginia, Charlottesville, Virginia, USA. 23Department of Public Health Sciences, Division of Biostatistics and Epidemiology, University of Virginia, Charlottesville, Virginia, USA. 24Centre for Cognitive Ageing and Cognitive Epidemiology, The University of Edinburgh, Edinburgh, UK. 25Department of Psychology, The University of Edinburgh, Edinburgh, UK. 26Clinical Pharmacology and the Genome Centre, William Harvey Research Institute, Barts and The London School of Medicine and Dentistry, Queen Mary University of London, London, UK. 27Department of Thoracic Surgery, Vanderbilt University, Nashville, Tennessee, USA. 28Division of Epidemiology, Vanderbilt University, Nashville, Tennessee, USA. 29Wellcome Trust Sanger Institute, Genome Campus, Hinxton, Cambridge, UK. 30University of Cambridge Metabolic Research Labs, Institute of Metabolic Science Addenbrooke’s Hospital, Cambridge, UK. 31Centre for Population Health Sciences, The University of Edinburgh, Edinburgh, UK. 32Department of Biostatistics, Gillings School of Global Public Health, University of North Carolina, Chapel Hill, North Carolina, USA. 33Department of Epidemiology, Gillings School of Global Public Health, University of North Carolina, Chapel Hill, North Carolina, USA. 34Laboratory of Epidemiology, Demography, and Biometry, National Institute on Aging, National Institutes of Health, Bethesda, Maryland, USA. 35Croatian Centre for Global Health, The University of Split Medical School, Split, Croatia. 36Epidemiology
maría soler Artigas1,2,128, daan w loth3,4,128, louise V wain1,2,128, sina A gharib5,6,128, ma’en obeidat7,128, wenbo tang8,128, guangju Zhai9,10, Jing Hua Zhao11, Albert Vernon smith12,13, Jennifer e Huffman14, eva Albrecht15, catherine m Jackson16, david m evans17, gemma cadby18,19, myriam Fornage20,21, Ani manichaikul22,23, lorna m lopez24,25, toby Johnson26, melinda c Aldrich27,28, thor Aspelund12,13, Inês Barroso29,30, Harry campbell31, Patricia A cassano8, david J couper32, gudny eiriksdottir12, nora Franceschini33, melissa garcia34, christian gieger15, gauti kjartan gislason12, Ivica grkovic35, christopher J Hammond9, dana B Hancock36,37, tamara B Harris34, Adaikalavan Ramasamy38–40, susan R Heckbert41–43, markku Heliövaara44, georg Homuth45, Pirro g Hysi9, Alan l James46–48, stipan Jankovic35, Bonnie R Joubert36, stefan karrasch49, norman klopp50, Beate koch51, stephen B kritchevsky52, lenore J launer34, Yongmei liu53, laura R loehr33, kurt lohman54, Ruth J F loos11, thomas lumley55, khalid A Al Balushi7, wei Q Ang56, R graham Barr57, John Beilby58,59, John d Blakey7, mladen Boban60, Vesna Boraska60, Jonas Brisman61, John R Britton62, guy g Brusselle63, cyrus cooper64, Ivan curjuric65,66, santosh dahgam61, Ian J deary24,25, shah ebrahim67,68, mark eijgelsheim3, clyde Francks69, darya gaysina70, Raquel granell71, Xiangjun gu20, John l Hankinson72, Rebecca Hardy70, sarah e Harris24,73, John Henderson71, Amanda Henry7, Aroon d Hingorani74, Albert Hofman3,75, Patrick g Holt76, Jennie Hui48,59,77,78, michael l Hunter48,78, medea Imboden65,66, karen A Jameson64, shona m kerr79, Ivana kolcic60, Florian kronenberg80, Jason Z liu81, Jonathan marchini81, tricia mckeever62, Andrew d morris82, Anna-carin olin61, david J Porteous79, dirkje s Postma83, stephen s Rich22, susan m Ring71, Fernando Rivadeneira3,75,84, thierry Rochat85, Avan Aihie sayer64, Ian sayers7, Peter d sly76, george davey smith17, Akshay sood86, John m starr24,87, André g Uitterlinden3,75,84, Judith m Vonk88, s goya wannamethee89, Peter H whincup90, cisca wijmenga91, o dale williams92, Andrew wong70, massimo mangino9, kristin d marciante6,41, wendy l mcArdle71, Bernd meibohm93, Alanna c morrison21, kari e north33, ernst omenaas94, lyle J Palmer18,19, kirsi H Pietiläinen95–97, Isabelle Pin98–100, ozren Polašek60,101, Anneli Pouta102, Bruce m Psaty6,41–43, Anna-liisa Hartikainen103, taina Rantanen104, samuli Ripatti97,105, Jerome I Rotter106, Igor Rudan31,35,101, Alicja R Rudnicka90, Holger schulz107, so-Youn shin29, tim d spector9, Ida surakka97,105, Veronique Vitart14, Henry Völzke108, nicholas J wareham11, nicole m warrington19,56, H-erich wichmann107,109,110, sarah H wild31, Jemma B wilk111, matthias wjst112,113, Alan F wright14, lina Zgaga31,114, tatijana Zemunik60, craig e Pennell56, Fredrik nyberg61,115, diana kuh70, John w Holloway116,117, H marike Boezen88, debbie A lawlor17, Richard w morris89, nicole Probst-Hensch65,66, the International lung cancer consortium127, gIAnt consortium127, Jaakko kaprio44,96,97, James F wilson31, caroline Hayward14, mika kähönen118, Joachim Heinrich107, Arthur w musk47,48,78,119, deborah l Jarvis38,120, sven gläser121, marjo-Riitta Järvelin39,102,120,122,123, Bruno H ch stricker3,4,75,84,124,128, Paul elliott39,120,128, george t o’connor125,126,128, david P strachan90,128, stephanie J london36,128, Ian P Hall7,128, Vilmundur gudnason12,13,128 & martin d tobin1,2,128

© 2
011
Nat
ure
Am
eric
a, In
c. A
ll ri
gh
ts r
eser
ved
.©
201
1 N
atu
re A
mer
ica,
Inc.
All
rig
hts
res
erve
d.
1090 VOLUME 43 | NUMBER 11 | NOVEMBER 2011 Nature GeNetics
Branch, National Institute of Environmental Health Sciences, National Institutes of Health, Department of Health and Human Services, Research Triangle Park, North Carolina, USA. 37Behavioral Health Epidemiology Program, Research Triangle Institute International, Research Triangle Park, North Carolina, USA. 38Respiratory Epidemiology and Public Health, Imperial College London, London, UK. 39Department of Epidemiology and Biostatistics, Imperial College London, London, UK. 40Department of Medical and Molecular Genetics, King’s College London, Guy’s Hospital, London, UK. 41Cardiovascular Health Research Unit, University of Washington, Seattle, Washington, USA. 42Department of Epidemiology, University of Washington, Seattle, Washington, USA. 43Group Health Research Institute, Group Health Cooperative, Seattle, Washington, USA. 44National Institute for Health and Welfare, Helsinki, Finland. 45Interfaculty Institute for Genetics and Functional Genomics, Department of Functional Genomics, University of Greifswald, Greifswald, Germany. 46Department of Pulmonary Physiology and Sleep Medicine/West Australian Sleep Disorders Research Institute, Sir Charles Gairdner Hospital, Nedlands, Western Australia, Australia. 47The School of Medicine and Pharmacology, University of Western Australia, Perth, Western Australia, Australia. 48Busselton Population Medical Research Foundation, Department of Respiratory Medicine, Sir Charles Gairdner Hospital, Nedlands, Western Australia, Australia. 49Institute and Outpatient Clinic for Occupational, Social and Environmental Medicine, Ludwig-Maximilians-University, Munich, Germany. 50Unit for Molecular Epidemiology, Helmholtz Zentrum München-German Research Center for Environmental Health, Neuherberg, Germany. 51Department of Internal Medicine B, University Hospital Greifswald, Greifswald, Germany. 52Sticht Center on Aging, Wake Forest School of Medicine, Winston-Salem, North Carolina, USA. 53Epidemiology, Wake Forest School of Medicine, Winston-Salem, North Carolina, USA. 54Department of Biostatistical Sciences, Division of Public Health Sciences, Wake Forest University School of Medicine, Winston-Salem, North Carolina, USA. 55Department of Statistics, University of Auckland, Auckland, New Zealand. 56School of Women’s and Infants’ Health, The University of Western Australia, Perth, Western Australia, Australia. 57Department of Medicine, Columbia University Medical Center, New York, New York, USA. 58Department of Surgery and Pathology, University of Western Australia, Nedlands, Western Australia, Australia. 59PathWest Laboratory Medicine of Western Australia, Queen Elizabeth II Medical Centre, Nedlands, Western Australia, Australia. 60Faculty of Medicine, University of Split, Croatia, Split, Croatia. 61Occupational and Environmental Medicine, Department of Public Health and Community Medicine, Institute of Medicine, Sahlgrenska Academy, University of Gothenburg, Gothenburg, Sweden. 62Division of Epidemiology and Public Health, School of Community Health Sciences and Nottingham Respiratory Biomedical Research Unit, University of Nottingham, Nottingham, UK. 63Department of Respiratory Medicine, Ghent University Hospital, Ghent, Belgium. 64MRC Lifecourse Epidemiology Unit, University of Southampton, Southampton, UK. 65Chronic Disease Epidemiology, Swiss Tropical and Public Health (TPH) Institute, Basel, Switzerland. 66University of Basel, Switzerland. 67Non-Communicable Diseases Epidemiology Unit, Department of Epidemiology and Population Health, London School of Hygiene and Tropical Medicine, London, UK. 68South Asia Centre for Chronic Disease, New Delhi, India. 69Max Planck Institute for Psycholinguistics, Nijmegen, The Netherlands. 70MRC Unit for Lifelong Health and Ageing, London, UK. 71School of Social and Community Medicine, University of Bristol, Bristol, UK. 72Hankinson Consulting, Inc, Athens, Georgia, USA. 73Medical Genetics Section, The University of Edinburgh, Edinburgh, UK. 74Department of Epidemiology and Public Health, University College London, London, UK. 75Netherlands Genomics Initiative (NGI)-sponsored Netherlands Consortium for Healthy Aging (NCHA), The Netherlands. 76Telethon Institute for Child Health Research and Centre for Child Health Research, The University of Western Australia, Perth, Western Australia, Australia. 77School of Pathology and Laboratory Medicine, The University of Western Australia, Nedlands, Western Australia, Australia. 78School of Population Health, University of Western Australia, Nedlands, Western Australia, Australia. 79Molecular Medicine Centre, Institute of Genetics and Molecular Medicine, University of Edinburgh, Edinburgh, UK. 80Division of Genetic Epidemiology, Department of Medical Genetics, Molecular and Clinical Pharmacology, Innsbruck Medical University, Innsbruck, Austria. 81Department of Statistics, University of Oxford, Oxford, UK. 82Medical Research Institute, The University of Dundee, Dundee, UK. 83Department of Pulmonology, University Medical Center Groningen, University of Groningen, Groningen, The Netherlands. 84Department of Internal Medicine, Erasmus MC, Rotterdam, The Netherlands. 85Division of Pulmonary Medicine, University Hospitals of Geneva, Geneva, Switzerland. 86Department of Medicine, University of New Mexico, Albuquerque, New Mexico, USA. 87Geriatric Medicine Unit, The University of Edinburgh, Edinburgh, UK. 88Department of Epidemiology, University Medical Center Groningen, University of Groningen, Groningen, The Netherlands. 89Department of Primary Care and Population Health, University College London, London, UK. 90Division of Population Health Sciences and Education, St. George’s University of London, London, UK. 91Department of Genetics, University Medical Center Groningen, University of Groningen, Groningen, The Netherlands. 92Division of Preventive Medicine, University of Alabama at Birmingham, Birmingham, USA. 93College of Pharmacy, University of Tennessee Health Science Center, Memphis, Tennessee, USA. 94Centre for Clinical Research, Haukeland University Hospital, Bergen, Norway. 95Obesity Research Unit, Department of Medicine, Division of Internal Medicine, Helsinki University Central Hospital, Helsinki, Finland. 96Hjelt Institute, Department of Public Health, University of Helsinki, Helsinki, Finland. 97Institute for Molecular Medicine, University of Helsinki, Helsinki, Finland. 98Pédiatrie, Centre Hospitalier Universitaire (CHU), Grenoble, France. 99Inserm U823, Centre de Recherche Albert Bonniot, Grenoble, France. 100Université Joseph Fourier, Grenoble, France. 101Gen-Info Ltd, Zagreb, Croatia. 102Department of Children, Young People and Families, National Institute for Health and Welfare, Oulu, Finland. 103Institute of Clinical Medicine, University of Oulu, Oulu, Finland. 104Gerontology Research Centre, Department of Health Sciences, University of Jyväskylä, Jyväskylä, Finland. 105Public Health Genomics Unit, Department Of Chronic Disease Prevention, The National Institute for Health and Welfare, Helsinki, Finland. 106Medical Genetics Institute, Cedars-Sinai Medical Center, Los Angeles, California, USA. 107Institute of Epidemiology I, Helmholtz Zentrum München-German Research Center for Environmental Health, Neuherberg, Germany. 108Institute for Community Medicine, Study of Health In Pomerania (SHIP)/Clinical Epidemiological Research, University of Greifswald, Greifswald, Germany. 109Institute of Medical Informatics, Biometry and Epidemiology, Chair of Epidemiology, Ludwig-Maximilians-Universität, Munich, Germany. 110Klinikum Grosshadern, Munich, Germany. 111Division of Aging, Department of Medicine, Brigham and Women’s Hospital and Harvard Medical School, Boston, Massachusetts, USA. 112Institute of Lung Biology and Disease, Comprehensive Pneumology Center, Helmholtz Zentrum München, Neuherberg, Germany. 113Institute for Medical Statistics and Epidemiology (IMSE), Technical University Munich, Munich, Germany. 114Andrija Stampar School of Public Health, Faculty of Medicine, University of Zagreb, Zagreb, Croatia. 115AstraZeneca Research and Development, Mölndal, Sweden. 116Human Development and Health, Faculty of Medicine, University of Southampton, Southampton, UK. 117Infection, Inflammation and Immunity, Faculty of Medicine, University of Southampton, Southampton, UK. 118Department of Clinical Physiology, University of Tampere and Tampere University Hospital, Tampere, Finland. 119Department of Respiratory Medicine, Sir Charles Gairdner Hospital, Nedlands, Western Australia, Australia. 120MRC Health Protection Agency (HPA) Centre for Environment and Health, Imperial College London, London, UK. 121University Hospital Greifswald, Department of Internal Medicine B, Greifswald, Germany. 122Institute of Health Sciences, University of Oulu, Oulu, Finland. 123Biocenter Oulu, University of Oulu, Oulu, Finland. 124Department of Medical Informatics, Erasmus Medical Center, Rotterdam, The Netherlands. 125Pulmonary Center, Boston University School of Medicine, Boston, Massachusetts, USA. 126The National Heart, Lung and Blood Institute’s Framingham Heart Study, Framingham, Massachusetts, USA. 127A full list of members is provided in the supplementary Note. 128These authors contributed equally to this work. Correspondence should be addressed to M.D.T. ([email protected]) or S.J.L. ([email protected]).
A rt i c l e s
© 2
011
Nat
ure
Am
eric
a, In
c. A
ll ri
gh
ts r
eser
ved
.©
201
1 N
atu
re A
mer
ica,
Inc.
All
rig
hts
res
erve
d.
Nature GeNeticsdoi:10.1038/ng.941
ONLINEMEThODSStudy design. The study consisted of two stages. Stage 1 was a meta-analy-sis conducted on directly genotyped and imputed SNPs from individu-als of European ancestry in 23 studies with a total of 48,201 individuals. Supplementary Table 1a gives the details of these studies. Thirty-four SNPs selected according to the results in stage 1 were followed up in stage 2. The ten leading SNPs were followed up in up to 46,411 individuals of European ancestry, and the remaining 24 SNPs were followed up in a subset of up to 21,674 individuals (Fig. 1).
Stage 1 samples. A total of 23 studies, 17 from the SpiroMeta consortium and 6 from the CHARGE consortium, formed stage 1: AGES, ARIC, B58C T1DGC, B58C WTCCC, BHS1, CHS, ECRHS, EPIC (obese cases and population- based studies), the EUROSPAN studies (CROATIA-Korcula, ORCADES and CROATIA-Vis), FHS, FTC (incorporating the FinnTwin16 and Finnish Twin Study on Aging), Health 2000, Health ABC, KORA F4, KORA S3, NFBC1966, RS-I, RS-II, SHIP and TwinsUK-I (see Supplementary Table 1 for the definitions of all abbreviations). Measurements of spirometry for each study are described in the Supplementary Note. The genotyping platforms and quality-control criteria implemented by each study are described in Supplementary Table 1b.
Imputation. Imputation of non-genotyped SNPs was undertaken with MACH47, IMPUTE48 or BIMBAM49 with pre-imputation filters and param-eters as shown in Supplementary Table 1b. SNPs were excluded if the imputa-tion information, assessed using r2.hat (MACH), .info (IMPUTE) or OEvar (BIMBAM), was <0.3. In total, 2,706,349 SNPs were analyzed.
Transformation of data and genotype-phenotype association analysis. Linear regression of age, age2, sex, height and ancestry principal components was undertaken on FEV1 (milliliters) and FEV1/FVC (percent). The residuals were transformed to ranks and then transformed to normally distributed z-scores. These transformed residuals were then used as the phenotype for association testing under an additive genetic model, separately for ever smokers and never smokers. The software used is specified in Supplementary Table 1b. Appropriate tests for association in related individuals were applied where necessary, as described in the Supplementary Note.
Meta-analysis of stage 1 data. All stage 1 study effect estimates, both for ever smokers and never smokers, were corrected using genomic control50 and were oriented to the forward strand of the NCBI build 36 reference sequence of the human genome, consistently using the alphabetically higher allele as the coded allele. Study-specific λ estimates are shown in Supplementary Table 1. For each study, effect estimates and standard errors for ever smokers and never smokers were meta-analyzed using inverse-variance weighting. Genomic control was applied again to the pooled effect-size estimates for each study. Finally, effect-size estimates and standard errors were combined across studies using an inverse-variance–weighting meta-analysis, and genomic control was applied to the pooled effect-size estimates. To describe the effect of imper-fect imputation on power, for each SNP we report the effective sample size (N effective), which is the sum of the study-specific products of the sample size and the imputation quality metric. Meta-analysis statistics and figures were produced using R version 2.9.2 (see URLs).
Selection of SNPs for stage 2. All regions selected for follow up in stage 2 contained a lead SNP with new evidence of association (all with P < 3 × 10⁻⁶) with FEV1 and/or FEV1/FVC, an N effective ≥70% of the total stage 1 sample size and association signals from the surrounding SNPs that were consistent with their correlation (LD) with the leading SNP. Twenty-nine independent regions with a leading SNP meeting these criteria were assessed in stage 2. Regions were defined as independent if the leading SNP from one region was >500 kb from the leading SNP of any other region. Long-range LD was also investigated between leading SNPs of regions in or near the MHC on chromosome 6 (Supplementary Note). For two regions, the leading SNP had an N effective ≥70% but <80% of the stage 1 sample size and, therefore, a proxy SNP from each region (r2 = 1 and r2 = 0.97) was also taken forward. For three regions, there were different leading SNPs for FEV1 and FEV1/FVC,
and so both leading SNPs were assessed. A total of 34 SNPs were analyzed in stage 2 and are listed in Supplementary Table 5b. Previously reported regions8–11,51,52 were not followed up. We present in Supplementary Table 5a association test statistics in stage 1 only for relevant SNPs from previously reported regions.
Stage 2 samples. The 34 SNPs were followed up in up to 11,275 individuals from seven studies with in silico data: CARDIA, CROATIA-Split, LifeLines, LBC1936, MESA-Lung, RS-III and TwinsUK-II (Supplementary Table 1). rs2647044 was not available from TwinsUK-II.
The 34 SNPs were ranked by P value (for association with either FEV1 or FEV1/FVC), and the top ten leading SNPs were selected for follow up by genotyping in up to 35,136 individuals from ADONIX, BHS2, BRHS, BWHHS, Gedling, GS: SFHS, HCS, Nottingham Smokers, NSHD and SAPALDIA (Supplementary Table 1). If a SNP in the top ten had an N effective <80%, only the proxy SNP was included in the top ten for follow up. For regions that showed association with both FEV1 and FEV1/FVC, only the leading SNP with the lowest P value for either trait was included if it was within the top ten SNPs. The study design is illustrated in Figure 1.
Meta-analysis of stage 2 data. All stage 2 studies provided effect estimates for ever smokers and never smokers, apart from Nottingham Smokers, as that study only included smokers. Studies with family data (BHS2 and GS: SFHS) analyzed ever smokers and never smokers together to account for the family correlation, adding the smoking status as a covariate in the model, and therefore provided smoking-adjusted effect estimates. All stage 2 study effect estimates were oriented to the forward strand of the NCBI build 36 reference sequence of the human genome, consistently using the alphabetically higher allele as the coded allele. For each study with separate results for ever smok-ers and never smokers, effect estimates and standard errors for ever smokers and never smokers were meta-analyzed using inverse-variance weighting. Genomic control was applied to the pooled effect sizes of those studies with in silico data that undertook the analysis genome wide. Effect estimates and standard errors were combined across the stage 2 studies using an inverse-variance–weighting meta-analysis.
Combined analysis of stage 1 and stage 2 samples. A meta-analysis of stage 1 and 2 results was undertaken using inverse-variance weighting. We described associations as genome-wide significant if they had P < 5 × 10⁻⁸.
PCR expression profiling. The mRNA expression profiles of TGFB2, MFAP2, HDAC4, EVI1, RARB, SPATA9, ARMC2, NCR3, CDC123, LRP1, CCDC38, SNRPF, MMP15, CFDP1, ZKSCAN3, KCNE2 and C10orf11 were determined in human lung tissue and primary cell samples using RT-PCR, including RNA from lung (Ambion/ABI), brain, airway smooth muscle cells and human bronchial epithelial cells (Clonetics42). Primer sequences are listed in Supplementary Table 2. Full details are provided in the Supplementary Note.
Lung function associations in our data of SNPs previously associated with lung function. In order to permit comparison of findings with recent studies of relevance to the field, we present association test statistics (in stage 1 only) for relevant SNPs from previously reported regions (Supplementary Table 5a). We included the regions (i) reported as showing genome-wide significant association (P < 5 × 10⁻⁸) with lung function, (ii) reported as showing genome-wide significant association with COPD, providing that there was additional evidence of association with lung function and (iii) DAAM2, which reached borderline significance in the SpiroMeta consortium9. Within each of these regions, if multiple SNPs had been reported, we included all relevant SNPs and also the SNP that showed the strongest association in our data.
Association to other traits of lung-function–associated SNPs. Regions asso-ciated (P < 5 × 10⁻⁸) with lung function or COPD (and also associated with lung function) were looked up for other traits. Where multiple SNPs were reported for different traits or by different investigators, we aimed to include all relevant SNPs, except those having r2 > 0.9 with another SNP in the region. We also included the SNPs that showed the strongest association in our data for each region. The following related traits were assessed: (i) lung function in

© 2
011
Nat
ure
Am
eric
a, In
c. A
ll ri
gh
ts r
eser
ved
.©
201
1 N
atu
re A
mer
ica,
Inc.
All
rig
hts
res
erve
d.
Nature GeNetics doi:10.1038/ng.941
children (Supplementary Table 3a); (ii) smoking amount and ever smoking versus never smoking in the Ox-GSK consortium25 dataset (Supplementary Table 3b); (iii) height in the GIANT consortium14 dataset (Supplementary Table 3c,e); and (iv) lung cancer in the International Lung Cancer Consortium (ILCCO) GWAS meta-analysis26 (Supplementary Table 3d).
Estimation of the number of undiscovered variants and calculation of the proportion of variance explained. We used the approach previously proposed34 to estimate the number of independent variants associated with lung function measures that have similar effect sizes to the variants already reported and to calculate the proportion of the variance explained by them. We excluded discovery data when estimating effect sizes to avoid winner’s curse bias and obtained the number of undiscovered variants using the dis-covery power to detect the unbiased effect sizes (Supplementary Table 6 and Supplementary Note).
Additional analyses. The top SNPs from our new loci and their proxies were searched for correlation with known common copy number variants and expres-sion SNPs. Analyses to identify common pathways underlying the association
signals for lung function were undertaken using MAGENTA v2 (ref. 53) and GRAIL54. Full methods and results are given in the Supplementary Note.
47. Li, Y. & Abecasis, G.R. Mach 1.0: rapid haplotype construction and missing genotype inference. Am. J. Hum. Genet. s79, 2290 (2006).
48. Marchini, J., Howie, B., Myers, S., McVean, G. & Donnelly, P. A new multipoint method for genome-wide association studies by imputation of genotypes. Nat. Genet. 39, 906–913 (2007).
49. Servin, B. & Stephens, M. Imputation-based analysis of association studies: candidate regions and quantitative traits. PLoS Genet. 3, e114 (2007).
50. Devlin, B. & Roeder, K. Genomic control for association studies. Biometrics 55, 997–1004 (1999).
51. Cho, M.H. et al. Variants in FAM13A are associated with chronic obstructive pulmonary disease. Nat. Genet. 42, 200–202 (2010).
52. Pillai, S.G. et al. Loci identified by genome-wide association studies influence different disease-related phenotypes in chronic obstructive pulmonary disease. Am. J. Respir. Crit. Care Med. 182, 1498–1505 (2010).
53. Segrè, A.V., Groop, L., Mootha, V.K., Daly, M.J. & Altshuler, D. Common inherited variation in mitochondrial genes is not enriched for associations with type 2 diabetes or related glycemic traits. PLoS Genet. 6, e1001058 (2010).
54. Raychaudhuri, S. et al. Identifying relationships among genomic disease regions: predicting genes at pathogenic SNP associations and rare deletions. PLoS Genet. 5, e1000534 (2009).