Large-scale association analysis identifies new risk loci for coronary artery disease
22
Large-scale association analysis identifies new risk loci for coronary artery disease The CARDIoGRAMplusC4D Consortium 1 Abstract Coronary artery disease (CAD) is the commonest cause of death. Here, we report an association analysis in 63,746 CAD cases and 130,681 controls identifying 15 loci reaching genome-wide significance, taking the number of susceptibility loci for CAD to 46, and a further 104 independent variants (r 2 < 0.2) strongly associated with CAD at a 5% false discovery rate (FDR). Together, these variants explain approximately 10.6% of CAD heritability. Of the 46 genome-wide significant lead SNPs, 12 show a significant association with a lipid trait, and 5 show a significant association with blood pressure, but none is significantly associated with diabetes. Network analysis with 233 candidate genes (loci at 10% FDR) generated 5 interaction networks comprising 85% of these putative genes involved in CAD. The four most significant pathways mapping to these networks are linked to lipid metabolism and inflammation, underscoring the causal role of these activities in the genetic etiology of CAD. Our study provides insights into the genetic basis of CAD and identifies key biological pathways. © 2013 Nature America, Inc. All rights reserved. 1 A full list of authors and affiliations appears at the end of the paper. URLs. QVALUE software for FDR analysis, http://genomics.princeton.edu/storeylab/qvalue/; coronary heart disease statistics, http:// www.bhf.org.uk/publications/view-publication.aspx?ps=1002097; top 10 causes of death fact sheet 310, http://www.who.int/ mediacentre/factsheets/fs310/en/index.html; Uppsala Platform, http://molmed.medsci.uu.se/SNP+SEQ+Technology+Platform/ Genotyping. Accession codes. Summary statistics for the 79,138 SNPs considered in this study for association with CAD (SNPs with stage 1 and stage 2 data) are available at ftp://ftp.sanger.ac.uk/pub/cardiogramplusc4d/. Note: Supplementary information is available in the online version of the paper. AUTHOR CONTRIBUTIONS Writing committee: P. Deloukas, S. Kanoni, C.W., M.F., T.L.A., J.R.T., E.I., D. Saleheen, J.E., M.P. Reilly, R. Collins, S. Kathiresan, A.H., U.T., J.S.K., J.D., C.N.A.P., R.R., H.W., H.S. and N.J.S. Steering committee: P. Deloukas, S. Kanoni, C.W., M.F., T.L.A., J.R.T., E.I., D. Saleheen, J.E., M.P. Reilly, R. Collins, S. Kathiresan, A.H., U.T., J.S.K., J.D., C.N.A.P., R.R., H.W., H.S., N.J.S., S.S.B., B.O.B., J.C.C., R. Clarke, G.D., P.W.F., C.H., G.K.H., Jong-Young Lee, T.L., W.M., A.M., M.S.N., C.O., M.P., S. Ripatti, M.S.S., S.S., A. Siegbahn, C.J.W. and P.A.Z. Analysis committee: B.A.G., K. Stirrups, I.R.K., J.-B.C., Å.J., T.E., L.F., A.G., A.S. Havulinna, W.K.H., J.C.H., N.E., M.E.K., K. Kristiansson, P.L., L.-P.L., S. Rafelt, D. Shungin, R.J.S., G. Thorleifsson, E.T., N.V.Z., B.F.V., L.L.W., W.Z. and A.Z. Genotyping: D. Absher, I.B., C.B., S.C.-B., DIAGRAM Consortium, N.E.M., K.F., P.F., B.G., L.G., S.G., J.H., B.-G.H., S.E.H., T.K., J.W.K., C. Langenberg, C. Langford, M.I.M., M.M.-N., K.N., J.F.P., S. Rosinger, D.R., M.P. Rumpf, A. Schäfer, A.F.R.S., P.J.W. and Wellcome Trust Case Control Consortium. Array design: H.M.K. and N.W.R. Functional analyses: E.G., P.E., A.F.-C., A.L., O.M., S.M., MuTHER Consortium, T.-P.Y., A.H.G., E.S., T.P. and A.-C.S. Samples and phenotyping: (ADVANCE) A.S.G., C.I. and T.Q.; (AMC-PAS/SANQUIN) C.E.v.d.S. and H.B.; (Angio-Lüb/KORA) P. Diemert; (CADomics) P.S.W.; (CARDIOGENICS) F.C. and W.H.O.; (CHARGE) E.B., A.L.C., A.D. and V.G.; (Corogene) M.-L.L. and J.S.; (deCODE) G. Thorgeirsson, H.H. and K. Stefansson; (EPIC-NORFOLK) N.W.; (Estonian Biobank) E.M.; (FGENTCARD) D.G.; (FINCAVAS) M.K.; (FINRISK 2007/DILGOM) V.S.; (FRISCII) L.W.; (GerMIFS) T.I., C.M., K. Stark and M.E.Z.; (GLACIER) G.H.; (GoDARTS Dundee) A.S.F.D. and A.D.M.; (HPS) S.P.; (Korean GenRIC) Y.J., H.-S.K., Ji-Young Lee and J.E.P.; (LOLIPOP) S.-T.T.; (LURIC/AtheroRemo) R.L. and W. Koenig; (METSIM) J.K., M.B. and M.L.; (MIGen) R.D.; (MORGAM) K. Kuulasmaa, J.V., P.A., D. Arveiler., J.F., D.-A.T., N.K., A.P., P.B., M.M.F., A.E. and F.K.; (Ottawa Heart Genomics Study) G.A.W., S.L.H. and S.H.S.; (PennCATH/MedStar) S.E.E. and D.J.R.; (Pfizer-Broad-Malmo) D. Altshuler and D.C.; (PIVUS/Swedish Twin Registry) C.S., L.L. and N.L.P.; (PROMIS) A.R.; (SHEEP-SCARF) K.L. and U.d.F.; (THISEAS) M.D., G.K.; (Ulm-EMIL) W. Kratzer; and (WTCCC) A.J.B., P.S.B., M.S. and A.S. Hall. COMPETING FINANCIAL INTERESTS The authors declare no competing financial interests. NIH Public Access Author Manuscript Nat Genet. Author manuscript; available in PMC 2013 June 12. Published in final edited form as: Nat Genet. 2013 January ; 45(1): 25–33. doi:10.1038/ng.2480. NIH-PA Author Manuscript NIH-PA Author Manuscript NIH-PA Author Manuscript
-
Upload
independent -
Category
Documents
-
view
1 -
download
0
Transcript of Large-scale association analysis identifies new risk loci for coronary artery disease

Large-scale association analysis identifies new risk loci forcoronary artery disease
The CARDIoGRAMplusC4D Consortium1
AbstractCoronary artery disease (CAD) is the commonest cause of death. Here, we report an associationanalysis in 63,746 CAD cases and 130,681 controls identifying 15 loci reaching genome-widesignificance, taking the number of susceptibility loci for CAD to 46, and a further 104 independentvariants (r2 < 0.2) strongly associated with CAD at a 5% false discovery rate (FDR). Together,these variants explain approximately 10.6% of CAD heritability. Of the 46 genome-widesignificant lead SNPs, 12 show a significant association with a lipid trait, and 5 show a significantassociation with blood pressure, but none is significantly associated with diabetes. Networkanalysis with 233 candidate genes (loci at 10% FDR) generated 5 interaction networks comprising85% of these putative genes involved in CAD. The four most significant pathways mapping tothese networks are linked to lipid metabolism and inflammation, underscoring the causal role ofthese activities in the genetic etiology of CAD. Our study provides insights into the genetic basisof CAD and identifies key biological pathways.
© 2013 Nature America, Inc. All rights reserved.1A full list of authors and affiliations appears at the end of the paper.
URLs. QVALUE software for FDR analysis, http://genomics.princeton.edu/storeylab/qvalue/; coronary heart disease statistics, http://www.bhf.org.uk/publications/view-publication.aspx?ps=1002097; top 10 causes of death fact sheet 310, http://www.who.int/mediacentre/factsheets/fs310/en/index.html; Uppsala Platform, http://molmed.medsci.uu.se/SNP+SEQ+Technology+Platform/Genotyping.
Accession codes. Summary statistics for the 79,138 SNPs considered in this study for association with CAD (SNPs with stage 1 andstage 2 data) are available at ftp://ftp.sanger.ac.uk/pub/cardiogramplusc4d/.
Note: Supplementary information is available in the online version of the paper.
AUTHOR CONTRIBUTIONSWriting committee: P. Deloukas, S. Kanoni, C.W., M.F., T.L.A., J.R.T., E.I., D. Saleheen, J.E., M.P. Reilly, R. Collins, S.Kathiresan, A.H., U.T., J.S.K., J.D., C.N.A.P., R.R., H.W., H.S. and N.J.S. Steering committee: P. Deloukas, S. Kanoni, C.W., M.F.,T.L.A., J.R.T., E.I., D. Saleheen, J.E., M.P. Reilly, R. Collins, S. Kathiresan, A.H., U.T., J.S.K., J.D., C.N.A.P., R.R., H.W., H.S.,N.J.S., S.S.B., B.O.B., J.C.C., R. Clarke, G.D., P.W.F., C.H., G.K.H., Jong-Young Lee, T.L., W.M., A.M., M.S.N., C.O., M.P., S.Ripatti, M.S.S., S.S., A. Siegbahn, C.J.W. and P.A.Z. Analysis committee: B.A.G., K. Stirrups, I.R.K., J.-B.C., Å.J., T.E., L.F., A.G.,A.S. Havulinna, W.K.H., J.C.H., N.E., M.E.K., K. Kristiansson, P.L., L.-P.L., S. Rafelt, D. Shungin, R.J.S., G. Thorleifsson, E.T.,N.V.Z., B.F.V., L.L.W., W.Z. and A.Z. Genotyping: D. Absher, I.B., C.B., S.C.-B., DIAGRAM Consortium, N.E.M., K.F., P.F.,B.G., L.G., S.G., J.H., B.-G.H., S.E.H., T.K., J.W.K., C. Langenberg, C. Langford, M.I.M., M.M.-N., K.N., J.F.P., S. Rosinger, D.R.,M.P. Rumpf, A. Schäfer, A.F.R.S., P.J.W. and Wellcome Trust Case Control Consortium. Array design: H.M.K. and N.W.R.Functional analyses: E.G., P.E., A.F.-C., A.L., O.M., S.M., MuTHER Consortium, T.-P.Y., A.H.G., E.S., T.P. and A.-C.S. Samplesand phenotyping: (ADVANCE) A.S.G., C.I. and T.Q.; (AMC-PAS/SANQUIN) C.E.v.d.S. and H.B.; (Angio-Lüb/KORA) P.Diemert; (CADomics) P.S.W.; (CARDIOGENICS) F.C. and W.H.O.; (CHARGE) E.B., A.L.C., A.D. and V.G.; (Corogene) M.-L.L.and J.S.; (deCODE) G. Thorgeirsson, H.H. and K. Stefansson; (EPIC-NORFOLK) N.W.; (Estonian Biobank) E.M.; (FGENTCARD)D.G.; (FINCAVAS) M.K.; (FINRISK 2007/DILGOM) V.S.; (FRISCII) L.W.; (GerMIFS) T.I., C.M., K. Stark and M.E.Z.;(GLACIER) G.H.; (GoDARTS Dundee) A.S.F.D. and A.D.M.; (HPS) S.P.; (Korean GenRIC) Y.J., H.-S.K., Ji-Young Lee and J.E.P.;(LOLIPOP) S.-T.T.; (LURIC/AtheroRemo) R.L. and W. Koenig; (METSIM) J.K., M.B. and M.L.; (MIGen) R.D.; (MORGAM) K.Kuulasmaa, J.V., P.A., D. Arveiler., J.F., D.-A.T., N.K., A.P., P.B., M.M.F., A.E. and F.K.; (Ottawa Heart Genomics Study) G.A.W.,S.L.H. and S.H.S.; (PennCATH/MedStar) S.E.E. and D.J.R.; (Pfizer-Broad-Malmo) D. Altshuler and D.C.; (PIVUS/Swedish TwinRegistry) C.S., L.L. and N.L.P.; (PROMIS) A.R.; (SHEEP-SCARF) K.L. and U.d.F.; (THISEAS) M.D., G.K.; (Ulm-EMIL) W.Kratzer; and (WTCCC) A.J.B., P.S.B., M.S. and A.S. Hall.
COMPETING FINANCIAL INTERESTSThe authors declare no competing financial interests.
NIH Public AccessAuthor ManuscriptNat Genet. Author manuscript; available in PMC 2013 June 12.
Published in final edited form as:Nat Genet. 2013 January ; 45(1): 25–33. doi:10.1038/ng.2480.
NIH
-PA Author Manuscript
NIH
-PA Author Manuscript
NIH
-PA Author Manuscript

Coronary artery disease and its main complication, myocardial infarction, is the leadingcause of death worldwide. Although, epidemiological studies have identified many riskfactors for CAD, including plasma lipid concentrations, blood pressure, smoking, diabetesand markers of inflammation, a causal role has been proven only for some (for example,low-density lipoprotein (LDL) cholesterol and blood pressure), primarily throughrandomized clinical trials of drug therapy directed at the risk factor1. Twin and familystudies have documented that a significant proportion (40–50%) of susceptibility to CAD isheritable (for a review, see ref. 2). Because genotypes are not confounded by environmentalexposures, genetic analysis has the potential to define which risk factors are indeed causaland to identify pathways and therapeutic targets3,4. To date, genome-wide associationstudies (GWAS) have collectively reported a total of 31 loci, associated with CAD risk atgenome-wide significance (P < 5 × 10⁻⁸)5-13. However, variants at these loci explain lessthan 10% of the heritability of CAD. One likely reason for this is that, given the polygenicnature of complex traits and the relatively small observed effect sizes of the loci identified,many genuinely associated variants do not reach the stringent P-value threshold for genome-wide significance. Indeed, there is increasing evidence that the genetic architecture ofcommon traits involves a large number of causative alleles with very small effects14.Addressing this will require the discovery of additional loci while leveraging large-scalegenomic data to identify the molecular pathways underlying the pathogenesis of CAD. Suchdiscovery is facilitated by building molecular networks, on the basis of DNA, RNA andprotein interactions, which have nodes of known biological function that also show evidenceof association with risk variants for CAD and related metabolic traits.
In the largest GWAS meta-analysis of CAD undertaken to date by the Coronary ARteryDIsease Genome-wide Replication and Meta-analysis (CARDIoGRAM) Consortium5,which involved 22,233 cases and 64,762 controls, in addition to loci reported at genome-wide significance, a linkage disequilibrium (LD)-pruned set of 6,222 variants achieved anominal association P value of less than 0.01. Here, we test these 6,222 SNPs in a meta-analysis of over 190,000 individuals, with the primary aim of identifying additionalsusceptibility loci for CAD. To this end, we used the Metabochip array15, which is a customiSELECT chip (Illumina) containing 196,725 SNPs, designed to (i) follow-up putativeassociations in several cardiometabolic traits, including CAD, and (ii) fine map confirmedloci for these traits. All SNPs on the array with data in the CARDIoGRAM study wereconsidered for analysis (79,138 SNPs, of which 6,222 were the replication SNPs and 20,876were fine-mapping SNPs in the 22 CAD susceptibility loci identified at the time at which thearray was designed; the remaining SNPs were submitted by the other consortia contributingto the Metabochip array15). In addition, we assess whether the genome-wide significantCAD risk alleles act through traditional risk factors by considering the available largeGWAS for these traits16-20. Finally, we identify a broader set of SNPs passing aconservative FDR threshold for association with CAD and use this set to undertake networkanalysis to find key biological pathways underlying the pathogenesis of CAD.
RESULTSStudy design
We expanded the CARDIoGRAM discovery data set (22,233 cases and 64,762 controls5,stage 1) with 34 additional CAD sample collections (stage 2) of European or south Asiandescent comprising 41,513 cases and 65,919 controls (study descriptions and samplecharacteristics are given in Supplementary Tables 1a and 2a, respectively) and undertook a2-stage meta-analysis to test SNPs on the Metabochip array for disease association in a totalof 63,746 cases and 130,681 controls. A further set of 3,630 cases and 11,983 controls from4 independent studies was used for replication of SNPs that reached 5 × 10⁻⁸ < P < 1 × 10⁻⁶
in combined stage 1 and 2 analysis (stage 3; Supplementary Tables 1b and 2b). An overview
Page 2
Nat Genet. Author manuscript; available in PMC 2013 June 12.
NIH
-PA Author Manuscript
NIH
-PA Author Manuscript
NIH
-PA Author Manuscript

of the study design is provided in Supplementary Figure 1. Cases were selected for inclusionfollowing the standard criteria for CAD and myocardial infarction used in theCARDIoGRAM study5 (details for the stage 2 and 3 cohorts are given in SupplementaryTable 2). Collections were typed with either the Metabochip array (60% of samples) orprovided GWAS data imputed using HapMap (Supplementary Table 3). We appliedstandard quality control criteria to each study and corrected for population stratification ifλGC was ≥1.05 (estimated for samples typed on the Metabochip using 4,310 SNPsassociated with long QT syndrome and located at least 5 Mb away from established CADrisk loci; Online Methods). Case-control association analyses were adjusted for sex and age.For the 79,138 SNPs on the Metabochip with both stage 1 and 2 data, we combined (2-sided) P values from stage 1 with their respective (1-sided) P values for stage 2 usingFisher’s method (Online Methods). In stage 3, we validated SNPs at 5 × 10⁻⁸ < P < 1 × 10⁻⁶
and combined evidence across all stages (1– 3) using a sample size–weighted meta-analysis.
Genome-wide significant lociWe first examined the 30 CAD risk loci previously reported in individuals of Europeanancestry at genome-wide significance (the ADTRP (C6orf105) locus has been reported onlyin Chinese)12 in the stage 2 samples. For the 26 loci in which we could test the known leadSNP or a suitable proxy (r2 > 0.8), we found highly significant associations in the stage 2samples (Table 1). Notably, in four of these loci (CDKN2B-AS1, COL4A2, CXCL12 andAPOE), we detected additional SNPs not in LD (r2 < 0.5) with the lead SNP, which alsoreached genome-wide significance and were conditionally independent when analyzed withGCTA software21. The additional SNP in the APOE locus, rs445925 (P = 9.42 × 10⁻¹¹; r2 =0.015 with rs207560 in 1000 Genomes Project data), is located near APOC1, a genepreviously suggested to confer risk for CAD22. The r2 value between rs445925 (P = 9.42 ×10⁻¹¹; n = 31 studies) and rs7412 (P = 8.86 × 10⁻⁴; n = 21 studies), which tags the APOE e2allele,is 0.588. The LIPA locus also harbors a strong independent signal, which, however,did not reach genome-wide significance. Findings for the strongest associated variantavailable on the Metabochip for the other four loci (MIA3, 7q22, ZNF259-APOA5-APOA1and ADAMTS7) for which we did not have a good proxy for the previously reported leadSNP are also given (Table 1). Notably, for ADAMTS7, rs7173743 (r2 = 0.38 withrs3825807, the published lead SNP) also achieved genome-wide significance.
We next examined the association of the 6,222 SNPs with P < 0.01 in CARDIoGRAM (weexcluded SNPs in all loci listed in Table 1). Distribution of the absolute z scores for theseSNPs in the stage 2 samples showed strong enrichment in positive scores corresponding toSNPs with directionally consistent signals between stages 1 and 2 under the nulldistribution, which is defined by mean = 0 and s.d. = 1 (4,260 SNPs observed versus 3,111SNPs expected; binomial 2-sided P = 7.5 × 10−187) (Supplementary Fig. 2). In total, 19 locishowed association at P < 1 × 10⁻⁶ in the combined stage 1 and 2 analysis, with 13 of themreaching genome-wide significance, namely IL6R, APOB, VAMP5-VAMP8-GGCX,SLC22A4-SLC22A5, ZEB2-AC074093.1, GUCY1A3, KCNK5, LPL, PLG, TRIB1,ABCG5-ABCG8, FURIN-FES and FLT1 (Table 2; Forest and regional association plots aregiven in Supplementary Figs. 3 and 4, respectively). The 6 loci with associations notreaching P < 5 × 10⁻⁸ were further validated (stage 3) in 4 independent studies (3,630 casesand 11,983 controls; Supplementary Table 1b). Two loci, EDNRA and HDAC9 replicated atP < 0.05 and reached genome-wide significance in a combined analysis of stages 1-3 (Table2); findings for those SNPs not meeting the above criteria are shown in SupplementaryTable 4.
Of the newly associated loci reaching genome-wide significance, TRIB1 and ABCG5-ABCG8 were recently reported to reach study-wide significance (P < 3 × 10⁻⁶) in a largecandidate gene (IBC array) study of CAD13. The same study reported rs2706399 in the IL5
Page 3
Nat Genet. Author manuscript; available in PMC 2013 June 12.
NIH
-PA Author Manuscript
NIH
-PA Author Manuscript
NIH
-PA Author Manuscript
locus, which is located 200,349 bp away from the SNP we detected in the SLC22A4-SLC22A5 locus (rs273909; Table 2). Although located in the same recombination interval,these SNPs are not in LD (r2 = 0.02), and conditional analysis in a subset of 85,136 samples(up to19,200 cases) suggested that the 2 signals are conditionally independent; whenconditioning on rs2706399 (IL5 locus), the P value for rs273909 (SLC22A4 locus) was 5.54× 10⁻³ (1.33 × 10⁻³ initially), whereas the converse conditioning gave a P value of 3.34 ×10⁻² for rs2706399 (IL5; 7.55 × 10⁻³ initially). We also detected a second signal in the FESlocus (rs2521501; P = 1.31 × 10⁻⁹); conditional analysis with rs17514846 and rs2521501 (r2
= 0.43 in 1000 Genomes Project data) showed the two signals not only to be independent butto also increase in strength upon conditioning (rs17514846 associated at P = 1.07 × 10⁻²⁵
when conditioned on rs2521501; conversely, the P value for rs2521501 was 9.24 × 10⁻²⁶).
Subgroup analysesGenetic risk of CAD could vary by age and gender and could also specifically influence therisk of its main adverse outcome, myocardial infarction23. We therefore undertookexploratory association analyses in subgroups partitioned by either gender, age at event(with individuals of <50 years of age being defined as young cases) or history of myocardialinfarction (Online Methods). For the 46 genome-wide significant CAD risk loci, weobserved no trend for higher odds ratios (ORs) in any of the subgroup analyses(Supplementary Table 5). However, one new locus reached genome-wide significance inmales and in young CAD cases (rs16986953; P = 1.89 × 10⁻⁸ and 1.67 × 10⁻⁸, respectively),which is located in a gene desert (with nearest transcript AK097927), 1.3 Mb away from theAPOB gene. Interaction analysis conducted in a subset of studies (n = 12) where we hadindividual-level data provided suggestive evidence of an association with age (P = 0.033)but not with sex (P = 0.708); further studies are required to confirm this finding.
Wider Metabochip contentIn addition to SNPs provided by the CARDIoGRAM Consortium, the Metabochip arraycontains a further 113,248 SNPs submitted for a range of cardiometabolic traits15 other thanCAD itself (associated at P > 0.01 with CAD in CARDIoGRAM samples or not tested). Forthese SNPs, we did not detect any new locus reaching genome-wide significance in our dataset (including stage 1 and 3 data, when available). In total, therefore, we discovered 15newly associated loci at genome-wide significance, increasing the total number of genome-wide significant loci to 45 in individuals of European and south Asian ancestry.
Localizing candidate CAD genesTo identify potential causal CAD-associated genes at the 15 new susceptibility lociidentified in our study, we first analyzed genome-wide expression quantitative trait locus(eQTL) data in multiple tissues (circulating monocytes, liver, fat, skin, omentum, aorticmedia and adventitia, mammary artery and lymphoblastoid cell lines (LCLs)). We foundthat the lead SNP or a proxy in high LD (r2 ≥ 0.8) in three of the new loci was associated incis with variable expression levels of the GGCX-VAMP8, PLG and FES genes(Supplementary Table 6). We then assessed allele-specific expression data in monocytes,fibroblasts and LCLs and found three loci where the lead SNP was associated with animbalance in expression of either LPL, GGCX or FES; IL6R showed some evidence ofallele-specific expression in the fibroblast sample (Supplementary Table 6). Finally, weexamined the new CAD risk loci for genes with relevant disease trait associations in mouseknockout models; six loci harbor a gene for which a mouse knockout model has a relevantcardiovascular phenotype, namely ABCG8, APOB, GUCY1A3, PLG, LPL and FES(Supplementary Table 7). PLG is adjacent to LPA, and, although the PLG risk variantrs4252120[T] was strongly associated with elevated Lp(a) lipoprotein levels (P = 5 × 10⁻²⁴)in 3,698 PROCARDIS cases, it was associated with CAD independent of the LPA-linked
Page 4
Nat Genet. Author manuscript; available in PMC 2013 June 12.
NIH
-PA Author Manuscript
NIH
-PA Author Manuscript
NIH
-PA Author Manuscript

variant at rs3798220. A detailed discussion of the genes in each locus is provided in theSupplementary Note. Of the 30 previously reported CAD susceptibility loci in individuals ofEuropean and south Asian ancestry, mouse knockout models for the candidate genes PEMT,APOE, LDLR, COL4A1, LIPA, APOA1-APOA5, PPAP2B and PCSK9 also showphenotypic characteristics directly relevant to disease (Supplementary Table 7). In total,approximately a third of the 45 CAD loci contain a known functionally relevant candidategene.
Overlap with traditional risk factorsWe assessed both the known and new CAD susceptibility loci for overlap of associationswith a number of relevant traits for which summary statistics have been made available:lipid levels (GLGC)16, blood pressure (ICBPG)17, diabetes (DIAGRAM)18, glucometabolictraits (fasting insulin and fasting glucose concentrations, HOMA-B (homeostatic modelassessment-β score) and HOMA-IR (insulin resistance); MAGIC)19 and anthropometrictraits (GIANT)20,24. After applying a Bonferroni correction for the 51 independent CAD-associated alleles tested (44 loci; no data available for rs16986953 and rs2521501), 12 locishowed evidence of association (P < 1 × 10⁻⁴) between the lead CAD risk SNP and 1 ormore plasma lipid trait (total cholesterol, LDL cholesterol, high-density lipoprotein (HDL)cholesterol and triglyceride concentration) in the expected direction (the CAD risk allelewas associated with higher total cholesterol, LDL cholesterol and triglyceride concentrationsand lower HDL cholesterol concentration). These lead SNPs were most strongly associatedwith LDL cholesterol concentration at eight loci (APOB, ABCG5-ABCG8, PCSK9,SORT1, ABO, LDLR, APOE and LPA), with triglyceride concentration at two loci (TRIB1and the APOA5 cluster) and with HDL cholesterol concentration at one locus (ANKS1A).There was near-equivalent association for triglyceride and HDL cholesterol concentrationsat one locus (LPL). All loci except LPA and ANKS1A showed genome-wide significancefor association with a lipid trait. These results underscore the importance of LDL cholesterolas a causal CAD risk factor (Supplementary Table 8). At the SH2B3 locus, the CAD riskallele for rs3184504 was associated with both lower LDL cholesterol (P = 1.73 × 10⁻⁹) andHDL cholesterol (P = 4.97 × 10⁻⁶) concentration; one likely explanation is the presence ofindependent variants for CAD and LDL cholesterol. Two known CAD risk loci (CYP17A1-NT5C2 and SH2B3) and two of the new CAD susceptibility loci (GUCY1A3 and FES) havepreviously been associated with systolic (SBP) and diastolic (DBP) blood pressure17.Significant evidence for association with DBP was also observed for ZC3HC1(Supplementary Table 8). In contrast to the results for lipid concentration and bloodpressure, there was no significant association of any of the loci tested with type 2 diabetes(T2D). Consistent with this observation, none of the assessed glucometabolic traits (fastinginsulin and fasting glucose concentrations, HOMA-B and HOMA-IR) were related to theseCAD variants (at the ANKS1A locus, it was not the CAD risk SNP that was associated withfasting insulin concentration and HOMA-IR). Suggestive associations (P < 1 × 10⁻⁴) withbody mass index (BMI) and waist-hip ratio were observed in the CYP17A1-CNNM2-NT5C2 and RAI1-PEMT-RASD1 loci, respectively.
Additional suggestive associationsThe genome-wide significance threshold, P < 5 × 10⁻⁸, we used is the accepted criterion forreporting individual association signals, as for each experiment it controls the error rateamong common variants to less than 5%. However, SNPs showing suggestive associationwith a phenotype but not meeting this genome-wide threshold are likely to includeadditional true positive signals in well-powered studies (Supplementary Fig. 1). Such SNPsmay also be informative in predicting CAD risk and in constructing CAD-associatedbiological networks. To identify such variants, we undertook an FDR analysis to assess theproportion of false positive signals in a set of (nominally) significant SNPs25. The
Page 5
Nat Genet. Author manuscript; available in PMC 2013 June 12.
NIH
-PA Author Manuscript
NIH
-PA Author Manuscript
NIH
-PA Author Manuscript
Metabochip array contains both SNPs with priors in terms of association to CAD(CARDIoGRAM study P < 0.01) and blocks of highly correlated SNPs in fine-mappingregions. Therefore, to normalize the distribution of SNPs considered for FDR analysis, we(i) removed all SNPs in the CAD fine-mapping regions and LD-pruned (r2 < 0.2) SNPs inthe non CAD fine-mapping regions and (ii) adjusted the combined P values of all SNPs withpriors in stage 1 (P < 0.01) using fixed-effect inverse variance–weighted meta-analysis Pvalues for all other SNPs (Online Methods). In addition, we obtained 104 SNPs at an FDRthreshold of 5% and LD threshold of r2 < 0.2 (Supplementary Table 9). The median OR forCAD for these SNPs was 1.054 (interquartile range of 0.0199) per risk allele(Supplementary Fig. 5).
On the basis of a heritability estimate of 40% for CAD, the combination of the known andnewly associated SNPs within the 45 susceptibility loci (Tables 1 and 2) explainsapproximately 6% of the additive genetic variance of CAD. The addition of the 104 SNPsfrom FDR analysis increased the fraction explained to 10.6% (Online Methods).
Network analysisIn contrast to estimating heritability where we want to keep the false positive rate as low aspossible, in network analysis, we want to maximize the representation of potential networknodes in the gene set used. Thus, to perform network analysis, we selected the top 222 SNPsdefined by the FDR analysis (10% FDR; final P < 6.6 × 10⁻⁴) at an LD threshold of r2 ≤ 0.7and assigned 239 candidate genes on the basis of either eQTL data or physical proximity(Supplementary Table 10). We mapped 238 of the 239 genes in the Ingenuity KnowledgeBase and considered 233 for network construction (Online Methods) on the basis ofavailable data on interactions in humans, mice and/or rats (51 genes within the 46 genome-wide significant loci (set A) and 182 genes within the loci selected at FDR < 10% (set B)).Including neighboring genes, Ingenuity generated 9 networks comprising 553 nodes; theseincluded 48 (94.1%) of the genes in set A and 156 (85.7%) of those in set B (SupplementaryTable 10). We obtained 2 overlapping networks: ON1, which included networks 1, 2, 6 and8, comprising the majority of genes in both sets (33 and 83 in sets A and B, respectively),and ON2, which included networks 4 and 7 (Supplementary Table 10). The nine networkswere strongly enriched for genes (query set) known to be involved in lipid metabolism (P =1.48 × 10⁻⁹), cellular movement (blood and endothelial cells; P = 1.35 × 10⁻⁷) andprocesses such as tissue morphology (size and area of atherosclerotic lesion, quantity ofleukocytes, macrophages and smooth muscle cells; P = 9.66 × 10⁻¹⁰) and immune celltrafficking (migration and adhesion; P = 1.12 × 10⁻⁷). As a negative control in the networkanalysis, we used a set of 368 genes selected from the least significant SNPs in the FDRanalysis; the resulting networks showed no significant enrichment in relevant molecularfunctions and process (results described in detail in the Supplementary Note).
We then assessed how genes in the networks overlap with canonical pathways in theIngenuity database. The four most significant canonical pathways represented in thesenetworks are shown in Figure 1a. The top three pathways, atherosclerosis signaling, liver Xreceptor (LXR)/retinoid X receptor (RXR) activation and farnesoid X receptor (FXR)/RXRactivation, all harbor genes involved in lipid metabolism, including ten CAD risk loci(ABCG5-ABCG8, APOA1, APOA5, APOB, APOE, CXCL12, LDLR, LPA, LPL andPDGFD). This is in agreement with our finding that 12 CAD risk loci are associated withlipid levels at P < 1 × 10⁻⁴ (Supplementary Table 8). Notably, three of the top four pathwaysalso contain genes involved in inflammation. In addition to the atherosclerosis signaling andLXR/RXR activation pathways, the acute phase response signaling (AAPRS) pathway,which includes four CAD risk loci (APOA1, MRAS, IL6R and PLG), is involved ininflammation and, more specifically, the rapid inflammatory response that is triggered,among other factors, by tissue injury. Genes from both the lipid metabolism and
Page 6
Nat Genet. Author manuscript; available in PMC 2013 June 12.
NIH
-PA Author Manuscript
NIH
-PA Author Manuscript
NIH
-PA Author Manuscript

inflammation-related pathways map to all networks, except network 9, which harbors onlytwo genes (Supplementary Table 10). As shown for overlapping network ON1(Supplementary Fig. 6), genes in lipid metabolism and inflammation are interconnected andinclude both CAD-associated loci reaching genome-wide significance and candidate loci atFDR < 10%. Key interactions between CAD susceptibility genes (known, new and the FDRset) involved in lipid metabolism and inflammation are shown in Figure 1b; macrophagestake up oxidized LDL (ox-LDL) through their cell surface scavenger receptors to form foamcells. Foam cells secrete proinflammatory cytokines, such as interleukin (IL)-1, IL-6 andmatrix metalloproteinases, which can amplify the local inflammatory response and stimulatesmooth muscle cell proliferation and initial migration toward the lesion26. Regulation ofcollagen secretion by smooth muscle cells in the extracellular matrix is regulated by matrixmetalloproteinases. Reduction of collagen in the extracellular matrix will destabilize theplaque. Both COL4A1 and COL4A2 encode subunits of type IV collagen, which is themajor structural component of basement membranes lining the inner surface of bloodvessels. Metalloproteinases have a role in the maintenance of the extracellular matrix andremodeling, contributing to the transition of plaques from stable to vulnerable states (Fig.1b).
DISCUSSIONHere, we report the largest genetic study to date assessing the impact of common variationon CAD risk. On the basis of analyses involving 63,746 CAD cases and 130,681 controls,we identified 15 new risk alleles at genome-wide significance, bringing the total number ofconfirmed CAD susceptibility loci in individuals of European and south Asian ancestry to45. We also identified a further set of 104 likely independent (r2 < 0.2) SNPs associated atan FDR of 5% with ORs between 1.031 and 1.126 per risk allele. In total, we estimate thatthese variants explain approximately 10.6% of the additive genetic variance of CAD(although we note that this may be an overestimate, given that it was not obtained in anindependent sample). Our data also support the presence of additional true signals amongthe tested common SNPs that are likely to further contribute in explaining heritability; forexample, the P-value adjustment we applied in the FDR analysis penalized the replicationSNPs.
Among the 45 loci in individuals of European and south Asian ancestry that were confirmedto be associated with CAD, we found that 12 were significantly associated with theconcentrations of blood lipids (mainly with LDL cholesterol), and 5 were associated withblood pressure. These data support the known etiological relationships of plasma lipids andblood pressure with CAD. People with T2D seem to have a 1.5- to 2-fold higher risk ofCAD than those without diabetes27, but none of the 45 risk loci were associated withdiabetes status or with continuous levels of various glucometabolic traits. We note that, forthe binary variable of T2D status, inability to show associations with CAD risk loci mayreflect limited statistical power. The temporal relationship for comorbidity with bothdiabetes and CAD is complex: individuals with CAD without diabetes at diagnosis oftensubsequently develop T2D28. Furthermore, despite clear benefits in preventingmicrovascular disease (for example, retinopathy and nephropathy), intensive glucose controlin diabetics reduces the risk of cardiovascular disease relatively modestly29. However,before a final conclusion can be reached, as many cohorts contributing to this meta-analysisfocused by design on early disease manifestation or excluded diabetic individuals, a formaltesting of the relationship of T2D and CAD in Mendelian randomization experiments will benecessary. To this end, the large genetic association data set on CAD assembled here willalso facilitate testing of the causal relationship of other putative risk factors for CAD.
Page 7
Nat Genet. Author manuscript; available in PMC 2013 June 12.
NIH
-PA Author Manuscript
NIH
-PA Author Manuscript
NIH
-PA Author Manuscript

A desirable clinical goal is to integrate genetic information into a risk score for CAD in anattempt to provide improved predictive power over traditional risk factors in asymptomaticsubjects, such that preventative measures, where available, can be more appropriatelytargeted. Our findings provide an appropriate framework of 153 CAD risk variants (at thoseestablished as susceptibility loci meeting the genome-wide significance threshold andadditional suggestive loci with an FDR of <5%) for assessing a genetic risk score in well-powered prospective studies to determine whether they are sufficiently informative andindependent predictors to have potential for use in day-to-day practice.
Allowing for inherent limitations in selecting likely candidate genes at each locus, ournetwork analysis identified lipid metabolism and inflammation as key biological pathwaysinvolved in the genetic pathogenesis of CAD. Indeed, there was significant crosstalkbetween the lipid metabolism and inflammation pathways identified (Fig. 1). The emergenceof lipid metabolism as a key pathway provides a positive control for the network andpathway analysis. On the other hand, this analysis provides strong new evidence at themolecular level in support of the causal involvement of inflammatory mechanisms in thepathogenesis of coronary atherosclerosis30. The role of inflammation in atherosclerosis iswell documented in the literature26; for example, risk factors such as fat diet, smoking,hypertension, hyperglycemia, obesity and insulin resistance can trigger the expression ofadhesion molecules (upregulated by atherogenic lipoproteins such as ox-LDL, very-low-density lipoprotein (VLDL) and Lp(a) lipoprotein) by endothelial cells, leading to theattachment of monocytes to the arterial wall. Although our analysis identified as significantthe rapid inflammatory response pathway (mediated by NF-κB, MAPK and JAK-STATsignaling) that is primarily involved in innate immunity, many of the effector pathways ininnate and adaptive immunity are heavily overlapping, and both are likely to have a role inCAD pathogenesis26. The five CAD-related networks constitute a useful framework forfurther functional and mechanistic studies to elucidate the biological processes underlyingCAD pathogenesis and to investigate gene-environment interactions.
ONLINE METHODSMeta-analysis and combination of evidence across stages
Analyses were performed in each study (Supplementary Table 1a) to test the followingcomparisons: all CAD cases with all controls, adjusted for sex and age; male CAD caseswith male controls, adjusted for age; female CAD cases with female controls, adjusted forage; early-onset CAD cases with early age of onset (≤50 years) with all CAD controls,adjusted for sex; late-onset CAD cases (>50 years) with all controls, adjusted for sex; and allmyocardial infarction cases with all controls, adjusted for age and sex. Age was defined asthe recruitment age for controls and the event age for cases. We used the additive geneticmodel and fixed-effect inverse variance–weighted meta-analysis. SNPs were excluded fromthe meta-analysis if present in <17 GWAS and/or Metabochip or <13 Metabochip stage 2studies. Heterogeneity was evaluated using the Cochran’s Q and I2 statistics. For SNPs withnon-significant heterogeneity (P for Q > 0.01), we report fixed-effect model results. ForSNPs with significant heterogeneity (P for Q <0.01), we performed an outlier test comparingthe results in each study with the average of all other studies. For outliers (P < 0.01 or nostudies with data), we excluded the most extreme study and repeated the meta-analysis. If nooutliers were detected, but heterogeneity was significant, we used a random-effects modelthat was also used for all SNPs with significant heterogeneity in stage 1. In stage 3, we useda fixed-effect inverse variance-weighted meta-analysis.
The combination of evidence across stage 1 and stage 2 meta-analysis results was performedusing Fisher’s combined P-values method; using two-sided P values from stage 1 and one-sided P values from stage 2 for all SNPs with consistent direction of effect across the two
Page 8
Nat Genet. Author manuscript; available in PMC 2013 June 12.
NIH
-PA Author Manuscript
NIH
-PA Author Manuscript
NIH
-PA Author Manuscript

stages. We estimated the stage 1 and 2 combined effect sizes for SNPs in the known lociusing a fixed-effect inverse variance–weighted meta-analysis. The combination of evidenceacross stages 1–3 for the replication effort was performed using a sample size–weightedmeta-analysis for the selected SNPs. All participants gave written consent for participationin genetic studies, and the protocol of each study was approved by the corresponding localresearch ethics committee or institutional review board.
False discovery rateFDR control is an alternative approach to experiment-wise error rate control that allows forstatistical multiple testing; identifying as many significantly associated SNPs as possiblewith a tolerable false positive burden. FDR analysis is useful for selecting extended panelsof SNPs (and genes) for experiments on the basis of multiple signals (for example, pathwayor network analyses) that are robust to contamination by a small number of false positivesignals. However, given the specific design of the Metabochip array to include selectedSNPs (for replication) with significant P values and several high-density regions (for finemapping) associated with CAD and the other cardiometabolic traits, the number of SNPssignificantly associated with CAD, as well as high LD, could bias the FDR analysis.Therefore, we excluded from the 79,138 SNPs with available stage 1 and 2 data all SNPsfalling in a high-density region associated with CAD (Tables 1 and 2), as well as CAD riskSNPs associated at P < 5 × 10⁻⁸. Furthermore, we performed an LD-based SNP pruning ofthe remaining high-density regions (r2 < 0.2). In total, 54,806 SNPs were included in theFDR analysis.
We combined stage 1 and 2 data as an inverse variance–weighted average, and P valueswere calculated by Wald test. SNPs selected because their stage 1 P values were below 0.01had their combined P values adjusted. If p0 is the P value used as the criterion for selectionin stage 1, z12 is the standardized test statistic obtained by combining the stages (arbitrarilyassumed to be positive) and s1 and s2 are the standard errors for the two stages, then theadjusted P value is the sum of two integrals representing the two tails in which the stage 1result might fall. The first is:
and the second has the same form but is integrated from −∞ to Φ−1(p0/2), where Φ is thecumulative normal function. To test the adjusted P values, a simulation was performed inwhich null SNPs were generated and selected in stage 1 on the basis of their P values. Thesewere combined with random second-stage data simulated again assuming a null effect. Theadjusted P values had the expected uniform distribution between zero and one, suitable foruse in the FDR analysis.
FDR analysis was performed using QVALUE software. A natural cubic spline (with 4degrees of freedom) was fitted to provide a smoothed estimate of the proportion of null Pvalues ( ). A density histogram of the P values for the 54,806 SNPs is shown inSupplementary Figure 7. At FDR = 0.05, we obtained 138 SNPs that were combined with 73independent SNPs from fine-mapping regions associated with CAD. The selection includedthe SNP with the lowest combined P value per fine-mapping region and all SNPs withinthese regions that met the 5% FDR criterion in a separate analysis and were unlinked (r2 <0.2). Finally, all SNPs reported in Tables 1 and 2 were added to the set of 211 SNPs (5%FDR results and CAD fine-mapped regions), resulting in 153 independent SNPs (104
Page 9
Nat Genet. Author manuscript; available in PMC 2013 June 12.
NIH
-PA Author Manuscript
NIH
-PA Author Manuscript
NIH
-PA Author Manuscript
identified through the FDR analysis) at r2 < 0.2, which were used for heritabilitycalculations (Supplementary Table 9).
HeritabilityHeritability estimates were calculated locus by locus using the multifactorial liabilitythreshold model based on OR estimates that assume that the lead SNP at a locus accuratelytags the disease-causing variant, as described in ref. 12. The calculations are based on adisease prevalence estimate of 5% and an estimate of 40% for the total heritability ofcoronary disease.
Expression analysesWe interrogated the 16 new (or proxy; r2 > 0.8) CAD risk SNPs for cis eQTL expression inmultiple tissues: the ASAP study31 used tissue biopsies taken from patients undergoingcarotid endartectomy (plaque n = 117) or valve surgery (liver n = 152, aorta media n = 117,aorta adventitia n = 103 and mammary artery n = 88). Expression data were generated usingthe Affymetrix HG-U133 plus 2.0 array (plaque) or the Affymetrix ST1.0 Exon array (liver,aorta and mammary artery); in the MuTHER study32, RNA levels were measured in LCLs(n = 826), skin (n = 705) and fat biopsies (n = 825) from 850 female twins (one-thirdmonozygotic and two-thirds dizygotic) from the TwinsUK resource using the IlluminaHumanHT-12v3 array. We assessed genotype with gene expression associations, using anadditive linear model (within a 1-Mb window); in Cardiogenics5, monocytes andmacrophages were collected from healthy subjects and individuals with CAD, and RNA wasprofiled with the Illumina Human Ref-8 array. eQTL analysis was undertaken in 459 healthyindividuals from Cambridge, UK, using an additive linear model (1-Mb window); in theMassachusetts General Hospital study33 of liver, omentum and subcutaneous adipose tissueamong subjects undergoing Roux-en-Y gastric bypass surgery, eQTL analysis wasperformed with a linear regression model using a 1-Mb window.
In loci with significant cis-eQTL signal(s) (P < 1 × 10⁻⁴), we also identified the moststrongly associated cis-eQTL SNP (eSNP) for the corresponding transcript and thenperformed conditional analyses, including in the regression model, with either the lead eSNPor the lead CAD-associated SNP. On the basis of the conditional analysis, we determinedwhether the same variant underlies both gene expression regulation and disease.
Finally, we interrogated the lead SNPs in the 16 new CAD susceptibility loci for allelicexpression imbalance effects in LCLs, fibroblasts and monocytes (n = 188; Cardiogenics),as described in ref. 34.
Network analysisGenes for network analysis were selected using 310 SNPs (88 SNPs in known and newCAD risk loci and 222 SNPs at FDR <10% and LD pruned to r2 ≤ 0.7). We first selectedgenes with an eQTL (P ≤ 1 × 10⁻⁶) and then on the basis of physical proximity (includedoverlapping genes on opposite strands or at equal distance from the SNP; genes wereconsidered within a 40-kb window centered on the SNP). Spliced ESTs and putativetranscripts were not included. Network analysis was performed using the Ingenuity PathwayAnalysis software tool (IPA; Ingenuity Systems). We considered molecules and/orrelationships available in The IPA Knowledge Base for human, mouse or rat and set theconfidence filter to experimentally observed or high (predicted). Networks were generatedwith a maximum size of 70 genes, allowing up to 10 networks. Molecules in the query setwith recorded interactions were ‘eligible’ for network construction using the IPA algorithm.Networks were ranked according to their degree of relevance to the eligible molecules in thequery data set. The score takes into account the number of eligible molecules in the network
Page 10
Nat Genet. Author manuscript; available in PMC 2013 June 12.
NIH
-PA Author Manuscript
NIH
-PA Author Manuscript
NIH
-PA Author Manuscript

and its size, as well as the total number of eligible molecules analyzed and the total numberof molecules in the Ingenuity Knowledge Base that could potentially be included in thenetworks. The network score is based on the hypergeometric distribution and is calculatedby right-tailed Fisher’s exact test. The significance P value associated with enrichment offunctional processes was calculated using the right-tailed Fisher’s exact test by consideringthe number of query molecules that participate in that function and the total number ofmolecules that are known to be associated with that function in the Ingenuity KnowledgeBase.
Supplementary MaterialRefer to Web version on PubMed Central for supplementary material.
AcknowledgmentsWe thank the personnel of the Wellcome Trust Sanger Institute (WTSI) Genotyping Facility, in particular S.Edkins, for supervising the genotyping of the AMC-PAS, Cardiogenics, GLACIER, MORGAM, PROMIS,THISEAS, and WTCCC cohorts.
AMC-PAS/SANQUIN.
We thank A.A. Soussan for technical assistance.
We thank personnel from the Estonian Genome Center of the University of Tartu (EGCUT) and the EstonianBiocentre, especially M. Hass and V. Soo, for data generation.
FINCAVAS.
We thank the staff of the Department of Clinical Physiology for collecting the exercise test data.
The GLACIER Study.
The GLACIER study is a nested study within the Northern Sweden Health and Disease Study; phenotyping wasconducted as part of the Västerbotten Intervention Project.
We thank the participants and the investigators from these studies for their valuable contributions, with specificthanks to L. Weinehall, Å. Agren, K. Enquist and T. Johansson.
GoDARTS Dundee.
We are grateful to all the participants who took part in this study, to the general practitioners, to the Scottish Schoolof Primary Care for their help in recruiting the participants and to the whole team, which includes interviewers,computer and laboratory technicians, clerical workers, research scientists, volunteers, managers, receptionists andnurses. We acknowledge the support of the Health Informatics Centre at the University of Dundee in managing andsupplying the anonymized data and National Health Service (NHS) Tayside, the original data owner.
Heart Protection Study.
The study was designed and conducted by the Clinical Trial Service Unit & Epidemiological Studies Unit (CTSU)at the University of Oxford. Genotyping was supported by a grant to Oxford University and Centre National deGenotypage (CNG) from Merck. The funders had no role in the design of the study or in the data collection oranalysis. We especially acknowledge the participants in the study, the Steering Committee and our collaborators.J.C.H. acknowledges support from the British Heart Foundation (BHF) Centre of Research Excellence.
LOLIPOP.
We thank the participants and research staff who made the study possible.
MORGAM study.
We thank the contributing sites and key personnel, as detailed below.
Page 11
Nat Genet. Author manuscript; available in PMC 2013 June 12.
NIH
-PA Author Manuscript
NIH
-PA Author Manuscript
NIH
-PA Author Manuscript
Finland: We thank FINRISK, National Institute for Health and Welfare, Helsinki: V.S. (principal investigator), A.Juolevi, E. Vartiainen and P. Jousilahti; Alpha-Tocopherol, Beta-Carotene Cancer Prevention (ATBC) study,National Institute for Health and Welfare, Helsinki: J. Virtamo (principal investigator) and H. Kilpeläinen; theMORGAM Data Centre, National Institute for Health and Welfare, Helsinki: K. Kuulasmaa (responsible person),Z. Cepaitis, A. Haukijärvi, B. Joseph, J. Karvanen, S. Kulathinal, M. Niemelä and O. Saarela; and the MORGAMCentral Laboratory, National Institute for Health and Welfare, Helsinki: M.P. (responsible person), P. Laiho and M.Sauramo.
France: We thank the National Coordinating Centre, National Institute of Health and Medical Research (U258),Paris: P. Ducimetière (national coordinator) and A. Bingham; Prospective Epidemiological Study of MyocardialInfarction (PRIME)/Strasbourg, Department of Epidemiology and Public Health, EA 3430, University ofStrasbourg, Faculty of Medicine, Strasbourg: D. Arveiler (principal investigator), B. Haas and A. Wagner; PRIME/Toulouse, Department of Epidemiology, Toulouse University School of Medicine, Toulouse: J.F. (principalinvestigator), J.-B. Ruidavets, V. Bongard, D. Deckers, C. Saulet and S. Barrere; PRIME/Lille, Department ofEpidemiology and Public Health, INSERM U744-Université Lille Nord de France-Institut Pasteur de Lille, Lille: P.Amouyel (principal investigator), M. Montaye, B. Lemaire, S. Beauchant, D. Cottel, C. Graux, N. Marecaux, C.Steclebout and S. Szeremeta; and the MORGAM Laboratory, INSERM U937, Paris: F.C. (responsible person), L.Tiret and V. Nicaud.
Italy: We thank Centro Ricerche EPIMED-Epidemiologia e Medicina Preventiva, Dipartimento di Medicina Clinicae Sperimentale; Università dell’ Insubria, Varese: M.M.F. (principal investigator) and G. Veronesi; and ResearchCentre on Public Health, University of Milano-Bicocca, Monza: G. Cesana.
UK: We thank PRIME/Belfast, Queen’s University Belfast, Belfast: F.K. (principal investigator), A.E. (formerprincipal investigator), J. Yarnell and E. Gardner; and the MORGAM Coordinating Centre, Queen’s UniversityBelfast, Belfast: A.E. (MORGAM coordinator), S. Cashman and F.K. MORGAM management group: A.E. (chair),S.S.B., F.C., M.M.F., K. Kuulasmaa, A. Palotie, M.P., A.P., V.S., H. Tunstall-Pedoe and P.G. Wiklund. Previousmembers: K. Asplund, L. Peltonen, D. Shields and B. Stegmayr. The PRIME Study is organized under anagreement between INSERM and the Merck, Sharpe and Dohme-Chibret Laboratory, with the followingparticipating laboratories: The Strasbourg MONICA Project, Laboratoire d’Epidémiologie et de Santé Publique,and the Université de Strasbourg, Strasbourg, France (D. Arveiler and B. Haas); The Toulouse MONICA Project,UMR INSERM 1027, and the Department of Epidemiology, Toulouse University School of Medicine, UniversitéPaul Sabatier, Toulouse, France (J.F. and J.-B. Ruidavets); The Lille MONICA Project, INSERM U744, InstitutPasteur de Lille and Université Lille Nord de France, Lille, France (P. Amouyel and M. Montaye); The Departmentof Epidemiology and Public Health, Queen’s University, Belfast, Belfast, UK (A.E., J. Yarnell and F.K.); TheDepartment of Atherosclerosis, INSERM U545, Institut Pasteur de Lille, Faculté de Médecine and Université LilleNord de France, Lille, France (G. Luc and J.-M. Bard); The Laboratory of Haematology, INSERM U626, andHôpital La Timone, Marseille, France (I. Juhan-Vague and P. Morange); The Laboratory of Endocrinology,INSERM U563, Toulouse, France (B. Perret); The Vitamin Research Unit, The University of Bern, Bern,Switzerland (F. Gey); The Nutrition and Metabolism Group, Centre for Public Health, Queen’s University Belfast,Belfast, UK (J. Woodside and I. Young); The DNA Bank, INSERM/Université Pierre et Marie Curie (UPMC),Paris Université Unite Mixte de Recherche (UMRS) 937, Paris (F.C.); The Coordinating Centre, Institut Fédératifde Recherche Santé Publique (IFR 69), Villejuif, France (P. Ducimetière); and INSERM U970, Villejuif, France,and University Paris V, Paris Cardiovascular Research Centre (PAARC), Paris (A. Bingham).
PIVUS/Swedish Twin Registry.
We thank the SNP&SEQ Technology Platform in Uppsala (see URLs) for genotyping, in particular T. Axelsson,A.-C. Wiman and C. Pöntinen for excellent assistance.
Ulm (EMIL).
We thank the Centre of Excellence Baden-Wuerttemberg Metabolic Disorders.
WTCCC.
We thank the BHF Family Heart Study Research Group for the collection of the cases.
AppendixThe authors of this paper are:
Panos Deloukas1,126, Stavroula Kanoni1,126, Christina Willenborg2,126, Martin Farrall3,4,126,Themistocles L Assimes5,126, John R Thompson6,126, Erik Ingelsson7,126, Danish
Page 12
Nat Genet. Author manuscript; available in PMC 2013 June 12.
NIH
-PA Author Manuscript
NIH
-PA Author Manuscript
NIH
-PA Author Manuscript

Saleheen8-10,126, Jeanette Erdmann2,126, Benjamin A Goldstein5, Kathleen Stirrups1, Inke RKönig11, Jean-Baptiste Cazier4, Åsa Johansson12, Alistair S Hall13, Jong-Young Lee14,Cristen J Willer15,16, John C Chambers17, Tõnu Esko18,19, Lasse Folkersen20,21, AnujGoel3,4, Elin Grundberg22, Aki S Havulinna23, Weang K Ho10, Jemma C Hopewell24,25,Niclas Eriksson12, Marcus E Kleber26,27, Kati Kristiansson23, Per Lundmark28, Leo-PekkaLyytikäinen29,30, Suzanne Rafelt31, Dmitry Shungin32-34, Rona J Strawbridge20,21, GudmarThorleifsson35, Emmi Tikkanen36,37, Natalie Van Zuydam38, Benjamin F Voight39, LindsayL Waite40, Weihua Zhang17, Andreas Ziegler11, Devin Absher40, David Altshuler41-44,Anthony J Balmforth45, Inês Barroso1,46, Peter S Braund31,47, Christof Burgdorf48, SimoneClaudi-Boehm49, David Cox50, Maria Dimitriou51, Ron Do41,43, DIAGRAM Consortium52,CARDIOGENICS Consortium52, Alex S F Doney38, NourEddine El Mokhtari53, PerEriksson20,21, Krista Fischer18, Pierre Fontanillas41, Anders Franco-Cereceda54, BrunaGigante55, Leif Groop56, Stefan Gustafsson7, Jörg Hager57, Göran Hallmans58, Bok-GheeHan14, Sarah E Hunt1, Hyun M Kang59, Thomas Illig60, Thorsten Kessler48, Joshua WKnowles5, Genovefa Kolovou61, Johanna Kuusisto62, Claudia Langenberg63, CordeliaLangford1, Karin Leander55, Marja-Liisa Lokki64, Anders Lundmark28, Mark IMcCarthy3,65,66, Christa Meisinger67, Olle Melander56, Evelin Mihailov19, SerayaMaouche68, Andrew D Morris38, Martina Müller-Nurasyid69-72, MuTHER Consortium52,Kjell Nikus73, John F Peden3, N William Rayner3, Asif Rasheed9, Silke Rosinger74, DianaRubin53, Moritz P Rumpf48, Arne Schäfer75, Mohan Sivananthan76,77, Ci Song7, AlexandreF R Stewart78,79, Sian-Tsung Tan80, Gudmundur Thorgeirsson81,82, C Ellen van derSchoot83, Peter J Wagner36,37, Wellcome Trust Case Control Consortium52, George AWells78,79, Philipp S Wild84,85, Tsun-Po Yang1, Philippe Amouyel86, DominiqueArveiler87, Hanneke Basart88, Michael Boehnke59, Eric Boerwinkle89, Paolo Brambilla90,Francois Cambien68, Adrienne L Cupples91,92, Ulf de Faire55, Abbas Dehghan93, PatrickDiemert94, Stephen E Epstein95, Alun Evans96, Marco M Ferrario97, Jean Ferrières98,Dominique Gauguier3,99, Alan S Go100, Alison H Goodall31,47, Villi Gudnason81,101,Stanley L Hazen102, Hilma Holm35, Carlos Iribarren100, Yangsoo Jang103, MikaKähönen104, Frank Kee105, Hyo-Soo Kim106, Norman Klopp60, Wolfgang Koenig107,Wolfgang Kratzer108, Kari Kuulasmaa23, Markku Laakso62, Reijo Laaksonen108, Ji-YoungLee14, Lars Lind28, Willem H Ouwehand1,109,110, Sarah Parish24,25, Jeong E Park111, NancyL Pedersen7, Annette Peters67,112, Thomas Quertermous5, Daniel J Rader113, VeikkoSalomaa23, Eric Schadt114, Svati H Shah115,116, Juha Sinisalo117, Klaus Stark118, KariStefansson35,81, David-Alexandre Trégouët68, Jarmo Virtamo23, Lars Wallentin12, NicholasWareham63, Martina E Zimmermann118, Markku S Nieminen117, ChristianHengstenberg118, Manjinder S Sandhu1,63, Tomi Pastinen119, Ann-Christine Syvänen28, GKees Hovingh88, George Dedoussis51, Paul W Franks32-34,120, Terho Lehtimäki29,30,Andres Metspalu18,19, Pierre A Zalloua121, Agneta Siegbahn12, Stefan Schreiber75, SamuliRipatti1,37, Stefan S Blankenberg94, Markus Perola23, Robert Clarke24,25, Bernhard OBoehm74, Christopher O’Donnell93, Muredach P Reilly122,126, Winfried März26,123, RoryCollins24,25,126, Sekar Kathiresan41,124,125,126, Anders Hamsten20,21,126, Jaspal SKooner80,126, Unnur Thorsteinsdottir35,81,126, John Danesh9,126, Colin N A Palmer38,126,Robert Roberts78,79,126, Hugh Watkins3,4,126, Heribert Schunkert48,126 & Nilesh JSamani31,47,126
1Wellcome Trust Sanger Institute, Hinxton, Cambridge, UK. 2Institut für Integrative undExperimentelle Genomik, Universität zu Lübeck, Lübeck, Germany. 3Wellcome TrustCentre for Human Genetics, University of Oxford, Oxford, UK. 4Cardiovascular Medicine,Radcliffe Department of Medicine, University of Oxford, Oxford, UK. 5Department ofMedicine, Stanford University School of Medicine, Stanford, California, USA. 6Departmentof Health Sciences, University of Leicester, Leicester, UK. 7Department of MedicalEpidemiology and Biostatistics, Karolinska Institutet, Stockholm, Sweden. 8Center for Non-Communicable Diseases, Karachi, Pakistan. 9Department of Public Health and Primary
Page 13
Nat Genet. Author manuscript; available in PMC 2013 June 12.
NIH
-PA Author Manuscript
NIH
-PA Author Manuscript
NIH
-PA Author Manuscript

Care, University of Cambridge, Cambridge, UK. 10Department of Medicine, University ofPennsylvania, Philadelphia, Pennsylvania, USA. 11Institut für Medizinische Biometrie undStatistik, Universität zu Lübeck, Lübeck, Germany. 12Uppsala Clinical Research Center,Uppsala University, Uppsala, Sweden. 13Division of Cardiovascular and NeuronalRemodelling, Multidisciplinary Cardiovascular Research Centre, Leeds Institute ofGenetics, Health and Therapeutics, University of Leeds, Leeds, UK. 14Center for GenomeScience, Korea National Institute of Health, Korea Center for Disease Control andPrevention, Yeonje-ri, Chungwon-gun, Korea. 15Division of Cardiovascular Medicine,Department of Internal Medicine, University of Michigan, Ann Arbor, Michigan,USA. 16Department of Human Genetics, University of Michigan, Ann Arbor, Michigan,USA. 17Department of Epidemiology and Biostatistics, Imperial College London, London,UK. 18Estonian Genome Center, University of Tartu, Tartu, Estonia. 19Institute ofMolecular and Cell Biology, University of Tartu, Tartu, Estonia. 20Atherosclerosis ResearchUnit, Department of Medicine, Karolinska Institutet, Stockholm, Sweden. 21Center forMolecular Medicine, Karolinska University Hospital, Stockholm, Sweden. 22Department ofTwin Research and Genetic Epidemiology, King’s College London, London,UK. 23Department of Chronic Disease Prevention, National Institute for Health and Welfare,Helsinki, Finland. 24Clinical Trial Service Unit, University of Oxford, Oxford,UK. 25Epidemiological Studies Unit, University of Oxford, Oxford, UK. 26MannheimInstitute of Public Health, Social and Preventive Medicine, Medical Faculty of Mannheim,University of Heidelberg, Mannheim, Germany. 27Ludwigshafen Risk and CardiovascularHealth (LURIC) Study, Freiburg, Germany. 28Department of Medical Sciences, UppsalaUniversity, Uppsala, Sweden. 29Department of Clinical Chemistry, Fimlab Laboratories,Tampere University Hospital, Tampere, Finland. 30Department of Clinical Chemistry,University of Tampere School of Medicine, Tampere, Finland. 31Department ofCardiovascular Sciences, University of Leicester, Glenfield Hospital, Leicester,UK. 32Genetic & Molecular Epidemiology Unit, Department of Clinical Sciences, LundUniversity Diabetes Center, Skåne University Hospital, Malmö, Sweden. 33Department ofPublic Health & Clinical Medicine, Genetic Epidemiology & Clinical Research Group,Section for Medicine, Umeå University, Umeå, Sweden. 34Department of Odontology,Umeå University, Umeå, Sweden. 35deCODE Genetics, Reykjavik, Iceland. 36Institute forMolecular Medicine FIMM, University of Helsinki, Helsinki, Finland. 37Public HealthGenomics Unit, National Institute for Health and Welfare, Helsinki, Finland. 38MedicalResearch Institute, University of Dundee, Ninewells Hospital and Medical School, Dundee,UK. 39Department of Pharmacology, University of Pennsylvania, Philadelphia,Pennsylvania, USA. 40HudsonAlpha Institute for Biotechnology, Huntsville, Alabama,USA. 41Broad Institute of Harvard and MIT, Cambridge, Massachusetts,USA. 42Department of Molecular Biology, Massachusetts General Hospital, Boston,Massachusetts, USA. 43Center for Human Genetic Research, Massachusetts GeneralHospital, Boston, Massachusetts, USA. 44Department of Genetics, Harvard Medical School,Boston, Massachusetts, USA. 45Division of Cardiovascular and Diabetes Research,Multidisciplinary Cardiovascular Research Centre, Leeds Institute of Genetics, Health andTherapeutics, University of Leeds, Leeds, UK. 46University of Cambridge MetabolicResearch Laboratories, Institute of Metabolic Science, Addenbrooke’s Hospital, Cambridge,UK. 47National Institute for Health Research (NIHR) Leicester Cardiovascular BiomedicalResearch Unit, Glenfield Hospital, Leicester, UK. 48Deutsches Herzzentrum München,Technische Universität München, Munich, Germany. 49Practice of Gynecology, UlmUniversity Medical Centre, Ulm, Germany. 50Biotherapeutics and Bioinnovation Center,Pfizer, South San Francisco, California, USA. 51Department of Dietetics-Nutrition,Harokopio University, Athens, Greece. 52A list of members and affiliations appears in thesupplementary Note. 53Klinik für Innere Medizin, Kreiskrankenhaus Rendsburg, Rendsburg,Germany. 54Cardiothoracic Surgery Unit, Department of Molecular Medicine and Surgery,Karolinska Institutet, Stockholm, Sweden. 55Division of Cardiovascular Epidemiology,
Page 14
Nat Genet. Author manuscript; available in PMC 2013 June 12.
NIH
-PA Author Manuscript
NIH
-PA Author Manuscript
NIH
-PA Author Manuscript

Institute of Environmental Medicine, Karolinska Institutet, Stockholm,Sweden. 56Department of Clinical Sciences, Diabetes and Endocrinology, Lund University,University Hospital Malmö, Malmö, Sweden. 57Commissariat à l’Energie Atomique (CEA)-Genomics Institute, National Genotyping Centre, Paris, France. 58Department of PublicHealth & Clinical Medicine, Section for Nutritional Research, Umeå University, Umeå,Sweden. 59Department of Biostatistics, Center for Statistical Genetics, University ofMichigan, Ann Arbor, Michigan, USA. 60Hannover Unified Biobank, Hannover MedicalSchool, Hannover, Germany. 61First Cardiology Department, Onassis Cardiac SurgeryCenter 356, Athens, Greece. 62Department of Medicine, University of Eastern Finland andKuopio University Hospital, Kuopio, Finland. 63Medical Research Council (MRC)Epidemiology Unit, Institute of Metabolic Science, Addenbrooke’s Hospital, Cambridge,UK. 64Transplantation Laboratory, Haartman Institute, University of Helsinki, Helsinki,Finland. 65Oxford Centre for Diabetes, Endocrinology and Metabolism, University ofOxford, Oxford, UK. 66Oxford NIHR Biomedical Research Centre, Churchill Hospital,Oxford, UK. 67Institute of Epidemiology II, Helmholtz Zentrum München-GermanResearch Center for Environmental Health, Neuherberg, Germany. 68Institut National de laSanté et la Recherche Médicale (INSERM) Unité Mixte de Recherche (UMR) S937,Institute for Cardiometabolism and Nutrition (ICAN), Pierre and Marie Curie (Paris 6)University, Paris, France. 69Department of Medicine I, University Hospital Grosshadern,Ludwig-Maximilians-Universität, Munich, Germany. 70Chair of Epidemiology, Institute ofMedical Informatics, Biometry and Epidemiology, Ludwig-Maximilians-Universität,Munich, Germany. 71Chair of Genetic Epidemiology, Institute of Medical Informatics,Biometry and Epidemiology, Ludwig-Maximilians-Universität, Munich,Germany. 72Institute of Genetic Epidemiology, Helmholtz Zentrum München-GermanResearch Center for Environmental Health, Neuherberg, Germany. 73Heart Centre,Department of Cardiology, Tampere University Hospital, Tampere, Finland. 74Division ofEndocrinology and Diabetes, Department of Internal Medicine, Ulm University MedicalCentre, Ulm, Germany. 75Institut für Klinische Molekularbiologie, Christian-AlbrechtsUniversität, Kiel, Germany. 76Division of Epidemiology, Multidisciplinary CardiovascularResearch Centre (MCRC) University of Leeds, Leeds, UK. 77Leeds Institute of Genetics,Health and Therapeutics, University of Leeds, Leeds, UK. 78University of Ottawa HeartInstitute, Cardiovascular Research Methods Centre Ontario, Ottawa, Ontario,Canada. 79Ruddy Canadian Cardiovascular Genetics Centre, Ottawa, Ontario,Canada. 80National Heart and Lung Institute (NHLI), Imperial College London,Hammersmith Hospital, London, UK. 81Faculty of Medicine, University of Iceland,Reykjavik, Iceland. 82Department of Medicine, Landspitali University Hospital, Reykjavik,Iceland. 83Department of Experimental Immunohematology, Sanquin, Amsterdam, TheNetherlands. 84Center for Thrombosis and Hemostasis, University Medical Center Mainz,Johannes Gutenberg University Mainz, Mainz, Germany. 85Department of Medicine 2,University Medical Center Mainz, Johannes Gutenberg University Mainz, Mainz,Germany. 86Institut Pasteur de Lille, INSERM U744, Université Lille Nord de France, Lille,France. 87Department of Epidemiology and Public Health, EA3430, University ofStrasbourg, Strasbourg, France. 88Department of Vascular Medicine, Academic MedicalCenter, Amsterdam, The Netherlands. 89Human Genetics Center, University of TexasHealth Science Center, Houston, Texas, USA. 90Department of Experimental Medicine,University of Milano-Bicocca, Monza, Italy. 91Department of Biostatistics, BostonUniversity School of Public Health, Boston, Massachusetts, USA. 92National Heart, Lung,and Blood Institute’s Framingham Heart Study, Framingham, Massachusetts,USA. 93Department of Epidemiology, Erasmus Medical Center, Rotterdam, TheNetherlands. 94Clinic for General and Interventional Cardiology, University Heart CenterHamburg, Hamburg, Germany. 95Cardiovascular Research Institute, Washington HospitalCenter, Washington, DC, USA. 96Centre for Public Health, The Queen’s University ofBelfast, Belfast, UK. 97Research Centre for Epidemiology and Preventive Medicine
Page 15
Nat Genet. Author manuscript; available in PMC 2013 June 12.
NIH
-PA Author Manuscript
NIH
-PA Author Manuscript
NIH
-PA Author Manuscript

(EPIMED), Department of Clinical and Experimental Medicine, University of Insubria,Varese, Italy. 98Department of Cardiology, Toulouse University School of Medicine,Rangueil Hospital, Toulouse, France. 99INSERM UMR S872, Cordeliers Research Centre,Paris, France. 100Division of Research, Kaiser Permanente Northern California, Oakland,California, USA. 101Icelandic Heart Association, Kopavogur, Iceland. 102Lerner ResearchInstitute, Cleveland Clinic, Cleveland, Ohio, USA. 103Cardiology Division, Department ofInternal Medicine, Cardiovascular Genome Center, Yonsei University, Seoul,Korea. 104Department of Clinical Physiology, Tampere University Hospital and Universityof Tampere, Tampere, Finland. 105UK Clinical Research Collaboration (UKCRC) Centre ofExcellence for Public Health (Northern Ireland), Queen’s University of Belfast, Belfast,UK. 106Department of Internal Medicine, Cardiovascular Center, Seoul National UniversityHospital, Seoul, Korea. 107Department of Internal Medicine II-Cardiology, Ulm UniversityMedical Center, Ulm, Germany. 108Science Center, Tampere University Hospital, Tampere,Finland. 109Department of Haematology, University of Cambridge, Cambridge,UK. 110National Health Service (NHS) Blood and Transplant, Cambridge, UK. 111Divisionof Cardiology, Samsung Medical Center, Seoul, Korea. 112Munich Heart Alliance, Munich,Germany. 113Division of Translational Medicine and Human Genetics, Department ofMedicine, Perelman School of Medicine at the University of Pennsylvania, Philadelphia,Pennsylvania, USA. 114Institute for Genomics and Multiscale Biology, Department ofGenetics and Genomic Sciences, Mount Sinai School of Medicine, New York, New York,USA. 115Center for Human Genetics, Department of Medicine, Duke University MedicalCenter, Durham, North Carolina, USA. 116Division of Cardiology, Department of Medicine,Duke University Medical Center, Durham, North Carolina, USA. 117Division of Cardiology,Department of Medicine, Helsinki University Central Hospital (HUCH), Helsinki,Finland. 118Klinik und Poliklinik für Innere Medizin II, Regensburg,Germany. 119Department of Human Genetics, McGill University, Montréal, Québec,Canada. 120Department of Nutrition, Harvard School of Public Health, Boston,Massachusetts, USA. 121Lebanese American University, Chouran, Beirut,Lebanon. 122Cardiovascular Institute, Perelman School of Medicine at the University ofPennsylvania, Philadelphia, Pennsylvania, USA. 123Synlab Academy, Mannheim,Germany. 124Cardiology Division, Center for Human Genetic Research, MassachusettsGeneral Hospital and Harvard Medical School, Boston, Massachusetts,USA. 125Cardiovascular Research Center, Massachusetts General Hospital and HarvardMedical School, Boston, Massachusetts, USA. 126These authors contributed equally to thiswork. Correspondence should be addressed to P. Deloukas ([email protected]) or N.J.S.([email protected]).
References1. Berry JD, et al. Lifetime risks of cardiovascular disease. N. Engl. J. Med. 2012; 366:321–329.
[PubMed: 22276822]
2. Peden JF, Farrall M. Thirty-five common variants for coronary artery disease: the fruits of muchcollaborative labour. Hum. Mol. Genet. 2011; 20:R2, R198–R205. [PubMed: 21531790]
3. Kingsmore SF, Lindquist IE, Mudge J, Gessler DD, Beavis WD. Genome-wide association studies:progress and potential for drug discovery and development. Nat. Rev. Drug Discov. 2008; 7:221–230. [PubMed: 18274536]
4. Stein EA, et al. Effect of a monoclonal antibody to PCSK9 on LDL cholesterol. N. Engl. J. Med.2012; 366:1108–1118. [PubMed: 22435370]
5. Schunkert H, et al. Large-scale association analysis identifies 13 new susceptibility loci for coronaryartery disease. Nat. Genet. 2011; 43:333–338. [PubMed: 21378990]
6. Coronary Artery Disease (C4D) Genetics Consortium. A genome-wide association study inEuropeans and South Asians identifies five new loci for coronary artery disease. Nat. Genet. 2011;43:339–344. [PubMed: 21378988]
Page 16
Nat Genet. Author manuscript; available in PMC 2013 June 12.
NIH
-PA Author Manuscript
NIH
-PA Author Manuscript
NIH
-PA Author Manuscript

7. Clarke R, et al. Genetic variants associated with Lp(a) lipoprotein level and coronary disease. N.Engl. J. Med. 2009; 361:2518–2528. [PubMed: 20032323]
8. Samani NJ, et al. Genomewide association analysis of coronary artery disease. N. Engl. J. Med.2007; 357:443–453. [PubMed: 17634449]
9. Erdmann J, et al. New susceptibility locus for coronary artery disease on chromosome 3q22.3. Nat.Genet. 2009; 41:280–282. [PubMed: 19198612]
10. Kathiresan S, et al. Genome-wide association of early-onset myocardial infarction with singlenucleotide polymorphisms and copy number variants. Nat. Genet. 2009; 41:334–341. [PubMed:19198609]
11. Soranzo N, et al. A genome-wide meta-analysis identifies 22 loci associated with eighthematological parameters in the HaemGen consortium. Nat. Genet. 2009; 41:1182–1190.[PubMed: 19820697]
12. Wang F, et al. Genome-wide association identifies a susceptibility locus for coronary artery diseasein the Chinese Han population. Nat. Genet. 2011; 43:345–349. [PubMed: 21378986]
13. The IBC 50K CAD Consortium. Large-scale gene-centric analysis identifies novel variants forcoronary artery disease. PLoS Genet. 2011; 7:e1002260. [PubMed: 21966275]
14. Yang J, et al. Genome partitioning of genetic variation for complex traits using common SNPs.Nat. Genet. 2011; 43:519–525. [PubMed: 21552263]
15. Voight BF, et al. The Metabochip, a custom genotyping array for genetic studies of metabolic,cardiovascular, and anthropometric traits. PLoS Genet. 2012; 8:e1002793. [PubMed: 22876189]
16. Teslovich TM, et al. Biological, clinical and population relevance of 95 loci for blood lipids.Nature. 2010; 466:707–713. [PubMed: 20686565]
17. International Consortium for Blood Pressure Genome-Wide Association Studies. Genetic variantsin novel pathways influence blood pressure and cardiovascular disease risk. Nature. 2011;478:103–109. [PubMed: 21909115]
18. Voight BF, et al. Twelve type 2 diabetes susceptibility loci identified through large scaleassociation analysis. Nat. Genet. 2010; 42:579–589. [PubMed: 20581827]
19. Dupuis J, et al. New genetic loci implicated in fasting glucose homeostasis and their impact ontype 2 diabetes risk. Nat. Genet. 2010; 42:105–116. [PubMed: 20081858]
20. Speliotes EK, et al. Association analyses of 249,796 individuals reveal 18 new loci associated withbody mass index. Nat. Genet. 2010; 42:937–948. [PubMed: 20935630]
21. Yang J, et al. Conditional and joint multiple-SNP analysis of GWAS summary statistics identifiesadditional variants influencing complex traits. Nat. Genet. 2012; 44:369–375. [PubMed:22426310]
22. Ken-Dror G, Talmud PJ, Humphries SE, Dreno F. APOE/C1/C4/C2 gene cluster genotypes,haplotypes and lipid levels in prospective coronary heart disease risk among UK healthy men.Mol. Med. 2010; 16:389–399. [PubMed: 20498921]
23. Reilly MP, et al. Identification of ADAMTS7 as a novel locus for coronary atherosclerosis andassociation of ABO with myocardial infarction in the presence of coronary atherosclerosis: twogenome-wide association studies. Lancet. 2011; 377:383–392. [PubMed: 21239051]
24. Heid IM, et al. Meta-analysis identifies 13 new loci associated with waist-hip ratio and revealssexual dimorphism in the genetic basis of fat distribution. Nat. Genet. 2010; 42:949–960.[PubMed: 20935629]
25. Storey JD, Tibshirani R. Statistical methods for identifying differentially expressed genes in DNAmicroarrays. Methods Mol. Biol. 2003; 224:149–157. [PubMed: 12710672]
26. Hansson GK, Libby P, Schönbeck U, Yan Z-Q. Innate and adaptive immunity in the pathogenesisof atherosclerosis. Circ. Res. 2002; 91:281–291. [PubMed: 12193460]
27. Emerging Risk Factors Collaboration. Diabetes mellitus, fasting glucose, and risk of cause-specificdeath. N. Engl. J. Med. 2011; 364:829–841. [PubMed: 21366474]
28. Mozaffarian D, et al. Incidence of new-onset diabetes and impaired fasting glucose in patients withrecent myocardial infarction and the effect of clinical and lifestyle risk factors. Lancet. 2007;370:667–675. [PubMed: 17720018]
Page 17
Nat Genet. Author manuscript; available in PMC 2013 June 12.
NIH
-PA Author Manuscript
NIH
-PA Author Manuscript
NIH
-PA Author Manuscript
29. Turnbull FM, et al. Intensive glucose control and macrovascular outcomes in type 2 diabetes.Diabetologia. 2009; 52:2288–2298. [PubMed: 19655124]
30. Ross R. Atherosclerosis is an inflammatory disease. Am. Heart J. 1999; 138:S419–S420. [PubMed:10539839]
31. Folkersen L, et al. Association of genetic risk variants with expression of proximal genes identifiesnovel susceptibility genes for cardiovascular disease. Circ. Cardiovasc. Genet. 2010; 3:365–373.[PubMed: 20562444]
32. Grundberg E, et al. Mapping cis- and trans-regulatory effects across multiple tissues in twins: theMuTHER Study. Nat. Genet. 2012; 44:1084–1089. [PubMed: 22941192]
33. Schadt EE, et al. Mapping the genetic architecture of gene expression in human liver. PLoS Biol.2008; 6:e107. [PubMed: 18462017]
34. Ge B, et al. Global patterns of cis variation in human cells revealed by high-density allelicexpression analysis. Nat. Genet. 2009; 41:1216–1222. [PubMed: 19838192]
Page 18
Nat Genet. Author manuscript; available in PMC 2013 June 12.
NIH
-PA Author Manuscript
NIH
-PA Author Manuscript
NIH
-PA Author Manuscript
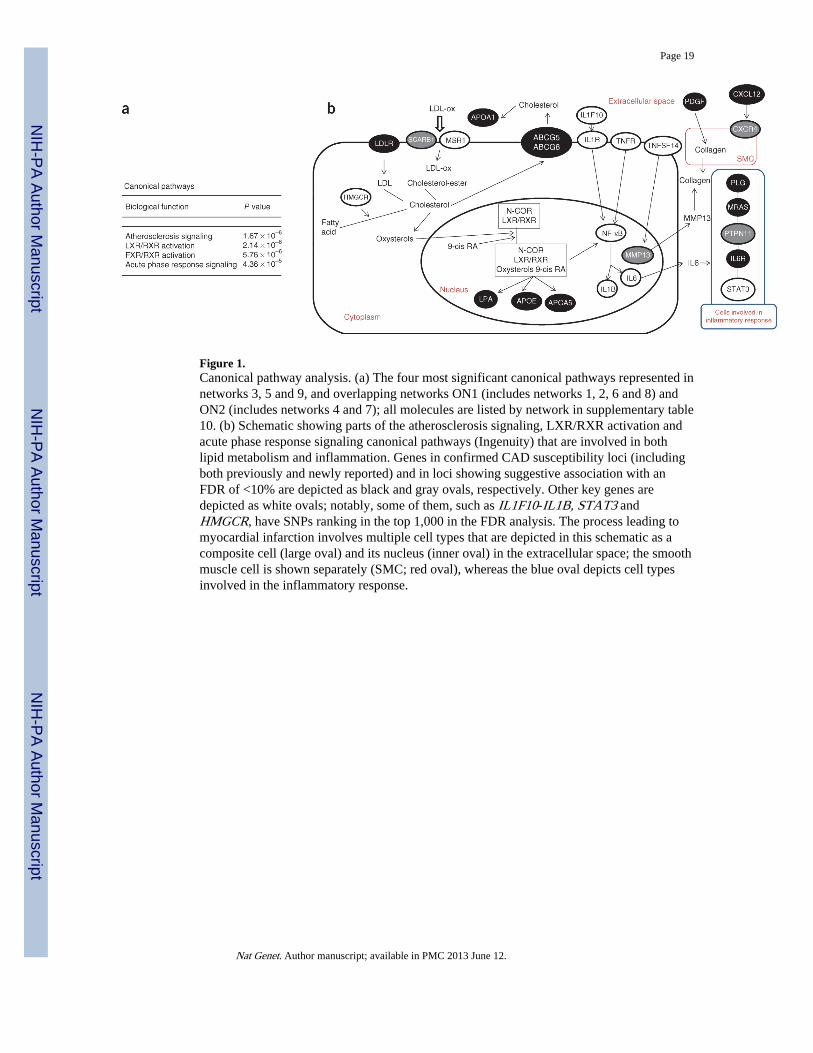
Figure 1.Canonical pathway analysis. (a) The four most significant canonical pathways represented innetworks 3, 5 and 9, and overlapping networks ON1 (includes networks 1, 2, 6 and 8) andON2 (includes networks 4 and 7); all molecules are listed by network in supplementary table10. (b) Schematic showing parts of the atherosclerosis signaling, LXR/RXR activation andacute phase response signaling canonical pathways (Ingenuity) that are involved in bothlipid metabolism and inflammation. Genes in confirmed CAD susceptibility loci (includingboth previously and newly reported) and in loci showing suggestive association with anFDR of <10% are depicted as black and gray ovals, respectively. Other key genes aredepicted as white ovals; notably, some of them, such as IL1F10-IL1B, STAT3 andHMGCR, have SNPs ranking in the top 1,000 in the FDR analysis. The process leading tomyocardial infarction involves multiple cell types that are depicted in this schematic as acomposite cell (large oval) and its nucleus (inner oval) in the extracellular space; the smoothmuscle cell is shown separately (SMC; red oval), whereas the blue oval depicts cell typesinvolved in the inflammatory response.
Page 19
Nat Genet. Author manuscript; available in PMC 2013 June 12.
NIH
-PA Author Manuscript
NIH
-PA Author Manuscript
NIH
-PA Author Manuscript

NIH
-PA Author Manuscript
NIH
-PA Author Manuscript
NIH
-PA Author Manuscript
Page 20
Tabl
e 1
Ass
ocia
tion
find
ings
for
kno
wn
CA
D s
usce
ptib
ility
loci
Kno
wn
loci
aP
ublis
hed
lead
SN
P o
r pr
oxy
New
SN
P(r
2 w
ith
lead
SN
P)
Chr
.E
ffec
t/no
n-ef
fect
alle
le (
freq
uenc
y)St
age
2 O
RSt
age
2 P
Com
bine
d P
Com
bine
d O
R
SOR
T1b
rs60
2633
(tag
ging
rs5
9983
9;r2
= 1
.00)
1C
/A (
0.77
)1.
132.
19 ×
10−
181.
47 ×
10−
251.
12
PCSK
9rs
1120
6510
1T
/C (
0.84
)1.
045.
09 ×
10−
31.
79 ×
10−
51.
06
WD
R12
rs67
2588
72
C/T
(0.
11)
1.10
5.29
× 1
0-8
1.16
× 1
0−15
1.12
MR
AS
rs98
1887
03
T/C
(0.
14)
1.05
1.83
× 1
0−3
2.62
× 1
0−9
1.07
TC
F21
rs12
1902
876
C/G
(0.
59)
1.04
6.48
× 1
0−4
4.94
× 1
0−13
1.07
SLC
22A
3-L
PAL
2-L
PArs
3798
220
6C
/T (
0.01
)1.
284.
90 ×
10−
5N
/AN
/A
rs20
4832
7 (0
.03)
6G
/A (
0.35
)1.
051.
09 ×
10−
56.
86 ×
10−
111.
06
ZC
3HC
1rs
1155
6924
7C
/T (
0.65
)1.
081.
45 ×
10−
96.
74 ×
10−
171.
09
CD
KN
2BA
S1rs
1333
049
9C
/G (
0.47
)1.
211.
08 ×
10−
341.
39 ×
10−
521.
23
rs32
1799
2 (0
.50)
9A
/G (
0.38
)1.
147.
27 ×
10−
327.
75 ×
10−
571.
16
AB
Ors
5794
599
C/T
(0.
21)
1.04
2.13
× 1
0−2
2.66
× 1
0−8
1.07
CY
P17A
1-C
NN
M2-
NT
5C2
rs12
4134
0910
G/A
(0.
89)
1.08
4.12
× 1
0−3
6.26
× 1
0−8
1.10
KIA
A14
62rs
2505
083
10C
/T (
0.42
)1.
062.
82 ×
10−
71.
35 ×
10−
111.
06
PDG
FDrs
9748
1911
A/G
(0.
29)
1.08
2.03
× 1
0−9
3.55
× 1
0−11
1.07
SH2B
3rs
3184
504
12T
/C (
0.40
)1.
076.
13 ×
10−
75.
44 ×
10−
111.
07
CO
L4A
1-C
OL
4A2
rs47
7314
413
G/A
(0.
42)
1.06
2.34
× 1
0−6
1.43
× 1
0−11
1.07
rs95
1520
3 (0
.01)
13T
/C (
0.74
)1.
081.
13 ×
10−
85.
85 ×
10−
121.
08
HH
IPL
1rs
2895
811
14C
/T (
0.43
)1.
041.
18 ×
10−
44.
08 ×
10−
101.
06
RA
I1-P
EM
T-R
ASD
1rs
1293
6587
17G
/A (
0.59
)1.
042.
06 ×
10−
41.
24 ×
10−
91.
06
LD
LR
rs11
2260
819
G/T
(0.
76)
1.06
3.72
× 1
0−6
6.33
× 1
0−14
1.10
Gen
e de
sert
(KC
NE
2)rs
9982
601
21T
/C (
0.13
)1.
108.
69 ×
10−
97.
67 ×
10−
171.
13
PPA
P2B
rs17
1140
361
A/G
(0.
91)
1.09
2.68
× 1
0−5
5.80
× 1
0−12
1.11
AN
KS1
Ars
1220
5331
(ta
ggin
g rs
1760
9940
; r2
= 0
.85)
6C
/T (
0.81
)1.
014.
36 ×
10-
14.
18 ×
10−
51.
04
PHA
CT
R1
rs93
6964
0 (t
aggi
ng r
s125
2645
3;r2
= 0
.90)
6A
/C (
0.65
)1.
091.
11 ×
10-
127.
53 ×
10−
221.
09
CX
CL
12rs
5011
2010
A/G
(0.
83)
1.06
7.13
× 1
0−5
1.79
× 1
0−9
1.07
Nat Genet. Author manuscript; available in PMC 2013 June 12.
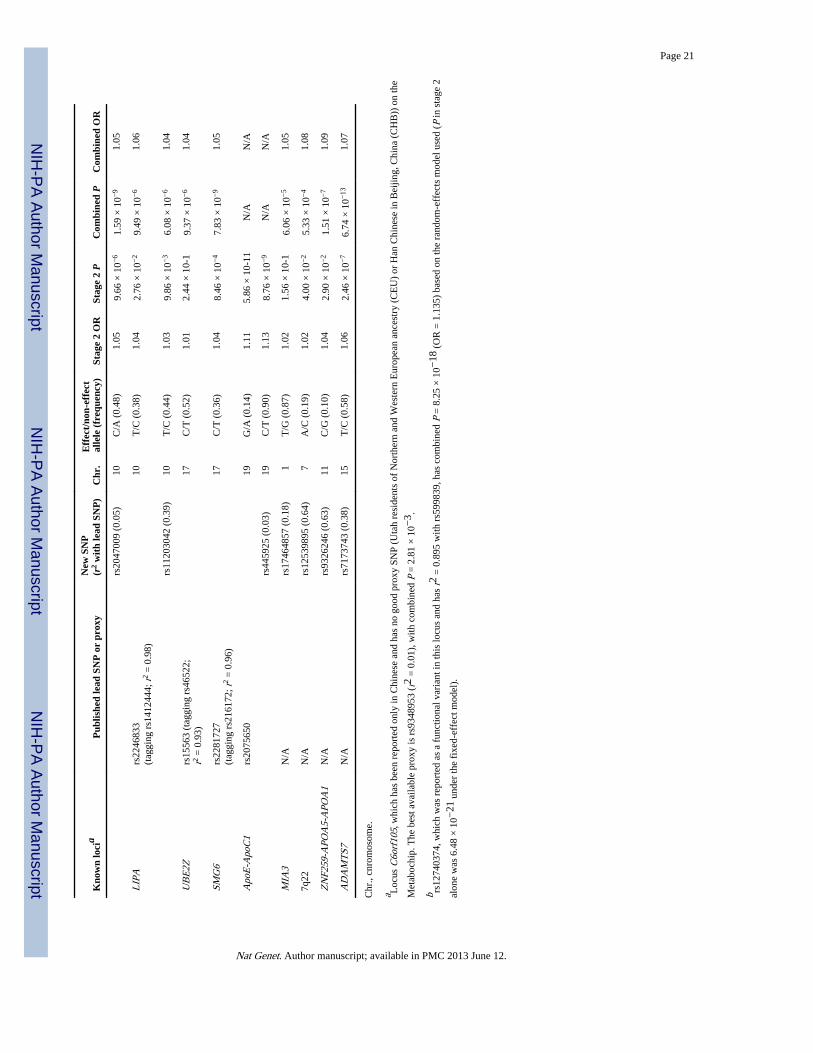
NIH
-PA Author Manuscript
NIH
-PA Author Manuscript
NIH
-PA Author Manuscript
Page 21
Kno
wn
loci
aP
ublis
hed
lead
SN
P o
r pr
oxy
New
SN
P(r
2 w
ith
lead
SN
P)
Chr
.E
ffec
t/no
n-ef
fect
alle
le (
freq
uenc
y)St
age
2 O
RSt
age
2 P
Com
bine
d P
Com
bine
d O
R
rs20
4700
9 (0
.05)
10C
/A (
0.48
)1.
059.
66 ×
10−
61.
59 ×
10−
91.
05
LIP
Ars
2246
833
(tag
ging
rs1
4124
44; r
2 =
0.9
8)10
T/C
(0.
38)
1.04
2.76
× 1
0−2
9.49
× 1
0−6
1.06
rs11
2030
42 (
0.39
)10
T/C
(0.
44)
1.03
9.86
× 1
0−3
6.08
× 1
0−6
1.04
UB
E2Z
rs15
563
(tag
ging
rs4
6522
;r2
= 0
.93)
17C
/T (
0.52
)1.
012.
44 ×
10-
19.
37 ×
10−
61.
04
SMG
6rs
2281
727
(tag
ging
rs2
1617
2; r2
= 0
.96)
17C
/T (
0.36
)1.
048.
46 ×
10−
47.
83 ×
10−
91.
05
Apo
E-A
poC
1rs
2075
650
19G
/A (
0.14
)1.
115.
86 ×
10-
11N
/AN
/A
rs44
5925
(0.
03)
19C
/T (
0.90
)1.
138.
76 ×
10−
9N
/AN
/A
MIA
3N
/Ars
1746
4857
(0.
18)
1T
/G (
0.87
)1.
021.
56 ×
10-
16.
06 ×
10−
51.
05
7q22
N/A
rs12
5398
95 (
0.64
)7
A/C
(0.
19)
1.02
4.00
× 1
0−2
5.33
× 1
0−4
1.08
ZN
F259
-APO
A5-
APO
A1
N/A
rs93
2624
6 (0
.63)
11C
/G (
0.10
)1.
042.
90 ×
10−
21.
51 ×
10−
71.
09
AD
AM
TS7
N/A
rs71
7374
3 (0
.38)
15T
/C (
0.58
)1.
062.
46 ×
10−
76.
74 ×
10−
131.
07
Chr
., cn
rom
osom
e.
a Loc
us C
6orf
105,
whi
ch h
as b
een
repo
rted
onl
y in
Chi
nese
and
has
no
good
pro
xy S
NP
(Uta
h re
side
nts
of N
orth
ern
and
Wes
tern
Eur
opea
n an
cest
ry (
CE
U)
or H
an C
hine
se in
Bei
jing,
Chi
na (
CH
B))
on
the
Met
aboc
hip.
The
bes
t ava
ilabl
e pr
oxy
is r
s934
8953
(r2
= 0
.01)
, with
com
bine
d P
= 2
.81
× 1
0−3 .
b rs12
7403
74, w
hich
was
rep
orte
d as
a f
unct
iona
l var
iant
in th
is lo
cus
and
has
r2 =
0.8
95 w
ith r
s599
839,
has
com
bine
d P
= 8
.25
× 1
0−18
(O
R =
1.1
35)
base
d on
the
rand
om-e
ffec
ts m
odel
use
d (P
in s
tage
2
alon
e w
as 6
.48
× 1
0−21
und
er th
e fi
xed-
effe
ct m
odel
).
Nat Genet. Author manuscript; available in PMC 2013 June 12.
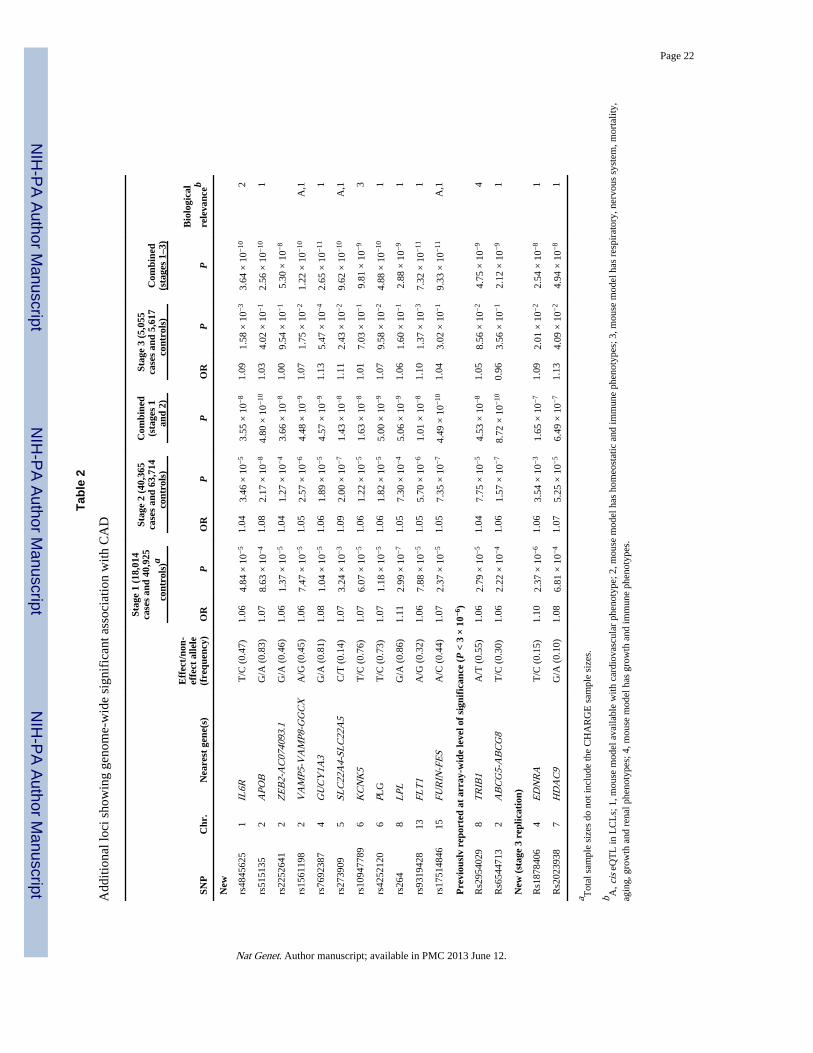
NIH
-PA Author Manuscript
NIH
-PA Author Manuscript
NIH
-PA Author Manuscript
Page 22
Tabl
e 2
Add
ition
al lo
ci s
how
ing
geno
me-
wid
e si
gnif
ican
t ass
ocia
tion
with
CA
D
Stag
e 1
(18,
014
case
s an
d 40
,925
co
ntro
ls)a
Stag
e 2
(40,
365
case
s an
d 63
,714
co
ntro
ls)
Com
bine
d(s
tage
s 1
an
d 2)
Stag
e 3
(5,0
55ca
ses
and
5,61
7
cont
rols
)C
ombi
ned
(sta
ges
1–3)
SNP
Chr
.N
eare
st g
ene(
s)
Eff
ect/
non-
effe
ct a
llele
(fre
quen
cy)
OR
PO
RP
PO
RP
P
Bio
logi
cal
rele
vanc
eb
New
rs48
4562
51
IL6R
T/C
(0.
47)
1.06
4.84
× 1
0−5
1.04
3.46
× 1
0−5
3.55
× 1
0−8
1.09
1.58
× 1
0−3
3.64
× 1
0−10
2
rs51
5135
2A
POB
G/A
(0.
83)
1.07
8.63
× 1
0−4
1.08
2.17
× 1
0−8
4.80
× 1
0−10
1.03
4.02
× 1
0−1
2.56
× 1
0−10
1
rs22
5264
12
ZE
B2-
AC
0740
93.1
G/A
(0.
46)
1.06
1.37
× 1
0−5
1.04
1.27
× 1
0−4
3.66
× 1
0−8
1.00
9.54
× 1
0−1
5.30
× 1
0−8
rs15
6119
82
VA
MP5
-VA
MP8
-GG
CX
A/G
(0.
45)
1.06
7.47
× 1
0−5
1.05
2.57
× 1
0−6
4.48
× 1
0−9
1.07
1.75
× 1
0−2
1.22
× 1
0−10
A,1
rs76
9238
74
GU
CY
1A3
G/A
(0.
81)
1.08
1.04
× 1
0−5
1.06
1.89
× 1
0−5
4.57
× 1
0−9
1.13
5.47
× 1
0−4
2.65
× 1
0−11
1
rs27
3909
5SL
C22
A4-
SLC
22A
5C
/T (
0.14
)1.
073.
24 ×
10−
31.
092.
00 ×
10−
71.
43 ×
10−
81.
112.
43 ×
10−
29.
62 ×
10−
10A
,1
rs10
9477
896
KC
NK
5T
/C (
0.76
)1.
076.
07 ×
10−
51.
061.
22 ×
10−
51.
63 ×
10−
81.
017.
03 ×
10−
19.
81 ×
10−
93
rs42
5212
06
PLG
T/C
(0.
73)
1.07
1.18
× 1
0−5
1.06
1.82
× 1
0−5
5.00
× 1
0−9
1.07
9.58
× 1
0−2
4.88
× 1
0−10
1
rs26
48
LPL
G/A
(0.
86)
1.11
2.99
× 1
0−7
1.05
7.30
× 1
0−4
5.06
× 1
0−9
1.06
1.60
× 1
0−1
2.88
× 1
0−9
1
rs93
1942
813
FLT
1A
/G (
0.32
)1.
067.
88 ×
10−
51.
055.
70 ×
10−
61.
01 ×
10−
81.
101.
37 ×
10−
37.
32 ×
10−
111
rs17
5148
4615
FUR
IN-F
ES
A/C
(0.
44)
1.07
2.37
× 1
0−5
1.05
7.35
× 1
0−7
4.49
× 1
0−10
1.04
3.02
× 1
0−1
9.33
× 1
0−11
A,1
Pre
viou
slv
repo
rted
at
arra
y-w
ide
leve
l of
sign
ific
ance
(P
< 3
× 1
0−6)
Rs2
9540
298
TR
IB1
A/T
(0.
55)
1.06
2.79
× 1
0−5
1.04
7.75
× 1
0−5
4.53
× 1
0−8
1.05
8.56
× 1
0−2
4.75
× 1
0−9
4
Rs6
5447
132
AB
CG
5-A
BC
G8
T/C
(0.
30)
1.06
2.22
× 1
0−4
1.06
1.57
× 1
0−7
8.72
× 1
0−10
0.96
3.56
× 1
0−1
2.12
× 1
0−9
1
New
(st
age
3 re
plic
atio
n)
Rs1
8784
064
ED
NR
AT
/C (
0.15
)1.
102.
37 ×
10−
61.
063.
54 ×
10−
31.
65 ×
10−
71.
092.
01 ×
10−
22.
54 ×
10−
81
Rs2
0239
387
HD
AC
9G
/A (
0.10
)1.
086.
81 ×
10−
41.
075.
25 ×
10−
56.
49 ×
10−
71.
134.
09 ×
10−
24.
94 ×
10−
81
a Tot
al s
ampl
e si
zes
do n
ot in
clud
e th
e C
HA
RG
E s
ampl
e si
zes.
b A, c
is e
QT
L in
LC
Ls;
1, m
ouse
mod
el a
vaila
ble
with
car
diov
ascu
lar
phen
otyp
e; 2
, mou
se m
odel
has
hom
eost
atic
and
imm
une
phen
otyp
es; 3
, mou
se m
odel
has
res
pira
tory
, ner
vous
sys
tem
, mor
talit
y,ag
ing,
gro
wth
and
ren
al p
heno
type
s; 4
, mou
se m
odel
has
gro
wth
and
imm
une
phen
otyp
es.
Nat Genet. Author manuscript; available in PMC 2013 June 12.