Paradigm for industrial strain improvement identifies sodium acetate tolerance loci in Zymomonas...
10
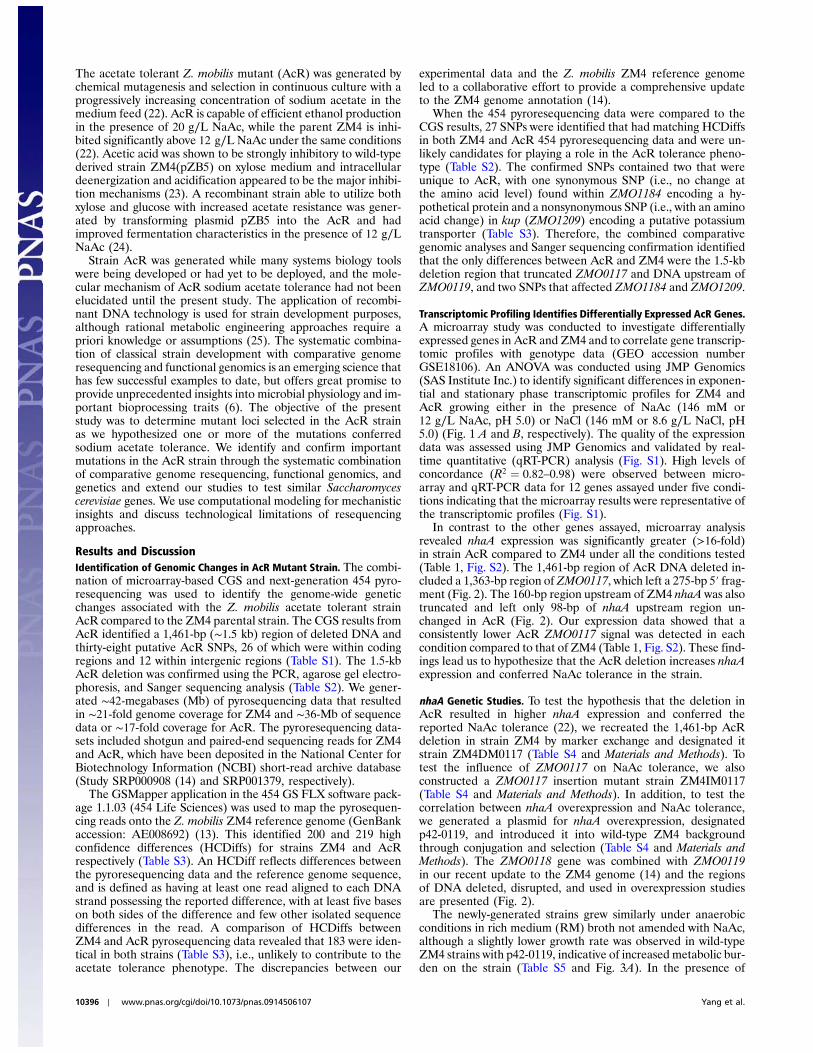
Paradigm for industrial strain improvement identifies sodium acetate tolerance loci in Zymomonas mobilis and Saccharomyces cerevisiae Shihui Yang a,b , Miriam L. Land a,b , Dawn M. Klingeman a,b , Dale A. Pelletier a , Tse-Yuan S. Lu a , Stanton L. Martin c , Hao-Bo Guo b,d , Jeremy C. Smith b,d , and Steven D. Brown a,b,1 a Biosciences Division and b BioEnergy Science Center, Oak Ridge National Laboratory, Oak Ridge, TN 37831; c North Carolina State University, Raleigh, NC 27606; and d University of Tennessee/Oak Ridge National Laboratory (ORNL) Center of Molecular and Biophysics, Oak Ridge National Laboratory, Oak Ridge, TN 37831 Edited* by Arnold L. Demain, Drew University, Madison, NJ, and approved April 9, 2010 (received for review December 17, 2009) The application of systems biology tools holds promise for rational industrial microbial strain development. Here, we characterize a Zymomonas mobilis mutant (AcR) demonstrating sodium acetate tolerance that has potential importance in biofuel development. The genome changes associated with AcR are determined using microarray comparative genome sequencing (CGS) and 454-pyro- sequencing. Sanger sequencing analysis is employed to validate genomic differences and to investigate CGS and 454-pyrosequen- cing limitations. Transcriptomics, genetic data and growth studies indicate that over-expression of the sodium-proton antiporter gene nhaA confers the elevated AcR sodium acetate tolerance phenotype. nhaA over-expression mostly confers enhanced sodium (Na þ ) tolerance and not acetate (Ac − ) tolerance, unless both ions are present in sufficient quantities. NaAc is more inhibitory than potassium and ammonium acetate for Z. mobilis and the combi- nation of elevated Na þ and Ac − ions exerts a synergistic inhibitory effect for strain ZM4. A structural model for the NhaA sodium- proton antiporter is constructed to provide mechanistic insights. We demonstrate that Saccharomyces cerevisiae sodium-proton antiporter genes also contribute to sodium acetate, potassium acetate, and ammonium acetate tolerances. The present combi- nation of classical and systems biology tools is a paradigm for ac- celerated industrial strain improvement and combines benefits of few a priori assumptions with detailed, rapid, mechanistic studies. ethanol ∣ inhibitor ∣ microarray ∣ sequencing ∣ systems biology R ecent high oil prices, concerns over energy security, and en- vironmental goals have reawakened interest in producing alternative fuels via large-scale industrial fermentation. Improve- ment in methods producing ethanol from cellulosic biomass is crucial in this goal. A key barrier to convert cellulosic biomass to ethanol is the recalcitrance of biomass to hydrolysis (1 and 2). Severe biomass pretreatments are required to release the C-5 and C-6 sugars, which, along with by-products of fermentation can also create inhibitors to the production of ethanol (see recent re- views (3 and 4)). A range of inhibitory chemicals are generated by pretreatment regimes including sugar degradation products such as furfural and hydroxymethylfurfural (HMF); weak acids such as acetic, formic, and levulinic acids; and lignin degradation pro- ducts such as the substituted phenolics vanillin and lignin mono- mers. High product yields, titers, and rapid product formation rates are considered prerequisites for industrial biofuel produc- tion (5). High substrate loadings are likely to be required in order to achieve an economically viable process, which in turn, is likely to lead to concomitant increases in inhibitor concentrations in fermentations and higher titers of the toxic, final product (5). The development and deployment of robust ethanologenic microorganisms resistant to industrially relevant inhibitors and with high-yield ethanol production will be a critical component in the successful production of fuel ethanol in industrial-scale quantities. However, little progress has been made toward understanding the genetic basis of tolerance to ethanol (5) and to date there have been only a few examples of metabolic engi- neering using systems biology tools for bioprocess development (6). The revolutionary influence of genomics upon the field of microbiology and the application of DNA microarrays have been reviewed previously (7 and 8). Yeast strains are the most frequently used microorganisms for industrial fuel production (9). However, engineered bacteria such as Escherichia coli, Zymomonas mobilis, and others are also being developed and deployed in search of superior production economics (2 and 10). Z. mobilis are Gram-negative facultative anaerobic bacteria with desirable industrial biocatalyst character- istics, such as high-specific productivity, high ethanol yield, and ethanol tolerance (12% v∕v) (10–12). The genome sequence of Z. mobilis strain ZM4 has been determined (13) and its anno- tation improved by our group recently (14). Wild-type strains are able to ferment only a limited range of C-6 sugars, although this limitation has been overcome through the development of recombinant strains able to ferment both hexose and pentose sugars such as xylose and arabinose so that major components of cellulosic biomass can be utilized (15 and 16). Other recombinant strains have been engineered to ferment xylose, arabinose, and other substrates with high yields, but low tolerance to acetic acid and decreased ethanol tolerance have been re- ported (10, 17–19). Acetic acid is an important inhibitor produced by the deace- tylation of hemicelluloses during biomass pretreatment. At pH 5.0, 36% of acetic acid is in the uncharged and undissociated form and is able to permeate the bacterial plasma membrane leading to uncoupling and anion accumulation causing cytoplasmic acidi- fication (20). The importance of acetic acid comes from the sig- nificant ratio of the concentration of acetate produced relative to fermentable sugars (21) and this ratio is higher in material from hardwoods (20). Synergistic or additive inhibitory effects are also likely with other hydrolysate inhibitors or metabolic by-products generated during the fermentation (3). Acetate removal pro- cesses have been described but they are energy or chemical- intensive and a full cost analysis has not been reported (21). Author contributions: S.Y., D.A.P., and S.D.B. designed research; S.Y., D.M.K., T.-Y.S.L., H.-B.G., and S.D.B. performed research; D.A.P. contributed new reagents/analytic tools; S.Y., M.L.L., S.L.M., H.-B.G., and S.D.B. analyzed data; and S.Y., H.-B.G., J.C.S., and S.D.B. wrote the paper. The authors declare no conflict of interest. *This Direct Submission article had a prearranged editor. Freely available online through the PNAS open access option. Data deposition: The sequences reported in this article have been deposited in the National Center for Biotechnology Information (NCBI) short-read archive database (Study SRP001379) GEO (accession number GSE18106). 1 To whom correspondence should be addressed. E-mail: [email protected]. This article contains supporting information online at www.pnas.org/lookup/suppl/ doi:10.1073/pnas.0914506107/-/DCSupplemental. www.pnas.org/cgi/doi/10.1073/pnas.0914506107 PNAS ∣ June 8, 2010 ∣ vol. 107 ∣ no. 23 ∣ 10395–10400 APPLIED BIOLOGICAL SCIENCES
Transcript of Paradigm for industrial strain improvement identifies sodium acetate tolerance loci in Zymomonas...

Paradigm for industrial strain improvement identifiessodium acetate tolerance loci in Zymomonasmobilis and Saccharomyces cerevisiaeShihui Yanga,b, Miriam L. Landa,b, Dawn M. Klingemana,b, Dale A. Pelletiera, Tse-Yuan S. Lua,Stanton L. Martinc, Hao-Bo Guob,d, Jeremy C. Smithb,d, and Steven D. Browna,b,1
aBiosciences Division and bBioEnergy Science Center, Oak Ridge National Laboratory, Oak Ridge, TN 37831; cNorth Carolina State University, Raleigh, NC27606; and dUniversity of Tennessee/Oak Ridge National Laboratory (ORNL) Center of Molecular and Biophysics, Oak Ridge National Laboratory,Oak Ridge, TN 37831
Edited* by Arnold L. Demain, Drew University, Madison, NJ, and approved April 9, 2010 (received for review December 17, 2009)
The application of systems biology tools holds promise for rationalindustrial microbial strain development. Here, we characterize aZymomonas mobilis mutant (AcR) demonstrating sodium acetatetolerance that has potential importance in biofuel development.The genome changes associated with AcR are determined usingmicroarray comparative genome sequencing (CGS) and 454-pyro-sequencing. Sanger sequencing analysis is employed to validategenomic differences and to investigate CGS and 454-pyrosequen-cing limitations. Transcriptomics, genetic data and growth studiesindicate that over-expression of the sodium-proton antiportergene nhaA confers the elevated AcR sodium acetate tolerancephenotype. nhaA over-expressionmostly confers enhanced sodium(Naþ) tolerance and not acetate (Ac−) tolerance, unless both ionsare present in sufficient quantities. NaAc is more inhibitory thanpotassium and ammonium acetate for Z. mobilis and the combi-nation of elevated Naþ and Ac− ions exerts a synergistic inhibitoryeffect for strain ZM4. A structural model for the NhaA sodium-proton antiporter is constructed to provide mechanistic insights.We demonstrate that Saccharomyces cerevisiae sodium-protonantiporter genes also contribute to sodium acetate, potassiumacetate, and ammonium acetate tolerances. The present combi-nation of classical and systems biology tools is a paradigm for ac-celerated industrial strain improvement and combines benefits offew a priori assumptions with detailed, rapid, mechanistic studies.
ethanol ∣ inhibitor ∣ microarray ∣ sequencing ∣ systems biology
Recent high oil prices, concerns over energy security, and en-vironmental goals have reawakened interest in producing
alternative fuels via large-scale industrial fermentation. Improve-ment in methods producing ethanol from cellulosic biomass iscrucial in this goal. A key barrier to convert cellulosic biomassto ethanol is the recalcitrance of biomass to hydrolysis (1 and 2).Severe biomass pretreatments are required to release the C-5 andC-6 sugars, which, along with by-products of fermentation canalso create inhibitors to the production of ethanol (see recent re-views (3 and 4)). A range of inhibitory chemicals are generated bypretreatment regimes including sugar degradation products suchas furfural and hydroxymethylfurfural (HMF); weak acids such asacetic, formic, and levulinic acids; and lignin degradation pro-ducts such as the substituted phenolics vanillin and lignin mono-mers. High product yields, titers, and rapid product formationrates are considered prerequisites for industrial biofuel produc-tion (5). High substrate loadings are likely to be required in orderto achieve an economically viable process, which in turn, is likelyto lead to concomitant increases in inhibitor concentrations infermentations and higher titers of the toxic, final product (5).
The development and deployment of robust ethanologenicmicroorganisms resistant to industrially relevant inhibitors andwith high-yield ethanol production will be a critical componentin the successful production of fuel ethanol in industrial-scalequantities. However, little progress has been made toward
understanding the genetic basis of tolerance to ethanol (5) andto date there have been only a few examples of metabolic engi-neering using systems biology tools for bioprocess development(6). The revolutionary influence of genomics upon the field ofmicrobiology and the application of DNA microarrays have beenreviewed previously (7 and 8).
Yeast strains are the most frequently used microorganisms forindustrial fuel production (9). However, engineered bacteria suchas Escherichia coli, Zymomonas mobilis, and others are also beingdeveloped and deployed in search of superior productioneconomics (2 and 10). Z. mobilis are Gram-negative facultativeanaerobic bacteria with desirable industrial biocatalyst character-istics, such as high-specific productivity, high ethanol yield, andethanol tolerance (12% v∕v) (10–12). The genome sequence ofZ. mobilis strain ZM4 has been determined (13) and its anno-tation improved by our group recently (14). Wild-type strainsare able to ferment only a limited range of C-6 sugars, althoughthis limitation has been overcome through the development ofrecombinant strains able to ferment both hexose and pentosesugars such as xylose and arabinose so that major componentsof cellulosic biomass can be utilized (15 and 16). Otherrecombinant strains have been engineered to ferment xylose,arabinose, and other substrates with high yields, but low toleranceto acetic acid and decreased ethanol tolerance have been re-ported (10, 17–19).
Acetic acid is an important inhibitor produced by the deace-tylation of hemicelluloses during biomass pretreatment. At pH5.0, 36% of acetic acid is in the uncharged and undissociated formand is able to permeate the bacterial plasma membrane leadingto uncoupling and anion accumulation causing cytoplasmic acidi-fication (20). The importance of acetic acid comes from the sig-nificant ratio of the concentration of acetate produced relative tofermentable sugars (21) and this ratio is higher in material fromhardwoods (20). Synergistic or additive inhibitory effects are alsolikely with other hydrolysate inhibitors or metabolic by-productsgenerated during the fermentation (3). Acetate removal pro-cesses have been described but they are energy or chemical-intensive and a full cost analysis has not been reported (21).
Author contributions: S.Y., D.A.P., and S.D.B. designed research; S.Y., D.M.K., T.-Y.S.L.,H.-B.G., and S.D.B. performed research; D.A.P. contributed new reagents/analytic tools;S.Y., M.L.L., S.L.M., H.-B.G., and S.D.B. analyzed data; and S.Y., H.-B.G., J.C.S., and S.D.B.wrote the paper.
The authors declare no conflict of interest.
*This Direct Submission article had a prearranged editor.
Freely available online through the PNAS open access option.
Data deposition: The sequences reported in this article have been deposited in theNational Center for Biotechnology Information (NCBI) short-read archive database (StudySRP001379) GEO (accession number GSE18106).1To whom correspondence should be addressed. E-mail: [email protected].
This article contains supporting information online at www.pnas.org/lookup/suppl/doi:10.1073/pnas.0914506107/-/DCSupplemental.
www.pnas.org/cgi/doi/10.1073/pnas.0914506107 PNAS ∣ June 8, 2010 ∣ vol. 107 ∣ no. 23 ∣ 10395–10400
APP
LIED
BIOLO
GICAL
SCIENCE
S
The acetate tolerant Z. mobilis mutant (AcR) was generated bychemical mutagenesis and selection in continuous culture with aprogressively increasing concentration of sodium acetate in themedium feed (22). AcR is capable of efficient ethanol productionin the presence of 20 g∕L NaAc, while the parent ZM4 is inhi-bited significantly above 12 g∕L NaAc under the same conditions(22). Acetic acid was shown to be strongly inhibitory to wild-typederived strain ZM4(pZB5) on xylose medium and intracellulardeenergization and acidification appeared to be the major inhibi-tion mechanisms (23). A recombinant strain able to utilize bothxylose and glucose with increased acetate resistance was gener-ated by transforming plasmid pZB5 into the AcR and hadimproved fermentation characteristics in the presence of 12 g∕LNaAc (24).
Strain AcR was generated while many systems biology toolswere being developed or had yet to be deployed, and the mole-cular mechanism of AcR sodium acetate tolerance had not beenelucidated until the present study. The application of recombi-nant DNA technology is used for strain development purposes,although rational metabolic engineering approaches require apriori knowledge or assumptions (25). The systematic combina-tion of classical strain development with comparative genomeresequencing and functional genomics is an emerging science thathas few successful examples to date, but offers great promise toprovide unprecedented insights into microbial physiology and im-portant bioprocessing traits (6). The objective of the presentstudy was to determine mutant loci selected in the AcR strainas we hypothesized one or more of the mutations conferredsodium acetate tolerance. We identify and confirm importantmutations in the AcR strain through the systematic combinationof comparative genome resequencing, functional genomics, andgenetics and extend our studies to test similar Saccharomycescerevisiae genes. We use computational modeling for mechanisticinsights and discuss technological limitations of resequencingapproaches.
Results and DiscussionIdentification of Genomic Changes in AcR Mutant Strain. The combi-nation of microarray-based CGS and next-generation 454 pyro-resequencing was used to identify the genome-wide geneticchanges associated with the Z. mobilis acetate tolerant strainAcR compared to the ZM4 parental strain. The CGS results fromAcR identified a 1,461-bp (∼1.5 kb) region of deleted DNA andthirty-eight putative AcR SNPs, 26 of which were within codingregions and 12 within intergenic regions (Table S1). The 1.5-kbAcR deletion was confirmed using the PCR, agarose gel electro-phoresis, and Sanger sequencing analysis (Table S2). We gener-ated ∼42-megabases (Mb) of pyrosequencing data that resultedin ∼21-fold genome coverage for ZM4 and ∼36-Mb of sequencedata or ∼17-fold coverage for AcR. The pyroresequencing data-sets included shotgun and paired-end sequencing reads for ZM4and AcR, which have been deposited in the National Center forBiotechnology Information (NCBI) short-read archive database(Study SRP000908 (14) and SRP001379, respectively).
The GSMapper application in the 454 GS FLX software pack-age 1.1.03 (454 Life Sciences) was used to map the pyrosequen-cing reads onto the Z. mobilis ZM4 reference genome (GenBankaccession: AE008692) (13). This identified 200 and 219 highconfidence differences (HCDiffs) for strains ZM4 and AcRrespectively (Table S3). An HCDiff reflects differences betweenthe pyroresequencing data and the reference genome sequence,and is defined as having at least one read aligned to each DNAstrand possessing the reported difference, with at least five baseson both sides of the difference and few other isolated sequencedifferences in the read. A comparison of HCDiffs betweenZM4 and AcR pyrosequencing data revealed that 183 were iden-tical in both strains (Table S3), i.e., unlikely to contribute to theacetate tolerance phenotype. The discrepancies between our
experimental data and the Z. mobilis ZM4 reference genomeled to a collaborative effort to provide a comprehensive updateto the ZM4 genome annotation (14).
When the 454 pyroresequencing data were compared to theCGS results, 27 SNPs were identified that had matching HCDiffsin both ZM4 and AcR 454 pyroresequencing data and were un-likely candidates for playing a role in the AcR tolerance pheno-type (Table S2). The confirmed SNPs contained two that wereunique to AcR, with one synonymous SNP (i.e., no change atthe amino acid level) found within ZMO1184 encoding a hy-pothetical protein and a nonsynonymous SNP (i.e., with an aminoacid change) in kup (ZMO1209) encoding a putative potassiumtransporter (Table S3). Therefore, the combined comparativegenomic analyses and Sanger sequencing confirmation identifiedthat the only differences between AcR and ZM4 were the 1.5-kbdeletion region that truncated ZMO0117 and DNA upstream ofZMO0119, and two SNPs that affected ZMO1184 and ZMO1209.
Transcriptomic Profiling Identifies Differentially Expressed AcR Genes.A microarray study was conducted to investigate differentiallyexpressed genes in AcR and ZM4 and to correlate gene transcrip-tomic profiles with genotype data (GEO accession numberGSE18106). An ANOVA was conducted using JMP Genomics(SAS Institute Inc.) to identify significant differences in exponen-tial and stationary phase transcriptomic profiles for ZM4 andAcR growing either in the presence of NaAc (146 mM or12 g∕L NaAc, pH 5.0) or NaCl (146 mM or 8.6 g∕L NaCl, pH5.0) (Fig. 1 A and B, respectively). The quality of the expressiondata was assessed using JMP Genomics and validated by real-time quantitative (qRT-PCR) analysis (Fig. S1). High levels ofconcordance (R2 ¼ 0.82–0.98) were observed between micro-array and qRT-PCR data for 12 genes assayed under five condi-tions indicating that the microarray results were representative ofthe transcriptomic profiles (Fig. S1).
In contrast to the other genes assayed, microarray analysisrevealed nhaA expression was significantly greater (>16-fold)in strain AcR compared to ZM4 under all the conditions tested(Table 1, Fig. S2). The 1,461-bp region of AcR DNA deleted in-cluded a 1,363-bp region of ZMO0117, which left a 275-bp 5′ frag-ment (Fig. 2). The 160-bp region upstream of ZM4 nhaA was alsotruncated and left only 98-bp of nhaA upstream region un-changed in AcR (Fig. 2). Our expression data showed that aconsistently lower AcR ZMO0117 signal was detected in eachcondition compared to that of ZM4 (Table 1, Fig. S2). These find-ings lead us to hypothesize that the AcR deletion increases nhaAexpression and conferred NaAc tolerance in the strain.
nhaA Genetic Studies. To test the hypothesis that the deletion inAcR resulted in higher nhaA expression and conferred thereported NaAc tolerance (22), we recreated the 1,461-bp AcRdeletion in strain ZM4 by marker exchange and designated itstrain ZM4DM0117 (Table S4 and Materials and Methods). Totest the influence of ZMO0117 on NaAc tolerance, we alsoconstructed a ZMO0117 insertion mutant strain ZM4IM0117(Table S4 and Materials and Methods). In addition, to test thecorrelation between nhaA overexpression and NaAc tolerance,we generated a plasmid for nhaA overexpression, designatedp42-0119, and introduced it into wild-type ZM4 backgroundthrough conjugation and selection (Table S4 and Materials andMethods). The ZMO0118 gene was combined with ZMO0119in our recent update to the ZM4 genome (14) and the regionsof DNA deleted, disrupted, and used in overexpression studiesare presented (Fig. 2).
The newly-generated strains grew similarly under anaerobicconditions in rich medium (RM) broth not amended with NaAc,although a slightly lower growth rate was observed in wild-typeZM4 strains with p42-0119, indicative of increased metabolic bur-den on the strain (Table S5 and Fig. 3A). In the presence of
10396 ∣ www.pnas.org/cgi/doi/10.1073/pnas.0914506107 Yang et al.

195 mM (or 16 g∕L) NaAc at pH 5.0, ZM4 wild type and theZM4IM0117 were unable to grow, while the positive controlstrain AcR grew well (Table S5 and Fig. 3B). The expression ofnhaA in ZM4 via plasmid p42-0119 permitted strain ZM4 to growunder these selective conditions, reaching three-fourths of theAcR growth rate (Table S5 and Fig. 3B). The final cell density(OD600 nm) of ZM4 (p42-0119) was only 13% less than that ofAcR (Table S5 and Fig. 3B). The facsimile of the 1,461-bp dele-tion in strain ZM4 (ZM4DM0117) also permitted growth in RMwith 195 mM NaAc at pH 5 achieving more than half of the
growth rate and three-fourths of the final cell density ofAcR strain (Table S5 and Fig. 3B). The insertional mutant(ZM4IM0117) growth data indicated ZM0117 was not responsi-ble for NaAc tolerance (Table S5 and Fig. 3). Despite the ZM4NaAc tolerance being augmented substantively by either addi-tional copies of nhaA provided via plasmid DNA or by recreatingthe deleted DNA region (ZM4DM0117), the AcR phenotype wasnot emulated completely (Table S5 and Fig. 3B). Possible reasonsfor this include that the region of DNA deleted in AcR maycontain a repressor binding site(s) and its removal could relieverepression from the nhaA promoter, and/or that the eliminationof a potential ZMO0117 transcriptional terminator maylead to a fusion transcript being expressed from the ZMO0117promoter.
To investigate the role of nhaA on different forms of acetate,we grew ZM4 and AcR strains in the presence of the same molarconcentrations (195 mM) of sodium chloride (NaCl), sodiumacetate (NaAc), potassium acetate (KAc), or ammonium acetate(NH4OAc). Both the sodium and acetate ions had a toxic effecton Z. mobilis growth, with decreases in both growth rate and finalcell density (Table S5 and Fig. 3C). The acetate ion was moretoxic than the sodium ion: Z. mobilis grew more rapidly in thepresence of 195 mM NaCl and the final cell density was highercompared to growth in the presence of same molar concentrationof NH4OAc or KAc (Table S5). NaAc was more inhibitory thanthe same molar concentration (195 mM) of KAc or NH4OAc forZM4 and the combination of elevated Naþ and Ac− ions ap-peared to exert a synergistic inhibitory effect for strain ZM4 withthe growth of Z. mobilis totally inhibited (Table S5 and Fig. 3C).
The AcR strain was selected for sodium acetate tolerance, butalso had enhanced tolerance to NaCl, but not NH4OAc or KAccompared to the wild-type ZM4 (Table S5 and Fig. 3C). StrainZM4DM0117 and ZM4 harboring the nhaA-expressing plasmidp42-0119 similarly had enhanced NaCl tolerance that did not ex-tend to NH4OAc or KAc (Table S5 and Fig. 3C). The increasedtolerance to NaAc for these strains may therefore be due mostlyto an increased sodium ion tolerance arising from the overexpres-sion of Naþ∕Hþ antiporter gene nhaA. The strains were alsotested for tolerance to other classes of pretreatment inhibitorssuch as vanillin, furfural, or HMF and advantages were not ob-served (Fig. S3). These data indicate that NhaA mostly confersenhanced specific Naþ tolerance and not Ac− tolerance unlessboth ions are present in sufficient quantities (Fig. 3C).
Z. mobilis NhaA Structural Studies. To gain further insights into theNaþ∕Hþ antiporter tolerance mechanism, the Z. mobilis NhaAmolecular structure was predicted. In the present case, it waspossible to construct an atomic-detail structural model of theZ. mobilis NhaA protein, by using homology with the existingcrystal structure of the E. coli NhaA (PDB id: 1ZCD, (26)). Theamino acid sequence of Z. mobilis NhaA exhibits a 95%
Fig. 1. Z. mobilis ZM4 and AcR fermentations for transcriptomics studies. (A)Growth, glucose consumption, and ethanol production of ZM4 and AcR inRM with 146 mM (12 g∕L) NaAc; and (B) with 146 mM (8.55 g∕L) NaCl.Samples were collected for transcriptomic profiling at time points indicatedby black arrows from pH 5.0, controlled anaerobic fermentations. Theaverages of two replicate fermentors for each strain and standard deviationsare presented.
Table 1. Summary of expression data for nhaA and adjacent genes
NaAc condition NaCl condition
Gene* Exp† StPh† Exp† StPh†
ZMO0117 −2.1 (8.8)‡ −2.2 (7.2) −2.2 (5.9) −2.0 (5.0)ZMO0119 4.6 (34.4) 4.3 (31.7) 4.4 (27.8) 4.4 (27.9)ZMO0120 1.7 (20.2) 1.0 (20.7) 1.8 (17.8) 1.0 (9.5)
*ZMO0117 encodes hydroxylamine reductase, ZMO0119 encodes Naþ∕Hþ
antiporter NhaA, and ZMO0120 encodes dihydroorotate dehydrogenase.ZMO0118 was deleted and ZMO0119 (encoding Naþ∕Hþ antiporterNhaA) extended in a recent genome reannotation11.
†Expression ratio values (log2) for AcR against ZM4 (AcR/ZM4) in eitherexponential (Exp) or stationary (StPh) phase comparisons.
‡ANOVA significance values are represented as a − log10 (p-value) and shownin brackets.
Fig. 2. Primer positions and regions of DNA deleted, disrupted, and used inexpression and mutant construction studies. ZMO0116, ZMO0117, ZMO0119,and ZMO0120 indicate Z. mobilis ZM4 genes. The open box labeled “Regiondeleted in AcR” is present in ZM4, but deleted in the AcR mutant. The openbox labeled “nhaA region” represents the region of DNA cloned for nhaAoverexpression (p42-0119). nhaA_CF and nhaA_CR indicate positions of pri-mers used to generate p42-0119. UP_F, UP_R, Down_F, and Down_R indicatethe positions of primers used to construct of the deletion in ZM4 that mimicsthe AcR deletion. Primers MF2 and MR2 were used to amplify an internalregion of ZMO0117 and create insertional mutant ZM4IM0117.
Yang et al. PNAS ∣ June 8, 2010 ∣ vol. 107 ∣ no. 23 ∣ 10397
APP
LIED
BIOLO
GICAL
SCIENCE
S

similarity score when compared to the E. coli NhaA, as obtainedwith the 3Dcoffee (27 and 28) multiple-sequence sequence-structure alignment tool. Hence, a Z. mobilis NhaA homologymodel could be constructed that is highly likely to be accurate.The model (Fig. 4A) was generated using the Swiss-model pro-gram (29) with the E. coli structure as the template (26). TheTmbase program (30) was applied to predict the orientationsof the transmembrane helices. All modeling results indicate thatthe Z. mobilis Naþ∕Hþ antiporter is structurally very similar tothat of E. coli. The main region of low homology (and thus theregion least likely to be structurally similar) was found to be lo-cated away from the ion transport region and in the periplasmicloop, which consists of a coil region and an antiparallel β-sheetand comprises residues Glu36 to Asn56 in the model of Z. mobilisNhaA. As in the E. coli NhaA crystal structure, the Z. mobilisNhaA structural model possesses a clear pH transductionpathway (Fig. 4B). The ion binding site of ZM4 NhaA consistsof Asp161 and Asp162. Most of the charged or polar residuesare also conserved in the “pH sensor” region of the funnelentrance (31). Similar to E. coliNhaA, ZM4 NhaA seems to have
a convertible transmembrane segment (TMS IV, including helicesα7 and α8, Fig. 4) and the structure of this depends upon the pro-tonation state of residue Asp131. When Asp131 is protonated(at acidic pH), the helix α7 is closely parallel to α8 (Fig. 4C), whilewhen Asp131 is deprotonated (at higher pH), α7 is crossed withα8 (32). Overall, the template fold is preserved in the homo-logy model.
Cytoplasm acidification by uncoupling and anion accumulationis one of the inhibitory effects of acetic acid on Z. mobilis (20).Weak acids such as acetic acid inhibit S. cerevisiae by ATPdepletion, toxic anion accumulation, and inhibition of aromaticamino acid uptake, as reviewed previously (4). The E. coli NhaAantiporter exports a sodium ion from the cytoplasm while import-ing two protons (32) and if Z. mobilis were to function in a similarmanner to the E. coli NhaA protein, the expulsion of sodium ionswould lead to further cytoplasm acidification. Methanosarcinabarkeri has a Naþ∕Hþ antiporter that operates in the oppositedirection to the E. coli NhaA, i.e., it imports a sodium ion intothe cytoplasm while exporting two protons (33). Although thestructural results (Fig. 4) are consistent with the Z. mobilis NhaAprotein operating like the E. coli NhaA rather than theM. barkerisystem, this would lead to two protons accumulating in thecytoplasm for each sodium ion that was exported. ConceivablyZ. mobilis may then have another mechanism to control forcytoplasmic proton accumulation that we did not detect in thecurrent study.
NaAc Tolerance Mechanism Testing in Other Microorganisms. E. colipossesses three Naþ∕Hþ antiporter genes, with NhaA being thearchetype and most well studied Naþ∕Hþ antiporter (32). E. coliprovided with Z. mobilisNhaA (p42-0119) did not have enhancedtolerance to NaAc (Fig. S4), likely due to E. coli functionalredundancy and regulation. Wu et al. (34) transferred the E. colinhaA gene into rice (Oryza sativa L. ssp. japonica) and detectedhigh expression in the transgenic rice, resulting in enhanced saltand drought tolerance (34). The Schizosaccharomyces pombeNaþ∕Hþ plasma membrane transporter gene SOD2 has beenshown to be involved in salt tolerance (35) and expression ofSOD2 in a S. cerevisiae strain lacking any Naþ-ATPase activityrestores the ability of these cells to export sodium and greatlyincreases their resistance to both Naþ and Liþ in the medium(36). NHA1, a homolog of SOD2, was cloned from S. cerevisiaeand found to contribute to Naþ extrusion (37).
The discovery that the ZM4 nhaA gene confers Z. mobilisNaAc tolerance and the existence of NhaA homologues inS. cerevisiae led us to investigate whether this target gene hasa similar role in other industrial strains such as S. cerevisiae.S. cerevisiae has three Naþ∕Hþ antiporters, a cytoplasmicNaþ∕Hþ antiporter NHA1 (YLR138W), a vacuolar Naþ∕Hþexchanger VNX1 (YNL321W), and an endosomal Naþ∕Hþ
Fig. 3. NhaA plays a role in Z. mobilis sodium acetate and sodium chloride tolerance. The growth differences of different strains were monitored by BioscreenC (Growth Curves USA) under anaerobic conditions in RM, pH 5.0 (A); RM with 195 mM NaAc, pH 5.0 (B); 195 mM NaCl, NaAc, NH4OAc, and KAc at pH 5.0(C). Strains included in this study were: ZM4: Z. mobilis ZM4 wild-type; AcR: previously described ZM4 acetate tolerant mutant; ZM4 (p42-0119): ZM4 containingp42-0119 for nhaA (ZMO0119) expression; ZM4IM0117: ZM4 ZMO0117 insertional mutant; ZM4DM0117: deletion mutant affecting ZMO0117 and part ofupstream nhaA (Fig. 2; Table S4). This experiment has been repeated at least three times with similar results. Duplicates were used for each condition.
Fig. 4. Z. mobilisNhaA structural predictions. (A) E. coliNhaA X-ray structure(left, red, (26)) and Z. mobilis NhaA model (right, blue). The periplasmic loopsthat are parallel to the membrane (light blue, dashed lines) are shown inyellow. The helix (α1, Ser35 to Asp41) of the loop in E. coli NhaA is modeledas a coil (Glu36 to Lys40) in Z. mobilis NhaA; (B) the active site and “pH sen-sor” in Z. mobilis NhaA. The protein is shown as a ribbon and the active siteand pH sensor residues are shown as spheres; and (C) the protonation state ofAsp131 may interconvert the topology of the transmembrane segment it islocated in (transmembrane segment IV, including helices α7 and α8) betweentwo different states (33).
10398 ∣ www.pnas.org/cgi/doi/10.1073/pnas.0914506107 Yang et al.

exchanger NHX1 (YDR456W). We assayed three S. cerevisiaeNaþ∕Hþ antiporter gene deletion mutants and a NHA1 over--expression strain (Table S4) in the presence of NaAc,NH4OAc, or KAc and found that, especially at early stages, eachNaþ∕Hþ antiporter mutant was more sensitive to acetate thanthe wild-type control strain (Fig. S5), and that yeast tolerancecould be further enhanced by expression of plasmid encodedyeast Naþ∕Hþ antiporter genes (Fig. S5). These yeast data areconsistent with earlier reports that these yeast systems can func-tion as monovalent cation∕Hþ antiporters (38 and 39), andNaþ∕Hþ antiporter genes in S. cerevisiae are involved inacetate tolerance (Fig. S5).
Resequencing Limitations. Thirty-eight putative SNPs and a 1,461-bp deletion region were identified by CGS in strain AcR(Table S1). Sanger sequencing analysis validated that 76% ofthe putative AcR SNP position changes had been identifiedcorrectly. However, both the correct position and nucleotide basecall were confirmed by Sanger sequence analysis for only 61% ofthe AcR SNPs identified by CGS (Table S2). Although a numberof SNPs and the deletion were predicted correctly, these data(Table S2) were also consistent with an earlier report thatCGS has difficulties in identifying nucleotide differences of morethan one bp or insertions/deletions(40).
Here, next-generation resequencing more accurately andrapidly assessed genomic differences between ZM4 and AcRstrains than CGS, which is conduced in two phases (Table S1,Table S2, Table S3). CGS readily identified the 1,461-bp regionof DNA that was deleted in AcR, as did the pyrosequencingapproach. The addition of paired-end pyrosequencing data toshotgun libraries generated 12 and 11 contigs during mappinganalysis for ZM4 and AcR, respectively. The 1,461-bp deletionregion was at the boundary of one of the pyrosequencing gaps.The combination of pyroresequencing and CGS allowed a rapidand independent assessment of SNPs and gaps against the ZM4reference genome.
Although pyrosequencing analysis of Z. mobilis ZM4 and AcRis a powerful approach for strain characterization we also iden-tified systematic issues with certain differences reported asHCDiffs by the GSMapper software. The frequency of “mappedreads” and “other reads” varied widely among the 200 and 219HCDiffs for AcR and ZM4 compared to the ZM4 referencegenome sequence (Table S3). A previous study established a cri-terion by which mapping alignments having <80% identity to thereference genome were ignored (41). In the present study, Sangersequencing data were used to investigate reported AcR and ZM4HCDiffs that had a range of different identity values (Table S3).We found a false positive rate of 100% among HCDiffs reportedby the GSMapper software that had frequency variation (or iden-tity) values of <50% by Sanger sequencing analysis (Table S3).When these differences were included in the analysis an overallfalse positive rate of >15% was found. In contrast, better resultswere obtained if we used our previously reported more stringentcriteria (14), with each pyrosequencing difference tested beingvalidated by analysis of Sanger data. When we examined pyro-sequencing SNPs with variation values between 50% and 80%by Sanger data analysis we found one out of nine was reportedcorrectly for AcR and the seven ZM4 pyroresequencing SNPs inthis category were incorrect (Table S3).
We also identified one false negative in our pyrosequencingdata during our Sanger sequence analysis, and noted occasionswhere the GSMapper software represented identical differencesin AcR and ZM4 in different formats (Table S3). We expectdevelopments in chemistry and bioinformatics will improve theaccuracy and reporting of SNP detection in the future, but suggestour insights related to more stringent reporting of pyrosequen-cing differences (14) will be immediately useful for other micro-bial resequencing projects. In addition, the large number of SNPs
shared in ZM4 and AcR compared to the reference genomeshowed the value in resequencing both strains in this studyand for providing adequate controls when designing strategiesfor strain selection and resequencing in general.
ConclusionsThe present study shows the potential of systems biology toolsand genetics for the rapid identification and characterizationof process-relevant traits. The expression profiles generated inthese studies are the most comprehensive for Z. mobilis to dateand will likely serve as useful reference data for future systemsbiology studies. By demonstrating that Z. mobilis nhaA overex-pression confers the AcR tolerance phenotype and that mostof the advantage conferred is against the sodium ion, our datareinforce the idea that one obtains what one selects for duringadaptive evolution experiments. The present work also demon-strates S. cerevisiae Naþ∕Hþ antiporter gene overexpressionenhances its tolerance to acetate with three different counterions. Our study also provides a caveat in using reference genomesequences for SNP identification and insights into technologicallimitations. We have affirmed the notion that near-term pathwayengineering approaches benefit from a combinatorial approach(2). The combined approach of employing the advantages ofclassical selection, which lack mechanistic a priori assumptions,with systems biology tools is a paradigm for industrial straincharacterization and development.
Materials and MethodsStrains and Culture Conditions. Bacterial strains and plasmids used in this studyare listed in Table S4. E. coli strains were cultured using LB medium ZM4 wasobtained from the American Type Culture Collection (ATCC 31821). AcR is theZM4 acetate tolerant strain described previously (22). ZM4 and AcR were cul-tured in RM at 30 °C. S. cerevisiae wild-type, deletion mutant YKO strains andGST-fusion ORF overexpression strains were obtained through OpenBiosystems. S. cerevisiae strains were cultured in minimum complete mediumpurchased from Teknova Inc. Growth was monitored turbidometrically bymeasuring optical density at the wavelength of 600 nanometer (nm) inter-mittently with a Bioscreen C (Growth Curves USA). Each experiment has beenrepeated at least three times. Replicates were used for each condition.
DNA Manipulations, CGS, and 454 Genomic Pyroresequencing. Genomic DNAfrom Z. mobilis was isolated using a Wizard Genomic DNA purification kit(Promega). The QIAprep Spin Miniprep and HiSpeed Plasmid Midi kits(Qiagen) were used for plasmid isolation. PCR, restriction enzyme digestion,ligation, cloning, and DNA manipulations followed standard molecular biol-ogy approaches (42). Genomic DNA of ZM4 and AcR was sent to NimbleGenfacility for CGS service. Pyrosequencing using the Roche 454 GS FLX System(454 Life Sciences) was carried out using both shotgun and paired-end DNAlibrary preparation methods. The GSMapper application in the 454 GS FLXsoftware package 1.1.03 (454 Life Sciences) was used to map the readsgenerated from GS FLX onto the ZM4 reference genome (GenBank accession:AE008692) and the GSAssembler application was used to assemble thesequence reads into contigs, which were then compared with ZM4 genomesequence (13).
HPLC. HPLC analysis was used for the measurements of the concentration ofglucose, acetate, andethanol in0.2μm-filtered samples takenatdifferent timepoints (Fig. 1) and analyzed as described previously (43).
Microarray Analysis. Transcriptomic profiles of exponential and stationaryphase cells were analyzed for the ZM4 and AcR in the presence of146 mM (or 12 g∕L) NaAc or 146 mM (or 8.55 g∕L) NaCl and samples wereharvested at different time points (Fig. 1). Duplicate batch fermentationswere conducted in approximately 2.5-L RM medium in 7.5-L BioFlo110 bior-eactors (New Brunswick Scientific) and RNA was isolated as described pre-viously (43). ds-cDNA was generated using an Invitrogen ds-cDNA syn-thesis kit (Invitrogen) and sent to NimbleGen for labeling, hybridization,and scanning following company's protocols. Statistical analysis was donewith JMP Genomics 4.0 software (SAS Institute) as described previously (43).
Construction of ZMO0119 Expression Plasmid p42-0119 and Z. mobilis Mutant.The construction of the entry vector and expression clone of target gene
Yang et al. PNAS ∣ June 8, 2010 ∣ vol. 107 ∣ no. 23 ∣ 10399
APP
LIED
BIOLO
GICAL
SCIENCE
S

ZMO0119 was carried out as described previously (44). ZMO0119 was ampli-fied by PCR using ZM4 genomic DNA as the template and primers nhaA_CFand nhaA_CR (Table S4). The plasmid p42-0119 sequence was confirmed to becorrect by sequencing analysis.
The ZMO0117 and ZMO0119 genes, as well as the primer positions used inmutant construction and construction of the nhaA overexpression vector areshown (Fig. 2). To create the ZMO0117 insertion mutant a 529-bp internalregion of the gene was amplified by PCR, purified, and cloned intopCR2.1-TOPO™ (Invitrogen). The insert DNA sequence was confirmed andthen ligated into pKnock-Km plasmid. The presence and integrity of pKm-0117 in E. coli WM3064 was verified by sequence analysis. pJK100 was usedto recreate the 1,461-bp AcR deletion in ZM4 as described previously (45).Primer pairs UP_F/UP_R and Down_F/Down_R were used to amplify 805and 1,050-bp regions of DNA that flanked either up or downstream regionsof DNA from the region of interest as shown (Fig. 2 and Table S4). The dele-tion plasmid construct was named pJK_hcp_nhaA. It was verified by PCR andsequencing and transformed in E. coli WM3064. Ex-conjugants were selected
by plating on RM agar plates containing 20 μg∕mL tetracycline for p42-0119plasmid ex-conjugants or 200 μg∕mL kanamycin for both pKm-0117 andpJK_hcp_nhaA plasmid ex-conjugants at 30 °C. PCR and sequencing wereused to confirm the presence of the correct plasmid or mutant constructs.
ACKNOWLEDGMENTS. The authors thank Peter Rogers for generouslyproviding strain AcR; M.K. Kerley, M. Rodriguez Jr., and L. Dice for technicalassistance with Sanger sequencing, HPLC, and qRT-PCR, respectively. We alsothank T. Phelps, B. Davison, and X. Cheng (ORNL) and J. Wiegel (University ofGeorgia, Athens) for insightful discussions and gratefully acknowledgeD. Graham (ORNL) for critical review during manuscript preparation. Thiswork is sponsored by the Laboratory Directed Research and DevelopmentProgram of ORNL. The BioEnergy Science Center is a Department of EnergyBioenergy Research Center supported by the Office of Biological and Envir-onmental in the Department Of Energy Office of Science. This manuscript hasbeen authored by UT-Battelle, LLC, under Contract No. DE-AC05-00OR22725with the Department of Energy.
1. Himmel ME, et al. (2007) Biomass recalcitrance: Engineering plants and enzymes forbiofuels production. Science 315:804–807.
2. Alper H, Stephanopoulos G (2009) Engineering for biofuels: exploiting innatemicrobial capacity or importing biosynthetic potential?. Nat Rev Microbiol 7:715–723.
3. Mills T, Sandoval N, Gill R (2009) Cellulosic hydrolysate toxicity and tolerance mecha-nisms in Escherichia coli. Biotechnology for Biofuels 2:26.
4. Almeida JRM, et al. (2007) Increased tolerance and conversion of inhibitors in ligno-cellulosic hydrolysates by Saccharomyces cerevisiae. J Chem Technol Biot 82:340–349.
5. Stephanopoulos G (2007) Challenges in engineering microbes for biofuels production.Science 315:801–804.
6. Park JH, Lee SY, Kim TY, Kim HU (2008) Application of systems biology for bioprocessdevelopment. Trends Biotechnol 26:404–412.
7. Medini D, et al. (2008) Microbiology in the post-genomic era. Nat Rev Microbiol6:419–430.
8. Gresham D, Dunham MJ, Botstein D (2008) Comparing whole genomes using DNAmicroarrays. Nat Rev Genet 9:291–302.
9. Hahn-Hagerdal B, Galbe M, Gorwa-GrauslundMF, Liden G, Zacchi G (2006) Bio-ethanol—the fuel of tomorrow from the residues of today. Trends Biotechnol 24:549–556.
10. Dien BS, Cotta MA, Jeffries TW (2003) Bacteria engineered for fuel ethanolproduction: current status. Appl Microbiol Biotechnol 63:258–266.
11. Panesar PS, Marwaha SS, Kennedy JF (2006) Zymomonas mobilis: an alternativeethanol producer. J Chem Technol Biot 81:623–635.
12. Rogers PL, Jeon YJ, Lee KJ, Lawford HG (2007) Zymomonas mobilis for fuel ethanoland higher value products. Biofuels, Advances in Biochemical Engineering / Biotech-nology (Springer-Verlag Berlin, Berlin), Vol 108, pp 263–288.
13. Seo JS, et al. (2005) The genome sequence of the ethanologenic bacterium Zymomo-nas mobilis ZM4. Nat Biotechnol 23:63–68.
14. Yang S, et al. (2009) Improved genome annotation for Zymomonas mobilis. NatBiotechnol 27:893–894.
15. Deanda K, Zhang M, Eddy C, Picataggio S (1996) Development of an arabinose-fermenting Zymomonas mobilis strain by metabolic pathway engineering. ApplEnviron Microbiol 62:4465–4470.
16. Zhang M, Eddy C, Deanda K, Finkestein M, Picataggio S (1995) Metabolic engineeringof a pentose metabolism pathway in ethanologenic Zymomonas mobilis. Science267:240–243.
17. Lawford HG, Rousseau JD (1998) Improving fermentation performance of recom-binant Zymomonas in acetic acid-containing media. Appl Biochem Biotechnol70:161–172.
18. Lawford HG, Rousseau JD, Tolan JS (2001) Comparative ethanol productivities ofdifferent Zymomonas recombinants fermenting oat hull hydrolysate. Appl BiochemBiotechnol 91:133–146.
19. Ranatunga TD, Jervis J, Helm RF, McMillan JD, Hatzis C (1997) Identification of inhi-bitory components toxic toward Zymomonas mobilis CP4(pZB5) xylose fermentation.Appl Biochem Biotechnol 67:185–198.
20. Lawford HG, Rousseau JD (1993) The effect of acetic acid on fuel ethanol-productionby Zymomonas. Appl Biochem Biotechnol 39:687–699.
21. McMillan JD (1994) Conversion of hemicellulose hydrolyzates to ethanol. Enzymaticconversion of biomass for fuels production, ACS Symposium Series (Ed Himmel,Washington, DC), Vol 566, pp 411–437.
22. Joachimstahl E, Haggett KD, Jang JH, Rogers PL (1998) A mutant of Zymomonasmobilis ZM4 capable of ethanol production from glucose in the presence of highacetate concentrations. Biotechnol Lett 20:137–142.
23. Kim IS, Barrow KD, Rogers PL (2000) Nuclear magnetic resonance studies of acetic acidinhibition of rec Zymomonas mobilis ZM4(pZB5). Appl Biochem Biotechnol84-6:357–370.
24. Jeon YJ, Svenson CJ, Joachimsthal EL, Rogers PL (2002) Kinetic analysis of ethanol pro-duction by an acetate-resistant strain of recombinant Zymomonas mobilis. BiotechnolLett 24:819–824.
25. Bailey JE (1991) Toward a science of metabolic engineering. Science 252:1668–1675.26. Hunte C, et al. (2005) Structure of a Naþ ∕Hþ antiporter and insights into mechanism
of action and regulation by pH. Nature 435:1197–1202.27. O’Sullivan O, Suhre K, Abergel C, Higgins DG, Notredame C (2004) 3DCoffee: combi-
ning protein sequences and structures within multiple sequence alignments. J Mol Biol340:385–395.
28. Armougom F, et al. (2006) Expresso: automatic incorporation of structural informationin multiple sequence alignments using 3D-coffee. Nucleic Acids Res 34:W604–W608.
29. Schwede T, Kopp J, Guex N, Peitsch MC (2003) SWISS-MODEL: an automated proteinhomology-modeling server. Nucleic Acids Res 31:3381–3385.
30. Hofmann K, Stoffel W (1993) TM base—a database of membrane spanning proteinssegments. Biol Chem Hoppe-Seyler 374:166–170.
31. Padan E, Kozachkov L, Herz K, Rimon A (2009) NhaA crystal structure: functional-structural insights. J Exp Biol 212:1593–1603.
32. Arkin IT, et al. (2007) Mechanism of Naþ∕Hþ antiporting. Science 317:799–803.33. Thauer RK, Kaster A-K, Seedorf H, Buckel W, Hedderich R (2008) Methanogenic
archaea: ecologically relevant differences in energy conservation. Nat Rev Microbiol6:579–591.
34. Wu LQ, et al. (2005) Over-expression of the bacterial nhaA gene in rice enhances saltand drought tolerance. Plant Sci 168:297–302.
35. Jia ZP, Mccullough N, Martel R, Hemmingsen S, Young PG (1992) Gene amplification ata locus encoding a putative Naþ∕Hþ antiporter confers sodium and lithium tolerancein fission yeast. EMBO J 11:1631–1640.
36. Hahnenberger KM, Jia ZP, Young PG (1996) Functional expression of the Schizosacchar-omyces pombe Naþ∕Hþ antiporter gene, sod2, in Saccharomyces cerevisiae. Proc NatlAcad Sci USA 93:5031–5036.
37. Prior C, Potier S, Souciet JL, Sychrova H (1996) Characterization of the NHA1 geneencoding a Naþ∕Hþ-antiporter of the yeastSaccharomyces cerevisiae. FEBS Lett387:89–93.
38. Banuelos MA, Sychrova H, Bleykasten-Grosshans C, Souciet JL, Potier S (1998) The Nha1antiporter of Saccharomyces cerevisiae mediates sodium and potassium efflux.Microbiology 144:2749–2758.
39. Cagnac O, Leterrier M, Yeager M, Blumwald E (2007) Identification and characteri-zation of Vnx1p, a novel type of vacuolar monovalent cation∕Hþ antiporter ofSaccharomyces cerevisiae. J Biol Chem 282:24284–24293.
40. Herring CD, Palsson BO (2007) An evaluation of comparative genome sequencing(CGS) by comparing two previously-sequenced bacterial genomes. BMC Geno-mics 8:274.
41. Brockman W, et al. (2008) Quality scores and SNP detection in sequencing-by-synthesissystems. Genome Res 18:763–770.
42. Sambrook J, Fritsch EF, Manatis T, eds. (1989) Molecular cloning, a laboratory manual(Cold Spring Harbor Laboratory Press, New York).
43. Yang S, et al. (2009) Transcriptomic and metabolomic profiling of Zymomonas mobilisduring aerobic and anaerobic fermentation. BMC Genomics 10:34.
44. Pelletier DA, et al. (2008) A general system for studying protein-protein interactions ingram-negative bacteria. J Proteome Res 7:3319–3328.
45. Denef VJ, et al. (2006) Genetic and genomic insights into the role of benzoatecatabolic pathway redundancy in Burkholderia xenovorans LB400. Appl EnvironMicrobiol 72:585–595.
10400 ∣ www.pnas.org/cgi/doi/10.1073/pnas.0914506107 Yang et al.

Supporting InformationYang et al. 10.1073/pnas.0914506107
-4
-2
0
2
4
6
8
-4 -2 0 2 4 6
Microarray (log2 ratio of AcR/ZM4)
qP
CR
(lo
g2
rati
o o
f A
cR/Z
M4)
4h_NaAc
6.5h_NaAc
24h_NaAc
5h_NaCl
24h_NaCl
: R2 = 0.98
: R2 = 0.97
: R2 = 0.91
: R2 = 0.83
: R2 = 0.82
Fig. S1. Supplemental method for real-time quantitative RT-PCR (qRT-PCR) analysis. Microarray data were validated using real-time qRT-PCR as describedpreviously (1) except that the BioRad MyiQ2 Two-Color Real-Time PCR Detection System (BioRad Laboratories) and Roche FastStart SYBR Green Master reagent(Roche Applied Science) were used for this experiment. Twelve genes representing different functional categories and a range of gene expression values basedon microarray results over different time point were analyzed using qRT-PCR. Primer pairs were designed as described previously (1) and the oligonucleotidesequences are listed in Table S4.
1 Yang S, et al. (2009) Transcriptomic and metabolomic profiling of Zymomonas mobilis during aerobic and anaerobic fermentation. BMC genomics 10:34.
Fig. S2. Volcano plot summary of microarray analysis showing all significantly differentially expressed genes between AcR and the ZM4 wild-type strains forall conditions (sodium acetate and sodium chloride in exponential and stationary phase cells). The X axis shows the difference values (log 2) between AcR andZM4 expression profiles. The Yaxis shows statistical significance values (− log10 (p-values)) for expression differences. The red dashed line shows the statisticalsignificance cut-off used in this study.
Yang et al. www.pnas.org/cgi/doi/10.1073/pnas.0914506107 1 of 4

0.5g/L furfural
Time (h)0 10 20 30 40 50
OD
600n
mO
D60
0nm
0.0
0.2
0.4
0.6
0.8
1.0
1.2ZM4ZM4(p42-0119)ZM4IM0117ZM4DM0117
0.5g/L HMF
Time (h)0 10 20 30 40 50
0.0
0.2
0.4
0.6
0.8
1.0
1.2
1.4ZM4ZM4(p42-0119)ZM4IM0117ZM4DM0117
0.5g/L vanillin
Time (h)0 10 20 30 40 50
0.0
0.2
0.4
0.6
0.8
1.0
1.2ZM4ZM4(p42-0119)ZM4IM0117ZM4DM0117
CB
E
A
4g/L furfural (RM, pH 5.0)
Time (h)0 20 40 60 80 100 120
Time (h)0 20 40 60 80 100 120
Time (h)0 20 40 60 80 100 120
0.00
0.02
0.04
0.06
0.08
0.10
0.12
0.14
OD
600n
mO
D60
0nm
0.00
0.02
0.04
0.06
0.08
0.10
0.12
0.14
OD
600n
mO
D60
0nm
0.00
0.02
0.04
0.06
0.08
0.10
0.12
0.14
ZM4AcRZM4(p42-0119)ZM4DM0117ZM4IM0117
4g/L HMF (RM, pH 5.0)
ZM4AcRZM4(p42-0119)ZM4DM0117ZM4IM0117
2 g/L vanillin (RM, pH 5.0)
ZM4AcRZM4(p42-0119)ZM4DM0117ZM4IM0117
FD
Fig. S3. ZM4 nhaA had no effect on inhibitor furfural, HMF, and vanillin tolerance. Z. mobilis strains were grown in RM (pH5.0) overnight, and then 5 μL ofculture seed was transferred into 250-μL RM media in the Bioscreen plate (Growth Curves USA). The growth differences of different strains were monitored byusing a Bioscreen C machine (Growth Curves USA) under anaerobic conditions in RM with 0.5 g∕L furfural, pH 5.0 (A); RM with 0.5 g∕L HMF, pH 5.0 (B); RM with0.5 g∕L vanillin, pH 5.0 (C); RM with 4 g∕L furfural, pH 5.0 (D); RM with 4 g∕L HMF, pH 5.0 (E); RM with 2 g∕L vanillin, pH 5.0 (F). Strains included in this studywere: ZM4: Zymomonas mobilis ZM4 wild-type; AcR: previously described ZM4 acetate tolerant mutant; ZM4 (p42-0119): ZM4 containing a gateway plasmidp42-0119 for nhaA (ZMO0119) expression; ZM4IM0117: ZM4 hcp (ZMO0117) insertional mutant; ZM4DM0117: deletion mutant affecting ZMO0117 and part ofupstream nhaA (Fig. 2 and Table S4). This experiment has been repeated at least two times with similar results. Duplicates were used for each condition.
Yang et al. www.pnas.org/cgi/doi/10.1073/pnas.0914506107 2 of 4

E. coli Strains in LB broth with 3g/L NaAc
Time (h)
OD
600n
mO
D60
0nm
0.0
0.2
0.4
0.6
0.8
1.0
1.2
1.4
1.6
E. coli Bl21-DE3E. coli Bl21-DE3(p42-0119)E. coli WM3064E. coli WM3064(P42-0119)
E. coli Strains in LB broth with 9g/L NaAc
Time (h)
0 1 2 3 4 5 6 7 8 9 1011121314151617181920212223242526272829303132333435363738394041424344454647
0.0
0.2
0.4
0.6
0.8
1.0
1.2
1.4
1.6E. coli Bl21-DE3E. coli Bl21-DE3(p42-0119)E. coli WM3064E. coli WM3064(p42-0119)
E. coli Strains in LB broth with 12 g/L NaAc
Time (h)0 1 2 3 4 5 6 7 8 9 1011121314151617181920212223242526272829303132333435363738394041424344454647
0 1 2 3 4 5 6 7 8 9 1011121314151617181920212223242526272829303132333435363738394041424344454647
0.0
0.2
0.4
0.6
0.8
1.0
1.2
1.4
1.6E. coli Bl21-DE3E. coli Bl21-DE3(p42-0119)E. coli WM3064E. coli WM3064(p42-0119)
E. coli Strains in LB broth
Time (h)0 1 2 3 4 5 6 7 8 9 1011121314151617181920212223242526272829303132333435363738394041424344454647
OD
600n
mO
D60
0nm
0.0
0.2
0.4
0.6
0.8
1.0
1.2
1.4
1.6
E. coli BL21-DE3E. coli BL21-DE3(p42-0119)E. coli WM3064E. coli WM3064(p42-0119)
A B
C D
Fig. S4. Overexpression of ZM4 nhaA in E. coli had a negative effect on sodium acetate tolerance. Two E. coli strains (WM3064 and BL21-DE3, the latter is usedfor protein overexpression) were grown in LB overnight, and then 5 μL of culture seed was transferred into 250-μL LB broth in the Bioscreen plate (GrowthCurves USA). The growth differences of different strains were monitored by Bioscreen C (Growth Curves USA) in LB broth, pH 7.0 (A); LB with 3 g∕L NaAc, pH 7.0(B); LB with 6 g∕L NaAc, pH 7.0 (C), LB with 12 g∕L NaAc, pH 7.0 (D). Strains included in this study were: E. coli BL21-DE3 (p42-0119): E. coli BL21-DE3 containing agateway plasmid p42-0119 for nhaA (ZMO0119) expression; E. coli WM3064 (p42-0119): E. coli BL21-DE3 containing a gateway plasmid p42-0119 for nhaA(ZMO0119) expression. Duplicates were used for each condition.
Yang et al. www.pnas.org/cgi/doi/10.1073/pnas.0914506107 3 of 4

CM+Glucose, pH 5.5
Time (h)
0 20 40 60 80 100 120
Time (h)
0 20 40 60 80 100 120
log
10(O
D60
0nm
)lo
g10
(OD
600n
m)
log
10(O
D60
0nm
)lo
g10
(OD
600n
m)
-1.2
-1.0
-0.8
-0.6
-0.4
-0.2
0.0
0.2
0.4
4741 (CM)YKO_NHA1 (CM)YKO_NHX1 (CM)YKO_VNX1 (CM)YKO_PSR1 (CM)4741 (NaCl)YKO_NHA1 (NaCl)YKO_NHX1 (NaCl)YKO_VNX1 (NaCl)YKO_PSR1 (NaCl)4741 (NaAc)YKO_NHA1 (NaAc)YKO_NHX1 (NaAc)YKO_VNX1 (NaAc)YKO_PSR1 (NaAc)
CM+Glucose, pH 5.5
-1.2
-1.0
-0.8
-0.6
-0.4
-0.2
0.0
0.2
4741 (NH4OAc)YKO_NHA1 (NH4OAc)YKO_NHX1 (NH4OAc)YKO_VNX1 (NH4OAc)YKO_PSR1 (NH4OAc)4741 (KAc)YKO_NHA1 (KAc)YKO_NHX1 (KAc)YKO_VNX1 (KAc)YKO_PSR1 (KAc)4741 (NaAc)YKO_NHA1 (NaAc)YKO_NHX1 (NaAc)YKO_VNX1 (NaAc)YKO_PSR1 (NaAc)
CM+Glucose+2% Galactose-Uracil, pH 5.5
Time (h)0 20 40 60 80 100 120
-1.6
-1.4
-1.2
-1.0
-0.8
-0.6
-0.4
-0.2
0.0
0.2
0.4
4741 (CM)GST-NHA1 (CM)GST-PSR1 (CM)4741 (NaCl)GST-NHA1 (NaCl)GST-PSR1 (NaCl)4741 (NaAc)GST-NHA1 (NaAc)GST-PSR1 (NaAc)
CM+Glucose+2% Galactose-Uracil, pH 5.5
Time (h)0 20 40 60 80 100 120
-1.4
-1.2
-1.0
-0.8
-0.6
-0.4
-0.2
4741 (NH4OAc)
GST-NHA1 (NH4OAc)
GST-PSR1 (NH4OAc)
4741 (KAc)GST-NHA1 (KAc))GST-PSR1 (KAc)4741 (NaAc)GST-NHA1 (NaAc)GST-PSR1 (NaAc)
BA
DC
Fig. S5. S. cerevisiae Na∕H antiporter genes play a role in sodium acetate tolerance. Growth was monitored using an aerobic Bioscreen C (Growth Curves USA)in CMþ glucose medium at pH 5.5, and either CMþ glucose (pH 5.5) with 244 mM NaCl, or 244 mM NaAc for wild-type BY4741 and deletion mutants strains(A); CMþ glucose with 244 mM NaAc, or 244 mM KAc, or 244 mM NH4OAc at pH 5.5 for wild-type BY4741 and deletion mutants strains (B); CMþ glucoseþ 2%
galactose_uracil at pH 5.5, CMþ glucoseþ 2% galactose_uracil with 244 mM NaCl, or 244 mM NaAc at pH 5.5 for wild-type BY4741 and GST overexpressionstrains (C); CMþ glucose þ 2% galactose_uracil with 244 mM NaAc, or 244 mM KAc, or 244 mM NH4OAc at pH 5.5 for wild-type BY4741 and GSToverexpressionstrains (D). This experiment has been repeated at least three times with similar result. PSR1 is responsible for plasma stress response and used as a control.
Other Supporting Information FilesTable S1 (DOC)Table S2 (DOC)Table S3 (DOC)Table S4 (DOC)Table S5 (DOC)
Yang et al. www.pnas.org/cgi/doi/10.1073/pnas.0914506107 4 of 4