Genome-wide association analysis identifies new susceptibility loci for Behçet's disease and...
8
1330 VOLUME 44 | NUMBER 12 | DECEMBER 2012 NATURE GENETICS To identify common genetic variants that contribute to lung cancer susceptibility, we conducted a multistage genome-wide association study of lung cancer in Asian women who never smoked. We scanned 5,510 never-smoking female lung cancer cases and 4,544 controls drawn from 14 studies from mainland China, South Korea, Japan, Singapore,Taiwan and Hong Kong. We genotyped the most promising variants (associated at P < 5 × 10 −6 ) in an additional 1,099 cases and 2,913 controls. We identified three new susceptibility loci at 10q25.2 (rs7086803, P = 3.54 × 10 −18 ), 6q22.2 (rs9387478, P = 4.14 × 10 −10 ) and 6p21.32 (rs2395185, P = 9.51 × 10 −9 ). We also confirmed associations reported for loci at 5p15.33 and 3q28 and a recently reported finding at 17q24.3. We observed no evidence of association for lung cancer at 15q25 in never- smoking women in Asia, providing strong evidence that this locus is not associated with lung cancer independent of smoking. It is estimated that 25% of lung cancer cases arise in individuals who never smoked. Lung cancer in never smokers ranks as the seventh most common cause of cancer death worldwide 1 . A number of observations suggest that the molecular pathogenesis of lung cancer differs by smoking status. Differences have been reported by smoking status in cellular and molecular carcinogenic pathways, distinct profiles of oncogenic mutations (for example, in EGFR) and response to targeted therapy 2,3 . Compared to lung cancer in smokers, cases in never smokers are more likely to arise in women at a younger age, and there is a greater proportion of cases with the adenocarcinoma histology subtype 3 . Epidemiological studies of lung cancer in never smokers have shown that the incidence of lung cancer in women is particularly high in Asia 4 , which is partially attributed to exposure to environmental tobacco smoke, combustion products from indoor heating and cooking fuel, and cooking oil fumes 4–10 . Genome-wide association analysis identifies new lung cancer susceptibility loci in never-smoking women in Asia Qing Lan 1,68 , Chao A Hsiung 2,68 , Keitaro Matsuo 3,68 , Yun-Chul Hong 4,68 , Adeline Seow 5,68 , Zhaoming Wang 6,68 , H Dean Hosgood III 1,7,68 , Kexin Chen 8,68 , Jiu-Cun Wang 9,10,68 , Nilanjan Chatterjee 1 , Wei Hu 1 , Maria Pik Wong 11 , Wei Zheng 12 , Neil Caporaso 1 , Jae Yong Park 13 , Chien-Jen Chen 14 , Yeul Hong Kim 15 , Young Tae Kim 16 , Maria Teresa Landi 1 , Hongbing Shen 17,18 , Charles Lawrence 19 , Laurie Burdett 6 , Meredith Yeager 6 , Jeffrey Yuenger 6 , Kevin B Jacobs 6 , I-Shou Chang 20 , Tetsuya Mitsudomi 21 , Hee Nam Kim 22 , Gee-Chen Chang 23,24 , Bryan A Bassig 1,25 , Margaret Tucker 1 , Fusheng Wei 26 , Zhihua Yin 27 , Chen Wu 28,29 , She-Juan An 30 , Biyun Qian 8 , Victor Ho Fun Lee 31 , Daru Lu 9,10 , Jianjun Liu 32,33 , Hyo-Sung Jeon 34 , Chin-Fu Hsiao 2 , Jae Sook Sung 15 , Jin Hee Kim 35 , Yu-Tang Gao 36 , Ying-Huang Tsai 37 , Yoo Jin Jung 16 , Huan Guo 38 , Zhibin Hu 17,18 , Amy Hutchinson 6 , Wen-Chang Wang 2 , Robert Klein 39 , Charles C Chung 1 , In-Jae Oh 40,41 , Kuan-Yu Chen 42 , Sonja I Berndt 1 , Xingzhou He 43 , Wei Wu 27 , Jiang Chang 28,29 , Xu-Chao Zhang 30 , Ming-Shyan Huang 44 , Hong Zheng 8 , Junwen Wang 45,46 , Xueying Zhao 9,10 , Yuqing Li 32 , Jin Eun Choi 34 , Wu-Chou Su 47 , Kyong Hwa Park 15 , Sook Whan Sung 48 , Xiao-Ou Shu 12 , Yuh-Min Chen 23,49 , Li Liu 50 , Chang Hyun Kang 16 , Lingmin Hu 17,18 , Chung-Hsing Chen 20 , William Pao 51 , Young-Chul Kim 40,41 , Tsung-Ying Yang 24 , Jun Xu 52 , Peng Guan 27 , Wen Tan 28,29 , Jian Su 30 , Chih-Liang Wang 53 , Haixin Li 8 , Alan Dart Loon Sihoe 54 , Zhenhong Zhao 9,10 , Ying Chen 5 , Yi Young Choi 34 , Jen-Yu Hung 44 , Jun Suk Kim 55 , Ho-Il Yoon 56 , Qiuyin Cai 12 , Chien-Chung Lin 47 , In Kyu Park 16 , Ping Xu 57 , Jing Dong 17,18 , Christopher Kim 1 , Qincheng He 27 , Reury-Perng Perng 49 , Takashi Kohno 58 , Sun-Seog Kweon 59,60 , Chih-Yi Chen 61 , Roel Vermeulen 62 , Junjie Wu 9,10 , Wei-Yen Lim 5 , Kun-Chieh Chen 24 , Wong-Ho Chow 1 , Bu-Tian Ji 1 , John K C Chan 63 , Minjie Chu 17,18 , Yao-Jen Li 14 , Jun Yokota 64 , Jihua Li 65 , Hongyan Chen 9,10 , Yong-Bing Xiang 36 , Chong-Jen Yu 42 , Hideo Kunitoh 66 , Guoping Wu 26 , Li Jin 9,10 , Yen-Li Lo 2 , Kouya Shiraishi 58 , Ying-Hsiang Chen 2 , Hsien-Chih Lin 2 , Tangchun Wu 38,69 , Yi-Long Wu 30,69 , Pan-Chyr Yang 67,69 , Baosen Zhou 27,69 , Min-Ho Shin 60,69 , Joseph F Fraumeni Jr 1,69 , Dongxin Lin 28,29,69 , Stephen J Chanock 1,69 & Nathaniel Rothman 1,69 A full list of affiliations appears at the end of the paper. Received 31 May; accepted 5 October; published online 11 November 2012; doi:10.1038/ng.2456 LETTERS npg © 2012 Nature America, Inc. All rights reserved.
-
Upload
independent -
Category
Documents
-
view
0 -
download
0
Transcript of Genome-wide association analysis identifies new susceptibility loci for Behçet's disease and...

1330 VOLUME 44 | NUMBER 12 | DECEMBER 2012 Nature GeNetics
Toidentifycommongeneticvariantsthatcontributetolungcancersusceptibility,weconductedamultistagegenome-wideassociationstudyoflungcancerinAsianwomenwhoneversmoked.Wescanned5,510never-smokingfemalelungcancercasesand4,544controlsdrawnfrom14studiesfrommainlandChina,SouthKorea,Japan,Singapore,TaiwanandHongKong.Wegenotypedthemostpromisingvariants(associatedatP<5×10⁻⁶)inanadditional1,099casesand2,913controls.Weidentifiedthreenewsusceptibilitylociat10q25.2(rs7086803,P=3.54×10⁻¹⁸),6q22.2(rs9387478,P=4.14×10⁻¹⁰)and6p21.32(rs2395185,P=9.51×10−9).Wealsoconfirmedassociationsreportedforlociat5p15.33and3q28andarecentlyreportedfindingat17q24.3.Weobservednoevidenceofassociationforlungcancerat15q25innever-smokingwomeninAsia,providingstrongevidencethatthislocusisnotassociatedwithlungcancerindependentofsmoking.
It is estimated that 25% of lung cancer cases arise in individuals who never smoked. Lung cancer in never smokers ranks as the seventh most common cause of cancer death worldwide1. A number of observations suggest that the molecular pathogenesis of lung cancer differs by smoking status. Differences have been reported by smoking status in cellular and molecular carcinogenic pathways, distinct profiles of oncogenic mutations (for example, in EGFR) and response to targeted therapy2,3. Compared to lung cancer in smokers, cases in never smokers are more likely to arise in women at a younger age, and there is a greater proportion of cases with the adenocarcinoma histology subtype3. Epidemiological studies of lung cancer in never smokers have shown that the incidence of lung cancer in women is particularly high in Asia4, which is partially attributed to exposure to environmental tobacco smoke, combustion products from indoor heating and cooking fuel, and cooking oil fumes4–10.
Genome-wide association analysis identifies new lung cancer susceptibility loci in never-smoking women in AsiaQing Lan1,68, Chao A Hsiung2,68, Keitaro Matsuo3,68, Yun-Chul Hong4,68, Adeline Seow5,68, Zhaoming Wang6,68, H Dean Hosgood III1,7,68, Kexin Chen8,68, Jiu-Cun Wang9,10,68, Nilanjan Chatterjee1, Wei Hu1, Maria Pik Wong11, Wei Zheng12, Neil Caporaso1, Jae Yong Park13, Chien-Jen Chen14, Yeul Hong Kim15, Young Tae Kim16, Maria Teresa Landi1, Hongbing Shen17,18, Charles Lawrence19, Laurie Burdett6, Meredith Yeager6, Jeffrey Yuenger6, Kevin B Jacobs6, I-Shou Chang20, Tetsuya Mitsudomi21, Hee Nam Kim22, Gee-Chen Chang23,24, Bryan A Bassig1,25, Margaret Tucker1, Fusheng Wei26, Zhihua Yin27, Chen Wu28,29, She-Juan An30, Biyun Qian8, Victor Ho Fun Lee31, Daru Lu9,10, Jianjun Liu32,33, Hyo-Sung Jeon34, Chin-Fu Hsiao2, Jae Sook Sung15, Jin Hee Kim35, Yu-Tang Gao36, Ying-Huang Tsai37, Yoo Jin Jung16, Huan Guo38, Zhibin Hu17,18, Amy Hutchinson6, Wen-Chang Wang2, Robert Klein39, Charles C Chung1, In-Jae Oh40,41, Kuan-Yu Chen42, Sonja I Berndt1, Xingzhou He43, Wei Wu27, Jiang Chang28,29, Xu-Chao Zhang30, Ming-Shyan Huang44, Hong Zheng8, Junwen Wang45,46, Xueying Zhao9,10, Yuqing Li32, Jin Eun Choi34, Wu-Chou Su47, Kyong Hwa Park15, Sook Whan Sung48, Xiao-Ou Shu12, Yuh-Min Chen23,49, Li Liu50, Chang Hyun Kang16, Lingmin Hu17,18, Chung-Hsing Chen20, William Pao51, Young-Chul Kim40,41, Tsung-Ying Yang24, Jun Xu52, Peng Guan27, Wen Tan28,29, Jian Su30, Chih-Liang Wang53, Haixin Li8, Alan Dart Loon Sihoe54, Zhenhong Zhao9,10, Ying Chen5, Yi Young Choi34, Jen-Yu Hung44, Jun Suk Kim55, Ho-Il Yoon56, Qiuyin Cai12, Chien-Chung Lin47, In Kyu Park16, Ping Xu57, Jing Dong17,18, Christopher Kim1, Qincheng He27, Reury-Perng Perng49, Takashi Kohno58, Sun-Seog Kweon59,60, Chih-Yi Chen61, Roel Vermeulen62, Junjie Wu9,10, Wei-Yen Lim5, Kun-Chieh Chen24, Wong-Ho Chow1, Bu-Tian Ji1, John K C Chan63, Minjie Chu17,18, Yao-Jen Li14, Jun Yokota64, Jihua Li65, Hongyan Chen9,10, Yong-Bing Xiang36, Chong-Jen Yu42, Hideo Kunitoh66, Guoping Wu26, Li Jin9,10, Yen-Li Lo2, Kouya Shiraishi58, Ying-Hsiang Chen2, Hsien-Chih Lin2, Tangchun Wu38,69, Yi-Long Wu30,69, Pan-Chyr Yang67,69, Baosen Zhou27,69, Min-Ho Shin60,69, Joseph F Fraumeni Jr1,69, Dongxin Lin28,29,69, Stephen J Chanock1,69 & Nathaniel Rothman1,69
A full list of affiliations appears at the end of the paper.
Received 31 May; accepted 5 October; published online 11 November 2012; doi:10.1038/ng.2456
l e t t e r snp
g©
201
2 N
atur
e A
mer
ica,
Inc.
All
right
s re
serv
ed.

Nature GeNetics VOLUME 44 | NUMBER 12 | DECEMBER 2012 1331
To gain insight into the etiology of lung cancer in never-smoking women, we formed the Female Lung Cancer Consortium in Asia (FLCCA), which includes studies drawn from mainland China, South Korea, Japan, Singapore, Taiwan and Hong Kong. Previously, we published the first genome-wide association study (GWAS) of lung cancer in never-smoking Asian women, including 584 cases and 585 controls with large-scale replication, reporting an association at 5p15.33 near the TERT gene11; in this study, it was also notable that the estimated effect of the associated locus was greater in nonsmoking Asian women than the reported effect size observed in primarily smokers of European ancestry12. We also confirmed an association signal in TP63 at 3q28 (ref. 13), replicating the report from a GWAS conducted in Japan14.
To identify new susceptibility loci in Asian never-smoking women, we conducted a lung cancer GWAS in 14 studies (13 case-control studies and 1 cohort study; Supplementary Table 1 and Supplementary Note). Samples were scanned at six centers (Online Methods): the US National Cancer Institute (NCI) Cancer Genomic Research (CGR) Laboratory, the Genome Institute of Singapore, the Memorial Sloan-Kettering Cancer Center (MSKCC), GeneTech Biotech in Taiwan, Gene-Square Biotech in Beijing and deCODE Genetics in Iceland. After stringent quality control analysis of genotypes (Online Methods), we combined data sets for 5,510 lung cancer cases and 4,544 controls using a pre-viously described clustering algorithm15. The primary analysis was performed using logistic regression for genotype trend effect (with 1 degree of freedom) adjusted for study center, age and three eigenvectors (on the basis of principal-components analysis). A comparison of the observed and expected P values in the quantile-quantile plot showed an enrichment of observed signals with small P values compared to the null
distribution of no association, with little evidence for genomic inflation (unscaled λ = 1.014, λ1000 = 1.003; Supplementary Fig. 1)16.
The overall association results are shown in a Manhattan plot, in which we observed both new and known loci that exceeded the thresh-old for genome-wide significance (P < 5 × 10⁻⁸; Fig. 1). We observed association at two previously established loci, rs2736100 at 5p15.33 (refs. 11,12,14,17–19) and rs4488809 at 3q28 (refs. 13,14). We also observed support for association of a recently reported locus marked by rs7216064 at 17q24.3 (ref. 20) (Supplementary Table 2). Notably, there was no evidence for association across the 15q25 region, which has been associated with smoking-related lung cancer12,19,21–24. We did not observe strong association signals for other loci reported in either European25 or Asian17,26 populations (Supplementary Table 2).
In our primary scan, we observed one new locus at 10q25.2, marked by rs7086803, that substantially exceeded the threshold for genome-wide significance (odds ratio (OR) = 1.32, 95% confidence interval (CI) = 1.24–1.41; P = 5.04 × 10⁻¹⁷) (Fig. 1 and Table 1). We developed assays to genotype 13 SNPs associated at P < 5 × 10⁻⁶ in the initial scan, using analysis of all cases or the most common subtype in nonsmokers, adenocarcinoma. We genotyped 1,099 new cases and 2,913 controls drawn from the same studies as in the initial scan. In a combined analysis of 6,609 cases and 7,457 controls, 3 new loci achieved associations at genome-wide significance (Table 1): 10q25.2 (rs7086803: OR = 1.28, 95% CI = 1.21–1.35; P = 3.54 × 10⁻¹⁸), 6q22.2 (rs9387478: OR = 0.85, 95% CI = 0.81–0.90; P = 4.14 × 10⁻¹⁰)
28
TERT
TP63
HLA class II
–log
10 P
VTI1A
ROS1-DCBLD1
27
26
18
17
16
15
14
13
12
11
10
9
8
7
6
5
4
3
2
1
0
Chr. 20Chr. 10
Chr. 19Chr. 9
Chr. 18
Chr. 8Chr. 17Chr. 7
Chr. 16Chr. 6
Chr. 15Chr. 5
Chr. 14Chr. 4Chr. 1
Chr. 11Chr. 21 Chr. 22
Chr. 12Chr. 2
Chr. XChr. 13Chr. 3
Figure 1 Association results from a GWAS of never-smoking women in Asia. Manhattan plot based on P values derived from 1-degree-of-freedom tests of genotype trend effect in unconditional logistic regression analysis adjusted for study, age and three eigenvectors in a GWAS of lung cancer in never-smoking Asian females, including 5,510 lung cancer cases and 4,544 controls. The x axis represents chromosomal location, and the y axis shows P values on a negative logarithmic scale. The red horizontal line represents the genome-wide significance threshold of P = 5 × 10⁻⁸. Labeled are two previously associated loci (TERT at 5p15.33 and TP63 at 3q28) together with three newly identified loci (VTI1A on chromosome 10 and ROS1-DCBLD1 and the HLA class II region on chromosome 6).
table 1 New loci associated with lung cancer in a GWAs of never-smoking Asian females
SNPPlausible candidate gene(s)
Chromosome position Subset Allelea
MAFb Subjects
OR (95% CI) PtrendControl Case Control Case
rs7086803 VTI1A 10q25.2 GWAS G/A 0.26 0.32 4,492 5,457 1.32 (1.24–1.41) 5.04 × 10⁻¹⁷
Replication G/A 0.27 0.31 2,887 1,085 1.23 (1.10–1.37) 3.36 × 10⁻⁴
Combined G/A 0.27 0.31 7,379 6,542 1.28 (1.21–1.35) 3.54 × 10⁻¹⁸
rs9387478 ROS1, DCBLD1 6q22.2 GWAS C/A 0.50 0.46 4,542 5,510 0.85 (0.81–0.90) 7.79 × 10⁻⁸
Replication C/A 0.49 0.47 2,891 1,091 0.92 (0.83–1.01) 0.088
Combined C/A 0.50 0.46 7,433 6,601 0.85 (0.81–0.90) 4.14 × 10⁻¹⁰
rs2395185c (rs28366298)
HLA class II region 6p21.32 GWASReplicationCombined
G/TA/C
Meta
0.350.37
0.380.42
4,5412,8807,421
5,5041,0086,512
1.16 (1.09–1.23)1.20 (1.08–1.33)1.17 (1.11–1.23)
2.60 × 10⁻⁶
7.93 × 10⁻⁴
9.51 × 10⁻⁹
aMinor allele listed second. bMinor allele frequency. cFor the HLA class II region, because a TaqMan assay could not be designed for rs2395185, we instead genotyped rs28366298, its perfect surrogate (r2 = 1.0), by TaqMan. The reported P value is based on meta-analysis of the rs2395185 results in the GWAS and the rs28366298 results in the TaqMan set.
l e t t e r snp
g©
201
2 N
atur
e A
mer
ica,
Inc.
All
right
s re
serv
ed.
1332 VOLUME 44 | NUMBER 12 | DECEMBER 2012 Nature GeNetics
l e t t e r s
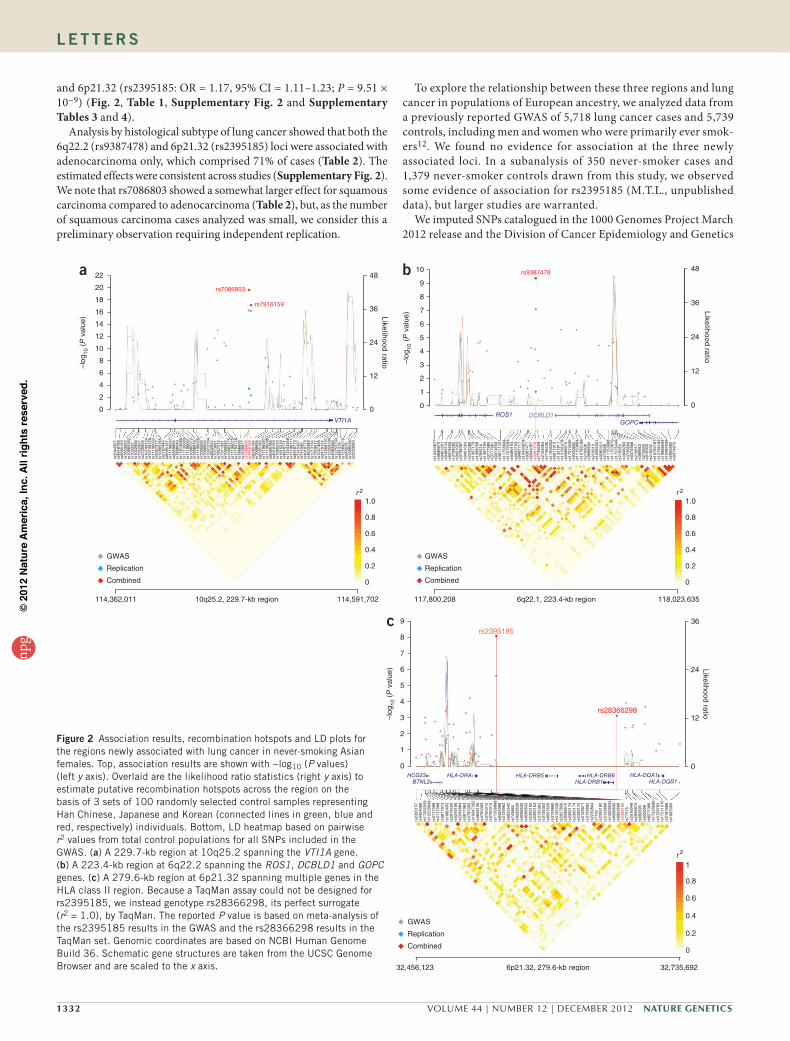
and 6p21.32 (rs2395185: OR = 1.17, 95% CI = 1.11–1.23; P = 9.51 × 10⁻⁹) (Fig. 2, Table 1, Supplementary Fig. 2 and Supplementary Tables 3 and 4).
Analysis by histological subtype of lung cancer showed that both the 6q22.2 (rs9387478) and 6p21.32 (rs2395185) loci were associated with adenocarcinoma only, which comprised 71% of cases (Table 2). The estimated effects were consistent across studies (Supplementary Fig. 2). We note that rs7086803 showed a somewhat larger effect for squamous carcinoma compared to adenocarcinoma (Table 2), but, as the number of squamous carcinoma cases analyzed was small, we consider this a preliminary observation requiring independent replication.
To explore the relationship between these three regions and lung cancer in populations of European ancestry, we analyzed data from a previously reported GWAS of 5,718 lung cancer cases and 5,739 controls, including men and women who were primarily ever smok-ers12. We found no evidence for association at the three newly associated loci. In a subanalysis of 350 never-smoker cases and 1,379 never-smoker controls drawn from this study, we observed some evidence of association for rs2395185 (M.T.L., unpublished data), but larger studies are warranted.
We imputed SNPs catalogued in the 1000 Genomes Project March 2012 release and the Division of Cancer Epidemiology and Genetics
c 9
8rs2395185
HCG23BTNL2
HLA-DRA HLA-DRB5 HLA-DRB6 HLA-DQA1HLA-DQB1HLA-DRB1
rs28366298
36
24 Likelihood ratio
12
0
7
6
–log
10 (P
val
ue)
5
4
3
2
1
0
rs23
9515
7rs
4424
066
rs17
2022
59rs
1252
9049
rs31
1709
9rs
3117
098
rs38
1797
3rs
1980
493
rs20
7653
0rs
4248
166
rs22
9488
4rs
3817
963
rs37
6330
5rs
1094
7262
rs38
0615
6rs
3763
309
rs37
6331
2rs
3763
313
rs17
2088
88rs
9405
098
rs31
2996
3rs
6932
542
rs74
3862
rs92
6852
8rs
9268
530
rs92
6854
2rs
2395
162
rs23
9516
3rs
3135
363
rs31
3535
3rs
9501
626
rs31
2986
0rs
3135
338
rs20
2785
6rs
9268
615
rs23
9517
3rs
2395
174
rs23
9517
5rs
3129
871
rs31
2988
2rs
2239
804
rs71
92rs
2395
182
rs31
2989
0rs
1320
9234
rs92
6883
2rs
6903
608
rs23
9518
5rs
7751
5rs
2516
049
rs28
5887
0
rs53
2098
rs92
7136
6rs
1753
3090
rs31
2976
3rs
1721
1510
rs21
8766
8rs
1063
355
rs66
0895
GWAS
Replication
Combined
32,456,123 32,735,6926p21.32, 279.6-kb region
0
0.2
0.4
0.6
0.8
1r2
22ars7086803
rs7916159
48
36
24
12
0
20
18
16
14
12
10
–log
10 (P
val
ue)
VTI1A
8
6
4
2
0
rs20
4436
7rs
4918
760
rs65
8516
3rs
1033
922
rs10
8853
62rs
7033
32rs
1022
906
rs10
2290
7rs
2120
929
rs10
7491
24rs
1074
9125
rs11
1960
32rs
2057
577
rs10
8853
65rs
2197
444
rs65
8516
7rs
1119
6047
rs28
5988
5rs
7898
049
rs11
8146
80rs
1713
0000
rs11
1960
51rs
1088
5372
rs79
0691
9
rs70
9562
0rs
7088
500
rs12
4127
04rs
3802
554
rs70
7368
1rs
7907
012
rs79
1108
1rs
7090
942
rs10
8853
75rs
1119
6072
rs12
7847
26rs
1886
600
rs14
0881
7
rs65
8518
4rs
7068
695
rs65
8518
5rs
1119
6097
rs11
1960
98rs
6585
186
rs49
1876
9rs
7085
310
rs49
1877
1rs
1815
239
rs12
2433
58rs
1119
6111
rs49
1877
3rs
7915
497
rs74
4340
rs49
1877
9rs
4633
389
rs12
1313
4rs
7903
017
rs10
4746
8rs
2479
124
rs12
3587
31rs
1235
9794
rs40
8348
0rs
1225
3794
rs48
1419
rs54
5572
rs12
5695
79
rs10
8853
87rs
2003
083
rs70
8680
3rs
7916
159
rs11
1960
56
r2
114,362,011 114,591,702
0
0.2
0.4
0.6
0.8
1.0r2
0
0.2
0.4
0.6
0.8
1.0
10q25.2, 229.7-kb region
10
9b
8
7
6
5
–log
10 (P
val
ue)
4
3
2
1
0
rs9387478 48
36
Likeliho
od ratio
Likeliho
od ratio
24
12
0ROS1
GOPCDCBLD1
rs10
4348
77rs
9688
879
rs94
0100
1rs
9489
143
rs93
7465
5rs
3798
385
rs94
0100
3rs
3798
387
rs94
0100
4rs
2243
380
rs14
0717
9rs
1998
206
rs76
5516
rs14
0718
4rs
3777
980
rs37
7798
1rs
9374
658
rs36
1114
27rs
1175
8804
rs17
0792
05rs
9489
193
rs69
3279
3rs
9481
717
rs10
4348
78rs
9387
477
rs69
4206
7
rs77
4922
9rs
2104
064
rs77
4653
6rs
1763
6252
rs69
1191
5rs
1321
811
rs13
1954
78rs
9489
215
rs17
5745
00rs
9320
605
rs11
1536
64rs
1078
2186
rs21
0608
rs96
8860
5rs
2106
10rs
1048
4301
rs92
8542
1rs
2106
48rs
1115
3668
rs11
1536
70rs
1757
5449
rs21
0653
rs49
4626
3rs
3756
894
rs93
7466
8rs
2106
17rs
3896
63rs
2106
25rs
9163
05rs
2106
32rs
1078
2187
rs12
1941
83rs
1968
8594
rs10
4842
99rs
2062
662
rs93
7467
0
rs93
8747
8
GWAS
Replication
Combined
117,800,208 118,023,6356q22.1, 223.4-kb region
GWAS
Replication
Combined
Figure 2 Association results, recombination hotspots and LD plots for the regions newly associated with lung cancer in never-smoking Asian females. Top, association results are shown with −log10 (P values) (left y axis). Overlaid are the likelihood ratio statistics (right y axis) to estimate putative recombination hotspots across the region on the basis of 3 sets of 100 randomly selected control samples representing Han Chinese, Japanese and Korean (connected lines in green, blue and red, respectively) individuals. Bottom, LD heatmap based on pairwise r2 values from total control populations for all SNPs included in the GWAS. (a) A 229.7-kb region at 10q25.2 spanning the VTI1A gene. (b) A 223.4-kb region at 6q22.2 spanning the ROS1, DCBLD1 and GOPC genes. (c) A 279.6-kb region at 6p21.32 spanning multiple genes in the HLA class II region. Because a TaqMan assay could not be designed for rs2395185, we instead genotype rs28366298, its perfect surrogate (r2 = 1.0), by TaqMan. The reported P value is based on meta-analysis of the rs2395185 results in the GWAS and the rs28366298 results in the TaqMan set. Genomic coordinates are based on NCBI Human Genome Build 36. Schematic gene structures are taken from the UCSC Genome Browser and are scaled to the x axis.
npg
© 2
012
Nat
ure
Am
eric
a, In
c. A
ll rig
hts
rese
rved
.

Nature GeNetics VOLUME 44 | NUMBER 12 | DECEMBER 2012 1333
l e t t e r s
Imputation Reference Set version 1 (ref. 27) using the IMPUTE2 program28 across a 1-Mb region centered on the index SNP (Online Methods). For the two regions outside of the human leukocyte anti-gen (HLA) region, the association analysis did not identify new signals that were substantially stronger than those found for the genotyped SNPs (Supplementary Fig. 3a,b). Although there seem to be stronger signals in the imputed data for the HLA class II region (Supplementary Fig. 3c), HLA typing will be necessary to unravel the specific haplotypes involved.
At the 6q22 locus, six SNPs were highly correlated with rs9387478 (r2 = 0.99–1.00). Two SNPs, rs9387478 and rs6937083 (pairwise r2 = 1), were observed within a region defined by the Encyclopedia of DNA Elements (ENCODE) as containing both chromatin state segmen-tation and enhancer- and promoter-associated histone marks. Although the evidence for evolutionary conservation is weak (that is, a cross- species sequence alignment comparison indicated conservation at the site of ~29.2 million years since divergence from a common ancestor), rs6937083 falls within an ENCODE-predicted transcription factor– binding site and an exon of the AceView-predicted gene, DCBLD1. The architecture of the region on chromosome 10q25 is more complicated because there are 23 perfectly correlated SNPs (r2 = 1) and 1 highly corre-lated SNP (r2 = 0.99). All localize to intron 7 or the UTR of one transcript of the VTI1A gene (encoding vesicle transport through interaction with t-SNAREs homolog 1A (yeast)). Sixteen fall within putatively functional regions, defined as ENCODE DNase I hypersensitivity clusters, chro-matin state segmentation, the UTR of VTI1A, ENCODE enhancer- and promoter-associated histone marks and/or highly conserved (that is, a cross-species sequence alignment comparison indicated conservation at the site of 300 million years since divergence from a common ancestor) regions (Supplementary Table 5). rs11196080 is noteworthy because many of the functionally predicted areas converge on this SNP, making this a high-priority variant for functional follow-up studies.
The strongest new association signal, rs7086803 at 10q25.2, maps to intron 7 of the VTI1A gene, which has been implicated in lung carcinogenesis. Loss of VTI1A activity has been reported to reduce high-frequency spontaneous neurotransmitter release29 and rapid progressive neurodegeneration in the peripheral ganglia30. VTI1A is also involved in Acrp30-containing vesicles in adipocytes, and lower amounts of VTI1A in cultured adipocytes can inhibit adiponectin secretion31. Lower amounts of adiponectin have previously been asso-ciated with advanced lung cancer31,32. A recent study reported recur-rent VTI1A-TCF7L2 fusions in colorectal cancers, and a colorectal carcinoma cell line with the fusion gene was shown to be dependent on VTI1A-TCF7L2 for anchorage-independent growth33.
The rs9387478 SNP at 6q22.2 is located in an interval that contains two candidate genes: DCBLD1 (encoding discoidin, CUB and LCCL domain containing 1) and ROS1 (encoding the ROS proto-oncogene
receptor tyrosine kinase). ROS1 functions as both an integral mem-brane protein and a receptor tyrosine kinase34. Expression of Ros1 is specifically increased in lung cancer tissue in mouse models, and ROS1 expression levels are higher in non-small cell lung cancer (NSCLC)35. ROS1 fusions in lung adenocarcinoma and NSCLC, particularly in Asian never smokers, have been identified as drivers of oncogenesis36–38. ROS1 rearrangements were found to be more common in lung adeno-carcinomas from never smokers and younger affected individuals39. There is limited evidence concerning the functional role of the protein encoded by DCBLD1; a related gene at 3q12.2, DCBLD2 (encoding discoidin, CUB and LCCL domain containing 2; also known as CLCP1) regulates cellular proliferation and invasion and may have an important role in cancer metastasis40–42.
The third locus, marked by rs2395185 at 6p21.3, is located within 20 kb of HLA-DRA (encoding major histocompatibility complex, class II, DRα) and 52 kb downstream of HLA-DRB5 (encoding major histocompatibility complex, class II, DRβ5). There was no evidence for strong linkage disequilibrium (LD) between this SNP and other SNPs at 6p21.32 reported to be associated with lung cancer17,23. There was little LD with a recently reported SNP at 6p21.3, rs3817963, which was associated with lung cancer in a Japanese population20; the r2 in Han Chinese and Japanese HapMap samples was 0.18 and 0.10, respectively, and D was 0.57 and 0.43, respectively. These data suggest that our locus probably represents a new HLA class II–related finding for nonsmoking lung cancer susceptibility. Further mapping across the complex HLA region is required to characterize the specific sus-ceptibility alleles or haplotypes involved in nonsmoking lung cancer risk. We also note that rs2395185 has been previously associated with ulcerative colitis43, Hodgkin lymphoma44 and type 1 diabetes45.
In previous GWAS of lung cancer, in which a majority of cases were smokers, SNPs across a region at 15q25 have been associated with lung cancer risk12,19,21–24. However, studies of smoking-related behavior have also identified variants at 15q25, raising the possibility that the variants previously identified by GWAS for lung cancer could mediate risk through effects on tobacco use46. We previously geno-typed additional SNPs across 15q25 in Asian studies and observed no evidence of association with lung cancer in never-smoking Asian females11. Notably, in our current, larger study, there was no evidence for association with lung cancer at 15q25 in the never-smoking popu-lation overall or in the major subtypes. These data provide strong evidence that this locus is not associated with lung cancer independ-ent of smoking in never-smoking females in Asia, which contrasts with the results from a smaller Asian study24 but is consistent with previous reports from smaller studies conducted in populations of European ancestry12,47,48.
We investigated the relationship between our new loci and known environmental exposures. The association between exposure to
table 2 New loci associated with adenocarcinoma and squamous carcinoma of the lung in a GWAs of never-smoking Asian females
SNPPutative gene
Chromosome position Allelea
MAFb Adenocarcinoma Squamous carcinoma
Pheterogeneityc1 2 3
Subjects OR (95% CI) Ptrend
Subjects OR (95% CI) PtrendControl Case Control Case
rs7086803 VTI1A 10q25.2 G/A 0.27 0.31 0.34 7,035 4,666 1.24 (1.17–1.32)
1.19 × 10⁻¹¹ 6,714 756 1.36 (1.21–1.54)
7.11 × 10⁻⁷ 0.014
rs9387478 ROS1, DCBLD1
6q22.2 C/A 0.50 0.46 0.48 7,089 4,726 0.84 (0.80–0.89)
1.55 × 10⁻⁹ 6,768 755 0.90 (0.81–1.01)
0.078 0.060
rs2395185d (rs28366298)
HLA class II region
6p21.32 Meta 7,390 4,696 1.20 (1.13–1.28)
9.47 × 10⁻¹⁰ 7,211 742 1.05 (0.93–1.18)
0.42 0.56
aMinor allele listed second. bMinor allele frequency. 1, MAF in controls; 2, MAF in adenocarcinoma; 3, MAF in squamous carcinoma. cTested by case-case analysis. dFor the HLA class II region, because a TaqMan assay could not be designed for rs2395185, we instead genotyped rs28366298, its perfect surrogate (r2 = 1.0), by TaqMan. The reported P value is based on meta-analysis of the rs2395185 results in the GWAS and the rs28366298 results in the TaqMan set.
npg
© 2
012
Nat
ure
Am
eric
a, In
c. A
ll rig
hts
rese
rved
.

1334 VOLUME 44 | NUMBER 12 | DECEMBER 2012 Nature GeNetics
l e t t e r s
environmental tobacco smoke in the home and adenocarcinoma in the five studies with data available yielded an OR of 1.36 (P = 1.2 × 10⁻⁴) in an analysis of 1,770 cases and 2,675 controls, consistent with previous reports8. The effect of environmental tobacco smoke was stronger for subjects with the GG genotype at rs2395185, with OR = 1.78 (P = 1.15 × 10⁻⁵), compared to subjects with the GT or TT genotypes, OR = 1.16 (P = 0.15), with Pinteraction = 0.002. The associa-tion between the T allele at rs2395185 and risk of adenocarcinoma in subjects with and without exposure to environmental tobacco smoke yielded OR = 1.13 (P = 0.031) and OR = 1.43 (P = 5.6 × 10⁻⁴), respec-tively, with Pinteraction = 0.037. There was no evidence of interaction with the other two new loci reported here.
In summary, we conducted a GWAS of lung cancer in never- smoking females in Asia and identified three new susceptibility loci at 10q25.2, 6q22.2 and 6p21.32. We also confirmed associations with two previously reported regions at 5p15.3 and 3q28 and a recently reported locus at 17q24.3. It is notable that our strongest finding at 10q25.2 has not been reported previously in lung cancer GWAS. This observation suggests that the etiology of lung cancer in never smokers in Asia may have unique genetic characteristics. This is consistent with the distinct pattern of environmental risk factors that have been causally linked to lung cancer in never-smoking females in Asia4–8,10 and the distinct molecular phenotypes of lung cancer in never smokers2,3. Further work is warranted to map the new regions. Functional work is required to identify the variants that directly account for the underlying association, as well as to study how the genetic variants interact with established environmental risk factors, including environmental tobacco smoke, cooking fumes and fuel use, in never-smoking females in Asia.
URLs. CGF, http://cgf.nci.nih.gov/; GLU, http://code.google.com/p/glu-genetics/; EIGENSTRAT, http://genepath.med.harvard.edu/~reich/EIGENSTRAT.htm; Structure, http://pritch.bsd.uchicago.edu/structure.html; IMPUTE2, http://mathgen.stats.ox.ac.uk/impute/impute_v2.html; SNPTEST, https://mathgen.stats.ox.ac.uk/genetics_software/snptest/snptest.html; liftOver, http://hgdownload.cse.ucsc.edu/downloads.html; SAS v9.2 (used to generate forest plots), http://support.sas.com/kb/43/855.html.
MeTHodSMethods and any associated references are available in the online version of the paper.
Accession codes. The CGEMS data portal provides access to individual-level data for investigators from certified scientific institutions after approval of their submitted Data Access Request.
Note: Supplementary information is available in the online version of the paper.
ACKNOWLEDGMENTSWe thank J.-J. Yang, X.-N. Yang, Q. Zhou, W.-B. Guo, S.-L. Chen, Y. Huang, Z. Xie, J.-G. Chen, H.-H. Yan, K. Tajima, Y. Yatabe, T. Hida, K.-L. Chuah, A. Ng, P. Eng, S.-S. Leong, M.-K. Ang, E. Lim, T.-K. Lim, M. Teh, W.-T. Poh and A. Tee. The overall GWAS project was supported by the intramural program of the US National Institutes of Health/National Cancer Institute. A list of support provided to individual studies is provided in the Supplementary Note.
AUTHOR CONTRIBUTIONSQ.L., N.R., S.J.C., D. Lin, C.A.H., Y.-C.H., K.M., A.S., H.D.H., J.Y.P., C.-J.C., Y.H.K., Y.T.K., C.L., Y.-L.W., P.-C.Y., B.Z., M.-H.S., J.F.F., K.C., W.Z., T.W., H.S., I.-S.C., D. Lu, N. Caporaso, W.P., R.K., J. Liu, M.T.L., N. Chatterjee, M.T. and M.Y. organized and designed the study. S.J.C., D. Lin, R.K., J. Liu, C.A.H., K.M., T.W., L.B., M.Y., J. Yuenger, Z.Y., C.W., H.G., A.H., W.W., Y.L., W.P., H.-C.L. and B.Z. conducted and supervised the genotyping of samples. Z.W., K.B.J., N.R., Q.L.,
S.J.C., N. Chatterjee, C.A.H., H.D.H., W.H., M.Y., I.-S.C., C.-F.H., W.-C.W., C.C.C., S.I.B., C.-H.C., R.V. and Y.-H.C. contributed to the design and execution of statistical analysis. Q.L., N.R., S.J.C., Z.W., W.H., C.C.C., C.A.H., K.M., Y.-C.H., A.S., H.D.H., N. Chatterjee, N. Caporaso, C.L., M.Y., B.A.B., M.T., S.-J.A., S.I.B., M.T.L., C.K., R.V., Y.-L.W., J.F.F. and I.-S.C. wrote the first draft of the manuscript. C.A.H., Q.L., B.Z., Y.-C.H., K.M., A.S., K.C., J.-C.W., M.P.W., W.Z., J.Y.P., W.H., C.-J.C., Y.H.K., Y.T.K., T.W., H.S., I.-S.C., T.M., H.N.K., F.W., Z.Y., C.W., S.-J.A., G.-C.C., B.Q., V.H.F.L., D. Lu, H.-S.J., J.S.S., J.H.K., Y.-T.G., Y.-H.T., Y.J.J., H.G., Z.H., I.-J.O., K.-Y.C., X.H., W.W., J.C., X.-C.Z., M.-S.H., H.Z., J. Wang, X.Z., J.E.C., W.-C.S., K.H.P., S.W.S., X.-O.S., Y.-M.C., L.L., C.H.K., L.H., Y.-C.K., T.-Y.Y., J.X., P.G., W.T., J.S., C.-L.W., H.L., A.D.L.S., Z.Z., Y.C., Y.Y.C., J.-Y.H., J.S.K., H.-I.Y., Q.C., C.-C.L., I.K.P., P.X., J.D., Q.H., R.-P.P., T.K., S.-S.K., C.-Y.C., R.V., J. Wu, W.-Y.L., K.-C.C., W.-H.C., B.-T.J., J.K.C.C., M.C., Y.-J.L., J. Yokota, J. Li, H.C., Y.-B.X., C.-J.Y., H.K., G.W., L.J., Y.-L.L., K.S., Y.-L.W., P.-C.Y., M.-H.S., J.F.F., D. Lin, S.J.C. and N.R. conducted the epidemiological studies and contributed samples to the GWAS and/or follow-up genotyping. All authors contributed to the writing of the manuscript.
COMPETING FINANCIAL INTERESTSThe authors declare no competing financial interests.
Published online at http://www.nature.com/doifinder/10.1038/ng.2456. Reprints and permissions information is available online at http://www.nature.com/reprints/index.html.
1. Sun, S., Schiller, J.H. & Gazdar, A.F. Lung cancer in never smokers—a different disease. Nat. Rev. Cancer 7, 778–790 (2007).
2. Sun, Y. et al. Lung adenocarcinoma from East Asian never-smokers is a disease largely defined by targetable oncogenic mutant kinases. J. Clin. Oncol. 28, 4616–4620 (2010).
3. Rudin, C.M. et al. Lung cancer in never smokers: molecular profiles and therapeutic implications. Clin. Cancer Res. 15, 5646–5661 (2009).
4. Thun, M.J. et al. Lung cancer occurrence in never-smokers: an analysis of 13 cohorts and 22 cancer registry studies. PLoS Med. 5, e185 (2008).
5. Gao, Y.T. et al. Lung cancer among Chinese women. Int. J. Cancer 40, 604–609 (1987).
6. Gu, D. et al. Cigarette smoking and exposure to environmental tobacco smoke in China: the international collaborative study of cardiovascular disease in Asia. Am. J. Public Health 94, 1972–1976 (2004).
7. Lan, Q., Chapman, R.S., Schreinemachers, D.M., Tian, L. & He, X. Household stove improvement and risk of lung cancer in Xuanwei, China. J. Natl. Cancer Inst. 94, 826–835 (2002).
8. Couraud, S., Zalcman, G., Milleron, B., Morin, F. & Souquet, P.J. Lung cancer in never smokers—a review. Eur. J. Cancer 48, 1299–1311 (2012).
9. Samet, J.M. et al. Lung cancer in never smokers: clinical epidemiology and environmental risk factors. Clin. Cancer Res. 15, 5626–5645 (2009).
10. Lo, Y.L. et al. Risk factors for primary lung cancer among never smokers by gender in a matched case-control study. Cancer Causes Control published online, doi:10.1007/s10552-012-9994-x (22 May 2012).
11. Hsiung, C.A. et al. The 5p15.33 locus is associated with risk of lung adenocarcinoma in never-smoking females in Asia. PLoS Genet. 6, e1001051 (2010).
12. Landi, M.T. et al. A genome-wide association study of lung cancer identifies a region of chromosome 5p15 associated with risk for adenocarcinoma. Am. J. Hum. Genet. 85, 679–691 (2009).
13. Hosgood, H.D. III et al. Genetic variant in TP63 on locus 3q28 is associated with risk of lung adenocarcinoma among never-smoking females in Asia. Hum. Genet. 131, 1197–1203 (2012).
14. Miki, D. et al. Variation in TP63 is associated with lung adenocarcinoma susceptibility in Japanese and Korean populations. Nat. Genet. 42, 893–896 (2010).
15. Amundadottir, L. et al. Genome-wide association study identifies variants in the ABO locus associated with susceptibility to pancreatic cancer. Nat. Genet. 41, 986–990 (2009).
16. de Bakker, P.I. et al. Practical aspects of imputation-driven meta-analysis of genome-wide association studies. Hum. Mol. Genet. 17, R122–R128 (2008).
17. Hu, Z. et al. A genome-wide association study identifies two new lung cancer susceptibility loci at 13q12.12 and 22q12.2 in Han Chinese. Nat. Genet. 43, 792–796 (2011).
18. McKay, J.D. et al. Lung cancer susceptibility locus at 5p15.33. Nat. Genet. 40, 1404–1406 (2008).
19. Truong, T. et al. Replication of lung cancer susceptibility loci at chromosomes 15q25, 5p15, and 6p21: a pooled analysis from the International Lung Cancer Consortium. J. Natl. Cancer Inst. 102, 959–971 (2010).
20. Shiraishi, K. et al. A genome-wide association study identifies two new susceptibility loci for lung adenocarcinoma in the Japanese population. Nat. Genet. 44, 900–903 (2012).
21. Amos, C.I. et al. Genome-wide association scan of tag SNPs identifies a susceptibility locus for lung cancer at 15q25.1. Nat. Genet. 40, 616–622 (2008).
22. Hung, R.J. et al. A susceptibility locus for lung cancer maps to nicotinic acetylcholine receptor subunit genes on 15q25. Nature 452, 633–637 (2008).
npg
© 2
012
Nat
ure
Am
eric
a, In
c. A
ll rig
hts
rese
rved
.

Nature GeNetics VOLUME 44 | NUMBER 12 | DECEMBER 2012 1335
l e t t e r s
1Division of Cancer Epidemiology and Genetics, National Cancer Institute, Bethesda, Maryland, USA. 2Institute of Population Health Sciences, National Health Research Institutes, Zhunan, Taiwan. 3Division of Epidemiology and Prevention, Aichi Cancer Center Research Institute, Nagoya, Japan. 4Department of Preventive Medicine, Seoul National University College of Medicine, Seoul, Republic of Korea. 5Saw Swee Hock School of Public Health, National University of Singapore, Singapore. 6Cancer Genomics Research Laboratory, Division of Cancer Epidemiology and Genetics, National Cancer Institute, Bethesda, Maryland, USA. 7Department of Epidemiology and Population Health, Albert Einstein College of Medicine, Bronx, New York, USA. 8Department of Epidemiology and Biostatistics, Tianjin Medical University Cancer Institute and Hospital, Tianjin, China. 9Ministry of Education Key Laboratory of Contemporary Anthropology, School of Life Sciences, Fudan University, Shanghai, China. 10State Key Laboratory of Genetic Engineering, School of Life Sciences, Fudan University, Shanghai, China. 11Department of Pathology, Li Ka Shing (LKS) Faculty of Medicine, The University of Hong Kong, Hong Kong, China. 12Department of Medicine, Vanderbilt Epidemiology Center, Vanderbilt-Ingram Cancer Center, Institute for Medicine and Public Health, Vanderbilt University, Nashville, Tennessee, USA. 13Lung Cancer Center, Kyungpook National University Medical Center, Daegu, Republic of Korea. 14Genomic Research Center, Taipei, Taiwan. 15Department of Internal Medicine, Division of Oncology/Hematology, College of Medicine, Korea University Anam Hospital, Seoul, Republic of Korea. 16Department of Thoracic and Cardiovascular Surgery, Cancer Research Institute, Seoul National University College of Medicine, Seoul, Republic of Korea. 17Ministry of Education Key Laboratory of Modern Toxicology, Nanjing Medical University, Nanjing, China. 18Jiangsu Key Laboratory of Cancer Biomarkers, Prevention and Treatment, Nanjing Medical University, Nanjing, China. 19Westat, Rockville, Maryland, USA. 20National Institute of Cancer Research, National Health Research Institutes, Zhunan, Taiwan. 21Division of Thoracic Surgery, Kinki University School of Medicine, Sayama, Japan. 22Genome Research Center for Hematopoietic Diseases, Chonnam National University Hwasun Hospital, Hwasun-eup, Republic of Korea. 23Department of Medicine, School of Medicine, National Yang-Ming University, Taipei, Taiwan. 24Division of Chest Medicine, Department of Internal Medicine, Taichung Veterans General Hospital, Taichung, Taiwan. 25Division of Environmental Health Sciences, Yale School of Public Health, New Haven, Connecticut, USA. 26China National Environmental Monitoring Center, Beijing, China. 27Department of Epidemiology, School of Public Health, China Medical University, Shenyang, China. 28Department of Etiology & Carcinogenesis, Cancer Institute and Hospital, Chinese Academy of Medical Sciences and Peking Union Medical College, Beijing, China. 29State Key Laboratory of Molecular Oncology, Cancer Institute and Hospital, Chinese Academy of Medical Sciences and Peking Union Medical College, Beijing, China. 30Guangdong Lung Cancer Institute, Medical Research Center and Cancer Center of Guangdong General Hospital, Guangdong Academy of Medical Sciences, Guangzhou, China. 31Department of Clinical Oncology, LKS Faculty of Medicine, The University of Hong Kong, Hong Kong, China. 32Department of Human Genetics, Genome Institute of Singapore, Singapore. 33School of Life Sciences, Anhui Medical University, Hefei, China. 34Cancer Research Center, Kyungpook National University Medical Center, Daegu, Republic of Korea. 35Institute of Environmental Medicine, Seoul National University Medical Research Center, Seoul, Republic of Korea. 36Department of Epidemiology, Shanghai Cancer Institute, Shanghai, China. 37Department of Respiratory Therapy, Chang Gung Memorial Hospital, Chiayi, Taiwan. 38Institute of Occupational Medicine and Ministry of Education Key Laboratory for Environment and Health, School of Public Health, Huazhong University of Science and Technology, Wuhan, China. 39Program in Cancer Biology and Genetics, Memorial Sloan-Kettering Cancer Center, New York, New York, USA. 40Lung and Esophageal Cancer Clinic, Chonnam National University Hwasun Hospital, Hwasun-eup, Republic of Korea. 41Department of Internal Medicine, Chonnam National University Medical School, Gwangju, Republic of Korea. 42Department of Internal Medicine, National Taiwan University Hospital, Taipei, Taiwan. 43Chinese Center for Disease Control and Prevention, Beijing, China. 44Department of Internal Medicine, Kaohsiung Medical University Hospital, School of Medicine, Kaohsiung Medical University, Kaohsiung, Taiwan. 45Department of Biochemistry, LKS Faculty of Medicine, The University of Hong Kong, Hong Kong, China. 46Centre for Genomic Sciences, LKS Faculty of Medicine, The University of Hong Kong, Hong Kong, China. 47Department of Internal Medicine, National Cheng Kung University Hospital, College of Medicine, National Cheng Kung University, Tainan, Taiwan. 48Department of Thoracic and Cardiovascular Surgery, Seoul National University Bundang Hospital, Seongnam, Republic of Korea. 49Chest Department, Taipei Veterans General Hospital, Taipei, Taiwan. 50Cancer Center, Union Hospital, Huazhong University of Science and Technology, Wuhan, China. 51Division of Hematology and Oncology, Vanderbilt University Medical Center, Nashville, Tennessee, USA. 52School of Public Health, The University of Hong Kong, Hong Kong, China. 53Department of Pulmonary and Critical Care, Chang Gung Memorial Hospital, Taoyuan, Taiwan. 54Department of Surgery, Division of Cardiothoracic Surgery, Queen Mary Hospital, Hong Kong, China. 55Department of Internal Medicine, Division of Medical Oncology, College of Medicine, Korea University Guro Hospital, Seoul, Republic of Korea. 56Department of Internal Medicine, Seoul National University Bundang Hospital, Seongnam, Republic of Korea. 57Department of Oncology, Wuhan Iron and Steel Corporation Staff Worker Hospital, Wuhan, China. 58Division of Genome Biology, National Cancer Center Research Institute, Tokyo, Japan. 59Jeonnam Regional Cancer Center, Chonnam National University Hwasun Hospital, Hwasun-eup, Republic of Korea. 60Department of Preventive Medicine, Chonnam National University Medical School, Gwangju, Republic of Korea. 61Cancer Center, China Medical University and Hospital, Taichung, Taiwan. 62Division of Environmental Epidemiology, Institute for Risk Assessment Sciences (IRAS), Utrecht University, Utrecht, The Netherlands. 63Department of Pathology, Queen Elizabeth Hospital, Hong Kong, China. 64Division of Multistep Carcinogenesis, National Cancer Center Research Institute, Tokyo, Japan. 65Qujing Center for Diseases Control and Prevention, Sanjiangdadao, Qujing, China. 66Department of Respiratory Medicine, Mitsui Memorial Hospital, Tokyo, Japan. 67Department of Internal Medicine, National Taiwan University College of Medicine, Taipei, Taiwan. 68These authors contributed equally to this work. 69These authors jointly directed this work. Correspondence should be addressed to Q.L. ([email protected]).
23. Wang, Y. et al. Common 5p15.33 and 6p21.33 variants influence lung cancer risk. Nat. Genet. 40, 1407–1409 (2008).
24. Wu, C. et al. Genetic variants on chromosome 15q25 associated with lung cancer risk in Chinese populations. Cancer Res. 69, 5065–5072 (2009).
25. Shi, J. et al. Inherited variation at chromosome 12p13.33, including RAD52, influences the risk of squamous cell lung carcinoma. Cancer Discov. 2, 131–139 (2012).
26. Dong, J. et al. Association analyses identify multiple new lung cancer susceptibility loci and their interactions with smoking in the Chinese population. Nat. Genet. 44, 895–899 (2012).
27. Wang, Z. et al. Improved imputation of common and uncommon SNPs with a new reference set. Nat. Genet. 44, 6–7 (2012).
28. Howie, B.N., Donnelly, P. & Marchini, J. A flexible and accurate genotype imputation method for the next generation of genome-wide association studies. PLoS Genet. 5, e1000529 (2009).
29. Ramirez, D.M., Khvotchev, M., Trauterman, B. & Kavalali, E.T. Vti1a identifies a vesicle pool that preferentially recycles at rest and maintains spontaneous neurotransmission. Neuron 73, 121–134 (2012).
30. Kunwar, A.J. et al. Lack of the endosomal SNAREs vti1a and vti1b led to significant impairments in neuronal development. Proc. Natl. Acad. Sci. USA 108, 2575–2580 (2011).
31. Bose, A. et al. The v-SNARE Vti1a regulates insulin-stimulated glucose transport and Acrp30 secretion in 3T3-L1 adipocytes. J. Biol. Chem. 280, 36946–36951 (2005).
32. Petridou, E.T. et al. Circulating adiponectin levels and expression of adiponectin receptors in relation to lung cancer: two case-control studies. Oncology 73, 261–269 (2007).
33. Bass, A.J. et al. Genomic sequencing of colorectal adenocarcinomas identifies a recurrent VTI1A-TCF7L2 fusion. Nat. Genet. 43, 964–968 (2011).
34. Lemmon, M.A. & Schlessinger, J. Cell signaling by receptor tyrosine kinases. Cell 141, 1117–1134 (2010).
35. Acquaviva, J., Wong, R. & Charest, A. The multifaceted roles of the receptor tyrosine kinase ROS in development and cancer. Biochim. Biophys. Acta 1795, 37–52 (2009).
36. Li, C. et al. Spectrum of oncogenic driver mutations in lung adenocarcinomas from East Asian never smokers. PLoS ONE 6, e28204 (2011).
37. Rikova, K. et al. Global survey of phosphotyrosine signaling identifies oncogenic kinases in lung cancer. Cell 131, 1190–1203 (2007).
38. Takeuchi, K. et al. RET, ROS1 and ALK fusions in lung cancer. Nat. Med. 18, 378–381 (2012).
39. Bergethon, K. et al. ROS1 rearrangements define a unique molecular class of lung cancers. J. Clin. Oncol. 30, 863–870 (2012).
40. Kim, M. et al. Epigenetic down-regulation and suppressive role of DCBLD2 in gastric cancer cell proliferation and invasion. Mol. Cancer Res. 6, 222–230 (2008).
41. Koshikawa, K. et al. Significant up-regulation of a novel gene, CLCP1, in a highly metastatic lung cancer subline as well as in lung cancers in vivo. Oncogene 21, 2822–2828 (2002).
42. Nagai, H. et al. CLCP1 interacts with semaphorin 4B and regulates motility of lung cancer cells. Oncogene 26, 4025–4031 (2007).
43. Silverberg, M.S. et al. Ulcerative colitis–risk loci on chromosomes 1p36 and 12q15 found by genome-wide association study. Nat. Genet. 41, 216–220 (2009).
44. Urayama, K.Y. et al. Genome-wide association study of classical Hodgkin lymphoma and Epstein-Barr virus status–defined subgroups. J. Natl. Cancer Inst. 104, 240–253 (2012).
45. Nakanishi, K. & Shima, Y. Capture of type 1 diabetes–susceptible HLA DR-DQ haplotypes in Japanese subjects using a tag single nucleotide polymorphism. Diabetes Care 33, 162–164 (2010).
46. Chanock, S.J. & Hunter, D.J. Genomics: when the smoke clears. Nature 452, 537–538 (2008).
47. Spitz, M.R., Amos, C.I., Dong, Q., Lin, J. & Wu, X. The CHRNA5-A3 region on chromosome 15q24-25.1 is a risk factor both for nicotine dependence and for lung cancer. J. Natl. Cancer Inst. 100, 1552–1556 (2008).
48. Wang, Y., Broderick, P., Matakidou, A., Eisen, T. & Houlston, R.S. Chromosome 15q25 (CHRNA3-CHRNA5) variation impacts indirectly on lung cancer risk. PLoS ONE 6, e19085 (2011).
npg
© 2
012
Nat
ure
Am
eric
a, In
c. A
ll rig
hts
rese
rved
.

Nature GeNetics doi:10.1038/ng.2456
oNLINeMeTHodSStudy participants. Participants were drawn from 14 studies (Supplementary Table 1). Cases had histologically confirmed lung cancer. Each participat-ing study obtained informed consent from study participants and approval from its respective institutional review board for this study. Studies obtained institutional certification permitting data sharing in accordance with the US National Institutes of Health (NIH) Policy for Sharing of Data Obtained in NIH Supported or Conducted Genome-Wide Association Studies (GWAS), with the exception of the component of the GELAC study that was not scanned at the NCI.
Genotyping and quality control. Genome-wide scanning data came from two sources. Internal sets (HKS, SNU, CNULCS, SWHS, YLCS and compo-nents of samples from Japan and GELAC) were genotyped at the NCI CGR Laboratory using the Illumina 660W SNP microarray. External sets were geno-typed as follows: (i) samples from CAMSCH, FLCS, GDS, SLCS, TLCS and WLCS were genotyped on contract at Gene-Square Biotech in Beijing using the Illumina 660W SNP microarray; (ii) samples from GELAC were genotyped on contract at GeneTech Biotech in Taiwan on the Illumina 370K SNP micro-array in a pilot project, and remaining samples were genotyped on contract at deCODE Genetics in Iceland using the Illumina 610Q SNP microarray and initially reported elsewhere11; (iii) a subset of samples from Japan were geno-typed at MSKCC using the Illumina 610Q SNP microarray; and (iv) samples from Singapore were genotyped at the Genome Institute of Singapore on the Illumina 660W SNP microarray. The scanned intensity data from external sources were collected, and genotypes were clustered and called at the CGR using Illumina Genome Studio v2011.1 on the basis of the GenTrain2 calling algorithm. Genotype clusters were estimated from samples with preliminary completion rates of greater than 98% per cluster group.
Genotyping was attempted for a total of 5,568 samples on the Illumina 660W SNP microarray at the CGR. Six samples could not be loaded into Illumina Genome Studio because of their low intensities, and 16 samples failed to scan because of broken chips. In addition, a total of 5,946 samples were genotyped at Gene-Square Biotech (3,828), deCODE Genetics and GeneTech Biotech (1,232), MSKCC (374) and the Genome Institute of Singapore (512); the distri-bution of samples genotyped per SNP microarray chip was as follows: Illumina 660W (4,340), Illumina 610Q (1,494) and Illumina 370K (112). Seven samples (all from Gene-Square Biotech) could not be loaded into Illumina Genome Studio because of their low intensities. In addition, 111 samples from 4 stud-ies (FLCS, GDS, SLCS and TLCS) were excluded due to laboratory processing errors. The combined 11,374 samples with genotypes mapped to 11,025 unique individuals drawn from 14 studies.
We subsequently performed quality control filtering at the sample level in 19 quality control groups (Supplementary Table 6). Samples were exclude that had low completion rates (n = 725 samples) and extreme mean heterozygosity rates (n = 116). Thresholds were chosen on the basis of the sample completion rate or sample mean heterozygosity distribution for each quality control group (Supplementary Table 6) and on the basis of discordant expected duplicate samples (n = 6). There were samples that were excluded for multiple reasons, and the total number of unique samples excluded was 761 (Supplementary Table 6b). Genotype data for the remaining 10,613 samples were merged, resulting in data from 10,312 unique individuals. The genotype concordance rate for expected duplicates (n = 311) was greater than 99.9%. Further quality control analysis at the individual level led to the exclusion of samples with (i) gender discordance (n = 94); (ii) less than 86% Asian ancestry (n = 3); (iii) first-degree relatives who were also genotyped in the study (n = 136 sub-jects); and (iv) incomplete phenotype or unknown histology, as well as those who had ever smoked or were deemed ineligible (n = 15). Thus, the total number of scanned subjects after both quality control and analytic exclusions was 10,054 (5,510 cases and 4,544 controls). A summary of the number of excluded loci by study is shown in Supplementary Table 6c.
TaqMan custom genotyping assays (Applied Biosystems) were designed and optimized for 13 SNPs, including 9 in the NCI scan data and 4 surrogates not in this scan. In an analysis of 385 samples from 7 studies, comparison of the Illumina calls with the results from TaqMan assays conducted at the NCI CGR showed an average concordance rate of 99.97% (with a range of 99.7–100%)
for the overlapping 9 SNPs. The Cancer Institute and Hospital at the Chinese Academy of Medical Sciences also conducted TaqMan genotyping for 7 SNPs on 201 previously scanned samples from 5 studies. Comparison of the Illumina calls with the results of TaqMan assays showed an average concordance rate of 99.93% (with a range of 99.5–100%). In examining the concordance between rs2395185 (scan) and its perfect surrogate rs28366298 (TaqMan), we applied genotype mapping GG→AA, GT→AC and TT→CC to confirm reproduc-ibility of genotyping between platforms.
For the replication phase, we analyzed an additional 3,933 individuals (1,023 cases and 2,910 controls) with TaqMan data, and an additional 79 indi-viduals (76 cases and 3 controls) genotyped using the Illumina 660W array at Gene-Square Biotech were available for analysis. Thus, the final number of subjects included in the analyses was 14,066 (6,609 cases and 7,457 controls; Supplementary Table 1). SNP assays with locus call rates lower than 90% or Hardy-Weinberg equilibrium P values less than 1.0 × 10⁻⁷ in each quality control group were excluded. In total, 596,032 SNPs remained in the analytic data set. After setting the minimum minor allele frequency (MAF) to 0.01, we excluded 83,806 loci from the association analysis. Thus, 512,226 SNPs were analyzed in the association studies reported here.
Statistical analyses. Data analysis and management were performed with GLU (Genotyping Library and Utilities version 1.0), a suite of tools available as an open-source application for the management, storage and analysis of GWAS data. Assessment of the population structure of study participants was performed with the GLU struct.admix module using the Japanese in Tokyo, Japan (JPT) and Han Chinese in Beijing, China (CHB), Utah residents of Northern and Western European ancestry (CEU) and Yoruba from Ibadan, Nigeria (YRI) samples as the reference populations (HapMap Build 28). A set of 33,165 SNPs with low pairwise correlation (r2 < 0.01) was selected for this analysis. Three individuals were estimated to have less than 86% Asian ancestry (Supplementary Fig. 4).
The genotypes for all subject pairs were computed for cryptic relatedness using the GLU qc.ibds module with the same set of selected SNPs. In addi-tion to 68 pairs of unexpected duplicates, we detected 33 parent-offspring and 41 full-sibling pairs. For the 142 unexpected duplicates and first-degree relative pairs, 1 subject from each simple pair was excluded. For each family with multiple relative pairs detected, only one randomly chosen subject was included in the principal-components analysis (PCA). To address the under-lying population substructure, PCA was conducted using the GLU struct.pca module, a program similar to EIGENSTRAT49,50, with the same set of SNPs (Supplementary Fig. 5a,b). Three samples with less than 86% Asian ancestry were excluded on the basis of PCA.
Association analysis. Association analyses were conducted using logistic regression, adjusted for age (in 10-year categories), study group and eigen-vectors, if they were significant when analyzed in the base models. For analysis of all cases versus controls, we adjusted for EV1, EV2 and EV4. For analysis of adenocarcinoma cases versus controls, we adjusted for EV2 and EV4. For analysis of squamous cell cases versus controls, we adjusted for EV8. Each SNP genotype was coded as a count of minor alleles (trend effect). A score test with 1 degree of freedom was performed on all genetic parameters in each model to determine statistical significance. The unscaled λ value for all cases versus con-trols in the main effect model was 1.014, and λ1000 was 1.003, with corrected λ calculated as λcorrected = 1 + (λ – 1) × (ncase
−1 + ncontrol−1)/(2 × 100−3).
We assessed heterogeneity in genetic effects across studies using the Cochran’s Q statistic, which conforms to a χ-squared distribution with k – 1 degree of freedom, where k is the number of studies.
For the inclusion of TaqMan data for the SNPs that failed assay design (rs2395185 and rs10197940), we conducted a fixed-effects meta-analysis by combining the aggregate results from their perfect surrogates (rs28366298 and rs2290368, respectively) scanned in the GWAS with their own results based only on the additional TaqMan samples not used in the GWAS association analyses.
Genotype-environment interactions with environmental tobacco smoke were assessed using logistic regression for studies with such information available and adjusted by age, study group, the main effect of the SNP and environmental tobacco smoke, and the interaction term.
npg
© 2
012
Nat
ure
Am
eric
a, In
c. A
ll rig
hts
rese
rved
.

Nature GeNeticsdoi:10.1038/ng.2456
Estimate of recombination hotspots. To identify recombination hotspots in the region, we used SequenceLDhot51, a program that uses the approximate marginal likelihood method52 and calculates likelihood ratio statistics at a set of possible hotspots. Drawn from scanned controls, 100 individuals were randomly sampled from Han Chinese, Japanese and Korean samples. Three independent recombination hotspot inferences were analyzed and are repre-sented as three different colored lines in Figure 1. Specifically, for the VTI1A regional plot, genotypes of 70 SNPs spanning chromosome 10 114,362,000–114,593,000 (UCSC Genome Build hg18) were phased using PHASE v2.1 (ref. 53) to calculate background recombination rates. The PHASE outcome was used as direct input for the SequenceLDhot program, and LD was esti-mated as r2 for 70 SNPs within a ~230-kb region, and a heatmap was drawn using the snp.plotter program54. Similarly, we started with the genotypes of 63 SNPs for the ROS1-DCBLD1 regional plot and the genotypes of 59 SNPs for the HLA class II locus.
Imputation analysis. To begin to fine map newly identified regions, we imputed all the SNPs catalogued in 1000 Genomes Project data, March 2012 release, and the DCEG Imputation Reference Set version 1 (ref. 27). The IMPUTE2 program28 was used to impute a 1-Mb region centered on the
index SNP for each of the three regions, using recommended default settings. Imputed SNPs with INFO of <0.3 were excluded from association analysis using the SNPTEST program v2.3 (see URLs), which considered probabilistic genotypes out of imputation. Because 1000 Genomes Project data was based on the NCBI Build 37 reference genome, we conducted liftOver (see URLs) on our scan data from Build 36 to 37 before imputation.
49. Patterson, N., Price, A.L. & Reich, D. Population structure and eigenanalysis. PLoS Genet. 2, e190 (2006).
50. Price, A.L. et al. Principal components analysis corrects for stratification in genome-wide association studies. Nat. Genet. 38, 904–909 (2006).
51. Fearnhead, P. SequenceLDhot: detecting recombination hotspots. Bioinformatics 22, 3061–3066 (2006).
52. Fearnhead, P., Harding, R.M., Schneider, J.A., Myers, S. & Donnelly, P. Application of coalescent methods to reveal fine-scale rate variation and recombination hotspots. Genetics 167, 2067–2081 (2004).
53. Abnet, C.C. et al. Genotypic variants at 2q33 and risk of esophageal squamous cell carcinoma in China: a meta-analysis of genome-wide association studies. Hum. Mol. Genet. 21, 2132–2141 (2012).
54. Luna, A. & Nicodemus, K.K. snp.plotter: an R-based SNP/haplotype association and linkage disequilibrium plotting package. Bioinformatics 23, 774–776 (2007).
npg
© 2
012
Nat
ure
Am
eric
a, In
c. A
ll rig
hts
rese
rved
.