Quantification of HLA class II-specific memory B cells in HLA-sensitized individuals
Upload
independentCategory
view
0download
0
HHSa
b
A
ARAA
KHSM
1
gmHi“btpgpcdaos
glii
Human Immunology 70 (2009) 518–526
Contents lists available at ScienceDirect
0d
LA polymorphism in six Malay subethnic groups in Malaysiaisham Atan Edinur a, Zainuddin Zafarina a, HÊlder SpÎnola b, Abd Rashid Nurhaslindawaty a,undararajulu Panneerchelvam a, Mohd-Nor Norazmi a,*School of Health Sciences, Universiti Sains Malaysia, Health Campus, 16150 Kubang Kerian, Kelantan, MalaysiaHuman Genetics Laboratory, University of Madeira, Campus of Penteada, 9000-399 Funchal, Portugal
R T I C L E I N F O
rticle history:eceived 29 September 2008ccepted 6 April 2009vailable online 11 April 2009
eywords:LA polymorphismSPalay subethnic groups
A B S T R A C T
In this study, human leukocyte antigen (HLA) class I and II were examined through sequence-specific primertyping in 176 unrelated individuals from six Malay subethnic groups of Peninsular Malaysia: Kelantan (n �
25), Minangkabau (34), Jawa (30), Bugis (31), Banjar (33), and Rawa (23). Themost commonHLA alleles in allgroups were A*24 (26–41%), Cw*07 (24–32%), B*15 (22–30%), DRB1*12 (15–36%), and DQB1*03 (25–51%).The Malay subethnic groups studied demonstrated a close relationship to each other and to other Asianpopulations, despite specific differences between them. Banjar, Bugis, and Jawa Malays demonstrated nosignificant difference from each other, which could be a result of their related origin from the islands aroundthe Java Sea. These three Malay subethnic groups were then collapsed into one group, which also helped toincrease the sample number and sharpen statistical results. Minangkabau and Rawa Malays exhibited highsimilarities in allele group and haplotype frequencies, which could be a consequence of their common originfrom Sumatera. Kelantan Malays, in addition to their statistically significant differences compared with theother groups, also exhibited differences on the most frequent haplotypes, which are almost absent in theother subethnic groups studied.
� 2009 American Society for Histocompatibility and Immunogenetics. Published by Elsevier Inc. All rights
reserved.pE
lfaM
Ah1tdPtSismear
Iw
. Introduction
The human leukocyte antigen (HLA) is the most polymorphicenetic locus in the human genome and is occupied by a set ofajor histocompatibility complex (MHC) genes on chromosome 6.LA plays an important role in immunological functions, whichnclude antigen presentation to T lymphocytes and recognition ofnonself” antigens. In addition, proper characterization of HLAmaye crucial in studies of disease susceptibility and resistance, tissueransplantation, molecular evolution, forensic application, andopulation studies. In population studies, anthropologists investi-ate the origins and evolutionary relationships amongmany ethnicopulations using variation of HLA alleles (with over 3000 HLAlass I and II alleles identified), haplotype frequencies, and linkageisequilibrium between these genes among populations [1–3]. Re-lizing the relevance of HLA in population studies, we trace therigin of theMalays throughHLA class I and II analysis on 176 bloodamples from six Malay subethnic groups of Peninsular Malaysia.
Malaysia is situated in southeast Asia (SEA), located within theeographic coordinate 1� to 7� north latitude and 100� to 120� eastongitude. The total landmass of Malaysia is 329,847 km2, consist-ng of 13 states and three federal territories. West Malaysia, whichs also known as Peninsular Malaysia, covers 132,000 km2. It com-
m* Corresponding author.
E-mail address: [email protected] (M.-N. Norazmi).
198-8859/09/$32.00 - see front matter � 2009 American Society for Histocompatibilityoi:10.1016/j.humimm.2009.04.003
rises 11 states and two federal territories and is separated fromast Malaysia (Sabah and Sarawak) by the South China Sea (Fig. 1).According to the federal constitution ofMalaysia, the term “Me-
ayu” (or “Malay” in English) refers to a personwho practices Islam,ollows the Malay custom, speaks the Malay language, and whosencestors are Malays. The history and origin of the present-dayalays have been the subject of much speculation among scholars.Linguistic and archaeological evidence indicates that the Proto-
ustronesian speakers (the forerunners of Proto-Malays) were in-abitants of Taiwan around 4,000 to 3,000 B.C. Between 2,500 and,500 B.C, the first migration of “the forerunner of Proto-Malays”ook place toward Borneo, Sulawesi, Central Java, and Eastern In-onesia through the Philippines. The second migration of theroto-Malays took place from central Java to Peninsular Malaysiahrough the Straits of Malacca between 1,500 and 500 B.C [4,5].ubsequently, an influx of many other population groups consist-ng of Arabs, Chinese, Indians, and Siamese into Peninsular Malay-ia occurred. They married the local Proto-Malays, resulting in aore diverse population known as the Deutero-Malays. This mod-rn group mostly inhabits the coastal areas of the Malay Archipel-go and indirectly pushed themoreprimitive Proto-Malays into theural and mountainous areas [6,7].
In the late 19th century, migration of the Malays from thendonesian Archipelago to Peninsular Malaysia occurred, whichas further enhanced during British colonization [8]. Therefore,
ost of the Malays in Peninsular Malaysia are the descendants ofand Immunogenetics. Published by Elsevier Inc. All rights reserved.

vBaP
l1B1RfjB
(aoi
tspMt
n
Fh rsityi
H.A. Edinur et al. / Human Immunology 70 (2009) 518–526 519
arious ethnic groups from Kalimantan (Banjar), Java (Jawa andawean), Sulawesi (Bugis and Makasa), and Sumatera (Minangk-bau, Batak, Rawa, Kerinci, Mandailing, Aceh, Siak, Inderagiri,alembang, and Kubu) [7].Minangkabau Malays from Sumatera settled in Negeri Sembi-
an, especially in Naning, Sungai Ujong, and Rembau, in the early4th century (after the fall of the Sultanate of Malacca), whereasugis Malays moved to Johor and Selangor in the last quarter of7th century after being expelled from Makasar by the Dutch [6].awa Malays, which originated from Sumatera, are commonlyound in Gopeng, Perak, whereas the Banjar, who came from Ban-armasin, Kalimantan, are more concentrated in Kerian and Parit
ig. 1. Map showing the geographic location of East and West Malaysia within Sttp://www.holcimfoundation.org/T536/A09_About_AP.htm and http://www.biove
untar (also in Perak), Sabak Bernam (Selangor), and Batu Pahat o
Johor) [8]. The drasticmigration of JawaMalays from Java occurredfter 1884 when the Johor government welcomed immigrants topen newdistricts in the state [7]. The JawaMalays settled not onlyn Johor, but also in Selangor.
The Kelantan Malays, who are indigenous to the State of Kelan-an in the northeast of Peninsular Malaysia, were chosen as aample group in this study based on their close relationship withopulations to theNorth of the peninsula [6,7].Moreover, Kelantanalays seem to possess a higher number of Mongoloid markers
han Modern Malays [9].Reports on genetic markers based on phylogeography and eth-
ogenesis of the Malay subpopulations are limited. Recent studies
ternational, and state boundaries and where the samples were collected. Source.nternational.org/publications/Web_version/572/p191b.gif.
EA, in
nmitochondrial DNA (mtDNA) sequences have indicated that the

pB(naIftusdtqnmfspfe
2
2
fK3batb
Du(uOpppapcdr
TH(
M
H
AAAAAAAAAAAAAAAAA
H
BBBBBBBBBBBBBBBBBBBBBBBBBBB
H
CCCCCCCCCCCCC
H
DDDDDRB1*08 0.006 0.011 0 0 0
T(
H
DDDDDDD
H
DDDDD
H.A. Edinur et al. / Human Immunology 70 (2009) 518–526520
eople inhabiting the islands of SouthernAsia (Indonesia,Malaysia,orneo, Singapore, and the Philippines) and those in OceaniaMelanesia and Micronesia, together referred as Oceanians) origi-ated from the eastern regions of Austronesia. This refers to anyrea from Taiwan to the Philippines, as well as south to easternndonesia [10–12]. Mack et al. [13] reported the HLA class II allelerequency distribution among the various Pacific/Asian popula-ions (Hawaiian, Samoan, Malay, Papua New Guinea, Indonesia)sing high-resolution polymerase chain reaction–sequence-pecific oligonucleotide probe. They elucidated the similarities andifferences that exist in the HLA class II allele distribution betweenhese population groups. Reports on the distribution of allele fre-uencies (population database) on various genetic markers,amely HLA [14–17], short tandem repeat (STR) [18,19], andtDNA [20,21] for the Malay population have also been put
orward. However, none of the studies focused on the Malayubethnic population groups mentioned above. Hence, theresent study was undertaken to determine the HLA distributionor elucidation of the interrelationships among the various sub-thnic Malay population groups in Peninsular Malaysia.
. Subjects and methods
.1. Sample collection and HLA typing
Blood samples from 176 unrelated individuals were collectedrom six Malay subethnic groups (Fig. 1). The subethnic groups areelantan (n�25),Minangkabau (n�34), Jawa (n�30), Banjar (n�
3), Rawa (n� 23), and Bugis (n� 31)Malays. Each participantwasriefed about the project andwas selected based on an interview toscertain that their ancestry comprised at least three generations ofhe same Malay subethnic group. Informed consent was obtainedefore the collection of 5 ml of blood in heparin-containing tubes.Genomic DNA was isolated from whole blood using a QIAamp
NAMini Kit (Qiagen, Hilden, Germany) and frozen at �20�C untilse. All samples were typed using the sequence-specific primersSSP) for HLA-A, HLA-Cw, HLA-B, HLA-DRB1, and HLA-DQB1 locising the Olerup SSP HLA-A-B-C SSP Combi Tray (96 tubes) andlerup SSP DQ-DR SSP Combi Tray (32 tubes). Each tube containsrealiquoted allele groups or locus-specific primers and controlrimer pairs in 0.2 ml PCR tubes, except for the negative controlrimer pair tubes (tubes 24, 72, and 96 for Olerup SSP HLA-A-B-Cnd tube 32 for the HLA-DQ-DR SSP Combi Tray), which will am-lify more than 90% of the control primer pairs, Olerup SSP HLAlass I, DRB1, DPB1, and DQB1 amplicons. Low-resolution (two-igit) allele group results were achieved, which are subsequently
able 1continued)
LA-DRB1 TMP(n � 176)
BBJ(n � 94)
Kltn(n � 25)
Mgkb(n � 34)
Rawa(n � 23)
RB1*09 0.034 0.016 0.06 0.03 0.09RB1*10 0.017 0 0.04 0.01 0.07RB1*11 0.066 0.043 0.14 0.09 0.04RB1*12 0.273 0.355 0.20 0.15 0.22RB1*13 0.031 0.048 0.04 0 0RB1*14 0.046 0.064 0.06 0 0.02RB1*15 0.239 0.229 0.20 0.37 0.15
LA-DQB1 TMP(n � 176)
BBJ(n � 94)
Kltn(n � 25)
Mgkb(n � 34)
Rawa(n � 23)
QB1*02 0.122 0.053 0.06 0.28 0.24QB1*03 0.412 0.505 0.34 0.25 0.35QB1*04 0.034 0.021 0.04 0.01 0.11QB1*05 0.310 0.293 0.36 0.35 0.26QB1*06 0.122 0.128 0.20 0.10 0.04
able 1LA A, Cw, B, DRB1, and DQB1 allele frequencies in the total Malay populationTMP), Banjar-Bugis-Jawa (BBJ), Kelantan (Kltn), Minangkabau (Mgkb), and Rawa
alaysia allele frequencies
LA-A TMP(n � 176)
BBJ(n � 94)
Kltn(n � 25)
Mgkb(n � 34)
Rawa(n � 23)
*01 0.023 0.021 0.04 0.03 0*02 0.122 0.149 0.12 0.12 0.19*03 0.065 0.106 0 0.03 0.02*11 0.193 0.133 0.18 0.28 0.15*23 0.003 0.005 0 0 0*24 0.36 0.405 0.26 0.35 0.29*26 0.02 0.005 0.06 0 0.07*29 0.006 0.005 0 0.03 0*30 0.003 0 0.02 0 0*31 0.009 0.011 0 0 0.02*32 0.006 0 0 0 0.04*33 0.108 0.075 0.18 0.13 0.13*34 0.054 0.059 0.06 0.01 0.09*43 0.003 0.005 0 0 0*66 0.011 0.016 0 0.01 0*68 0.011 0 0.08 0 0*74 0.003 0.005 0 0 0
LA-B TMP(n � 176)
BBJ(n � 94)
Kltn(n � 25)
Mgkb(n � 34)
Rawa(n � 23)
*07 0.028 0.027 0.02 0.04 0.03*13 0.037 0.011 0.06 0.04 0.11*14 0.006 0 0 0.03 0*15 0.27 0.303 0.24 0.25 0.22*18 0.134 0.138 0.14 0.16 0.07*27 0.04 0.069 0.02 0 0*35 0.137 0.144 0.10 0.18 0.11*37 0.009 0 0.02 0.01 0.02*38 0.043 0.032 0.08 0.03 0.07*39 0.006 0.011 0 0 0*40 0.051 0.048 0.12 0.01 0.04*42 0.003 0 0 0 0.02*44 0.04 0.037 0.02 0.06 0.04*45 0.003 0.005 0 0 0*46 0.006 0 0 0.01 0.02*48 0.02 0.021 0.02 0.03 0*49 0.017 0 0 0.06 0.04*51 0.043 0.059 0 0.01 0.07*52 0.023 0.021 0.02 0.01 0.04*53 0.009 0 0.02 0.01 0*55 0.003 0 0 0 0.02*56 0.006 0.005 0 0 0.02*57 0.006 0 0.04 0 0*58 0.037 0.032 0.04 0.03 0.07*59 0.017 0.032 0 0 0*63 0.003 0 0.02 0 0*81 0.003 0.005 0 0 0
LA-Cw TMP(n � 176)
BBJ(n � 94)
Kltn(n � 25)
Mgkb(n � 34)
Rawa(n � 23)
w*01 0.011 0.011 0.02 0.01 0.02w*02 0.009 0 0 0.03 0w*03 0.171 0.176 0.12 0.10 0.30w*04 0.247 0.213 0.28 0.34 0.22w*05 0.006 0.005 0.02 0 0w*06 0.011 0 0.04 0.01 0.02w*07 0.281 0.271 0.32 0.31 0.24w*08 0.168 0.218 0.12 0.12 0.09w*12 0.028 0.027 0 0.04 0.04w*14 0.034 0.048 0 0.01 0.04w*15 0.017 0.011 0.08 0 0w*16 0.014 0.021 0 0 0.02w*18 0.003 0 0 0 0
LA-DRB1 TMP(n � 176)
BBJ(n � 94)
Kltn(n � 25)
Mgkb(n � 34)
Rawa(n � 23)
RB1*01 0.009 0 0.04 0.02 0RB1*03 0.051 0.016 0.04 0.13 0.09RB1*04 0.117 0.154 0.08 0.03 0.11RB1*07 0.077 0.043 0.04 0.15 0.15
eferred to as “alleles” for conciseness.

2
t(audttsgircEtvgRdf2
KaNsstf
uvU
3
DtpMDl
e
TMpel
A
T
H
AAA
B
H
AAA
K
H
AA
M
H
A
R
H
A
A
R
H
AAAAAAAAAAA
A
T
H
AAAAAA
B
H
AAAAAAAA
K
H
AAAAA*24–Cw*03–B*40 0.04 D � 0.0230 p � 0.005
T(
K
H
AAAA
M
H
AAAAA
OeaD
H.A. Edinur et al. / Human Immunology 70 (2009) 518–526 521
.2. Statistical analysis
Allele frequencies were calculated by direct counting. Haplo-ype frequencies, neutrality tests, analysis of molecular varianceAMOVA), linkage disequilibrium, Hardy–Weinberg equilibrium,nd exact test of population differentiation for loci were estimatedsing Arlequin software, version 3.1 [22]. Exact tests of populationifferentiation were performed using only those allele frequencieshat achieved the minimum to that make them testable. Becausehe Banjar, Bugis, and Jawa Malays demonstrated no statisticallyignificant differences between groups,we collapsed them into oneroup (BBJ) for analyses. In the present study, haplotypes werenferred using amaximum likelihood approach. Linkage disequilib-ium (D) between alleles at different loci and their level of signifi-ance (p) was calculated according to Weir and colleagues [23,24].wens–Watterson selective neutrality statistical testswere appliedo examine the presence of selective forces influencing allelic di-ersity at each locus. AMOVA was performed to estimate the totalenetic structure among the BBJ, Kelantan, Minangkabau, andawa Malays based on the variance of gene frequencies. The HLAata were also comparedwith that of several populations obtainedrom http://www.allelefrequencies.net (accessed February 8,008) and from previously published papers [25–33].Phylogenetic analysis of the studied population group (SPG; BBJ,
elantan, Minangkabau, and Rawa Malays) and other populationsvailable in the literature was achieved using Seqboot, Gendist,eighbor-Joining, and Consense programs included in the PHYLIPoftware package, version 3.6 [34]. The topology of a single consen-us bootstrapped tree was visualized with TreeView [35]. A total ofwo types of dendrograms (A, Cw, and B; and A, B, and DRB1 allelerequencies) were produced by this analysis.
A, Cw, B and A, B, DRB1 HLA allele frequencies data were alsosed to carry out principle coordinate analysis (PCO) using Multi-ariate Statistical software package 3 (Kovach Computing Services,K; http://www.kovcomp.com/mvsp).
. Results
Table 1 illustrates the combined allele frequencies of A, Cw, B,RB1, and DQB1 HLA allele frequencies for the total Malay popula-ion (TMP: combination of all six subethnic groups) and the studiedopulation group (SPG: BBJ, Kelantan, Minangkabau, and Rawaalays). The most frequent A-Cw-B-DRB1-DQB1, A-Cw-B, A-B-RB1, andDRB1-DQB1HLAhaplotypeswith statistically significantinkage disequilibrium are listed in Tables 2 and 3.
The SPG were in Hardy–Weinberg equilibrium at most loci,
able 2continued)
elantan
aplotypes Freq. �4% D p
*26–Cw*04–B*35 0.04 D � 0.0202 p � 0.005*33–Cw*07–B*18 0.10 D � 0.0480 p � 0.005*34–Cw*07–B*38 0.04 D � 0.0320 p � 0.005*68–Cw*15–B*40 0.04 D � 0.0375 p � 0.005
inangkabau
aplotypes Freq. �4% D p
*02–Cw*07–B*18 0.055 D � 0.0200 p � 0.010*11–Cw*08–B*15 0.055 D � 0.0245 p � 0.010*11–Cw*07–B*49 0.059 D � 0.0340 p � 0.005*11–Cw*12–B*18 0.044 D � 0.0270 p � 0.005*24–Cw*04–B*35 0.143 D � 0.0440 p � 0.005
nly higher frequencies with statistical significance linkage disequilibrium are shown. Forxtended haplotypes A–Cw–B–DRB1–DQB1, we only present those with significant link-ge disequilibrium in the correspondent to three-loci (A–B–DRB1) and two-loci (DRB1–QB1) haplotypes.
able 2ost common A–Cw–B–DRB1–DQB1 and A–Cw–B haplotypes in total Malayopulation (TMP), Banjar–Bugis–Jawa (BBJ), Kelantan, Minangkabau, and Rawa asstimated by maximum likelihood, with the respective frequencies, value ofinkage disequilibrium (D), and their level of significance (p)
–Cw–B–DRB1–DQB1 haplotypes
MP (total Malay population)
aplotypes Frequencies �2%
*24–Cw*08–B*15–DRB1*12–DQB1*03 0.056*24–Cw*07–B*18–DRB1*12–DQB1*03 0.034*24–Cw*07–B*18–DRB1*15–DQB1*05 0.023
BJ
aplotypes Frequencies �2%
*02–Cw*04–B*15–DRB1*12–DQB1*03 0.021*24–Cw*08–B*15–DRB1*12–DQB1*03 0.120*34–Cw*04–B*15–DRB1*15–DQB1*06 0.032
elantan
aplotypes Frequencies �4%
*02–Cw*08–B*15–DRB1*11–DQB1*03 0.04*24–Cw*04–B*15–DRB1*16–DQB1*05 0.04
inangkabau
aplotypes Frequencies �2%
*24–Cw*04–B*35–DRB1*15–DQB1*05 0.088
awa
aplotypes Frequencies �4%
*32–Cw*07–B*49–DRB1*10–DQB1*05 0.044
–Cw–B Haplotypes
awa
aplotypes Freq. �4% D p
*02–Cw*04–B*13 0.044 D � 0.025 p � 0.005*02–Cw*07–B*40 0.044 D � 0.033 p � 0.005*02–Cw*08–B*13 0.044 D � 0.024 p � 0.005*11–Cw*03–B*18 0.044 D � 0.023 p � 0.005*11–Cw*04–B*15 0.065 D � 0.065 p � 0.005*24–Cw*08–B*15 0.044 D � 0.032 p � 0.005*24–Cw*04–B*35 0.065 D � 0.036 p � 0.005*24–Cw*03–B*38 0.044 D � 0.028 p � 0.005*24–Cw*12–B*52 0.044 D � 0.029 p � 0.005*32–Cw*07–B*49 0.044 D � 0.032 p � 0.005*33–Cw*03–B*58 0.065 D � 0.038 p � 0.005
–Cw–B Haplotypes
MP (Total Malay population)
aplotypes Freq. �2% D p
*02–Cw*08–B*15 0.024 D � 0.0095 p � 0.005*02–Cw*07–B*18 0.031 D � 0.0112 p � 0.005*24–Cw*08–B*15 0.078 D � 0.0187 p � 0.005*24–Cw*07–B*18 0.041 D � 0.0164 p � 0.005*24–Cw*04–B*35 0.082 D � 0.0243 p � 0.005*33–Cw*03–B*58 0.028 D � 0.0194 p � 0.005
BJ
aplotypes Freq. �2% D p
*02–Cw*07–B*18 0.047 D � 0.0260 p � 0.005*03–Cw*04–B*40 0.032 D � 0.0192 p � 0.005*11–Cw*03–B*27 0.021 D � 0.0084 p � 0.005*24–Cw*08–B*15 0.139 D � 0.0440 p � 0.005*24–Cw*04–B*35 0.065 D � 0.0213 p � 0.005*24–Cw*14–B*51 0.021 D � 0.0055 p � 0.005*33–Cw*03–B*58 0.021 D � 0.0150 p � 0.005*34–Cw*04–B*15 0.032 D � 0.0131 p � 0.005
elantan
aplotypes Freq. �4% D p
*02–Cw*08–B*15 0.04 D � 0.0210 p � 0.005*11–Cw*04–B*13 0.04 D � 0.0194 p � 0.005*11–Cw*08–B*15 0.04 D � 0.0530 p � 0.005*24–Cw*04–B*15 0.10 D � 0.0365 p � 0.010
xcept in Cw, B, and DRB1 for BBJ, which could be because the

stlMt
sMBMnala
ggwaiR
3
4i12Tsqmt
DDD(
3
AmMt
TM(bd
ATH
AAA
B
H
AAAAAAA
K
H
AAAAAAA
MH
AAAAA
R
H
AAAAAA
D
TH
DDDDDDD
BH
DDDDDD
K
H
DDDDDRB1*16–DQB1*05 0.06 D � 0.0384 p � 0.020
T(
M
H
DDDD
R
H
DDDDDDDD
O
H.A. Edinur et al. / Human Immunology 70 (2009) 518–526522
amples have been collapsed from three groups. Ewens–Wattersonests of selective neutrality yielded significant results in Rawa Ma-ays for DRB1 (p � 0.01) and DQB1 (p � 0.045) and inMinangkabaualays for DQB1 (p � 0.05), indicating that selection was acting on
hese two populations.The test of linkage disequilibrium between pairs of loci was
tatistically significant for A and B in BBJ, Rawa, and Minangkabaualays; for A and Cw in BBJ and Kelantan Malays; for Cw and B inBJ, Kelantan, and Minangkabau Malays; for B and DQB1 in Rawaalays; for B and DRB1 in BBJ; for Cw and DQB1 in BBJ and Mi-angkabauMalays; for A andDRB1 inMinangkabauMalays; for Cwnd DRB1 in BBJ; and for DRB1 and DQB1 in the SPG. The lack ofinkage disequilibrium between Cw and B in RawaMalays could beresult of the low sample number.An AMOVA between SPG indicates that only 0.3% of the total
enetic variation can be attributed to differences among theroups; the remaining variation is attributed to the differencesithin each subpopulation. The exact test of population differenti-tion performed by Arlequin software using only testable allelesndicated significant results except between Minangkabau andawa Malays (p � 0.24).
.1. Allele frequencies
HLA-A*24 was the most frequent allele in TMP and SPG (26–1%), followed by A*11 (13–28%). Other predominant HLA-A allelesn the TMP and SPGwere A*02 (12–19%) and A*33 (8–18%). Among3 HLA-Cw alleles being recognized, Cw*07 (24–28%), Cw*08 (9–2%), and Cw*04 (21–34%) were the most frequent alleles in theMP and SPG. The frequencies of HLA-B alleles indicated a morecattered distribution among the TMP and SPG, but the most fre-uent allelewas B*15 (22–30%). B*18 and B*35were also two of theost commonHLA-B alleles, with frequencies of greater than 7% in
he TMP and SPG.The most frequent HLA-DRB1 alleles in the TMP and SPG were
RB1*12 (15–36%) andDRB1*15 (15–37%). Themost frequentHLA-QB1 alleles in the TMP and SPG were DQB1*03 (25–51%) andQB1*05 (26–35%), although in Minangkabau Malays DQB1*0228%) have a higher frequency than DQB1*03 (25%).
.2. Haplotype frequencies
The most frequent (5.6%) extended haplotype in the TMP was*24-Cw*8-B*15-DRB1*12-DQB1*03. This haplotype was also theost frequent in the BBJ group (12%) but was absent in Kelantan,inangkabau, and RawaMalays. Themost frequent A-Cw-B haplo-
able 3continued)
inangkabau
aplotypes Freq. �4% D p
RB1*11–DQB1*03 0.041 D � 0.0221 p � 0.0323RB1*12–DQB1*03 0.118 D � 0.0809 p � 0.0000RB1*15–DQB1*05 0.261 D � 0.1055 p � 0.0002RB1*15–DQB1*06 0.057 D � 0.0357 p � 0.0446
awa
aplotypes Freq. �4% D p
RB1*04–DQB1*04 0.087 D � 0.0728 p � 0.0000RB1*07–DQB1*02 0.152 D � 0.1158 p � 0.0000RB1*09–DQB1*03 0.087 D � 0.0567 p � 0.0042RB1*10–DQB1*05 0.065 D � 0.0482 p � 0.0026RB1*12–DQB1*03 0.217 D � 0.1418 p � 0.0000RB1*15–DQB1*05 0.087 D � 0.0529 p � 0.0026RB1*15–DQB1*06 0.044 D � 0.0378 p � 0.0002RB1*16–DQB1*05 0.065 D � 0.0482 p � 0.0026
nly higher frequencies with statistical significance linkage disequilibrium are shown.
able 3ost common A–B–DRB1 and DRB1–DQB1 haplotypes in total Malay population
TMP), Banjar–Bugis–Jawa (BBJ), Kelantan, Minangkabau, and Rawa as estimatedy maximum likelihood, with the respective frequencies, value of linkageisequilibrium (D), and their level of significance (p)
–B–DRB1 HaplotypesMP (Total Malay population)aplotypes Freq. �2% D p
*02–B*15–DRB1*12 0.023 D � 0.0234 p � 0.005*24–B*15–DRB1*12 0.072 D � 0.0320 p � 0.005*24–B*18–DRB1*15 0.038 D � 0.0200 p � 0.005
BJ (Banjar, Bugis and Jawa)
aplotypes Freq. �2% D p
*02–B*15–DRB1*12 0.026 D � 0.0158 p � 0.010*24–B*15–DRB1*12 0.130 D � 0.0206 p � 0.005*24–B*15–DRB1*15 0.037 D � 0.0370 p � 0.005*24–B*18–DRB1*15 0.028 D � 0.0300 p � 0.005*24–B*35–DRB1*12 0.057 D � 0.0397 p � 0.005*33–B*18–DRB1*12 0.021 D � 0.0200 p � 0.005*34–B*15–DRB1*15 0.032 D � 0.0150 p � 0.005
elantan
aplotypes Freq. �4% D p
*02–B*15–DRB1*11 0.04 D � �0.016 p � 0.050*11–B*13–DRB1*15 0.04 D � 0.024 p � 0.005*24–B*15–DRB1*16 0.04 D � 0.030 p � 0.005*24–B*35–DRB1*12 0.04 D � 0.026 p � 0.005*24–B*58–DRB1*15 0.04 D � 0.033 p � 0.005*33–B*18–DRB1*12 0.06 D � 0.034 p � 0.005*33–B*38–DRB1*12 0.04 D � 0.020 p � 0.005
inangkabauaplotypes Freq. �2% D p
*02–B*18–DRB1*03 0.059 D � 0.041 p � 0.005*11–B*49–DRB1*03 0.029 D � 0.011 p � 0.050*24–B*15–DRB1*07 0.029 D � 0.026 p � 0.020*24–B*35–DRB1*15 0.115 D � 0.060 p � 0.005*33–B*15–DRB1*15 0.029 D � 0.036 p � 0.005
awa
aplotypes Freq. �4% D p
*02–B*13–DRB1*12 0.065 D � 0.053 p � 0.005*11–B*18–DRB1*04 0.044 D � 0.027 p � 0.005*24–B*15–DRB1*15 0.087 D � 0.035 p � 0.005*24–B*51–DRB1*07 0.044 D � 0.036 p � 0.005*32–B*49–DRB1*10 0.044 D � 0.037 p � 0.005*34–B*58–DRB1*03 0.044 D � 0.041 p � 0.005
RB1–DQB1 Haplotypes
MP (Total Malay population)aplotypes Freq. �2.5% D p
RB1*03–DQB1*02 0.040 D � 0.0335 p � 0.000RB1*07–DQB1*02 0.068 D � 0.0588 p � 0.000RB1*12–DQB1*03 0.257 D � 0.1478 p � 0.000RB1*14–DQB1*05 0.046 D � 0.0285 p � 0.000RB1*15–DQB1*05 0.144 D � 0.0653 p � 0.000RB1*15–DQB1*06 0.076 D � 0.0504 p � 0.000RB1*16–DQB1*05 0.034 D � 0.0235 p � 0.000
BJ (Banjar, Bugis and Jawa)aplotypes Freq. �3% D p
RB1*07–DQB1*02 0.037 D � 0.0350 p � 0.000RB1*12–DQB1*03 0.351 D � 0.1710 p � 0.000RB1*13–DQB1*06 0.037 D � 0.0311 p � 0.000RB1*14–DQB1*05 0.063 D � 0.0452 p � 0.000RB1*15–DQB1*05 0.139 D � 0.0661 p � 0.000RB1*15–DQB1*06 0.080 D � 0.0559 p � 0.000
elantan
aplotypes Freq. �4% D p
RB1*03–DQB1*02 0.04 D � 0.0376 p � 0.005RB1*11–DQB1*03 0.10 D � 0.0792 p � 0.005RB1*14–DQB1*05 0.06 D � 0.0384 p � 0.020RB1*15–DQB1*06 0.10 D � 0.0600 p � 0.005
ype in TMP was A*24-Cw*4-B*35 (8.2%). This haplotype was also

oR
(ff
m(ciDaR
3
aaweHtt
4
ARScldae
Igassp
asArtA1t2waassTPa
bauDs(qsnh
Fcwp
H.A. Edinur et al. / Human Immunology 70 (2009) 518–526 523
ne of the most frequent in BBJ (6.5%), Minangkabau (14.3%), andawa (6.5%) Malays, but was absent in Kelantan Malays.The A*24-B*15-DRB1*12 haplotype was the most frequent
7.2%) haplotype in the TMP. This haplotype was also the mostrequent in the BBJ group (13%), but was absent among the mostrequent haplotypes in Kelantan, Minangkabau, and Rawa Malays.
Among DRB1-DQB1 haplotypes, DRB1*12-DQB1*03 was theost frequent haplotype in the TMP (25.7%), BBJ (35%), and Rawa
22%)Malays. This haplotypewas also observedwith high frequen-ies in Minangkabau Malays (12%), but with no statistically signif-cant linkage disequilibrium among Kelantan Malays. TheRB1*15-DQB1*05 haplotype was the most frequent in Minangk-bau Malays (26%). It was observed fairly frequently in BBJ andawa Malays but was totally absent in Kelantan Malays.
.3. Phylogenetic and PCO analysis
Phylogenetic trees andPCOgraphswere constructedwithA, Cw,nd B (Figs. 2 and 4, respectively) and with A, B, and DRB1 (Figs. 3nd 5, respectively). HLA allele frequencies indciated that the SPGere clustered to each other and to other Asian populations, asxpected. The phylogenetic tree constructed with A, B, and DRB1LA allele frequencies (Fig. 3) indicates a close relationship be-ween BBJ and Filipinos. The PCO graphs (Figs. 4 and 5) indicatedhat the Thai population has some similarities with the SPG.
. Discussion
Historically, the Malays are considered aborigines in the Malayrchipelago, an area which extends from Luzon on the north tootti on the south and fromNikobar Island on the northwest to thealomon Islands on the southeast [36]. The cluster combination ofultures in this region is based on Islam [37]. With respect toanguage, Bahasa Melayu, which consists of a variety of distinctialects, is used as the Lingua Franca and has been the language ofdministration, knowledge, and authorization since the Srivijayampire and the Aceh empire; it was more dominantly used after
ig. 2. Neighbor-joining dendrogram showing the comparative positions ofMalay ealculated using A, Cw, and BHLA allele frequencies. Numbers above branches are no
ith 1000 replicates. The studied population groupdatawere comparedwith that of severaublished papers [25,27,29,33].ndonesia and Malaysia gained independence [38]. Although theroups are closely related in terms of language, history, religion,nd culture, the intent of the present studywas to trace the geneticimilarities anddifferences (basedonHLAmarkers) betweenMalayubethnic groups in PeninsularMalaysia andAsian and otherworldopulations.This study initially provides the HLA-A, Cw, B, -DRB1, and DQB1
llele frequencies of six Malay subethnic groups residing in Penin-ular Malaysia. The most frequent HLA-A serotypes (A*02, A*24,*11, and A*33) reported in the TMP and SPG are also a set ofelatively common alleles throughout SEA populations, includingwo Thai populations (present-day Thais: A*02, 16.3%; A*24, 18.1%;*11, 28.9%; and A*33, 14.6%; and the Dai Lue: A*02, 22.3%; A*24,0.4%; A*11, 37.6%; and A*33, 9.9%) [26] and Mongolians (popula-ion residing in the northern part of China (A*02, 20.2%; A*24,0.1%; A*11, 17.2%; andA*33, 9.3%) [29]. Cw*04, Cw*07, and Cw*08,hich were observed with a frequency greater than 9% in the TMPnd SPG, exhibit some similarities with the distribution of theselleles in the Lisu and Nu people inhabiting Yunnan; the Lisu pos-ess 33, 15, and 8% similarity and the Nu display 32, 10, and 16%imilarity, respectively [27]. The predominance of B*15 among theMP and SPG was also exhibited with high frequencies in thehilippines (28%), Taiwan (11.3%), and Thailand (18.2%; http://www.llelefrequencies.net).DRB1*15 was the most frequent HLA-DRB1 alleles detected in
oth TMP and SPG. This allele was also one of the most commonlleles in Nadars, Kallars, Yadava, and Vanniyar (South Indian pop-lations), with a percentage ranging between 11 and 26% [32]. TheRB1*16 allele exhibited low frequencies in the TMP and SPG,imilar towhat has been reported in Singapore (7%), the Philippines5%), and India (0.4; http://www.allelefrequencies.net). The fre-uency of DQB1*03 and DQB1*05 alleles in the TMP and SPG wasimilar to that observed in other SEA populations. Singapore Chi-ese exhibit 44% DQB1*03 and 11.5% DQB1*05, whereas Buyi ex-ibit 24% DQB1*03 and 40% DQB1*05 [26].
roupswith other populations. Standard genetic distances among populationswereport after the bootstrap technique implemented in PHYLIP package programBOOT
thnic gde sup
l populations obtained fromhttp://www.allelefrequencies.net and frompreviously

fpa(
((
fr
Fwp redwf
Ff
H.A. Edinur et al. / Human Immunology 70 (2009) 518–526524
The HLA data in this study were also similar to that obtainedrom previous studies on the collective Malay population re-orted previously. The most frequent HLA-A, B, DRB1, and DQB1lleles in the Malays were A*24 (37.2%), A*11 (25.8%), A*0219.6%), and A*33 (7.4%) [10], B*15 (25.7%) [12], DRB1*12
ig. 3. Neighbor-joining dendrogram illustrating the comparative positions of Malaere calculated using A, B, and DRB1 HLA allele frequencies. Numbers above branrogramBOOTwith 1000 replicates. The studied population group datawere comparom previously published papers [26–28,30–33].
ig. 4. Principal coordinate analysis using A, Cw, and B HLA allele frequencies. The studierom http://www.allelefrequencies.net and from previously published papers [25,27,29,3
36.4%), and DRB1*15 (23.4%), DQB1*03 (41.4%), and DQB1*05,29%), respectively [13].
With the exception of Kelantan Malays, A*24-Cw*04-B*35 wasrequently observed among the TMP and other SPG and is alsoeported in Ashkenazi Jews (3.4%), French Corsicans (2.4%), and
nic groups with other populations. Standard genetic distances among populationsare node support after the bootstrap technique implemented in PHYLIP packageith that of several populations obtained fromhttp://www.allelefrequencies.net and
ys ethches
d population group data were compared with that of several populations obtained3].
Na
MTMF(DtoKMiF(
Mr(bw
aAJpJsbtatRSsrBDoSMp
nKhMMtcI
pirMca
A
SM
R
F studif 28,30
H.A. Edinur et al. / Human Immunology 70 (2009) 518–526 525
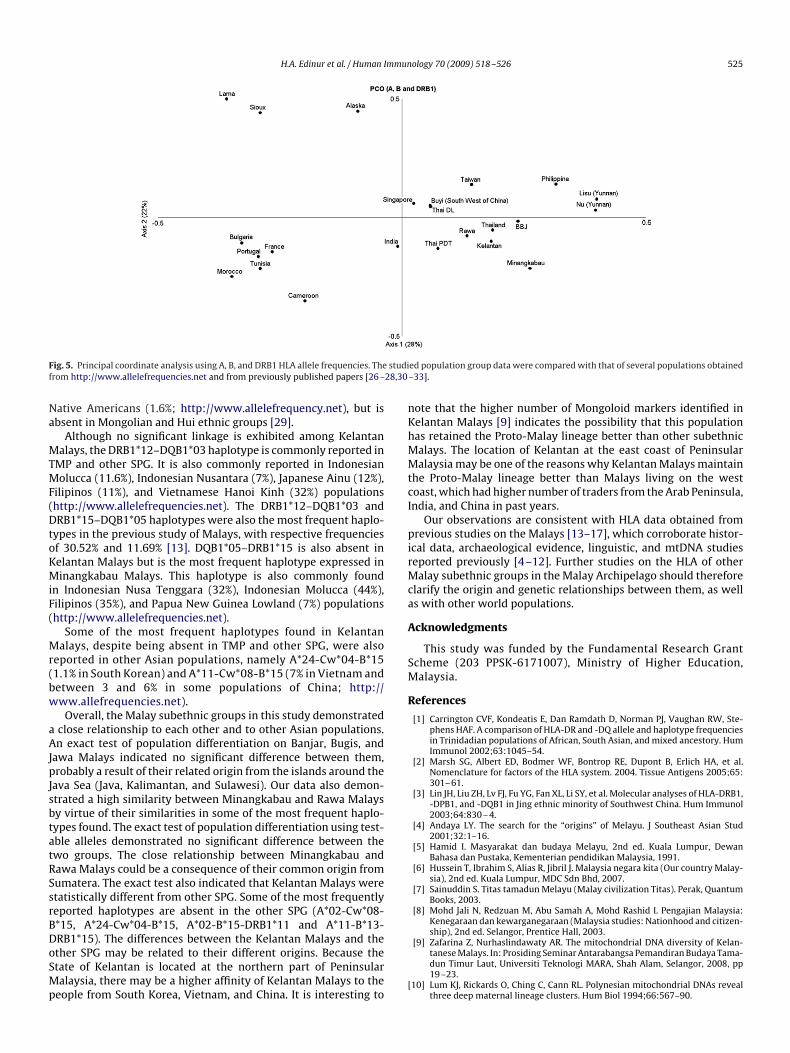
ative Americans (1.6%; http://www.allelefrequency.net), but isbsent in Mongolian and Hui ethnic groups [29].Although no significant linkage is exhibited among Kelantan
alays, the DRB1*12–DQB1*03 haplotype is commonly reported inMP and other SPG. It is also commonly reported in Indonesianolucca (11.6%), Indonesian Nusantara (7%), Japanese Ainu (12%),ilipinos (11%), and Vietnamese Hanoi Kinh (32%) populationshttp://www.allelefrequencies.net). The DRB1*12–DQB1*03 andRB1*15–DQB1*05 haplotypes were also themost frequent haplo-ypes in the previous study of Malays, with respective frequenciesf 30.52% and 11.69% [13]. DQB1*05–DRB1*15 is also absent inelantan Malays but is the most frequent haplotype expressed ininangkabau Malays. This haplotype is also commonly found
n Indonesian Nusa Tenggara (32%), Indonesian Molucca (44%),ilipinos (35%), and Papua New Guinea Lowland (7%) populationshttp://www.allelefrequencies.net).
Some of the most frequent haplotypes found in Kelantanalays, despite being absent in TMP and other SPG, were also
eported in other Asian populations, namely A*24-Cw*04-B*151.1% in South Korean) and A*11-Cw*08-B*15 (7% in Vietnam andetween 3 and 6% in some populations of China; http://ww.allefrequencies.net).Overall, the Malay subethnic groups in this study demonstrated
close relationship to each other and to other Asian populations.n exact test of population differentiation on Banjar, Bugis, andawa Malays indicated no significant difference between them,robably a result of their related origin from the islands around theava Sea (Java, Kalimantan, and Sulawesi). Our data also demon-trated a high similarity between Minangkabau and Rawa Malaysy virtue of their similarities in some of the most frequent haplo-ypes found. The exact test of population differentiation using test-ble alleles demonstrated no significant difference between thewo groups. The close relationship between Minangkabau andawa Malays could be a consequence of their common origin fromumatera. The exact test also indicated that Kelantan Malays weretatistically different from other SPG. Some of the most frequentlyeported haplotypes are absent in the other SPG (A*02-Cw*08-*15, A*24-Cw*04-B*15, A*02-B*15-DRB1*11 and A*11-B*13-RB1*15). The differences between the Kelantan Malays and thether SPG may be related to their different origins. Because thetate of Kelantan is located at the northern part of Peninsularalaysia, there may be a higher affinity of Kelantan Malays to the
ig. 5. Principal coordinate analysis using A, B, and DRB1 HLA allele frequencies. Therom http://www.allelefrequencies.net and from previously published papers [26–
eople from South Korea, Vietnam, and China. It is interesting to[
ote that the higher number of Mongoloid markers identified inelantan Malays [9] indicates the possibility that this populationas retained the Proto-Malay lineage better than other subethnicalays. The location of Kelantan at the east coast of Peninsularalaysiamay be one of the reasons why KelantanMalaysmaintain
he Proto-Malay lineage better than Malays living on the westoast,which hadhigher number of traders from theArab Peninsula,ndia, and China in past years.
Our observations are consistent with HLA data obtained fromrevious studies on the Malays [13–17], which corroborate histor-cal data, archaeological evidence, linguistic, and mtDNA studieseported previously [4–12]. Further studies on the HLA of otheralay subethnic groups in theMalay Archipelago should thereforelarify the origin and genetic relationships between them, as wells with other world populations.
cknowledgments
This study was funded by the Fundamental Research Grantcheme (203 PPSK-6171007), Ministry of Higher Education,alaysia.
eferences
[1] Carrington CVF, Kondeatis E, Dan Ramdath D, Norman PJ, Vaughan RW, Ste-phens HAF. A comparison of HLA-DR and -DQ allele and haplotype frequenciesin Trinidadian populations of African, South Asian, and mixed ancestory. HumImmunol 2002;63:1045–54.
[2] Marsh SG, Albert ED, Bodmer WF, Bontrop RE, Dupont B, Erlich HA, et al.Nomenclature for factors of the HLA system. 2004. Tissue Antigens 2005;65:301–61.
[3] Lin JH, Liu ZH, Lv FJ, Fu YG, Fan XL, Li SY, et al. Molecular analyses of HLA-DRB1,-DPB1, and -DQB1 in Jing ethnic minority of Southwest China. Hum Immunol2003;64:830–4.
[4] Andaya LY. The search for the “origins” of Melayu. J Southeast Asian Stud2001;32:1–16.
[5] Hamid I. Masyarakat dan budaya Melayu, 2nd ed. Kuala Lumpur, DewanBahasa dan Pustaka, Kementerian pendidikan Malaysia, 1991.
[6] Hussein T, Ibrahim S, Alias R, Jibril J. Malaysia negara kita (Our country Malay-sia), 2nd ed. Kuala Lumpur, MDC Sdn Bhd, 2007.
[7] Sainuddin S. Titas tamadunMelayu (Malay civilization Titas). Perak, QuantumBooks, 2003.
[8] Mohd Jali N, Redzuan M, Abu Samah A, Mohd Rashid I. Pengajian Malaysia:Kenegaraan dan kewarganegaraan (Malaysia studies: Nationhood and citizen-ship), 2nd ed. Selangor, Prentice Hall, 2003.
[9] Zafarina Z, Nurhaslindawaty AR. The mitochondrial DNA diversity of Kelan-taneseMalays. In: Prosiding SeminarAntarabangsa PemandiranBudaya Tama-dun Timur Laut, Universiti Teknologi MARA, Shah Alam, Selangor, 2008, pp19–23.
ed population group datawere comparedwith that of several populations obtained–33].
10] Lum KJ, Rickards O, Ching C, Cann RL. Polynesian mitochondrial DNAs revealthree deep maternal lineage clusters. Hum Biol 1994;66:567–90.

[
[
[
[
[
[
[
[
[
[
[
[
[[
[
[
[
[
[
[
[
[
[
[
[
[
[
[
H.A. Edinur et al. / Human Immunology 70 (2009) 518–526526
11] Melton T, Peterson R, Redd AJ, Saha N, Sofro ASM,Martinson J, et al. Polynesiangenetic affinities with southeast Asian populations as identified by mtDNAanalysis. Am J Hum Genet 1995;57:403–14.
12] Melton T, Clifford S, Martinson J, Batzer M, Stoneking M. Genetic evidence forthe proto-Austronesian homeland in Asia: mtDNA and nuclear DNA variationin Taiwanese Aboriginal tribes. Am J Hum Genet 1998;63:1807–23.
13] Mack SJ, Bugawan TL, Moonsamy PV, Erlich JA, Trachtenberg EA, Paik YK, et al.Evolution of Pacific/Asian populations inferred from HLA class II allele fre-quency distribution. Tissue Antigens 2000;55:383–400.
14] Bugawan TL, Mack SJ, Stoneking M, Saha M, Beck HP, Erlich HA. HLA class Iallele distributions in six Pacific/Asianpopulations: evidence of selection at theHLA-A locus. Tissue Antigens 1999;53:311–9.
15] Dhaliwal JS, Too CL, Lisut M, Lee YY, Murad S. HLA-B27 polymorphism in theMalays. Tissue Antigens 2003;62:330–2.
16] Dhaliwal JS, ShahnazM, TooCL, AzrenaA,Maiselamah L, Lee YY, et al. HLA-A, -Band -DR allele and haplotype frequencies in Malays. Asian Pacific J AllergyImmunol 2007;25:47–71.
17] Koh CL, Benjamin DG. HLA-DQ alpha genotype and allele frequencies in Ma-lays, Chinese, and Indians in the Malaysian population. Hum Hered 1994;44:150–5.
18] LimKB, JeevanNH, Jaya P, OthmanMI, Lee YH. STR for the Amp�STR profile locifrom the three main ethnic population groups (Malay, Chinese and Indian) inMalaysia. Forensic Sci Int 2001;119:109–12.
19] Seah LH, Jeevan NH, OthmanMI, Jaya P, Ooi YS,Wong PC, et al. STR data for theAmpFlSTR Identifiler loci in three ethnic groups (Malay, Chinese, Indian) of theMalaysian population. Forensic Sci Int 2003;138:134–7.
20] Bekaert B, Zainuddin Z, Hadi S, Goodwin W. A comparison of mtDNA and Ychromosome diversity in Malay populations. Int Congress Ser 2006;1288:252–5.
21] Zainuddin Z, Goodwin W. Mitochondrial DNA profiling of modern Malay andOrang Asli populations in Peninsular Malaysia. Int Congress Ser 2004;1261:428–30.
22] Excoffier L, Laval G, Schneider S. Arlequin version 3.1: an integrated softwarepackage for population genetics data analysis. Computational and MolecularPopulation Genetics Lab (CMPG). Switzerland, Institute of Zoology, Universityof Berne, 2006.
23] Weir BS. Genetic data analysis II. Sunderland, MA, Sinauer Associates, 1996.24] Nielson DM, Ehm MG, Zaykin DV, Weir BS. Effect of two- and three-locus
linkage disequilibriumon the power to detectmarker/phenotype associations.Genetics 2004;168:1029–40.
25] Allsopp CEM, Harding RM, Taylor C, Bunce M, Kwiatkowski D, Anstey N, et al.Interethnic genetic differentiation inAfrica:HLA class I antigens in theGambia.Am J Hum Genet 1992;50:411–21.
26] Chandanayingyong D, Stephens HAF, Klaythong R, Sirikong M, Udee S, LongtaP, et al. HLA-A, -B, -DRB1, DQA1, and DQB1 polymorphism in Thais. HumImmunol 1997;53:174–82.
27] Chen S, Hu Q, Xie Y, Zhou L, Xiao C, Wu Y, et al. Origin of Tibeto-Burmanspeakers: evidence from HLA allele distribution in Lisu and Nu inhabitingYunnan of China. Hum Immunol 2007;68:550–9.
28] Gibert M, Reviron D, Mercier P, Chiaroni J, Boetsch G. HLA-DRB1 and DQB1polymorphisms in Southern France and genetic relationships with otherMed-iterranean populations. Hum Immunol 2000;61:930–6.
29] Hong W, Chen S, Shao H, Fu Y, Hu Z, Xu A. HLA class I polymorphism inMongolian and Hui ethnic groups from Northern China. Hum Immunol 2007;68:439–48.
30] Moscoso J, Seclen S, Serrano-Vela JI, Villena A, Martinez-Laso J, Zamora J, et al.HLA genes in Lamas Peruvian-Amozonian Amerindians. Mol Immunol 2006;43:1881–9.
31] Moscoso J, CrawfordMH,Vicario JL, ZlojutroM, Serrano-Vela JI, RegueraR, et al.HLA genes of Aleutian Islanders living between Alaska (USA) and Kamchatka(Russia) suggest a possible Southern Siberia origin. Mol Immunol 2008;45:1018–26.
32] Shankarkumar U, Sridharan B. HLA DRB1* and DQB1* allelic diversity amongNadars: a primitive South Indian Dravidian caste group. Hum Immunol 2004;65:847–54.
33] Middleton D, Menchaca L, Rood H, Komerofsky R. New allele frequency data-base. Tissue Antigens 2003;61:403–7.
34] Felsenstein J. PHYLIP (Phylogeny Inference Package) version 3.6. Seattle, De-partment of Genome Sciences, University of Washington, 2004.
35] Page RDM. TreeView: an application to display phylogenetic trees on personalcomputers. Comput Appl Biosci 1996;12:357–8.
36] Wallace AR. On the physical geography of theMalay Archipelago. J R Geogr Soc1863;33:217–34.
37] Abu Bakar AL. Sejarah dan pemikiran konsep kebudayaan di Malaysia (Thehistory and custom thinking concept in Malaysia). In: Pertemuan dunia Mel-ayu ’82 (The convergence of Malay world ’82). Kuala Lumpur, Dewan Bahasadan Pustaka, Kementerian Pelajaran Malaysia, 1987.
38] OmarA. Kajian danperkembanganBahasaMelayu (Research anddevelopmentof Malay language). In: Perkembangan Bahasa Melayu masa kini dan masa
hadapan (Current and future Malay language development). Kuala Lumpur,Dewan Bahasa dan Pustaka, Kementerian Pendidikan Malaysia, 1992.Copyright © 2022 FDOKUMEN