Genome-wide meta-analysis identifies 56 bone mineral density loci and reveals 14 loci associated...
13
NATURE GENETICS VOLUME 44 | NUMBER 5 | MAY 2012 491 ARTICLES Osteoporosis is a disease characterized by low bone mass and micro- architectural deterioration of bone tissue leading to increased risk of fracture. The disease accounts for approximately 1.5 million new fracture cases each year, representing a huge economic burden on health care systems, with annual costs estimated to be $17 billion in the United States alone and expected to rise 50% by the year 2025 (ref. 1). Osteoporosis is defined clinically through the measurement of BMD, which remains the single best predictor of fracture 2,3 . Twin and family studies have shown that 50–85% of the variance in BMD is genetically determined 4 . Osteoporotic fractures are also heritable by mechanisms that are partly independent of BMD 5 . Over the past 5 years, genome-wide association studies (GWAS) have revo- lutionized the understanding of the genetic architecture of common, complex diseases 6 . This approach is providing key insights into the mechanisms of disease, with prospects for the design of effective strate- gies for risk assessment and the development of new interventions 7 . Previous GWAS have identified 24 loci that influence BMD varia- tion 8–14 . Whereas several variants in these BMD-associated loci have also been nominally associated with fracture risk 15,16 , none have shown robust association with genome-wide significance (P < 5 × 10 −8 ). We report here the results of the largest effort to date searching for BMD- associated loci in >80,000 subjects and testing them for association with fracture in >130,000 cases and controls. In addition, we employed bioinformatics tools and gene expression analyses to place the identi- fied variants in the context of pathways relevant to bone biology. RESULTS This study was performed across three main stages (Fig. 1): (i) the discovery of BMD loci, (ii) follow-up replication and (iii) association of the BMD-associated loci with fracture. Discovery of BMD loci (stage 1) We first performed a meta-analysis of multiple GWAS for BMD of the femoral neck (FN-BMD; n = 32,961) and lumbar spine (LS-BMD; n = 31,800 cases), including ~2.5 million genotyped or imputed auto- somal SNPs from 17 studies of populations across North America, Europe, East Asia and Australia, with a variety of epidemiologi- cal designs and subject characteristics (Online Methods). We also performed meta-analysis in men and women separately to identify sex-specific associations. The quantile-quantile plots of the discov- ery meta-analysis showed strong (and not early) deviation of the observed statistics from the null distribution of no association for both BMD traits (Supplementary Fig. 1). After double genomic con- trol correction of the overall (λ FN-BMD pooled = 1.112; λ LS-BMD pooled = 1.127) and sex-stratified (λ FN-BMD women = 1.091; λ FN-BMD men = 1.059; λ LS-BMD women = 1.086; λ LS-BMD men = 1.061) analyses, SNPs in 34 loci surpassed genome-wide significance, whereas a total of 82 loci were associated at P < 5 × 10 −6 (Supplementary Figs. 2 and 3). Thirty-eight loci were associated with FN-BMD, 25 with LS-BMD and 19 with both. The overlap reflects correlation between the femoral neck and lumbar spine measurements (Pearson’s correlation = 0.53). Of these 82 loci, 59, 18 and 5 were prioritized from analyses in the sex-combined, female and male sample sets, respectively (Supplementary Table 1). The meta-analysis was extended to include the evaluation of 76,253 markers on the X chromosome imputed across 14 of the discovery GWAS, for a total of 31,801 participants (Online Methods). Five loci on the X chromosome were associated at P < 5 × 10 −5 , with four of these derived from the sex-combined analysis and one identified in the analysis of men only (Supplementary Table 1). We further performed genome-wide conditional analyses in all sex-combined stage 1 studies. Each study repeated the GWAS analysis but also adjusted for 82 SNPs Genome-wide meta-analysis identifies 56 bone mineral density loci and reveals 14 loci associated with risk of fracture A full list of authors and affiliations appears at the end of the paper. Received 7 October 2011; accepted 16 March 2012; published online 15 April 2012; doi:10.1038/ng.2249 Bone mineral density (BMD) is the most widely used predictor of fracture risk. We performed the largest meta-analysis to date on lumbar spine and femoral neck BMD, including 17 genome-wide association studies and 32,961 individuals of European and east Asian ancestry. We tested the top BMD-associated markers for replication in 50,933 independent subjects and for association with risk of low-trauma fracture in 31,016 individuals with a history of fracture (cases) and 102,444 controls. We identified 56 loci (32 new) associated with BMD at genome-wide significance (P < 5 × 10 −8 ). Several of these factors cluster within the RANK- RANKL-OPG, mesenchymal stem cell differentiation, endochondral ossification and Wnt signaling pathways. However, we also discovered loci that were localized to genes not known to have a role in bone biology. Fourteen BMD-associated loci were also associated with fracture risk (P < 5 × 10 −4 , Bonferroni corrected), of which six reached P < 5 × 10 −8 , including at 18p11.21 (FAM210A), 7q21.3 (SLC25A13), 11q13.2 (LRP5), 4q22.1 (MEPE), 2p16.2 (SPTBN1) and 10q21.1 (DKK1). These findings shed light on the genetic architecture and pathophysiological mechanisms underlying BMD variation and fracture susceptibility. npg © 2012 Nature America, Inc. All rights reserved.
-
Upload
independent -
Category
Documents
-
view
1 -
download
0
Transcript of Genome-wide meta-analysis identifies 56 bone mineral density loci and reveals 14 loci associated...

Nature GeNetics VOLUME 44 | NUMBER 5 | MAY 2012 491
A rt i c l e s
Osteoporosis is a disease characterized by low bone mass and micro-architectural deterioration of bone tissue leading to increased risk of fracture. The disease accounts for approximately 1.5 million new fracture cases each year, representing a huge economic burden on health care systems, with annual costs estimated to be $17 billion in the United States alone and expected to rise 50% by the year 2025 (ref. 1). Osteoporosis is defined clinically through the measurement of BMD, which remains the single best predictor of fracture2,3.
Twin and family studies have shown that 50–85% of the variance in BMD is genetically determined4. Osteoporotic fractures are also heritable by mechanisms that are partly independent of BMD5. Over the past 5 years, genome-wide association studies (GWAS) have revo-lutionized the understanding of the genetic architecture of common, complex diseases6. This approach is providing key insights into the mechanisms of disease, with prospects for the design of effective strate-gies for risk assessment and the development of new interventions7.
Previous GWAS have identified 24 loci that influence BMD varia-tion8–14. Whereas several variants in these BMD-associated loci have also been nominally associated with fracture risk15,16, none have shown robust association with genome-wide significance (P < 5 × 10⁻⁸). We report here the results of the largest effort to date searching for BMD-associated loci in >80,000 subjects and testing them for association with fracture in >130,000 cases and controls. In addition, we employed bioinformatics tools and gene expression analyses to place the identi-fied variants in the context of pathways relevant to bone biology.
RESULTSThis study was performed across three main stages (Fig. 1): (i) the discovery of BMD loci, (ii) follow-up replication and (iii) association of the BMD-associated loci with fracture.
Discovery of BMD loci (stage 1)We first performed a meta-analysis of multiple GWAS for BMD of the femoral neck (FN-BMD; n = 32,961) and lumbar spine (LS-BMD; n = 31,800 cases), including ~2.5 million genotyped or imputed auto-somal SNPs from 17 studies of populations across North America, Europe, East Asia and Australia, with a variety of epidemiologi-cal designs and subject characteristics (Online Methods). We also performed meta-analysis in men and women separately to identify sex-specific associations. The quantile-quantile plots of the discov-ery meta-analysis showed strong (and not early) deviation of the observed statistics from the null distribution of no association for both BMD traits (Supplementary Fig. 1). After double genomic con-trol correction of the overall (λFN-BMD pooled = 1.112; λLS-BMD pooled = 1.127) and sex-stratified (λFN-BMD women = 1.091; λFN-BMD men = 1.059; λLS-BMD women = 1.086; λLS-BMD men = 1.061) analyses, SNPs in 34 loci surpassed genome-wide significance, whereas a total of 82 loci were associated at P < 5 × 10⁻⁶ (Supplementary Figs. 2 and 3). Thirty-eight loci were associated with FN-BMD, 25 with LS-BMD and 19 with both. The overlap reflects correlation between the femoral neck and lumbar spine measurements (Pearson’s correlation = 0.53). Of these 82 loci, 59, 18 and 5 were prioritized from analyses in the sex-combined, female and male sample sets, respectively (Supplementary Table 1). The meta-analysis was extended to include the evaluation of 76,253 markers on the X chromosome imputed across 14 of the discovery GWAS, for a total of 31,801 participants (Online Methods). Five loci on the X chromosome were associated at P < 5 × 10⁻⁵, with four of these derived from the sex-combined analysis and one identified in the analysis of men only (Supplementary Table 1). We further performed genome-wide conditional analyses in all sex-combined stage 1 studies. Each study repeated the GWAS analysis but also adjusted for 82 SNPs
Genome-wide meta-analysis identifies 56 bone mineral density loci and reveals 14 loci associated with risk of fracture
A full list of authors and affiliations appears at the end of the paper.
Received 7 October 2011; accepted 16 March 2012; published online 15 April 2012; doi:10.1038/ng.2249
Bone mineral density (BMD) is the most widely used predictor of fracture risk. We performed the largest meta-analysis to date on lumbar spine and femoral neck BMD, including 17 genome-wide association studies and 32,961 individuals of European and east Asian ancestry. We tested the top BMD-associated markers for replication in 50,933 independent subjects and for association with risk of low-trauma fracture in 31,016 individuals with a history of fracture (cases) and 102,444 controls. We identified 56 loci (32 new) associated with BMD at genome-wide significance (P < 5 × 10⁻⁸). Several of these factors cluster within the RANK-RANKL-OPG, mesenchymal stem cell differentiation, endochondral ossification and Wnt signaling pathways. However, we also discovered loci that were localized to genes not known to have a role in bone biology. Fourteen BMD-associated loci were also associated with fracture risk (P < 5 × 10⁻⁴, Bonferroni corrected), of which six reached P < 5 × 10⁻⁸, including at 18p11.21 (FAM210A), 7q21.3 (SLC25A13), 11q13.2 (LRP5), 4q22.1 (MEPE), 2p16.2 (SPTBN1) and 10q21.1 (DKK1). These findings shed light on the genetic architecture and pathophysiological mechanisms underlying BMD variation and fracture susceptibility.
npg
© 2
012
Nat
ure
Am
eric
a, In
c. A
ll rig
hts
rese
rved
.

492 VOLUME 44 | NUMBER 5 | MAY 2012 Nature GeNetics
A rt i c l e s
representing the autosomal loci associated at P < 5 × 10⁻⁶ (Online Methods). We then performed meta-analysis on these studies in the same way as in the primary GWAS meta-analysis. Nine loci showed at least two independent association signals in this conditional ana-lysis (Supplementary Fig. 4 and Supplementary Table 2), suggesting that allelic heterogeneity underlies BMD variation. We also assessed all possible pairwise interactions of the 82 SNPs, but none were significant after adjusting for the number of tests (Supplementary Fig. 5 and Supplementary Table 3). A total of 96 independent SNPs (82 autosomal SNPs with P < 5 × 10⁻⁶, 9 autosomal SNPs from condi-tional analysis and 5 SNPs on the X chromosome) from 87 genomic loci were selected for further replication (Fig. 1).
Follow-up replication (stage 2)We performed de novo genotyping of these 96 SNPs and tested them for association with BMD in up to 50,933 additional participants from 34 studies (Online Methods). Meta-analysis of the 96 SNPs in the dis-covery and replication studies (n = 83,894) yielded 64 replicating SNPs from 56 associated loci. Of these loci, 32 were newly found to show asso-ciation (Table 1 and Supplementary Table 4a), and 24 were reported previously8–14 (Supplementary Table 4b). Thirty-two SNPs did not reach genome-wide significance after replication (Supplementary Table 4c), including 10 markers that remained associated at a sug-gestive level. Of all the SNPs analyzed, only one (rs9533090 mapping to 13q14.11 near TNFSF11 (also known as RANKL)) showed a high degree of heterogeneity of effects (I2 > 50%) across studies, despite being the marker that associated with highest significance (P = 4.82 × 10−68) in the fixed-effect meta-analysis (Supplementary Table 4b). After applying random-effects meta-analysis, this marker was still associated with genome-wide significance (P = 3.98 × 10⁻¹³).
Two of the newly identified loci were discovered in the sex-stratified meta-analysis: 8q13.3 in women and Xp22.31 in men; however, only the association at Xp22.31 showed significant evidence for sex speci-ficity, as reflected by significant heterogeneity of effects across sex strata (Phet = 1.62 × 10⁻⁸). Yet, we acknowledge that the association at 8q13.3 in women may have been driven by a lower number of men in the discovery and replication data sets (Table 1 and Supplementary Table 5). Furthermore, evidence for BMD site specificity (Phet < 5 × 10⁻⁴) was observed in a proportion of the loci, including 6 of the 32 new and 4 of the 24 known loci (Table 1 and Supplementary
Fig. 6). Among the newly identified loci, 2q14 (INSIG2), 12p11.22 (PTHLH) and 16q12.1 (CYLD) showed site specificity with FN-BMD, and 8q13.3 (LACTB2), 10p11.23 (MPP7) and 10q22.3 (KCNMA1) showed site-specificity with LS-BMD.
After replication, the conditional analysis provided significant evi-dence of association (P < 5 × 10⁻⁸) in eight of the nine loci contain-ing secondary signals (Supplementary Fig. 4 and Supplementary Table 2). Three loci had variants located less than 40 kb from the initial main signal, suggesting allelic heterogeneity, including at 1p31.3 (represented by rs17482952 near WLS), 6q25.1 (rs7751941 near ESR1) and 16q12.1 (rs1564981 near CYLD). The secondary signal at 16q12.1 (rs1564981) showed a strong association with LS-BMD, whereas the main signal in this locus (rs1566045) was only associated with FN-BMD. The other five secondary signals were represented by variants localized more than 180 kb from the initial main signal and were located in different candidate genes, including at 1p36.12 (rs7521902 near WNT4), 7p14.1 (rs10226308 near SFRP4), 7q31.31 (rs13245690 near C7orf58), 12q13.13 (rs736825 near HOXC6) and 17q21.31 (rs4792909 near SOST). The secondary signal mapping to the 13q14.11 locus (rs7326472) did not achieve genome-wide signifi-cance after replication.
Association of the BMD loci with fracture (stage 3)We tested the 96 markers for association with fracture in 31,016 cases and 102,444 controls from 50 studies with fracture informa-tion. This collection included 5,411 cases and 21,909 controls tested in the BMD GWAS discovery samples, 9,187 cases and 45,057 controls tested by in silico replication and 16,418 cases and 35,478 controls tested by de novo genotyping (Fig. 1 and Online Methods). In this fracture meta-analysis, 14 loci were significantly associated with any type of fracture at Bonferroni-corrected significance (P = 5 × 10⁻⁴), of which five were new BMD-associated loci. None of the markers showed large estimates of heterogeneity (Table 2, Supplementary Fig. 7 and Supplementary Table 6). Markers at six of these loci reached P < 5 × 10⁻⁸, including at 18p11.21 (FAM210A; also known as C18orf19), 7q21.3 (SLC25A13), 11q13.2 (LRP5), 4q22.1 (MEPE), 2p16.2 (SPTBN1) and 10q21.1 (DKK1). The proportion of the overall fracture risk explained by BMD ranged between 0.09 and 0.40 across markers (Supplementary Table 7) and was estimated in a subset of stage 2 samples (including n = 8,594 cases and 23,218 controls) by modeling the effect of BMD-associated SNPs on fracture risk, with and without the inclusion of BMD as a covariate. In general, the effect of these SNPs on BMD was larger than on fracture risk (Fig. 2a), except for the most significantly associated locus for fracture at 18p11.21 (Fig. 2b). SNPs in genes of the RANK-RANKL-OPG path-way (TNFRSF11A, TNFSF11 and TNFRSF11B, respectively), despite being the strongest loci associated with BMD, were not significantly associated with fracture. All 31 BMD-associated loci that had nominal association with fracture risk (P < 0.05) showed consistent direc-tion (the allele associated with decreasing BMD was associated with increased risk of fracture). When we performed subgroup analyses using cleaner phenotype definitions generated by limiting subjects to those with clinically validated fractures and stratifying by ana-tomical site (for example, non-vertebral and vertebral fractures), we did not identify any additional signals (Supplementary Table 8). At a nominally significant level (P < 0.05), only 3 loci were associated with vertebral fracture, and all 14 BMD-associated loci were associ-ated with non-vertebral fracture, although the difference in effect between fracture sites was not significant. Therefore, the power of our study did not benefit from improving phenotype definitions at the cost of lower sample size.
BMD discovery (stage 1)meta-analysis of 17 BMD
genome-wide association studies(n = 32,961)
BMD replication (stage 2)96 SNPs in 34 studies(de novo and in silico)
(n = 50,933)
Association of the BMD lociwith fracture (stage 3)96 SNPs in 50 studies(de novo and in silico)
(n = 31,016 cases and 102,444controls)
Figure 1 Description of study design. Stage 1: meta-analysis of 17 genome-wide association studies for BMD. Stage 2: 96 top independent SNPs (82 autosomal SNPs with P < 5 × 10⁻⁶, 5 SNPs on the X chromosome and 9 SNPs from conditional analysis) were followed up in de novo and in silico replication of the BMD association in 34 studies. Stage 3: the same 96 SNPs were tested for association with fracture in 50 studies with de novo and in silico data.
npg
© 2
012
Nat
ure
Am
eric
a, In
c. A
ll rig
hts
rese
rved
.

Nature GeNetics VOLUME 44 | NUMBER 5 | MAY 2012 493
A rt i c l e s
tabl
e 1
est
imat
ed e
ffec
ts o
f ne
w g
enom
e-w
ide
sign
ific
ant
sN
Ps
on F
N-B
MD
and
ls
-BM
D a
cros
s st
ages
Func
tion
al e
vide
nce
FN-B
MD
LS-B
MD
Sta
ge 1
(3
2,9
61
)S
tage
2
(50
,93
3)
Stag
es 1
and
2
(83
,89
4)
Sta
ge 1
(3
1,8
00
)S
tage
2
(45
,70
8)
Sta
ges
1 a
nd 2
(7
7,5
08
)
SN
PLo
cus
Clo
sest
ge
ne/c
andi
date
eQTL
Kno
ckou
t m
ouse
OM
IMTa
gs
func
tion
GR
AIL
Path
way
AFr
eq.
βcP
PP
βaP
PP
P het
sit
eb
rs4
79
33
61q
24.3
DN
M3
T0
.74
−0
.04
1.1
× 1
0−7
1.3
× 1
0−8
8.5
× 1
0−15
−0
.03
0.0
15
.0 ×
10
−4
2.1
× 1
0−5
0.0
5
rs7
58
42
62
2p21
PKD
CC•
T0
.23
0.0
31
.4 ×
10
−7
3.4
× 1
0−4
1.3
× 1
0−9
0.0
10
.13
0.2
80
.07
0.0
1
rs1
70
40
77
32q
13AN
APC1
•A
0.7
60
.03
4.3
× 1
0−6
6.1
× 1
0−5
1.5
× 1
0−9
0.0
10
.61
0.2
10
.19
5.2
× 1
0−3
rs1
87
85
26
2q14
.2IN
SIG
2A
0.2
20
.00
0.7
00
.97
0.7
90
.04
7.3
× 1
0−6
3.4
× 1
0−6
1.2
× 1
0−10
8.6
× 1
0−5
rs1
02
63
64
3q13
.2K
IAA2
018
•T
0.3
70
.03
2.0
× 1
0−6
2.5
× 1
0−5
4.1
× 1
0−10
0.0
20
.04
7.3
× 1
0−3
7.6
× 1
0−4
0.1
1
rs3
44
08
13q
25.3
1LE
KR
1T
0.8
70
.03
1.1
× 1
0−4
2.5
× 1
0−3
2.2
× 1
0−6
0.0
62
.8 ×
10
−5
3.5
× 1
0−8
4.5
× 1
0−12
0.1
2
rs3
75
59
55
4p16
.3ID
UA
••
A0
.16
−0
.05
3.9
× 1
0−7
6.1
× 1
0−9
1.5
× 1
0−14
−0
.05
1.4
× 1
0−7
5.5
× 1
0−9
5.2
× 1
0−15
0.8
0
rs1
17
55
16
46p
21.1
SUPT
3H/R
UN
X2•
••
T0
.40
−0
.01
0.2
30
.12
0.0
5−0
.03
3.5
× 1
0−7
9.2
× 1
0−6
5.6
× 1
0−11
2.1
× 1
0−3
rs9
46
60
56
6p22
.3CD
KAL
1/SO
X4A
0.3
8−0
.03
1.8
× 1
0−8
1.6
× 1
0−6
2.7
× 1
0−13
−0
.03
6.5
× 1
0−5
1.1
× 1
0−4
3.6
× 1
0−8
0.3
4
rs3
80
13
87
7q31
.31
WN
T16
••
•A
0.7
4−0
.08
4.2
× 1
0−14
2.0
× 1
0−27
5.0
× 1
0−40
−0
.10
1.4
× 1
0−16
1.5
× 1
0−36
3.2
× 1
0−51
0.0
9
rs1
32
45
69
0e
7q31
.31
C7or
f58
A0
.62
0.0
08
.6 ×
10
−5
0.6
98
.2 ×
10
−4
0.0
31
.1 ×
10−9
1.3
× 1
0−3
6.0
× 1
0−11
0.0
5
rs7
81
20
88
7q36
.1AB
CF2
A0
.13
0.0
41
.2 ×
10
−6
4.4
× 1
0−4
7.3
× 1
0−9
0.0
42
.9 ×
10
−5
1.1
× 1
0−3
2.2
× 1
0−7
0.8
6
rs7
01
79
14
c8q
13.3
XKR
9/LA
CTB
2•
•A
0.4
90
.02
4.7
× 1
0−8
7.1
× 1
0−3
1.9
× 1
0−8
−0
.01
0.3
50
.41
0.9
89
.1 ×
10−5
rs7
85
16
93
9q34
.11
FUB
P3C
0.6
40
.05
3.1
× 1
0−8
1.4
× 1
0−15
3.4
× 1
0−22
0.0
40
.06
6.7
× 1
0−8
6.1
× 1
0−8
0.0
2
rs3
90
57
06
10p1
1.23
MPP
7T
0.2
2−0
.02
0.6
31
.7 ×
10
−3
0.0
30
.05
2.9
× 1
0−9
6.7
× 1
0−9
2.4
× 1
0−16
5.8
× 1
0−11
rs1
37
30
04
10q2
1.1
MB
L2/D
KK
1•
•T
0.1
3−0
.04
1.4
× 1
0−5
1.5
× 1
0−4
1.5
× 1
0−8
−0
.05
5.4
× 1
0−8
2.2
× 1
0−6
1.6
× 1
0−12
0.2
8
rs7
07
12
06
10q2
2.3
KCN
MA1
T0
.78
0.0
10
.29
0.2
60
.81
-0.0
51
.5 ×
10−12
6.2
× 1
0−9
5.0
× 1
0−19
5.9
× 1
0−9
rs7
08
49
21
10q2
4.2
CPN
1T
0.3
90
.03
1.4
× 1
0−4
1.6
× 1
0−6
9.0
× 1
0−10
0.0
30
.01
1.9
× 1
0−5
9.2
× 1
0−7
0.5
8
rs1
08
35
18
711
p14.
1LI
N7C
•T
0.5
5−0
.01
0.1
70
.08
0.0
3−0
.02
3.0
× 1
0−5
2.4
× 1
0−4
4.9
× 1
0−8
0.0
3
rs7
95
35
28
12p1
1.22
KLH
DC5
/PTH
LH•
••
•A
0.1
80
.04
5.8
× 1
0−8
2.4
× 1
0−6
1.9
× 1
0−12
−0
.02
0.9
40
.05
0.1
32
.3 ×
10−7
rs2
88
75
71
12p1
3.33
ERC1
/WN
T5B
••
A0
.76
−0
.03
1.1
× 1
0−4
1.6
× 1
0−5
6.5
× 1
0−9
−0
.04
2.2
× 1
0−7
2.9
× 1
0−6
5.6
× 1
0−12
0.3
7
rs1
28
21
00
812
q13.
12D
HH
•T
0.3
90
.03
1.9
× 1
0−4
5.2
× 1
0−4
3.3
× 1
0−7
0.0
51
.5 ×
10
−7
1.9
× 1
0−9
1.2
× 1
0−15
0.0
6
rs1
05
30
51
12q2
3.3
C12o
rf23
•T
0.5
2−0
.03
1.4
× 1
0−5
1.8
× 1
0−5
9.6
× 1
0−10
−0
.02
2.5
× 1
0−6
2.4
× 1
0−3
7.9
× 1
0−8
0.7
6
rs1
28
60
83
14q3
2.12
RPS
6KA5
T0
.81
−0
.05
2.9
× 1
0−8
9.3
× 1
0−9
2.0
× 1
0−15
−0
.04
1.7
× 1
0−11
7.1
× 1
0−6
1.8
× 1
0−14
0.9
2
rs4
98
51
55
16p1
3.11
NTA
N1
••
A0
.67
−0
.03
3.5
× 1
0−4
1.4
× 1
0−7
1.7
× 1
0−10
−0
.03
8.7
× 1
0−7
1.8
× 1
0−4
2.2
× 1
0−9
0.9
8
rs9
92
12
22
16p1
3.3
AXIN
1•
••
T0
.48
−0
.03
2.5
× 1
0−7
2.4
× 1
0−6
5.2
× 1
0−12
−0
.04
2.2
× 1
0−8
8.3
× 1
0−10
1.0
× 1
0−16
0.2
6
rs1
33
36
42
816
p13.
3C1
6orf
38/
CLCN
7•
•A
0.4
3−0
.04
2.9
× 1
0−7
1.1
× 1
0−10
1.5
× 1
0−16
−0
.04
5.9
× 1
0−5
5.8
× 1
0−10
1.7
× 1
0−13
0.8
0
rs1
56
60
45
16q1
2.1
SALL
1/CY
LD•
T0
.80
−0
.06
5.0
× 1
0−12
3.0
× 1
0−12
1.9
× 1
0−22
−0
.01
7.8
× 1
0−3
0.5
50
.04
7.5
× 1
0−6
rs1
56
49
81
e16
q12.
1CY
LD•
A0
.47
−0
.02
1.1
× 1
0−3
0.0
14
.4 ×
10
−5
−0
.03
6.2
× 1
0−8
5.4
× 1
0−4
2.0
× 1
0−10
0.5
0
rs4
79
08
81
17p1
3.3
SMG
6A
0.6
90
.05
1.7
× 1
0−8
1.2
× 1
0−11
9.8
× 1
0−19
0.0
46
.0 ×
10
−4
1.7
× 1
0−6
3.4
× 1
0−9
0.1
3
rs7
21
79
32
17q2
4.3
SOX9
••
••
A0
.46
0.0
33
.7 ×
10−8
2.7
× 1
0−5
1.9
× 1
0−11
0.0
10
.31
0.1
50
.08
3.8
× 1
0−3
rs4
79
69
95
18p1
1.21
FAM
210A
A0
.63
0.0
23
.2 ×
10
−6
1.1
× 1
0−3
4.9
× 1
0−8
0.0
15
.2 ×
10
−4
0.1
16
.7 ×
10
−4
0.2
9
rs1
04
16
21
819
q13.
11G
PATC
H1
•T
0.7
3−0
.02
5.7
× 1
0−6
7.1
× 1
0−4
5.5
× 1
0−8
−0
.03
9.2
× 1
0−9
1.2
× 1
0−4
6.6
× 1
0−11
0.3
8
rs5
93
45
07
dXp
22.3
1FA
M9B
/KAL
1A
0.7
4−0
.08
0.0
18
.3 ×
10
−4
1.6
× 1
0−4
−0
.09
5.7
× 1
0−6
3.2
× 1
0−4
1.2
× 1
0−8
0.1
7
Bol
dfac
e in
dica
tes
P < 5
× 1
0−8 o
r si
te-s
peci
fic P
< 5
× 1
0−4. A
, al
lele
; β,
eff
ect
esti
mat
es;
freq
., a
llele
fre
quen
cy o
f A
. E
ffec
t es
tim
ates
are
exp
ress
ed a
s st
anda
rdiz
ed v
alue
s pe
r co
py o
f th
e S
NP
alle
le f
rom
fixe
d-ef
fect
s m
eta-
anal
ysis
. B
lack
dot
s in
the
six
fun
ctio
nal e
vide
nce
colu
mns
indi
cate
, re
spec
tive
ly,
that
the
SN
P is
an
eQTL
, th
ere
is a
kno
ckou
t m
ouse
wit
h sk
elet
al p
heno
type
s (M
ouse
Gen
ome
Info
rmat
ics
(MG
I) d
atab
ase
20
11
), t
he c
andi
date
gen
e is
invo
lved
in
a m
onog
enic
syn
drom
e w
ith
skel
etal
phe
noty
pes
(OM
IM 2
01
1),
the
mos
t si
gnifi
cant
SN
P t
ags
a S
NP
pre
dict
ed t
o ha
ve im
pact
on
func
tion
of
the
cand
idat
e ge
ne, th
e ge
ne is
the
bes
t ca
ndid
ate
in G
RA
IL a
naly
sis,
and
the
can
dida
te g
ene
is p
art
of a
bon
e-ac
tive
pat
hway
. C
andi
date
gen
es f
rom
GR
AIL
and
/or
the
liter
atur
e ar
e sh
own
if d
iffe
rent
fro
m t
he c
lose
st g
ene.
a Eff
ect
esti
mat
es w
ere
calc
ulat
ed in
the
sta
ge 2
sam
ples
. b S
ite
spec
ifici
ty n
ull h
ypot
hesi
s, β
LS-B
MD =
βFN
-BM
D.
c rs7
01
79
14
was
dis
cove
red
in t
he m
eta-
anal
ysis
of
wom
en o
nly.
The
eff
ects
and
P v
alue
for
thi
s m
arke
r ar
e fo
r th
e m
eta-
anal
ysis
of
w
omen
sam
ples
. d r
s59
34
50
7 w
as d
isco
vere
d in
the
met
a-an
alys
is o
f m
en o
nly.
The
eff
ects
and
P v
alue
for
thi
s m
arke
r ar
e fo
r th
e m
eta-
anal
ysis
of
men
sam
ples
. e r
s13
24
56
90
and
rs1
56
49
81
wer
e in
depe
nden
tly
asso
ciat
ed t
o th
eir
mai
n si
gnal
s in
co
ndit
iona
l ana
lysi
s.
npg
© 2
012
Nat
ure
Am
eric
a, In
c. A
ll rig
hts
rese
rved
.
494 VOLUME 44 | NUMBER 5 | MAY 2012 Nature GeNetics
A rt i c l e s
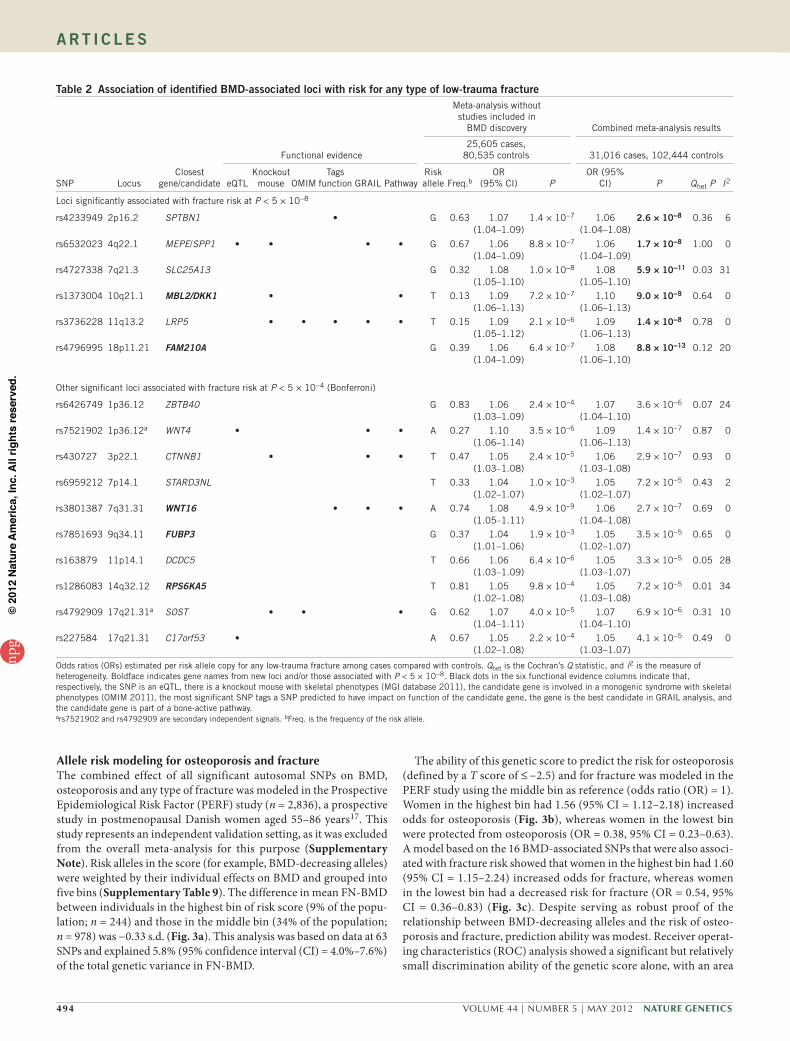
Allele risk modeling for osteoporosis and fractureThe combined effect of all significant autosomal SNPs on BMD, osteoporosis and any type of fracture was modeled in the Prospective Epidemiological Risk Factor (PERF) study (n = 2,836), a prospective study in postmenopausal Danish women aged 55–86 years17. This study represents an independent validation setting, as it was excluded from the overall meta-analysis for this purpose (Supplementary Note). Risk alleles in the score (for example, BMD-decreasing alleles) were weighted by their individual effects on BMD and grouped into five bins (Supplementary Table 9). The difference in mean FN-BMD between individuals in the highest bin of risk score (9% of the popu-lation; n = 244) and those in the middle bin (34% of the population; n = 978) was −0.33 s.d. (Fig. 3a). This analysis was based on data at 63 SNPs and explained 5.8% (95% confidence interval (CI) = 4.0%–7.6%) of the total genetic variance in FN-BMD.
The ability of this genetic score to predict the risk for osteoporosis (defined by a T score of ≤ −2.5) and for fracture was modeled in the PERF study using the middle bin as reference (odds ratio (OR) = 1). Women in the highest bin had 1.56 (95% CI = 1.12–2.18) increased odds for osteoporosis (Fig. 3b), whereas women in the lowest bin were protected from osteoporosis (OR = 0.38, 95% CI = 0.23–0.63). A model based on the 16 BMD-associated SNPs that were also associ-ated with fracture risk showed that women in the highest bin had 1.60 (95% CI = 1.15–2.24) increased odds for fracture, whereas women in the lowest bin had a decreased risk for fracture (OR = 0.54, 95% CI = 0.36–0.83) (Fig. 3c). Despite serving as robust proof of the relationship between BMD-decreasing alleles and the risk of osteo-porosis and fracture, prediction ability was modest. Receiver operat-ing characteristics (ROC) analysis showed a significant but relatively small discrimination ability of the genetic score alone, with an area
table 2 Association of identified BMD-associated loci with risk for any type of low-trauma fracture
Functional evidence
Meta-analysis without studies included in
BMD discovery Combined meta-analysis results
25,605 cases, 80,535 controls 31,016 cases, 102,444 controls
SNP LocusClosest
gene/candidate eQTLKnockout
mouse OMIMTags
function GRAIL PathwayRisk allele Freq.b
OR (95% CI) P
OR (95% CI) P Qhet P I2
Loci significantly associated with fracture risk at P < 5 × 10⁻⁸
rs4233949 2p16.2 SPTBN1 • G 0.63 1.07 (1.04–1.09)
1.4 × 10⁻⁷ 1.06 (1.04–1.08)
2.6 × 10⁻⁸ 0.36 6
rs6532023 4q22.1 MEPE/SPP1 • • • • G 0.67 1.06 (1.04–1.09)
8.8 × 10⁻⁷ 1.06 (1.04–1.09)
1.7 × 10⁻⁸ 1.00 0
rs4727338 7q21.3 SLC25A13 G 0.32 1.08 (1.05–1.10)
1.0 × 10⁻⁸ 1.08 (1.05–1.10)
5.9 × 10⁻¹¹ 0.03 31
rs1373004 10q21.1 MBL2/DKK1 • • T 0.13 1.09 (1.06–1.13)
7.2 × 10⁻⁷ 1.10 (1.06–1.13)
9.0 × 10⁻⁹ 0.64 0
rs3736228 11q13.2 LRP5 • • • • • T 0.15 1.09 (1.05–1.12)
2.1 × 10⁻⁶ 1.09 (1.06–1.13)
1.4 × 10⁻⁸ 0.78 0
rs4796995 18p11.21 FAM210A G 0.39 1.06 (1.04–1.09)
6.4 × 10⁻⁷ 1.08 (1.06–1.10)
8.8 × 10⁻¹³ 0.12 20
Other significant loci associated with fracture risk at P < 5 × 10⁻⁴ (Bonferroni)
rs6426749 1p36.12 ZBTB40 G 0.83 1.06 (1.03–1.09)
2.4 × 10⁻⁴ 1.07 (1.04–1.10)
3.6 × 10⁻⁶ 0.07 24
rs7521902 1p36.12a WNT4 • • • A 0.27 1.10 (1.06–1.14)
3.5 × 10⁻⁶ 1.09 (1.06–1.13)
1.4 × 10⁻⁷ 0.87 0
rs430727 3p22.1 CTNNB1 • • • T 0.47 1.05 (1.03–1.08)
2.4 × 10⁻⁵ 1.06 (1.03–1.08)
2.9 × 10⁻⁷ 0.93 0
rs6959212 7p14.1 STARD3NL T 0.33 1.04 (1.02–1.07)
1.0 × 10⁻³ 1.05 (1.02–1.07)
7.2 × 10⁻⁵ 0.43 2
rs3801387 7q31.31 WNT16 • • • A 0.74 1.08 (1.05–1.11)
4.9 × 10⁻⁹ 1.06 (1.04–1.08)
2.7 × 10⁻⁷ 0.69 0
rs7851693 9q34.11 FUBP3 G 0.37 1.04 (1.01–1.06)
1.9 × 10⁻³ 1.05 (1.02–1.07)
3.5 × 10⁻⁵ 0.65 0
rs163879 11p14.1 DCDC5 T 0.66 1.06 (1.03–1.09)
6.4 × 10⁻⁶ 1.05 (1.03–1.07)
3.3 × 10⁻⁵ 0.05 28
rs1286083 14q32.12 RPS6KA5 T 0.81 1.05 (1.02–1.08)
9.8 × 10⁻⁴ 1.05 (1.03–1.08)
7.2 × 10⁻⁵ 0.01 34
rs4792909 17q21.31a SOST • • • G 0.62 1.07 (1.04–1.11)
4.0 × 10⁻⁵ 1.07 (1.04–1.10)
6.9 × 10⁻⁶ 0.31 10
rs227584 17q21.31 C17orf53 • A 0.67 1.05 (1.02–1.08)
2.2 × 10⁻⁴ 1.05 (1.03–1.07)
4.1 × 10⁻⁵ 0.49 0
Odds ratios (ORs) estimated per risk allele copy for any low-trauma fracture among cases compared with controls. Qhet is the Cochran’s Q statistic, and I2 is the measure of heterogeneity. Boldface indicates gene names from new loci and/or those associated with P < 5 × 10⁻⁸. Black dots in the six functional evidence columns indicate that, respectively, the SNP is an eQTL, there is a knockout mouse with skeletal phenotypes (MGI database 2011), the candidate gene is involved in a monogenic syndrome with skeletal phenotypes (OMIM 2011), the most significant SNP tags a SNP predicted to have impact on function of the candidate gene, the gene is the best candidate in GRAIL analysis, and the candidate gene is part of a bone-active pathway.ars7521902 and rs4792909 are secondary independent signals. bFreq. is the frequency of the risk allele.
npg
© 2
012
Nat
ure
Am
eric
a, In
c. A
ll rig
hts
rese
rved
.

Nature GeNetics VOLUME 44 | NUMBER 5 | MAY 2012 495
A rt i c l e s
under the curve (AUC) of 0.59 (95% CI = 0.56–0.62) for osteoporosis (Supplementary Fig. 8). Adding this score to a model with age and weight alone (AUC = 0.75, 95% CI = 0.73–0.77) did not substantially increase discrimination (AUC = 0.76, 95% CI = 0.74–0.78). A similar pattern was observed for fracture discrimination, with AUCs of 0.57 (95% CI = 0.55–0.59) in a model with the score alone and 0.62 (95% CI = 0.60–0.64) in a model with age, weight and height. A model considering all 63 SNPs did not change the AUC for fracture risk prediction (0.57, 95% CI = 0.54–0.59).
Functional annotations and pathway analysesFor the purpose of fine mapping and identifying additional SNPs with putative functional implication using linkage disequilibrium (LD), a subset of nine discovery studies (FN-BMD, n = 21,699; LS-BMD, n = 20,835) used 1000 Genomes Project data (Release June 2010) to re-impute genotypes at the 55 autosomal BMD loci (Supplementary Note). In 13 of the 55 BMD-associated loci (the SNP on the X chromo-some was not included), we identified markers in the surrounding 1-Mb region that were imputed from 1000 Genomes Project data and that were more significant than the original HapMap signals (Supplementary Tables 10 and 11), highlighting the benefit of using a denser reference panel of markers. All HapMap markers in LD with variants with functional annotation and showing higher significance in the 1000 Genomes Project meta-analysis are shown (Supplementary Table 12). In 14 of the 56 identified BMD-associated loci, a marker from HapMap imputation was highly correlated (r 2 > 0.8) with at least one putative functional variant annotated in the 1000 Genomes Project reference. Three of the 14 BMD-associated loci that also asso-ciated with fracture contained putative functional variants tagged by
the top SNPs of the BMD meta-analysis. These included the known rs3736228 functional marker in LRP5 (encoding p.Ala1330Val)16,18, the intronic marker rs3779381 within a promoter and/or regulatory region of WNT16 and one intronic marker (rs4305309) within a pro-moter and/or regulatory region of SPTBN1.
Expression profiles at the BMD loci associated with genome-wide significance were analyzed within four data sets (Supplementary Note). In transiliac bone biopsies, expression of five genes correlated with LS-BMD and/or FN-BMD of the donors with P < 0.001, includ-ing PSME4 (2p16.2), DKK1 (10q21.1), MIR22HG (also known as C17orf91; 17p13.3), SOST (17q21.31_1) and DUSP3 (17q21.31_1) (Supplementary Table 13). Among these loci, the SNP at DKK1 (10q21.1) was the most significantly correlated with FN-BMD (P = 1.3 × 10⁻⁵) and LS-BMD (P = 3.2 × 10⁻⁴). Variants in all these BMD-associated loci (with the exception of MIR22HG at 17p13.3) were also associated with fractures.
SNP expression quantitative trait locus (eQTL) analyses were per-formed across diverse tissues, examining the correlation between marker alleles and transcript levels at the associated BMD loci. Fourteen of the BMD-associated SNPs correlated with the expression of one or more of the nearby genes with P < 5 × 10⁻⁵ and were either the strongest cis variants or were good surrogates of these for the affected genes (Supplementary Tables 14 and 15). The most significant BMD-associated SNP eQTL was observed for rs10835187[T], resulting in reduced expression of the LIN7C gene at the 11p14.1 locus (P = 2.8 × 10−39 in adipose tissue). Of particular interest were BMD-associated SNP cis variants at three loci that were also associated with fracture, including 1p36.12, 4q22.1 and 17q21.31. At 1p36.12, rs6426749[G] correlated with reduced WNT4 expression in fibroblasts, osteoblasts
rs7851693 (9q34)
rs227584 (17q21)
rs163879 (11p14)
rs6959212 (7p14)
rs430727 (3p22)
rs1286083 (14q32)
rs4233949 (2p16)
rs6532023 (4q22)
rs3801387 (7q31)
rs4792909* (7q21)
rs6426749 (1p36)
rs4727338 (7q21)
rs3736228 (11q13)
rs7521902* (1p36)
rs1373004 (10q21)
rs4796995 (18p11)
rs2062377 (OPG)**
rs884205 (RANK)**
rs9533090 (RANKL)**
1.00 1.05 1.10
Effect estimate
1.15 1.20
a b
10 100
Recom
bination rate (cM/M
b)
18p11
rs4796995
C18orf1 RNMT
C18orf19 MC2R
ZNF519
MC5R
Pfracture = 8.8 × 10⁻¹³
PBMD 1+2 = 4 × 10⁻⁸
PBMD 1 = 3 × 10⁻⁶
–log
10 (
P v
alue
) 8
6
4
2
0
80
60
40
20
13.5 14.0
Position on chr. 18 (Mb)
0
r2
0.80.60.40.2
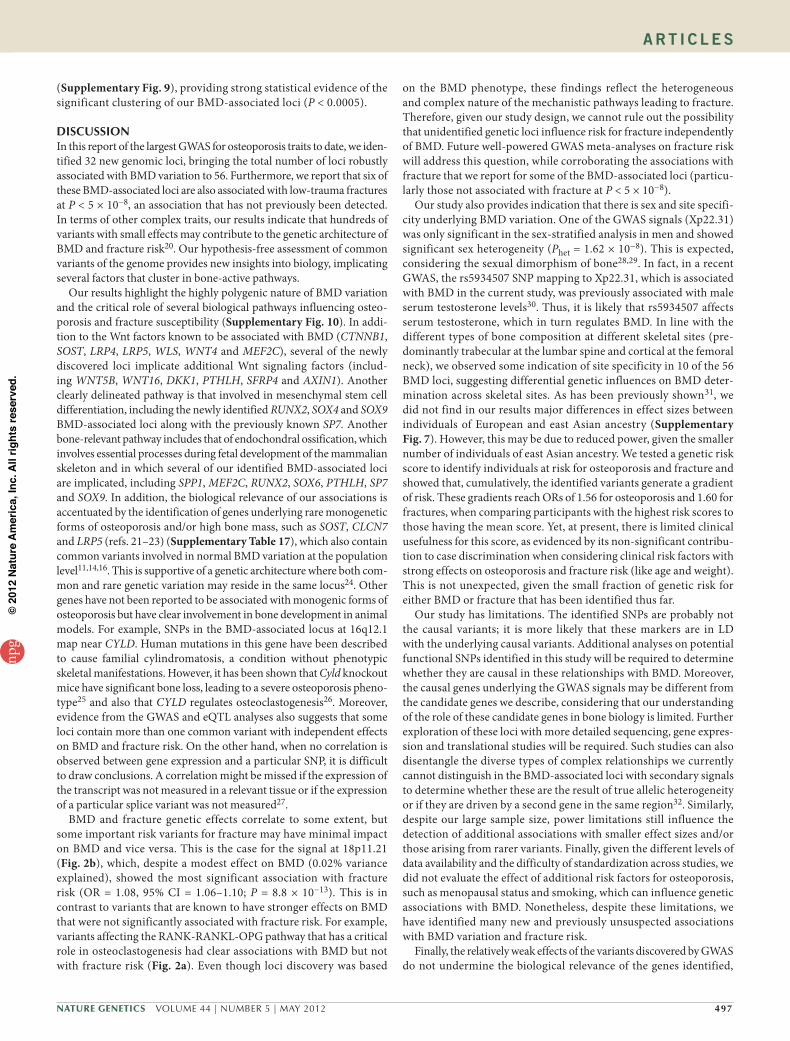
Figure 2 Association of BMD loci with fracture risk. (a) Phenotype-wide effects for the BMD loci associated with fracture and those that are part of the RANK-RANKL-OPG pathway. Genetic effect estimates are shown for fracture (blue circles), LS-BMD (yellow squares) and FN-BMD (green diamonds) for the 14 loci associated with fracture risk. Horizontal lines represent 95% confidence limits. Effect estimates are shown after transformation of the standardized mean difference (SMD) in the BMD effect to odds ratio equivalents34 (for example, a 0.02 SMD in the BMD effect corresponds to an OR of 1.04). Secondary signals for rs227584 and rs6426749 are marked with an asterisk and the signals mapping to the TNFRSF11B (also known as OPG; rs2062377), TNFRSF11A (also known as RANK; rs884205) and TNFSF11 (also known as RANKL; rs9533090) genes are marked with a double asterisk. (b) Regional association plot for the 18p11.21 locus showing the P value for the top SNP associated with fracture (rs4796995) together with P values from the BMD discovery set (stage 1) and combined with the BMD replication (stage 1 + 2). SNPs are plotted by position in a 500-kb window of chromosome 18 against association with FN-BMD (−log10 (P value)). Estimated recombination rates (from HapMap) are plotted in cyan to reflect the local LD structure. SNPs surrounding the most significant SNP are color-coded according to LD between these markers (pairwise r 2). Genes, exons and transcription direction are derived from the UCSC Genome Browser.
npg
© 2
012
Nat
ure
Am
eric
a, In
c. A
ll rig
hts
rese
rved
.

496 VOLUME 44 | NUMBER 5 | MAY 2012 Nature GeNetics
A rt i c l e s
and adipose tissue; at 4q22.1, rs6532023[G] correlated with reduced SPP1 (encoding osteopontin) expression in adipose tissue; and, at 17q21.31, rs227584[A] correlated with increased C17orf65 expression in monocytes, adipose tissue, whole blood and lymphoblasts.
We applied the Gene Relationships Across Implicated Loci (GRAIL) text-mining algorithm19 to investigate connections between genes in the 55 autosomal BMD-associated loci. This analysis revealed significant (P < 0.01) connections between genes in 18 of
the 55 input loci (Fig. 4 and Supplementary Table 16). The strongest connections were seen for members of three key biological pathways: the RANK-RANKL-OPG path-way (encoded by TNFRSF11A, TNFSF11 and TNFRSF11B, respectively); mesenchymal stem cell differentiation (RUNX2, SP7 and SOX9); and Wnt signaling (LRP5, CTNNB1, SFRP4, WNT3, WNT4, WNT5B, WNT16 and AXIN1), with the ten most frequently connecting terms being bone, catenin, sig-naling, differentiation, rank, osteoblast, diacylglycerol, kappab, development and osteoclast. To assess the significance of this biological gene connection enrichment, we applied GRAIL to 2,000 randomly matched sets of 55 SNPs (Supplementary Note) and did not observe any set with 15 or more loci with significantly enriched connectivity
rs2016266
AM
HR
2
MEP
E
LRP
5
TNF
RS
F11
B
TNF
RS
F11
A
TNF
SF
11
PTHLH
RUNX2
WNT4
WNT16
WNT3
WN
T5B
CTN
NB
1
FO
XL1
AXIN
1
SFRP4
SOX9
SOX6
SP7
rs65
3202
3
rs37
3622
8
rs20
6237
7
rs88
4205
rs95
3309
0
rs79
5352
8
rs11755164
rs6426749
rs3801387
rs1864325
rs2887571
rs430727
rs10048146
rs9921222
rs6959212
rs7217932
rs7108738
Figure 4 Graphic representation of GRAIL connections between SNPs and corresponding genes for the 18 SNPs, as determined with GRAIL P < 0.01. The top ten keywords linking the genes were bone, catenin, signaling, differentiation, rank, osteoblast, diacylglycerol, kappab, development and osteoclast. Thicker redder lines imply stronger literature-based connectivity. Blue and black boxes depict loci boundaries represented for each top-associated marker (outer circle) and for each gene in the region (inner circle).
a b c1,200 0.8
Num
ber
of in
divi
dual
s FN
-BM
D Z
score
1,000
800
600
400
200
<44(n = 247)
44–48(n = 672)
48–52(n = 978)
Genetic score
52–56(n = 695)
≥56(n = 244)
0
0.6
0.4
0.2
0
–0.2
–0.4
–0.6
2.2
Num
ber
of in
divi
dual
sO
dds ratio for osteoporosis<44
(n = 247)44–48
(n = 672)48–52
(n = 978)
Genetic score
52–56(n = 695)
≥56(n = 244)
1,200
1,000
800
600
400
200
0
2.0
1.8
1.6
1.4
1.2
1.0
0.8
0.6
0.4
0.2
0
3.0
Num
ber
of in
divi
dual
s Odds ratio for fracture
<36(n = 160)
36–45(n = 649)
45–54(n = 1,190)
Genetic score
54–63(n = 670)
≥63(n = 167)
1,200
1,000
800
600
400
200
0
2.8
2.6
2.4
2.2
2.0
1.8
1.6
1.4
1.2
1.0
0.8
0.6
0.4
0.2
0
Figure 3 Combined effect of BMD-decreasing alleles and fracture risk–increasing risk alleles modeled in the population-based PERF study (n = 2,836 women). (a–c) Effects are shown for baseline FN-BMD standardized residuals (Z scores) (a), risk for osteoporosis (b) and risk for any type of fracture (c). The genetic score of each individual in a and b was based on the 63 SNPs showing genome-wide significant association with BMD (55 main and 8 secondary signals) and in c was based on the 16 BMD SNPs associated with fracture. Both genetic scores are weighted for relative effect sizes estimated without the PERF study. Weighted allele counts summed for each individual were divided by the mean effect size, making them equivalent to the percent of alleles carried by each individual, and sorted into five bins. Histograms show the numbers of individuals in each genetic score category (left y axis). Diamonds (right y axis) represent mean FN-BMD standardized levels in a, risk estimates in the form of odds ratios and osteoporosis (defined as NHANES T score of ≤ –2.5) in b and any type of fracture in c, using the middle category as reference (OR = 1). Vertical lines represent 95% confidence limits.
npg
© 2
012
Nat
ure
Am
eric
a, In
c. A
ll rig
hts
rese
rved
.
Nature GeNetics VOLUME 44 | NUMBER 5 | MAY 2012 497
A rt i c l e s
(Supplementary Fig. 9), providing strong statistical evidence of the significant clustering of our BMD-associated loci (P < 0.0005).
DISCUSSIONIn this report of the largest GWAS for osteoporosis traits to date, we iden-tified 32 new genomic loci, bringing the total number of loci robustly associated with BMD variation to 56. Furthermore, we report that six of these BMD-associated loci are also associated with low-trauma fractures at P < 5 × 10⁻⁸, an association that has not previously been detected. In terms of other complex traits, our results indicate that hundreds of variants with small effects may contribute to the genetic architecture of BMD and fracture risk20. Our hypothesis-free assessment of common variants of the genome provides new insights into biology, implicating several factors that cluster in bone-active pathways.
Our results highlight the highly polygenic nature of BMD variation and the critical role of several biological pathways influencing osteo-porosis and fracture susceptibility (Supplementary Fig. 10). In addi-tion to the Wnt factors known to be associated with BMD (CTNNB1, SOST, LRP4, LRP5, WLS, WNT4 and MEF2C), several of the newly discovered loci implicate additional Wnt signaling factors (includ-ing WNT5B, WNT16, DKK1, PTHLH, SFRP4 and AXIN1). Another clearly delineated pathway is that involved in mesenchymal stem cell differentiation, including the newly identified RUNX2, SOX4 and SOX9 BMD-associated loci along with the previously known SP7. Another bone-relevant pathway includes that of endochondral ossification, which involves essential processes during fetal development of the mammalian skeleton and in which several of our identified BMD-associated loci are implicated, including SPP1, MEF2C, RUNX2, SOX6, PTHLH, SP7 and SOX9. In addition, the biological relevance of our associations is accentuated by the identification of genes underlying rare monogenetic forms of osteoporosis and/or high bone mass, such as SOST, CLCN7 and LRP5 (refs. 21–23) (Supplementary Table 17), which also contain common variants involved in normal BMD variation at the population level11,14,16. This is supportive of a genetic architecture where both com-mon and rare genetic variation may reside in the same locus24. Other genes have not been reported to be associated with monogenic forms of osteoporosis but have clear involvement in bone development in animal models. For example, SNPs in the BMD-associated locus at 16q12.1 map near CYLD. Human mutations in this gene have been described to cause familial cylindromatosis, a condition without phenotypic skeletal manifestations. However, it has been shown that Cyld knockout mice have significant bone loss, leading to a severe osteoporosis pheno-type25 and also that CYLD regulates osteoclastogenesis26. Moreover, evidence from the GWAS and eQTL analyses also suggests that some loci contain more than one common variant with independent effects on BMD and fracture risk. On the other hand, when no correlation is observed between gene expression and a particular SNP, it is difficult to draw conclusions. A correlation might be missed if the expression of the transcript was not measured in a relevant tissue or if the expression of a particular splice variant was not measured27.
BMD and fracture genetic effects correlate to some extent, but some important risk variants for fracture may have minimal impact on BMD and vice versa. This is the case for the signal at 18p11.21 (Fig. 2b), which, despite a modest effect on BMD (0.02% variance explained), showed the most significant association with fracture risk (OR = 1.08, 95% CI = 1.06–1.10; P = 8.8 × 10⁻¹³). This is in contrast to variants that are known to have stronger effects on BMD that were not significantly associated with fracture risk. For example, variants affecting the RANK-RANKL-OPG pathway that has a critical role in osteoclastogenesis had clear associations with BMD but not with fracture risk (Fig. 2a). Even though loci discovery was based
on the BMD phenotype, these findings reflect the heterogeneous and complex nature of the mechanistic pathways leading to fracture. Therefore, given our study design, we cannot rule out the possibility that unidentified genetic loci influence risk for fracture independently of BMD. Future well-powered GWAS meta-analyses on fracture risk will address this question, while corroborating the associations with fracture that we report for some of the BMD-associated loci (particu-larly those not associated with fracture at P < 5 × 10⁻⁸).
Our study also provides indication that there is sex and site specifi-city underlying BMD variation. One of the GWAS signals (Xp22.31) was only significant in the sex-stratified analysis in men and showed significant sex heterogeneity (Phet = 1.62 × 10⁻⁸). This is expected, considering the sexual dimorphism of bone28,29. In fact, in a recent GWAS, the rs5934507 SNP mapping to Xp22.31, which is associated with BMD in the current study, was previously associated with male serum testosterone levels30. Thus, it is likely that rs5934507 affects serum testosterone, which in turn regulates BMD. In line with the different types of bone composition at different skeletal sites (pre-dominantly trabecular at the lumbar spine and cortical at the femoral neck), we observed some indication of site specificity in 10 of the 56 BMD loci, suggesting differential genetic influences on BMD deter-mination across skeletal sites. As has been previously shown31, we did not find in our results major differences in effect sizes between individuals of European and east Asian ancestry (Supplementary Fig. 7). However, this may be due to reduced power, given the smaller number of individuals of east Asian ancestry. We tested a genetic risk score to identify individuals at risk for osteoporosis and fracture and showed that, cumulatively, the identified variants generate a gradient of risk. These gradients reach ORs of 1.56 for osteoporosis and 1.60 for fractures, when comparing participants with the highest risk scores to those having the mean score. Yet, at present, there is limited clinical usefulness for this score, as evidenced by its non-significant contribu-tion to case discrimination when considering clinical risk factors with strong effects on osteoporosis and fracture risk (like age and weight). This is not unexpected, given the small fraction of genetic risk for either BMD or fracture that has been identified thus far.
Our study has limitations. The identified SNPs are probably not the causal variants; it is more likely that these markers are in LD with the underlying causal variants. Additional analyses on potential functional SNPs identified in this study will be required to determine whether they are causal in these relationships with BMD. Moreover, the causal genes underlying the GWAS signals may be different from the candidate genes we describe, considering that our understanding of the role of these candidate genes in bone biology is limited. Further exploration of these loci with more detailed sequencing, gene expres-sion and translational studies will be required. Such studies can also disentangle the diverse types of complex relationships we currently cannot distinguish in the BMD-associated loci with secondary signals to determine whether these are the result of true allelic heterogeneity or if they are driven by a second gene in the same region32. Similarly, despite our large sample size, power limitations still influence the detection of additional associations with smaller effect sizes and/or those arising from rarer variants. Finally, given the different levels of data availability and the difficulty of standardization across studies, we did not evaluate the effect of additional risk factors for osteoporosis, such as menopausal status and smoking, which can influence genetic associations with BMD. Nonetheless, despite these limitations, we have identified many new and previously unsuspected associations with BMD variation and fracture risk.
Finally, the relatively weak effects of the variants discovered by GWAS do not undermine the biological relevance of the genes identified,
npg
© 2
012
Nat
ure
Am
eric
a, In
c. A
ll rig
hts
rese
rved
.
498 VOLUME 44 | NUMBER 5 | MAY 2012 Nature GeNetics
A rt i c l e s
as exemplified by the identification of genetic signals at genes coding for proteins currently targeted by new osteoporosis treatments (Supplementary Fig. 10). The new genes identified in our study may represent new candidates to target for osteoporosis drug discovery. Most established treatments for osteoporosis focus on curtailing bone resorption (for example, bisphosphonates and RANKL inhibitors), whereas only a few anabolic treatments are currently approved for the treatment of osteoporosis (recombinant truncated or altered PTH). Other anabolic compounds undergoing Phase 2 development include PTHrP fragments and Wnt signaling enhancers, such as antibodies to sclerostin33. Several of the variants robustly associated with BMD map in or close to genes that encode proteins involved in these pharma-cologic pathways, namely TNFRSF11B (encoding osteoprotegerin), TNFRSF11A (encoding RANK), TNFSF11 (encoding RANKL), PTHLH (encoding PTHrP), LRP5 (encoding low-density lipoprotein receptor–related protein 5), SOST (encoding sclerostin) and DKK1 (encoding Dickkopf-1).
In conclusion, these findings highlight the highly polygenic and complex nature of BMD variation, shed light on the pathophysio-logical mechanisms underlying fracture susceptibility and may con-tribute to the identification of future drug targets for the treatment of osteoporosis.
URLs. GEFOS Consortium, http://www.gefos.org/; GENOMOS Consortium, http://www.genomos.eu/; HapMap Project, http://hapmap. ncbi.nlm.nih.gov/; 1000 Genomes Project, http://www.1000genomes.org/; LocusZoom, http://csg.sph.umich.edu/locuszoom/; METAL, http://www.sph.umich.edu/csg/abecasis/Metal/.
METHODSMethods and any associated references are available in the online version of the paper at http://www.nature.com/naturegenetics/.
Note: Supplementary information is available on the Nature Genetics website.
AcknowledgmentsWe thank all study participants for making this work possible. This research and the Genetic Factors for Osteoporosis (GEFOS) consortium have been funded by the European Commission (HEALTH-F2-2008-201865-GEFOS). We acknowledge funding from the following organizations: the US National Institutes of Health (NIH; R01 AG18728, R01 HL088119, R01AR046838, U01 HL084756, P30 DK072488, T32 AG000262, F32 AR059469, P01 AG-18397, R01 AG041517, M01 RR-00750 and N01-AG-12100), the NIA Intramural Research Program (AG-023629, AG-15928, AG-20098 and AG-027058), Hjartavernd (the Icelandic Heart Association), the Althingi (the Icelandic Parliament), the Australian National Health and Medical Research Council (511132), the Australian Cancer Research Foundation and the Rebecca Cooper Foundation, the Australian National Health and Medical Research Council Career Development Award (569807 to E.L.D.), an MRC New Investigator Award (MRC G0800582 to D.M.E.), the Health Research Council of New Zealand, Sanofi-Aventis, Eli Lilly, Pfizer, Proctor & Gamble Pharmaceuticals, Roche, the Medical Benefits Fund (MBF) Living Well Foundation, the Ernst Heine Family Foundation, Arthritis Research UK (17539 and 15389), The Victorian Health Promotion Foundation, Geelong Region Medical Research Foundation, Australia (628582), Action Research UK, the European Commission (QLRT-2001-02629), the UK Food Standards Agency, BioPersMed (COMET K-project 825329), the Austrian Federal Ministry of Transport, Innovation and Technology (BMVIT), the Austrian Federal Ministry of Economics and Labour (BMWA), the Austrian Federal Ministry of Economy, Family and Youth (BMWFJ), the Styrian Business Promotion Agency (SFG), the Red de Envejecimiento y Fragilidad (RETICEF), Instituto Carlos III, the Spanish Ministry of Education and Science (SAF2010-15707), the Government of Catalonia (2009SGR971 and 2009SGR818), Instituto de Salud Carlos III–Fondo de Investigaciones Sanitarias (PI 06/0034 and PI08/0183), Healthway Health Promotion Foundation of Western Australia, Australasian Menopause Society and the Australian National Health and MRC Project (254627, 303169 and 572604), the Finnish Ministry of Education, Merck Frosst Canada, Eli Lilly Canada, Novartis Pharmaceuticals, Procter & Gamble Pharmaceuticals Canada, Servier Canada,
Amgen Canada, The Dairy Farmers of Canada, The Arthritis Society, the US National Heart, Lung, and Blood Institute (NHLBI; N01-HC-85239, N01-HC-85079 through N01-HC-85086; N01-HC-35129, N01 HC-15103, N01 HC-55222, N01-HC-75150, N01-HC-45133, HL080295, HL075366, HL087652, HL105756 NINDS, HL 043851 and HL69757, CA 047988, and the Framingham Heart Study (N01-HC-25195) and its contract with Affymetrix, Inc, for genotyping services (N02-HL-6-4278)). Untied Educational Grants were provided by Amgen, Eli Lilly International, GE-Lunar, Merck Australia, Sanofi-Aventis Australia and Servier. Additional support was provided by the US National Center for Research Resources (M01-RR00425 to the Cedars-Sinai General Clinical Research Center Genotyping Core), the US National Institute of Diabetes and Digestive and Kidney Diseases (DK063491 to the Southern California Diabetes Endocrinology Research Center), deCODE Genetics, The UK National Institute for Medical Research (NIMR) Biomedical Research Centre, the Cancer Research Campaign, the Stroke Association, the British Heart Foundation, the UK Department of Health, the Europe Against Cancer Programme Commission of the European Union, the Ministry of Agriculture, Fisheries and Food, EU Biomed 1 (BMHICT920182, CIPDCT925012, ERBC1PDCT 940229 and ERBC1PDCT930105), the UK MRC (G9321536 and G9800062), the Wellcome Trust Collaborative Research Initiative 1995, MAFF AN0523, EU Framework Programme 5 (FP5; QLK6-CT-2002-02629), the Food Standards Agency (N05046), the Netherlands Organization for Scientific Research (NWO), Erasmus University Medical Center, the Centre for Medical Systems Biology (CMSB1 and CMSB2) of the Netherlands Genomics Initiative (NGI), the F.I.R.M.O. Fondazione Raffaella Becagli, the National Institute for Arthritis, Musculoskeletal and Skin Diseases, the National Institute on Aging (R01 AR/AG 41398, N01AG62101, N01AG62103, N01AG62106, 1R01AG032098 and R01 AR 050066), the Canadian Institutes for Health Research (86748), Federal Program of the Ministry of Education and Science of the Russian Federation Scientific and Pedagogical Staff of Innovative Russia in 2009–2013 (P-601), the Federal Program Research and Development of Prior Directions of Scientific-Technological Complex of Russia in 2007–2012 (16.512.11.2032), the Swedish Research Council (K2010-54X-09894-19-3, 2006-3832, K2010-52X-20229-05-3 and K20006-72X-20155013) the Swedish Foundation for Strategic Research, the ALF/LUA research grant in Gothenburg, the Lundberg Foundation, the Torsten and Ragnar Söderberg’s Foundation, the Västra Götaland Foundation, the Göteborg Medical Society, the Novo Nordisk foundation, University of Athens, Greece (Kapodistrias 2009), the UK NIHR Musculoskeletal BRU Oxford, the UK NIHR Nutrition BRU Southampton, The Center for Inherited Disease Research (CIDR), National Institutes of Health (HHSN268200782096C), the Hong Kong Research Grant Council (HKU 768610M), The Bone Health Fund of the HKU Foundation, The KC Wong Education Foundation, Small Project Funding (201007176237), Matching Grant, Committee of Research and Conference Grants (CRCG) Grant, the Osteoporosis and Endocrine Research Fund, the Genomics Strategic Research Theme of The University of Hong Kong, Chinese University of Hong Kong, the Korea Health 21 Research & Development Project, the Korean Ministry of Health & Welfare, Republic of Korea (A010252), the Korea Healthcare Technology Research & Development Project, the Ministry for Health, Welfare and Family Affairs (A110536), The Netherlands Ministry of Health, Welfare and Sports Directorate of Long-Term Care, the World Anti-Doping Agency, the Danish Ministry of Culture, the Institute of Clinical Research of the University of Southern Denmark, the Chief Scientists Office of the Scottish Government (CZB/4/276), a Royal Society University Research Fellowship (to J.F.W.), the European Union Framework Program 6 EUROSPAN project (LSHG-CT-2006-018947), the European Union’s Seventh Framework Programme (FP7/2007-2013; HEALTH-F2-2009-223004 PHASE), the Netherlands Organization of Scientific Research NWO Investments (175.010.2005.011 and 911-03-012), the Research Institute for Diseases in the Elderly (RIDE2; 014-93-015), the Netherlands Genomics Initiative/Netherlands Consortium for Healthy Aging (050-060-810), the German Bundesministerium fuer Forschung und Technology (01 AK 803 A-H and 01 IG 07015 G), the NIHR Biomedical Research Centre (grant to Guys’ and St. Thomas’ Hospitals and King’s College London), the Chronic Disease Research Foundation, the Canadian Institutes of Health Research, the Canadian Foundation for Innovation, the Fonds de la Recherche en Santé Québec, The Lady Davis Institute, the Jewish General Hospital, the Ministère du Développement Economique, de l’Innovation et de l’Exportation du Quebec, the Swedish Sports Research Council (87/06), the Swedish Society of Medicine, the Kempe Foundation (JCK-1021), the Medical Faculty of Umeå University (ALFVLL:968:22-2005, ALFVL:-937-2006, ALFVLL:223:11-2007 and ALFVLL:78151-2009), the County Council of Västerbotten (Spjutspetsanslag; VLL:159:33-2007), the US National Cancer Institute, the Donald W. Reynolds Foundation, the Fondation Leducq, the Academy of Finland (126925, 121584, 124282, 129378 (Salve), 117787 (Gendi) and 41071 (Skidi)), the Social Insurance Institution of Finland, Kuopio, Tampere and Turku University Hospital Medical Funds (9M048 for TeLeht), the Juho Vainio Foundation, the Paavo Nurmi Foundation, the Finnish Foundation of
npg
© 2
012
Nat
ure
Am
eric
a, In
c. A
ll rig
hts
rese
rved
.

Nature GeNetics VOLUME 44 | NUMBER 5 | MAY 2012 499
A rt i c l e s
Cardiovascular Research, the Finnish Cultural Foundation, the Tampere Tuberculosis Foundation and the Emil Aaltonen Foundation (K08AR055688 to T.L.). A detailed list of acknowledgments by study is given in the Supplementary Note. The members of the GEFOS Consortium mourn the passing of co-author Philip Neil Sambrook, a good friend, respected colleague and outstanding research scientist in the prevention, treatment, epidemiology and genetics of osteoporosis.
AUtHoR contRIBUtIonsThis work was done under the auspices of the European Commission–sponsored Genetic Factors for Osteoporosis (GEFOS) consortium.
Study-specific design and management were performed by U.S., M.A., L.M., J.P., S.B., M.L.B., B.M.B., C. Christiansen, C. Cooper, G.D., I.F., M.F., D.G., J.G.-M., M. Kähönen, M. Karlsson, J.-M.K., P.K., B.L.L., W.D.L., P.L., Ö.L., R.S.L., J.M., D.M., J.M.O., U.P.-K., J.A.R., P.M.R., F. Rousseau, P.E.S., N.L.S.T., R.U., W.V.H., J.V., M.T.Z., K.M.G., T.P., D.I.C., S.R.C., R.E., J.A.E., V.G., A.H., R.D.J., G.J., J.W.J., K.-T.K., T.L., M. Lorentzon, E.M., B.D.M., G.C.N., M.P., H.A.P.P., R.L.P., O.R., I.R.R., P.N.S., P.C.S., A.R.S., F.A.T., C.M.v.D., N.J.W., L.A.C., M.J.E., T.B.H., A.W.C.K., B.M.P., J. Reeve, T.D.S., E.A.S., M.C.Z., U.T., C.O., J.B.R., M.A.B., K. Stefansson, A.G.U., S.H.R., J.P.A.I., D.P.K. and F. Rivadeneira. Study-specific genotyping was performed by K.E., U.S., E.L.D., L.O., L.V., S.-M.X., A.K.A., D.J.D., S.G., R.K., C.K., A.Z.L., J.R.L., S.M., S.M.-B., S.S., S.T., O.T., S.C., E.K., J.M., B.O.-P., Y.S.A., E.G., L.H., H.J., T. Kwan, R. Luben, C.M.-G., S.T.P., S. Reppe, J.I.R., J.B.J.v.M., D.V., K.M.G., D.I.C., G.R.C., P.D., R.D.J., T.L., Y.L., M. Lorentzon, R.L.P., N.J.W., L.A.C., C.O., M.A.B., A.G.U. and F. Rivadeneira. Study-specific phenotyping was performed by U.S., E.L.D., O.M.E.A., A.M., S.-M.X., N. Alonso, S.K.K., S.G.W., A.K.A., T.A., J.R.C., Z.D., N.G.-G., S.G., G.H., L.B.H., K.A.J., G.K., G.S.K., C.K., T. Koromila, M. Kruk, M. Laaksonen, A.Z.L., S.H.L., P.C.L., L.M., X.N., J.P., L.M.R., K. Siggeirsdottir, O.S., N.M.v.S., J.W., K.Z., M.L.B., C. Christiansen, M.F., M. Kähönen, M. Karlsson, J.-M.K., Ö.L., J.M., D.M., B.O.-P., J.M.O., U.P.-K., D.M.R., J.A.R., P.M.R., F. Rousseau, W.V.H., J.V., M.C.-B., E.G., T.I., R. Luben, S. Reppe, G.S., J.B.J.v.M., D.V., F.M.K.W., K.M.G., J.A.C., D.I.C., E.M.D., R.E., J.A.E., V.G., A.H., R.D.J., G.J., Y.L., M. Lorentzon, E.M., G.C.N., B.A.O., M.P., H.A.P.P., R.L.P., O.R., I.R.R., J. Robbins, P.N.S., C.M.v.D., M.J.E., J. Reeve, E.A.S., M.C.Z., C.O., M.A.B., A.G.U., D.P.K. and F. Rivadeneira. Study-specific data analysis were performed by K.E., U.S., E.E., Y.-H.H., E.L.D., E.E.N., L.O., O.M.E.A., N. Amin, J.P.K., D.L.K., G.L., C.L., R.L.M., A.M., L.V., D.W., S.-M.X., L.M.Y.-A., H.-F.Z., J.E., C.M.K., S.K.K., P.J.L., G.T., J.F.W., V.A., A.K.A., T.A., J.R.C., G.H., L.J.H., C.K., T. Koromila, A.Z.L., S.M.-B., T.V.N., M.S.P., J.P., L.M.R., A.V.S., O.S., S.T., S.C., J.M., B.O.-P., U.P.-K., R. Li, R. Luben, S. Reppe, J.I.R., A.R.W., Y.Z., S. Raychaudhuri, D.I.C., J.A.E., R.D.J., T.L., K.N., O.R., D.M.E., D.K., J.B.R., M.A.B., J.P.A.I., D.P.K. and F. Rivadeneira. Analysis plan design was performed by K.E., E.E., U.S., D.K., D.P.K., J.P.A.I. and F. Rivadeneira. K.E., E.E., Y.-H.H. and E.E.N. carried out meta-analyses. K.E., E.E. and A.R.W. determined gene-by-gene interaction. Risk modeling and analysis of secondary signals were performed by K.E. and F. Rivadeneira. Expression QTLs were analyzed by U.S., G.T., E.G., S. Reppe, K.M.G. and T.P. Y.-H.H. performed functional SNP prediction. GRAIL was carried out by K.E., E.L.D., D.W. and S. Raychaudhuri. Standardization of phenotype and genotype replication data sets was performed by K.E., U.S., E.E., E.L.D., L.O., G.T., L.H. and C.M.-G. Interpretation of results was carried out by K.E., U.S., E.E., Y.-H.H., E.L.D., E.E.N., L.O., O.M.E.A., N. Amin, D.L.K., C.-T.L., R.L.M., A.M., L.V., D.W., S.-M.X., L.M.Y.-A., J.E., C.M.K., S.K.K., A.W.C.K., J. Reeve, M.C.Z., C.O., D.K., J.B.R., M.A.B., A.G.U., S.H.R., J.P.A.I., D.P.K. and F. Rivadeneira. The manuscript draft was prepared by K.E., U.S., E.E., Y.-H.H., E.L.D., E.E.N., L.O., O.M.E.A., A.M., C.O., D.K., J.B.R., M.A.B., A.G.U., S.H.R., J.P.A.I., D.P.K. and F. Rivadeneira. The steering committee for GEFOS includes U.S., E.E., U.T., A.G.U., S.H.R., J.P.A.I. and F. Rivadeneira.
comPetIng FInAncIAl InteRestsThe authors declare competing financial interests: details accompany the full-text HTML version of the paper at http://www.nature.com/naturegenetics/.
Published online at http://www.nature.com/naturegenetics/. Reprints and permissions information is available online at http://www.nature.com/reprints/index.html.
1. Burge, R. et al. Incidence and economic burden of osteoporosis-related fractures in the United States, 2005–2025. J. Bone Miner. Res. 22, 465–475 (2007).
2. Johnell, O. et al. Predictive value of BMD for hip and other fractures. J. Bone Miner. Res. 20, 1185–1194 (2005).
3. Kanis, J.A. et al. The use of clinical risk factors enhances the performance of BMD in the prediction of hip and osteoporotic fractures in men and women. Osteoporos. Int. 18, 1033–1046 (2007).
4. Peacock, M., Turner, C.H., Econs, M.J. & Foroud, T. Genetics of osteoporosis. Endocr. Rev. 23, 303–326 (2002).
5. Ralston, S.H. & Uitterlinden, A.G. Genetics of osteoporosis. Endocr. Rev. 31, 629–662 (2010).
6. Hardy, J. & Singleton, A. Genomewide association studies and human disease. N. Engl. J. Med. 360, 1759–1768 (2009).
7. Manolio, T.A. Genomewide association studies and assessment of the risk of disease. N. Engl. J. Med. 363, 166–176 (2010).
8. Richards, J.B. et al. Bone mineral density, osteoporosis, and osteoporotic fractures: a genome-wide association study. Lancet 371, 1505–1512 (2008).
9. Styrkarsdottir, U. et al. Multiple genetic loci for bone mineral density and fractures. N. Engl. J. Med. 358, 2355–2365 (2008).
10. Rivadeneira, F. et al. Twenty bone-mineral-density loci identified by large-scale meta-analysis of genome-wide association studies. Nat. Genet. 41, 1199–1206 (2009).
11. Styrkarsdottir, U. et al. New sequence variants associated with bone mineral density. Nat. Genet. 41, 15–17 (2009).
12. Hsu, Y.H. et al. An integration of genome-wide association study and gene expression profiling to prioritize the discovery of novel susceptibility loci for osteoporosis-related traits. PLoS Genet. 6, e1000977 (2010).
13. Kung, A.W. et al. Association of JAG1 with bone mineral density and osteoporotic fractures: a genome-wide association study and follow-up replication studies. Am. J. Hum. Genet. 86, 229–239 (2010).
14. Duncan, E.L. et al. Genome-wide association study using extreme truncate selection identifies novel genes affecting bone mineral density and fracture risk. PLoS Genet. 7, e1001372 (2011).
15. Richards, J.B. et al. Collaborative meta-analysis: associations of 150 candidate genes with osteoporosis and osteoporotic fracture. Ann. Intern. Med. 151, 528–537 (2009).
16. van Meurs, J.B. et al. Large-scale analysis of association between LRP5 and LRP6 variants and osteoporosis. J. Am. Med. Assoc. 299, 1277–1290 (2008).
17. Bagger, Y.Z. et al. Links between cardiovascular disease and osteoporosis in postmenopausal women: serum lipids or atherosclerosis per se? Osteoporos. Int. 18, 505–512 (2007).
18. Kiel, D.P. et al. Genetic variation at the low-density lipoprotein receptor–related protein 5 (LRP5) locus modulates Wnt signaling and the relationship of physical activity with bone mineral density in men. Bone 40, 587–596 (2007).
19. Raychaudhuri, S. et al. Identifying relationships among genomic disease regions: predicting genes at pathogenic SNP associations and rare deletions. PLoS Genet. 5, e1000534 (2009).
20. Lango Allen, H. et al. Hundreds of variants clustered in genomic loci and biological pathways affect human height. Nature 467, 832–838 (2010).
21. Brunkow, M.E. et al. Bone dysplasia sclerosteosis results from loss of the SOST gene product, a novel cystine knot–containing protein. Am. J. Hum. Genet. 68, 577–589 (2001).
22. Guo, Y.F. et al. Polymorphisms of the low-density lipoprotein receptor–related protein 5 (LRP5) gene are associated with obesity phenotypes in a large family-based association study. J. Med. Genet. 43, 798–803 (2006).
23. Kornak, U. et al. Loss of the ClC-7 chloride channel leads to osteopetrosis in mice and man. Cell 104, 205–215 (2001).
24. Panagiotou, O.A., Evangelou, E. & Ioannidis, J.P. Genome-wide significant associations for variants with minor allele frequency of 5% or less—an overview: a HuGE review. Am. J. Epidemiol. 172, 869–889 (2010).
25. Jin, W. et al. Deubiquitinating enzyme CYLD negatively regulates RANK signaling and osteoclastogenesis in mice. J. Clin. Invest. 118, 1858–1866 (2008).
26. Sundaram, K., Shanmugarajan, S., Rao, D.S. & Reddy, S.V. Mutant p62P392L stimulation of osteoclast differentiation in Paget’s disease of bone. Endocrinology 152, 4180–4189 (2011).
27. Grundberg, E. et al. Population genomics in a disease targeted primary cell model. Genome Res. 19, 1942–1952 (2009).
28. Duan, Y., Beck, T.J., Wang, X.F. & Seeman, E. Structural and biomechanical basis of sexual dimorphism in femoral neck fragility has its origins in growth and aging. J. Bone Miner. Res. 18, 1766–1774 (2003).
29. Karasik, D. & Ferrari, S.L. Contribution of gender-specific genetic factors to osteoporosis risk. Ann. Hum. Genet. 72, 696–714 (2008).
30. Ohlsson, C. et al. Genetic determinants of serum testosterone concentrations in men. PLoS Genet. 7, e1002313 (2011).
31. Styrkarsdottir, U. et al. European bone mineral density loci are also associated with BMD in East-Asian populations. PLoS ONE 5, e13217 (2010).
32. Wood, A.R. et al. Allelic heterogeneity and more detailed analyses of known loci explain additional phenotypic variation and reveal complex patterns of association. Hum. Mol. Genet. 20, 4082–4092 (2011).
33. Mosekilde, L., Torring, O. & Rejnmark, L. Emerging anabolic treatments in osteoporosis. Curr. Drug Saf. 6, 62–74 (2011).
34. Hasselblad, V. & Hedges, L.V. Meta-analysis of screening and diagnostic tests. Psychol. Bull. 117, 167–178 (1995).
npg
© 2
012
Nat
ure
Am
eric
a, In
c. A
ll rig
hts
rese
rved
.

500 VOLUME 44 | NUMBER 5 | MAY 2012 Nature GeNetics
A rt i c l e s
karol estrada1–3,142, Unnur styrkarsdottir4,142, evangelos evangelou5,142, Yi-Hsiang Hsu6,7,142, emma l duncan8,9,142, evangelia e ntzani5,142, ling oei1–3,142, omar m e Albagha10, najaf Amin2, John P kemp11, daniel l koller12, guo li13, ching-ti liu14, Ryan l minster15, Alireza moayyeri16,17, liesbeth Vandenput18, dana willner8,19, su-mei Xiao20,21, laura m Yerges-Armstrong22, Hou-Feng Zheng23, nerea Alonso10, Joel eriksson18, candace m kammerer15, stephen k kaptoge16, Paul J leo8, gudmar thorleifsson4, scott g wilson17,24,25, James F wilson26,27, Ville Aalto28,29, markku Alen30, Aaron k Aragaki31, thor Aspelund32,33, Jacqueline R center34–36, Zoe dailiana37, david J duggan38, melissa garcia39, natàlia garcia-giralt40, sylvie giroux41, göran Hallmans42, lynne J Hocking43, lise Bjerre Husted44, karen A Jameson45, Rita khusainova46,47, ghi su kim48, charles kooperberg31, theodora koromila49, marcin kruk50, marika laaksonen51, Andrea Z lacroix31, seung Hun lee48, Ping c leung52, Joshua R lewis24,25, laura masi53, simona mencej-Bedrac54, tuan V nguyen34,35, Xavier nogues40, millan s Patel55, Janez Prezelj56, lynda m Rose57, serena scollen58, kristin siggeirsdottir32, Albert V smith32,33, olle svensson59, stella trompet60,61, olivia trummer62, natasja m van schoor63, Jean woo64, kun Zhu24,25, susana Balcells65, maria luisa Brandi53, Brendan m Buckley66, sulin cheng67,68, claus christiansen69, cyrus cooper45, george dedoussis70, Ian Ford71, morten Frost72,73, david goltzman74, Jesús gonzález-macías75,76, mika kähönen77,78, magnus karlsson79,80, elza khusnutdinova46,47, Jung-min koh48, Panagoula kollia49, Bente lomholt langdahl44, william d leslie81, Paul lips82,83, Östen ljunggren84, Roman s lorenc50, Janja marc54, dan mellström18, Barbara obermayer-Pietsch62, José m olmos75,76, Ulrika Pettersson-kymmer85, david m Reid43, José A Riancho75,76, Paul m Ridker57,86, François Rousseau41,87,88, P eline slagboom3,89, nelson l s tang90,91, Roser Urreizti65, wim Van Hul92, Jorma Viikari93, maría t Zarrabeitia94, Yurii s Aulchenko2, martha castano-Betancourt1–3, elin grundberg95–97, lizbeth Herrera1, thorvaldur Ingvarsson33,98,99, Hrefna Johannsdottir4, tony kwan95,96, Rui li100, Robert luben16, carolina medina-gómez1,2, stefan th Palsson4, sjur Reppe101, Jerome I Rotter102, gunnar sigurdsson33,103, Joyce B J van meurs1–3, dominique Verlaan95,96, Frances m k williams17, Andrew R wood104, Yanhua Zhou14, kaare m gautvik101,105,106, tomi Pastinen95,96,107, soumya Raychaudhuri108,109, Jane A cauley110, daniel I chasman57,86, graeme R clark8, steven R cummings111, Patrick danoy8, elaine m dennison45, Richard eastell112, John A eisman34–36, Vilmundur gudnason32,33, Albert Hofman2,3, Rebecca d Jackson113,114, graeme Jones115, J wouter Jukema60,116,117, kay-tee khaw16, terho lehtimäki118–120, Yongmei liu121, mattias lorentzon18, eugene mccloskey112,122, Braxton d mitchell22, kannabiran nandakumar6,7, geoffrey c nicholson123, Ben A oostra124, munro Peacock125, Huibert A P Pols1,2, Richard l Prince24,25, olli Raitakari28,29, Ian R Reid126, John Robbins127, Philip n sambrook128, Pak chung sham129,130, Alan R shuldiner22,131, Frances A tylavsky132, cornelia m van duijn2, nick J wareham133, l Adrienne cupples14,134, michael J econs12,125, david m evans11, tamara B Harris39, Annie wai chee kung20,21, Bruce m Psaty135–138, Jonathan Reeve139, timothy d spector17, elizabeth A streeten22,131, m carola Zillikens1, Unnur thorsteinsdottir4,33,143, claes ohlsson18,143, david karasik6,7,143, J Brent Richards17,23,100,140,143, matthew A Brown8,143, kari stefansson4,33,143, André g Uitterlinden1–3,143, stuart H Ralston10,143, John P A Ioannidis5,141,143, douglas P kiel6,7,143 & Fernando Rivadeneira1–3,143
1Department of Internal Medicine, Erasmus Medical Center, Rotterdam, The Netherlands. 2Department of Epidemiology, Erasmus Medical Center, Rotterdam, The Netherlands. 3Netherlands Genomics Initiative (NGI)-sponsored Netherlands Consortium for Healthy Aging (NCHA), Leiden, The Netherlands. 4deCODE Genetics, Reykjavik, Iceland. 5Department of Hygiene and Epidemiology, University of Ioannina School of Medicine, Ioannina, Greece. 6Institute for Aging Research, Hebrew SeniorLife, Boston, Massachusetts, USA. 7Department of Medicine, Harvard Medical School, Boston, Massachusetts, USA. 8Human Genetics Group, University of Queensland Diamantina Institute, Brisbane, Queensland, Australia. 9Department of Endocrinology, Royal Brisbane and Women’s Hospital, Brisbane, Queensland, Australia. 10Rheumatic Diseases Unit, Institute of Genetics and Molecular Medicine, University of Edinburgh, Edinburgh, UK. 11Medical Research Council (MRC) Centre for Causal Analyses in Translational Epidemiology, University of Bristol, Bristol, UK. 12Department of Medical and Molecular Genetics, Indiana University School of Medicine, Indianapolis, Indiana, USA. 13Cardiovascular Health Research Unit, University of Washington, Seattle, Washington, USA. 14Department of Biostatistics, Boston University School of Public Health, Boston, Massachusetts, USA. 15Department of Human Genetics, University of Pittsburgh, Pittsburgh, Pennsylvania, USA. 16Department of Public Health and Primary Care, University of Cambridge, Cambridge, UK. 17Department of Twin Research and Genetic Epidemiology, King’s College London, London, UK. 18Centre for Bone and Arthritis Research, Institute of Medicine, Sahlgrenska Academy, University of Gothenburg, Gothenburg, Sweden. 19Australian Centre for Ecogenomics, University of Queensland, Brisbane, Queensland, Australia. 20Department of Medicine, The University of Hong Kong, Hong Kong, China. 21Research Centre of Heart, Brain, Hormone and Healthy Aging, The University of Hong Kong, Hong Kong, China. 22Department of Medicine, Division of Endocrinology, Diabetes and Nutrition, University of Maryland School of Medicine, Baltimore, Maryland, USA. 23Department of Human Genetics, Lady Davis Institute, McGill University, Montreal, Quebec, Canada. 24School of Medicine and Pharmacology, University of Western Australia, Perth, Western Australia, Australia. 25Department of Endocrinology and Diabetes, Sir Charles Gairdner Hospital, Perth, Western Australia, Australia. 26Centre for Population Health Sciences, University of Edinburgh, Edinburgh, UK. 27MRC Human Genetics Unit, MRC Institute of Genetics and Molecular Medicine, University of Edinburgh, Edinburgh, UK. 28Department of Clinical Physiology and Nuclear Medicine, Turku University Hospital, Turku, Finland. 29Research Centre of Applied and Preventive Cardiovascular Medicine, University of Turku, Turku, Finland. 30Department of Medical Rehabilitation, Oulu University Hospital and Institute of Health Sciences, Oulu, Finland. 31Division of Public Health Sciences, Fred Hutchinson Cancer Research Center, Seattle, Washington, USA. 32Icelandic Heart Association, Kopavogur, Iceland. 33Faculty of Medicine, University of Iceland, Reykjavik, Iceland. 34Osteoporosis and Bone Biology Program, Garvan Institute of Medical Research, Sydney,
npg
© 2
012
Nat
ure
Am
eric
a, In
c. A
ll rig
hts
rese
rved
.

Nature GeNetics VOLUME 44 | NUMBER 5 | MAY 2012 501
A rt i c l e s
New South Wales, Australia. 35Department of Medicine, University of New South Wales, Sydney, New South Wales, Australia. 36Department of Endocrinology, St. Vincent’s Hospital, Sydney, New South Wales, Australia. 37Department of Orthopaedic Surgery, Medical School University of Thessalia, Larissa, Greece. 38Translational Genomics Research Institute, Phoenix, Arizona, USA. 39Laboratory of Epidemiology, Demography, and Biometry, National Institute on Aging, Bethesda, Maryland, USA. 40Department of Internal Medicine, Hospital del Mar, Instituto Municipal de Investigación Médica (IMIM), Red Temática de Investigación Cooperativa en Envejecimiento y Fragilidad (RETICEF), Universitat Autònoma de Barcelona (UAB), Barcelona, Spain. 41Unité de Recherche en Génétique Humaine et Moléculaire, Centre de Recherche du Centre Hospitalier Universitaire de Québec–Hôpital St-François-d’Assise (CHUQ-HSFA), Québec City, Quebec, Canada. 42Department of Public Health and Clinical Medicine, Umeå Unviersity, Umeå, Sweden. 43Musculoskeletal Research Programme, Division of Applied Medicine, University of Aberdeen, Aberdeen, UK. 44Department of Endocrinology and Internal Medicine, Aarhus University Hospital, Aarhus C, Denmark. 45MRC Lifecourse Epidemiology Unit, University of Southampton, Southampton, UK. 46Ufa Scientific Centre of the Russian Academy of Sciences, Institute of Biochemistry and Genetics, Ufa, Russia. 47Biological Department, Bashkir State University, Ufa, Russia. 48Division of Endocrinology and Metabolism, Asan Medical Center, University of Ulsan College of Medicine, Seoul, South Korea. 49Department of Genetics and Biotechnology, Faculty of Biology, University of Athens, Athens, Greece. 50Department of Biochemistry and Experimental Medicine, The Children’s Memorial Health Institute, Warsaw, Poland. 51Department of Food and Environmental Sciences, University of Helsinki, Helsinki, Finland. 52Jockey Club Centre for Osteoporosis Care and Control, The Chinese University of Hong Kong, Hong Kong, China. 53Department of Internal Medicine, University of Florence, Florence, Italy. 54Department of Clinical Biochemistry, University of Ljubljana, Ljubljana, Slovenia. 55Department of Medical Genetics, University of British Columbia, Vancouver, British Columbia, Canada. 56Department of Endocrinology, University Medical Center, Ljubljana, Slovenia. 57Division of Preventive Medicine, Brigham and Women’s Hospital, Boston, Massachusetts, USA. 58Department of Medicine, University of Cambridge, Cambridge, UK. 59Department of Surgical and Perioperative Sciences, Umeå Unviersity, Umeå, Sweden. 60Department of Cardiology, Leiden University Medical Center, Leiden, The Netherlands. 61Department of Gerontology and Geriatrics, Leiden University Medical Center, Leiden, The Netherlands. 62Department of Internal Medicine, Division of Endocrinology and Metabolism, Medical University Graz, Graz, Austria. 63Department of Epidemiology and Biostatistics, Extramuraal Geneeskundig Onderzoek (EMGO) Institute for Health and Care Research, Vrije Universiteit (VU) University Medical Center, Amsterdam, The Netherlands. 64Department of Medicine and Therapeutics, The Chinese University of Hong Kong, Hong Kong, China. 65Department of Genetics, University of Barcelona, Centro de Investigación Biomédica en Red de Enfermedades Raras (CIBERER), Institut de Biomedicina de la Universitat de Barcelona (IBUB), Barcelona, Spain. 66Department of Pharmacology and Therapeutics, University College Cork, Cork, Ireland. 67Department of Health Sciences, University of Jyväskylä, Jyväskylä, Finland. 68Department of Orthopaedics and Traumatology, Kuopio University Hospital, Kuopio, Finland. 69Center for Clinical and Basic Research (CCBR)-Synarc, Ballerup, Denmark. 70Department of Nutrition and Dietetics, Harokopio University, Athens, Greece. 71Robertson Center for Biostatistics, University of Glasgow, Glasgow, UK. 72Department of Endocrinology, Odense University Hospital, Odense, Denmark. 73Clinical Institute, University of Southern Denmark, Odense, Denmark. 74Department of Medicine, McGill University, Montreal, Quebec, Canada. 75Department of Medicine, University of Cantabria, Santander, Spain. 76Department of Internal Medicine, Hospital Universitario Marqués de Valdecilla and Instituto de Formación e Investigación Marqués de Valdecilla (IFIMAV), Santander, Spain. 77Department of Clinical Physiology, Tampere University Hospital, Tampere, Finland. 78Department of Clinical Physiology, University of Tampere School of Medicine, Tampere, Finland. 79Clinical and Molecular Osteoporosis Research Unit, Department of Clinical Sciences, Lund University, Malmö, Sweden. 80Department of Orthopaedics, Lund University, Malmö, Sweden. 81Department of Internal Medicine, University of Manitoba, Winnipeg, Manitoba, Canada. 82Department of Endocrinology, VU University Medical Center, Amsterdam, The Netherlands. 83Extramuraal Geneeskundig Onderzoek (EMGO) Institute for Health and Care Research, VU University Medical Center, Amsterdam, The Netherlands. 84Department of Medical Sciences, University of Uppsala, Uppsala, Sweden. 85Department of Pharmacology and Neuroscience, Umeå University, Umeå, Sweden. 86Harvard Medical School, Boston, Massachusetts, USA. 87Department of Molecular Biology, Medical Biochemistry and Pathology, Université Laval, Québec City, Quebec, Canada. 88The APOGEE-Net/CanGèneTest Network on Genetic Health Services and Policy, Université Laval, Québec City, Quebec, Canada. 89Department of Molecular Epidemiology, Leiden University Medical Center, Leiden, The Netherlands. 90Department of Chemical Pathology, The Chinese University of Hong Kong, Hong Kong, China. 91Li Ka Shing Institute of Health Sciences, The Chinese University of Hong Kong, Hong Kong, China. 92Department of Medical Genetics, University of Antwerp, Antwerp, Belgium. 93Department of Medicine, Turku University Hospital, Turku, Finland. 94Department of Legal Medicine, University of Cantabria, Santander, Spain. 95Department of Human Genetics, McGill University, Montreal, Quebec, Canada. 96McGill University and Genome Québec Innovation Centre, Montreal, Quebec, Canada. 97Wellcome Trust Sanger Institute, Hinxton, Cambridge, UK. 98Department of Orthopedic Surgery, Akureyri Hospital, Akureyri, Iceland. 99Institution of Health Science, University of Akureyri, Akureyri, Iceland. 100Department of Epidemiology and Biostatistics, Lady Davis Institute, McGill University, Montreal, Quebec, Canada. 101Department of Medical Biochemistry, Oslo University Hospital, Oslo, Norway. 102Medical Genetics Institute, Cedars-Sinai Medical Center, Los Angeles, California, USA. 103Department of Endocrinology and Metabolism, University Hospital, Reykjavik, Iceland. 104Genetics of Complex Traits, Peninsula College of Medicine and Dentistry, University of Exeter, Exeter, UK. 105Department of Clinical Biochemistry, Lovisenberg Deacon Hospital, Oslo, Norway. 106Institute of Basic Medical Sciences, University of Oslo, Oslo, Norway. 107Department of Medical Genetics, McGill University Health Centre, Montreal, Quebec, Canada. 108Division of Genetics and Rheumatology, Brigham and Women’s Hospital, Harvard Medical School, Boston, Massachusetts, USA. 109Program in Medical and Population Genetics, Broad Institute, Cambridge, Massachusetts, USA. 110Department of Epidemiology, University of Pittsburgh, Pittsburgh, Pennsylvania, USA. 111California Pacific Medical Center, San Francisco, California, USA. 112National Institute for Health and Research (NIHR), Musculoskeletal Biomedical Research Unit, University of Sheffield, Sheffield, UK. 113Department of Internal Medicine, The Ohio State University, Columbus, Ohio, USA. 114Center for Clinical and Translational Science, The Ohio State University, Columbus, Ohio, USA. 115Menzies Research Institute, University of Tasmania, Hobart, Tasmania, Australia. 116Durrer Center for Cardiogenetic Research, Amsterdam, The Netherlands. 117Interuniversity Cardiology Institute of the Netherlands, Utrecht, The Netherlands. 118Department of Clinical Chemistry, Tampere University Hospital, Tampere, Finland. 119Department of Clinical Chemistry, University of Tampere School of Medicine, Tampere, Finland. 120Fimlab, Tampere, Finland. 121Center for Human Genomics, Wake Forest University School of Medicine, Winston-Salem, North Carolina, USA. 122Academic Unit of Bone Metabolism, Metabolic Bone Centre, University of Sheffield, Sheffield, UK. 123Rural Clinical School, The University of Queensland, Toowoomba, Queensland, Australia. 124Department of Clinical Genetics, Erasmus Medical Center, Rotterdam, The Netherlands. 125Department of Medicine, Indiana University School of Medicine, Indianapolis, Indiana, USA. 126Department of Medicine, University of Auckland, Auckland, New Zealand. 127Department of Medicine, University of California, Davis, Sacramento, California, USA. 128Kolling Institute, Royal North Shore Hospital, University of Sydney, Sydney, New South Wales, Australia. 129Department of Psychiatry, The University of Hong Kong, Hong Kong, China. 130Centre for Reproduction, Development and Growth, The University of Hong Kong, Hong Kong, China. 131Geriatric Research and Education Clinical Center (GRECC), Veterans Administration Medical Center, Baltimore, Maryland, USA. 132Department of Preventive Medicine, University of Tennessee Health Science Center, Memphis, Tennessee, USA. 133MRC Epidemiology Unit Box 285, MRC, Cambridge, UK. 134Framingham Heart Study, Framingham, Massachusetts, USA. 135Department of Medicine, University of Washington, Seattle, Washington, USA. 136Department of Epidemiology, University of Washington, Seattle, Washington, USA. 137Deparment of Health Services, University of Washington, Seattle, Washington, USA. 138Group Health Research Institute, Group Health Cooperative, Seattle, Washington, USA. 139Medicine Box 157, University of Cambridge, Cambridge, UK. 140Department of Medicine, Lady Davis Institute, McGill University, Montreal, Quebec, Canada. 141Stanford Prevention Research Center, Stanford University, Stanford, California, USA. 142These authors contributed equally to this work. 143These authors jointly directed this work. Correspondence should be addressed to F. Rivadeneira ([email protected]).
npg
© 2
012
Nat
ure
Am
eric
a, In
c. A
ll rig
hts
rese
rved
.

Nature GeNetics doi:10.1038/2249
ONLINE METHODSStudy design. This study was conducted as part of the GEFOS Consortium, a coalition of teams of investigators dedicated to identifying the genetic determi-nants of osteoporosis. The discovery samples comprised 17 GWAS (n = 32,961) from populations across North America, Europe, East Asia and Australia, with a variety of epidemiological designs (Supplementary Table 18a) and clinical characteristics of individuals (Supplementary Table 18b); a subset of these had fracture information available (Supplementary Table 18c). Subjects from 34 additional studies with BMD data (n = 50,933) were used for replication, and association with fracture was tested across 50 studies with fracture infor-mation, most of which were also used for the BMD analysis (n = 31,016 cases and 102,444 controls) (Fig. 1 and Supplementary Tables 19a–c and 20a–c). All studies were approved by their institutional ethics review committees, and all participants provided written informed consent.
BMD measurements and fracture definition. LS-BMD and FN-BMD were measured in all cohorts using dual-energy X-ray absorptiometry, following standard protocols (Supplementary Tables 18b, 19b and 20b). Three clinically distinct fracture definitions were used: (i) any type, consisting of low-trauma fractures at any skeletal site (except fingers, toes and skull) occurring after age 18 years, assessed by X-ray, radiographic report, clinical record, clini-cal interview and/or questionnaire, (ii) validated non-vertebral, consisting of fractures occurring after age 50 years, with diagnosis confirmed by hospital records and/or radiographs, and (iii) radiographic vertebral fractures, from lateral morphometry scored on X-rays. The first definition is most-inclusive, whereas the latter two are more stringent fracture definitions that are com-monly used in randomized trials35,36. Controls were defined as individuals without a history of fracture, using for each fracture type the same age limit categories as for the cases.
Stage 1 genome-wide association analysis. Genotyping and imputation. GWAS genotyping was performed by each study following standard protocols, and imputation was then carried out on ~2.5 million SNPs from HapMap37 Phase 2 release 22 using Genome Build 36. Quality control was performed inde-pendently for each study. To facilitate meta-analysis, each group performed genotype imputation with BIM-BAM38, IMPUTE39 or MACH40 software using genotypes from HapMap Phase 2 release 22 (CEU or Han Chinese in Beijing (CHB) and Japanese in Tokyo (JPT) as appropriate). HapMap release 21 was used as a reference for SNPs residing on the X chromosome, and IMPUTE software was used for imputation. Overall, imputation quality scores for each SNP were obtained from IMPUTE (proper_info) and MACH (rsq_hat) statistics. Details of the genotyping platform, genotype quality control procedures and software for imputation that were used by each study are pre-sented (Supplementary Tables 18d and 19d).
Association analysis with BMD. Each study performed genome-wide associa-tion analysis for FN-BMD and LS-BMD, using sex-specific and age-, weight- and principal component–adjusted standardized residuals analyzed under an additive (per allele) genetic model. Analyses of autosomal and X-chromosome markers were performed separately. The analysis of imputed genotype data accounted for uncertainty in each genotype prediction by using either the dosage information from MACH or the genotype probabilities from IMPUTE and BIM-BAM. Studies used MACH2QTL40 directly or via GRIMP41 (which uses genotype dosage value as a predictor in a linear regression framework), SNPTEST39, Merlin42, BIM-BAM or the linear mixed-effects model of the Kinship and ProbABEL43 (Supplementary Tables 18d and 19d). For analy-sis of the X chromosome, either SNPTEST or R software was used in each participating study. We coded ‘effect allele homozygous genotype’ as 2 and ‘other allele homozygous genotype’ as 0 in the genotyped SNPs in men on the X chromosome. The imputed genotypes were coded as continuous variables from 0 to 2 to take into account imputation uncertainty. The genomic control method44 was used to correct the standard error (SE) by the square root of the genomic inflation factor (λ): SEcorrected = s.e.m. × √λ.
Meta-analysis of the GWAS. Before performing meta-analysis on the genome-wide association data, SNPs with poor imputation quality scores (rsq_hat of <0.3 in MACH, proper_info of <0.4 in IMPUTE or a ratio of
observed-to-expected dosage variance of <0.3 in BIM-BAM) and markers with a minor allele frequency (MAF) of <1% were excluded from each study. All individual GWAS were genomic control corrected before meta-analysis44. Individual study-specific genomic control values ranged from 0.98 to 1.08 (Supplementary Table 18d). A total of 2,483,766 autosomal SNPs were included in meta-analysis across 17, 16 and 13 studies for FN-BMD (pooled, women-only and men-only analyses, respectively) and 16, 13 and 12 stud-ies for LS-BMD (pooled, women-only and men-only analyses, respectively). A total of 76,253 X-linked SNPs were included in meta-analysis across 14, 13 and 10 studies for LS-BMD and FN-BMD (pooled, women-only and men-only analyses, respectively). In our discovery analysis, we chose to implement a fixed-effects model, as it is generally preferable for the purposes of initial discovery, where the aim is to screen and identify as many of the true variants as possible45,46. SNPs present in less than three studies were removed from the meta-analysis, yielding ~2.2 million SNPs in the final results. The genomic inflation factors (λ) were 1.11, 1.09 and 1.06 for FN-BMD (pooled, women-only and men-only analyses, respectively) and 1.13, 1.09 and 1.06 for LS-BMD (pooled, women-only and men-only analyses, respectively). A second genomic control correction was applied to the overall meta-analysis results, although such a second correction is considered overly conservative47. Significance for BMD association was set at P < 5 × 10⁻⁸, and a Bonferroni correction was used for association with fracture48.
Selection of SNPs for replication. We took forward the most significant 96 SNPs for replication. With respect to power estimations, after adding 30,000 samples in stage 2, these variants had a priori power of ≥85% to reach P = 5 × 10⁻⁸ in the meta-analysis. Loci were considered independent when separated by at least 1 Mb from a top GWAS signal. The 96 variants included the 82 index SNPs representing each of the 82 loci reaching P < 5 × 10⁻⁶ in stage 1, 9 SNPs that were within the same 2-Mb windows as the 82, which were independent from the main signals (secondary signals), and the top 5 most-associated SNPs on the X chromosome (with P < 5 × 10⁻⁵).
Association analyses with fracture risk. Effect estimates (odds ratios) for asso-ciation of allele dosage of the top signals with fracture risk were obtained from logistic regression models adjusted for age, age2, weight, sex, height and four principal components. The proportion of the fracture risk explained by FN-BMD was calculated from the regression coefficients as (βunadjusted − βBMDadjusted) / βunadjusted in a subset of replication samples for which both FN-BMD and complete fracture information was available.
Stage 2 replication. Samples and genotyping. Fracture association results were also obtained for the 82 most-significant SNPs from 54,244 indi-viduals of European ancestry from 7 GWAS (in silico genotyping) that had not been included in the stage 1 analyses (Supplementary Table 19a–c). Subjects from 34 studies of the GENOMOS Consortium with BMD and/or fracture information were studied in replication analysis (Supplementary Table 3a–c). De novo replication genotyping was performed in the UK (Kbiosciences), Iceland (deCODE Genetics), Australia (University of Queensland Diamantina Institute) and the United States (WHI GeCHIP) using KASPar, Centaurus, OpenArray and iSelect assays, respectively (Supplementary Note). Minimum genotyping quality control criteria were defined as sample call rate of >80%, SNP call rate of >90%, Hardy-Weinberg Equilibrium P value of >1 × 10⁻⁴ and MAF of >1%.
Association analyses and meta-analysis. We tested the association between the 96 SNPs and BMD and fracture risk in each in silico and de novo stage 2 study separately, as described for the stage 1 studies. We subsequently performed meta-analysis of effects and standard errors from the stage 2 studies and then carried out a meta-analysis of the summary statistics of stages 1 and 2 combined using the inverse-variance method in METAL. At the replication stage, where more than 30 studies were synthesized, we chose to first assess the underlying heterogeneity, considering both the Cochran’s Q statistic and the I2 metric. If the heterogeneity was not significant, fixed-effects model were applied. If the Cochran’s Q P value was <0.0005 and I2 was >50%, we used the more conservative random- effects model.
npg
© 2
012
Nat
ure
Am
eric
a, In
c. A
ll rig
hts
rese
rved
.

Nature GeNeticsdoi:10.1038/2249
Additional analyses. Further analyses were performed for the SNPs carried forward for replication. Each of these analyses is described in detail in the Supplementary Note.
In brief, we performed (i) a conditional genome-wide association analysis to determine whether any of the 82 BMD loci harbored additional independent signals, (ii) tested gene-by-gene pairwise interactions between these BMD loci, (iii) assessed within the independent setting of the PERF study (for details on study design see Supplementary Table 20a–c) the predictive ability derived from the cumulative effect of the 63 autosomal SNPs associated with BMD with genome-wide significance in relation to BMD levels and osteoporosis risk and that of the 16 BMD SNPs also associated with fracture risk in relation to fracture risk, (iv) identified SNPs with r2 of ≥0.80 with the lead SNP that were potentially functional (for example, nonsense, non-conservative nonsynonymous, synony-mous, exonic splicing, transcription factor binding), using regional imputation with 1000 Genomes Project data (June 2010 release), (v) tested the relationship between gene expression profiles from transiliac bone biopsies and BMD in 84 unrelated postmenopausal women49 and examined cis associations between each of the 55 significant BMD SNPs and expression of nearby genes in different tissues, including lymphoblastoid cell lines50–52, primary human fibroblasts and osteoblasts53, adipose tissue54, whole blood54 and circulating monocytes55, and (vi) evaluated the connectivity and relationships between identified loci using literature-based annotation with the GRAIL19 statistical strategy.
35. Harris, S.T. et al. Effects of risedronate treatment on vertebral and nonvertebral fractures in women with postmenopausal osteoporosis: a randomized controlled trial. Vertebral Efficacy With Risedronate Therapy (VERT) Study Group. J. Am. Med. Assoc. 282, 1344–1352 (1999).
36. Jackson, R.D. et al. Calcium plus vitamin D supplementation and the risk of fractures. N. Engl. J. Med. 354, 669–683 (2006).
37. Frazer, K.A. et al. A second generation human haplotype map of over 3.1 million SNPs. Nature 449, 851–861 (2007).
38. Servin, B. & Stephens, M. Imputation-based analysis of association studies: candidate regions and quantitative traits. PLoS Genet. 3, e114 (2007).
39. Marchini, J., Howie, B., Myers, S., McVean, G. & Donnelly, P. A new multipoint method for genome-wide association studies by imputation of genotypes. Nat. Genet. 39, 906–913 (2007).
40. Li, Y., Willer, C., Sanna, S. & Abecasis, G. Genotype imputation. Annu. Rev. Genomics Hum. Genet. 10, 387–406 (2009).
41. Estrada, K. et al. GRIMP: a web- and grid-based tool for high-speed analysis of large-scale genome-wide association using imputed data. Bioinformatics 25, 2750–2752 (2009).
42. Abecasis, G.R., Cherny, S.S., Cookson, W.O. & Cardon, L.R. Merlin—rapid analysis of dense genetic maps using sparse gene flow trees. Nat. Genet. 30, 97–101 (2002).
43. Aulchenko, Y.S., Struchalin, M.V. & van Duijn, C.M. ProbABEL package for genome-wide association analysis of imputed data. BMC Bioinformatics 11, 134 (2010).
44. Devlin, B., Roeder, K. & Wasserman, L. Genomic control, a new approach to genetic-based association studies. Theor. Popul. Biol. 60, 155–166 (2001).
45. Ioannidis, J.P., Thomas, G. & Daly, M.J. Validating, augmenting and refining genome-wide association signals. Nat. Rev. Genet. 10, 318–329 (2009).
46. Pereira, T.V., Patsopoulos, N.A., Salanti, G. & Ioannidis, J.P. Discovery properties of genome-wide association signals from cumulatively combined data sets. Am. J. Epidemiol. 170, 1197–1206 (2009).
47. Yang, J. et al. Genomic inflation factors under polygenic inheritance. Eur. J. Hum. Genet. 19, 807–812 (2011).
48. Pe’er, I., Yelensky, R., Altshuler, D. & Daly, M.J. Estimation of the multiple testing burden for genomewide association studies of nearly all common variants. Genet. Epidemiol. 32, 381–385 (2008).
49. Reppe, S. et al. Eight genes are highly associated with BMD variation in postmenopausal Caucasian women. Bone 46, 604–612 (2010).
50. Ge, B. et al. Global patterns of cis variation in human cells revealed by high-density allelic expression analysis. Nat. Genet. 41, 1216–1222 (2009).
51. Montgomery, S.B. et al. Transcriptome genetics using second generation sequencing in a Caucasian population. Nature 464, 773–777 (2010).
52. Stranger, B.E. et al. Population genomics of human gene expression. Nat. Genet. 39, 1217–1224 (2007).
53. Grundberg, E. et al. Global analysis of the impact of environmental perturbation on cis-regulation of gene expression. PLoS Genet. 7, e1001279 (2011).
54. Emilsson, V. et al. Genetics of gene expression and its effect on disease. Nature 452, 423–428 (2008).
55. Zeller, T. et al. Genetics and beyond—the transcriptome of human monocytes and disease susceptibility. PLoS ONE 5, e10693 (2010).
npg
© 2
012
Nat
ure
Am
eric
a, In
c. A
ll rig
hts
rese
rved
.