Genome Landscape and Evolutionary Plasticity of Chromosomes in Malaria Mosquitoes

A genome-wide association study identifies colorectalcancer susceptibility loci on chromosomes 10p14and 8q23.3Ian PM Tomlinson*1,38, Emily Webb2, Luis Carvajal-Carmona1, Peter Broderick2, Kimberley Howarth1,Alan M Pittman2, Sarah Spain1, Steven Lubbe2, Axel Walther1, Kate Sullivan2, Emma Jaeger1, Sarah Fielding2,Andrew Rowan1, Jayaram Vijayakrishnan2, Enric Domingo1, Ian Chandler2, Zoe Kemp1, Mobshra Qureshi2,Susan M Farrington3, Albert Tenesa3, James GD Prendergast3, Rebecca A Barnetson3, Steven Penegar2,Ella Barclay1, Wendy Wood2, Lynn Martin1,4,5, Maggie Gorman1, Huw Thomas6, Julian Peto7,8,D Timothy Bishop9, Richard Gray10, Eamonn R Maher5, Anneke Lucassen11, David Kerr12,D Gareth R Evans4, The CORGI Consortium37, Clemens Schafmayer13,14, Stephan Buch16,17, Henry Volzke15,Jochen Hampe16, Stefan Schreiber14,17, Ulrich John15, Thibaud Koessler18, Paul Pharoah18, Tom van Wezel19,Hans Morreau19, Juul T Wijnen20, John L Hopper21, Melissa C Southey22, Graham G Giles21,23,Gianluca Severi23, Sergi Castellvı-Bel24, Clara Ruiz-Ponte25, Angel Carracedo25, Antoni Castells24,The EPICOLON Consortium37, Asta Forsti26,27, Kari Hemminki26,27, Pavel Vodicka28, Alessio Naccarati28,Lara Lipton29, Judy WC Ho30, KK Cheng30, Pak C Sham30, J Luk30, Jose AG Agundez31, Jose M Ladero32,Miguel de la Hoya33, Trinidad Caldes33, Iina Niittymaki34, Sari Tuupanen34, Auli Karhu34, Lauri Aaltonen34,Jean-Baptiste Cazier35, Harry Campbell36,38, Malcolm G Dunlop3,38 & Richard S Houlston2,38
To identify colorectal cancer (CRC) susceptibility alleles, weconducted a genome-wide association study. In phase 1, wegenotyped 550,163 tagSNPs in 940 familial colorectal tumorcases (627 CRC, 313 high-risk adenoma) and 965 controls. Inphase 2, we genotyped 42,708 selected SNPs in 2,873 CRCcases and 2,871 controls. In phase 3, we evaluated 11 SNPsshowing association at P o 10!4 in a joint analysis of phases1 and 2 in 4,287 CRC cases and 3,743 controls. Two SNPswere taken forward to phase 4 genotyping (10,731 CRC casesand 10,961 controls from eight centers). In addition to thepreviously reported 8q24, 15q13 and 18q21 CRC risk loci,we identified two previously unreported associations:rs10795668, located at 10p14 (P ¼ 2.5 # 10!13 overall;P ¼ 6.9 # 10!12 replication), and rs16892766, at 8q23.3(P ¼ 3.3 # 10!18 overall; P ¼ 9.6 # 10!17 replication), whichtags a plausible causative gene, EIF3H. These data providefurther evidence for the ‘common-disease common-variant’model of CRC predisposition.
High-penetrance, germline mutations in known genes account for lessthan 5% of colorectal cancer (CRC) cases1. Much of the remainingvariation in genetic risk may be attributable to a large number of
susceptibility loci, some of which will be common, each exerting asmall influence on risk.The availability of comprehensive sets of tagSNPs that capture most
of the common sequence variation allows genome-wide associationstudies (GWAS) for disease associations to be efficiently conducted.We sought to identify previously unknown CRC susceptibility genesby conducting a multistage GWAS. We have previously reported theresults of the two most highly ranked SNPs from phase 1 of ourGWAS and one candidate gene association with replication in inde-pendent studies. These confirmed susceptibility loci for CRC map to8q24 (rs6983267)2, 18q21 (rs4939827, rs12953717 and rs4464148)3
and 15q13 (rs4779584 and rs10318)4.Here, we report comprehensive findings from our GWAS. In phase
1, we genotyped 555,352 tagSNPs in 940 individuals with colorectalneoplasia and 965 controls using the Illumina Hap550 BeadChipArray. To maximize power to identify associations, we chose cases thateach had at least one first-degree relative affected with CRC, therebygenetically enriching for susceptibility alleles5,6. Of the 1,905 DNAsamples submitted for genotyping, 1,890 samples were successfullyprocessed. Genotyping failed in 15 individuals, leaving genotype datafor 930 cases (620 with CRC and 310 with high-risk colorectaladenomas) and 960 controls. Applying strict quality control criteria,
Received 26 November 2007; accepted 1 February 2008; published online 30 March 2008; corrected online 13 April 2008 (details online); doi:10.1038/ng.111
*A full list of author affiliations appears at the end of the paper.
NATURE GENETICS VOLUME 40 [ NUMBER 5 [ MAY 2008 623
LET TERS©
2008
Nat
ure
Publ
ishi
ng G
roup
http
://w
ww
.nat
ure.
com
/nat
ureg
enet
ics

we removed a further 8 cases and 33 controls, leaving 922 cases (614CRC, 308 high-risk colorectal adenomas) and 927 controls foranalysis. A total of 550,163 SNPs were satisfactorily genotyped(99.1%), with mean individual sample call rates of 99.7% and99.8% in cases and controls, respectively. Of the SNPs satisfactorilygenotyped, 2,516 were monomorphic, leaving 547,647 SNPs for whichgenotype data were informative. Comparison of the observed andexpected distributions showed little evidence for an inflation of thetest statistics (inflation factor l ¼ 1.02, based on the 90% leastsignificant SNPs; Supplementary Fig. 1 online), thereby excludingthe possibility of significant hidden population substructure, crypticrelatedness among subjects or differential genotype calling betweencases and controls7.The strongest associations identified in phase 1 were found at
polymorphic sites defined by rs6983267 and SNPs located in intron 3of SMAD7 (rs4939827, rs12953717 and rs4464148). We also identifiedtwo strongly associated SNPs, rs4779584 and rs10318, close to theCRAC1 (HMPS) locus8 on chromosome 15q13. After fast-trackingthese SNPs, on the basis of P values of association calculated fromdifferences in allele frequency between cases and controls, we prior-itized 42,708 of the SNPs typed in phase 1 for genotyping in phase 2.Phase 2 data were derived from 2,854 CRC cases (of 2,873 submittedfor typing, 19 samples either failed genotyping or quality control
criteria) and 2,822 controls (of 2,871 submitted, 49 samples eitherfailed genotyping or quality control criteria); these samples were typedusing customized Illumina iSelect Bead arrays. We satisfactorilygenotyped 38,733 SNPs (90.7%), with mean individual sample callrates of 99.9% and 99.9% in cases and controls, respectively.A comparison of the observed and expected distributions againshowed only a small inflation of the test statistics (l ¼ 1.05;Supplementary Fig. 1).After a joint analysis of phases 1 (restricted to cancer phenotype)
and 2, we prioritized 11 SNPs (Po 10!4) from previously unreportedregions of association for further analysis in phase 3, comprising 4,287CRC cases and 3,743 controls (Supplementary Table 1 online). Ofthese 11 SNPs, two were independently and consistently associatedwith CRC risk in phase 3 (P o 0.05; Supplementary Table 2 online)and taken forward for genotyping in phase 4, comprising eightadditional, independent CRC case-control series (10,731 CRC casesand 10,961 controls; Supplementary Table 1). For the remainingSNPs, there was little evidence of association in phase 3 (P 4 0.05),suggesting that the associations from the previous phases werefalse positives.Both SNPs (rs16892766 and rs10795668) showed associations in
phase 4 that were significant in this phase alone at P r 10!4, witheffects in the same direction as in phases 1, 2 and 3 (Table 1). By
Table 1 Summary of results for eleven SNPs selected for phase 3, together with three SNPs previously identified through fast trackingreplication analyses
ORb (95% CI) P value
SNP Gene Chr. Position (bp) MAFa Allelic Heterozygote Homozygote Phases 1 & 2 Phase 3 Phase 4 Combinedc
Fast-tracked loci
rs6983267 8q24.21 128482487 0.48 1.24 1.35 1.57 7.0 # 10–11 – – –
(1.17–1.33) (1.20–1.53) (1.38–1.80)
rs4939827 SMAD7 18q21.1 44707461 0.47 0.85 0.84 0.73 1.7 # 10–6 – – –
(0.80–0.91) (0.75–0.94) (0.64–0.83)
rs4779584 15q13.3 30782048 0.19 1.23 1.17 1.70 4.7 # 10–7 – – –
(1.14–1.34) (1.06–1.30) (1.35–2.14)
Systematically evaluated loci
rs16892766 EIF3H 8q23.3 117699995 0.07 1.25 1.27 1.43 7.4 # 10–8 0.02 2.9 # 10–11 3.3 # 10–18
(1.19–1.32) (1.20–1.34) (1.13–1.82)
rs4841306 MSRA 8q23.10 10159725 0.24 1.04 1.01 1.14 1.3 # 10–6 0.75 – 0.03
(1.00–1.08) (0.96–1.06) (1.04–1.26)
rs4822442 SLC2A11 22q11.23 22551295 0.29 0.95 1.00 0.82 1.0 # 10–5 0.78 – 0.01
(0.91–0.99) (0.94–1.05) (0.75–0.91)
rs12957142 18q12.3 36599267 0.20 1.10 1.08 1.29 1.4 # 10–5 0.54 – 5.6 # 10–4
(1.04–1.16) (1.01–1.16) (1.10–1.51)
rs2488704 10q22.1 76808630 0.33 1.11 1.11 1.22 1.5 # 10–5 0.12 – 3.8 # 10–5
(1.05–1.16) (1.03–1.19) (1.10–1.36)
rs4355419 4q13.1 63165287 0.41 1.10 1.08 1.22 1.6 # 10–5 0.09 – 2.4 # 10–5
(1.05–1.16) (1.01–1.16) (1.11–1.34)
rs2989734 FCN1 9q34.30 136941135 0.36 1.04 1.05 1.07 2.2 # 10–5 0.41 – 0.07
(1.00–1.08) (0.99–1.11) (0.98–1.16)
rs11590577 NXPH4 1p36.31 5824610 0.22 1.07 1.07 1.14 3.8 # 10–5 0.55 – 0.02
(1.01–1.13) (1.00–1.14) (0.99–1.32)
rs2164182 MAML2 11q21 95620677 0.05 0.89 0.87 1.00 5.8 # 10–5 0.37 – 0.03
(0.80–0.99) (0.78–0.98) (0.53–1.88)
rs2282428 KCNK1 1q42.2 231852793 0.32 1.10 1.08 1.24 9.2 # 10–5 0.07 – 6.3 # 10–5
(1.05–1.16) (1.01–1.15) (1.12–1.38)
rs10795668 10p14 8741225 0.33 0.89 0.87 0.80 9.8 # 10–5 7.4 # 10–7 1.8 # 10–5 2.5 # 10–13
(0.86–0.91) (0.83–0.91) (0.74–0.86)
aMAF in controls in phase 2. bORs estimated using data from phases 1–4. cCombined analysis based on cancer cases only (that is, 308 cases with adenoma excluded from phase 1).
624 VOLUME 40 [ NUMBER 5 [ MAY 2008 NATURE GENETICS
LET TERS©
2008
Nat
ure
Publ
ishi
ng G
roup
http
://w
ww
.nat
ure.
com
/nat
ureg
enet
ics

pooling genotype data for CRC cases and controls from all of the case-control series, we found unequivocal evidence for a relationshipbetween these SNPs and CRC risk (Fig. 1), with combined significancelevels in replication phases of P ¼ 8.7 # 10!18 and P ¼ 1.3 # 10!13,respectively. Including the discovery phase, significance levels were 3.3# 10!18 and 2.5 # 10!13, respectively. There was little evidence ofheterogeneity between studies (I2 ¼ 11.15, Phet ¼ 0.43 and I2 ¼ 14.81,Phet ¼ 0.10, respectively).Both rs16892766 and rs10795668 are within regions of fairly
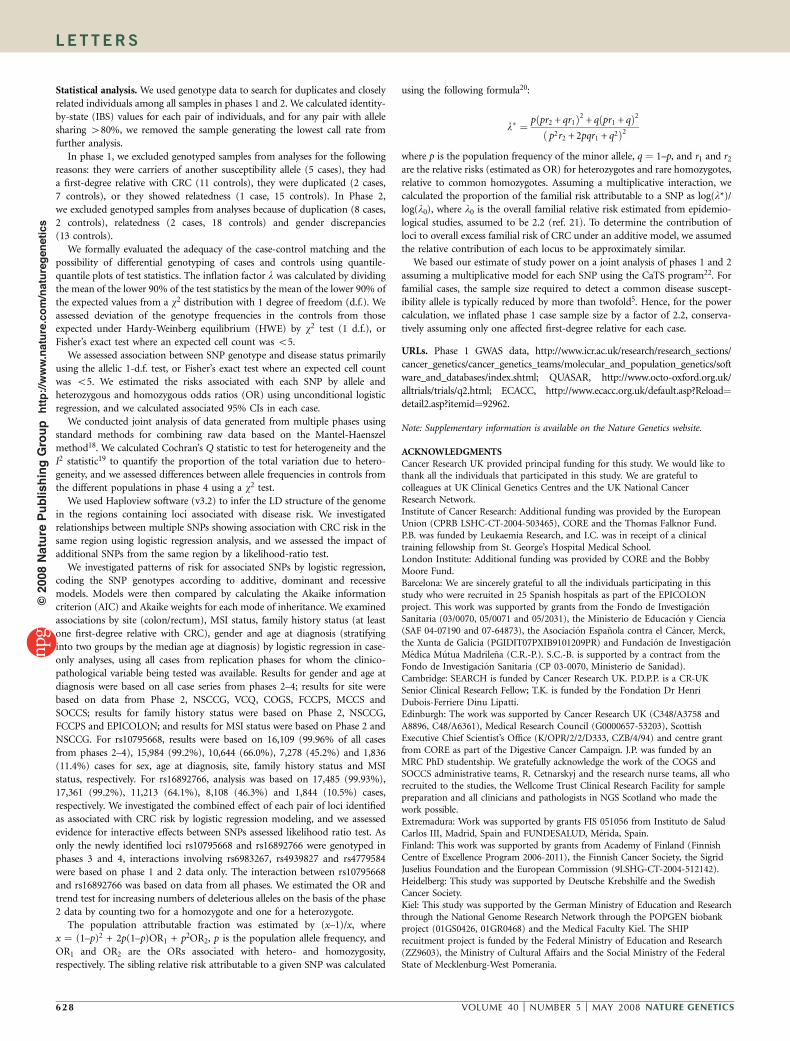
extensive linkage disequilibrium (LD). rs16892766 maps to 8q23.3and lies in a 220-kb LD block (117.65–117.87 Mb) that encompassesboth EIF3H and predicted transcript C8orf53 (Fig. 2). In addition tors16892766, two other SNPs in the region (rs11986063 and rs6983626)were associated with CRC risk at P o 10!4 in phases 1 and 2; both ofthese are correlated with rs16892766 (r2 ¼ 0.78 and r2 ¼ 0.43,respectively), and in a logistic regression analysis, the inclusion ofrs11986063 and rs6983626 did not significantly improve the fit of themodel compared with rs16892766 alone (P ¼ 0.43 and P ¼ 0.57,respectively), thus providing no evidence for more than one diseaselocus in this region. Furthermore, there was no LD betweenrs16892766 and the fast-tracked 8q24 variant rs6983267, which liesB10 Mb telomeric to rs16892766 (D ¼ 0.07, r2 ¼ 0.00).rs10795668 maps to an 82-kb LD block (8.73–8.81Mb) within
10p14 (Fig. 3). Three additional SNPs in this LD block (rs706771,rs7898455 and rs827405) showed evidence of association (P o 10!3)with CRC risk in the phase 1 and 2 joint analysis; two of these werestrongly correlated (rs706771 and rs7898455) and one was weaklycorrelated (rs827405) with rs10795668 (r2 ¼ 0.90, r2 ¼ 0.89 andr2 ¼ 0.13, respectively). Nevertheless, in a logistic regression analysis,the inclusion of each of these additional SNPs did not significantlyimprove the fit of the model compared with rs10795668 alone(P ¼ 0.96, 0.92 and 0.06, respectively), providing no evidence formore than one disease locus in the region. There are no provenprotein-coding transcripts in the vicinity of the marker SNPs that wetested, and no predicted genes within 0.4 Mb of rs10795668. Thenearest predicted genes are BC031880, located 0.4 Mb proximal tors10795668, and LOC389936, located 0.7 Mb distally.We assessed in more detail the pattern of risk associated with
rs16892766 and rs10795668. For rs10795668, there was no evidencefor differences in control allele frequencies between the populationsstudied (P ¼ 0.40). For rs16892766, the control minor allele frequency
(MAF) was similar in all populations (P ¼0.66), except for the Finnish population(FCCPS), where it was significantly higherthan that in all other cohorts (P ¼ 2.6 #10!7). For rs16892766, the minor allele wasassociated with increased risk of CRC in a
dose-dependent manner (ORhet ¼ 1.27, 95% CI ¼ 1.20–1.34 andORhom ¼ 1.43, 95% CI¼ 1.13–1.82). For rs10795668, the minor allelewas associated with decreased risk of CRC in a dose-dependentmanner (ORhet ¼ 0.87, 95% CI ¼ 0.83–0.91 and ORhom ¼ 0.80,95% CI¼ 0.74–0.86). For rs16892766, there was little difference in thefit provided by multiplicative and dominant models (most likelybecause of the low frequency of rare homozygotes), although arecessive model could be excluded. For rs10795668, genotype-specificORs were most compatible with a multiplicative model (Supplemen-tary Table 3 online). As the cases in phase 1 and one cohort (LFCCS)in phase 4 were enriched for familial CRC, the estimate of the riskratio could have varied from the other phases. We therefore alsocomputed ORs restricting analysis to data from those series unselectedfor family history. Odds ratios were marginally closer to unity: forrs16892766, ORhet ¼ 1.26 (95% CI ¼ 1.19–1.34) and ORhom ¼ 1.40(95% CI ¼ 1.10–1.79), and for rs10795668, ORhet ¼ 0.87 (95% CI ¼0.83–0.91) and ORhom ¼ 0.81 (95% CI ¼ 0.75–0.87).We assessed associations between clinico-pathological variables
and genotypes at rs16892766 and rs10795668 by case-only logisticregression. There was some evidence that the effect of rs10795668 onCRC risk varied by site of tumor (P ¼ 0.04, based on 10,644 casesfrom phase 2, NSCCG, VCQ, COGS, FCCPS, MCCS and SOCCS),with the susceptibility allele more common in rectal than colonictumors (Supplementary Table 4 online). The effect of rs16892766 wassignificantly stronger in younger cases (o60 years; P ¼ 0.01, based on17,361 cases from all case series in phases 2–4). We did not findany other significant associations between molecular and clinico-pathological data (specifically, sex, microsatellite instability or familyhistory status).When we modeled pairwise combinations of rs16892766 and
rs10795668 and the previously identified CRC variants rs6983267,rs4779584 and rs4939827, we did not find any evidence of interactiveeffects between any of the CRC disease loci identified thus far(P4 0.2 for all pairwise interactions; Supplementary Table 5 online),suggesting that each locus has an independent role in CRC develop-ment. Counting two for a homozygote, the risk of CRC increasedwith increasing numbers of variant alleles for the five loci (Ptrend ¼7.0 # 10!4; Supplementary Table 6 online).Although loss of heterozygosity involving chromosome 10p14 is
observed in CRC9, the underlying basis of the association identified atrs10795668 is presently unclear, and there is no evidence to implicate
Phase 1
a b
Phase 2
NSCCG
VCQ
COGS
EPICOLON
DFCCS
FCCPS
MCCS
SEARCH
SOCCS
POPGENSHIP
0.6 0.8 1.0 1.2
Odds ratio Odds ratio
0.6 0.8 1.0 1.21.6
Figure 1 Summary of association results forrs16892766 and rs10795668. (a,b) Forest plotsof per-allele odds ratios (ORs) for rs16892766(a) and rs10795668 (b). The x-axis correspondsto the trend OR. Each row corresponds to onesample series (see Supplementary Table 1).Boxes denote OR point estimates, their areasbeing proportional to the inverse variance weightof the estimate. Horizontal lines represent95% confidence intervals. The diamond (andbroken line) represents the summary OR, withthe 95% confidence interval given by its width.The unbroken vertical line is at the null value(OR ¼ 1.0).
NATURE GENETICS VOLUME 40 [ NUMBER 5 [ MAY 2008 625
LET TERS©
2008
Nat
ure
Publ
ishi
ng G
roup
http
://w
ww
.nat
ure.
com
/nat
ureg
enet
ics

the predicted gene FLJ3802842. For rs16892766, amplification andoverexpression of EIF3H, which regulates cell growth and viability, arefeatures of breast, prostate and hepatocellular cancers10,11. Mostmendelian cancer predisposition genes influence the risk of morethan one tumor type, and pleiotropic effects are also a feature of 8q24variants such as rs6983267, which affects the risk of both CRC2,12 andprostate carcinoma13,14. It is therefore entirely plausible that thevariants we have identified will influence the risk of not only CRC,but also other cancers. According to GWAS data from Cancer GeneticMarkers of Susceptibility (CGEMS) for breast and prostate cancer,however, there is no evidence that any of the variants other thanrs6983267 (which is associated with prostate cancer risk) influence therisk of either tumor.On the basis of allele frequencies and genotypic risks, we estimate
that the loci we have identified to date through our GWAS account forB3–4% of the excess familial CRC risk. However, irrespective of thenature of the causal variants, a high proportion of the population arecarriers of at-risk genotypes. Moreover, our data are compatible with apolygenic model in which individual alleles, each exerting a smalleffect, combine either additively or multiplicatively to produce muchlarger risks in carriers of multiple risk alleles. Based on our data, thefive SNPs identified thus far have potential to be clinically useful, giventhat theB3% of individuals carrying seven or more deleterious alleleshave a risk of CRC sufficient to warrant regular colonoscopicsurveillance under current guidelines. As further susceptibility loci
are identified, comprehensive panels of low-penetrance alleles arelikely to be of increasing clinical importance.Our GWAS analysis provides insight into the nature of low-
penetrance susceptibility to CRC in general. Given our staged design,we estimate that the power of our phases 1 and 2 in a joint analysis toidentify the five loci mapping to 8q24, 18q21, 15q13, 8q23.3 and10p14, stipulating a statistical threshold of P o 10!7, was 97%, 58%,62%, 10% and 4%, respectively. Thus, the power of our study to detectmajor common loci conferring risks of 1.2 or greater such as 8q24 washigh, and there are unlikely to be many additional CRC SNPs withsimilar effects for alleles with frequencies 420% in populations ofEuropean ancestry. In contrast, we had low power to detect alleles withsmaller effects and/or MAFs o 10%, as evidenced by the 8q23.3 and10p14 variants. Such variants may represent a much larger class ofsusceptibility loci for CRC. The 550K tagSNPs we used for the GWAScapture on average B80% of common SNPs in the Europeanpopulation (that is, r2 4 0.8), but only B12% of SNPs with MAFsof 5–10% are tagged at this level, limiting power to detect this class ofsusceptibility allele.In addition to the risk variants for CRC we previously identified,
our multistage GWAS has identified two additional CRC susceptibilityloci. Collectively, these findings demonstrate conclusively that part ofthe inherited risk of CRC is mediated through common alleles, and
5a
b
4
3
rs10795668rs706771
rs7898455rs827405
–log
10(P
)
2
1
08.6 8.7
Base position (Mb)
8.88.75 8.858.65
0117.65 117.7 117.75 117.8
Base position (Mb)
117.85 117.9 117.95
1
2
rs16892766rs11986063
rs6983626
3
4
5
6
7
8
–log
10(P
)
9 EIF3H
c8orf53
a
b
Figure 2 The 8q23.3 locus. (a) SNP single marker association results.This panel shows P values from the joint analysis of phases 1 and 2.All known genes (EIF3H) and predicted transcripts (c8orf53) in the localarea are shown. Positions are that of UCSC March 2006 assembly; NCBIbuild 36.1. The top SNP rs16892766 (red) was followed up in theadditional phases. (b) LD structure at 8q23.3. Shown in each box areestimated statistics of the square of the correlation coefficient (r 2),derived from phase 1 genotypes in Haploview software (v3.2). The valuesindicate the LD relationship between each pair of SNPs; the darker theshading, the greater extent of LD.
Figure 3 The 10p14 locus. (a) SNP single marker association results. Thispanel shows P values from the joint analysis of phases 1 and 2. No genes(predicted or otherwise) reside in the local area. Positions are that of UCSCMarch 2006 assembly; NCBI build 36.1. The top SNP rs10795668 (red)was followed up in the additional phases. (b) LD structure at 10p14.Shown in each box are estimated statistics of the square of the correlationcoefficient (r2), derived from phase I genotypes in Haploview software(v3.2). The values indicate the LD relationship between each pair of SNPs;the darker the shading, the greater extent of LD.
626 VOLUME 40 [ NUMBER 5 [ MAY 2008 NATURE GENETICS
LET TERS©
2008
Nat
ure
Publ
ishi
ng G
roup
http
://w
ww
.nat
ure.
com
/nat
ureg
enet
ics

provide justification for continuing the search for low-penetrancesusceptibility alleles. The detection of additional susceptibility loci islikely to require GWASs with more comprehensive coverage and largernumbers of cases and controls and combination of results acrossmultiple studies. In order to facilitate the identification of additionallow-penetrance alleles for CRC, we have made GWAS data from phase1 publicly accessible.
METHODSStudy participants. Supplementary Table 1 provides a summary of all casesand controls used in the study.
In phase 1, 940 cases with colorectal neoplasia (443 males, 497 females) wereascertained through the Colorectal Tumour Gene Identification (CORGI)consortium. All had at least one first-degree relative affected by CRC andone or more of the following phenotypes: CRC at age 75 or less; any colorectaladenoma at age 45 or less; Z3 colorectal adenomas at age 75 or less; or a large(41 cm diameter) or aggressive (villous and/or severely dysplastic) adenoma atage 75 or less. Controls (n ¼ 965; 439 males, 526 females) were spouses orpartners unaffected by cancer and without a personal family history (up tosecond-degree relatives) of colorectal neoplasia. All cases and controls were ofEuropean ancestry and from the UK.
In phase 2, 2,873 CRC cases (1,199 males, 1,674 females; mean age atdiagnosis ¼ 59.3 years; s.d. ± 8.7) were ascertained through two ongoinginitiatives at the Institute of Cancer Research/Royal Marsden Hospital NHSTrust (RMHNHST) from 1999 onwards: The National Study of ColorectalCancer Genetics (NSCCG) and the Royal Marsden Hospital Trust/Institute ofCancer Research Family History and DNA Registry. A total of 2,871 healthyindividuals were recruited as part of ongoing National Cancer ResearchNetwork genetic epidemiological studies, NSCCG (n ¼ 1,235), the GeneticLung Cancer Predisposition Study (GELCAPS) (1999–2004; n ¼ 917), and theRoyal Marsden Hospital Trust/Institute of Cancer Research Family History andDNA Registry (1999–2004; n ¼ 719). Controls (1,164 males, 1,707 females;mean age ¼ 59.8 years; s.d. ± 10.8) were the spouses or unrelated friends ofindividuals with malignancies. None had a personal history of malignancy attime of ascertainment. All cases and controls were of European ancestry andfrom the UK, and there were no obvious differences in the demography of casesand controls in terms of place of residence within the UK.
In phase 3, for NSCCG, 3,036 CRC cases (1,629 males, 1,407 females; meanage at diagnosis ¼ 59.4 years; s.d. ± 8.2) and 2,944 controls (1,183 males, 1,753females; mean age ¼ 55.2 years; s.d. ± 12.3) were ascertained through NSCCGpost 2005. For VCQ, cases comprised 202 additional individuals with colorectalcarcinoma from the CORGI study, 910 individuals from the VICTOR study, arandomized trial of VIOXX in patients with stage B and C colorectal cancer,and 139 individuals from the QUASAR2 clinical trial, a study that comparesstandard chemotherapy of capecitabine against capecitabine plus bevacizumab.Controls comprised 250 unaffected spouses or partners from the CORGI study,376 human random controls from ECACC and 173 population blood donors.Overall, 53% of the cases and 58% of the controls were female. All cases andcontrols were of European ancestry and from the UK.
In phase 4, COGS comprised 1,012 CRC cases (518 males, 494 females;mean age at diagnosis ¼ 49.6 years; s.d. ± 6.1) and 1,012 age- and sex-matchedcancer-free population controls (518 males, 494 females; mean age ¼ 51.0years; s.d. ± 5.9). Cases were enriched for genetic etiology by early age atonset (o55 years). Known dominant polyposis syndromes, HNPCC orbiallelic MYH mutation carriers were excluded. Control subjects werepopulation controls, matched by age (± 2 years), gender and area of residencewithin Scotland.
DFCCS comprised 783 familial CRC cases (370 males, 413 females; mean ageat diagnosis ¼ 53.4 years; s.d. ± 13.4) and 664 controls (251 males, 413 females;mean age ¼ 51.1 years; s.d. ± 11.3) ascertained at a clinically based geneticreference center in Leiden, the Netherlands.
EPICOLON comprised 515 CRC cases (305 males, 210 females; mean ageat diagnosis ¼ 70.6 years; s.d. ± 11.3) and 515 controls (290 males, 225 females;mean age ¼ 69.8 years; s.d. ± 11.7) ascertained through the EPICOLONinitiative, a prospective, multicenter, nationwide study aimed at compilingprominent epidemiological and clinical data with respect to hereditary
nonpolyposis colorectal cancer and other familial colorectal cancer forms inSpain. This cohort consists of an incident series collected in Barcelona.
FCCPS comprised 1,001 CRC cases (509 males, 492 females; mean age atdiagnosis ¼ 67.4 years; s.d. ± 11.8) and 1,034 controls (randomly selectedanonymous Finnish blood donors) ascertained in southeastern Finland.
MCCS comprised 515 CRC cases (270 males, 245 females; mean age atdiagnosis ¼ 66.2 years; s.d. ± 7.7) and 709 controls (352 males, 357 females;mean age ¼ 57.9 years; s.d. ± 7.0) ascertained in Melbourne, Australia, arandom sample selected from the MCCS (Melbourne Collaborative Cohortstudy) cohort.
POPGENSHIP comprised 2,569 CRC cases (1,382 males, 1,187 females;mean age at diagnosis ¼ 62.4 years; s.d. ± 9.9) and 2,699 controls (1,296 males,1,395 females; mean age ¼ 53.4 years; s.d. ± 15.8) ascertained through thePOPGEN and SHIP population-based biobank projects based in Kiel andGreifswald, Germany.
SEARCH comprised 2,253 CRC cases (1,287 males, 966 females; mean age atdiagnosis ¼ 59.1 years; s.d. ± 8.1) and 2,262 controls (949 males, 1,313 females;mean age ¼ 53.39 years; s.d. ± 7.61. Samples were ascertained through theSEARCH (Studies of Epidemiology and Risk Factors in Cancer Heredity) studybased in Cambridge, UK. Recruitment of colorectal cancers started in 2000;initial patient contact was through the general practitioner. Control sampleswere collected post 2003. Eligible individuals were sex and frequency matchedin 5-year age bands to cases.
SOCCS comprised 2,057 CRC cases (1,249 males, 808 females; mean age atdiagnosis ¼ 65.8 years; s.d. ± 8.4) and 2,111 population controls (1,257 males,854 females; mean age ¼ 67.9 years; s.d. ± 9.0) ascertained in Scotland. Caseswere taken from an independent, prospective, incident colorectal cancer caseseries and aged o80 years at diagnosis.
In all cases, CRC was defined according to the ninth revision of theInternational Classification of Diseases (ICD)15 by codes 153–154, and all caseshad pathologically proven adenocarcinoma or adenomas.
Collection of blood samples and clinico-pathologiocal informationfrom cases and controls was undertaken with informed consent andethical review board approval in accordance with the tenets of the Declarationof Helsinki.
Genotyping. DNA was extracted from samples using conventional methodol-ogies and quantified using PicoGreen (Invitrogen). In phase 1, we conducted agenome-wide scan of 550,163 tagSNPs using the Illumina Hap550 Bead Arraysaccording to the manufacturer’s protocols. DNA samples with GenCall scoreso0.25 at any locus were considered ‘no calls’. In Phase 2, we conductedgenotyping using Illumina Infinium custom arrays according to the manufac-turer’s protocols. A DNA sample was deemed to have failed if it generatedgenotypes at o95% of loci. For both phases 1 and 2, a SNP was deemed tohave failed if o95% of DNA samples generated a genotype at the locus. Toensure quality of genotyping, we genotyped a series of duplicate samples, andwe genotyped cases and controls in the same batches in both phases 1 and 2.
We conducted phase 3 genotyping by competitive allele-specific PCRKASPar chemistry (KBiosciences); primers and probes used are available onrequest. Genotyping quality control was tested using duplicate DNA sampleswithin studies and SNP assays, together with direct sequencing of subsets ofsamples to confirm genotyping accuracy. For all SNPs, we obtained 499.9%concordant results.
For phase 4 genotyping, we used the same method as phase 3 or standardalternatives depending upon facilities available locally. For all phase 4 seriestyped other than by KASPar, we confirmed local genotyping quality byundertaking KASPar genotyping in a random set of 48 samples, and we found498% concordance for all series.
We determined microsatellite instability (MSI) in CRCs as follows: we cut10-mm sections from formalin-fixed, paraffin-embedded tumors, lightly stainedthem with toluidine blue, and microdissected regions containing at least 60%tumor. We extracted tumor DNA using the QIAamp DNA Mini kit (Qiagen)according to the manufacturer’s instructions and genotyped the DNA for themononucleotide microsatellite loci BAT25 and BAT26, which are highlysensitive markers of MSI16. Samples showing previously unknown alleles ateither BAT26 or BAT25 or both markers were assigned as MSI (correspondingto a high level of instability, MSI-H17).
NATURE GENETICS VOLUME 40 [ NUMBER 5 [ MAY 2008 627
LET TERS©
2008
Nat
ure
Publ
ishi
ng G
roup
http
://w
ww
.nat
ure.
com
/nat
ureg
enet
ics
Statistical analysis. We used genotype data to search for duplicates and closelyrelated individuals among all samples in phases 1 and 2. We calculated identity-by-state (IBS) values for each pair of individuals, and for any pair with allelesharing 480%, we removed the sample generating the lowest call rate fromfurther analysis.
In phase 1, we excluded genotyped samples from analyses for the followingreasons: they were carriers of another susceptibility allele (5 cases), they hada first-degree relative with CRC (11 controls), they were duplicated (2 cases,7 controls), or they showed relatedness (1 case, 15 controls). In Phase 2,we excluded genotyped samples from analyses because of duplication (8 cases,2 controls), relatedness (2 cases, 18 controls) and gender discrepancies(13 controls).
We formally evaluated the adequacy of the case-control matching and thepossibility of differential genotyping of cases and controls using quantile-quantile plots of test statistics. The inflation factor l was calculated by dividingthe mean of the lower 90% of the test statistics by the mean of the lower 90% ofthe expected values from a w2 distribution with 1 degree of freedom (d.f.). Weassessed deviation of the genotype frequencies in the controls from thoseexpected under Hardy-Weinberg equilibrium (HWE) by w2 test (1 d.f.), orFisher’s exact test where an expected cell count was o5.
We assessed association between SNP genotype and disease status primarilyusing the allelic 1-d.f. test, or Fisher’s exact test where an expected cell countwas o5. We estimated the risks associated with each SNP by allele andheterozygous and homozygous odds ratios (OR) using unconditional logisticregression, and we calculated associated 95% CIs in each case.
We conducted joint analysis of data generated from multiple phases usingstandard methods for combining raw data based on the Mantel-Haenszelmethod18. We calculated Cochran’s Q statistic to test for heterogeneity and theI2 statistic19 to quantify the proportion of the total variation due to hetero-geneity, and we assessed differences between allele frequencies in controls fromthe different populations in phase 4 using a w2 test.
We used Haploview software (v3.2) to infer the LD structure of the genomein the regions containing loci associated with disease risk. We investigatedrelationships between multiple SNPs showing association with CRC risk in thesame region using logistic regression analysis, and we assessed the impact ofadditional SNPs from the same region by a likelihood-ratio test.
We investigated patterns of risk for associated SNPs by logistic regression,coding the SNP genotypes according to additive, dominant and recessivemodels. Models were then compared by calculating the Akaike informationcriterion (AIC) and Akaike weights for each mode of inheritance. We examinedassociations by site (colon/rectum), MSI status, family history status (at leastone first-degree relative with CRC), gender and age at diagnosis (stratifyinginto two groups by the median age at diagnosis) by logistic regression in case-only analyses, using all cases from replication phases for whom the clinico-pathological variable being tested was available. Results for gender and age atdiagnosis were based on all case series from phases 2–4; results for site werebased on data from Phase 2, NSCCG, VCQ, COGS, FCCPS, MCCS andSOCCS; results for family history status were based on Phase 2, NSCCG,FCCPS and EPICOLON; and results for MSI status were based on Phase 2 andNSCCG. For rs10795668, results were based on 16,109 (99.96% of all casesfrom phases 2–4), 15,984 (99.2%), 10,644 (66.0%), 7,278 (45.2%) and 1,836(11.4%) cases for sex, age at diagnosis, site, family history status and MSIstatus, respectively. For rs16892766, analysis was based on 17,485 (99.93%),17,361 (99.2%), 11,213 (64.1%), 8,108 (46.3%) and 1,844 (10.5%) cases,respectively. We investigated the combined effect of each pair of loci identifiedas associated with CRC risk by logistic regression modeling, and we assessedevidence for interactive effects between SNPs assessed likelihood ratio test. Asonly the newly identified loci rs10795668 and rs16892766 were genotyped inphases 3 and 4, interactions involving rs6983267, rs4939827 and rs4779584were based on phase 1 and 2 data only. The interaction between rs10795668and rs16892766 was based on data from all phases. We estimated the OR andtrend test for increasing numbers of deleterious alleles on the basis of the phase2 data by counting two for a homozygote and one for a heterozygote.
The population attributable fraction was estimated by (x–1)/x, wherex ¼ (1–p)2 + 2p(1–p)OR1 + p2OR2, p is the population allele frequency, andOR1 and OR2 are the ORs associated with hetero- and homozygosity,respectively. The sibling relative risk attributable to a given SNP was calculated
using the following formula20:
l$ ¼ pðpr2 + qr1Þ2 + qðpr1 + qÞ2
ð p2r2 + 2pqr1 + q2Þ2
where p is the population frequency of the minor allele, q ¼ 1–p, and r1 and r2are the relative risks (estimated as OR) for heterozygotes and rare homozygotes,relative to common homozygotes. Assuming a multiplicative interaction, wecalculated the proportion of the familial risk attributable to a SNP as log(l*)/log(l0), where l0 is the overall familial relative risk estimated from epidemio-logical studies, assumed to be 2.2 (ref. 21). To determine the contribution ofloci to overall excess familial risk of CRC under an additive model, we assumedthe relative contribution of each locus to be approximately similar.
We based our estimate of study power on a joint analysis of phases 1 and 2assuming a multiplicative model for each SNP using the CaTS program22. Forfamilial cases, the sample size required to detect a common disease suscept-ibility allele is typically reduced by more than twofold5. Hence, for the powercalculation, we inflated phase 1 case sample size by a factor of 2.2, conserva-tively assuming only one affected first-degree relative for each case.
URLs. Phase 1 GWAS data, http://www.icr.ac.uk/research/research_sections/cancer_genetics/cancer_genetics_teams/molecular_and_population_genetics/software_and_databases/index.shtml; QUASAR, http://www.octo-oxford.org.uk/alltrials/trials/q2.html; ECACC, http://www.ecacc.org.uk/default.asp?Reload¼detail2.asp?itemid¼92962.
Note: Supplementary information is available on the Nature Genetics website.
ACKNOWLEDGMENTSCancer Research UK provided principal funding for this study. We would like tothank all the individuals that participated in this study. We are grateful tocolleagues at UK Clinical Genetics Centres and the UK National CancerResearch Network.Institute of Cancer Research: Additional funding was provided by the EuropeanUnion (CPRB LSHC-CT-2004-503465), CORE and the Thomas Falknor Fund.P.B. was funded by Leukaemia Research, and I.C. was in receipt of a clinicaltraining fellowship from St. George’s Hospital Medical School.London Institute: Additional funding was provided by CORE and the BobbyMoore Fund.Barcelona: We are sincerely grateful to all the individuals participating in thisstudy who were recruited in 25 Spanish hospitals as part of the EPICOLONproject. This work was supported by grants from the Fondo de InvestigacionSanitaria (03/0070, 05/0071 and 05/2031), the Ministerio de Educacion y Ciencia(SAF 04-07190 and 07-64873), the Asociacion Espanola contra el Cancer, Merck,the Xunta de Galicia (PGIDIT07PXIB9101209PR) and Fundacion de InvestigacionMedica Mutua Madrilena (C.R.-P.). S.C.-B. is supported by a contract from theFondo de Investigacion Sanitaria (CP 03-0070, Ministerio de Sanidad).Cambridge: SEARCH is funded by Cancer Research UK. P.D.P.P. is a CR-UKSenior Clinical Research Fellow; T.K. is funded by the Fondation Dr HenriDubois-Ferriere Dinu Lipatti.Edinburgh: The work was supported by Cancer Research UK (C348/A3758 andA8896, C48/A6361), Medical Research Council (G0000657-53203), ScottishExecutive Chief Scientist’s Office (K/OPR/2/2/D333, CZB/4/94) and centre grantfrom CORE as part of the Digestive Cancer Campaign. J.P. was funded by anMRC PhD studentship. We gratefully acknowledge the work of the COGS andSOCCS administrative teams, R. Cetnarskyj and the research nurse teams, all whorecruited to the studies, the Wellcome Trust Clinical Research Facility for samplepreparation and all clinicians and pathologists in NGS Scotland who made thework possible.Extremadura: Work was supported by grants FIS 051056 from Instituto de SaludCarlos III, Madrid, Spain and FUNDESALUD, Merida, Spain.Finland: This work was supported by grants from Academy of Finland (FinnishCentre of Excellence Program 2006-2011), the Finnish Cancer Society, the SigridJuselius Foundation and the European Commission (9LSHG-CT-2004-512142).Heidelberg: This study was supported by Deutsche Krebshilfe and the SwedishCancer Society.Kiel: This study was supported by the German Ministry of Education and Researchthrough the National Genome Research Network through the POPGEN biobankproject (01GS0426, 01GR0468) and the Medical Faculty Kiel. The SHIPrecuitment project is funded by the Federal Ministry of Education and Research(ZZ9603), the Ministry of Cultural Affairs and the Social Ministry of the FederalState of Mecklenburg-West Pomerania.
628 VOLUME 40 [ NUMBER 5 [ MAY 2008 NATURE GENETICS
LET TERS©
2008
Nat
ure
Publ
ishi
ng G
roup
http
://w
ww
.nat
ure.
com
/nat
ureg
enet
ics

Leiden: DFCCS was supported by Dutch Cancer Society grant UL2005-3247 andapproved by the local Medical Ethical Committee (protocol P01.019); sampleswere handled according to Code Proper Secondary Use of Human Tissue by theDutch Federation of Medical Sciences.Madrid: Work was supported by the Fondo de Investigacion Sanitaria (PI070316and RD06/0020/0021).Melbourne: The Melbourne Collaborative Cohort Study is supported by NationalHealth and Medical Research Council (NHMRC) grants 209057, 251533 and396414 and receives core funding and infrastructure support from The CancerCouncil Victoria. J.L.H. is an NHMRC Australia Fellow and M.C.S. is anNHMRC Senior Research Fellow. We would like to acknowledge F. Odefreyfor performing the genotyping.Prague: This study was supported by the grant GACR 310/07/1430.
AUTHOR CONTRIBUTIONSR.H. and I.T. designed the study and obtained financial support. The manuscriptwas drafted by R.H., I.T. and E.W., with substantial contributions from L.C.-C.and A.P. Statistical analyses were conducted primarily by E.W.Institute of Cancer Research: Recruitment of affected individuals and acquisitionof samples were undertaken by S.P., W.W., J.P., R.G. and members of the NSCCG.Sample preparation was performed by P.B., A.P., M.Q., K.S., S.F., J.V. and S.L.Histology review was done by I.C. Testing of MSI was performed by S.L. and I.C.Genotyping was performed and coordinated by P.B., S.F., J.V., K.S. and A.P. E.W.performed statistical analyses. E.W. and A.P. performed bioinformatic analyses.London Institute: Recruitment of affected individuals and acquisition of sampleswere undertaken by Z.K., E.B., M.G., L.M., H.T., T.B., G.E., E.M., A.L. and mem-bers of the CORGI Consortium (D.R.G., A.L., T.B., E.R.M. and H.T.). Samplepreparation was done by K.H., S.S., E.J., A.R. and Z.K. Genotyping was performedand coordinated by L.C.-C., K. Howarth, A.P., S. Spain, A.W., E.J., A.R., Z.K. andE.D. J.-B.C. performed bioinformatic and statistical analyses.Barcelona: Recruitment of affected individuals and acquisition of samples wereundertaken by S.C.-B., C.R.-P., A. Carracedo, A. Castells and members of theEPICOLON Consortium. Sample preparation was performed by S.C.-B., C.R.-P.,A. Carracedo and A. Castells. Genotyping was performed and coordinated byS.C.-B., C.R.-P., A. Carracedo and A. Castells.Leiden: Recruitment of affected individuals and acquisition of samples wereundertaken by H.M.; sample preparation was performed by J.T.W. and T.V.W.;genotyping was performed and coordinated by J.T.W. and T.V.W.Edinburgh: M.G.D. and H.C. designed the work in Scotland and obtainedfinancial support. S.M.F., A.T., R.A.B. and J.D.G.P. contributed substantially togenotyping of Scottish sample set and to analysis of resultant data from Scotland.Melbourne: G.G.G. and J.L.H. designed the Melbourne Collaborative CohortStudy and obtained financial support. G.G.G., J.L.H., M.C.S. and G.S. recruitedaffected individuals and acquired samples. Sample preparation was supervised byM.C.S. Genotyping was coordinated by M.C.S. and G.S.Finland: I.N., S.T., A.K. and L.A.A. provided the Helsinki cohort withinformation on tumor site, microsatellite instability, family history and survival,as well as selected controls matched within the population.Kiel: C.S., S.B. and J.H. performed and supervised the recruitment and pheno-typing in Kiel; H.V. participated in the SHIP project and represents theGreifswald contribution.Cambridge: Genotyping was undertaken by T.K. under the supervision of P.P.All authors are members of the colorectal cancer association study consortium(CRACAC), and all authors contributed to the final paper.
Published online at http://www.nature.com/naturegeneticsReprints and permissions information is available online at http://npg.nature.com/reprintsandpermissions
1. Aaltonen, L., Johns, L., Jarvinen, H., Mecklin, J.P. & Houlston, R. Explaining thefamilial colorectal cancer risk associated with mismatch repair (MMR)-deficient andMMR-stable tumors. Clin. Cancer Res. 13, 356–361 (2007).
2. Tomlinson, I. et al. A genome-wide association scan of tag SNPs identifies asusceptibility variant for colorectal cancer at 8q24.21. Nat. Genet. 39, 984–988(2007).
3. Broderick, P. et al. A genome-wide association study shows that commonalleles of SMAD7 influence colorectal cancer risk. Nat. Genet. 39, 1315–1317(2007).
4. Jaeger, E. et al. Common genetic variants at the CRAC1 (HMPS) locus on chromosome15q13.3 influence colorectal cancer risk. Nat. Genet. 40, 26–28 (2008).
5. Antoniou, A.C. & Easton, D.F. Polygenic inheritance of breast cancer: implications fordesign of association studies. Genet. Epidemiol. 25, 190–202 (2003).
6. Houlston, R.S. & Peto, J. The future of association studies of common cancers. Hum.Genet. 112, 434–435 (2003).
7. Clayton, D.G. et al. Population structure, differential bias and genomic controlin a large-scale, case-control association study. Nat. Genet. 37, 1243–1246(2005).
8. Jaeger, E.E. et al. An ancestral Ashkenazi haplotype at the HMPS/CRAC1 locus on15q13-q14 is associated with hereditary mixed polyposis syndrome. Am. J. Hum.Genet. 72, 1261–1267 (2003).
9. Shima, H. et al. Loss of heterozygosity on chromosome 10p14-p15 in colorectalcarcinoma. Pathobiology 72, 220–224 (2005).
10. Savinainen, K.J. et al. Expression and copy number analysis of TRPS1, EIF3S3and MYC genes in breast and prostate cancer. Br. J. Cancer 90, 1041–1046(2004).
11. Okamoto, H., Yasui, K., Zhao, C., Arii, S. & Inazawa, J. PTK2 and EIF3S3 genes maybe amplification targets at 8q23-q24 and are associated with large hepatocellularcarcinomas. Hepatology 38, 1242–1249 (2003).
12. Zanke, B.W. et al. Genome-wide association scan identifies a colorectal cancersusceptibility locus on chromosome 8q24. Nat. Genet. 39, 989–994 (2007).
13. Haiman, C.A. et al.Multiple regions within 8q24 independently affect risk for prostatecancer. Nat. Genet. 39, 638–644 (2007).
14. Haiman, C.A. et al. A common genetic risk factor for colorectal and prostate cancer.Nat. Genet. 39, 954–956 (2007).
15. World Health Organization. International Classification of Diseases, 1975 Revision(World Health Organization, Geneva, Switzerland, 1977).
16. Zhou, X.P. et al. Determination of the replication error phenotype in human tumorswithout the requirement for matching normal DNA by analysis of mononucleotiderepeat microsatellites. Genes Chromosom. Cancer 21, 101–107 (1998).
17. Boland, C.R. et al. A National Cancer Institute workshop on microsatellite instabilityfor cancer detection and familial predisposition: development of international criteriafor the determination of microsatellite instability in colorectal cancer. Cancer Res. 58,5248–5257 (1998).
18. Petitti, D. Meta-analysis Decision Analysis and Cost-effectiveness Analysis (OxfordUniversity Press, New York, 1994).
19. Higgins, J.P. & Thompson, S.G. Quantifying heterogeneity in a meta-analysis. Stat.Med. 21, 1539–1558 (2002).
20. Cox, A. et al. A common coding variant in CASP8 is associated with breast cancer risk.Nat. Genet. 39, 352–358 (2007).
21. Johns, L.E. & Houlston, R.S. A systematic review and meta-analysis of familialcolorectal cancer risk. Am. J. Gastroenterol. 96, 2992–3003 (2001).
22. Skol, A.D., Scott, L.J., Abecasis, G.R. & Boehnke, M. Joint analysis is more efficientthan replication-based analysis for two-stage genome-wide association studies. Nat.Genet. 38, 209–213 (2006).
1Molecular and Population Genetics Laboratory, London Research Institute, Cancer Research UK, London WC2A 3PX, UK. 2Section of Cancer Genetics, Institute ofCancer Research, Sutton SM2 5NG, UK. 3Colon Cancer Genetics Group, Institute of Genetics and Molecular Medicine, University of Edinburgh and MRC HumanGenetics Unit, Western General Hospital, Edinburgh EH4 2XU, UK. 4Department of Medical Genetics, St Mary’s Hospital, Manchester M13 0JH, UK. 5Departmentof Medical and Molecular Genetics, University of Birmingham School of Medicine and West Midlands Regional Genetics Service, Birmingham Women’s Hospital,Edgbaston, Birmingham B15 2TG, UK. 6Family Cancer Clinic, St Mark’s Hospital, Watford Road, Harrow HA1 3UJ, UK. 7Non-Communicable DiseaseEpidemiology Unit, London School of Hygiene and Tropical Medicine, London WC1E 7HT, UK. 8Cancer Research UK Epidemiology and Genetics Unit, Institute ofCancer Research, London SM2 5NG, UK. 9Section of Epidemiology and Biostatistics, Leeds Institute of Molecular Medicine, University of Leeds, Leeds LS9 7TF,UK. 10Birmingham Clinical Trials Unit, University of Birmingham, Birmingham B15 2TA, UK. 11University of Southampton and Wessex Clinical Genetics Service,Mailpoint 105, Princess Anne Hospital, Coxford Road, Southampton SO16 5YA, UK. 12Department of Clinical Pharmacology, Oxford University, Radcliffe Infirmary,Oxford OX2 6HA, UK. 13Department of General and Thoracic Surgery, University Hospital Schleswig-Holstein, Arnold-Heller-Stra!e 3, 24105 Kiel, Germany.14POPGEN Biobank, University Hospital Schleswig-Holstein, Schittenhelmstr. 12, 24105 Kiel, Germany. 15Department of Community Medicine and SHIPBiobank, University Hospital of the Ernst-Moritz-Arndt University, Walther Rathenau Str. 1, 17487 Greifswald, Germany. 16Department of General InternalMedicine, University Hospital Schleswig-Holstein, Schittenhelmstr. 12, 24105 Kiel, Germany. 17Institute for Clinical Molecular Biology, University HospitalSchleswig-Holstein, Schittenhelmstr. 12, 24105 Kiel, Germany. 18Cancer Research United Kingdom Department of Oncology, University of Cambridge,Strangeways Research Laboratory, Cambridge CB1 8RN, UK. 19Department of Pathology and 20Center for Human and Clinical Genetics, Leiden University MedicalCenter, Albinusdreef 2, 2333ZA Leiden, The Netherlands. 21Centre for Molecular, Environmental, Genetic and Analytic Epidemiology, The University of Melbourne,723 Swanston Street, Carlton VIC 3053, Australia. 22Genetic Epidemiology Laboratory, Department of Pathology, The University of Melbourne, Grattan Street,Parkville VIC 3052, Australia. 23Cancer Epidemiology Centre, The Cancer Council Victoria, 1 Rathdowne Street, Carlton VIC 3053, Australia. 24Department of
NATURE GENETICS VOLUME 40 [ NUMBER 5 [ MAY 2008 629
LET TERS©
2008
Nat
ure
Publ
ishi
ng G
roup
http
://w
ww
.nat
ure.
com
/nat
ureg
enet
ics

Gastroenterology, Institut de Malalties Digestives i Metaboliques, Hospital Clınic, CIBER-EHD, Institut d’Investigacions Biomediques August Pi i Sunyer (IDIBAPS),Barcelona, Catalonia, Spain. 25Genomic Medicine Group, Fundacion Publica Galega de Medicina Xenomica (FPGMX), Spanish National Genotyping Center(CeGen)-USC, CIBERER, Hospital Clınico, Santiago de Compostela, Galicia, Spain. 26Division of Molecular Genetic Epidemiology, German Cancer Research Center(DKFZ), Im Neuenheimer Feld 580, D-69120 Heidelberg, Germany. 27Center for Family and Community Medicine, Karolinska Institute, 141 83 Huddinge,Sweden. 28Institute of Experimental Medicine at the Academy of Sciences, Czech Rep., Videnska 1083, 14200 Prague, Czech Republic. 29Department of MedicalOncology and Clinical Haematology, Western Hospital, Footscray 3011, Victoria, Australia. 30The University of Hong Kong, Hong Kong. 31Department ofPharmacology, Medical School, University of Extremadura, Badajoz, Spain. 32Service of Gastroenterology, San Carlos University Hospital, Madrid, Spain.33Molecular Oncology Laboratory, Hospital San Carlos, 28040 Madrid, Spain. 34Department of Medical Genetics, Genome-Scale Biology Research Program,Biomedicum Helsinki, University of Helsinki, Helsinki, Finland. 35Bioinformatics and Biostatistics, London Research Institute, Cancer Research UK, London WC2A3PX, UK. 36Public Health Sciences, University of Edinburgh, Edinburgh EH8 9AG, UK. 37A full list of authors is provided in the Supplementary Note online.38These authors contributed equally to this work. Correspondence should be addressed to R.H. ([email protected]) or I.T. ([email protected]).
630 VOLUME 40 [ NUMBER 5 [ MAY 2008 NATURE GENETICS
LET TERS©
2008
Nat
ure
Publ
ishi
ng G
roup
http
://w
ww
.nat
ure.
com
/nat
ureg
enet
ics
Copyright © 2022 FDOKUMEN