An overview of age-related changes in the scalp distribution of P3b
16
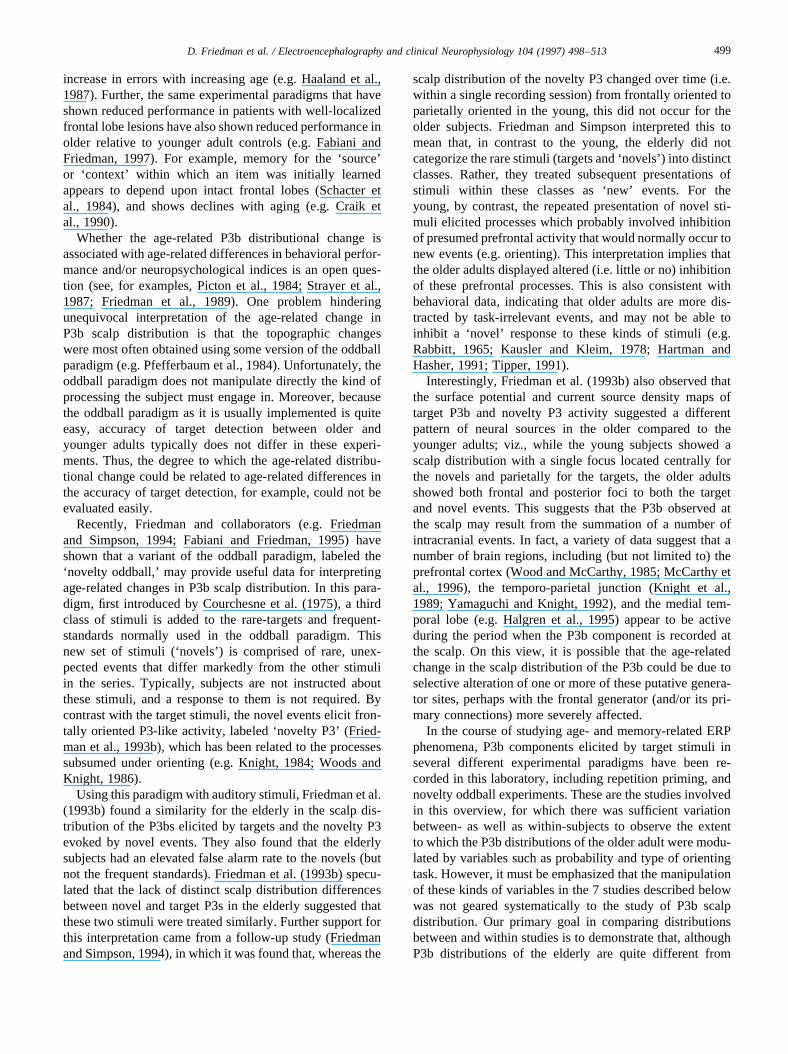
An overview of age-related changes in the scalp distribution of P3b David Friedman a, *, Victoria Kazmerski b , Monica Fabiani c a Cognitive Electrophysiology Laboratory, New York State Psychiatric Institute, 722 West 168th Street, Unit 58; Annex Room 308, New York, NY 10032, USA b Pennsylvania State University, The Behrend College, Erie, PA, USA c Department of Psychology, University of Missouri, McAlester Hall, Columbia, MO, USA Accepted for publication: 14 April 1997 Abstract In this overview of 7 studies, the scalp distribution of the P3b component (i.e. the P3 or P300) of the event-related potential elicited by target events in young and older adults was assessed. The target P3b data were recorded in either auditory oddball paradigms or in visual study tasks in which orienting activity was manipulated (as a within-subjects variable) in investigations of indirect memory. Some of the studies required choice reaction time responses, whereas others required responses only to the target stimuli. Motor response requirements had a profound effect on the P3b scalp distribution of older but not of younger subjects. The presence of a frontally oriented scalp focus in the topographies of the older adults in most of the tasks described here is consistent with older adults continuing to use prefrontal processes for stimuli that should have already been well encoded and/or categorized. However, although older subjects generally had different P3b scalp distributions than younger subjects, their scalp distributions were modulated similarly by task requirements. These data suggest that similar mechanisms modulate the scalp distribution of P3b in older compared to younger adults. However, in the older adult, these scalp distribution changes in response to task demands are superimposed on a frontally oriented scalp focus due to a putative frontal lobe contribution to target P3b topography. 1997 Elsevier Science Ireland Ltd. Keywords: P3b component; Aging; Scalp topography; Frontal cortex 1. Introduction This paper reports an overview of 7 studies conducted in our laboratory, investigating changes in the scalp distribu- tion of the P3 (P300 or P3b) component of the event-related potential (ERP) as a function of aging in a variety of experi- mental paradigms. The P3b is a positive potential elicited typically by attended, task-relevant, infrequently occurring ‘target’ events (to which the subject must respond in some fashion), with a peak latency between 300 and 1000 ms post-stimulus (depending upon stimulus modality, the com- plexity of the task and the clinical sample tested). Several reports have described age-related changes in the topogra- phy of the P3b component elicited during a variety of para- digms in response to target stimuli in both the auditory (e.g. Pfefferbaum et al., 1984; Picton et al., 1984; Ford and Pfef- ferbaum, 1991; Verleger et al., 1991; Friedman et al., 1993b) and visual (e.g. Strayer et al., 1987; Friedman et al., 1989) modalities (for reviews, see Ford and Pfeffer- baum, 1985; Polich, 1991; Friedman, 1995; Polich, 1996). Typically, the change in scalp distribution, which appears to begin in middle age (Mullis et al., 1985), takes the form of a change from a sharply focused parietal-maximum distribu- tion in childhood and adolescence, to a distribution that becomes more equipotential across the scalp midline with increasing age. This age-related change in scalp topography has been interpreted by some (e.g. Yamaguchi and Knight, 1991; Fabiani and Friedman, 1995; Nielsen-Bohlman and Knight, 1995) as indicative of age-related changes in the efficiency of frontal lobe functioning. Consistent with this interpreta- tion, several reports in the neuropsychological and cognitive aging literature have also pointed to age-related changes in frontal lobe function. For example, using psychometric instruments designed to identify patients with lesions loca- lized to the frontal lobes (e.g. the Wisconsin Card Sorting Test or WCST), a number of investigators have noted an Electroencephalography and clinical Neurophysiology 104 (1997) 498–513 0168-5597/97/$17.00 1997 Elsevier Science Ireland Ltd. All rights reserved PII S0168-5597(97)00036-1 EEP 96126 * Corresponding author. Tel.: +1 212 9602476; fax: +1 212 7812661; e-mail: [email protected]
Transcript of An overview of age-related changes in the scalp distribution of P3b
An overview of age-related changes in the scalp distribution of P3b
David Friedmana,*, Victoria Kazmerskib, Monica Fabianic
aCognitive Electrophysiology Laboratory, New York State Psychiatric Institute, 722 West 168th Street, Unit 58; Annex Room 308, New York, NY 10032, USAbPennsylvania State University, The Behrend College, Erie, PA, USA
cDepartment of Psychology, University of Missouri, McAlester Hall, Columbia, MO, USA
Accepted for publication: 14 April 1997
Abstract
In this overview of 7 studies, the scalp distribution of the P3b component (i.e. the P3 or P300) of the event-related potential elicited bytarget events in young and older adults was assessed. The target P3b data were recorded in either auditory oddball paradigms or in visualstudy tasks in which orienting activity was manipulated (as a within-subjects variable) in investigations of indirect memory. Some of thestudies required choice reaction time responses, whereas others required responses only to the target stimuli. Motor response requirementshad a profound effect on the P3b scalp distribution of older but not of younger subjects. The presence of a frontally oriented scalp focus inthe topographies of the older adults in most of the tasks described here is consistent with older adults continuing to use prefrontal processesfor stimuli that should have already been well encoded and/or categorized. However, although older subjects generally had different P3bscalp distributions than younger subjects, their scalp distributions were modulated similarly by task requirements. These data suggest thatsimilar mechanisms modulate the scalp distribution of P3b in older compared to younger adults. However, in the older adult, these scalpdistribution changes in response to task demands are superimposed on a frontally oriented scalp focus due to a putative frontal lobecontribution to target P3b topography. 1997 Elsevier Science Ireland Ltd.
Keywords:P3b component; Aging; Scalp topography; Frontal cortex
1. Introduction
This paper reports an overview of 7 studies conducted inour laboratory, investigating changes in the scalp distribu-tion of the P3 (P300 or P3b) component of the event-relatedpotential (ERP) as a function of aging in a variety of experi-mental paradigms. The P3b is a positive potential elicitedtypically by attended, task-relevant, infrequently occurring‘target’ events (to which the subject must respond in somefashion), with a peak latency between 300 and 1000 mspost-stimulus (depending upon stimulus modality, the com-plexity of the task and the clinical sample tested). Severalreports have described age-related changes in the topogra-phy of the P3b component elicited during a variety of para-digms in response to target stimuli in both the auditory (e.g.Pfefferbaum et al., 1984; Picton et al., 1984; Ford and Pfef-ferbaum, 1991; Verleger et al., 1991; Friedman et al.,
1993b) and visual (e.g. Strayer et al., 1987; Friedman etal., 1989) modalities (for reviews, see Ford and Pfeffer-baum, 1985; Polich, 1991; Friedman, 1995; Polich, 1996).Typically, the change in scalp distribution, which appears tobegin in middle age (Mullis et al., 1985), takes the form of achange from a sharply focused parietal-maximum distribu-tion in childhood and adolescence, to a distribution thatbecomes more equipotential across the scalp midline withincreasing age.
This age-related change in scalp topography has beeninterpreted by some (e.g. Yamaguchi and Knight, 1991;Fabiani and Friedman, 1995; Nielsen-Bohlman and Knight,1995) as indicative of age-related changes in the efficiencyof frontal lobe functioning. Consistent with this interpreta-tion, several reports in the neuropsychological and cognitiveaging literature have also pointed to age-related changes infrontal lobe function. For example, using psychometricinstruments designed to identify patients with lesions loca-lized to the frontal lobes (e.g. the Wisconsin Card SortingTest or WCST), a number of investigators have noted an
Electroencephalography and clinical Neurophysiology 104 (1997) 498–513
0168-5597/97/$17.00 1997 Elsevier Science Ireland Ltd. All rights reservedPII S0168-5597(97)00036-1 EEP 96126
* Corresponding author. Tel.: +1 212 9602476; fax: +1 212 7812661;e-mail: [email protected]
increase in errors with increasing age (e.g. Haaland et al.,1987). Further, the same experimental paradigms that haveshown reduced performance in patients with well-localizedfrontal lobe lesions have also shown reduced performance inolder relative to younger adult controls (e.g. Fabiani andFriedman, 1997). For example, memory for the ‘source’or ‘context’ within which an item was initially learnedappears to depend upon intact frontal lobes (Schacter etal., 1984), and shows declines with aging (e.g. Craik etal., 1990).
Whether the age-related P3b distributional change isassociated with age-related differences in behavioral perfor-mance and/or neuropsychological indices is an open ques-tion (see, for examples, Picton et al., 1984; Strayer et al.,1987; Friedman et al., 1989). One problem hinderingunequivocal interpretation of the age-related change inP3b scalp distribution is that the topographic changeswere most often obtained using some version of the oddballparadigm (e.g. Pfefferbaum et al., 1984). Unfortunately, theoddball paradigm does not manipulate directly the kind ofprocessing the subject must engage in. Moreover, becausethe oddball paradigm as it is usually implemented is quiteeasy, accuracy of target detection between older andyounger adults typically does not differ in these experi-ments. Thus, the degree to which the age-related distribu-tional change could be related to age-related differences inthe accuracy of target detection, for example, could not beevaluated easily.
Recently, Friedman and collaborators (e.g. Friedmanand Simpson, 1994; Fabiani and Friedman, 1995) haveshown that a variant of the oddball paradigm, labeled the‘novelty oddball,’ may provide useful data for interpretingage-related changes in P3b scalp distribution. In this para-digm, first introduced by Courchesne et al. (1975), a thirdclass of stimuli is added to the rare-targets and frequent-standards normally used in the oddball paradigm. Thisnew set of stimuli (‘novels’) is comprised of rare, unex-pected events that differ markedly from the other stimuliin the series. Typically, subjects are not instructed aboutthese stimuli, and a response to them is not required. Bycontrast with the target stimuli, the novel events elicit fron-tally oriented P3-like activity, labeled ‘novelty P3’ (Fried-man et al., 1993b), which has been related to the processessubsumed under orienting (e.g. Knight, 1984; Woods andKnight, 1986).
Using this paradigm with auditory stimuli, Friedman et al.(1993b) found a similarity for the elderly in the scalp dis-tribution of the P3bs elicited by targets and the novelty P3evoked by novel events. They also found that the elderlysubjects had an elevated false alarm rate to the novels (butnot the frequent standards). Friedman et al. (1993b) specu-lated that the lack of distinct scalp distribution differencesbetween novel and target P3s in the elderly suggested thatthese two stimuli were treated similarly. Further support forthis interpretation came from a follow-up study (Friedmanand Simpson, 1994), in which it was found that, whereas the
scalp distribution of the novelty P3 changed over time (i.e.within a single recording session) from frontally oriented toparietally oriented in the young, this did not occur for theolder subjects. Friedman and Simpson interpreted this tomean that, in contrast to the young, the elderly did notcategorize the rare stimuli (targets and ‘novels’) into distinctclasses. Rather, they treated subsequent presentations ofstimuli within these classes as ‘new’ events. For theyoung, by contrast, the repeated presentation of novel sti-muli elicited processes which probably involved inhibitionof presumed prefrontal activity that would normally occur tonew events (e.g. orienting). This interpretation implies thatthe older adults displayed altered (i.e. little or no) inhibitionof these prefrontal processes. This is also consistent withbehavioral data, indicating that older adults are more dis-tracted by task-irrelevant events, and may not be able toinhibit a ‘novel’ response to these kinds of stimuli (e.g.Rabbitt, 1965; Kausler and Kleim, 1978; Hartman andHasher, 1991; Tipper, 1991).
Interestingly, Friedman et al. (1993b) also observed thatthe surface potential and current source density maps oftarget P3b and novelty P3 activity suggested a differentpattern of neural sources in the older compared to theyounger adults; viz., while the young subjects showed ascalp distribution with a single focus located centrally forthe novels and parietally for the targets, the older adultsshowed both frontal and posterior foci to both the targetand novel events. This suggests that the P3b observed atthe scalp may result from the summation of a number ofintracranial events. In fact, a variety of data suggest that anumber of brain regions, including (but not limited to) theprefrontal cortex (Wood and McCarthy, 1985; McCarthy etal., 1996), the temporo-parietal junction (Knight et al.,1989; Yamaguchi and Knight, 1992), and the medial tem-poral lobe (e.g. Halgren et al., 1995) appear to be activeduring the period when the P3b component is recorded atthe scalp. On this view, it is possible that the age-relatedchange in the scalp distribution of the P3b could be due toselective alteration of one or more of these putative genera-tor sites, perhaps with the frontal generator (and/or its pri-mary connections) more severely affected.
In the course of studying age- and memory-related ERPphenomena, P3b components elicited by target stimuli inseveral different experimental paradigms have been re-corded in this laboratory, including repetition priming, andnovelty oddball experiments. These are the studies involvedin this overview, for which there was sufficient variationbetween- as well as within-subjects to observe the extentto which the P3b distributions of the older adult were modu-lated by variables such as probability and type of orientingtask. However, it must be emphasized that the manipulationof these kinds of variables in the 7 studies described belowwas not geared systematically to the study of P3b scalpdistribution. Our primary goal in comparing distributionsbetween and within studies is to demonstrate that, althoughP3b distributions of the elderly are quite different from
499D. Friedman et al. / Electroencephalography and clinical Neurophysiology 104 (1997) 498–513
those of their younger adult counterparts in many circum-stances, the scalp distribution of the older adult is alsomodulated by task and processing characteristics. Althoughreduced amplitude as well as prolonged latency characterizethe P3b components of older adults (see reviews by Fried-man, 1995; Polich, 1996), these two aging effects do notappear to be related directly to the age-related changes inscalp topography of the P3b described above. Only the age-related changes in P3b scalp distribution are consideredbelow.
2. Methods and materials
2.1. Subject characteristics
The participants were young and old volunteers recruitedthrough various sources, including senior centers within thevicinity of the Columbia Presbyterian Medical Center, localpostings, and advertisements in local newspapers. In someof the studies reported below, middle-aged subjects werealso recruited. Their data are not described here becausethe focus is on the young versus old comparisons. Thereader is referred to the appropriate publications for inspec-tion of the data of the middle-aged.
For all studies, older subjects completed a series ofscreening procedures before being admitted into the labora-tory aspect of a given study. They were first interviewed viatelephone at which time educational level, medication sta-tus, and an indication of physical and mental health wereobtained. Older subjects who were taking blood pressuremedications were admitted into the study if the antihyper-tensive agent had no CNS action. No subject with a cur-
rently active medical condition, such as diabetes or cancer,was entered into the protocol. If older subjects met ourtelephone screening criteria, they were invited to the labora-tory for a series of interviews and neuropsychologicalassessments to determine in more detail their suitabilityfor entrance into the experimental protocol. In the firstfew studies in this series (Hamberger and Friedman, 1992;Friedman et al., 1993a,b), these instruments consisted of theSHORT CARE (Gurland et al., 1984), a semi-structuredinterview standardized on large samples of community-dwelling elderly individuals, that was used to screen elderlyparticipants for the presence of dementia, depression, andlimitation in the activities of daily living. Both young andold were administered a modified version of the mini-men-tal status exam (mMMS; Mayeux et al., 1981; a measure ofgeneral cognitive function), and a measure of intellectualfunction (the Quick Test; Ammons and Ammons, 1962). Insubsequent studies, in addition to the SHORT CARE andthe mMMS, elderly subjects were administered an abbre-viated version of the WAIS (Satz and Mogel, 1962) mod-ified for the WAIS-R by Adams et al. (1984), while youngsubjects were administered the Wechsler vocabulary andblock design subtests (Wechsler, 1981). In these latter stu-dies, a board-certified neurologist obtained a full medicaland neurological history, and administered a detailed med-ical and neurological examination, screening prospectiveelderly subjects for the presence of any neurodegenerativedisorders (e.g. Parkinsonism, amyotrophic lateral sclerosis,progressive cerebellar disease, multiple sclerosis), clinicallydetectable neurovascular disease (large and small vesselCVA), as well as assessing sitting and standing blood pres-sure, visual acuity, visual fields, gait, and the presence ofany tremor or rheumatological disorders (arthritis) that
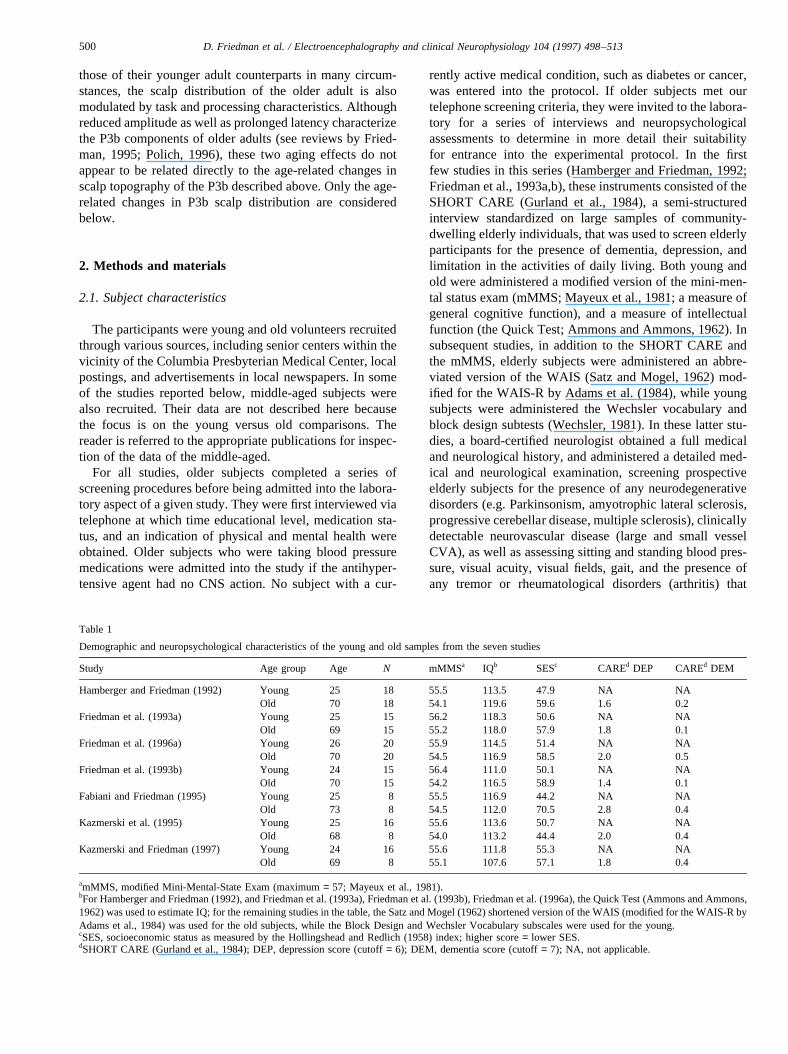
Table 1
Demographic and neuropsychological characteristics of the young and old samples from the seven studies
Study Age group Age N mMMSa IQb SESc CAREd DEP CAREd DEM
Hamberger and Friedman (1992) Young 25 18 55.5 113.5 47.9 NA NAOld 70 18 54.1 119.6 59.6 1.6 0.2
Friedman et al. (1993a) Young 25 15 56.2 118.3 50.6 NA NAOld 69 15 55.2 118.0 57.9 1.8 0.1
Friedman et al. (1996a) Young 26 20 55.9 114.5 51.4 NA NAOld 70 20 54.5 116.9 58.5 2.0 0.5
Friedman et al. (1993b) Young 24 15 56.4 111.0 50.1 NA NAOld 70 15 54.2 116.5 58.9 1.4 0.1
Fabiani and Friedman (1995) Young 25 8 55.5 116.9 44.2 NA NAOld 73 8 54.5 112.0 70.5 2.8 0.4
Kazmerski et al. (1995) Young 25 16 55.6 113.6 50.7 NA NAOld 68 8 54.0 113.2 44.4 2.0 0.4
Kazmerski and Friedman (1997) Young 24 16 55.6 111.8 55.3 NA NAOld 69 8 55.1 107.6 57.1 1.8 0.4
amMMS, modified Mini-Mental-State Exam (maximum= 57; Mayeux et al., 1981).bFor Hamberger and Friedman (1992), and Friedman et al. (1993a), Friedman et al. (1993b), Friedman et al. (1996a), the Quick Test (Ammons and Ammons,1962) was used to estimate IQ; for the remaining studies in the table, the Satz and Mogel (1962) shortened version of the WAIS (modified for the WAIS-R byAdams et al., 1984) was used for the old subjects, while the Block Design and Wechsler Vocabulary subscales were used for the young.cSES, socioeconomic status as measured by the Hollingshead and Redlich (1958) index; higher score= lower SES.dSHORT CARE (Gurland et al., 1984); DEP, depression score (cutoff= 6); DEM, dementia score (cutoff= 7); NA, not applicable.
500 D. Friedman et al. / Electroencephalography and clinical Neurophysiology 104 (1997) 498–513
could interfere with the cognitive testing. Evidence of sig-nificant cardiovascular (i.e. arteriosclerotic conditions) and/or neurologic conditions automatically excluded that personfrom participation, as did any evidence of a physical pro-blem that could affect cognitive functioning. All elderlysubjects whose data are described in this report were withinnormal limits on each of these screening devices, and werenot depressed or demented, or limited in the activities ofdaily living.
The demographics and results of the neuropsychologicalscreening procedures from each study, including mean ages,numbers of young and old subjects, and socioeconomic sta-tus (SES) indices (Hollingshead and Redlich, 1958) aredetailed in Table 1. As can be seen in Table 1, the youngand elderly samples from the different studies appear to becomparable in terms of demographics and neuropsycholo-gical test performance.
2.2. EEG recording procedures
EEG was recorded using an Electrocap from standard10–20 placements that overlapped considerably across stu-dies. The reader is referred to the original reports for theexact placements used. Vertical EOG was recorded fromelectrodes located on the supra- and inferior-orbital ridgesof the right eye, and horizontal EOG was recorded fromelectrodes placed at the outer canthi of both eyes. In theFabiani and Friedman (1995) study, which employed 30scalp electrode sites, additional non-standard placementswere used. In these studies, all scalp leads were referredto nosetip. EEG and EOG were recorded with a bandpassof 0.01–30 Hz (5.3 s time constant). EEG was digitizedeither at 100 or 200 Hz, depending upon the study.
EEG was corrected for intrusion of EOG artifact. Withthe exception of Fabiani and Friedman (1995), and Kaz-merski and Friedman (1995, 1997), who used the Grattonet al. (1983) algorithms, this was accomplished using adap-
tations of the procedures described by Gratton et al. (1983)and Verleger et al. (1982). This latter technique is describedin the relevant publications.
2.3. Task and stimulus parameters
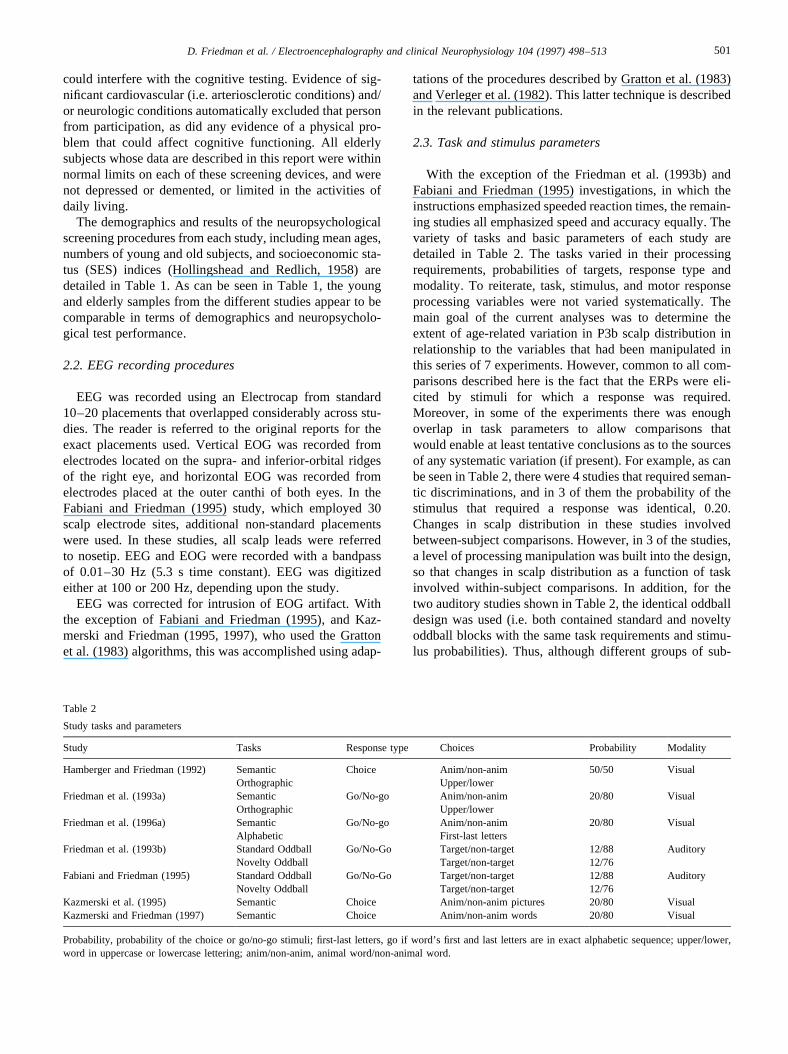
With the exception of the Friedman et al. (1993b) andFabiani and Friedman (1995) investigations, in which theinstructions emphasized speeded reaction times, the remain-ing studies all emphasized speed and accuracy equally. Thevariety of tasks and basic parameters of each study aredetailed in Table 2. The tasks varied in their processingrequirements, probabilities of targets, response type andmodality. To reiterate, task, stimulus, and motor responseprocessing variables were not varied systematically. Themain goal of the current analyses was to determine theextent of age-related variation in P3b scalp distribution inrelationship to the variables that had been manipulated inthis series of 7 experiments. However, common to all com-parisons described here is the fact that the ERPs were eli-cited by stimuli for which a response was required.Moreover, in some of the experiments there was enoughoverlap in task parameters to allow comparisons thatwould enable at least tentative conclusions as to the sourcesof any systematic variation (if present). For example, as canbe seen in Table 2, there were 4 studies that required seman-tic discriminations, and in 3 of them the probability of thestimulus that required a response was identical, 0.20.Changes in scalp distribution in these studies involvedbetween-subject comparisons. However, in 3 of the studies,a level of processing manipulation was built into the design,so that changes in scalp distribution as a function of taskinvolved within-subject comparisons. In addition, for thetwo auditory studies shown in Table 2, the identical oddballdesign was used (i.e. both contained standard and noveltyoddball blocks with the same task requirements and stimu-lus probabilities). Thus, although different groups of sub-
Table 2
Study tasks and parameters
Study Tasks Response type Choices Probability Modality
Hamberger and Friedman (1992) Semantic Choice Anim/non-anim 50/50 VisualOrthographic Upper/lower
Friedman et al. (1993a) Semantic Go/No-go Anim/non-anim 20/80 VisualOrthographic Upper/lower
Friedman et al. (1996a) Semantic Go/No-go Anim/non-anim 20/80 VisualAlphabetic First-last letters
Friedman et al. (1993b) Standard Oddball Go/No-Go Target/non-target 12/88 AuditoryNovelty Oddball Target/non-target 12/76
Fabiani and Friedman (1995) Standard Oddball Go/No-Go Target/non-target 12/88 AuditoryNovelty Oddball Target/non-target 12/76
Kazmerski et al. (1995) Semantic Choice Anim/non-anim pictures 20/80 VisualKazmerski and Friedman (1997) Semantic Choice Anim/non-anim words 20/80 Visual
Probability, probability of the choice or go/no-go stimuli; first-last letters, go if word’s first and last letters are in exact alphabetic sequence; upper/lower,word in uppercase or lowercase lettering; anim/non-anim, animal word/non-animal word.
501D. Friedman et al. / Electroencephalography and clinical Neurophysiology 104 (1997) 498–513
jects entered into the comparisons, all task and stimulusparameters were the same.
2.4. Descriptions of the individual studies
The reader is referred to each of the published studies forcomplete descriptions of the experimental designs. Onlyvery brief descriptions will be provided here.
2.4.1. Hamberger and Friedman (1992)Visual word stimuli were presented during two orienting
tasks, semantic (choice animal/non-animal discrimination)and orthographic (choice uppercase/lowercase discrimina-tion). Within each task the stimuli were delivered with 50/50 probabilities of occurrence.
2.4.2. Friedman et al. (1993a)Subjects participated in two visual orienting tasks,
semantic (detect animal names) and orthographic (detectwords presented in uppercase lettering). Target stimuli (ani-mal names; uppercase words) occurred with a probability of0.20 and the task required responses to the target stimulionly, and the withholding of responses to the non-targets(i.e. Go/No-Go).
2.4.3. Friedman et al. (1996a)Subjects again participated in two visual orienting tasks,
semantic (detect animal names) and structural (detect wordswhose first and last letters are in exact alphabetic sequence).Target stimuli occurred with 0.20 probability and each taskrequired responses to the target stimuli, and withholding ofresponses to the non-targets (i.e. Go/No-Go). For the ana-lyses detailed below, one-half of the subjects from each ofthe young and old samples (originallyN = 40 per agegroup) were randomly chosen so that theNs would be some-what more comparable to theNs of the other studiesreported here.
2.4.4. Kazmerski et al. (1995)Subjects made choice, animal/non-animal button-press
responses to pictorial representations of animal and non-animal stimuli, which occurred, respectively, with probabil-ities of 0.20 and 0.80. Stimuli were presented in 4 sets, eachwith 3 blocks. Some non-animal stimuli repeated acrossblocks, but animal stimuli were unique to each block (repe-tition was incidental to task performance).
2.4.5. Kazmerski and Friedman (1997)With the exception of the presentation of word stimuli,
this task is identical to that described above for Kazmerskiet al. (1995).
2.4.6. Friedman et al. (1993b)Subjects participated in standard (probabilities of tar-
gets and standards were, respectively, 0.12 and 0.88) andnovelty (probabilities of targets, standards and novels
were, respectively, 0.12, 0.76, and 0.12) auditory odd-ball blocks. Subjects were asked to respond only to thetarget stimuli during both kinds of blocks, thus yielding aGo/No-Go response requirement. The analyses reportedhere are based on 15 subjects per age group, althoughin Friedman et al. (1993b) there were only 10 youngand 9 older subjects. The additional subjects using theiden-tical paradigm were recruited for the study repor-ted by Friedman and Simpson (1994), in which analy-ses of changes in novelty P3 amplitude were performedas a function of the within-block temporal sequence ofnovels.
2.4.7. Fabiani and Friedman (1995)This was a replication and extension of the Friedman et
al. (1993b) study. By contrast with Friedman et al. (1993b),in which 12 scalp sites were used, in Fabiani and Friedman,recordings were obtained from 30 scalp sites.
2.5. ERP measurement and analyses
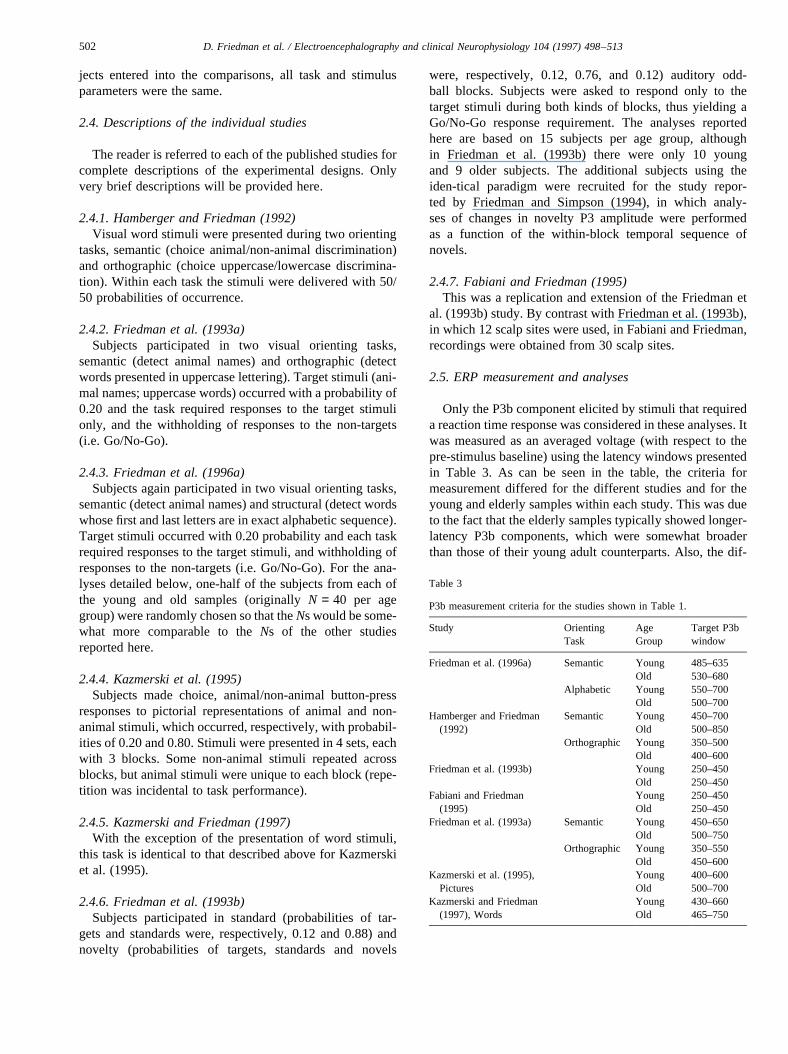
Only the P3b component elicited by stimuli that requireda reaction time response was considered in these analyses. Itwas measured as an averaged voltage (with respect to thepre-stimulus baseline) using the latency windows presentedin Table 3. As can be seen in the table, the criteria formeasurement differed for the different studies and for theyoung and elderly samples within each study. This was dueto the fact that the elderly samples typically showed longer-latency P3b components, which were somewhat broaderthan those of their young adult counterparts. Also, the dif-
Table 3
P3b measurement criteria for the studies shown in Table 1.
Study OrientingTask
AgeGroup
Target P3bwindow
Friedman et al. (1996a) Semantic Young 485–635Old 530–680
Alphabetic Young 550–700Old 500–700
Hamberger and Friedman(1992)
Semantic YoungOld
450–700500–850
Orthographic Young 350–500Old 400–600
Friedman et al. (1993b) Young 250–450Old 250–450
Fabiani and Friedman(1995)
YoungOld
250–450250–450
Friedman et al. (1993a) Semantic Young 450–650Old 500–750
Orthographic Young 350–550Old 450–600
Kazmerski et al. (1995),Pictures
YoungOld
400–600500–700
Kazmerski and Friedman(1997), Words
YoungOld
430–660465–750
502 D. Friedman et al. / Electroencephalography and clinical Neurophysiology 104 (1997) 498–513
ferent task requirements produced changes in latency forboth young and old.
2.5.1. Analyses of variance (ANOVAs)Analyses consisted of ANOVAs, in which the averaged
voltage data had first been normalized either between-studies (usually separately for young and old) or within-study (again, separately for young and old), removingamplitude information so that only shape across the scalpwould be assessed in the ANOVA. The root mean squaremethod described by McCarthy and Wood (1985) was used.Significant Study by Electrode Location interactions afternormalization suggest the presence of a change in scalpdistribution. These ANOVAs used the data recorded atthe midline, since those midline sites (Fz, Cz, and Pz)were common to all of the studies listed in Table 1.In addition, in separate ANOVAs, the lateral scalp sitesthat were common to some of the studies (e.g. F3/4, C3/4,P3/4, O1/2) were also used in within-study and within-age group analyses of the raw amplitudes. These wereHemisphere by Electrode Location analyses performedin order to demonstrate statistically the age-related differ-ences in anterior/posterior features present in the scalpmaps.
2.5.2. Surface potential (SP) and current source density(CSD) mapping
All mapping and associated computations were per-formed with the Brain Electric Source Analysis software(Scherg, 1990). For each study listed in Table 1, the scalp
potentials, excluding the EOG leads, were re-referenced tothe average reference, and interpolated for mapping using athird order spherical surface spline method (Perrin et al.,1989). The current source density maps were computed onthis spherical spline interpolated data. Providing an inter-polated voltage surface improves the estimation of extremalocations and does not force the visualization of extremaonto the recording electrodes, but rather allows them to beseen at locations in between electrodes. The current sourcedensity, being the second spatial derivative of the surfacepotential, provides a reference-independent representationof radial current density in the scalp which has sharperextrema than the surface potential.
The validity of the surface potential (SP) and currentsource density (CSD) mapping techniques relies on ade-quate spatial sampling (i.e. density of electrodes placed onthe scalp). However, with the exception of the Fabiani andFriedman (1995) study, which employed 30 scalp sites, thenumber of electrodes used in computing the maps in theother investigations is inadequate to allow any quantitativeassessment of the current source density distributions. Theydo, however, provide descriptive information, which allowsa qualitative assessment of the differences in spatial distri-bution between age groups and/or experimental conditions.For example, in studies that used the identical design,although there were clear differences in detail between thecurrent source density maps based on 30 electrode sites(Fabiani and Friedman, 1995; replication) and those basedon many fewer scalp locations (Friedman et al., 1993b), thegeneral features of the distributions were remarkably similar
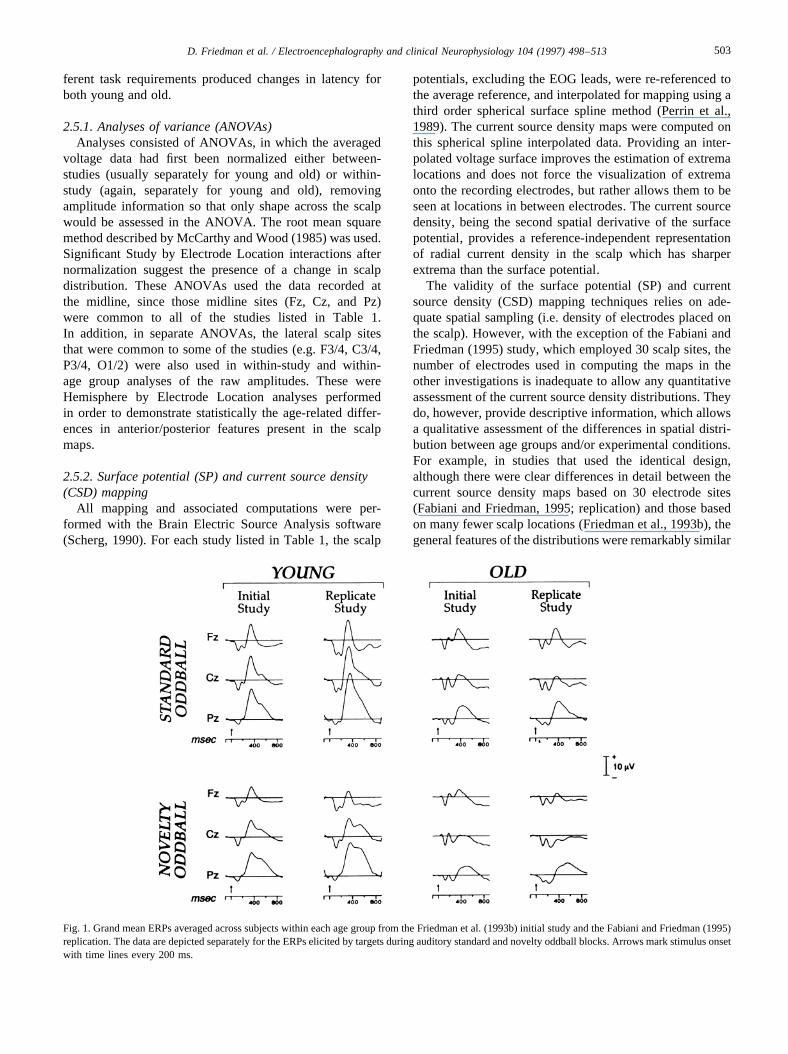
Fig. 1. Grand mean ERPs averaged across subjects within each age group from the Friedman et al. (1993b) initial study and the Fabiani and Friedman (1995)replication. The data are depicted separately for the ERPs elicited by targets during auditory standard and novelty oddball blocks. Arrows mark stimulus onsetwith time lines every 200 ms.
503D. Friedman et al. / Electroencephalography and clinical Neurophysiology 104 (1997) 498–513
(see Fig. 4 below). This suggests that the maps can be usedto obtain a visual, qualitative impression of age-relatedchanges in the scalp topography of P3b.
3. Results
3.1. ERP waveforms
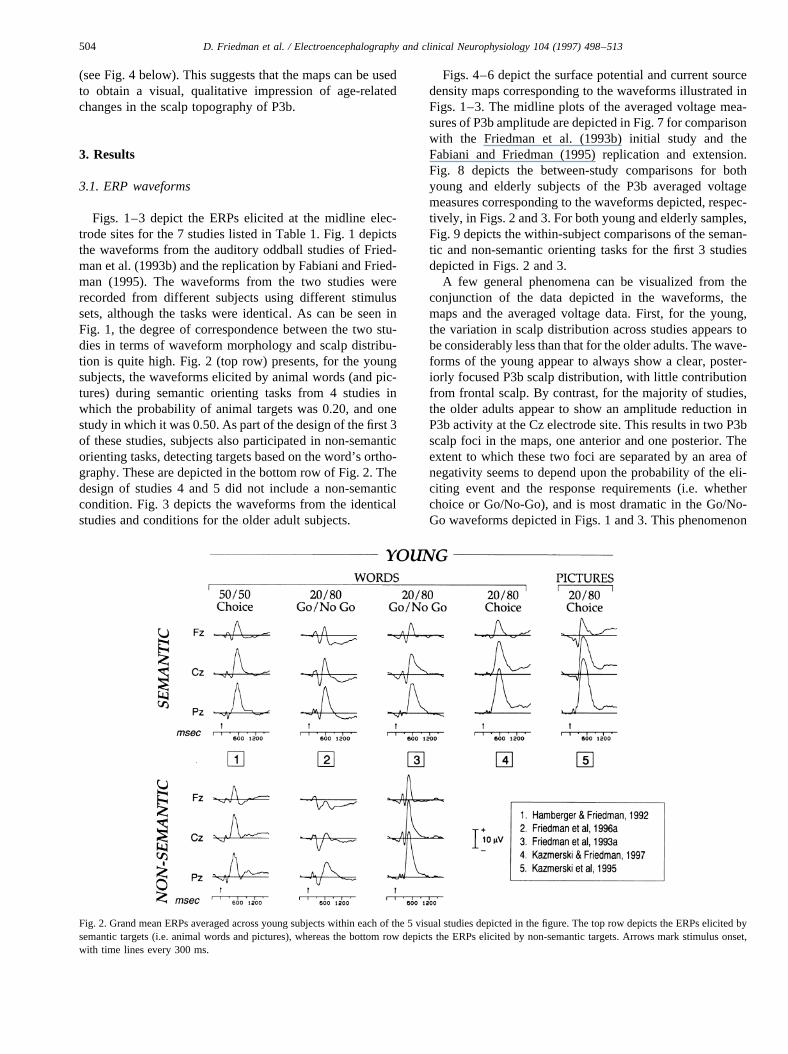
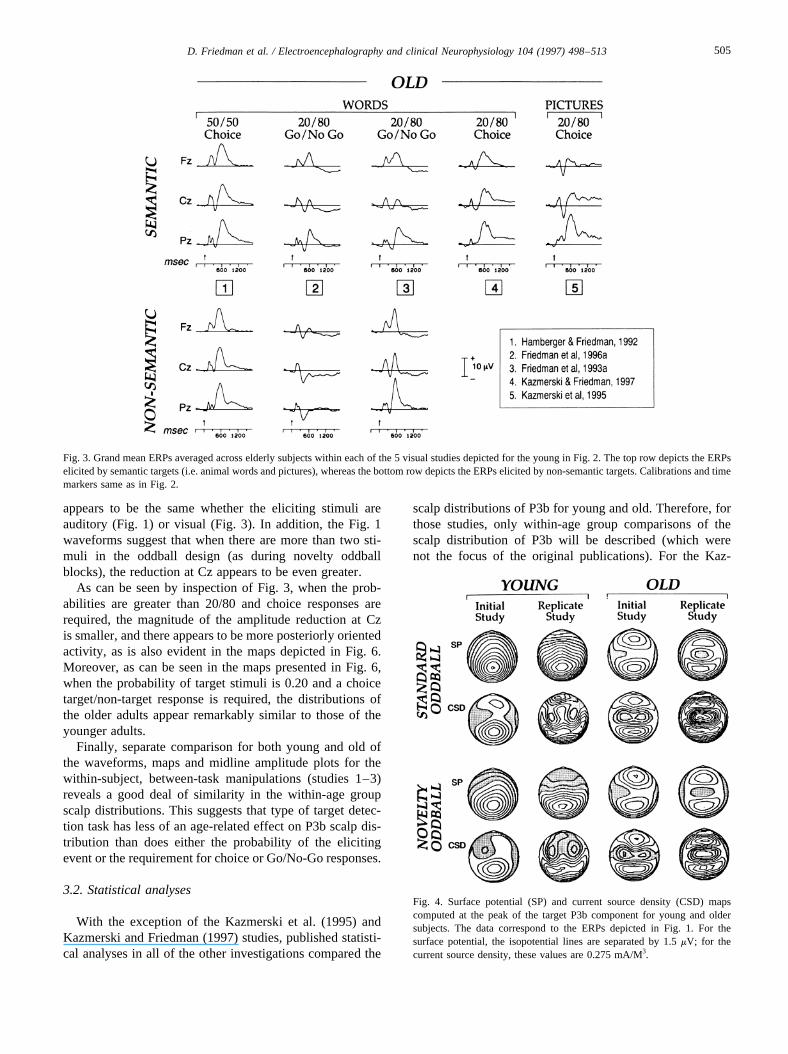
Figs. 1–3 depict the ERPs elicited at the midline elec-trode sites for the 7 studies listed in Table 1. Fig. 1 depictsthe waveforms from the auditory oddball studies of Fried-man et al. (1993b) and the replication by Fabiani and Fried-man (1995). The waveforms from the two studies wererecorded from different subjects using different stimulussets, although the tasks were identical. As can be seen inFig. 1, the degree of correspondence between the two stu-dies in terms of waveform morphology and scalp distribu-tion is quite high. Fig. 2 (top row) presents, for the youngsubjects, the waveforms elicited by animal words (and pic-tures) during semantic orienting tasks from 4 studies inwhich the probability of animal targets was 0.20, and onestudy in which it was 0.50. As part of the design of the first 3of these studies, subjects also participated in non-semanticorienting tasks, detecting targets based on the word’s ortho-graphy. These are depicted in the bottom row of Fig. 2. Thedesign of studies 4 and 5 did not include a non-semanticcondition. Fig. 3 depicts the waveforms from the identicalstudies and conditions for the older adult subjects.
Figs. 4–6 depict the surface potential and current sourcedensity maps corresponding to the waveforms illustrated inFigs. 1–3. The midline plots of the averaged voltage mea-sures of P3b amplitude are depicted in Fig. 7 for comparisonwith the Friedman et al. (1993b) initial study and theFabiani and Friedman (1995) replication and extension.Fig. 8 depicts the between-study comparisons for bothyoung and elderly subjects of the P3b averaged voltagemeasures corresponding to the waveforms depicted, respec-tively, in Figs. 2 and 3. For both young and elderly samples,Fig. 9 depicts the within-subject comparisons of the seman-tic and non-semantic orienting tasks for the first 3 studiesdepicted in Figs. 2 and 3.
A few general phenomena can be visualized from theconjunction of the data depicted in the waveforms, themaps and the averaged voltage data. First, for the young,the variation in scalp distribution across studies appears tobe considerably less than that for the older adults. The wave-forms of the young appear to always show a clear, poster-iorly focused P3b scalp distribution, with little contributionfrom frontal scalp. By contrast, for the majority of studies,the older adults appear to show an amplitude reduction inP3b activity at the Cz electrode site. This results in two P3bscalp foci in the maps, one anterior and one posterior. Theextent to which these two foci are separated by an area ofnegativity seems to depend upon the probability of the eli-citing event and the response requirements (i.e. whetherchoice or Go/No-Go), and is most dramatic in the Go/No-Go waveforms depicted in Figs. 1 and 3. This phenomenon
Fig. 2. Grand mean ERPs averaged across young subjects within each of the 5 visual studies depicted in the figure. The top row depicts the ERPs elicited bysemantic targets (i.e. animal words and pictures), whereas the bottom row depicts the ERPs elicited by non-semantic targets. Arrows mark stimulus onset,with time lines every 300 ms.
504 D. Friedman et al. / Electroencephalography and clinical Neurophysiology 104 (1997) 498–513
appears to be the same whether the eliciting stimuli areauditory (Fig. 1) or visual (Fig. 3). In addition, the Fig. 1waveforms suggest that when there are more than two sti-muli in the oddball design (as during novelty oddballblocks), the reduction at Cz appears to be even greater.
As can be seen by inspection of Fig. 3, when the prob-abilities are greater than 20/80 and choice responses arerequired, the magnitude of the amplitude reduction at Czis smaller, and there appears to be more posteriorly orientedactivity, as is also evident in the maps depicted in Fig. 6.Moreover, as can be seen in the maps presented in Fig. 6,when the probability of target stimuli is 0.20 and a choicetarget/non-target response is required, the distributions ofthe older adults appear remarkably similar to those of theyounger adults.
Finally, separate comparison for both young and old ofthe waveforms, maps and midline amplitude plots for thewithin-subject, between-task manipulations (studies 1–3)reveals a good deal of similarity in the within-age groupscalp distributions. This suggests that type of target detec-tion task has less of an age-related effect on P3b scalp dis-tribution than does either the probability of the elicitingevent or the requirement for choice or Go/No-Go responses.
3.2. Statistical analyses
With the exception of the Kazmerski et al. (1995) andKazmerski and Friedman (1997) studies, published statisti-cal analyses in all of the other investigations compared the
scalp distributions of P3b for young and old. Therefore, forthose studies, only within-age group comparisons of thescalp distribution of P3b will be described (which werenot the focus of the original publications). For the Kaz-
Fig. 3. Grand mean ERPs averaged across elderly subjects within each of the 5 visual studies depicted for the young in Fig. 2. The top row depicts the ERPselicited by semantic targets (i.e. animal words and pictures), whereas the bottom row depicts the ERPs elicited by non-semantic targets. Calibrations and timemarkers same as in Fig. 2.
Fig. 4. Surface potential (SP) and current source density (CSD) mapscomputed at the peak of the target P3b component for young and oldersubjects. The data correspond to the ERPs depicted in Fig. 1. For thesurface potential, the isopotential lines are separated by 1.5mV; for thecurrent source density, these values are 0.275 mA/M3.
505D. Friedman et al. / Electroencephalography and clinical Neurophysiology 104 (1997) 498–513
merski et al. (1995) and Kazmerski and Friedman (1997)studies, between-age group comparisons will be detailed,since these kinds of analyses did not comprise the majorfocus of those investigations (they were studies of ERPresponses of patients with Alzheimer’s disease, for whichsamples of young and older control subjects were alsorecruited).
It should be emphasized that several of the analyses per-formed here involved between-subject comparisons. Thatis, these were comparisons of ERP scalp distributionsrecorded in different studies with independent samples ofyoung and old subjects. However, it should also be stressedthat in the case of between-study comparisons, statisticalcomparisons were performed to compare the scalp distribu-tions from only those studies whose task requirements andstimulus parameters were similar.
3.2.1. Midline scalp distribution analyses
3.2.1.1. Between-study comparisons. Between-StudyComparison of Auditory Novelty Oddball Studies.Comparison of the initial (Friedman et al., 1993b) andreplication (Fabiani and Friedman, 1995) studies involveda between-subjects analysis, in which task requirementswere identical. For these analyses, the ERPs elicited bytargets in the novelty oddball blocks were used because,as can be seen in Fig. 1, the reduction for the old in P3bamplitude at Cz is quite marked in those target ERPs. For
the young, there was a significant Study by ElectrodeLocation interaction (F(2,42) = 4.07, e = 0.84,P , 0.03),indicating that different midline P3b scalp distributionswere elicited in the two studies. However, this was notthe case for the old (F(2,42) = 1.29, e = 0.85, P . 0.1).These phenomena can be seen in Fig. 7.
The normalized P3b amplitudes elicited by targets in thestandard oddball blocks were also compared with those eli-cited in the novelty oddball blocks, separately for each agegroup and study. For the Friedman et al. (1993b) study, theyoung did not show a significant Oddball Task by ElectrodeLocation interaction (F(2,28) = 1.13, e = 0.60,P . 0.10).However, the older sample did (F(2,28) = 9.12, e = 0.67,P , 0.004). As can be seen in Fig. 4, this resulted due togreater negativity (thus resulting in a reduction of P3bamplitude) at the Cz site when all 3 stimuli were representedin the stimulus series (i.e. standards, targets and novels). Forthe Fabiani and Friedman study, a somewhat different pat-tern resulted. The young did show an Oddball Task by Elec-trode Location interaction (F(2,14) = 8.29, e = 0.53, P ,0.02) due to a decrease in frontally oriented P3b activityfrom standard oddball to novelty oddball blocks. Althoughthe older sample of the Fabiani and Friedman study showeda similar trend to the older sample of the Friedman et al.investigation (as can be seen in Figs. 1 and 4), the OddballTask by Electrode Location interaction was not significant(F(2,14) = 2.61, e = 0.85, P . 0.10), perhaps due to thesmallerN in the Fabiani and Friedman study.
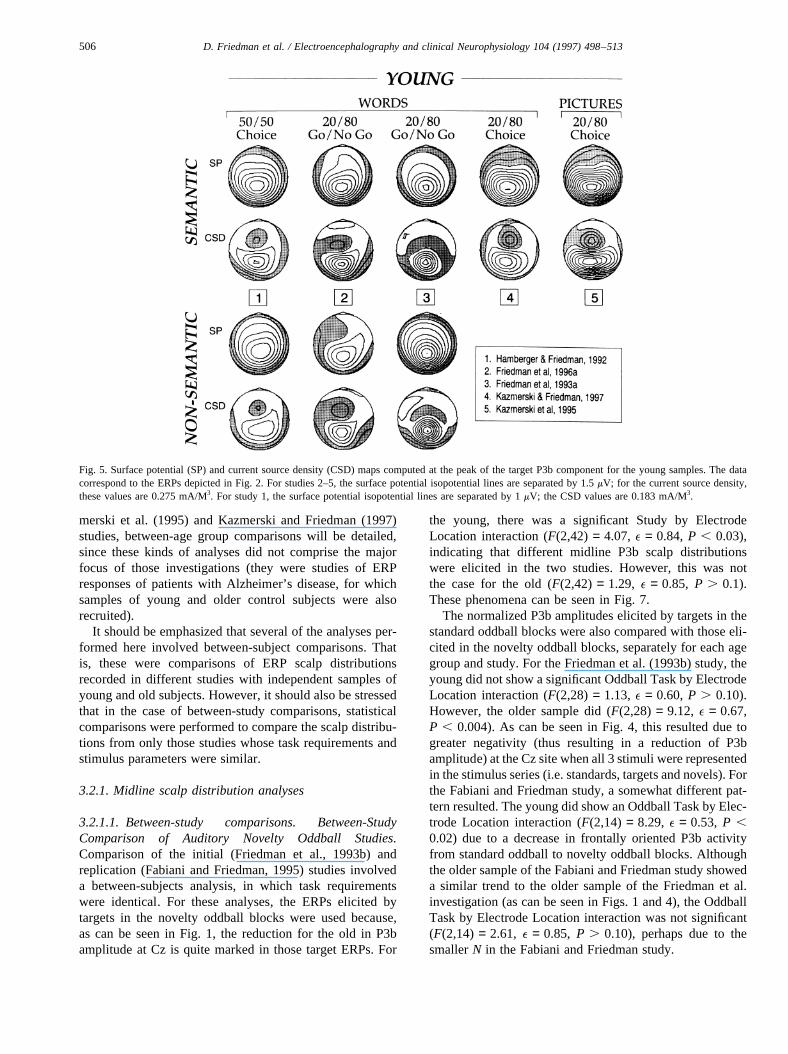
Fig. 5. Surface potential (SP) and current source density (CSD) maps computed at the peak of the target P3b component for the young samples. The datacorrespond to the ERPs depicted in Fig. 2. For studies 2–5, the surface potential isopotential lines are separated by 1.5mV; for the current source density,these values are 0.275 mA/M3. For study 1, the surface potential isopotential lines are separated by 1mV; the CSD values are 0.183 mA/M3.
506 D. Friedman et al. / Electroencephalography and clinical Neurophysiology 104 (1997) 498–513
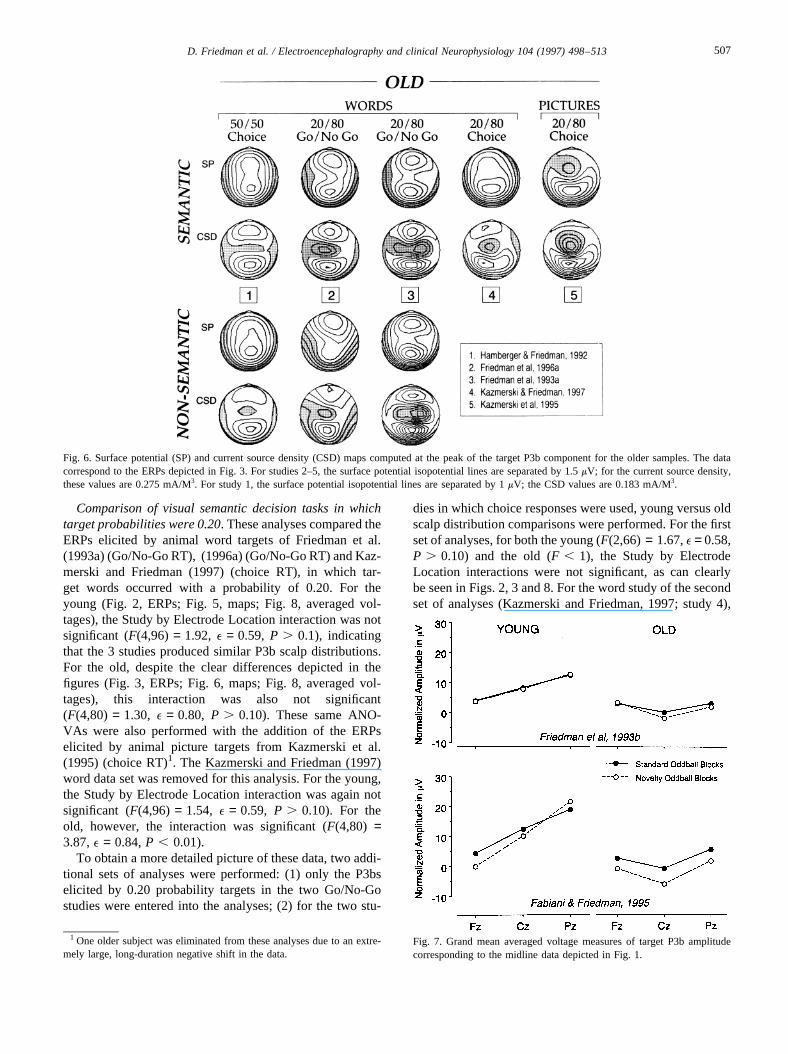
Comparison of visual semantic decision tasks in whichtarget probabilities were 0.20. These analyses compared theERPs elicited by animal word targets of Friedman et al.(1993a) (Go/No-Go RT), (1996a) (Go/No-Go RT) and Kaz-merski and Friedman (1997) (choice RT), in which tar-get words occurred with a probability of 0.20. For theyoung (Fig. 2, ERPs; Fig. 5, maps; Fig. 8, averaged vol-tages), the Study by Electrode Location interaction was notsignificant (F(4,96) = 1.92, e = 0.59, P . 0.1), indicatingthat the 3 studies produced similar P3b scalp distributions.For the old, despite the clear differences depicted in thefigures (Fig. 3, ERPs; Fig. 6, maps; Fig. 8, averaged vol-tages), this interaction was also not significant(F(4,80) = 1.30, e = 0.80, P . 0.10). These same ANO-VAs were also performed with the addition of the ERPselicited by animal picture targets from Kazmerski et al.(1995) (choice RT)1. The Kazmerski and Friedman (1997)word data set was removed for this analysis. For the young,the Study by Electrode Location interaction was again notsignificant (F(4,96) = 1.54, e = 0.59, P . 0.10). For theold, however, the interaction was significant (F(4,80) =3.87,e = 0.84,P , 0.01).
To obtain a more detailed picture of these data, two addi-tional sets of analyses were performed: (1) only the P3bselicited by 0.20 probability targets in the two Go/No-Gostudies were entered into the analyses; (2) for the two stu-
dies in which choice responses were used, young versus oldscalp distribution comparisons were performed. For the firstset of analyses, for both the young (F(2,66) = 1.67,e = 0.58,P . 0.10) and the old (F , 1), the Study by ElectrodeLocation interactions were not significant, as can clearlybe seen in Figs. 2, 3 and 8. For the word study of the secondset of analyses (Kazmerski and Friedman, 1997; study 4),
Fig. 6. Surface potential (SP) and current source density (CSD) maps computed at the peak of the target P3b component for the older samples. The datacorrespond to the ERPs depicted in Fig. 3. For studies 2–5, the surface potential isopotential lines are separated by 1.5mV; for the current source density,these values are 0.275 mA/M3. For study 1, the surface potential isopotential lines are separated by 1mV; the CSD values are 0.183 mA/M3.
Fig. 7. Grand mean averaged voltage measures of target P3b amplitudecorresponding to the midline data depicted in Fig. 1.
1 One older subject was eliminated from these analyses due to an extre-mely large, long-duration negative shift in the data.
507D. Friedman et al. / Electroencephalography and clinical Neurophysiology 104 (1997) 498–513
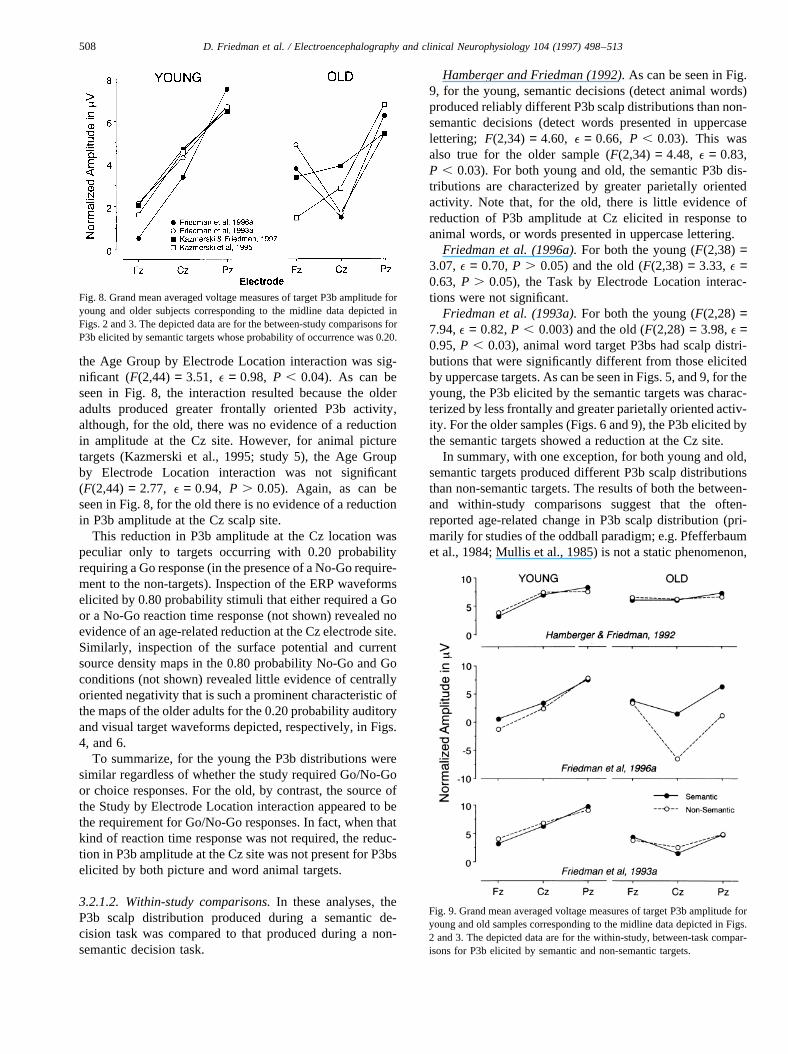
the Age Group by Electrode Location interaction was sig-nificant (F(2,44) = 3.51, e = 0.98, P , 0.04). As can beseen in Fig. 8, the interaction resulted because the olderadults produced greater frontally oriented P3b activity,although, for the old, there was no evidence of a reductionin amplitude at the Cz site. However, for animal picturetargets (Kazmerski et al., 1995; study 5), the Age Groupby Electrode Location interaction was not significant(F(2,44) = 2.77, e = 0.94, P . 0.05). Again, as can beseen in Fig. 8, for the old there is no evidence of a reductionin P3b amplitude at the Cz scalp site.
This reduction in P3b amplitude at the Cz location waspeculiar only to targets occurring with 0.20 probabilityrequiring a Go response (in the presence of a No-Go require-ment to the non-targets). Inspection of the ERP waveformselicited by 0.80 probability stimuli that either required a Goor a No-Go reaction time response (not shown) revealed noevidence of an age-related reduction at the Cz electrode site.Similarly, inspection of the surface potential and currentsource density maps in the 0.80 probability No-Go and Goconditions (not shown) revealed little evidence of centrallyoriented negativity that is such a prominent characteristic ofthe maps of the older adults for the 0.20 probability auditoryand visual target waveforms depicted, respectively, in Figs.4, and 6.
To summarize, for the young the P3b distributions weresimilar regardless of whether the study required Go/No-Goor choice responses. For the old, by contrast, the source ofthe Study by Electrode Location interaction appeared to bethe requirement for Go/No-Go responses. In fact, when thatkind of reaction time response was not required, the reduc-tion in P3b amplitude at the Cz site was not present for P3bselicited by both picture and word animal targets.
3.2.1.2. Within-study comparisons.In these analyses, theP3b scalp distribution produced during a semantic de-cision task was compared to that produced during a non-semantic decision task.
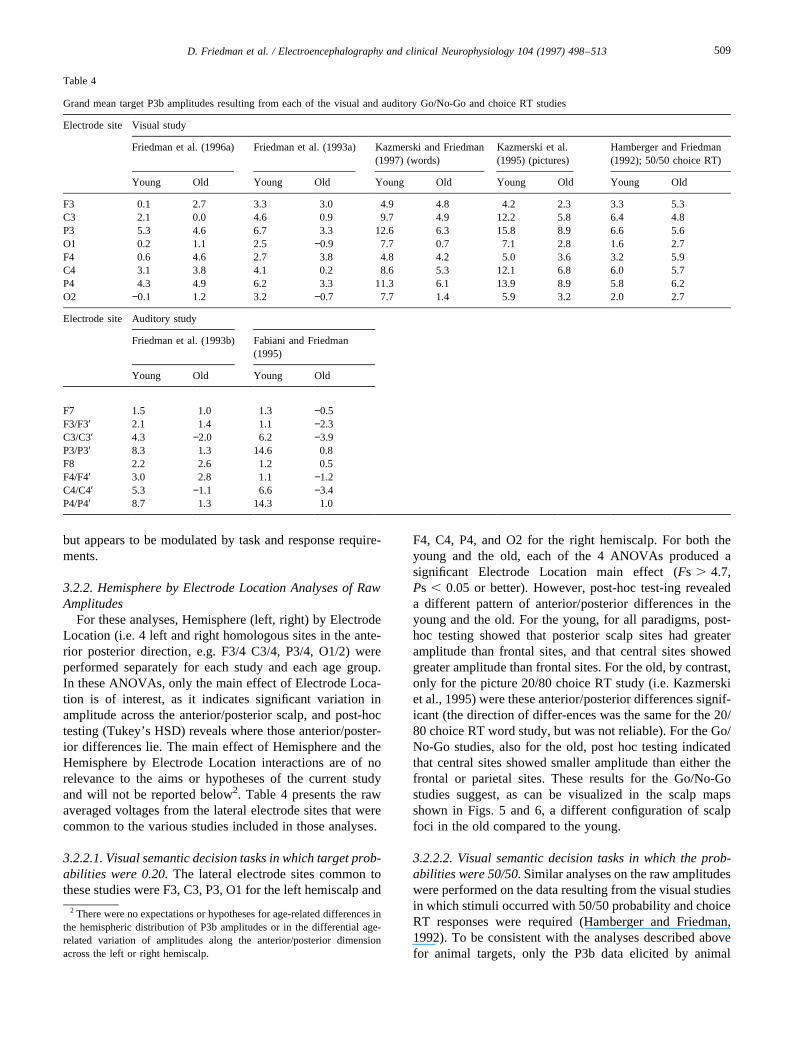
Hamberger and Friedman (1992).As can be seen in Fig.9, for the young, semantic decisions (detect animal words)produced reliably different P3b scalp distributions than non-semantic decisions (detect words presented in uppercaselettering; F(2,34) = 4.60, e = 0.66, P , 0.03). This wasalso true for the older sample (F(2,34) = 4.48, e = 0.83,P , 0.03). For both young and old, the semantic P3b dis-tributions are characterized by greater parietally orientedactivity. Note that, for the old, there is little evidence ofreduction of P3b amplitude at Cz elicited in response toanimal words, or words presented in uppercase lettering.
Friedman et al. (1996a).For both the young (F(2,38) =3.07,e = 0.70,P . 0.05) and the old (F(2,38) = 3.33,e =0.63, P . 0.05), the Task by Electrode Location interac-tions were not significant.
Friedman et al. (1993a).For both the young (F(2,28) =7.94,e = 0.82,P , 0.003) and the old (F(2,28) = 3.98,e =0.95,P , 0.03), animal word target P3bs had scalp distri-butions that were significantly different from those elicitedby uppercase targets. As can be seen in Figs. 5, and 9, for theyoung, the P3b elicited by the semantic targets was charac-terized by less frontally and greater parietally oriented activ-ity. For the older samples (Figs. 6 and 9), the P3b elicited bythe semantic targets showed a reduction at the Cz site.
In summary, with one exception, for both young and old,semantic targets produced different P3b scalp distributionsthan non-semantic targets. The results of both the between-and within-study comparisons suggest that the often-reported age-related change in P3b scalp distribution (pri-marily for studies of the oddball paradigm; e.g. Pfefferbaumet al., 1984; Mullis et al., 1985) is not a static phenomenon,
Fig. 8. Grand mean averaged voltage measures of target P3b amplitude foryoung and older subjects corresponding to the midline data depicted inFigs. 2 and 3. The depicted data are for the between-study comparisons forP3b elicited by semantic targets whose probability of occurrence was 0.20.
Fig. 9. Grand mean averaged voltage measures of target P3b amplitude foryoung and old samples corresponding to the midline data depicted in Figs.2 and 3. The depicted data are for the within-study, between-task compar-isons for P3b elicited by semantic and non-semantic targets.
508 D. Friedman et al. / Electroencephalography and clinical Neurophysiology 104 (1997) 498–513
but appears to be modulated by task and response require-ments.
3.2.2. Hemisphere by Electrode Location Analyses of RawAmplitudes
For these analyses, Hemisphere (left, right) by ElectrodeLocation (i.e. 4 left and right homologous sites in the ante-rior posterior direction, e.g. F3/4 C3/4, P3/4, O1/2) wereperformed separately for each study and each age group.In these ANOVAs, only the main effect of Electrode Loca-tion is of interest, as it indicates significant variation inamplitude across the anterior/posterior scalp, and post-hoctesting (Tukey’s HSD) reveals where those anterior/poster-ior differences lie. The main effect of Hemisphere and theHemisphere by Electrode Location interactions are of norelevance to the aims or hypotheses of the current studyand will not be reported below2. Table 4 presents the rawaveraged voltages from the lateral electrode sites that werecommon to the various studies included in those analyses.
3.2.2.1. Visual semantic decision tasks in which target prob-abilities were 0.20.The lateral electrode sites common tothese studies were F3, C3, P3, O1 for the left hemiscalp and
F4, C4, P4, and O2 for the right hemiscalp. For both theyoung and the old, each of the 4 ANOVAs produced asignificant Electrode Location main effect (Fs . 4.7,Ps , 0.05 or better). However, post-hoc test-ing revealeda different pattern of anterior/posterior differences in theyoung and the old. For the young, for all paradigms, post-hoc testing showed that posterior scalp sites had greateramplitude than frontal sites, and that central sites showedgreater amplitude than frontal sites. For the old, by contrast,only for the picture 20/80 choice RT study (i.e. Kazmerskiet al., 1995) were these anterior/posterior differences signif-icant (the direction of differ-ences was the same for the 20/80 choice RT word study, but was not reliable). For the Go/No-Go studies, also for the old, post hoc testing indicatedthat central sites showed smaller amplitude than either thefrontal or parietal sites. These results for the Go/No-Gostudies suggest, as can be visualized in the scalp mapsshown in Figs. 5 and 6, a different configuration of scalpfoci in the old compared to the young.
3.2.2.2. Visual semantic decision tasks in which the prob-abilities were 50/50.Similar analyses on the raw amplitudeswere performed on the data resulting from the visual studiesin which stimuli occurred with 50/50 probability and choiceRT responses were required (Hamberger and Friedman,1992). To be consistent with the analyses described abovefor animal targets, only the P3b data elicited by animal
2 There were no expectations or hypotheses for age-related differences inthe hemispheric distribution of P3b amplitudes or in the differential age-related variation of amplitudes along the anterior/posterior dimensionacross the left or right hemiscalp.
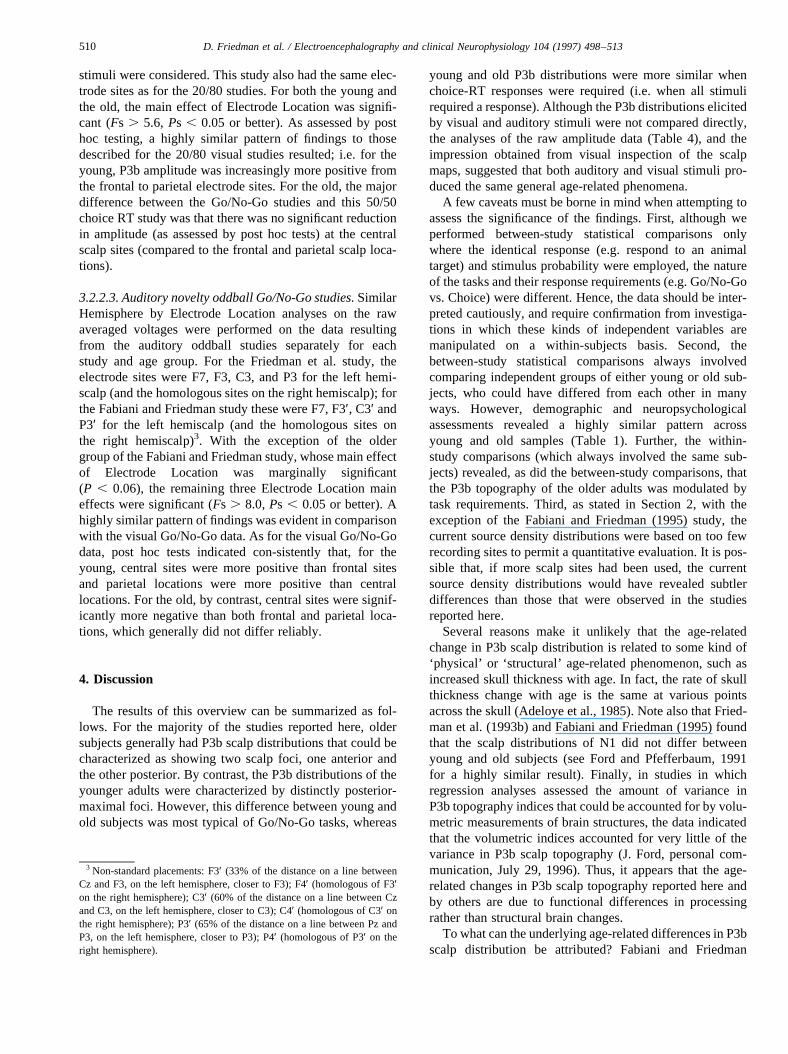
Table 4
Grand mean target P3b amplitudes resulting from each of the visual and auditory Go/No-Go and choice RT studies
Electrode site Visual study
Friedman et al. (1996a) Friedman et al. (1993a) Kazmerski and Friedman(1997) (words)
Kazmerski et al.(1995) (pictures)
Hamberger and Friedman(1992); 50/50 choice RT)
Young Old Young Old Young Old Young Old Young Old
F3 0.1 2.7 3.3 3.0 4.9 4.8 4.2 2.3 3.3 5.3C3 2.1 0.0 4.6 0.9 9.7 4.9 12.2 5.8 6.4 4.8P3 5.3 4.6 6.7 3.3 12.6 6.3 15.8 8.9 6.6 5.6O1 0.2 1.1 2.5 −0.9 7.7 0.7 7.1 2.8 1.6 2.7F4 0.6 4.6 2.7 3.8 4.8 4.2 5.0 3.6 3.2 5.9C4 3.1 3.8 4.1 0.2 8.6 5.3 12.1 6.8 6.0 5.7P4 4.3 4.9 6.2 3.3 11.3 6.1 13.9 8.9 5.8 6.2O2 −0.1 1.2 3.2 −0.7 7.7 1.4 5.9 3.2 2.0 2.7
Electrode site Auditory study
Friedman et al. (1993b) Fabiani and Friedman(1995)
Young Old Young Old
F7 1.5 1.0 1.3 −0.5F3/F3′ 2.1 1.4 1.1 −2.3C3/C3′ 4.3 −2.0 6.2 −3.9P3/P3′ 8.3 1.3 14.6 0.8F8 2.2 2.6 1.2 0.5F4/F4′ 3.0 2.8 1.1 −1.2C4/C4′ 5.3 −1.1 6.6 −3.4P4/P4′ 8.7 1.3 14.3 1.0
509D. Friedman et al. / Electroencephalography and clinical Neurophysiology 104 (1997) 498–513
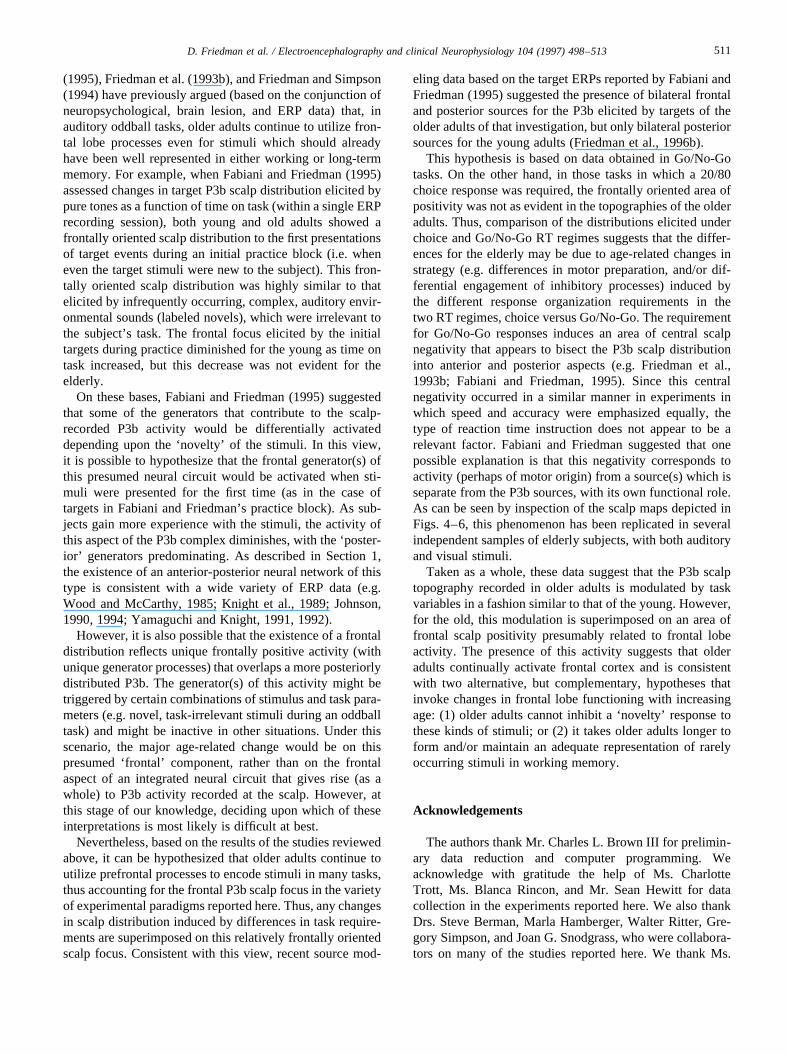
stimuli were considered. This study also had the same elec-trode sites as for the 20/80 studies. For both the young andthe old, the main effect of Electrode Location was signifi-cant (Fs . 5.6, Ps , 0.05 or better). As assessed by posthoc testing, a highly similar pattern of findings to thosedescribed for the 20/80 visual studies resulted; i.e. for theyoung, P3b amplitude was increasingly more positive fromthe frontal to parietal electrode sites. For the old, the majordifference between the Go/No-Go studies and this 50/50choice RT study was that there was no significant reductionin amplitude (as assessed by post hoc tests) at the centralscalp sites (compared to the frontal and parietal scalp loca-tions).
3.2.2.3. Auditory novelty oddball Go/No-Go studies.SimilarHemisphere by Electrode Location analyses on the rawaveraged voltages were performed on the data resultingfrom the auditory oddball studies separately for eachstudy and age group. For the Friedman et al. study, theelectrode sites were F7, F3, C3, and P3 for the left hemi-scalp (and the homologous sites on the right hemiscalp); forthe Fabiani and Friedman study these were F7, F3′, C3′ andP3′ for the left hemiscalp (and the homologous sites onthe right hemiscalp)3. With the exception of the oldergroup of the Fabiani and Friedman study, whose main effectof Electrode Location was marginally significant(P , 0.06), the remaining three Electrode Location maineffects were significant (Fs . 8.0, Ps , 0.05 or better). Ahighly similar pattern of findings was evident in comparisonwith the visual Go/No-Go data. As for the visual Go/No-Godata, post hoc tests indicated con-sistently that, for theyoung, central sites were more positive than frontal sitesand parietal locations were more positive than centrallocations. For the old, by contrast, central sites were signif-icantly more negative than both frontal and parietal loca-tions, which generally did not differ reliably.
4. Discussion
The results of this overview can be summarized as fol-lows. For the majority of the studies reported here, oldersubjects generally had P3b scalp distributions that could becharacterized as showing two scalp foci, one anterior andthe other posterior. By contrast, the P3b distributions of theyounger adults were characterized by distinctly posterior-maximal foci. However, this difference between young andold subjects was most typical of Go/No-Go tasks, whereas
young and old P3b distributions were more similar whenchoice-RT responses were required (i.e. when all stimulirequired a response). Although the P3b distributions elicitedby visual and auditory stimuli were not compared directly,the analyses of the raw amplitude data (Table 4), and theimpression obtained from visual inspection of the scalpmaps, suggested that both auditory and visual stimuli pro-duced the same general age-related phenomena.
A few caveats must be borne in mind when attempting toassess the significance of the findings. First, although weperformed between-study statistical comparisons onlywhere the identical response (e.g. respond to an animaltarget) and stimulus probability were employed, the natureof the tasks and their response requirements (e.g. Go/No-Govs. Choice) were different. Hence, the data should be inter-preted cautiously, and require confirmation from investiga-tions in which these kinds of independent variables aremanipulated on a within-subjects basis. Second, thebetween-study statistical comparisons always involvedcomparing independent groups of either young or old sub-jects, who could have differed from each other in manyways. However, demographic and neuropsychologicalassessments revealed a highly similar pattern acrossyoung and old samples (Table 1). Further, the within-study comparisons (which always involved the same sub-jects) revealed, as did the between-study comparisons, thatthe P3b topography of the older adults was modulated bytask requirements. Third, as stated in Section 2, with theexception of the Fabiani and Friedman (1995) study, thecurrent source density distributions were based on too fewrecording sites to permit a quantitative evaluation. It is pos-sible that, if more scalp sites had been used, the currentsource density distributions would have revealed subtlerdifferences than those that were observed in the studiesreported here.
Several reasons make it unlikely that the age-relatedchange in P3b scalp distribution is related to some kind of‘physical’ or ‘structural’ age-related phenomenon, such asincreased skull thickness with age. In fact, the rate of skullthickness change with age is the same at various pointsacross the skull (Adeloye et al., 1985). Note also that Fried-man et al. (1993b) and Fabiani and Friedman (1995) foundthat the scalp distributions of N1 did not differ betweenyoung and old subjects (see Ford and Pfefferbaum, 1991for a highly similar result). Finally, in studies in whichregression analyses assessed the amount of variance inP3b topography indices that could be accounted for by volu-metric measurements of brain structures, the data indicatedthat the volumetric indices accounted for very little of thevariance in P3b scalp topography (J. Ford, personal com-munication, July 29, 1996). Thus, it appears that the age-related changes in P3b scalp topography reported here andby others are due to functional differences in processingrather than structural brain changes.
To what can the underlying age-related differences in P3bscalp distribution be attributed? Fabiani and Friedman
3 Non-standard placements: F3′ (33% of the distance on a line betweenCz and F3, on the left hemisphere, closer to F3); F4′ (homologous of F3′on the right hemisphere); C3′ (60% of the distance on a line between Czand C3, on the left hemisphere, closer to C3); C4′ (homologous of C3′ onthe right hemisphere); P3′ (65% of the distance on a line between Pz andP3, on the left hemisphere, closer to P3); P4′ (homologous of P3′ on theright hemisphere).
510 D. Friedman et al. / Electroencephalography and clinical Neurophysiology 104 (1997) 498–513
(1995), Friedman et al. (1993b), and Friedman and Simpson(1994) have previously argued (based on the conjunction ofneuropsychological, brain lesion, and ERP data) that, inauditory oddball tasks, older adults continue to utilize fron-tal lobe processes even for stimuli which should alreadyhave been well represented in either working or long-termmemory. For example, when Fabiani and Friedman (1995)assessed changes in target P3b scalp distribution elicited bypure tones as a function of time on task (within a single ERPrecording session), both young and old adults showed afrontally oriented scalp distribution to the first presentationsof target events during an initial practice block (i.e. wheneven the target stimuli were new to the subject). This fron-tally oriented scalp distribution was highly similar to thatelicited by infrequently occurring, complex, auditory envir-onmental sounds (labeled novels), which were irrelevant tothe subject’s task. The frontal focus elicited by the initialtargets during practice diminished for the young as time ontask increased, but this decrease was not evident for theelderly.
On these bases, Fabiani and Friedman (1995) suggestedthat some of the generators that contribute to the scalp-recorded P3b activity would be differentially activateddepending upon the ‘novelty’ of the stimuli. In this view,it is possible to hypothesize that the frontal generator(s) ofthis presumed neural circuit would be activated when sti-muli were presented for the first time (as in the case oftargets in Fabiani and Friedman’s practice block). As sub-jects gain more experience with the stimuli, the activity ofthis aspect of the P3b complex diminishes, with the ‘poster-ior’ generators predominating. As described in Section 1,the existence of an anterior-posterior neural network of thistype is consistent with a wide variety of ERP data (e.g.Wood and McCarthy, 1985; Knight et al., 1989; Johnson,1990, 1994; Yamaguchi and Knight, 1991, 1992).
However, it is also possible that the existence of a frontaldistribution reflects unique frontally positive activity (withunique generator processes) that overlaps a more posteriorlydistributed P3b. The generator(s) of this activity might betriggered by certain combinations of stimulus and task para-meters (e.g. novel, task-irrelevant stimuli during an oddballtask) and might be inactive in other situations. Under thisscenario, the major age-related change would be on thispresumed ‘frontal’ component, rather than on the frontalaspect of an integrated neural circuit that gives rise (as awhole) to P3b activity recorded at the scalp. However, atthis stage of our knowledge, deciding upon which of theseinterpretations is most likely is difficult at best.
Nevertheless, based on the results of the studies reviewedabove, it can be hypothesized that older adults continue toutilize prefrontal processes to encode stimuli in many tasks,thus accounting for the frontal P3b scalp focus in the varietyof experimental paradigms reported here. Thus, any changesin scalp distribution induced by differences in task require-ments are superimposed on this relatively frontally orientedscalp focus. Consistent with this view, recent source mod-
eling data based on the target ERPs reported by Fabiani andFriedman (1995) suggested the presence of bilateral frontaland posterior sources for the P3b elicited by targets of theolder adults of that investigation, but only bilateral posteriorsources for the young adults (Friedman et al., 1996b).
This hypothesis is based on data obtained in Go/No-Gotasks. On the other hand, in those tasks in which a 20/80choice response was required, the frontally oriented area ofpositivity was not as evident in the topographies of the olderadults. Thus, comparison of the distributions elicited underchoice and Go/No-Go RT regimes suggests that the differ-ences for the elderly may be due to age-related changes instrategy (e.g. differences in motor preparation, and/or dif-ferential engagement of inhibitory processes) induced bythe different response organization requirements in thetwo RT regimes, choice versus Go/No-Go. The requirementfor Go/No-Go responses induces an area of central scalpnegativity that appears to bisect the P3b scalp distributioninto anterior and posterior aspects (e.g. Friedman et al.,1993b; Fabiani and Friedman, 1995). Since this centralnegativity occurred in a similar manner in experiments inwhich speed and accuracy were emphasized equally, thetype of reaction time instruction does not appear to be arelevant factor. Fabiani and Friedman suggested that onepossible explanation is that this negativity corresponds toactivity (perhaps of motor origin) from a source(s) which isseparate from the P3b sources, with its own functional role.As can be seen by inspection of the scalp maps depicted inFigs. 4–6, this phenomenon has been replicated in severalindependent samples of elderly subjects, with both auditoryand visual stimuli.
Taken as a whole, these data suggest that the P3b scalptopography recorded in older adults is modulated by taskvariables in a fashion similar to that of the young. However,for the old, this modulation is superimposed on an area offrontal scalp positivity presumably related to frontal lobeactivity. The presence of this activity suggests that olderadults continually activate frontal cortex and is consistentwith two alternative, but complementary, hypotheses thatinvoke changes in frontal lobe functioning with increasingage: (1) older adults cannot inhibit a ‘novelty’ response tothese kinds of stimuli; or (2) it takes older adults longer toform and/or maintain an adequate representation of rarelyoccurring stimuli in working memory.
Acknowledgements
The authors thank Mr. Charles L. Brown III for prelimin-ary data reduction and computer programming. Weacknowledge with gratitude the help of Ms. CharlotteTrott, Ms. Blanca Rincon, and Mr. Sean Hewitt for datacollection in the experiments reported here. We also thankDrs. Steve Berman, Marla Hamberger, Walter Ritter, Gre-gory Simpson, and Joan G. Snodgrass, who were collabora-tors on many of the studies reported here. We thank Ms.
511D. Friedman et al. / Electroencephalography and clinical Neurophysiology 104 (1997) 498–513
Rachel Yarmolinsky, Ms. Eve Vagg, and Mr. Marvin Nalickfor the construction and photoreproduction of figures. Manythanks to Drs. Ray Johnson, Jr., and Gabriele Gratton fortheir critical commentaries on earlier drafts of this manu-script, and to Dr. Judith M. Ford for discussions of andsharing her data on the relationship between P3b topogra-phy and MRI volumetric indices. We thank Dr. TimothyLynch for performing the medical and neurological examsfor the older participants in some of the studies reportedhere. The authors are grateful to the participants in all ofthe studies for generously giving their time. The researchreported here was supported in part by Grants AG005213and AG09988 from the USPHS, and by the New York StateDepartment of Mental Hygiene.
References
Adams, R.L., Smigielski, J. and Jenkins, R.L. Development of a Satz-Mogel short form of the WAIS-R. J. Consult. Clin. Psychol., 1984,52: 908.
Adeloye, A., Kattan, K.R. and Silverman, F.N. Thickness of the normalskull in American blacks and whites. Am. J. Phys. Anthropol., 1985, 43:23–30.
Ammons, R.B. and Ammons, C.H. The quick test (QT): provisional man-ual. Psychol. Rep., 1962, Monogr. Suppl.: I-VII.
Craik, F.I.M., Morris, L.W., Morris, R.G. and Loewen, E.R. Relationsbetween source amnesia and frontal lobe functioning in older adults.Psychol. Aging, 1990, 5: 148–151.
Courchesne, E., Hillyard, S.A. and Galambos, R. Stimulus novelty, taskrelevance and the visual evoked potential in man. Electroenceph. clin.Neurophysiol., 1975, 39: 131–143.
Fabiani, M. and Friedman, D. Changes in brain activity patterns in aging:the novelty oddball. Psychophysiology, 1995, 32: 579–594.
Fabiani, M. and Friedman, D. Dissociations between memory for temporalorder and recognition memory in aging. Neuropsychologia, 1997, 35:129–141.
Ford, J.M. and Pfefferbaum, A. Age-related changes in ERPs. In: P.K.Ackles, J.R. Jennings and M.G.H. Coles (Eds.), Advances in Psycho-physiology. JAI Press, Greenwich, 1985, pp. 301–339.
Ford, J.M. and Pfefferbaum, A. Event-related potentials and eyeblinkresponses in automatic and controlled processing: effects of age. Elec-troenceph. clin. Neurophysiol., 1991, 78: 361–377.
Friedman, D. Cognition in the normal elderly: an event-related potentialperspective. In: F. Boller and J. Grafman (Eds.), Handbook of Neurop-sychology, Vol. 10. Elsevier, Amsterdam, 1995, pp. 213–240.
Friedman, D. and Simpson, G. Amplitude and scalp distribution of targetand novel events: effects of temporal order in young, middle-aged andolder adults. Cogn. Brain Res., 1994, 2: 49–63.
Friedman, D., Putnam, L. and Sutton, S. Event-related potentials in chil-dren, young adults and senior citizens: homologous components andscalp distribution changes. Dev. Neuropsychol., 1989, 5: 33–60.
Friedman D., Hamberger, M. and Ritter, W. Event-related potentials asindicators of repetition priming in young and elderly adults: amplitude,duration and scalp distribution. Psychol. Aging, 1993a, 8: 120–125.
Friedman, D., Simpson, G.V. and Hamberger, M. Age-related changes inscalp topography to novel and target stimuli. Psychophysiology, 1993b,30: 383–396.
Friedman, D., Ritter, W. and Snodgrass, J.G. ERPs during study as afunction of subsequent direct and indirect memory testing in youngand old adults. Cogn. Brain Res., 1996a, 4, 1–13.
Friedman, D., Fabiani, M. and Simpson, G.V. Brain electrical activity in
aging: different age-related intracranial configurations revealed bysource localization. Neuroimage, 1996b, 3: S576 (Abstract).
Gratton, G., Coles, M.G.H. and Donchin, E. A new method for off-lineremoval of ocular artifact. Electroenceph. clin. Neurophysiol., 1983, 55:468–484.
Gurland, B., Golden, R.R., Teresi, J.A. and Challop, J. The SHORTCARE: an efficient instrument for the assessment of depression, demen-tia and disability. J. Gerontol., 1984, 39: 166–169.
Haaland, K.Y., Vranes, L.F., Goodwin, J.S. and Garry, P.J. Wisconsin cardsort test performance in a healthy elderly population. J. Gerontol., 1987,42: 345–346.
Halgren, E., Baudena, P., Clarke, J.M., Heir, G., Marinkovic, K., Devaux,B., Vignal, J.-P. and Biraben, A. Intracerebral potentials to rare targetand distractor auditory and visual stimuli. II Medial, lateral and poster-ior temporal pole. Electroenceph. clin. Neurophysiol., 1995, 94: 229–250.
Hamberger, M. and Friedman, D. ERP correlates of repetition priming andstimulus classification in young and older adults. J. Gerontol.: Psychol.Sci., 1992, 47: P395–P405.
Hartman, M. and Hasher, L. Aging and suppression: memory for pre-viously relevant information. Psychol. Aging, 1991, 6: 587–594.
Hollingshead, A.B. and Redlich, F.C. Social Class and Mental Illness.Wiley, New York, 1958.
Johnson, R., Jr. Long-term recognition memory in temporal lobectomypatients: an event-related potential study. Psychophysiology, 1990, 27:S42 (Abstract).
Johnson, R. On the neural generators of the P300: evidence from temporallobectomy patients. In: G. Karmos, M. Molnar, V. Csepe, I. Czigler andJ.E. Desmedt (Eds.), Perspectives of Event-Related Potentials Research,EEG Suppl. 44. Elsevier, Amsterdam, 1994, pp. 110–129.
Kausler, D.H. and Kleim, D.M. Age differences in processing relevantversus irrelevant stimuli in multiple-item recognition learning. J. Ger-ontol., 1978, 33: 87–93.
Kazmerski, V. and Friedman, D. Repetition of novel stimuli in anERP oddball paradigm: aging effects. J. Psychophysiol., 1995, 9:298–311.
Kazmerski, V. and Friedman, D. The ERP repetition effect in Alzheimer’spatients: multiple repetition priming with words. Neuropsychiatry Neu-ropsychol. Behav. Neurol., 1997, 10: 32–47.
Kazmerski, V., Friedman, D. and Hewitt, S. The ERP repetition effect inAlzheimer’s patients: multiple repetition priming with pictures. AgingCogn., 1995, 2: 169–191.
Knight, R.T. Decreased response to novel stimuli after prefrontal lesions inman. Electroenceph. clin. Neurophysiol., 1984, 59: 9–20.
Knight, R.T., Scabini, D., Woods, D.L. and Clayworth, C.C. Contributionsof temporal-parietal junction to the human auditory P3. Brain Res.,1989, 502: 109–116.
Mayeux, R., Stern, Y., Rosen, J. and Leventhal, J. Depression, intellectualimpairment and Parkinson’s disease. Neurology, 1981, 31: 645–650.
McCarthy, G. and Wood, C.C. Scalp distributions of event-related poten-tials: an ambiguity associated with analysis of variance models. Elec-troenceph. clin. Neurophysiol., 1985, 62: 203–208.
McCarthy, G., Luby, M., Gore, J.C. and Goldman-Rakic, P. Functionalmagnetic resonance imaging in a visual oddball task. Neuroimage,1996, 3: S548 (Abstract).
Mullis, R.J., Holcomb, P.J., Diner, B.C. and Dykman, R.A. The effect ofaging on the P3 component of the visual event-related potential. Elec-troenceph. clin. Neurophysiol., 1985, 62: 141–149.
Nielsen-Bohlman, L. and Knight, R.T. Prefrontal alterations during mem-ory processing in aging. Cerebral Cortex, 1995, 5: 541–549.
Perrin, P., Pernier, J., Bertrand, O. and Echallier, J.F. Spherical splines forscalp potential and current density mapping. Electroenceph. clin. Neu-rophysiol., 1989, 72: 184–187.
Pfefferbaum, A., Ford, J.M., Wenegrat, B.G., Roth, W.T. and Kopell, B.S.Clinical application of the P3 component of the ERP I: normal aging.Electroenceph. clin. Neurophysiol., 1984, 59: 85–103.
Picton, T.W., Stuss, D.T., Champagne, S.C. and Nelson, R.F. The effects
512 D. Friedman et al. / Electroencephalography and clinical Neurophysiology 104 (1997) 498–513
of age on human event-related potentials. Psychophysiology, 1984, 21:312–325.
Polich, J. P300 in the evaluation of aging and dementia. In: C.H.M.Brunia, B. Mulder and M.N. Verbaten (Eds.), Event-Related BrainResearch, EEG Suppl. 42. Elsevier, Amsterdam, 1991, pp. 304–322.
Polich, J. Meta-analysis of P300 normative aging studies. Psychophysiol-ogy, 1996, 33: 334–353.
Rabbitt, P. Age-decrement in the ability to ignore irrelevant information. J.Gerontol., 1965, 20: 233–238.
Satz, P. and Mogel, S. An abbreviation of the WAIS for clinical use. J.Clin. Psychol., 1962, 78: 77–79.
Schacter, D.L., Harbluk, J.L. and McLachlan, D.R. Retrieval withoutrecollection: an experimental analysis of source amnesia. J. Verb.Learn. Verb. Behav., 1984, 23: 593–611.
Scherg, M. Fundamentals of dipole source analysis. In: F. Grandori, M.Hoke and G.L. Romani (Eds.), Auditory Evoked Magnetic Fields andPotentials. Karger, Basel, 1990, pp. 40–69.
Strayer, D.L., Wickens, C.D. and Braune, R. Adult age differences in thespeed and capacity of information processing: 2. An electrophysiologi-cal approach. Psychol. Aging, 1987, 2: 99–110.
Tipper, S.P. Less attentional selectivity as a result of declining inhibitionin older adults. Bull. Psychonom. Soc., 1991, 29: 45–47.
Verleger, R. Gasser, T. and Mocks, J. Correction of EOG artifacts in event-related potentials of the EEG: aspects of reliability and validity. Psy-chophysiology, 1982, 19: 472–480.
Verleger, R., Neukater, W., Kompf, D. and Vieregge, P. On the reasons forthe delay of P3 latency in healthy elderly subjects. Electroenceph. clin.Neurophysiol., 1991, 79: 488–502.
Wechsler, D. Wechsler Adult Intelligence Scale-Revised. The Psycholo-gical Corporation, Hartcourt Brace Janovich, San Antonio, TX, 1981.
Wood, C.C. and McCarthy, G. A possible frontal lobe contribution to thescalp P300. Soc. Neurosci. Abstr., 1985, 11: 879.
Woods, D.L. and Knight, R.T. Electrophysiological evidence of increaseddistractibility after dorsolateral prefrontal lesions. Neurology, 1986, 36:212–216.
Yamaguchi, S. and Knight, R.T. Age effects on the P300 to novel soma-tosensory stimuli. Electroenceph. clin. Neurophysiol., 1991, 78: 297–301.
Yamaguchi, S. and Knight, R.T. Effects of temporal-parietal lesions on thesomatosensory P3 to lower limb stimulation. Electroenceph. clin. Neu-rophysiol., 1992, 84: 139–148.
513D. Friedman et al. / Electroencephalography and clinical Neurophysiology 104 (1997) 498–513