Extracting Expressive Performance Information from Recorded Music by

ORIGINAL RESEARCH ARTICLEpublished: 08 April 2014
doi: 10.3389/fnhum.2014.00188
Neural decoding of expressive human movement fromscalp electroencephalography (EEG)Jesus G. Cruz-Garza1,2 †, Zachery R. Hernandez1,3*†, Sargoon Nepaul4, Karen K. Bradley5 and
Jose L. Contreras-Vidal1,3
1 Laboratory for Noninvasive Brain-Machine Interface Systems, Department of Electrical and Computer Engineering, University of Houston, Houston, TX, USA2 Center for Robotics and Intelligent Systems, Instituto Tecnológico y de Estudios Superiores de Monterrey, Monterrey, Mexico3 Department of Biomedical Engineering, University of Houston, Houston, TX, USA4 Department of Neurobiology, University of Maryland, College Park, MD, USA5 Department of Dance, University of Maryland, College Park, MD, USA
Edited by:
Klaus Gramann, Berlin Institute ofTechnology, Germany
Reviewed by:
Joseph T. Gwin, University ofMichigan, USAJulie A. Onton, Institute for NeuralComputation, USA
*Correspondence:
Zachery R. Hernandez, Laboratoryfor Noninvasive Brain-MachineInterface Systems, Department ofElectrical and ComputerEngineering, University of Houston,4800 Calhoun Rd., Houston,TX 77004, USAe-mail: [email protected]
†These authors have contributedequally to this work.
Although efforts to characterize human movement through electroencephalography (EEG)have revealed neural activities unique to limb control that can be used to infer movementkinematics, it is still unknown the extent to which EEG can be used to discern theexpressive qualities that influence such movements. In this study we used EEG andinertial sensors to record brain activity and movement of five skilled and certified LabanMovement Analysis (LMA) dancers. Each dancer performed whole body movements ofthree Action types: movements devoid of expressive qualities (“Neutral”), non-expressivemovements while thinking about specific expressive qualities (“Think”), and enactedexpressive movements (“Do”). The expressive movement qualities that were used inthe “Think” and “Do” actions consisted of a sequence of eight Laban Effort qualities asdefined by LMA—a notation system and language for describing, visualizing, interpretingand documenting all varieties of human movement. We used delta band (0.2–4 Hz)EEG as input to a machine learning algorithm that computed locality-preserving Fisher’sdiscriminant analysis (LFDA) for dimensionality reduction followed by Gaussian mixturemodels (GMMs) to decode the type of Action. We also trained our LFDA-GMM modelsto classify all the possible combinations of Action Type and Laban Effort quality (givinga total of 17 classes). Classification accuracy rates were 59.4 ± 0.6% for Action Typeand 88.2 ± 0.7% for Laban Effort quality Type. Ancillary analyses of the potentialrelations between the EEG and movement kinematics of the dancer’s body, indicatedthat motion-related artifacts did not significantly influence our classification results. Insummary, this research demonstrates that EEG has valuable information about theexpressive qualities of movement. These results may have applications for advancing theunderstanding of the neural basis of expressive movements and for the development ofneuroprosthetics to restore movements.
Keywords: EEG, neural classification, mobile neuroimaging, neural decoding, dance, Laban Movement Analysis
INTRODUCTIONIn recent years, neural engineering approaches to understandingthe neural basis of human movement using scalp electroen-cephalography (EEG) have uncovered dynamic cortical contri-butions to the initiation and control of human lower limbmovements such as cycling (Jain et al., 2013); treadmill walk-ing (Gwin et al., 2010, 2011; Presacco et al., 2011, 2012; Cheronet al., 2012; Petersen et al., 2012; Severens et al., 2012; Schneideret al., 2013), and even robotic assisted gait (Wagner et al., 2012;Kilicarslan et al., 2013). Most of these studies however have beenlimited to slow walking speeds and have been constrained bytreadmills or the cycling or robotic devices used in the tasks, andhave yet to examine more natural, and therefore less constrained,expressive movements. To address this important limitations, amobile EEG-based brain imaging (MoBI) approach may be avaluable tool for recording and analyzing what the brain and the
body do during the production of expressive movements, whatthe brain and the body experience, and what or how the brainself-organizes while movements of physical virtuosity are modi-fied by expressive qualities that communicate emotional tone andtexture—the basic language of human interactions. These expres-sive patterns are unique to each person, and we organize them insuch particular ways that they become markers for our identities,even at great distances and from behind (Williams et al., 2008;Hodzic et al., 2009; Ramsey et al., 2011).
Interestingly, studies of the so-called human action obser-vation network, comprised of ventral premotor cortex, inferiorparietal lobe, and the superior temporal sulcus, have shown disso-ciable neural substrates for body motion and physical experienceduring the observation of dance (Cross et al., 2006, 2009). Orgset al. (2008) reported modulation of event-related desynchroniza-tion (ERD) in alpha and beta bands between 7.5 and 25 Hz in
Frontiers in Human Neuroscience www.frontiersin.org April 2014 | Volume 8 | Article 188 | 1
HUMAN NEUROSCIENCE

Cruz-Garza et al. Decoding expressive movements from EEG
accordance to a subject’s dance expertise while viewing a dancemovement. Tachibana et al. (2011) reported gradual increases inoxygenated-hemoglobin (oxy-Hb) levels using functional near-infrared spectroscopy (fNIRS) in the superior temporal gyrusduring periods of increasing complexity of dance movement.While current neuroimaging research aims to recognize how thebrain perceives dance, no study has described the various modesof expressive movements within a dance in relation to humanscalp EEG activity. Thus, the current study focuses on extract-ing information about expressive movements performed duringdance from non-invasive high-density scalp EEG.
The study emerged from many questions about the differencesin neural engagement between functional and expressive move-ment in elite performers of movement; specifically, dance, andmovement theatre. The questions are important, because dancehas been studied primarily as elite athletic movement, locatedin the motor cortex. And yet, dancers train for years to expressnuanced and complex qualities in order to tell a story, expressan emotion, or locate a situation. Where do these various com-municative messages, manifested in expressive movers, fire? Arethey part of the motor functions, or are other aspects of cog-nition involved? The questions therefore became the basis of anemergent inquiry, using the high-density scalp EEG. Since no pre-vious data on the differences between these two modalities ofmovement have been found, the study is nascent. As the inves-tigators planned for the research, it became clear from the lackof any prior studies making these distinctions that we would begathering baseline data and demonstrating feasibility for furtherstudies.
Our study utilized expert analysts and performers of expres-sive movement, all trained in Laban Movement Analysis (LMA)(Laban, 1971; Bradley, 2009). LMA is composed of four majorcomponents: Body, Space, Effort, Shape, which make up thegrammar for movement “sentences,” or phrases. In this study,we focus on the Effort component, which represents dynamicfeatures of movement, specifically the shift of an inner atti-tude toward one or more of four factors: Space (attention orfocus), Weight (impact, overcoming resistance), Time (pacing),and Flow (on-goingness). Each factor is a continuum betweentwo extremes: (1) Indulging in or favoring the quality and (2)Condensing or fighting against the quality. Table 1 illustrates theLaban’s Effort qualities, each factor’s indulging and condensingelement, respectively with textual descriptions and examples.
LMA differentiates between functional and expressive move-ment. Functional movement is perfunctory, task-oriented, non-expressive movement. It can be highly skill-based and technicallycomplex, but it does not communicate an attitude or express anemotion. An example of functional movement might be cyclingor treadmill walking; when such activities are primarily aboutthe mechanics of executing the action. Expressive movementoccurs through shifts in thoughts or intentions, and communi-cates something about the personal style of the mover. Humanbeings communicate in both verbal and nonverbal ways; thenonverbal expressive aspects of movement are “read” as indica-tors of our unique personalities and personal style. For example,movement analysts would describe individuals as “hyper” or“laid-back” based, in part, on their Effort patterns. Individuals
Table 1 | Effort factors and effort elements (Zhao, 2001; Bishko, 2007;
Bradley, 2009).
Effort Element Description
Space Attention to the surroundings. “Where.”Spatial orientation
Indirect All-round awareness, three–dimensionality ofspace, flexibleExample: waving away bugs, scanning roomfor misplaced keys
Direct Straight, linear action, attention to singularspatial possibilityExample: pointing to a particular spot,threading a needle
Flow Amount of control. “How.”Feeling of how movement progresses
Free Uncontrolled, unable to stop in the course ofmovementExample: flinging a rock into a pond, wavingwildly
Bound Rigid, controlled, restrained, resisting the flowExample: carrying an filled up of hot tea,moving in slow motion
Weight Sensing, Intention. “What.”Attitude of movement
Light Buoyant, weightless, sensitiveExample: dabbing paint on a canvas,movement of feather
Strong Powerful, bold, forceful, determinedExample: punching, pushing, wringing a towel
Time Intention, decision. “When.”Lack or sense of urgency
Sustained Leisurely, lingeringExample: yawning, smelling the flowers
Quick Unexpected, surprising, urgent, fleetingExample: swatting a fly, grabbing child frompath of danger
might have recurring moments of a Strong, Direct stance. Othersmay demonstrate recurring moments of Quick, Free, Light ges-tures that accent a sparkly or lively presence. These expressivecomponents of movement do not occur in isolated ways from theother aspects of movement analysis (Body, Space, and Shape), butrather, modify movement events. They are capable of a wide rangeof such modifications, and the complex patterns of expressivenessmake up unique movement signatures. In this way, familiar peo-ple can be identified from even great distances, simply from theirEffort qualities. Unfortunately, prior research investigating natu-ral expressive movement has been limited to motion capture tech-nology (Zhao and Badler, 2005; Bouchard and Badler, 2007). Themarkers that track the body in movement are tantalizingly close tobeing able to trace movement qualities, but have not yet achievedlegibility of the shift into expressive movement. Thus, the goal of
Frontiers in Human Neuroscience www.frontiersin.org April 2014 | Volume 8 | Article 188 | 2

Cruz-Garza et al. Decoding expressive movements from EEG
this study is two-fold: (1) Identify those efforts and individual dif-ferences in such qualities from brain activity recorded with scalpEEG, and (2) further develop MoBI approaches to the study ofnatural unconstrained expressive movement.
Certified Laban Movement Analysts were used as subjectsbecause of the extensive training in distinguishing between cat-egories of movement as both observers and performers. The fivesubjects were also teachers of LMA, and had extensive experiencein demonstrating the differences and unique qualities of each fea-ture of expressive movement to students of the work. One of theresearchers (Bradley) is a Certified Laban Movement Analyst andhas been teaching the material for 30 years. Such experienced sub-jects and researcher allowed for the identification (and labeling)of shifts in performance from functional to expressive moments.
MATERIALS AND METHODSEXPERIMENTAL SETUPSubjectsFive healthy Certified Movement Analysts (CMAs) proficient inthe expressive components of LMA participated in the study aftergiving Informed Consent. All subjects were professional teachersand performers of movement; either dancers or movement-basedactors. One man and four women were studied with ages rang-ing from 28–62 years. Data from subject 2 were discarded due totechnical issues during the recording that resulted in missing dataor data of bad quality.
TaskThe study consisted of three-trial blocks where synchronizedscalp EEG and whole-body kinematics data were recorded duringa ∼5 min unscripted and individualized dance performance. Eachtrial block consisted of three Action Types (“neutral,” “think,”“do”). During “neutral” action, subjects were directed to performfunctional movements without any additional qualities of expres-sion. This was followed by the “think” condition where subjectscontinued to perform functional movements, but now imagineda particular Laban Effort quality instructed by the experimenter.Lastly, subjects executed (i.e., enacted) the previously imaginedexpressive movement during the “do” condition. Dancers wereinstructed to begin and end each Laban Effort quality cued bythe experimenter, a professional movement analyst, in addition toa monotone auditory trigger at the onset of each condition. Thesequence of Laban Effort qualities varied from trial-to-trial as wellas from subject-to-subject. Nonetheless, all efforts were arrangedsuch that the indulging (favored) element was preceded by con-densing element of the Laban Effort quality. As we were interestedin inferring expressive qualities, all the “neutral” instances, whichwere devoid of willed expressiveness, were collapsed within asuperset “neutral” leaving therefore a total of 17 distinct classesof expressive movements to infer from scalp EEG (“neutral” +“think” × 8 efforts + “do” × 8 efforts).
DATA ACQUISITION AND PREPROCESSINGBrain activity was acquired non-invasively using a 64 channel,wireless, active EEG system sampled at 1000 Hz (BrainAmpDCwith actiCAP, Brain Products GmbH). Electrode labeling was pre-pared in accordance to the 10–20 international system using FCz
as reference and AFz as ground. The kinematics of each dance’smovements were captured using 10 wireless Magnetic, AngularRate, and Gravity (MARG) sensors (OPAL, APDM Inc., Portland,OR) sampled at 128 Hz mounted on the head, upper torso, lum-bar region, arms, thighs, shanks, and feet. Each sensor contains atriaxial magnetometer, gyroscope, and accelerometer (Figure 1).A Kalman filter was used to estimate the orientation of each IMUwith respect to the global reference frame. Using this informationabout sensor orientation, the tri-axial acceleration data, whichhad been compensated for gravitational effects, was estimated(Marins et al., 2001).
Peripheral EEG channels (FP1-2, AF7-8, F7-8, FT7-10, T7-8, TP7-10, P7-8, PO7-8, O1-2, Oz, PO9-10 in the extended10–20 EEG system montage) were rejected as these channelsare typically heavily corrupted with motion artifacts and scalpmyoelectric (EMG) contamination. In addition, time samples of500 ms before and after the onset of each condition were removedfrom further analysis to minimize time transition effects acrossconditions. EEG signals were resampled to 100 Hz, followed bya removal of low frequency trends and constrained to the deltaband (0.2–4 Hz) using a 3rd order, zero-phase Butterworth band-pass filter. The EEG data were then standardized by channel bysubtracting the mean and dividing by the standard deviation.Finally, a time-embedded feature matrix was constructed froml = 10 lags corresponding to a w = 100 ms window of EEG data.The embedded time interval was chosen based on previous stud-ies demonstrating accurate decoding of movement kinematics
FIGURE 1 | Dancer wearing the 64 ch. EEG cap and the 10 ch. magnetic,angular rate, and gravity (MARG) inertial sensors for data collection.
Frontiers in Human Neuroscience www.frontiersin.org April 2014 | Volume 8 | Article 188 | 3

Cruz-Garza et al. Decoding expressive movements from EEG
from the fluctuations in the amplitude of low frequency EEG(Bradberry et al., 2010; Presacco et al., 2011, 2012). The featurevector for each time sample tn was constructed by concatenat-ing the 10 lags (tn − 9, tn − 8, . . ., tn) for each channel intoa single vector of length 10 × N, where N is the number ofEEG channels. To avoid the problem of missing data, the fea-ture matrix was buffered by starting at the 10th EEG sample ofthe trial. All EEG channels and time lags were subsequently con-catenated and standardized to form a [t0 − w] × [N ∗ l] featurematrix.
DIMENSIONALITY REDUCTIONOnce feature matrices were generated for all trial blocks, trainingand testing data were randomly sampled in equal sizes for eachclass for cross-validation purposes, and reduced in dimension-ality (Bulea et al., 2013; Kilicarslan et al., 2013). Local Fisher’sDiscriminant Analysis (LFDA) is deployed here to reduce thedimensionality of a sample set of classes by minimizing andmaximizing samples within and between classes, respectively,while preserving the locality of the samples that form each class(Sugiyama, 2006, 2007). Details of the technique adopted here(LFDA) are described in Sugiyama (2006, 2007).
NEURAL CLASSIFIER ALGORITHMA Gaussian mixture model (GMM), capable of representing arbi-trary statistical distributions as a weighted summation of multipleGaussian distributions, or components (Paalanen et al., 2006),was employed to classify the Laban Movement (LBM) Effortsfrom scalp EEG. As the name implies, GMM represents eachclass as a mixture of Gaussian components whose parametersand component number are approximated using the Estimation-Maximization (EM) algorithm and Bayes Information Criterion(BIC), respectively (Li et al., 2012). The two main parametersfor this algorithm include the number of reduced dimensions rand k-nearest neighbors knn (from the LFDA) and thus must beoptimized for this particular application of expressive movementclassification (Li et al., 2012; Kilicarslan et al., 2013).
The probability density function for a given training data setX = {xi}n
i = 1 ∈ Rd is given by:
p(x) =K∑
k = 1
αkφk (1)
φk(x) = e−0.5(x − μk)T�−1
k (x − μk)
(2π)d/2|�k|1/2(2)
where K is the number of components and αk is the mixingweight, μk is the mean, and �k is the covariance matrix of thek-th component. The parameters of each GMM component K,including αk, μk, and �k, are estimated as those which maximizethe log-likelihood of the training set given by:
Lk =n∑
i = 1
log pk (xi) (3)
where p(x) is given in (1). Maximization of (3) is carried out usingan iterative, greedy expectation-maximization (EM) algorithm
(Vlassis and Likas, 2002), with the initial guess of the parame-ters αk, μk, and �k established via k-means clustering (Su and Dy,2007), until the log-likelihood reaches a predetermined threshold.The determination of K is critical to successful implementationof GMMs for classification. The BIC has been reported as aneffective metric for optimizing K (Li et al., 2012).
BIC = −2Lmax + 2 log (n) (4)
where Lmax is the maximum log-likelihood of each model from(3). During training, the maximum value of K = 10 was cho-sen based on estimates from prior work in our lab (Kilicarslanet al., 2013). We then computed Lmax for each value of K ∈{1, 2, . . . , 10} and estimated the optimal value of K as the model,using the minimum BIC from (4). In this manner, class-specificGMMs representing each Effort could be specified for use in amaximum-likelihood classifier. The parameters for each class-conditional GMM were specified using an optimization data set(classifier optimization). The posterior probability of each newdata point was computed using the optimized model for eachclass, and that data point was then assigned to the class thatreturned the largest value.
Neural classification from scalp EEG was performed using twoschemes of class initialization. We defined the Scheme 1 (ActionType) as a differentiation of n time samples into one of threeclasses corresponding to the conditions of “Neutral,” “Think,”and “Do.” In a similar initialization for Scheme 2 (Laban Effortquality Type), each condition of “Think” and “Do” were segre-gated into each of the eight Laban Effort quality elements, therebyforming an accumulation of 17 classes. The results of each classi-fication could be observed by obtaining the confusion matrix ofeach classification scheme. This matrix provides the user with adetailed understanding of the overall accuracy rate in terms of theaccuracy, or sensitivity and precision, for each class.
CROSS VALIDATIONOverall classification accuracy and class precision rates were aver-aged by implementing a random sub-sampling cross validationscheme. That is, samples from the concatenated feature matrix ofthree trial blocks were randomly selected and placed into an equalnumber of samples per class based on a percentage of samplesfrom the least populated class. This process was then repeated 10times (Figure 2) in order to minimize the effects of random sam-pling bias, avoid over-fitting, and demonstrate replicability of thealgorithm. A sampling of 10 accuracies was found to be sufficientas it usually resulted in a low standard error (ε < 1).
FORWARD SELECTION OF EEG CHANNELSIn an attempt to identify the EEG channels that contributed mostto classification accuracy, the iterative process of forward selectionwas introduced upon the EEG channels and their correspond-ing lags that comprise the feature matrix. This was performed bycomputing the mean classification accuracy of each EEG chan-nel independently using the LFDA-GMM algorithm, and rankingthem in descending order of accuracy values. The highest rankedchannel was added to the selected channels list (SCL), and testedagainst each of the remaining channels. The channel that ranked
Frontiers in Human Neuroscience www.frontiersin.org April 2014 | Volume 8 | Article 188 | 4

Cruz-Garza et al. Decoding expressive movements from EEG
FIGURE 2 | Flow diagram depicting the computational approach to neural decoding of expressive movements. The sample sizes n and m are equivalentto a percentage of the least populated class size.
highest in classification accuracy when tested along the SCL wasadded to the SCL for the next iteration. This procedure wasrepeated until all remaining non-SCL channels were exhausted.
EXAMINATION OF POTENTIAL MECHANICAL ARTIFACTS ON EEGDECODINGTo assess the potential contribution of mechanical/motion arti-facts to decoding, we performed a series of analyses includingtime-frequency analysis, cross-correlation analysis, and coherenceanalysis to compare the EEG signals with the motion signalsacquired with the MARG sensors. First, we performed principalcomponent analysis (PCA; Duda et al., 2012) on the accelera-tion data (d = 10 sensors). A cross-correlation analysis was thenperformed between the raw EEG (resampled to 100 Hz) and thefirst “synergy” (i.e., first PC) of acceleration data. Histogramsand box plots of each EEG channel by PC1 calculated corre-lation values were subsequently assessed to observe differencesacross the distribution of each class. Second, we performed atime-frequency analysis to compare the raw EEG signals overselected frontal, lateral, central, and posterior scalp sites andthe gravity-compensated accelerometer readings from the MARG
sensor placed on the head. Then, we estimated the coherencebetween the raw EEG signals and the accelerometer signals.Finally, we computed a whole-scalp cross-correlation of the EEGsignals and the head accelerometer readings to examine the con-tribution of head motion to EEG.
RESULTSKINEMATIC ANALYSISFigure 3 depicts a sample set of EEG and motion capture record-ings for Subject 4, Trial 2 comprising all Action type classes forthe Laban Effort quality of Flow, which includes the opposing ele-ments of free and bound flows. PCA was performed upon the fulltime series of acceleration data from all 10 MARG sensors. ThePCs whose cumulative variability summed to at least 80% werealso featured within the sample set of signal data in Figure 3. Timeseries provided for both “neutral” blocks in Figure 3 appear to berelatively “smooth” (less varying) in terms of both neural activityand kinematic movement. One exception to this includes rapidchanges in acceleration around 169 s as confirmed by the accel-eration plots. EEG signal patterns are visually distinct between“think” time segments of free and bound flow elements, especially
Frontiers in Human Neuroscience www.frontiersin.org April 2014 | Volume 8 | Article 188 | 5

Cruz-Garza et al. Decoding expressive movements from EEG
FIGURE 3 | Sample EEG and MARG recordings for Subject 4, Trial 2 with video recording (see Supplementary Materials). EEG and accelerometer dataare segmented by each condition (Neutral, Think, Do) of the Laban Effort quality of Flow. The first four PCs of acceleration data are also shown.
Frontiers in Human Neuroscience www.frontiersin.org April 2014 | Volume 8 | Article 188 | 6

Cruz-Garza et al. Decoding expressive movements from EEG
with unique areas of modulation of neural activity at 185 s (freeflow) and 209 and 214 s (bound flow) which contained little to noeffect of motion artifacts, as confirmed by the kinematics signaldata. By contrast, the “do” section of the Laban Effort quality offree flow was found to contain the greatest influence of motionembedded in the EEG signal data, as demonstrated by the largeexcursions in signal magnitude for both EEG and kinematics data.These differences between classes are more prominent when thedistribution of PC values can be observed for every class in thetrial, as shown in Figure 4. Key features to note include the smallvariance accounted by “Do Light Weight” and “Do SustainedTime” classes, which reflects the low movement the subject effec-tuated for the particular action. Other classes such as “Do FreeFlow” and “Do Quick Time” have a higher variance due to thenature of these efforts as they cover a greater range of motion.Potential motion artifacts produced by the subject’s movementsappear to contaminate EEG signal patterns, however the effectappears to be localized to specific classes of Laban Effort qual-ities (e.g., “Do Free Flow”) and thus not consistent over theentire time series. A more detailed analysis of potential mechan-ical/motion artifacts based on cross-correlation, coherence andtime-frequency analyses are thus provided next.
The distribution of correlation values between raw EEG chan-nels and the first PC of the raw acceleration data returned a rangeof median correlation coefficients between 0.02 and 0.15 acrossclasses (Figure 5A). Outliers were identified for some efforts, andthus may be indicative of a close relationship between a particu-lar EEG channel and the first PC “synergy” of acceleration. Thecoefficient of determination was obtained by squaring each cor-relation coefficient ρ. This coefficient is defined as the percentvariation in the values of the dependent variable (raw EEG) thatcan be explained by variations in the values of the independentvariable (acceleration). Coefficients of determination (ρ2) valueswere generally low and ranged from ∼0.0 to ∼0.23 (that is, ∼0to 23% of the total variation of the raw EEG can be accountedfor by changes in the PC1) across all subjects and electrodes.Spatial distributions of ρ2-values were plotted as scalp maps toindicate the relationship between the raw EEG and the head accel-eration across scalp channels. Peaks of highest accounted variance(Figure 5B) were observed for certain Laban Effort qualities, mostnotably in the occipital regions for “Think Quick Time” and“Think Light Weight” and temporal regions for “Do SustainedTime” for Subject 4 (See Supplementary Material for ρ2 data fromother subjects).
FIGURE 4 | Normalized histogram distribution of time sample data for
the first principal component of magnitude acceleration data recorded
from Subject 4, Trial 2 (n = number of samples, k = kurtosis). A boxplot
representation excluding outliers of the distribution is shown below eachhistogram. Note that the distributions for PC1 are a combination ofsuper-Gaussian and sub-Gaussian distributions as estimated by their kurtoses.
Frontiers in Human Neuroscience www.frontiersin.org April 2014 | Volume 8 | Article 188 | 7

Cruz-Garza et al. Decoding expressive movements from EEG
FIGURE 5 | The boxplots (A) and scalp maps (B) show the distribution of
the cross-correlation coefficients and coefficients of determination
between raw EEG signals and the first PC of the magnitude acceleration
data across subjects and efforts. The first PC of the acceleration dataaccounted for 64.5, 39.3, 59.8, and 44.9% of the variance for subjects 1, 3, 4,and 5 respectively. Asterisks (∗) indicate outliers within the set of ρ-values.
A similar analysis comparing the raw EEG signals and the headaccelerometer (which directly recorded EEG electrode move-ments), rather than the first PC “synergy,” was also conducted(Figure 6). This resulted in correlation values generally belowρ = 0.15, though many boxplot distributions varied by sub-ject throughout each Laban Effort quality (Figure 6A). Althoughstrong relationships between the accelerometer and EEG signalsmay be expected, the relatively low ρ2 scores indicate otherwise.Low correlations between neural activity and head motion wereobserved for classes such as “Bound Flow,” which is reasonablegiven the rigid-like movements that this effort entails. In contrast,much higher correlation coefficients remained for “Light Weight”and “Indirect Space” time segments. Figure 6B depicts scalp mapswith ρ2-values between head accelerometer and raw EEG datafor Subject 4. In the scalp maps some classes show channels withslightly high correlation ρ2 = 0.1 (which account for ∼10% ofthe total variation of the EEG due to the head motion), specif-ically in “Think Light Weight,” “Think Direct Space,” “ThinkQuick Time,” and “Do Sustained Time,” for Subject 4. Overall,these analyses showed a slight contamination, for some classes ofLaban Effort qualities, of EEG signals due to head movement (seeSupplementary Material), but the amount of total variance in theEEG signals explained by head motion was relatively small.
Additionally, time-frequency and coherence analyses were per-formed upon the raw signals of three selected EEG electrodes (Cz,C6, and POz) representing a sampling of the spatial assortment ofneural activity across the scalp, as well as the gravity-compensatedacceleration magnitude of the head MARG sensor by generat-ing two spectrograms, as shown in Figure 7. The spectrograms
were generated by computing the short-time Fourier transform(STFT) over a time window of samples with overlap at each PSDcomputation of the FFT. We used a frequency range between0.1–40 Hz and a time window of 1024 samples with 93% over-lap. The mean-squared coherence between the head accelerationand each corresponding EEG electrode at each frequency valuewas computed using Welch’s overlapped-segment averaging tech-nique (Carter, 1987). From the spectrograms it can be observedthat the actions “Do Quick Time,” “Do Think Free Flow,” “DoStrong Weight,” and short-lived portions of “Neutral” tasks con-tained higher power in the head accelerometer readings that mayaffect decoding. However, coherence estimates were generally low(<0.3; see Figure 7) with some transient increases in coherencebetween EEG and head acceleration during some Laban Effortqualities. Given that relatively high levels of coherence were short-lived and localized to a few classes of Laban Effort qualities,and that random sampling of EEG signals were used for train-ing and cross-validation of our neural classifiers, we argue thatmotion artifacts, if present, had only a very minor contributionto decoding. We further discuss these results below.
DECODING ACTION TYPE FROM SCALP EEGWe first examined the feasibility of inferring the action type(“neutral,” “think,” “do”), irrespective of Laban Effort quality,from scalp EEG. Analyses showed the “think” condition had thehighest sensitivity than the other two action types. Based on theoptimization of LFDA parameters, the mean accuracy rate (10random subsampling cross-validation iterations were used foreach subject) was 56.2 ± 0.6% by Action Type for Subject 1
Frontiers in Human Neuroscience www.frontiersin.org April 2014 | Volume 8 | Article 188 | 8

Cruz-Garza et al. Decoding expressive movements from EEG
FIGURE 6 | (A) The boxplots show the distribution of thecross-correlation coefficients between raw EEG signals and themagnitude acceleration data from the head MARG sensor acrosssubjects and efforts. (B) Scalp maps of coefficient of determination
(ρ2) values between raw EEG signals and the magnitude accelerationdata from the head MARG sensor across Laban Effort qualities forSubject 4. See Supp. Materials for other subjects. Asterisks (∗)indicate outliers within the set of ρ-values.
(r = 300, knn = 21), which was well above 33% chance proba-bility. Similar classification accuracy results were obtained for therest of the subjects, namely 57.0 ± 0.4% for Subject 3, 62.1 ±0.5% for Subject 4, 62.4 ± 1.0% for Subject 5. Figure 8 shows themean classification accuracies for the different data sets tested.
Predicted samples were summed across all four subjects andnormalized by dividing each predicted sample size by the actualclass sample size, as indicated by the percentages within eachconfusion matrix block (Figure 9). Figure 9 depicts the confu-sion matrix for the Action Type decodes. Classification of EEGpatterns corresponding to the “think” class achieved the high-est classification rates (88.2%), followed by both “neutral” and“do” classes. Note that the highest misclassifications occurredfor class “neutral,” which were classified as belonging to the“think” (32.9%) class. The worst performance was for the “do”class as instances of “neutral” (23.5%) and “think” (50.7%) weremisclassified as “do.”
DECODING LABAN EFFORT QUALITY TYPE FROM SCALP EEGWe then examined the classification accuracy for Laban Effortquality Type (8 Think about Laban Effort quality + 8 Do LabanEffort quality + Neutral = 17 classes). In this case, nearly alltest samples were accurately classified into their respective classes,which resulted in 88.2% classification accuracy across subjects.Figure 8 (black bars) shows the mean classification accuraciesfor Laban Effort qualities across subjects. Interestingly, most testsamples were misclassified under the “neutral” class as shown bythe relatively high percentages for all non-“neutral” classes in the
first column (Figure 10). Based upon Figure 10, classes related toactions of “do” were more difficult to classify (relative to actionsof “think”) except for “Do Quick Time,” which contained thehighest sensitivity rate overall (96.5%).
TRAINING SAMPLE SIZE EFFECTS ON CLASSIFICATION ACCURACYThe effect of training sample size on classification accuracy wasalso examined in Subject 1. The training sample size constituteda percentage (20–90) of the least populated class. Classificationof Action type was not significantly affected by percentage oftraining samples (Figure 11); however, classification of LabanEffort quality type showed a non-linear increase as a function ofpercentage of training samples.
RELEVANT EEG CHANNELS FOR CLASSIFICATIONA forward selection approach was employed per subject in orderto identify the EEG channels with the most useful information forclassification (Pagano and Gauvreau, 2000). While maintainingthe number of reduced dimensions (r) and k-nearest neigh-bors (knn) constant (r = 10, knn = 7) and operating under theEffort Type classification scheme, the mean classification accu-racy was computed for all 39 channels and corresponding lagsindependently. The channel that yielded the highest classificationaccuracy (channel A) was then selected. Classification accura-cies were then re-computed by adding channel A to each of theremaining 38 channels independently. The channel-pair yield-ing the highest accuracy was again selected and added to eachof the remained channels to find the channel-triplets yielding
Frontiers in Human Neuroscience www.frontiersin.org April 2014 | Volume 8 | Article 188 | 9

Cruz-Garza et al. Decoding expressive movements from EEG
FIGURE 7 | Spectrograms and short-term coherence between
selected (raw) EEG channels (Cz, C6, and POZ) and the acceleration
magnitude of the head MARG sensor for Subject 4. Frequency axesare shown in logarithmic scale. Note the generally low coherence
values (<0.3) across most Laban Effort quality classes with someshort-lived increases in coherence for some Efforts. Bold vertical blacklines above each figure indicate the efforts windows in Figures 3, 4 tocompare to each spectrogram plot.
Frontiers in Human Neuroscience www.frontiersin.org April 2014 | Volume 8 | Article 188 | 10

Cruz-Garza et al. Decoding expressive movements from EEG
FIGURE 8 | Mean (SD) classification accuracies for 10 iterations and
optimized LFDA parameters for both Action (3 classes) and Effort (17
classes) Type decoding. The gray middle bars show the mean classification
accuracy for the 10 electrodes that individually yielded the highest classificationaccuracy using the forward selection algorithm with constant LFDA parameters(r = 10, knn = 7, See Relevant EEG channels for classification for discussion).
the highest accuracy, and so on. This process continues until nochannels remained, and classification accuracy was shown to stopincreasing after selecting approximately 10 electrodes for eachsubject (shaded gray region in Figure 12). Hence, 10 electrodeswere retained for further analysis per subject, as illustrated by thescalp maps depicted in Figures 13A–D. Electrodes common toat least two subjects were highlighted in Figure 13E, which spanover scalp areas above bilateral premotor and motor cortices anddorsal parietal lobule areas. This is consistent with previous stud-ies seeking to associate dancing movements with cortical regions(Cross et al., 2006, 2009). Though peak accuracies at 10 electrodes(Figure 12) were low (40–50%) relative to optimized Effort Typeaccuracies (Figure 8), this was largely due to the lower reduceddimension parameter for LDFA. This suggests that a higher-than-chance classification accuracy can be obtained by using as fewas 10 electrodes. Nevertheless, relevant information within all 39EEG channels ultimately allows the classifier to reach more than90% decoding accuracy (Figure 8).
EFFECTS OF HEAD MOTION ON NEURAL CLASSIFICATIONWe examined the relationship between classification performanceand motion artifact contamination. Taking the ρ-values fromFigure 5A, we compared them with each class’ F1 score in clas-sification. If classes with higher ρ-values showed a higher F1score, this would mean that the classifier was able to better clas-sify the classes that were modulated by motion artifacts. However,Figure 14 shows no evidence of a correspondence between the F1score and the correlation coefficients per class.
The F1 score (5) is a weighted average of the sensitivity andprecision rates, and thus reflects the overall accuracy of a partic-ular class (Hripcsak and Rothschild, 2005). For purposes of this
FIGURE 9 | Normalized Summed Confusion Matrix across subjects for
three classes (Action Type decodes). The bottom-right corner providesthe overall mean classification accuracy (59.4%).
study we use the balanced F1 score equation, defined as:
F =(1 + β2
) × sensitivity × precision(β × precision
) + sensitivity, β = 1 (5)
where β is used as a weighting factor between sensitivity andprecision. Overall, a direct relationship between classification
Frontiers in Human Neuroscience www.frontiersin.org April 2014 | Volume 8 | Article 188 | 11

Cruz-Garza et al. Decoding expressive movements from EEG
FIGURE 10 | Normalized Summed Confusion Matrix across
subjects for 17 classes (Laban Effort quality Type). Thebottom-right corner provides the overall mean classification
accuracy across subjects (88.2%). This was obtained by summingeach subject’s normalized confusion matrix and normalizing thesummed result.
success and the median correlation coefficient of EEG channels-to-acceleration data does not seem to occur, but rather a tendencyexists for high successes of neural classification in classes that alsocontain low correlations with accelerometer data.
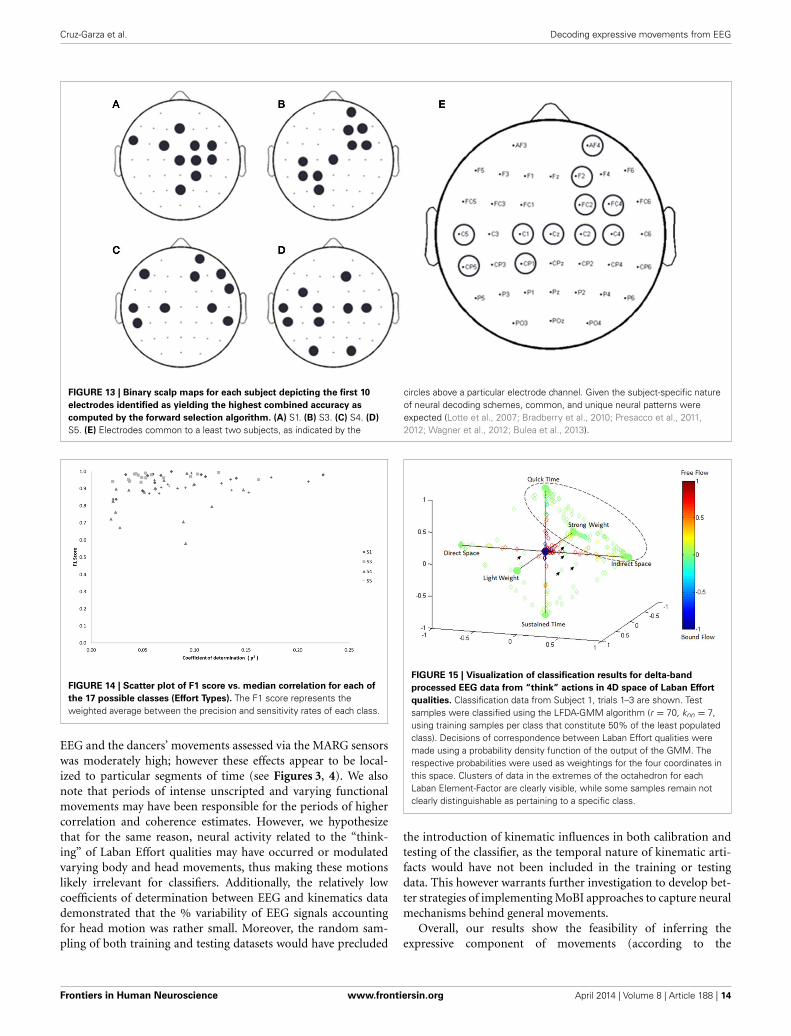
EFFORT TYPE CLASSIFICATION REPRESENTED IN 4D LABAN SPACEFigure 15 illustrates the highly predictive power of the LabanEffort quality Type neural classification scheme. Using a normal-ized variant of the GMM probability density function, we placedweightings to the four coordinates in the Laban Effort qualityspace. Each axis corresponds to a Laban Effort quality of Space,Flow, Weight, and Time. Some testing samples were found tobe misclassified between Indirect Space, Light Weight, and QuickTime axes, as shown by the ellipsis in Figure 15. This may suggest
shared characteristics between the expressive movements thatcause such misclassification. Non-expressive, or non-classifiable,samples are depicted as green foci falling near the center of theplot, as indicated by the small arrows. The small amount of non-classified samples reflects the overall error of the classifier topredict Laban Effort quality using neural recordings.
DISCUSSIONCLASSIFICATION OF EXPRESSIVE MOVEMENTS FROM SCALP EEGIn this study we demonstrate the feasibility of classifying expres-sive movement from delta band, EEG signals. Classification ratesranged from 59.4 ± 0.6% for decoding of Action Type (“neutral,”“think,” and “do”) to 88.2 ± 0.7% for decoding of Laban Effortquality (17 classes). Surprisingly, only the “think” class was
Frontiers in Human Neuroscience www.frontiersin.org April 2014 | Volume 8 | Article 188 | 12

Cruz-Garza et al. Decoding expressive movements from EEG
FIGURE 11 | Mean accuracies (for 10 iterations) across varying
percentage of training samples for classification by Action (3 classes)
and Laban Effort quality (17 classes) types for Subject 1. LFDAparameters: (r = 180, knn = 7) for both classification schemes. ∗Trainingdata samples constitute a percentage of the least populated class.
FIGURE 12 | Growth of the mean accuracy (for 30 iterations) as n
channels were added to the new set for subjects 1, 3, 4, and 5 using
forward selection with constant LDFA parameters (r = 10, knn = 7) and
the Effort Type classification scheme. The approximate peak in accuracyrate at 10 electrodes, highlighted by the vertical gray bar, was displayed inFigure 8 to demonstrate the extent of classifying using only 10 electrodesat such a relatively low dimensionality.
reliably decoded from EEG whereas classes “neutral” and “do”were poorly decoded. It should be noted that subjects were notinstructed to perform a particular pattern of movement, butrather a mode of action (“neutral,” “think,” and “do”) and LabanEffort quality as a component of LMA. Thus, subjects performedhighly individualized changing movement patterns throughoutthe recording session irrespective of mode of action. We notethat our neural decoding framework uses a within-subjectapproach where neural classifiers are trained for each subject.Such neural decoding approaches are subject specific (Lotte et al.,2007; Bradberry et al., 2010; Presacco et al., 2011, 2012; Wagner
et al., 2012; Bulea et al., 2013), and thus common and uniqueneural patterns are to be expected to influence classification.Conventional statistical analyses can therefore be difficult tointerpret in the context of this framework because many factorsaffect the resulting estimates of significance (i.e., assumptionsunderlying response distribution, sample size, number of trials,data over-fitting, etc.) (Tsuchiya et al., 2008). Given the cross-validation procedure (i.e., separate random sampling of datafor training and test trials) used in our methodology, the riskof over-fitting is minimized. By deploying our methodologyfor investigating differences in cortical EEG activity patterns,especially as a function of within-subject training, valuableinformation could be learned about the adaptation/learningtrajectories of those patterns and their relationship to perfor-mance and training. On the other hand, the consistency of theunderlying neural representations, within a subject, would be avaluable metric in longitudinal studies.
DECODING OF ACTION TYPE AND LABAN EFFORT QUALITIESThe mean decoding accuracy for action type (“neutral,” “think,”“do”) was near 60%, which was well above chance level.Interestingly, classification rate for the “think” actions was high-est (88.2%), followed by “neutral” (64.3%) and “do” actions(25.8%). We note that individualized and unscripted functionalmovements were performed across all the three action types.Thus, the lowest classification rate for the “do” actions may reflectneural patterns that contain integrated elements of “thought”expressiveness and functional movement that were enacted bythe dancers. This would have likely introduced “noise” to thesepatterns as diverse functional movements were performed irre-spective of the Laban Effort qualities being imagined. On theother hand, the “neutral” actions, albeit unscripted and varyingacross time, contained separable information for the classifiers todiscriminate them from the other action types. Only the “think”actions contained separable information about functional move-ment and Laban Effort qualities, which could be decoded by theclassifiers. Thus, it is expected the “neutral” class to yield the worstclassification rate given the stochastic pattern of functional move-ments it contains. Likewise the poor classification of the “do”class may be due to the heterogeneous mixture of functional andexpressive movements co-occurring, which may introduce someneural noise within the neural activity evoked by this action.
Interestingly our results demonstrate a greater predictivepower toward the classification of each Laban Effort quality ele-ment rather than the aggregation of all Laban elements into asingular condition-defined class (Figures 9, 10) suggesting thatthe neural internal states associated with these efforts contain dif-ferentiable features, beyond the movements performed, that canbe extracted from scalp EEG.
INFLUENCE OF MOTION ARTIFACTSGiven the nature of the experimental setup, it is reasonable toassert the assumption that the EEG data may be plagued withmotion artifacts. To examine this possibility we performed a seriesof analyses to uncover any potential relationship between theEEG signals and the dancers’ body and head movements. Wefound that in a few instances the correlation between the raw
Frontiers in Human Neuroscience www.frontiersin.org April 2014 | Volume 8 | Article 188 | 13
Cruz-Garza et al. Decoding expressive movements from EEG
FIGURE 13 | Binary scalp maps for each subject depicting the first 10
electrodes identified as yielding the highest combined accuracy as
computed by the forward selection algorithm. (A) S1. (B) S3. (C) S4. (D)
S5. (E) Electrodes common to a least two subjects, as indicated by the
circles above a particular electrode channel. Given the subject-specific natureof neural decoding schemes, common, and unique neural patterns wereexpected (Lotte et al., 2007; Bradberry et al., 2010; Presacco et al., 2011,2012; Wagner et al., 2012; Bulea et al., 2013).
FIGURE 14 | Scatter plot of F1 score vs. median correlation for each of
the 17 possible classes (Effort Types). The F1 score represents theweighted average between the precision and sensitivity rates of each class.
EEG and the dancers’ movements assessed via the MARG sensorswas moderately high; however these effects appear to be local-ized to particular segments of time (see Figures 3, 4). We alsonote that periods of intense unscripted and varying functionalmovements may have been responsible for the periods of highercorrelation and coherence estimates. However, we hypothesizethat for the same reason, neural activity related to the “think-ing” of Laban Effort qualities may have occurred or modulatedvarying body and head movements, thus making these motionslikely irrelevant for classifiers. Additionally, the relatively lowcoefficients of determination between EEG and kinematics datademonstrated that the % variability of EEG signals accountingfor head motion was rather small. Moreover, the random sam-pling of both training and testing datasets would have precluded
FIGURE 15 | Visualization of classification results for delta-band
processed EEG data from “think” actions in 4D space of Laban Effort
qualities. Classification data from Subject 1, trials 1–3 are shown. Testsamples were classified using the LFDA-GMM algorithm (r = 70, knn = 7,using training samples per class that constitute 50% of the least populatedclass). Decisions of correspondence between Laban Effort qualities weremade using a probability density function of the output of the GMM. Therespective probabilities were used as weightings for the four coordinates inthis space. Clusters of data in the extremes of the octahedron for eachLaban Element-Factor are clearly visible, while some samples remain notclearly distinguishable as pertaining to a specific class.
the introduction of kinematic influences in both calibration andtesting of the classifier, as the temporal nature of kinematic arti-facts would have not been included in the training or testingdata. This however warrants further investigation to develop bet-ter strategies of implementing MoBI approaches to capture neuralmechanisms behind general movements.
Overall, our results show the feasibility of inferring theexpressive component of movements (according to the
Frontiers in Human Neuroscience www.frontiersin.org April 2014 | Volume 8 | Article 188 | 14

Cruz-Garza et al. Decoding expressive movements from EEG
Laban categorization) from scalp EEG, especially when thosecomponents are imagined as subjects perform unscripted naturalbody movements. These results may have implications forthe study of movement training, disease and brain-computerinterfaces for restoration of expressive movements.
ACKNOWLEDGMENTSThis material is based upon work supported by the NationalScience Foundation under Grant # HRD-1008117 and theNational Institutes of Health Award # NINDS R01 NS075889, andalso in collaboration with Laboratorio de Robotica del Norestey Centro de Mexico-CONACyT, Tecnologico de Monterrey. Wewould also like to express our gratitude to Thomas Bulea, AtillaKilicarslan, and Harshavardhan Agashe for assisting with theLFDA-GMM algorithms and setting up the EEG, kinematics, andvideo recordings for this study.
SUPPLEMENTARY MATERIALThe Supplementary Material for this article can be foundonline at: http://www.frontiersin.org/journal/10.3389/fnhum.
2014.00188/abstract
Video Recordings to Figure 3 | Subject 4, Trial 2 EEG and kinematics data.
Recordings are included in the online manuscript submission and are titled
as: Direct Space Effort (Movie 1), Free Flow Effort (Movie 2), and Bound
Flow Effort (Movie 3).
Figure 5.S1 | Mapping of the coefficient of determination (ρ2) between the
first principal component of the accelerometer data and unprocessed EEG
data for each Laban Effort quality performed by each subject.
Figure 6.S1 | Mapping of the coefficient of determination (ρ2) between the
head accelerometer magnitude and unprocessed EEG data for each Laban
Effort quality performed by each subject.
REFERENCESBishko, L. (2007). The uses and abuses of cartoon style in animation. Animation
2, 24–35. Available online at: http://journal.animationstudies.org/wp-content/uploads/2007/12/ASVol2Art4LBishko.pdf
Bouchard, D., and Badler, N. (2007). “Semantic segmentation of motion captureusing laban movement analysis,” in Intelligent Virtual Agents, eds C. Pelachaud,J.-C. Martin, E. André, G. Chollet, K. Karpouzis, and D. Pelé (Berlin; Heidelberg:Springer), 37–44. doi: 10.1007/978-3-540-74997-4_4
Bradberry, T. J., Gentili, R. J., and Contreras-Vidal, J. L. (2010). Reconstructingthree-dimensional hand movements from noninvasive electroencephalographicsignals. J. Neurosci. 30, 3432–3437. doi. 10.1523/JNEUROSCI.6107-09.2010
Bradley, K. (2009). Rudolf Laban. New York, NY: Routledge.Bulea, T. C., Prasad, S., Kilicarslan, A., and Contreras-Vidal, J. L. (2013).
“Classification of stand-to-sit and sit-to-stand movement from low fre-quency EEG with locality preserving dimensionality reduction,” in Engineeringin Medicine and Biology Society (EMBC), 2013 35th Annual InternationalConference of the IEEE (Osaka), 6341–6344. doi. 10.1109/EMBC.2013.6611004
Carter, G. C. (1987). Coherence and time delay estimation. Proc. IEEE 75, 236–255.doi: 10.1109/PROC.1987.13723
Cheron, G., Duvinage, M., De Saedeleer, C., Castermans, T., Bengoetxea, A.,Petieau, M., et al. (2012). From spinal central pattern generators to cortical net-work: integrated BCI for walking rehabilitation. Neural Plast. 2012:375148. doi:10.1155/2012/375148
Cross, E. S., Hamilton, A. F., and Grafton, S. T. (2006). Building a motor simula-tion de novo: observation of dance by dancers. Neuroimage 31, 1257–1267. doi:10.1016/j.neuroimage.2006.01.033
Cross, E. S., Hamilton, A. F., Kraemer, D. J. M., Kelley, W. M., and Grafton, S.T. (2009). Dissociable substrates for body motion and physical experience inthe human action observation network. Eur. J. Neurosci. 30, 1383–1392. doi:10.1111/j.1460-9568.2009.06941.x
Duda, R. O., Hart, P. E., and Stork, D. G. (2012). Pattern Classification. New York,NY: John Wiley and Sons.
Gwin, J. T., Gramann, K., Makeig, S., and Ferris, D. P. (2010). Removal of move-ment artifact from high-density EEG recorded during walking and running.J. Neurophysiol. 103, 3526–3534. doi: 10.1152/jn.00105.2010
Gwin, J. T., Gramann, K., Makeig, S., and Ferris, D. P. (2011). Electrocortical activ-ity is coupled to gait cycle phase during treadmill walking. Neuroimage 54,1289–1296. doi: 10.1016/j.neuroimage.2010.08.066
Hodzic, A., Kaas, A., Muckli, L., Stirn, A., and Singer, W. (2009). Distinct corticalnetworks for the detection and identification of human body. Neuroimage 45,1264–1271. doi: 10.1016/j.neuroimage.2009.01.027
Hripcsak, G., and Rothschild, A. S. (2005). Agreement, the F-Measure, and reli-ability in information retrieval. J. Am. Med. Inform. Assoc. 12, 296–298. doi:10.1197/jamia.M1733
Jain, S., Gourab, K., Schindler-Ivens, S., and Schmit, B. D. (2013). EEG during ped-aling: evidence for cortical control of locomotor tasks. Clin. Neurophysiol. 124,379–90. doi: 10.1016/j.clinph.2012.08.021
Kilicarslan, A., Prasad, S., Grossman, R. G., and Contreras-Vidal, J. L. (2013).“High accuracy decoding of user intentions using EEG to control a lower-body exoskeleton,” in Engineering in Medicine and Biology Society (EMBC),2013 35th Annual International Conference of the IEEE (Osaka), 5606–5609. doi:10.1109/EMBC.2013.6610821
Laban, R. (1971). The Mastery of Movement. Boston, MA: Plays, Inc. (Original workpublished 1950).
Li, W., Prasad, S., Fowler, J. E., and Bruce, L. M. (2012). Locality-preservingdimensionality reduction and classification for hyperspectral image analysis.IEEE Trans. Geosci. Remote Sensing 50, 1185–1198. doi: 10.1109/TGRS.2011.2165957
Lotte, F., Congedo, M., Lécuyer, A., Lamarche, F., and Arnaldi, B. (2007). A reviewof classification algorithms for EEG-based brain–computer interfaces. J. NeuralEng. 4, R1–R13. doi: 10.1088/1741-2560/4/2/R01
Marins, J. L., Yun, X., Bachmann, E. R., McGhee, R. B., and Zyda, M. J. (2001).“An extended Kalman filter for quaternion-based orientation estimation usingMARG sensors,” in Intelligent Robots and Systems, 2001. Proceedings. 2001IEEE/RSJ International Conference on, Vol. 4, (Maui, HI), 2003–2011. doi:10.1109/IROS.2001.976367
Orgs, G., Dombrowski, J. H., Heil, M., and Jansen-Osmann, P. (2008).Expertise in dance modulates alpha/beta event-related desynchronization dur-ing action observation. Eur. J. Neurosci. 27, 3380–3384. doi: 10.1111/j.1460-9568.2008.06271.x
Paalanen, P., Kamarainen, J.-K., Ilonen, J., and Kälviäinen, H. (2006). Featurerepresentation and discrimination based on Gaussian mixture model proba-bility densities—practices and algorithms. Pattern Recogn. 39, 1346–1358. doi:10.1016/j.patcog.2006.01.005
Pagano, M., and Gauvreau, K. (2000). “Multiple Regression,” in Principles of bio-statistics, 2nd Edn., eds C. Crockett, et al. (Pacific Grove, CA: Duxbury),449–469.
Petersen, T. H., Willerslev−Olsen, M., Conway, B. A., and Nielsen, J. B. (2012). Themotor cortex drives the muscles during walking in human subjects. J. Physiol.590, 2443–2452. doi: 10.1113/jphysiol.2012.227397
Presacco, A., Goodman, R., Forrester, L., and Contreras-Vidal, J. L. (2011). Neuraldecoding of treadmill walking from noninvasive electroencephalographic sig-nals. J. Neurophysiol. 106, 1875–1887. doi: 10.1152/jn.00104.2011
Presacco, A., Forrester, L. W., and Contreras-Vidal, J. L. (2012). Decoding intra-limb and inter-limb kinematics during treadmill walking from scalp elec-troencephalographic (EEG) signals. IEEE Trans. Neural Syst. Rehabil. Eng. 20,212–219. doi: 10.1109/TNSRE.2012.2188304
Ramsey, R., van Schie, H. T., and Cross, E. S. (2011). No two are the same:Body shape is part of identifying others. Cogn. Neurosci. 2, 207–208. doi:10.1080/17588928.2011.604721
Schneider, S., Abeln, V., Popova, J., Fomina, E., Jacubowski, A., Meeusen, R.,et al.(2013). The influence of exercise on prefrontal cortex activity and cognitive per-formance during a simulated space flight to Mars (MARS500). Behav. Brain Res.236, 1–7. doi: 10.1016/j.bbr.2012.08.022
Severens, M., Nienhuis, B., Desain, P., and Duysens, J. (2012). “Feasibility ofmeasuring event Related Desynchronization with electroencephalography dur-ing walking,” in Engineering in Medicine and Biology Society (EMBC), 2012Annual International Conference of the IEEE (San Diego, CA), 2764–2767. doi:10.1109/EMBC.2012.6346537
Frontiers in Human Neuroscience www.frontiersin.org April 2014 | Volume 8 | Article 188 | 15

Cruz-Garza et al. Decoding expressive movements from EEG
Su, T., and Dy, J. G. (2007). In search of deterministic methods for initializingK-means and Gaussian mixture clustering. Intell. Data Analysis 11, 319–338.
Sugiyama, M. (2006). “Local Fisher discriminant analysis for supervised dimen-sionality reduction,” in Proceedings of the 23rd International Conference onMachine Learning, (ACM), 905–912.
Sugiyama, M. (2007). Dimensionality reduction of multimodal labeled data bylocal fisher discriminant analysis. J. Mach. Learn. Res. 8, 1027–1061.
Tachibana, A., Noah, J. A., Bronner, S., Ono, Y., and Onozuka, M. (2011). Parietaland temporal activity during a multimodal dance video game: an fNIRS study.Neurosci. Lett. 503, 125–130. doi: 10.1016/j.neulet.2011.08.023
Tsuchiya, N., Kawasaki, H., Oya, H., Howard, M. A., and Adolphs, R. (2008).Decoding face information in time, frequency and space from direct intracra-nial recordings of the human brain. PLoS ONE 3:e3892. doi: 10.1371/jour-nal.pone.0003892
Vlassis, N., and Likas, A. (2002). A greedy EM algorithm for Gaussian mixturelearning. Neural Process. Lett. 15, 77–87. doi: 10.1023/A:1013844811137
Wagner, S., Lucka, F., Burger, M., Grasedyck, L., Haueisen, J., and Wolters, C. H.(2012). Comparison of direct and reciprocal forward modeling approaches inEEG source analysis. Biomed. Tech. Berl. 57:310 (Suppl. 1). doi: 10.1515/bmt-2012-4069
Williams, G., Bregler, C., Hackney, P., Rosenthal, S., McDowall, I., and Smolskiy, K.(2008). Body Signature Recognition. Technical Report, TR-2008-915, New YorkUniversity.
Zhao, L. (2001). Synthesis and Acquisition of Laban Movement Analysis QualitativeParameters for Communicative Gestures. PhD diss., Philadelphia, PA: Universityof Pennsylvania, 147.
Zhao, L., and Badler, N. I. (2005). Acquiring and validating motion qualities fromlive limb gestures. Graph. Models 67, 1–16. doi: 10.1016/j.gmod.2004.08.002
Conflict of Interest Statement: The authors declare that the research was con-ducted in the absence of any commercial or financial relationships that could beconstrued as a potential conflict of interest.
Received: 30 November 2013; accepted: 14 March 2014; published online: 08 April2014.Citation: Cruz-Garza JG, Hernandez ZR, Nepaul S, Bradley KK and Contreras-VidalJL (2014) Neural decoding of expressive human movement from scalp electroen-cephalography (EEG). Front. Hum. Neurosci. 8:188. doi: 10.3389/fnhum.2014.00188This article was submitted to the journal Frontiers in Human Neuroscience.Copyright © 2014 Cruz-Garza, Hernandez, Nepaul, Bradley and Contreras-Vidal.This is an open-access article distributed under the terms of the Creative CommonsAttribution License (CC BY). The use, distribution or reproduction in other forumsis permitted, provided the original author(s) or licensor are credited and that theoriginal publication in this journal is cited, in accordance with accepted academicpractice. No use, distribution or reproduction is permitted which does not comply withthese terms.
Frontiers in Human Neuroscience www.frontiersin.org April 2014 | Volume 8 | Article 188 | 16
Copyright © 2022 FDOKUMEN