An Online Approach to the Analog Electronics Laboratory
13
Paper ID #27193 An Online Approach to the Analog Electronics Laboratory Mr. Kenneth Ray Hite, West Virginia University Kenneth Hite is a Graduate Student and Lab Manager/Instructor in the Lane Department of Computer Science and Electrical Engineering. His BS is in Electrical Engineering with a focus on Electronics. He has worked as Graduate Assistant for two Solar Decathlon competitions and several undergraduate senior design groups. He has been instructing labs and summer courses since 2012, covering much of the un- dergraduate core Electrical Engineering curriculum. The past several years he has also served as the Lab Manager, in which he works with students and administration on improving curriculum, managing equip- ment, and assisting in redesigning assessment protocols. He led the lab assessment during the last ABET review in Fall 2015. Mr. Hite is pursuing a Ph.D. degree in Electrical Engineering with a focus on the exploration of flotation-REST in the development of the Engineering Mindset in First-Year Engineering students. Dr. Louis J. Slimak, West Virginia University Dr. Louis Slimak is the director of Academic Excellence and Assessment at West Virginia University. He chairs the University Assessment Council, and works with a wide range of stakeholders to improve the institution’s academic and co-curricular programs through assessment of student learning, academic policies, and strategic planning. Prof. Dimitris Korakakis, West Virginia University Dimitris Korakakis, Professor in the Lane Department of Computer Science and Electrical Engineering has been involved with Senior Capstone projects in the department for more than 10 years. He has been the lead faculty for the Lane Experience in Applied Design, the research track of the department’s capstone project and for the Nanosystems minor established in 2010 through an NSF funded NUE. He is also the PI for the Solar Decathlon awards, in 2013, 2015 and recently 2017, from the Department of Energy, advising students from a variety of disciplines across the university and many of these student participants use their work for the Solar House as their capstone project. His research interests are in the area of optoelectronic devices, based on wide bandgap semiconductors and organic materials with an emphasis on nanostructures and nanoscale architecture. He has about 100 peer-reviewed publications. Terence C. Ahern, West Virginia University Terence C. Ahern is an Associate Professor Instructional Design and Technology at West Virginia Univer- sity and coordinates the program in Instructional Design and Technology in the Department of Learning Sciences and Human Development. His research interests are in the use of instructional technology on- line. Dr. Ahern has published extensively in the areas of distance education and social network media and games. Currently he is using his expertise in instructional design and programming to create game-based learning environments for the middle school classroom. c American Society for Engineering Education, 2019
-
Upload
khangminh22 -
Category
Documents
-
view
8 -
download
0
Transcript of An Online Approach to the Analog Electronics Laboratory

Paper ID #27193
An Online Approach to the Analog Electronics Laboratory
Mr. Kenneth Ray Hite, West Virginia University
Kenneth Hite is a Graduate Student and Lab Manager/Instructor in the Lane Department of ComputerScience and Electrical Engineering. His BS is in Electrical Engineering with a focus on Electronics. Hehas worked as Graduate Assistant for two Solar Decathlon competitions and several undergraduate seniordesign groups. He has been instructing labs and summer courses since 2012, covering much of the un-dergraduate core Electrical Engineering curriculum. The past several years he has also served as the LabManager, in which he works with students and administration on improving curriculum, managing equip-ment, and assisting in redesigning assessment protocols. He led the lab assessment during the last ABETreview in Fall 2015. Mr. Hite is pursuing a Ph.D. degree in Electrical Engineering with a focus on theexploration of flotation-REST in the development of the Engineering Mindset in First-Year Engineeringstudents.
Dr. Louis J. Slimak, West Virginia University
Dr. Louis Slimak is the director of Academic Excellence and Assessment at West Virginia University.He chairs the University Assessment Council, and works with a wide range of stakeholders to improvethe institution’s academic and co-curricular programs through assessment of student learning, academicpolicies, and strategic planning.
Prof. Dimitris Korakakis, West Virginia University
Dimitris Korakakis, Professor in the Lane Department of Computer Science and Electrical Engineeringhas been involved with Senior Capstone projects in the department for more than 10 years. He hasbeen the lead faculty for the Lane Experience in Applied Design, the research track of the department’scapstone project and for the Nanosystems minor established in 2010 through an NSF funded NUE. Heis also the PI for the Solar Decathlon awards, in 2013, 2015 and recently 2017, from the Department ofEnergy, advising students from a variety of disciplines across the university and many of these studentparticipants use their work for the Solar House as their capstone project. His research interests are inthe area of optoelectronic devices, based on wide bandgap semiconductors and organic materials with anemphasis on nanostructures and nanoscale architecture. He has about 100 peer-reviewed publications.
Terence C. Ahern, West Virginia University
Terence C. Ahern is an Associate Professor Instructional Design and Technology at West Virginia Univer-sity and coordinates the program in Instructional Design and Technology in the Department of LearningSciences and Human Development. His research interests are in the use of instructional technology on-line. Dr. Ahern has published extensively in the areas of distance education and social network media andgames. Currently he is using his expertise in instructional design and programming to create game-basedlearning environments for the middle school classroom.
c©American Society for Engineering Education, 2019

An Online Approach to the Analog Electronics Laboratory
Abstract
Demand for science, technology, engineering, and mathematics (STEM) courses continue to rise.
Given personnel and budgetary constraints, we explored an approach that provides more
individual assistance to students, while simultaneously allotting the individual student more time
to practice essential course competencies independently. In the Fall of 2016, the undergraduate
300 level Analog Electronics Laboratory at the West Virginia University Lane Department of
Computer Science and Electrical Engineering, set up one of its four sections offered in an online
fashion as a “lab in a box.” This approach is a set of hands-on exercises where students design,
build, and test circuits at home using an inexpensive all-in-one electronics kit, digital multimeter,
and a USB oscilloscope. With this “lab in a box,” the students, at their own convenience, conduct
several multi-week laboratory experiments such as basic amplifier design, LED four channel
color organs, and frequency response of circuits. Each week, students use online tools such as
discussion boards and blogs through a web-based course management system, built into the
campus Learning Management System. This method allows the Teaching Assistant to provide
feedback and allows other students to engage and work with each other to solve the problem.
Different online tools were used during different lab experiments. The students’ understanding of
the material was evaluated through the assessment of their lab reports. In this paper, we describe
the setup of the “lab in a box” method, the use of TA tools, the effects this method has had on
learning outcomes, and present qualitative student responses to this online approach to learning.
Introduction
Teaching students in the 21st Century present major challenges in which one must adapt to
overcome. The generation of students enrolled in undergraduate degrees has been raised with an
instant fulfillment mentality that is no longer met by traditional passive teaching approaches. The
students crave new strategies which encompass authentic exploration and learning, visual
stimulation and community-based practices [1].
Several pedagogical paradigms have been proposed to help better engineering education;
Constructivist, constructionist, and action-based learning theories help lay the pedagogical
foundation needed to adapt instruction in higher education to meet this need [2]. The foundation
from these theories provides instructional methods that help promote critical-thinking,
experimental inquiry and collaboration while the use of technology plays a vital role in
contributing to access and manipulation of information along with knowledge retention [3]–[5].
With the increase of current K-12 hands-on constructivist learning, students are entering STEM
degree fields expecting to learn via hands-on technology support learning [6]. This mentality
along with the increase of STEM enrollment poses a problem for current educators. Engineering
enrollment is on the rise due to an increase in emphasis on STEM exposure and STEM-related
careers. From 2007 to 2015, an average annual increase of 5.4% in bachelor’s degrees were in
engineering [7]. To increase access and to meet this growing demand, developing an online
hands-on strategy is essential. By creating such an approach, this may help relieve the amount of
space and personnel needed for such a demand.

Lab-in-a-Box
Within the world of engineering education, several constructivist models of hands-on discovery
learning have been successfully developed [8]–[10]. The University of Washington shared their
Lab-in-a-Box (LiaB) concept with Virginia Tech. In 2004, it was integrated into the curriculum
to improve student learning by allowing students to make their own observations on concrete
examples of fundamental concepts in electrical engineering [11]. The LiaB was initially used in
their first electronics course to help the students gain hands-on experience with basic DC circuits
utilizing the LiaB with homework experiments. The LiaB allowed the students to perform these
experiments without dedicated lab space and on their own time.
A 2011 approach that further developed the idea of the LiaB, the Mobile Studio, was developed
to replace traditional laboratory equipment with the use of portable technology that can be used
with a laptop anytime, anywhere. This concept has been shown to assist active learning with the
increase of real life, hands-on student experiences and paired with discovery learning helps
stimulate content acquisition, problem-solving, and transfer of information for content related to
electrical engineering and physics [12], [13].
13 Historically Black Colleges and Universities utilized the first Analog Discovery Board to
support their experimental student-centered learning. Faculty and students reported an increase in
intrinsic motivation, interest in content, and confidence in their ability to learn with 88% of
students mentioning that the Analog Discovery Board helped them learn. An increase of students
expressing interest in graduate programs and research was also noted [6].
Expanding on the LiaB and Mobile Studio concept, we wanted to investigate the feasibility of
implementing a similar structure at West Virginia University. What difficulties must be
overcome with integrating into existing infrastructure? What resources are best situated for the
use of the TA? What effects does this method have on student learning outcomes? How do
students’ respond to this approach?

WVU LiaB Setup
The setup chosen for this pilot investigation included: Digilent Analog Discovery 2 Board, BNC
Adapter Board, BNC Oscilloscope x1/x10 Probes (Pair), Shielded USB cable, and WaveForms
2015 software [14]. The Analog Discovery 2 Board is an all-in-one box that fits in the palm of
your hand and performs various functions such as measuring, validating, testing, debugging and
generating. Its multi-functional use allows students to plug the device into their computer or
laptop, and start working with a two-channel oscilloscope, two-channel arbitrary function
generator, two programmable power supply, and a single channel voltmeter. Minimal space and
money are required for this setup when compared to typical benchtop equipment. Students could
easily add the equipment in their lab kit bags due to the size and weight of the Analog Discovery
2 Board. Any components needed for experiments were stored on campus and students had
access via their student ID. The difference between the traditional laboratory setup vs the
minimal portable setup of the LiaB can be seen in Figure 1.
Figure 1: Transition from traditional setup (top) to the portable lab in a box (bottom)
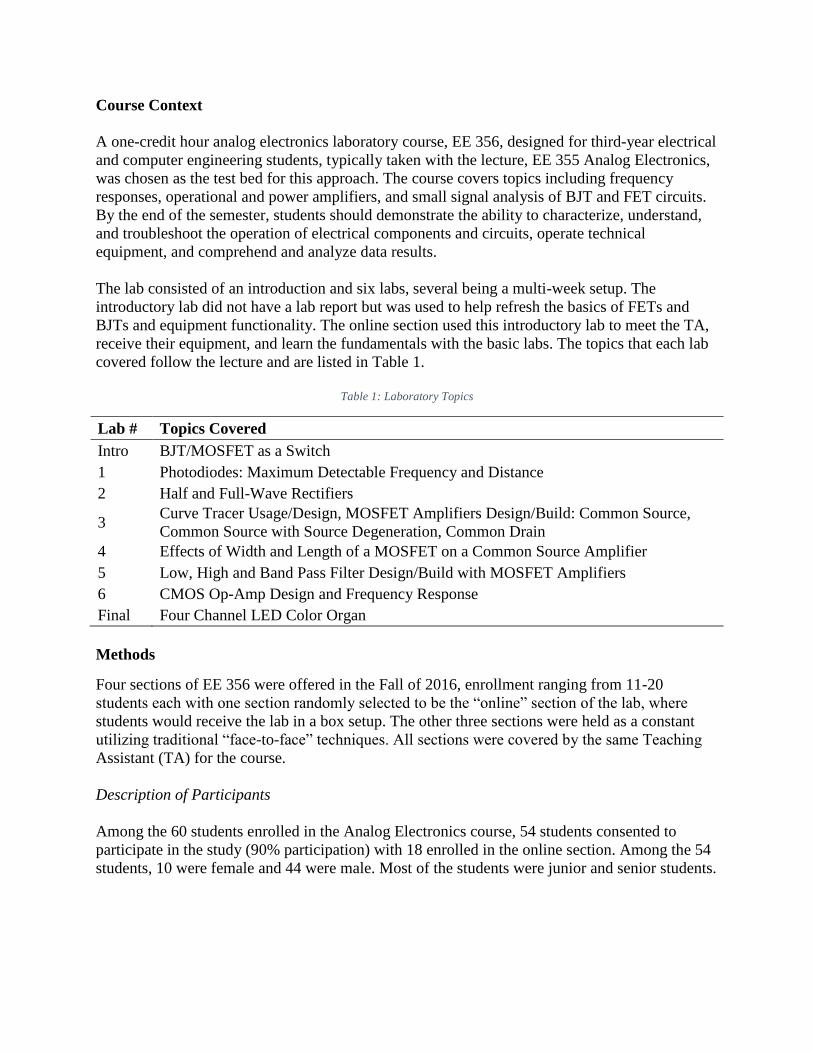
Course Context
A one-credit hour analog electronics laboratory course, EE 356, designed for third-year electrical
and computer engineering students, typically taken with the lecture, EE 355 Analog Electronics,
was chosen as the test bed for this approach. The course covers topics including frequency
responses, operational and power amplifiers, and small signal analysis of BJT and FET circuits.
By the end of the semester, students should demonstrate the ability to characterize, understand,
and troubleshoot the operation of electrical components and circuits, operate technical
equipment, and comprehend and analyze data results.
The lab consisted of an introduction and six labs, several being a multi-week setup. The
introductory lab did not have a lab report but was used to help refresh the basics of FETs and
BJTs and equipment functionality. The online section used this introductory lab to meet the TA,
receive their equipment, and learn the fundamentals with the basic labs. The topics that each lab
covered follow the lecture and are listed in Table 1.
Table 1: Laboratory Topics
Lab # Topics Covered
Intro BJT/MOSFET as a Switch
1 Photodiodes: Maximum Detectable Frequency and Distance
2 Half and Full-Wave Rectifiers
3 Curve Tracer Usage/Design, MOSFET Amplifiers Design/Build: Common Source,
Common Source with Source Degeneration, Common Drain
4 Effects of Width and Length of a MOSFET on a Common Source Amplifier
5 Low, High and Band Pass Filter Design/Build with MOSFET Amplifiers
6 CMOS Op-Amp Design and Frequency Response
Final Four Channel LED Color Organ
Methods
Four sections of EE 356 were offered in the Fall of 2016, enrollment ranging from 11-20
students each with one section randomly selected to be the “online” section of the lab, where
students would receive the lab in a box setup. The other three sections were held as a constant
utilizing traditional “face-to-face” techniques. All sections were covered by the same Teaching
Assistant (TA) for the course.
Description of Participants
Among the 60 students enrolled in the Analog Electronics course, 54 students consented to
participate in the study (90% participation) with 18 enrolled in the online section. Among the 54
students, 10 were female and 44 were male. Most of the students were junior and senior students.

Online Section Structure
In order to help normalize the approach across the University and minimize the amount of new
software/hardware the students had to learn, the current online learning management system,
eCampus, a custom version of BlackBoard Learn v.9.1, was used for document distribution,
submitting assignments and exploration of intervention strategies for the online section.
eCampus can be accessed using a laptop, desktop, or any other mobile device. This tool enables
the collaboration between students and faculty across the university within individual classes and
disciplines.
The online section was broken into two groups,
A and B, with two different intervention
strategies used to assist students. During the
face-to-face sections, each student had access to
the TA to seek help, such as asking questions
pertaining to performing the lab. Group A and
Group B rotated their TA intervention methods
every two weeks. Table 2 lays out which
interventions were used during which labs.
Students logged onto eCampus to post questions,
concerns, or comments pertaining to the lab assignments either on a discussion board or blog.
Students would create a thread through a discussion board if they encountered problems, other
students could post solutions or comments. Others that experience a similar problem would use
the thread as a reference. In the blog, some students posted their work about how they
approached the lab, asked questions, and made comments on the blog as well. The interventions
were meant for students; the TA would occasionally post a solution or comment on either
posting methods.
Table 2: Intervention Layout
Lab Online Section
Group A Group B
Intro Face to Face
1 Discussion
Board Blog
2
3 Blog
Discussion
Board 4
5
None None 6
Final
Data Collection
Lab reports were one of the main student products used in grading and assessment of the course,
a corresponding learning objective within the current infrastructure, and consequently a primary
data source for the study. The same reviewer, who was not associated with the course or
laboratory, was used in assessing the lab reports via the rubric in Appendix A.
Along with the lab reports, students were asked at the end of the semester to rank the difficulty
of each lab using a 10-point Likert scale and to turn in a one-page summary answering these
questions:
1. What did you learn in the lab?
2. Any ways to improve the lab experience?
3. Which labs were your favorite and why?
4. Which ones did you hate and why?
5. Any improvements that can be made by myself, lab equipment, lab handouts, etc.
6. Anything else you would like the TA to know?
Results
Exercise Difficulty
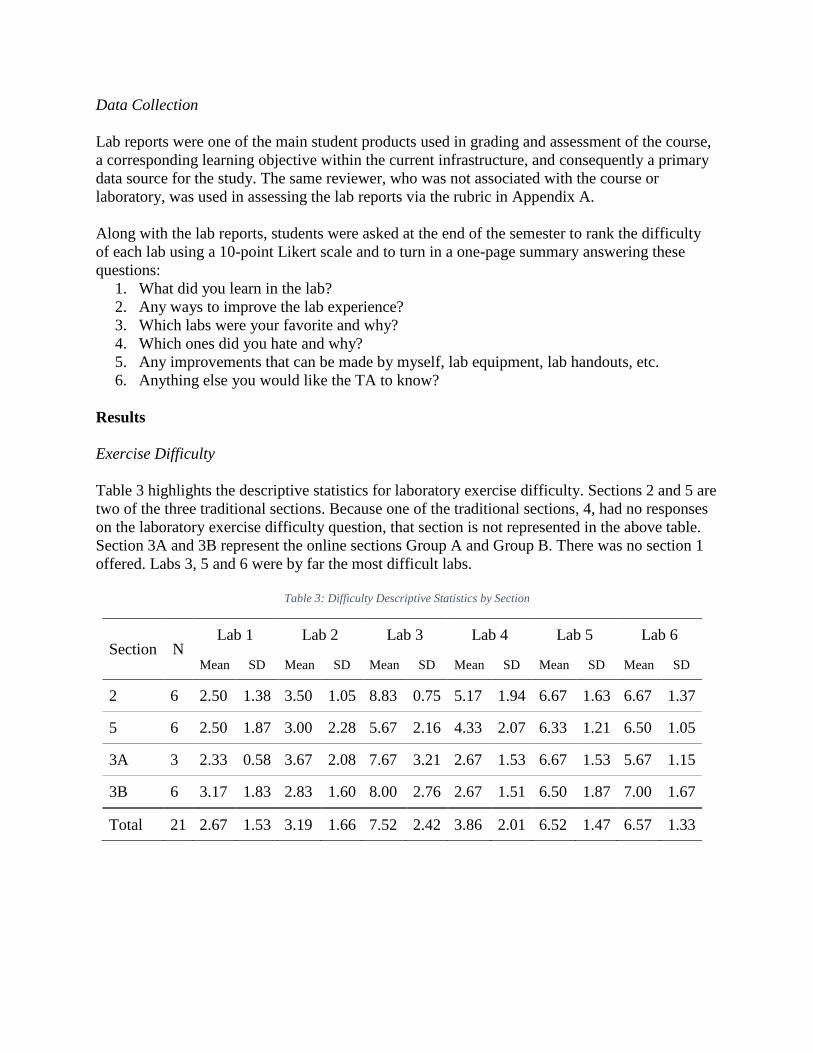
Table 3 highlights the descriptive statistics for laboratory exercise difficulty. Sections 2 and 5 are
two of the three traditional sections. Because one of the traditional sections, 4, had no responses
on the laboratory exercise difficulty question, that section is not represented in the above table.
Section 3A and 3B represent the online sections Group A and Group B. There was no section 1
offered. Labs 3, 5 and 6 were by far the most difficult labs.
Table 3: Difficulty Descriptive Statistics by Section
Section N Lab 1 Lab 2 Lab 3 Lab 4 Lab 5 Lab 6
Mean SD Mean SD Mean SD Mean SD Mean SD Mean SD
2 6 2.50 1.38 3.50 1.05 8.83 0.75 5.17 1.94 6.67 1.63 6.67 1.37
5 6 2.50 1.87 3.00 2.28 5.67 2.16 4.33 2.07 6.33 1.21 6.50 1.05
3A 3 2.33 0.58 3.67 2.08 7.67 3.21 2.67 1.53 6.67 1.53 5.67 1.15
3B 6 3.17 1.83 2.83 1.60 8.00 2.76 2.67 1.51 6.50 1.87 7.00 1.67
Total 21 2.67 1.53 3.19 1.66 7.52 2.42 3.86 2.01 6.52 1.47 6.57 1.33
Interventions Usage
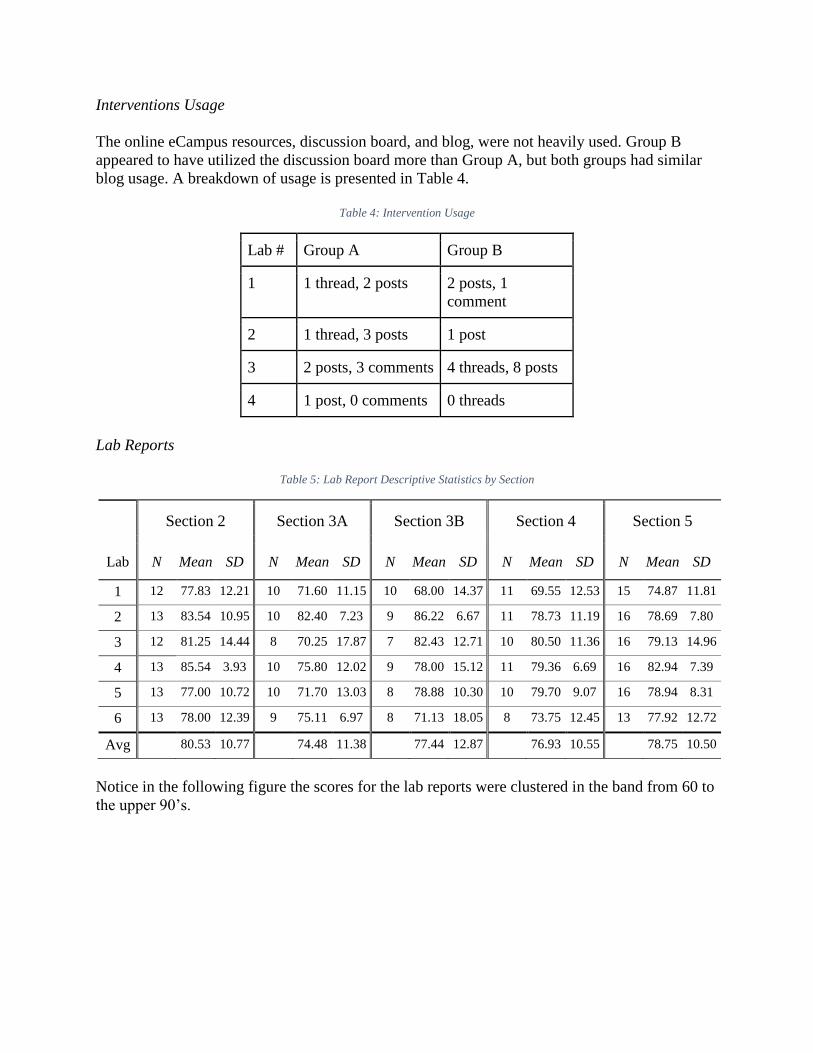
The online eCampus resources, discussion board, and blog, were not heavily used. Group B
appeared to have utilized the discussion board more than Group A, but both groups had similar
blog usage. A breakdown of usage is presented in Table 4.
Table 4: Intervention Usage
Lab # Group A Group B
1 1 thread, 2 posts 2 posts, 1
comment
2 1 thread, 3 posts 1 post
3 2 posts, 3 comments 4 threads, 8 posts
4 1 post, 0 comments 0 threads
Lab Reports
Table 5: Lab Report Descriptive Statistics by Section
Lab
Section 2 Section 3A Section 3B Section 4 Section 5
N Mean SD N Mean SD N Mean SD N Mean SD N Mean SD
1 12 77.83 12.21 10 71.60 11.15 10 68.00 14.37 11 69.55 12.53 15 74.87 11.81
2 13 83.54 10.95 10 82.40 7.23 9 86.22 6.67 11 78.73 11.19 16 78.69 7.80
3 12 81.25 14.44 8 70.25 17.87 7 82.43 12.71 10 80.50 11.36 16 79.13 14.96
4 13 85.54 3.93 10 75.80 12.02 9 78.00 15.12 11 79.36 6.69 16 82.94 7.39
5 13 77.00 10.72 10 71.70 13.03 8 78.88 10.30 10 79.70 9.07 16 78.94 8.31
6 13 78.00 12.39 9 75.11 6.97 8 71.13 18.05 8 73.75 12.45 13 77.92 12.72
Avg 80.53 10.77 74.48 11.38 77.44 12.87 76.93 10.55 78.75 10.50
Notice in the following figure the scores for the lab reports were clustered in the band from 60 to
the upper 90’s.

Figure 2: Distribution of Lab Report Scores by Lab
Regression Analysis
Multiple regression analysis was used to test if the type of available help or the difficulty of the
lab significantly predicted participants' scores. The results of the regression as shown in Table 6
and Table 7 show that the two predictors were not statically significant. Table 6: Regression Statistics
Multiple R 0.18
R Square 0.03
Adjusted R Square 0.02
Standard Error 23.06
Observations 114
Table 7: ANOVA Summary Results
df SS MS F Sig. F
Regression 2 2057.69 1028.84 1.93 0.15
Residual 111 59047.55 531.96
Total 113 61105.24
The results show that the type of help (threaded discussion, blog or none) and the difficulty of
the lab did not impact the students from completing the lab successfully. It appeared that there
seemed to be other factors, such as the type of instruction that contributed to the success of the
online sections. This bodes well for the continued development of an online approach to lab
designs.

Student Reactions
The one-page summaries showed that 93% of the responses had an overall positive experience
with the take home lab with a positive learning experience and strengthening of skillsets. This
seemed largely because most students had to spend extra time to overcome some of the
challenges with the lab setup. These challenges seemed to provide a slight hinderance to the
experience without affecting the overall experience. Of the fifteen (15) responses, some of the
common themes of hinderance were:
● Need for an optional in-person time with TA or method of instant feedback (N=10)
● Lab handout ambiguity and need for adaptation for equipment (N=6)
● Equipment struggles (N=5)
● Need for more in-depth equipment tutorials (N=3)
● Finding time outside of class to work with partners (N=2)
Discussion
The results demonstrate that the lab can be successfully completed using a totally asynchronous
online environment. The biggest issue from the students’ perspective was the lack of instant
feedback from the TA which required them to investigate the problem on their own. Some
students stated that they spent in upwards of 20+ hours some weeks to overcome the problems
faced. These comments are very intriguing as the online help provided was underutilized. It
seems students opted for no or little “instant help” from the TA and self-explore the solution
rather than utilizing the “delayed” response used with the different TA interventions explored.
Consequently, the results specify the availability of help was inconsequential to students’
performance. What was interesting is that the difficulty of the lab did not stimulate the students
to use the available help.
Reasons for the lack of use stem from the nature of the online use of the help system. The
students noted that the response was slow. They desired a more immediate response to the
question at hand. The students in the online section performed consistently even though they did
not use the available help. Notice in Table 5 and Figure 2. The most difficult labs (3, 5 & 6) had
the widest distribution of scores.
Conclusions and future work
With the students performing similarly with the different TA interventions, one of the questions
that come up is whether the lab report is an appropriate measure of the students’ lab performance
and understanding of the material. These sections may provide more insight into students’
comprehension instead of total lab report grades:
● Abstract
● Observations, Data, Findings, and Results
● Data Discussion
● Conclusion and Suggestions

Reproducing this study with a different assessment method, such as using Synopsis reports, may
be a more appropriate method to analyze the students’ effects of the LiaB method and TA
interventions [15]–[17].
One must also take into consideration all the feedback given by the students and take the
following steps before continuing with online help, specifically for WVU:
1. Rework any experiments to verify the scope of the lab is met the abilities of the LiaB
equipment.
2. Stronger introduction lab and more specific equipment tutorials
3. A solution for “instant” TA. This could range from the utilization of a Frequently Asked
Questions section or a dedicated time period in which the TA is available online via
Blackboard Collaborate.
4. Encourage students to better utilize the University’s online learning management system.
5. Consider new assessment methods for laboratory learning outcomes to better gauge the
success of future implementation.
Acknowledgment
The Analog Discovery Boards and additional supplies were supported by a grant from the West
Virginia University’s Teaching and Learning Commons along with the West Virginia University
Lane Department of Computer Science and Electrical Engineering.
We are also immensely grateful to Ms. Jessica Liu and Ms. Amy Bennett for their comments on
an earlier version of the paper, although any errors are our own and should not tarnish the
reputations of these esteemed persons.

References
[1] C. J. Brown, L. J. Hansen-brown, and R. Conte, “Engaging Millennial College-Age Science and Engineering Students Through Experiential Learning Communities,” J. Appl. Glob. Res., vol. 4, no. 10, pp. 41–58, 2011.
[2] S. S. Taylor, “Effects of studio space on teaching and learning: Preliminary findings from two case studies,” Innov. High. Educ., vol. 33, no. 4, pp. 217–228, 2009.
[3] F. N. Akhras and J. A. Self, “Modeling the process, not the product of learning,” in Computers as cognitive tools, 1999.
[4] Y. C. Cheng, “New Paradigm of Learning and Teaching in a Networked Environment,” in Handbook of Research on Literacy in Technology at the K-12 Level, 2006, pp. 1–20.
[5] D. Newman and K. Gullie, “Using constructivist methods in technology-supported learning: Evidence of student impact,” in Annual Meeting of the American Educational Research Association, 2009.
[6] K. A. Connor et al., “The Implementation of Experimental Centric Pedagogy in 13 ECE Programs - The View from Students and Instructors,” in 2016 ASEE Annual Conference & Exposition, 2016.
[7] B. L. Yoder, “Engineering by the Numbers,” 2011.
[8] K. A. Connor et al., “Collaborative research: Center for mobile hands-on STEM,” in 120th ASEE Annual Conference and Exposition, 2013.
[9] K. Meehan, M. Simoni, and A. Wong, “Hands-on learning with portable electronics,” Proc. - Front. Educ. Conf. FIE, pp. 1121–1122, 2013.
[10] B. H. Ferri, A. A. Ferri, D. M. Majerich, and A. G. Madden, “Effects of in-class hands-on laboratories in a large enrollment, multiple section blended linear circuits course,” Adv. Eng. Educ., vol. 5, no. 3, 2016.
[11] R. W. Hendricks, K. M. Lai, and J. B. Webb, “Lab-in-a-Box : Experiments in Electronic Circuits That Support Introductory Courses for Electrical and Computer Engineers,” in American Society for Engineering Education Annual Conference & Exposition, 2005.
[12] K. A. Connor et al., “Using the Mobile Studio to Facilitate Non-Traditional Approaches to Education and Outreach,” in 2011 ASEE ANNUAL CONFERENCE & EXPOSITION, 2011.
[13] D. Newman, G. Clure, M. M. Deyoe, and K. Connor, “Using technology in a studio approach to learning: a summary of a five year study of the impact of an innovative technological teaching tool on learning and cognition,” in Society for Information Technology & Teacher Education International Conference, 2012.
[14] D. Inc., “Analog Discovery 2 Pro Bundle.” [Online]. Available: https://store.digilentinc.com/analog-discovery-2-pro-bundle/.
[15] D. W. Hoffa, “Synopsis laboratory reports : effects on student learning and curricular benefits,” in American Society for Engineering Education Annual Conference & Exposition, 2008.
[16] D. W. Hoffa and S. A. Freeman, “The Impact of Laboratory Report Format on Student Learning,” Int. J. Eng. Educ., vol. 23, no. 1, pp. 105–113, 2007.
[17] T. Kunberger, “The Impact of Non-Traditional Laboratory Report Formats on Student Performance of Course Objectives,” in American Society for Engineering Education Southeast Section Conference, 2013.
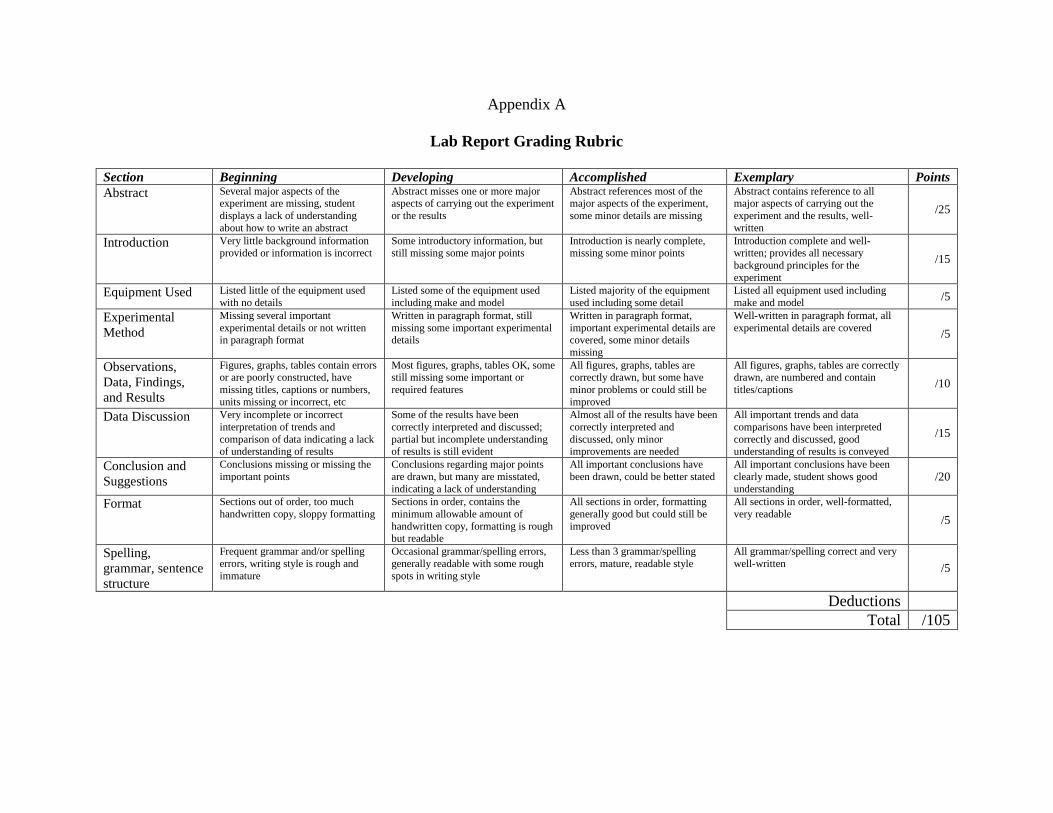
Appendix A
Lab Report Grading Rubric
Section Beginning Developing Accomplished Exemplary Points
Abstract Several major aspects of the experiment are missing, student
displays a lack of understanding
about how to write an abstract
Abstract misses one or more major aspects of carrying out the experiment
or the results
Abstract references most of the major aspects of the experiment,
some minor details are missing
Abstract contains reference to all major aspects of carrying out the
experiment and the results, well-
written
/25
Introduction Very little background information provided or information is incorrect
Some introductory information, but still missing some major points
Introduction is nearly complete, missing some minor points
Introduction complete and well-written; provides all necessary
background principles for the
experiment
/15
Equipment Used Listed little of the equipment used
with no details
Listed some of the equipment used
including make and model
Listed majority of the equipment
used including some detail
Listed all equipment used including
make and model /5
Experimental
Method
Missing several important
experimental details or not written in paragraph format
Written in paragraph format, still
missing some important experimental details
Written in paragraph format,
important experimental details are covered, some minor details
missing
Well-written in paragraph format, all
experimental details are covered /5
Observations,
Data, Findings,
and Results
Figures, graphs, tables contain errors or are poorly constructed, have
missing titles, captions or numbers,
units missing or incorrect, etc
Most figures, graphs, tables OK, some still missing some important or
required features
All figures, graphs, tables are correctly drawn, but some have
minor problems or could still be
improved
All figures, graphs, tables are correctly drawn, are numbered and contain
titles/captions /10
Data Discussion Very incomplete or incorrect
interpretation of trends and
comparison of data indicating a lack of understanding of results
Some of the results have been
correctly interpreted and discussed;
partial but incomplete understanding of results is still evident
Almost all of the results have been
correctly interpreted and
discussed, only minor improvements are needed
All important trends and data
comparisons have been interpreted
correctly and discussed, good understanding of results is conveyed
/15
Conclusion and
Suggestions
Conclusions missing or missing the
important points
Conclusions regarding major points
are drawn, but many are misstated,
indicating a lack of understanding
All important conclusions have
been drawn, could be better stated
All important conclusions have been
clearly made, student shows good
understanding /20
Format Sections out of order, too much
handwritten copy, sloppy formatting
Sections in order, contains the
minimum allowable amount of
handwritten copy, formatting is rough but readable
All sections in order, formatting
generally good but could still be
improved
All sections in order, well-formatted,
very readable /5
Spelling,
grammar, sentence
structure
Frequent grammar and/or spelling
errors, writing style is rough and
immature
Occasional grammar/spelling errors,
generally readable with some rough
spots in writing style
Less than 3 grammar/spelling
errors, mature, readable style
All grammar/spelling correct and very
well-written /5
Deductions
Total /105