An Investigation of Hydro-Geochemical Processes in Coupled ...
388
An Investigation of Hydro-Geochemical Processes in Coupled Thermal, Hydraulic, Chemical and Mechanical Behaviour of Unsaturated Soils M ajid S edighi Geoenvironmental Research Centre Cardiff School of Engineering Cardiff University Thesis submitted in candidature for the degree of Doctor of Philosophy at Cardiff University J une 2011
-
Upload
khangminh22 -
Category
Documents
-
view
5 -
download
0
Transcript of An Investigation of Hydro-Geochemical Processes in Coupled ...
An Investigation of Hydro-Geochemical Processes in Coupled Thermal, Hydraulic,
Chemical and Mechanical Behaviour of Unsaturated Soils
M a jid Se d ig h i
Geoenvironmental Research Centre Cardiff School of Engineering
Cardiff University
Thesis submitted in candidature fo r the degree o f Doctor o f Philosophy atCardiff University
J u n e 2011
UMI Number: U573143
All rights reserved
INFORMATION TO ALL USERS The quality of this reproduction is dependent upon the quality of the copy submitted.
In the unlikely event that the author did not send a complete manuscript and there are missing pages, these will be noted. Also, if material had to be removed,
a note will indicate the deletion.
Dissertation Publishing
UMI U573143Published by ProQuest LLC 2013. Copyright in the Dissertation held by the Author.
Microform Edition © ProQuest LLC.All rights reserved. This work is protected against
unauthorized copying under Title 17, United States Code.
ProQuest LLC 789 East Eisenhower Parkway
P.O. Box 1346 Ann Arbor, Ml 48106-1346

D e c l a r a t i o n
This work has not previously been accepted in substance for any degree and is not concurrently submitted in candidature for any degree.
Signed ...
D ate 24/06/2011
(Majid Sedighi)
St a t e m e n t 1
This thesis is being submitted in partial fulfillment of the requirements for the degree of Doctor o f Philosophy (PhD).
(Majid Sedighi)Signed
D ate 24/06/2011
S t a t e m e n t 2
This thesis is the result o f my own independent work/investigation, except where otherwise stated. Other sources ape acknowledged by explicit references.
Signed (Majid Sedighi)
D ate.............24/06/2Cnl..........
St a t e m e n t 3
I hereby give consent for my thesis, if accepted, to be available for photocopying and for inter-library loan, and for the title and summary to be made available to outside organisations.
Signed . (Majid Sedighi)
D ate 24/06/2011
Acknowledgments
Firstly, I would like to sincerely thank my supervisor Professor Hywel Thomas for his continued support, motivation and invaluable academic guidance throughout this research. I am extremely grateful for the opportunity he has provided me with, allowing me to realise this milestone.
I would also like to express my deepest thanks to my co-supervisor, Dr. Phillip Vardon, for his technical support and guidance during this work. For his contribution, technical comments and encouragement in the early stages of this work, I wish to sincerely acknowledge Dr. Suresh Seetharam.
The invaluable financial support o f this research through PhD fellowships from the Overseas Research Students Award Scheme (ORSAS), Cardiff School of Engineering, and the Geoenvironmental Research Centre is gratefully acknowledged.
I also owe gratitude to all my colleagues at the Geoenvironmental Research Centre and the Seren project team for their support; especially, Alex, Snehsias, Talib, Peter, Pauline (Welsh), Rao, Ram, Claire, Hesham, Matthew, Shakil and Pauline (Townsend). I would like to express my deepest thanks to Dr. Rob Francis for his understanding during the write up o f this work. I am also grateful to Dr. Roger Philp for assisting me in computer programming challenges, I have faced.
For their invaluable kindness and support during my study in the UK, I am truly thankful to Soroor and Shahab. All my friends who have been so important to finish this work deserve special thanks. I would like to thank Bahador and Foad who have helped me with computer programming challenges. I would also like to acknowledge Professors Dennis and Freda Hawkes for their invaluable friendship and motivation.
I must thank sincerely my family members for their continued support and love, specifically to dearest Mehrdad, Mitra, Saied and Amir. I am also very grateful to beloved Iri and Mr. A. Alavi for their support in the early stages o f my academic life.
I would like to especially thank my beloved mother, Mali, whose blessing, persistence and support has been always so inspiring to me. I owe her a great gratitude as without her constant love, encouragement and strong support, none of my achievements would have been possible.
Last but not least, my beloved friend and wife, Mojgan, deserves a considerable recognition for her continuing love, friendship and support. Most importantly, without her love, motivation, and understanding, none of the achievements in this work would have been possible.

SummaryThis thesis presents an investigation o f hydro-geochemical processes in the framework of coupled thermal, hydraulic, chemical and mechanical (THCM) behaviour of unsaturated soils. Based on a mechanistic approach, several theoretical aspects of the modelling of hydro-geochemical behaviour are advanced.
The hydraulic processes investigated include liquid and vapour transfer due to chemical osmosis. These are addressed via an explicit coupling with chemical variables. The chemical processes accommodate the transport of multicomponent chemicals by advection, diffusion and dispersion mechanisms, subjected to homogeneous and heterogeneous geochemical reactions. Multicomponent diffusive flow is treated with diffusion driven by chemical, electrical and thermal potentials under charge conservation conditions in multiple ionic systems.
A numerical solution based on the use of the finite element method for spatial discretisation and the finite difference method for temporal discretisation is developed to solve the governing equations for flow and deformation.
In terms o f chemical reactions, advanced geochemical features are introduced via the coupling o f the geochemical model, PHREEQC with the coupled THCM model, COMPASS. Both equilibrium and kinetically controlled geochemical reactions are considered in the reactive transport model. To couple chemical transport and reaction models, a sequential non-iterative approach is adopted. In addition, an algorithm for porosity modification from mineral precipitation/dissolution reactions has been established.
Verification o f the approach proposed has been addressed via a series o f bench mark tests. Good results have been achieved for the theoretical and numerical implementation of hydraulic and chemical behaviour in the model.
The new model is then used to investigate non-isothermal hydro-geochemical processes under the effects o f thermal diffusion. The results reveal the importance of thermal diffusion, the so called Soret effect, on the reactive transport of chemicals.
The new model has then been applied to investigate relevant hydraulic and hydrogeochemical processes in a swelling clay, via a series o f simulations o f laboratory based experiments. This is supported by the development of a new approach to investigate hydration/dehydration effects on porosity evolution and transport processes. With respect to moisture flow, the results obtained are in close agreement with experimental results from water infiltration tests. The results also indicate that the inclusion of the new hydration/dehydration model significantly improves the prediction of water transport and re-saturation time. Considering the behaviour of dissolved chemicals and the composition of minerals/exchangeable ions, the results obtained are in good agreement with experimental results, providing confidence in the ability o f the model to simulate the hydro-geochemical processes.
As the result o f this study, it is claimed that a new approach for assessing hydrogeochemical processes in unsaturated soils has been developed, which can be employed under variable THCM conditions. Based on the application o f the work to the case of a compacted swelling clay, the developed model is also shown to be an appropriate prediction model for that material.

Contents
Chapter 1 Introduction1 . 1 Introduction 1 - 2
1 . 2 Study objectives 1-4
1.3 Research background 1-51.4 Scopes and limitations 1 - 8
1.5 Overview of the thesis 1-9
1 . 6 References 1 - 1 1
Chapter 2 Literature Review2 . 1 Introduction 2 - 2
2 . 2 Physical, chemical and mechanical processes in unsaturated compacted bentonite buffer in geological disposal of HLW
2-3
2.3 Compacted bentonite (micro- and macrostructure evolution) 2-72.4 Water uptake and interaction with compacted bentonite 2 - 1 1
2.5 Physical state o f water in compacted bentonite 2-16
2 . 6 Moisture transport and microstructure in compacted bentonite 2 - 2 0
2.7 Chemical diffusion in compacted bentonite 2 - 2 2
2 . 8 Diffusion under non-isothermal conditions 2-26
2.9 Experimental studies on the coupled thermal, hydraulic, chemical and mechanical behaviour of compacted bentonite
2-28
2 . 1 0 Computational studies on the coupled thermal, hydraulic, chemical and mechanical behaviour of compacted bentonite
2-33
2 . 1 1 Computational schemes and developments in modelling o f the reactive transport o f multicomponent chemicals
2-38
2 . 1 2 Conclusions 2-43
2.13 References 2-46
Chapter 3 Theoretical Formulation3.1 Introduction 3-2
3.2 Theoretical formulation-General aspects 3-3
3.3 Moisture flow 3-4
3.3.1 Mechanisms o f liquid water flow 3-6
3.3.2 Mechanisms o f water vapour flow 3-12
i

3.3.3 Governing differential equation for moisture flow 3-18
3.4 Dry air transfer 3-23
3.5 Heat transfer 3-27
3.6 Reactive transport o f multicomponent chemicals 3-33
3.6.1 Transport processes and mechanisms 3-34
3.6 .1.1 Advection 3-35
3.6 .1.2 Diffusion 3-35
3.6.1.3 Dispersion 3-43
3.6.2 Geochemical reactions 3-44
3.6.3 Implementation o f mass and charge conservation laws 3-47
3.6.4 Governing equations for chemical reactive transport 3-49
3.7 Deformation behaviour 3-53
3.7.1 Constitutive elastic relationship 3-54
3.7.2 Yield function 3-55
3.7.3 Flow rule 3-56
3.7.4 Hardening law 3-57
3.7.5 Governing equation for deformation 3-58
3.8 Summary 3-60
3.9 References 3-62
Chapter 4 Numerical Formulation4.1 Introduction 4-2
4.2 Spatial discretisation 4-3
4.2.1 Spatial discretisation for chemical flows 4-3
4.2.2 Spatial discretisation for moisture, heat and air transfer- 4-7deformation
4.3 Temporal discritisation 4-10
4.4 Coupling between the transport and chemical reaction model 4-13
4.5 Summary 4-17
4.6 References 4-18
Chapter 5 Verification and Validation
5.1 Introduction 5-2
5.2 Osmotic potential effects on moisture transport 5-5
5.2.1 Osmotic potential under saturated conditions (Test I) 5-5

5.2.1.1 Introduction 5-5
5.2.1.2 Numerical model conditions 5-5
5.2.1.3 Results and discussion 5-6
5.2.2 Osmosis potential under unsaturated condition (Test II) 5-8
5.2.2.1 Introduction 5-8
5.2.2.2 Numerical model conditions 5-9
5.2.2.3 Results and discussion 5-10
5.3 Verification o f Multicomponent Chemicals Transport 5-14
5.3.1 Diffusion o f binary electrolyte solutions under 5-14electrochemical potential (Test III)
5.3.1.1 Introduction 5-14
5.3.1.2 Numerical model conditions 5-16
5.3.1.3 Results and discussion 5-17
5.3.2 Diffusion o f multiple ions in electrolyte solution under 5-19electrochemical potential (Test IV)
5.3.2.1 Introduction 5-19
5.3.2.2 Numerical model conditions 5-19
5.3.2.3 Results and discussion 5-20
5.3.3 Diffusion o f multi-ionic components due to thermal 5-24gradients-coupled electrochemical and thermal diffusion(Test V)
5.3.3.1 Introduction 5-24
5.3.3.2 Numerical model conditions 5-24
5.3.3.3 Results and discussion 5-26
5.4 Reactive transport o f multicomponent chemicals: verification 5-31of the coupling o f the COMPASS and PHREEQC models
5.4.1 Chemical Transport with mineral precipitation/dissolution 5-31reaction (Test VI)
5.4.1.1 Introduction 5-31
5.4.1.2 Numerical model conditions 5-32
5.4.1.3 Analytical solution under equilibrium condition 5-33
5.4.1.4 Analytical solution under kinetically controlled steady-state 5-34 condition
5.4.1.5 Results and discussion 5-36
5.4.2 Chemical Transport with multiple Precipitation/Dissolution 5-39 Front (Test VII)
5.4.2.1 Introduction 5-39
iii

5A.2.2 Numerical model conditions 5-39
5.4.2.3 Results and discussion 5-40
5.4.3 Chemical Transport with Multiple Ion Exchange (Test VIII) 5-42
5.4.3.1 Introduction 5-42
5.4.3.2 Numerical model conditions 5-43
5.4.3.3 Results and discussion 5-44
5.5 Modelling feed-back o f mineral precipitation/dissolution 5-46reactions on flow process
5.5.1 Chemical Diffusion with mineral precipitation/dissolution 5-46reaction with flow modification feed back (Test IX)
5.5.1.1 Introduction 5-46
5.5.1.2 Numerical model conditions 5-46
5.5.1.3 Results and discussion 5-48
5.6 Conclusions 5-50
5.7 References 5-53
Chapter 6 Simulation of the Reactive Transport of Chemicals under Coupled THC Conditions
6.1 Introduction 6-2
6.2 Model domain and conditions 6-3
6.3 Material parameters and relationships 6-4
6.4 Numerical simulation results 6-9
6.4.1 Temperature and moisture distribution 6-9
6.4.2 Dissolved chemicals and mineral distribution 6-10
6 .4 .2.1 Analysis results with k =1 for both anionic and cationic 6-10component
6.4.2.2 Analysis results with k equal to 0.1 for anionic and equal to 6-141 . 0 for cationic component
6.5 Conclusions 6-19
6.5 References 6-20
Chapter 7 Transport Processes in Compacted Swelling Clays- Microstructural Effects
7.1 Introduction 7-2
7.2 A geochemical solid-solution model for the 7-4hydration/dehydration o f smectite
7.3 Suction and temperature dependency o f the 7-9hydration/dehydration model

7.4 Evaluation o f the interlayer water content in compacted 7-11smectite clays
7.5 Application and adaptation o f the model for compacted Na- 7-14 smectite clay
7.5.1 Interlayer porosity o f saturated compacted Na-smectite 7-14
7.5.2 Application and Adaptation o f the solid solution model for 7-18 compacted MX-80 bentonite
7.5.3 Interlayer water variations with suction and temperature for 7-25 compacted MX-80
7.6 Proposed approach for representing the interlayer water effects 7-29 on water transport model (an example application o f themodel)
7.6.1 Background o f the hypothesis 7-29
7.6.2 Modified hydraulic conductivity relationship 7-31
7.7 Simulation o f isothermal and non-isothermal transfer o f 7-34moisture in compacted smectite clay (FEBEX bentonite)
7.7.1 Model domain and time-step 7-36
7.7.2 Material parameters 7-36
7.7.3 Initial and boundary conditions 7-39
7.7.4 Simulation results o f the isothermal infiltration test 7-41
7.7.5 Simulation results o f the non-isothermal infiltration test 7-43
7.8 Conclusions 7-45
7.9 References 7-48
Chapter 8 Numerical Simulation of the Coupled Thermal, Hydraulic and Chemical Behaviour Compacted Bentonite
8.1 Introduction 8-2
8.2 FEBEX bentonite and the pore water chemistry 8-4
8.3 Hydro-geochemical results o f the heating and hydration 8-10experiments
8.3.1 Experimental methodologies o f post-mortem analyses 8-10
8.3.2 Experimental results o f post-mortem analyses 8-11
8.4 Numerical simulation o f the heating/hydration test 8-15
8.4.1 Model domain and time-step 8-15
8.4.2 Material parameters and relationships for modelling o f 8-17thermal and hydraulic processes
8.4.3 Material parameters and relationships for modelling of the 8-20reactive transport o f chemicals
v

8.4.4 Initial and boundary conditions 8-23
8.5 Simulation results 8-27
8.5.1 Temperature distribution 8-27
8.5.2 Moisture distribution 8-28
8.5.3 Geochemistry and pore fluid composition 8-30
8.5.3.1 Chloride (Cl ) distribution (In-place analysis results) 8-30
8 .5.3.2 Chloride (Cl ) distribution (Post-mortem simulation results) 8-31
8 .5.3.3 Sulfate (SO4 2 ) distribution (In-place analysis results) 8-33
8 .5.3.4 Sulfate (SO4 2 ) distribution (Post-mortem simulation 8-36results)
8 .5.3.5 Bicarbonate (HCO3 ) distribution (In-place analysis results) 8-37
8.5.3.6 Bicarbonate (HCO3 ) distribution (Post-mortem simulation 8-38results)
8 .5.3.7 Sodium (Na+) distribution (In-place analysis results) 8-40
8 .5.3. 8 Sodium (Na+) distribution (Post-mortem simulation results) 8-419 +
8 .5.3.9 Calcium (Ca ) distribution (In-place analysis results) 8-429 4 -8.5.3.10 Calcium (Ca ) distribution (Post-mortem simulation 8-43
results)9 .
8.5.3.11 Magnesium (Mg ) distribution (In-place analysis results) 8-44
8.5.3.12 Magnesium (Mg2+) distribution (Post-mortem simulation 8-45results)
8.5.3.13 Potassium (K+) distribution (In-place analysis results) 8-47
8.5.3.14 Potassium (K+) distribution (Post-mortem simulation 8-48results)
8.5.3.15 Pore water pH (In-place analysis results) 8-49
8.5.3.16 Pore water pH (Post-mortem simulation results) 8-50
8.5.3.17 Exchangeable ions distribution (In-place analysis results) 8-52
8.5.3.18 Exchangeable ions distribution (Post-mortem simulation 8-55results)
8 . 6 Conclusions 8-59
8.7 References 8-63
Chapter 9 Conclusions and Suggestions for Further Research9.1 Conclusions 9-2
9.1.1 Theoretical and numerical formulation 9-2
9.1.2 Verification and validation o f the numerical model 9-4
9.1.3 Reactive transport under coupled THC conditions 9-5
vi
9.1.4 Transport Processes in compacted bentonite and 9-6 microstructure evolution
9.1.5 Simulation o f a heating and hydration experiment of a 9-8 compacted bentonite
9.1.6 Overall conclusions 9-10
9.2 Suggestions for further research 9-12
vi i

Nomenclature
aas Defined in equation (7.2)
Defined in equation (7.3)
aH}0 Activity o f water
aM Defined in equation (4.22)
a' Defined in equation (3.17)
A p Defined in equation (3.213)
As Defined in equation (3.195)
As‘nt Internal specific surface area
Ar Defined in equation (3.196)
A Constant value, defined in equation (3.150)
A Temperature dependent parameter
Ai, A2 Defined in equation (6.1)
A Defined in equation (4.62)
b Body force vector
B Defined in equation (3.49)
B Defined in equation (4.62)
b’ Defined in equation (3.17)
Cd Dissolved concentration o f chemical component ith
c ’d Approximate value o f dissolved concentration of chemical component
Defined in equation (3.92)
CaCd Defined in equation (3.93)
Cal Defined in equation (3.90)
CaT Defined in equation (3.91)
Cm Defined in equation (3.94)
CCda Defined in equation (3.172) and (3.184)
CCd, Defined in equation (3.170) and (3.182)
CCjC.d Defined in equation (3.173) and (3.185)
Cc u Defined in equation (3.175) and (3.187)

C«,r Defined in equation (3.171) and (3.183)
CV Defined in equation (3.174) and (3.186)
Q , Defined in equation (3.69)
C", Defined in equation (3.70)
C„ Defined in equation (3.67)
c IT Defined in equation (3.68)
C* Defined in equation (3.71)
^ pd a Specific heat capacity o f dry air
C« Specific heat capacity o f liquid
C* Specific heat capacity o f soil solids
c r Specific heat capacity o f vapour
Cn Defined in equation (3.119)
Ctc, Defined in equation (3.120)
r71 Defined in equation (3.117)
rI T Defined in equation (3.118)
Cu Defined in equation (3.121)
c m Defined in equation (3.220)
c* Defined in equation (3.218)
CuT Defined in equation (3.219)
C„u Defined in equation (3.221)
ci Nodal value o f i,h chemical component
c Defined in equation (4.62)
CM Defined in equation (4.48)
C . c dDefined in equation (4.49)
C„ Defined in equation (4.46)
C.T Defined in equation (4.47)
C,u Defined in equation (4.50)
Cc Defined in equation (4.12)
C cdTDefined in equation (4.13)
C c daDefined in equation (4.14)
C0-, Defined in equation (4.15)
ix

Defined n equation 4.16)
Defined n equation 4.26)
Defined n equation 4.27)
Defined n equation 4.24)
Defined n equation 4.25)
Defined n equation 4.28)
Defined n equation 4.37)
Defined n equation 4.38)
Defined n equation 4.35)
Defined n equation 4.36)
Defined n equation 4.39)
Defined n equation 4.59)
Defined n equation 4.57)
Defined n equation 4.58)
Defined n equation 4.60)
Defined n equation 7.27)
Defined n equation 7.27)
Defined n equation 5.27)
Defined n equation 7.26)
Defined n equation 8.1)
Molecular diffusivity of vapour in air
Tracer diffusion coefficient o f the i* component in water
Defined in equation (8.5)
Defined in equation (3.145)
Defined in equation (3.146)
Coefficient o f mechanical dispersion
Stiffness matrix
Elasto-plastic matrix
void ratio
Initial void ratio
Young’s modulus
Sink or Source
Flow area factor in vapour flux

Total moisture flux Total heat flux
Clay fraction is soilVolume fraction of the interlayer water in compacted smectite
The approximate chemical solute flux normal to the boundary
Applied Force
Faraday constant
Yield function as defined in equation (3.209)
Yield function as defined in equation (3.210)
Defined in equation (4.55)
Defined in equation (4.21)
Defined in equation (4.33)
Defined in equation (4.44)
Defined in equation (4.61)
Gravitational constant Defined in equation (7.28)Defined in equation (7.28)Defined in equation (3.50)
Shear modulus Specific weight
Relative humidity
Relative humidity due to matric potential
Relative humidity due to osmotic potential
Heat capacity of the soil
Henry’s volumetric coefficient of solubility
Iteration level Ionic strength
Defined in equation (3.99)
Advective flux of ith chemical component
Defined in equation (3.179)
Diffusive flux of i,h chemical component
Dispersive flux of i* chemical component
Defined in equation (3.76)
JT Defined in equation (3.126)
Ji Total flux of i* chemical component
K Unsaturated hydraulic conductivity
ksat Saturated hydraulic conductivity
K Unsaturated conductivity of air
K» ‘at rest’ stress state* Kinetic rate constantK Bulk modulus
Defined in equation (3.97)
Defined in equation (3.98)
K , Defined in equation (3.95)
KaT Defined in equation (3.96)
Defined in equation (3.176)
K'S Defined in equation (3.177)
Ku Defined in equation (3.178)
K«! Equilibrium constant of chemical rea
K, Intrinsic hydraulic conductivity
Ku, Defined in equation (3.74)
Defined in equation (3.75)
K„ Defined in equation (3.72)
Krr Defined in equation (3.73)
K* Defined in equation (3.124)
Kn. Defined in equation (3.125)
Defined in equation (3.122)
Kn Defined in equation (3.123)
k m Defined in equation (4.53)
Defined in equation (4.51)
K.c. Defined in equation (4.54)
K .t Defined in equation (4.52)
K«,. Defined in equation (4.17)
K c-T Defined in equation (4.18)
K«.. Defined in equation (4.19)
xii

K<* Defined in equation (4.20)
Kta Defined in equation (4.31)
Defined in equation (4.32)
K„ Defined in equation (4.29)
Krr Defined in equation (4.30)
Kt. Defined in equation (4.42)
Ktc, Defined in equation (4.43)
K„ Defined in equation (4.40)
Krr Defined in equation (4.41)
L Latent heat of vapourisation
L Defined in equation (4.70)
u Phenomenological transport coefficient due to electrochemical potential for the i* chemical component
Ljq Phenomenological coefficient of thermally induced chemical diffusion for the i* chemical component
Mil Defined in equation (7.28)m as Number of moles of anhydrous smectitem hs Number of moles of hydrous smectite
msm Molar mass of dry smectite
\A smdry Total mass of dry smectite
M Molecular weight of water
Ms Molecular weight of smectiteM Slope of the critical state linem Unit vector
Tm Differential operator, defined in equation (3.191)n Porosity
n0 Saturate available porosityn Direction cosine normal to the surface
niL Interlayer porosity, Defined in equation (7.24)nc Total number of chemical componentsnc Mole number of interlayer hydrate water
nDDi. Porosity associated with developed diffusion layer
neff Effective porosity for diffusion of ionic species
K . N , Shape functions
N Shape function matrix
Palms Atmospheric pressure
xiii

pc Reference stress
p °H j0 Partial pressure of water in a pure solution
p Hp Partial pressure of water in soil
p s Parameter controlling suction effect on cohesion
p 0 Critical Pre-consolidation stress
pi Saturated pre-consolidation stress
P Strain matrixq Deviatoric stress
q Number of occupied octahedral sites per mole of the mineralQ Heat flux
Q* Heat of transport of i**1 chemical component
Qf° Heat of transport of i* chemical component in a dilute solution
Qt Defined in equation (3.2 0 1 )
Q Defined in equation (3.202)
r Defined in equation (3.200)Defined in equation (5.12)
R Defined in equation (4.71)R Interlayer cationsR Universal gas constantRn Residual error introduced due to approximation
Rto Specific gas constant for dry air
Rv Specific gas constant for water vapour
RH Relative humiditys matric suctionSj Geochemical sink/source term for i**1 chemical component
S r Suction at reference temperature (Tr)
Sq Critical value of suction - suction hardening parameter
ST The Soret coefficientSa Degree of saturation of pore air
St Degree of saturation of pore water
S/o Residual degree of saturationSf Percolation threshold for degree of saturation
Sirmax Maximum degree of saturationSn Initial degree of saturation of pore-liquid
t Time
xiv
T TemperatureTr Reference temperature
A
T Approximate value of temperature
(vrX/vr Microscopic pore temperature gradient factor
T, Nodal value of temperature
TLaA, Matrix of absolute tolerances
TL Matrix of percentage tolerances
Ua Pore-air pressure
Ufa Partial pressure of dry air
Uj Pore-water pressure
Uy Partial pressure of water vapour in pore space
ua Approximate value of pore-air pressure
u, Approximate value of pore-water pressure
u Approximate value of displacement
u Displacement vector
u#j Nodal value of pore-air pressure
uls Nodal value of pore-water pressure
u, Nodal value of displacement
v specific volume
|v| Absolute average velocity of advection flow
vv Mass flow factor
Vi Pore velocity
V/L Defined in equation (7.14)
Vm Defined in Table (5.8)
Vt Total volume of the dry smectite
Vs Volume of Solids
va Velocity of air
v, Velocity of liquid water
v v Velocity of water vapour
w Water contentWs Margules parameter for a binary regular solid solution of hydrous and
anhydrous smectite componentsx0 Defined in equation (8 .1)
xv

X* Mole fraction of anhydrous smectite
X hs Mole fraction of hydrous smectite
xsm Mass fraction of smectite in clay
x, y, z Global coordinates
z Elevation from the reference level
Zi Charge of i* chemical componet
a Power number
<*L Longitudinal dispersivity parameter
a Parameter for non-associated flow rule, defined in equation (3.203)
a T Transversal dispersivity parameter
a T Coefficient of thermal expansion
Po Defined in equation (5.26)
A C\ Standard change of heat capacity of the reaction at constant pressure
AG° Standard change of Gibbs free energy of the chemical reactionAHr° Standard change in enthalpy of the chemical reaction
r, Activity coefficient of the i* chemical component
Yi Unit weight of liquid
X v X i Fluidity parameters controlling the plastic flow rate (plastic multipliers)
5 Constrictivity coefficient
h Kronecker’s delta function
d Differential
SV Incremental volume
£ Total strain
s e Elastic component of strain
S P Plastic component of strain
< Plastic strain increments due to stress and suction changes
Plastic deviatoric strain
Elastic component of strain due to stress changes
< Elastic component of strain due to suction changes
£ eT Elastic component of strain due to temperature changes
Volumetric strain
£ P Total volumetric plastic strain
xvi
Volumetric plastic strain due to stress changes
Volumetric plastic strain due to suction changes
Elastic component of strain due to stress changes
Viscosity of solvent
Material dependent factor for vapour flux
Material dependent factor for vapour flux
Stiffness parameter for changes in net mean stress in the elastic region
Defined in equation (6.6)
Stiffness parameter for changes in suction in the elastic region
Defined in equation (5.28)
Thermal conductivity of pore air
Activity coefficient of anhydrous smectite
Activity coefficient of hydrous smectite
Thermal conductivity of pore liquid
Thermal conductivity of soil
Thermal conductivity of pore vapour
Stiffness parameter for changes in net mean stress for saturated soil
Stiffness parameter for changes in net mean stress for virgin states of the soil
Viscosity of air
Chemical potential of i* chemical component
Chemical potential of i**1 chemical component at reference state
Absolute viscosity of liquid
Volumetric water content
Volumetric air content
Volumetric liquid content
Volumetric content of the interlayer water
Defined in Table 5.2
Defined in Table 5.2
Volumetric vapour content

Surface energy (tension) at temperature T
I Surface energy (tension) at reference temperature Tr
^2-layer Defined in equation (7.27)
Po Density of saturated water vapour
Pd Bulk dry density of the clay
Pda Density of dry air_ smPd Partial bulk dry density of smectite
Pi Density of liquid water
Ps Density of non-smectite minerals or impurities
P, Density of soil solids
Pv Density of water vapour
a Specific surface areaO Total stress
o ' Net stressX Tortuosity factor in chemical diffsuion flux
Tortuosity factor in vapour flux
V Poisson’s ratioUii Molar volume of interlayer waterUy, Molar volume of water
Wabs Defined in equation (7.32)(0X Osmotic efficiency coefficient
CO Defined in equation (4.1)
Q) Defined in equation (4.1)
¥ Defined in equation (5.16)
¥ Total water potential
¥ m Matric potential
Gravitational potential
¥ n Osmotic potential
V Gradient operator
re Element boundary surface3 Defined in equation (4.64)
0 Defines the type of integrating scheme, defined in equation (4.63)Q Heat content of soil per unit volumene Element domain
xvii i

<j> Variable vector, defined in equation (4.64)
G> Electrical potential of the solution<D Defined in equation (7.8)
^ Defined in equation (4.69)
xix

Chapter 1______________________________________________________________________________ Introduction
Chapter 1
Introduction
1-1

Chapter 1 Introduction
1.1 Introduction
Geoenvironmental engineering faces serious challenges with the management of ground and
water contamination, waste disposal, energy demand and greenhouse gas emissions due to
anthropogenic activities and their consequences (Thomas, 2006). In fact, sustainability of the
geoenvironment is highly affected by the continued depletion of non-renewable natural
resources and imposing physical, chemical and biological impacts to the geoenvironment
from the various anthropogenic stress generators, representing an increasing threat to the
subsurface environmental quality and the public health (Yong et al., 2006). Hence, there is a
pressing need to develop a better appreciation o f the anthropogenic stresses imposed on the
geoenvironment and to improve the knowledge and technology for appropriate management
of our geoenvironmental resources (Yong et al., 2006).
Understanding hydro-geochemical processes in subsurface soil and groundwater is essential
in order to approach the sustainable engineering solutions for the management of the
environmental contaminants. The investigation o f the various anthropogenically-induced
contaminations in subsurface soil and groundwater, such as the accidental release of
contaminants, disposal o f hazardous wastes, agricultural and soil management practices may
involve complex transport and geochemical reactions in the soil-water-chemical system,
usually defined as reactive transport o f chemicals. This area of research can also include the
irreversible changes to the properties o f soil material induced by chemical reactions (Yaron et
al., 2008) and requires advanced understanding o f the hydro-geochemistry and interactions in
the soil-water-chemical system.
Modelling of the reactive transport o f chemicals inherit all o f the difficulties associated with
the individual disciplines o f hydro-chemical transport and geochemistry which can involve
multiple chemicals, reaction heterogeneities and various time-scales. In many
geoenvironmental challenges, hydro-geochemical processes are also coupled with physical,
chemical and mechanical behaviour. The study o f the reactive transport of chemicals under
coupled physical, chemical and mechanical problems has been the interest of many studies
and evolved with developments in various disciplines due to the various challenges, e.g.
ground contaminants, energy demand, anthropogenic atmospheric carbon dioxide and global
warming (e.g. Stephansson et al., 2004; Thomas, 2006; Datta et al., 2010). The degree of
1-2

Chapter 1 Introduction
complexity due to the coupling phenomena between physical, chemical and mechanical
behaviour depends on the geo-material and the conditions related to the engineering case.
The developments in numerical modelling capabilities for simulating hydro-geochemical
processes under coupled behaviour and conditions are among the most important steps
forward in the assessment and prediction o f geoenvironmental solutions. Such models provide
an integrating focus for the wide range o f geo-engineering disciplines and represent the basic
physical, chemical and mechanical processes which can include the effects o f heat, water,
chemistry and mechanics. It is well accepted that numerical simulation can be used to
illustrate technical understanding, via development o f conceptual models and validation with
experimental data. Numerical simulation can then be used to test various scenarios at a
fraction of real cost and predict future behaviour. Computer modelling is also non-destructive;
data can be easily produced at all locations and can be produced in reduced time periods
compared to experimentation. However, it is critical that models and processes are correctly
understood and used only in relevant circumstances; otherwise important processes may be
omitted from simulations which can yield to incorrect interpretation.
The overall aim of this research is to advance the numerical simulation of hydro- geochemical
processes in unsaturated soils under coupled thermal, hydraulic, chemical and mechanical
modelling framework. The research also aims to develop the theoretical understanding and
include advances in the experimental knowledge o f the hydraulic and chemical/geochemical
behaviour in the coupled numerical modelling platform. The specific emphasis is on the
developments to the hydraulic and chemical reactive transport processes in compacted
swelling clays (smectite clays) under coupled THCM behaviour.
The developed coupled numerical model would be o f particular interest in simulation of the
coupled physical and chemical behaviour o f compacted swelling clays (bentonite) as
proposed for the buffer material in geological containment of high level radioactive waste.
Engineered Barrier Systems are likely to be subject to thermal, hydraulic, chemical and
biogeochemical processes, such as heat release due to radionuclide decay, multiphase flow,
swelling of buffer material, radionuclide diffusive transport, waste dissolution and chemical
reactions. Hence, the performance assessment o f the compacted clay buffer, as a component
of the Engineered Barriers System (EBS), includes analysing complex interacting and coupled
thermal, hydraulic, chemical/geochemical and mechanical processes (Yong et al., 2010). In
1-3
Chapter 1 Introduction
addition, the properties and characteristics o f compacted bentonite, i.e. smectite dominated
clay, are highly affected by the microstructure of the swelling minerals constituents which in
fact, control the transport properties o f water and chemicals in the system (Pusch and Yong,
2006).
Understanding the highly complex hydro-geochemical behaviour of compacted clay buffer in
high level radioactive waste (HLW) repository is a challenging problem and requires
advanced conceptual and theoretical models, comprising multiphase, multicomponent
processes and the multilevel structural material effects. In particular, studies related to the
smectite mineral hydration and the long-term chemical and mechanical stability o f the barrier
are among the key issues in the long-term performance of multiple barrier HLW repositories.
There are still essential research and development required for modelling the coupled
processes in compacted swelling clays as the buffer candidate. Inclusion o f processes such as
bentonite hydration mechanism, microstructure evolution, existence o f different states of
water in the bentonite, existence of a threshold hydraulic gradient for water flow and thermo
osmosis has been suggested in conventional formulation of THM models (Steefel et al.,
2010). In terms o f chemical/geochemical and biological processes, the models need still more
development to reach the stage of sophistication to be coupled with THM platforms (Pusch,
2008). Further integration o f C and THM models and processes for simulating coupled
THMC processes has been also suggested as a critical research and developments required in
this field ( Steefel et al., 2010).
The study objectives o f the thesis are presented in section 1.2. In section 1.3 the background
of the research is presented. The scopes o f the work and limitations are discussed in section
1.4. Finally an overview o f the structure o f the thesis and the chapters is given in section 1.5.
1.2 Study objectives
Within the development o f the numerical simulation o f the coupled thermo-hydro-chemo-
mechanical behaviour o f unsaturated soils, the research presented in this thesis focuses, on the
advanced modelling of the moisture flow and the reactive transport of chemicals. In
1-4

Chapter 1 Introduction
particular, the hydro-geochemical behaviour o f compacted bentonite suggested as the buffer
in geological disposal o f HLW is studied as an application cased of the developed model.
The main objectives o f this study are to:
i) Develop a theoretical framework for the transport of multiple chemicals under
variable saturated and non-isothermal conditions and the key coupling effects
between chemical/geochemical processes (C) and THM processes.
ii) Integrate an advanced geochemical model into the coupled THCM numerical
model to calculate the chemical reaction under both equilibrium and kinetically
controlled conditions.
iii) Include the impacts o f microstructure evolution of compacted swelling clays, in
particular, smectite rich clays, in the modelling the transport processes.
iv) Investigate the hydro-geochemical behaviour of compacted swelling clays under
coupled THC effects and compare with experimental results.
1.3 Research background
This work is undertaken at the Geoenvironmental Research Centre at Cardiff University
where considerable research, including the development of the numerical computer code
COMPASS (COde for Modelling PArtially Saturated Soils), has been performed prior to the
study. This section provides the context to this work, and is not intended to replace more
detailed reviews o f literature in chapter 2 or the theoretical formulation in chapter 3.
A theoretical model o f coupled transient heat and moisture transfer in unsaturated soil was
developed by Thomas (1985). In this model the vapour flow was modelled by incorporating
the diffusive flow proposed by Philip and de Vries (1957) and de Vries (1958), and the latent
heat of vaporisation was also introduced following Luikov (1966). The principle of mass
conservation was employed for moisture flow and the conservation of energy used for heat
transfer. Non-linearity of material parameters was then incorporated in the works presented by
Thomas (1987), Thomas, (1988a) and Thomas, (1988b). Revised time-stepping schemes were
1-5

Chapter 1 Introduction
investigated under the mentioned coupled TH model by Thomas and Rees (1988) and Thomas
and Rees (1990).
Following an experimental investigation into the behaviour of unsaturated sand surrounding a
heating rod, Ewen and Thomas (1987) and Ewen and Thomas (1989) amended the vapour
transfer diffusivities o f the numerical model to simulate coupled heat and moisture transfer
processes in unsaturated soil. A numerical simulation in terms of moisture content and
temperature was carried out by Ewen and Thomas (1989) including vapour transport via a
diffusive mechanism. Thomas and King (1991) presented a theoretical heat and moisture
formulation cast in terms o f capillary potential and temperature and found good agreement
with the Ewen and Thomas (1987) experiments. Thomas and Sansom (1995) extended this
formulation to include elevated pore-air pressures and validated via comparison to
experimental works on sand and clay. This formulation was presented in three-dimensions
including work on pre and post-processing, visualisation and parallel computation by Sloper
(1997) and Thomas et al. (1998).
Mechanical behaviour and deformation was introduced examining seasonal ground
movements by Thomas and Rees (1990; 1993), with an isothermal coupled hydro-mechanical
numerical model presented by Thomas et al. (1992) utilising the non-linear elastic state-
surface approach proposed by Lloret and Alonso (1985). This model was applied to seasonal
ground movements in the work presented by Thomas and Zhou (1995). An elasto-plastic
coupled Thermo-Hydro-Mechanical (THM) model was presented by Thomas and He (1994)
and Thomas and He (1995) using the elasto-plastic model o f Alonso et al. (1990). Ramesh
(1996) applied the THM model to simulate temperature, moisture and void ratio distributions
of montmorillonite subjected to heating/hydration. The work also involved investigation of
isothermal volume change behaviour o f compacted kaolinite in suction controlled tests.
Thomas and Cleall (1999) extended the THM model to include highly expansive behaviour.
Using the developed model, a numerical simulation of large scale experiments were presented
by Mitchell (2002), Thomas et al. (2003), Melhuish (2004) and Cleall et al. (2006) which
included investigation into the microstructure behaviour of bentonite and the effects on
resaturation of the buffer.
Chemical processes were first introduced as non-reactive chemical solute transport for a
single species (Thomas and Cleall, 1997). Hashm (1999) developed the model to two
1-6
Chapter 1 Introduction
dimensional coupled moisture and reactive multiple chemical solute transport by linking the
non-reactive transport code with the geochemical model, MINTEQA2 (Allison et al., 1991).
The model was applied to simulate a series of leaching cell experiments to study the
migration/sorption behaviour o f some o f the heavy metals. Seetharam (2003) developed the
multicomponent chemicals reactive transport module o f the coupled THCM model. The
geochemical reactions were calculated by the geochemical model, MINTEQA2 using two
different coupling schemes to solve transport and reaction equations. The coupled THCM
model was used to simulate the reactive transport o f chemicals in a small scale laboratory on
compacted bentonite under heating and hydration (Seetharam et al., 2006; Cleall et al., 2007).
A number o f theoretical and computational developments have recently been made in the
model focusing mainly on the behaviour o f compacted bentonite as the buffer in HLW
geological repository and to model the large scale THM behaviour o f the repository. Sing
(2007) presented an experimental and numerical investigation on the heat and moisture
transfer in compacted bentonite and kaolinite with special attention to the vapour transfer in
compacted clays. Modifications to the existing vapour theory were suggested and introduced
in existing THM behaviour. Siddiqua (2008) presented an investigation into the elevated
temperature effects (70-200 °C) on the THM processes in the model. A pore gas transfer
equation and thermo-osmotic effect was developed to account for elevated temperature.
Vardon (2009) extended the COMPASS model to accommodate three-dimensional THM
behaviour in geological repository, including the development o f a high-performance
computing algorithm using both multi-threaded and message-passing programming paradigms
to enable simulations to be completed in significantly reduced time. The model was utilised
for simulation o f the THM behaviour o f a large-scale experiment, carried out at an
underground research laboratory in Sweden. More recently, Thomas et al. (2011) presented
the inclusion o f biological aspects to the coupled THCM model. The work deals with early
developments to include some biological impacts on coupled transport phenomena through
unsaturated porous media. The THCMB model presented incorporates biodegradation kinetics
of organic substrates.
1-7
Chapter 1 Introduction
1.4 Scopes and limitations
The scope o f the work undertaken in this thesis and in particular the limitations that are
anticipated are listed below:
• Numerical approximation is used to find a solution to the system of coupled
differential equations. In particular, the finite-element method is used to provide a
spatial solution and the finite-difference method used to provide a temporal solution.
• Soil is assumed as a homogeneous medium acknowledging the fact that that soils
exhibit some degree o f heterogeneity, and this may be partly accommodated in this
study as the assumption o f homogeneity only applies within an individual element.
Therefore, different soil types may be used within an analysis.
• The chemical transport equation is applicable for miscible chemical flow only.
Immiscible chemical flow is not considered.
• Soil hysteresis behaviour such as found in the moisture retention behaviour in
wetting/drying paths has not been included in the model. This is due in part to a lack
of experimental evidence and potentially complex wetting/drying path.
• The effect o f osmotic potential on the deformation behaviour is not considered.
• Vapour transport is assumed to be diffusive. At higher temperatures, elevated air
pressure gradients may occur, leading to increased vapour movement. This has not
been included in the theoretical formulation. Hence the temperature range, which can
be modelled, is between 0 and 100 °C in accordance with the moisture flow
formulation. However, the range o f temperature validity in the geochemical model
depends mainly on the limitation o f the thermodynamic data for reactions.
• The constitutive model implemented for stress/strain behaviour is valid for slightly
and moderately expansive soils.
1-8
Chapter 1 Introduction
1.5 Overview of the thesis
A brief description o f each chapter is presented below.
Chapter 2 contains a selective review o f the current literature salient to the work contained in
the developments presented in the remainder o f the thesis, including a review of the recent
coupled THCM experimentation and modelling aspects of compacted bentonite buffer
behaviour. A targeted review o f the development of numerical strategies to efficiently solve
coupled transport and geochemical problems is also presented.
The theoretical formulation for thermal, hydraulic and mechanical behaviour and geochemical
reactions o f the linked geochemical model is presented in chapter 3. The main focus is to
present the development in the governing equations for the reactive transport of
multicomponent chemicals. In chapter 4 the numerical formulation of the solution of the
governing differential equations representing heat, moisture, air, multicomponent chemical
and deformation behaviour is presented. The coupling scheme adopted for solving the
chemical transport and reaction problems is also presented in this chapter.
Chapter 5 presents the verification and validation of the numerical model against analytical
solutions, alternative numerical solutions and experimental results. This chapter will only
focus on the verification and validation related to the developments made in the scope o f this
thesis, in particular in the chemical reactive transport. It is noted that the numerical model has
already been verified for a number o f test cases involving coupled moisture flow, air flow,
heat transfer, chemical transport, and deformation.
Chapter 6 presents a numerical simulation o f the reactive transport o f chemicals under
coupled thermal, hydraulic, chemical framework. In particular, based on the development of
the theoretical formulation, presented in chapter 3, the effects related to the combined
electrochemical and thermal diffusion potentials on the reactive transport o f ionic species in
compacted clays are investigated. The simulations have aimed to initially test the numerical
model behaviour under coupled THC condition and more importantly to investigate how the
coupled electrochemical and thermal diffusion affects the distribution of chemicals in the
system.
1-9

Chapter 1 Introduction
In chapter 7, a theoretical model is presented to include the microstructural evolution of
smectite minerals (as the major clay component o f compacted bentonite) in modelling of the
transport processes. The hydrate water in the microstructure of compacted bentonite and its
variation is evaluated and modelled with an approach proposed based on a geochemical solid-
solution reaction. The inclusion of the effects of the hydrate water located in the
microstructure on the flow behaviour o f confined compacted bentonite is presented. Two
series o f simulations are reported, the first under isothermal conditions and the second under
thermal gradients using the proposed model. The results are compared and validated against
experimental results.
Chapter 8 presents the results o f an application o f the model via simulation o f a laboratory
experiment reported on the hydro-geochemical response of compacted unsaturated smectite
clay subjected to heating and hydration. The problem considered in the simulation is a
thermo-hydraulic laboratory test on a sample (600x70 mm) o f compacted bentonite for
relatively long term (7.6 years) and reported by Villar et al. (2008) and Fernandez and Villar
(2010). The sample is subjected to heating at 100 °C on the bottom side and hydration through
the top surface with granitic water at 1.2 MPa. The focus is to simulate the reactive transport
behaviour of major ionic species and the variations in the geochemistry of aqueous-clay
system under the influence o f opposing thermo-hydraulic gradients. The major geochemical
reactions including precipitation/dissolution o f multiple minerals and ion exchange process
are investigated. The results o f simulation are compared with the experimental data providing
a validation test on the model for complex and coupled behaviour similar to the condition of
the buffer in HLW repository condition.
Chapter 9 presents the conclusions drawn from this work, and suggestions are made for
further research.
1-10

Chapter 1 Introduction
1.6 References
Allison, J.D., Brown, D.S., and Novo-Gradac, K.J. (1991). MINTEQA2 user manual version
3.0. Environmental Research Laboratory, US EPA.
Alonso, E.E., Gens, A., and Josa, A. (1990). A constitutive model for partially saturated
soils. Geotechnique, 40(3), 405-430.
Cleall, P.J., Melhuish, T.A., and Thomas, H.R. (2006). Modelling the three-dimensional
behaviour of a prototype nuclear waste repository. Engineering Geology, 85(2), 212-220.
Cleall, P.J., Seetharam, S.C., and Thomas, H.R. (2007). On the inclusion of some aspects of
chemical behaviour o f an unsaturated soil in thermo-hydro-chemical-mechanical models: II
Application and transport o f soluble salts in compacted bentonite. Journal o f Engineering
Mechanics, ASCE, 133, 348-356.
Datta, M., Srivastava, R.K., Ramana, G.V., and Shahu, J.V. (edt.) (2010). Environmental• thGeotechnics for Sustainable Development. Proceeding o f the 6 International Congress on
Environmental Geotechnics, New Delhi, India.
de Vries, D.A. (1958). Simultaneous transfer of heat and moisture in porous media.
Transaction American Geophysical Union, 39(5), 909-916.
Ewen, J., and Thomas, H.R. (1987). The thermal probe-a new method and its use on an
unsaturated sand. Geotechnique, 37, 91-105.
Ewen, J., and Thomas, H.R. (1989). Heating unsaturated medium sand, Geotechnique, 39( 3),
455-470.
Fem&ndez, A.M., and Villar, M.V. (2010). Geochemical behaviour of a bentonite barrier in
the laboratory after up to 8 years o f heating and hydration. Applied Geochemistry, 25, 809-
824.
Hashm, A. A. (1999). A study o f the transport o f a selection o f heavy metals in unsaturated
soils, Ph.D. Thesis. University o f Wales, Cardiff.
Lloret, A., and Alonso, E.E. (1985). State surfaces fo r partially saturated soils. Proceedings
o f the 11th International Conference o f Soil Mechanics and Foundation Engineering, San
Francisco, 2, 557-562.
1-11
Chapter 1 Introduction
Luikov, A.V. (1966). Heat and Mass Transfer in Capillary Porous Bodies, Pergamon Press,
Oxford.
Melhuish, T.A. (2004). An investigation o f the three-dimensional thermo/hydro/mechanical
behaviour o f large scale in-situ experiments. PhD Thesis, Cardiff University, Cardiff, UK.
Mitchell, H.P. (2002). An investigation into the thermo/hydro/mechanical interactions
involved in high level nuclear waste disposal. PhD Thesis, University of Wales, Cardiff, UK.
Philip, J.R., and de Vries, D.A. (1957). Moisture movement in porous materials under
temperature gradients. Transaction American Geophysical Union, 38(2), 222-232.
Pusch, R. (2008). Geological Storage o f Highly Radioactive Waste, Springer, New York.
Pusch, R. and Yong, R.N. (2006). Microstructure o f Smectite Clays and Engineering
Performance. Taylor and Francis, New York.
Ramesh, A.D. (1996). Modelling the thermo/hydraulic/mechanical behaviour o f unsaturated
soil using an elasto-plastic constitutive relationship, Ph.D thesis. University o f Wales
Cardiff, UK.
Seetharam, S.C., Thomas, H.R., and Cleall, P.J. (2007). Coupled thermo-hydro-chemical-
mechanical model for unsaturated soils-Numerical algorithm. International Journal o f
Numerical Methods in Engineering, 70, 1480-1511.
Seetharam, S.C. (2003). An investigation o f the thermo/hydro/chemical/mechanical
behaviour o f unsaturated soils. Ph.D. Thesis, Cardiff University, Wales, UK.
Seetharam, S.C., Cleall, P.J., and Thomas, H.R. (2006). Modelling some aspects of ion
migration in a compacted bentonitic clay. Engineering Geology, 85, 221-228.
Siddiqua, S. (2008). An investigation o f the influence o f elevated temperatures on the
thermal-hydraulic-mechanical response o f unsaturated soils. PhD Thesis, Cardiff University,
Wales, UK.
Singh, R.M. (2007). An experimental and numerical investigation o f heat and mass
movement in unsaturated clays. PhD Thesis, Cardiff University, Wales, UK.
Sloper, N.J. (\991).The development o f a new three dimensional numerical model fo r fully
coupled heat, moisture and air flow in unsaturated soil incorporating scientific visualisation
and parallel computing techniques, PhD Thesis, University of Wales, Cardiff.
1-12
Chapter 1 Introduction
Steefel, C.I., Rutqvist, J. Tsang, C-F., Liu, H-H., Sonnenthal, E., Houseworth J., and
Birkholzer, J. (2010). Reactive Transport and Coupled THM Processes in Engineering
Barrier Systems (EBS). Technical Report, LBNL-3901E, Lawrence Berkeley National
Laboratory.
Stephansson, O., Hudson, J.A., and Jing, L. (edt.) (2004). Coupled Thermo-Hydro-
Mechanical-Chemical Processes in Geo-systems: Fundamentals, Modelling, Experiments
and Applications. Geo-Engineering Book Series, Elsevier.
Thomas, H.R. (1985). Modelling two-dimensional heat and moisture transfer in unsaturated
soils, including gravity effects. International Journal o f Analytical Methods in
Geomechanics, 9, 573-588.
Thomas, H.R. (1987). Non-linear analysis of heat and moisture transfer in partly saturated
soil, Journal o f Engineering Mechanics, American Society o f Civil Engineering, 113, 1163-
1180.
Thomas, H.R. (1988a). A non-linear analysis o f two-dimensional heat and moisture transfer
in partly saturated soil. International Journal o f Analytical Methods in Geomechanics. 2, 31-
44.
Thomas H.R. (1988b). The influence o f non-linear thermal parameters on moisture content
distributions in unsaturated soil. International Journal o f Analytical Methods in Engineering,
26, 263-279.
Thomas, H.R. (2006). 5th ICEG Environmental Geotechnics; Opportunities, Challenges and
Responsibilities fo r Environmental Geotechnics. Thomas Telford.
Thomas, H.R., and Rees, S.W. (1988). The use o f Lee’s algorithm in the analysis o f somesthground heat and mass transfer problems. Proceedings o f the o International Conference on
Numerical Methods in Geomechanics, Innsbruck, Austria.
Thomas, H.R., and Rees, S.W. (1990). An examination of the performance o f a 3-level time
stepping algorithm-Coupled heat and mass transfer computing. Proceedings o f the 1st
International Conference, Advances in Computer Methods in Heat Transfer, Southampton,
U.K.
1-13

Chapter 1 Introduction
Thomas, H.R., and King, S.D. (1991). Coupled temperature/capillary potential variations in
unsaturated soil. Journal o f Engineering Mechanics, American Society o f Civil Engineers,
117, 2475-2491.
Thomas, H.R., Zhou, Z., and He, Y. (1992). Analysis o f consolidation of unsaturated soils.
Proceedings o f the 2nd Czechoslovak Conference on Numerical Methods in Geomechanics,
Prague, Dolezalova, M., eds., vol.l, 242-247.
Thomas, H.R., and Rees, S.W. (1993). The numerical simulation of seasonal soil drying in an
unsaturated clay soil. International Journal o f Numerical and Analytical Methods in
Geomechanics, 17 (1), 119-132.
Thomas, H.R., and He, Y. (1994). An elasto-plastic analysis of the
thermo/hydraulic/mechanical behaviour o f unsaturated soil. Proceedings o f the 8th
International Conference on Computer Methods and Advances in Geomechanicsi
Morgantown, Siriwardane, H.J. and Zaman, M.M. eds., Balkema, Rotterdam, 1171-1176.
Thomas, H.R., and He, Y. (1995). Analysis o f coupled heat, moisture and air transfer in a
deformable unsaturated soil. Geotechnique, 45(4), 677-689.
Thomas, H.R., and Sansom, M.R. (1995). Fully coupled analysis of heat, moisture and air
transfer in unsaturated soil. Journal o f Engineering Mechanics., American Society o f Civil
Engineers, 121(3), 392-405.
Thomas, H.R., and Zhou, Z. (1995). A comparison o f field measured and numerically
simulated seasonal ground movement in unsaturated clay. International Journal fo r
Numerical and Analytical Methods in Geomechanics, 19, 249-265.
Thomas, H.R., and Cleall, P.J. (1997). Chemico-osmotic effects on the behaviour of
unsaturated expansive clays. Geoenvironmental Engineering, Contaminated Ground; Fate o f
Pollutants and Remediation, Yong, R.N. and Thomas, H.R., eds., Thomas Telford, London,
272-277.
Thomas, H.R., Rees, S.W., Sloper, N.J. (1998). Three-dimensional heat, moisture and air
transfer in unsaturated soils. International Journal o f Numerical and Analytical Methods in
Geomechanics, 22(2), 75-95.
Thomas, H.R., and Cleall, P.J. (1999). Inclusion o f expansive clay behaviour in coupled
thermo hydraulic mechanical models. Engineering Geology, 54, 93-108.
1-14

Chapter 1 Introduction
Thomas, H.R., Cleall, P.J., Chandler, N., Dixon, D., and Mitchell, H.P. (2003). Water
infiltration into a large-scale in-situ experiment in an underground research laboratory.
Geotechnique, 53(2), 207-224.
Thomas H.R., Seetharam, S.C., and Vardon, P.J. (2011). On the inclusion of some biological
impacts and influences in coupled transport phenomena in unsaturated soil, Geotechnical and
Geological Engineering, 29, 181-191.
Vardon, P.J. (2009). A three-dimensional numerical investigation o f the therm-hydro-
mechanical behaviour o f a large-scale prototype repository. Ph.D. Thesis, Cardiff
University, Wales, UK.
Villar, M.V., Fem&ndez, A.M., Martin, P.L., Barcala, J.M., G6mez-Espina, R., Rivas, P.
(2008). Effect o f Heating/Hydration on Compacted Bentonite: Tests in 60 cm Long Cells.
Publishing House CIEMAT. Madrid.
Yaron, B., Dror, I and Berkowitz, B. (2008). Contaminant-induced irreversible changes in
properties o f the soil-vadose-aquifer zone: An overview. Chemosphere, 71, 1409-1421.
Yong, R.N., Mulligan, C.N., and Fukue, M. (2006). Geoenvironmental Sustainability. CRC
Press, Taylor and Francis.
Yong, R.N., Pusch, R., and Nakano, M. (2010). Containment o f High-Level Radioactive and
Hazardous Solid Wastes with Clay Barriers. Spon Press, New York.

Chapter 2 Literature Review
Chapter 2
Literature Review
2-1

Chapter 2 Literature Review
2.1 Introduction
The nature, functionality, properties and the behaviour o f soils have been the subject of
numerous studies for a long time in various fields o f science and engineering. Hence, many o f
the processes are well established in the literature. In terms o f the coupled physical, chemical
and mechanical behaviour o f unsaturated soils, this study focuses mainly on the behaviour of
compacted swelling clays and in particular compacted smectite clays (bentonite), as an
application case o f the developments made in this research. Compacted bentonite has been
suggested as the buffer candidate in relation to the underground disposal of high level nuclear
waste (HLW). The modelling o f the hydro-geochemical behaviour o f compacted bentonite
under geological repository conditions is a challenging task which involves difficulties related
to the material and to the various processes and time scales involved. This chapter mainly
aims to provide a state o f the art review on the coupled physical, chemical and mechanical
properties and behaviour o f compacted smectite clays and the research programs including
experimental and numerical investigations.
The advances in the understanding o f the key processes related to the thermal, hydraulic,
chemical and mechanical behaviour o f compacted bentonite in repository conditions has been
utilised in developing numerical modelling as an assessment tool o f the performance and the
quantification o f uncertainty, risk and reliability. In this chapter a selective review is
presented o f the recent developments in the experimental works and the numerical modelling
of the behaviour o f compacted bentonite.
In section 2.2 the key elements o f the physical, chemical and mechanical processes involved
in evolution o f compacted bentonite as the buffer candidate in repository conditions are
briefly reviewed.
The microstructure evolution o f compacted bentonite has a profound effect on hydraulic and
chemical flow behaviour due to the presence o f smectite minerals as the primary solid
component of the most o f the commercially available bentonite clays. Section 2.3 provides a
review on the micro- and macrostructure and the fabric of compacted bentonite. The basic
microstructure o f smectite minerals is briefly reviewed in this section.
The process o f water uptake and hydration/dehydration is discussed in section 2.4. Section 2.5
deals with the water and the physical state o f pore water in compacted bentonite. As an
2-2

Chapter 2 Literature Review
important issue o f the modelling o f the water and chemical flow, the physical state o f water
located in different levels o f pore scale in compacted bentonite is also concerned. The
developments in the modelling o f the moisture transport in compacted bentonite and its
linkage with the microstructure evolution is presented in section 2.6.
Diffusion acts as the major mechanism o f chemical transport, especially in compacted
swelling clays. Section 2.7 reviews the current knowledge o f the ionic diffusion and effective
parameters in compacted smectite clays (bentonite). Temperature effects on the diffusion of
ionic species with special focus on thermal diffusion i.e. Soret effect, are also dealt with in
section 2.8.
Sections 2.9 and 2.10 present reviews on the recent experimental and numerical investigation
of the coupled thermal, hydraulic, chemical and mechanical behaviour o f compacted bentonite
under similar conditions to the buffer in repository conditions.
Section 2.11 covers some o f computational aspects and recent developments o f the reactive
transport modelling o f multicomponent chemicals in porous media. Different schemes for
coupling chemical transport and reactions to efficiently solve coupled transport and
geochemical problems are also reviewed in this section.
Finally, in section 2.12, summary and conclusions are drawn from the above discussions.
2.2 Physical, chemical and mechanical processes in unsaturated compacted bentonite buffer in geological disposal of HLW
According to most concepts proposed by the organisations responsible for disposal o f HLW,
the radioactive waste canisters will be placed at several hundred meters depth in crystalline
rock, salt, argillaceous rock or clay deposits. Compacted smectite clay (i.e. compacted
bentonite) has been suggested as the buffer candidate that provides the embedded medium for
canisters with very high tightness for minimizing percolation o f groundwater, with sufficient
bearing capacity for minimizing movement o f the heavy canisters and being sufficiently soft
to transfer only a fraction o f the stresses generated by tectonic movements to the canisters
(e.g. Pusch, 1994; SKB, 1999; Posiva, 2006; Pusch, 2008; Yong et al., 2010). The main
2-3
Chapter 2 Literature Review
attributes making compacted smectite clays suitable for use as buffer in EBS are (Yong et al.,
2010; Steefel et al., 2010):
• Adequate thermal conductivity to transfer heat away from the canister so that the
canister can be maintained at a temperature equal to 100°C or below.
• Very low hydraulic conductivity that prevents percolation of the ground water around
canister and limits the rate o f canister corrosion.
• High swelling potential, that provides the self-sealing and tightness that makes
possible self sealing o f openings within the Engineered Barrier System and o f gaps
between the bentonite with the rock and with the radioactive waste canister.
• Low diffusion coefficient and high buffering/attenuation capacity which are essential
for reduction and control the transport o f radionuclides, and to attenuate the transport
of corrosion promoting ions from the rock.
• Low microbial activity in highly compacted bentonite which reduces the impact on
clay minerals with respect to transmission through mechanisms o f weathering and
dissolution over long time period.
Three major phases in the evolution o f the bentonite buffer in geological HLW repository
conditions can be identified (Pusch and Yong, 2006; Pusch, 2008; Steefel et al., 2010). The
compacted bentonite buffer is initially partly saturated when installed around waste canisters
in a repository. The first phase is the initial water uptake after emplacement which can take
place over a period o f 0 to 100 years dependent on repository design (Wersin et al., 2007).
The re-saturation phase is under the thermal effects, sourcing from the canister. Processes
involved in the evolution o f the bentonite buffer include thermally induced distribution of
initial pore water in the clay during the early thermal phases (Tong et al., 2009; Thomas et al.,
2009). The second phase is dominated by heat input from the waste canister with a significant
time-varying temperature gradient, with the temperature initially increasing and then
returning to ambient over a period o f 100 to 10,000 years. The third phase is the long-term
hydro-geochemical period with tectonic or glacial processes under ambient or reduced
temperature conditions from a thousand to a million years. The possible external changes that
the groundwater might undergo in the long-term, can affect the geochemistry o f the bentonite
2-4

Chapter 2 Literature Review
buffer. Major chemical processes that may affect the chemical stability of the bentonite buffer
after water saturation include dissolution and precipitation, conversion o f smectite in the
buffer to non expansive mineral forms, and cementation by precipitated complexes (Pusch
and Yong, 2006).
The engineered barriers around the waste will provide a long period o f containment,
depending on the environment and the materials used, during which much o f the radioactivity
of the waste will decay. The engineered barriers hinder the mobilisation o f radioactive
contaminant generated form the waste for hundreds o f thousands of years. It is expected that
the transport o f chemical species occurs very slowly by the diffusion mechanism in
compacted clay buffer.
At the canister side, compacted clays buffer will be exposed to the heat released from
radioactive waste. As a result, the heat flux is transferred through the three phase system of
solid-water-gas which induces a moisture re-distribution from the initial pore water
distribution in the clay during the early thermal phases (e.g. Thomas et al., 2009). At the other
side of the buffer (at the clay/rock interface), water uptake and saturation can occur as a result
of water flow through the fractures in rock or the water which exists in the host geological
medium. Due to the low permeability o f compacted bentonite, the process o f water uptake and
re-saturation is considered as a slow process which has been estimated to take place during
the first hundred year o f the repository life-time (SKB, 1999; Nagra, 2002; Wersin et al.,
2007; Yong et al., 2009).
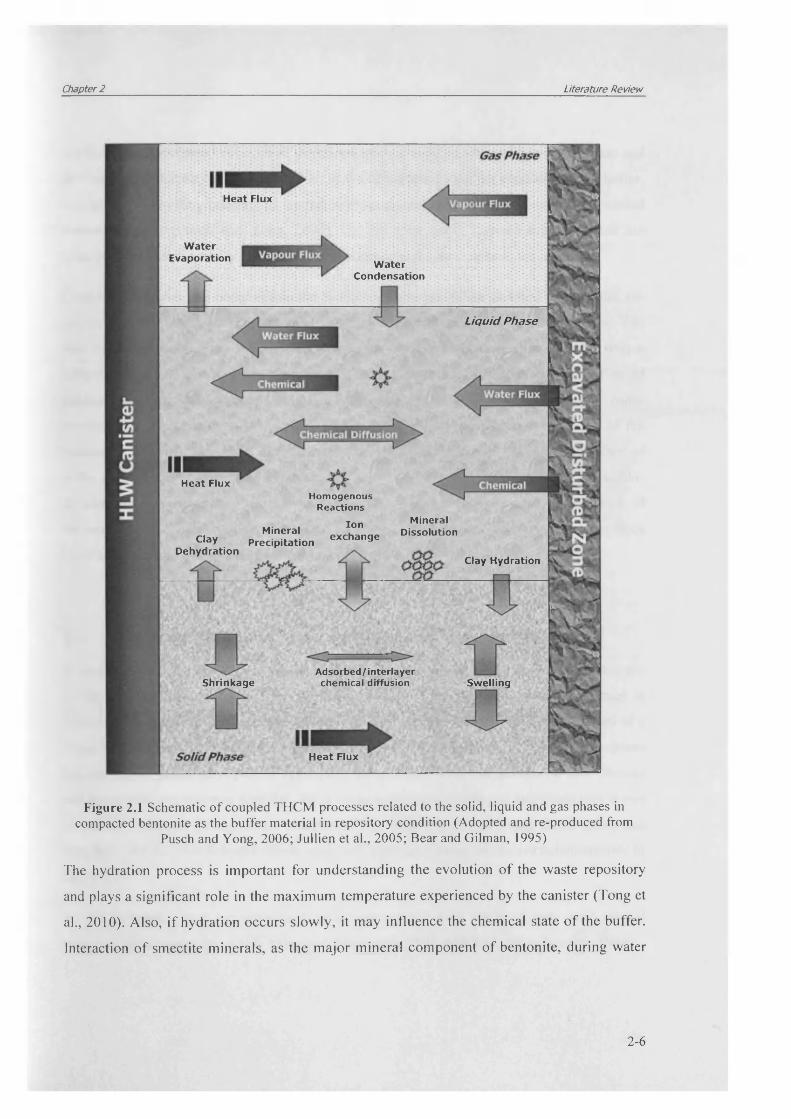
Figure 2.1 presents a schematic o f key processes related to thermal, hydraulic, chemical and
mechanical behaviour o f compacted bentonite buffer under repository conditions. A source of
water is shown to be found in the Excavated Disturbed Zone (EDZ) of the host rock. The
location of the canister is shown schematically with the three phase conceptual diagram
adjacent to the canister. The various processes associated with the THCM behaviour are
coupled in a complex manner. In addition, all the processes operate at different time scales
and intensities which make the problem o f prediction and modelling difficult (Yong et al.,
2009).
2-5
Chapter 2 Literature Review
Heat Flux
WaterEvaporation Water
Condensation
Liquid Phase
Heat FluxHomogenous
ReactionsIon
exchangeMineral
DissolutionMineral Clay Precipitation
DehydrationClay Hydration
Adsorbed/interlayer chemical diffusionShrinkage Swelling
Heat Flux
Figure 2.1 Schematic of coupled THCM processes related to the solid, liquid and gas phases in compacted bentonite as the buffer material in repository condition (Adopted and re-produced from
Pusch and Yong, 2006; Jullien et al., 2005; Bear and Gilman, 1995)
The hydration process is important for understanding the evolution o f the waste repository
and plays a significant role in the maximum temperature experienced by the canister (Tong et
al., 2010). Also, if hydration occurs slowly, it may influence the chemical state o f the buffer.
Interaction o f smectite minerals, as the major mineral component o f bentonite, during water
2-6
Chapter 2 Literature Review
uptake leads to increased volumes o f the microstructure units in terms of density increase and
decrease in the porosity o f wetted portion. In the constrained swelling condition o f the buffer,
increasing the swelling pressure o f wetted portion causes the local compression o f un-wetted
portion elements (Pusch and Yong, 2006). On the other hand, higher temperature and the
induced dehydration and drying cause local shrinkage in the area close to the heater.
Chemical processes will occur within the buffer as the results o f the elevated temperature, re
distribution o f moistrure and water intrusion from the surrounding geological formation. The
pore fluid composition can be affected due to the exposure to the host rock water with a
different chemical composition. Pusch and Yong (2006) has described the migration of
calcium, chloride and sulphate ions, which increase the salinity in the hot part or cause
accumulation o f minerals such as halite and gypsum which contribute to corrosion o f the
canister as the most important chemical processes within the buffer and at the interface of
buffer and canister. Concerning geochemical reactions related to the compacted clay buffer,
dissolution and precipitation o f minerals, ion-exchange reaction (for example conversion of
Na-bentonite to Ca-bentonite), illitisation and dissolution o f smectite mineral have been
reported as the major reactions (Seetharam et al., 2007; Steefel, 2010).
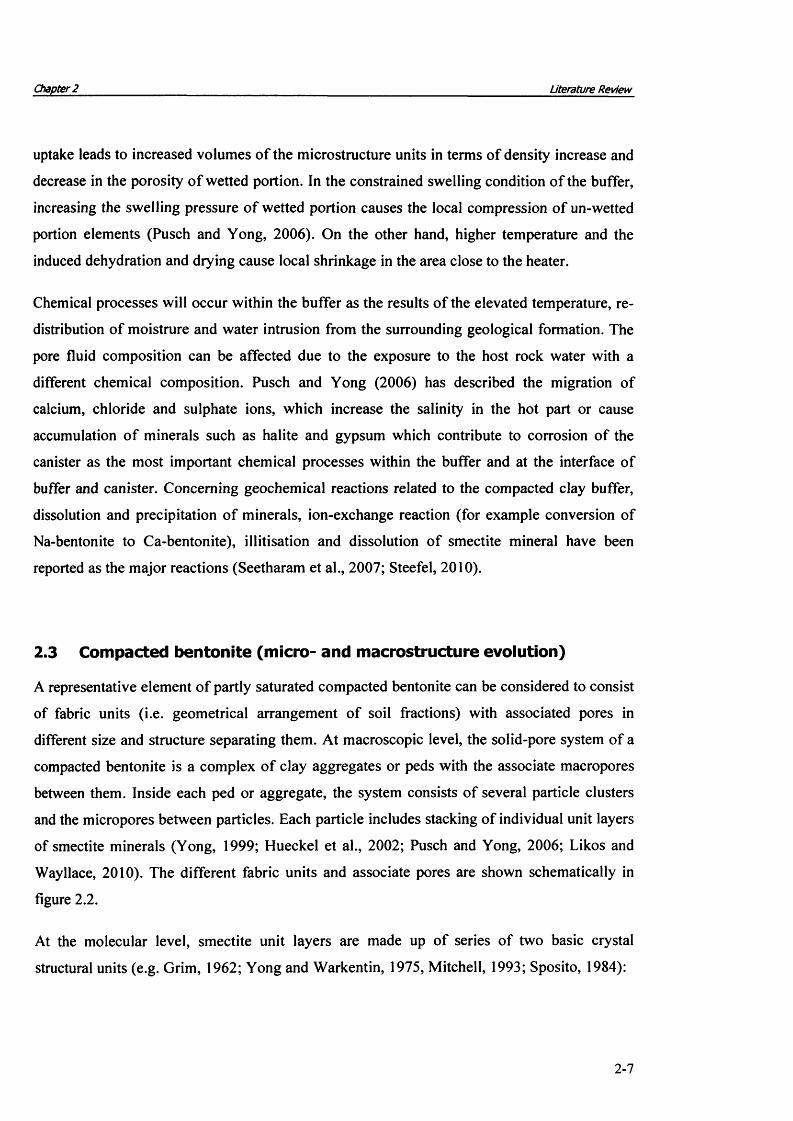
2.3 Compacted bentonite (micro- and macrostructure evolution)
A representative element o f partly saturated compacted bentonite can be considered to consist
of fabric units (i.e. geometrical arrangement o f soil fractions) with associated pores in
different size and structure separating them. At macroscopic level, the solid-pore system of a
compacted bentonite is a complex o f clay aggregates or peds with the associate macropores
between them. Inside each ped or aggregate, the system consists o f several particle clusters
and the micropores between particles. Each particle includes stacking of individual unit layers
of smectite minerals (Yong, 1999; Hueckel et al., 2002; Pusch and Yong, 2006; Likos and
Wayllace, 2010). The different fabric units and associate pores are shown schematically in
figure 2.2.
At the molecular level, smectite unit layers are made up o f series of two basic crystal
structural units (e.g. Grim, 1962; Yong and Warkentin, 1975, Mitchell, 1993; Sposito, 1984):
2-7
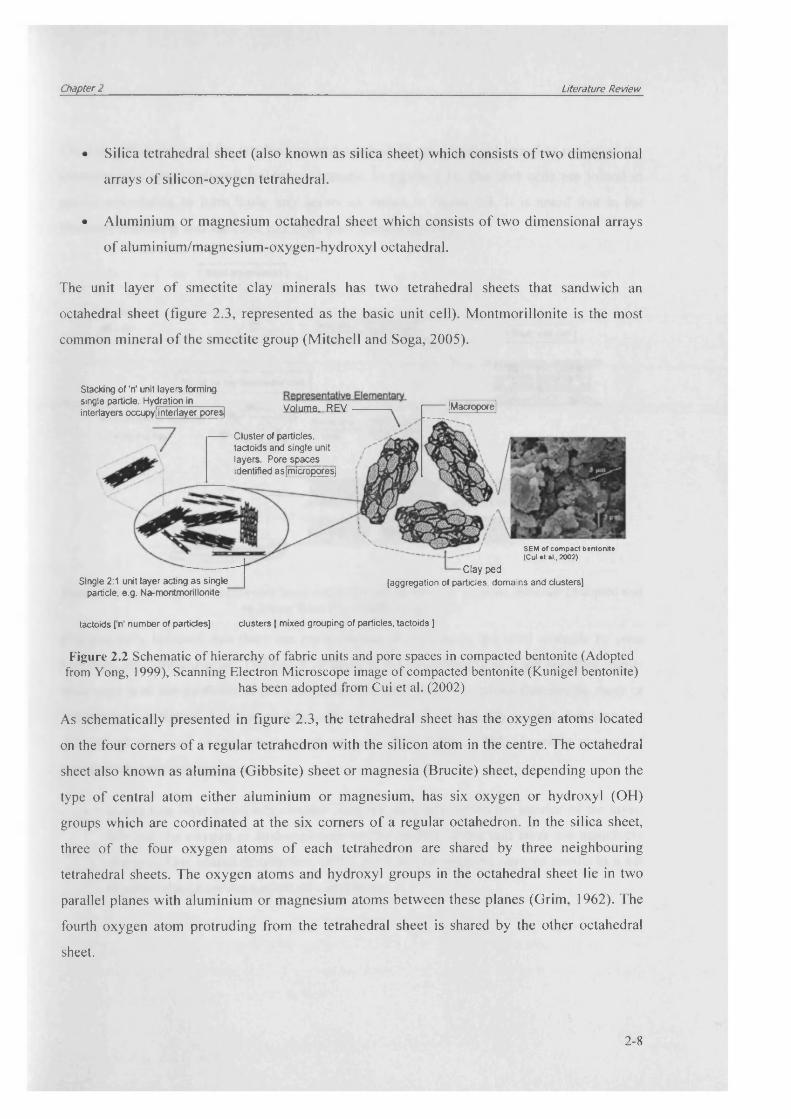
Chapter 2____________________________________________________________________________ Literature Review
• Silica tetrahedral sheet (also known as silica sheet) which consists o f two dimensional
arrays o f silicon-oxygen tetrahedral.
• Aluminium or magnesium octahedral sheet which consists o f two dimensional arrays
o f aluminium/magnesium-oxygen-hydroxyl octahedral.
The unit layer o f smectite clay minerals has two tetrahedral sheets that sandwich an
octahedral sheet (figure 2.3, represented as the basic unit cell). Montmorillonite is the most
common mineral o f the smectite group (Mitchell and Soga, 2005).
Stacking of'n' unit layers formingsingle particle. Hydration in_____interlayers occupylinterlayer pores] 1 Macropore]Volume. REV
Cluster of particles,tactoids and single unit layers. Pore spaces identified as|microporesl
SEM or compact bentonite (Cui et al., 2002)
Single 2:1 unit layer acting as single particle, e.g. Na-montmorillonite
Clay ped(aggregation of particles, domains and clusters]
tactoids fn' number of particles] clusters [ mixed grouping of particles, tactoids ]
Figure 2.2 Schematic of hierarchy of fabric units and pore spaces in compacted bentonite (Adopted from Yong, 1999), Scanning Electron Microscope image of compacted bentonite (Kunigel bentonite)
has been adopted from Cui et al. (2002)
As schematically presented in figure 2.3, the tetrahedral sheet has the oxygen atoms located
on the four corners o f a regular tetrahedron with the silicon atom in the centre. The octahedral
sheet also known as alumina (Gibbsite) sheet or magnesia (Brucite) sheet, depending upon the
type o f central atom either aluminium or magnesium, has six oxygen or hydroxyl (OH)
groups which are coordinated at the six comers o f a regular octahedron. In the silica sheet,
three o f the four oxygen atoms o f each tetrahedron are shared by three neighbouring
tetrahedral sheets. The oxygen atoms and hydroxyl groups in the octahedral sheet lie in two
parallel planes with aluminium or magnesium atoms between these planes (Grim, 1962). The
fourth oxygen atom protruding from the tetrahedral sheet is shared by the other octahedral
sheet.
2-8
Chapter 2 Literature Review
The simplified views o f the tetrahedron and octahedron are commonly used to represent the
elements o f a basic unit cell (middle schematic in figure 2.3). The unit cells are joined in
spatial articulation to form basic unit layers as shown in figure 2.3. It is noted that in the
literature both layer and lamellae has been used interchangeably.
Silica tetrahedron
O * Oxygen ■ -Si Sim plified
Basic unit cell
Fe. Al, or Mg octahedral unit
d = Oxygen or Hydroxyl
D - Al. Fe. MgS im p l if ie d
Exchangeable cations
Figure 2.3 Schematic of smectite unit layer and structural elements of smectite minerals (Adopted andre-drawn from Pusch and Yong, 2006)
It is generally believed that there are replacements o f the ions in the ideal smectite by ones
that have different valences. The result o f these is the development o f a net negative charge
associated with the particles, and is the reason for adsorption o f cations that can be more or
less strongly hydrated. In other words, unit layers are not electrically neutral, but carry an
unbalanced electrical charge on the surfaces and edges (Grim, 1962). Possible sources o f
unbalanced electrical charge are:
• In any unit layer positively charged ions are generally within the interior o f the layer,
whereas the oxygen or hydroxyl ions on the surface o f the unit layer are negatively
charged. This spatial distribution o f the positive and negative charges results in a net
negative charge on the surface o f a unit layer.
2-9

Chapter 2 Literature Review
• Partial replacement o f Si4+ by Al3+ in a tetrahedral sheet or o f Al3+ by Mg2+ in an
octahedral sheet (a process known as isomorphous substitution) results in a net
negative charge on the unit layers.
• At the edges o f unit layers, tetrahedral silica sheets and octahedral sheets are
disrupted, and primary bonds are broken. This leads to the hypothesis of positively
charged edges o f unit layers.
Charge deficiencies that result from isomorphous substitution are balanced by exchangeable
cations located between the unit cell layers and on the surfaces of particles.
The structural elements and fabric units o f compacted smectite can therefore be summarized
and arranged in the size order as (Yong, 1999, 2003):
• Unit layers with associated interlayer porosity between unit layers
• Unit particles with associated micropores or intra-layer porosity between particles
• Particle aggregates or clusters and the associated macropores between microstructural
units
In accordance with the concept presented above, three porosity scales can be identified in
compacted smectite clays:
• The interlayer porosity corresponding to the interlayer space which contain cations
and water molecules (generally <2 nm),
• The micro/mesoscopic porosity corresponding to the space existing between particles
(in the range o f 2-50 nm),
• The macroscopic porosity corresponding to the inter-aggregate voids (>50 nm),
There are different statements about the number o f individual layers in a stable particle of
smectite and it generally depends on the type o f interlayer cations and suction value. Sposito
(1984) stated that one to sixteen unit layers can be stacked; face to face, to form a unit
particle, depending on the interlayer exchangeable cation and the estimation method, van
Olphen (1977) estimated that typical sodium montmorillonite particle consists o f 2-3 lamellas
2-10

Chapter 2 Literature Review
or unit layers. Marcial et al. (2002) reported that in Na-smectite, the stacked clay layers which
form the wall of inter-particle pores contains 4-10 layers. However, the number of lamellas in
a typical particle depends on the electrolyte concentration in the liquid phase as well (Yong
and Warkentin, 1975).
The compaction o f smectite clays by applying external stress results primarily in the reduction
of macro- and micropores. Therefore the ratio o f total macro- and micro porosity to the
interlayer porosity decreases considerably in compacted smectite clays (Likos and Lu, 2006).
In fact, the contribution o f the interlayer porosity to the overall porosity increases with the
partial smectite dry density.
In one-dimensionally compacted smectite clays, the unit layers or lamellas are oriented
preferentially in a direction normal to that o f sample compaction. However the effect may be
less marked in the presence o f non-smectite particles (Bourg et al., 2006). The charge
conditions within the stacks, which contain 3-5 unit layers in Na montmorillonite and about
10 unit layers in Ca montmorillonite, are different from those at the external surfaces o f the
stacks in the sense that only cations are present in the interlayer space while complete
electrical double-layers are formed at the outer surfaces (Pusch, 2001).
2.4 Water uptake and interaction with compacted bentonite
Water uptake into anhydrous smectite microstructure units starts via hydration forces initially
and continues subsequently via diffuse double layer forces (van Olphen, 1977; Pusch and
Yong, 2006). The first mechanism o f water uptake referred to as hydration or crystalline
swelling is a process whereby initially dry expansive clay minerals sequentially adsorb a
limited numbers o f discrete layers o f water into the mineral interlayer. Hydration process is
driven primarily by the energy associated with the initial hydration o f exchangeable interlayer
cations and hydrogen bonding or charged surface-dipole attraction effects associated with
solid-liquid interactions, occurring in the immediate vicinity of the clay particle surfaces
(Likos, 2004). Interlayer hydration is determined by the layer charge, inter-layer cations,
properties o f adsorbed water and particle size (Yong, 2003).
2-11

Chapter 2____________________________________________________________________________ Literature Review
Water uptake beyond the hydration is related to the swelling force related to the development
of electrical diffuse layer between particles (van Olphen, 1977; Likos, 2004; Pusch and Yong,
2006). In a clay-water electrolyte system, the adsorbed cations near the surface o f the clay
particles produce a much higher concentration as compared with the ion concentration in free
water away from the surfaces. Ions diffuse away from the surface opposing electrostatic
attraction lead to ion distribution adjacent to a clay particle in suspension. The charged clay
surface and the distributed charge in the adjacent phase are together termed the diffuse double
layer or DDL (van Olphen 1977; Mitchell 1993; Tripathy et al., 2004).
In smectite clay, during the hydration process, discrete layers o f water molecules are adsorbed
into the individual interlayer positions within a smectite particle. The adsorbed numbers o f
zero, one, two, three and four layer(s) o f water molecules have been reported for smectite
clays which are associated with the basal spacing o f approximately 1.0, 1.25, 1.50, 1.70 and
2.0 nm, respectively (Laird, 2006). Figure 2.4 shows a schematic o f zero to three layers water
adsorption during hydration o f a single smectite particle.
fundamental £1 crystal layar net negative surface charge
zero-layer hydrate state*35
Intertayer catkns
W
&
1-layer hydrate state
motecufar Layer of H^O nwiecufes
to
2 layer hydrate statea
(c)
3-layer hydrate state
to
Figure 2.4 Conceptual model of the sequential hydration and crystalline swelling of smectite particle(Adopted from Likos 2004)
2-12
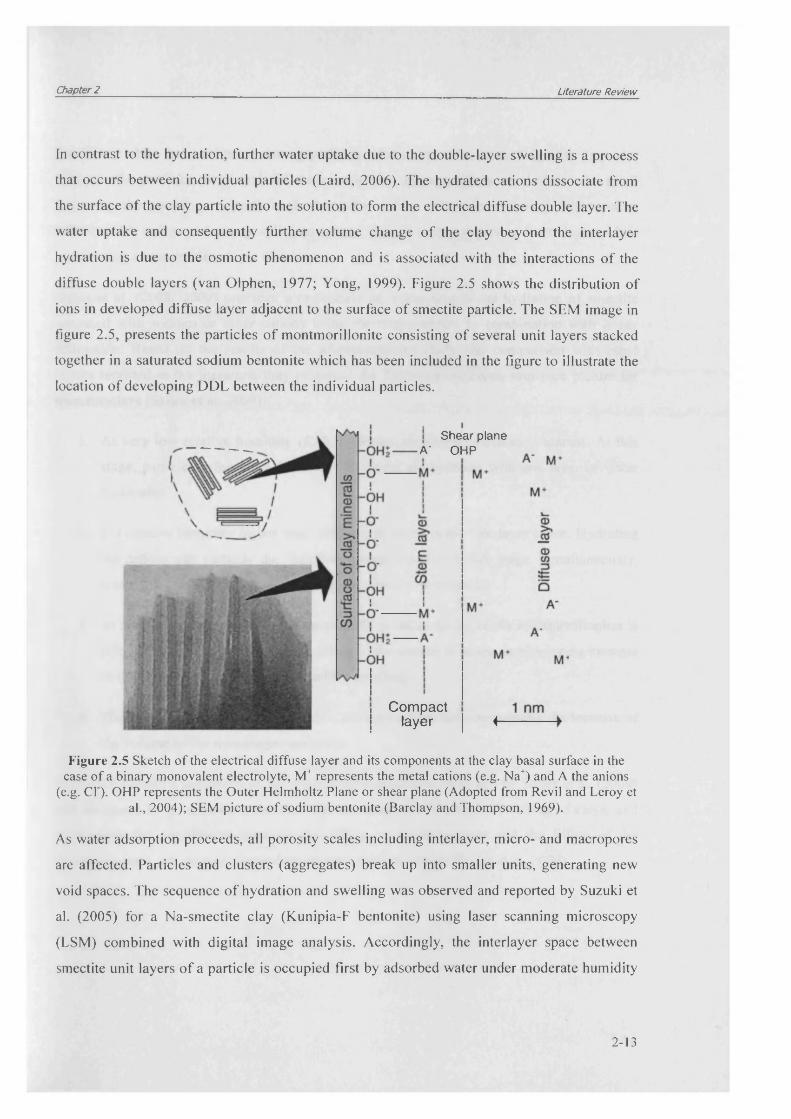
Chapter 2 Literature Review
In contrast to the hydration, further water uptake due to the double-layer swelling is a process
that occurs between individual particles (Laird, 2006). The hydrated cations dissociate from
the surface o f the clay particle into the solution to form the electrical diffuse double layer. The
water uptake and consequently further volume change o f the clay beyond the interlayer
hydration is due to the osmotic phenomenon and is associated with the interactions o f the
diffuse double layers (van Olphen, 1977; Yong, 1999). Figure 2.5 shows the distribution o f
ions in developed diffuse layer adjacent to the surface o f smectite particle. The SEM image in
figure 2.5, presents the particles o f montmorillonite consisting o f several unit layers stacked
together in a saturated sodium bentonite which has been included in the figure to illustrate the
location o f developing DDL between the individual particles.
Shear plane A" OHP
Compact layer j i
Figure 2.5 Sketch of the electrical diffuse layer and its components at the clay basal surface in the case of a binary monovalent electrolyte, M+ represents the metal cations (e.g. Na+) and A the anions
(e.g. Cl ). OHP represents the Outer Helmholtz Plane or shear plane (Adopted from Revil and Leroy et al., 2004); SEM picture of sodium bentonite (Barclay and Thompson, 1969).
As water adsorption proceeds, all porosity scales including interlayer, micro- and macropores
are affected. Particles and clusters (aggregates) break up into smaller units, generating new
void spaces. The sequence o f hydration and swelling was observed and reported by Suzuki et
al. (2005) for a Na-smectite clay (Kunipia-F bentonite) using laser scanning microscopy
(LSM) combined with digital image analysis. Accordingly, the interlayer space between
smectite unit layers o f a particle is occupied first by adsorbed water under moderate humidity
2-13
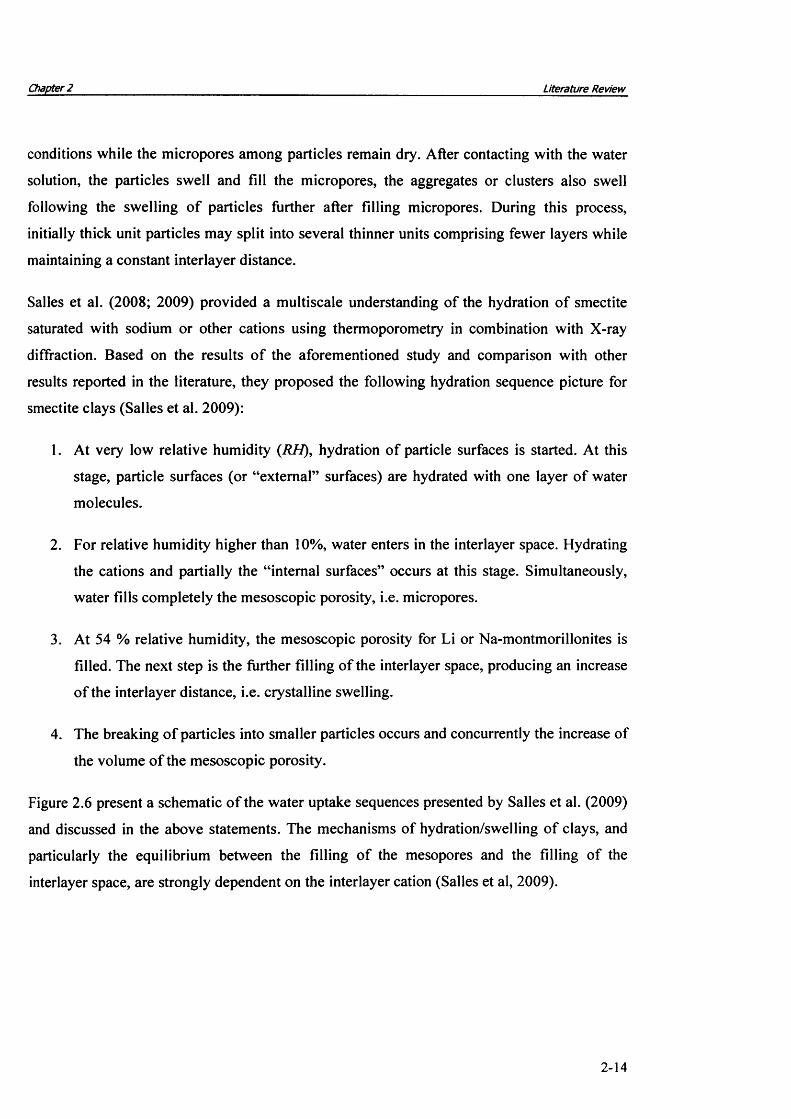
Chapter 2 Literature Review
conditions while the micropores among particles remain dry. After contacting with the water
solution, the particles swell and fill the micropores, the aggregates or clusters also swell
following the swelling o f particles further after filling micropores. During this process,
initially thick unit particles may split into several thinner units comprising fewer layers while
maintaining a constant interlayer distance.
Salles et al. (2008; 2009) provided a multiscale understanding of the hydration o f smectite
saturated with sodium or other cations using thermoporometry in combination with X-ray
diffraction. Based on the results o f the aforementioned study and comparison with other
results reported in the literature, they proposed the following hydration sequence picture for
smectite clays (Salles et al. 2009):
1. At very low relative humidity (RH), hydration o f particle surfaces is started. At this
stage, particle surfaces (or “external” surfaces) are hydrated with one layer o f water
molecules.
2. For relative humidity higher than 10%, water enters in the interlayer space. Hydrating
the cations and partially the “internal surfaces” occurs at this stage. Simultaneously,
water fills completely the mesoscopic porosity, i.e. micropores.
3. At 54 % relative humidity, the mesoscopic porosity for Li or Na-montmorillonites is
filled. The next step is the further filling of the interlayer space, producing an increase
of the interlayer distance, i.e. crystalline swelling.
4. The breaking o f particles into smaller particles occurs and concurrently the increase of
the volume o f the mesoscopic porosity.
Figure 2.6 present a schematic o f the water uptake sequences presented by Salles et al. (2009)
and discussed in the above statements. The mechanisms of hydration/swelling o f clays, and
particularly the equilibrium between the filling o f the mesopores and the filling of the
interlayer space, are strongly dependent on the interlayer cation (Salles et al, 2009).
2-14
Chapter 2 Literature Review
(a)
(b)Figure 2.6 A complete hydration sequence for sodium smectite, (a) shows different scales of fabrics
and (b) represents schematically the equilibrium condition of water at different range of relativehumidity (adopted from Salles et al., 2009)
In compacted bentonite, during the water uptake, particles expand upon the hydration into the
macropores through the formation o f diffuse layer (or gel) and occupy the macropores
gradually until full saturation o f the pores. Figure 2.7 shows the swelling o f bentonite taken
by scanning electron microscope in a controlled temperature and vapour pressure around a
sample (Komine and Ogata, 2004). Kozaki et al. (2001) and Liu et al. (2003) studied the
fabric o f compacted Na-montmorillonite and montmorillonite/silica sand mixtures before and
after hydration. The results indicated that even at full hydration, regions o f relatively high
montmorillonite density persisted in the compacted clay, indicating an incomplete breakup o f
the aggregate structure o f the dry bentonite.
RH-0%
R H < 10%
2-15
26

Chapter 2 Literature Review
(KuntgeM/1)
Before water supply
Bentonite
Under water supply
Process of filling the voids by the volume increase of bentonite
Vokis are filed up completely by the volume increase of bentonite absorbing water.
After water supply
Figure 2.7 Observation of the hydration and swelling behaviour of compacted bentonite (adoptedfrom Komine and Ogata, 2004)
2.5 Physical state of water in compacted bentonite
Studies o f the structure and dynamics o f water on the surfaces o f smectite have shown that
water molecules in the interlayer space possess different physical properties (e.g., density,
viscosity) from the free water. Interlayer water has been found to pose a different density
ranging between 700 and 1400 kg/m (Pusch et al., 1990) and a higher viscosity than bulk
water (about seven times than free water), especially for the first two layers o f attached water
(Homola et al., 1989; Yong et al., 2009). At least, in the first two molecular layers located in
the interlayer or on the external surfaces, water is structured by the exchangeable cations, and
to a lesser extent, by the smectite mineral surface. Beyond these first two molecular layers,
the properties o f surface water rapidly approach those o f bulk water (e.g. Pusch and Yong,
2006). Thermodynamically, the adsorbed water has a lower chemical potential than water
located increasingly far from the particle surface or perfectly free water. Physically, the
adsorbed water is less mobile than free water (Lu and Likos, 2004). Low and Anderson
(1958), and Zhang and Low (1995) have also shown through experimental studies that the
thermodynamic, hydrodynamic and spectroscopic properties o f water in the montmorillonite-
water system differ from those o f pure bulk water.
The water within the interlayer, combined with a small portion o f water in the micropores, i.e.
close to the particle surface, constitutes water that is relatively immobile rather than water in
the macropores, making this portion o f water a part o f solid phase (Pusch et al., 1990;
Hueckel, 1992; Hueckel et al., 2002). Therefore the interlayer pores between clay layers
2-16

Chapter 2 Literature Review
contribute very little to fluid migration, whereas the micropores and macropores are likely to
act as major fluid pathways (Pusch et al., 1990; Hueckel, 1992; Ichikawa et al., 1999). As a
result, the available pore water for movements o f water and ionic-species in compacted
bentonite is practically reduced to the pore water in intralayer/micropore between the particle
and those in the macropores. From a modelling view point, the hydrated water in the
interlayer (immobile water) is attributed to the solid phase and its transport should be
considered concurrent with the particles deformation (Hueckel, 1992).
With regards to the physical state o f water and chemical ions in compacted bentonite, three
types o f water can be identified (Bradbury and Bayenes, 2003; Bourg et al., 2003; Wersin et
al., 2004; Steefel et al., 2010), including:
• Interlayer water containing only water and cations. The cations balance the fixed
charge o f the unit layers.
• Diffuse double layer containing cations and anions. Excess amount o f cations
normally exists to balance the charge o f the clay surface.
• Bulk or free pore water. This portion is charge balanced as aqueous solutions. This
fraction o f pore water can be also regarded as the available geochemical porosity in
which the aqueous geochemical reactions take place.
Figure 2.8 shows a schematic o f different water in compacted saturated bentonite.
As mentioned previously, compaction process o f bentonite results primarily in the reduction
of macro porosity (Likos and Lu, 2006), hence by increasing dry density o f compacted
bentonite, the contribution o f interlayer porosity to the overall porosity increases. In other
words, major fraction o f the pore water in compacted bentonite is located in the interlayer
pore space and in micropores between the unit particles which is affected by the diffuse
double layer or the electrified surface reactions (Wersin et al., 2004; Pusch and Yong, 2006;
Van Loon et al., 2007; Murrinen et al., 2007). The proportion o f each kind o f above-
mentioned water depends on the compaction degree of bentonite, but also on the ionic
strength through its effect on the thickness o f the diffuse double layer (Van Loon et al., 2007).
2-17

Chapter 2 Literature Review
Pusch and HOkmark (1990) stated that for an artificial saturated Na-montmorillonite with bulk
density o f 1800 kg/m3; more than 60 % o f the water is immobile. Kozaki et al. (2001) stated
that only interlayer water can remain in compacted water saturated bentonite at dry densities
more than 1750 kg/m3. However, it has been suggested that in practice a small number o f
larger pores can exists due to the non-systematic character o f the clay fabric (Dixon et al.,
1992). Suzuki et al. (2001) estimated that the interlayer pore proportion o f Na-
montmorillonite is 61 % and 22 % for dry densities 900 and 1350 kg/m3, respectively. Sato
and Suzuki (2003) suggested that impurities (i.e. non-montmorillonite particles) may prevent
stacking o f unit layers or lamellaes from parallel association and orientating normal to the
direction o f compaction, based on observations on two bentonites with different Na-
montmorillonite purities o f 99% and approximately less than o f 50%.
1 nm o>umiai c**yPPL water dql; pamci#
i ^ te r la y e r w * h « x c h a n g e d e a fc o n *
( 2 ) c i ' X x q docfet* layer axooes positive charge
(Q) ctwge balanced external powmate*COj is#
00 enhanga0 l (fmsMKn gt tmmt* *d*J*0 g a s iw chanos V fm m )
Figure 2.8 Different types of water in compacted re-saturated bentonite (adopted from Bradbury andBayenes, 2003; Wersin et al., 2004)
Based on XRD observations o f the basal spacing o f individual layer o f Na-bentonite, Kozaki
et al. (2001) reported that only two and three hydrated water layers can be located in the
CaJcitWOuarii/F eldtpar
Doubt* toy* Fr** w*S*r(Beaton*** porewatar)
2-18

Chapter 2 Literature Review
interlayer at dry densities 1570-1760 kg/m3 and at dry densities 980-1570 kg/m3, respectively.
The contribution o f interlayer porosity to the total porosity increases with the dry density until
only interlayer pores are present for the dry densities more than 1750 kg/m3 (Kozaki et al.,
2001; Bourg et al., 2006).
k .
££©w'
TZac
0.41.2 1.6 1.80.8 1.41
Bentonite dry Density (x103 kg/m3)
Figure 2.9 Model prediction o f the volume fraction of the average interlayer porosity in saturated Na- bentonite as a function of partial montmorillonite dry density (Adopted from Bourg et al. 2006)
Bourg et al. (2006) derived a relationship between the interlayer fraction and partial dry
density o f saturated Na-bentonite for dry densities between 980 and 1750 kg/m3. The
calculation was based on the specific surface area of the clay originally presented by Kozaki
et al. (2001). In this model, two or three layers o f water have been assumed as the adsorbed
water between layers in the dry densities less than 1750 kg/m3. Figure 2.9 shows the plotted
interlayer water fraction at the different dry densities based on the proposed model by Bourg
et al. (2006). As it can be seen, more than approximately 80% of the water exists in the
interlayer space at dry densities higher than 1500 kg/m .
The structure and other properties o f adsorbed water would change with temperature resulting
in transferring the interlayer water to the macro/micro porosity under non-isothermal
conditions (Ma and Hueckel, 1993; Villar and Lloret, 2004). Accurate estimation o f the
amount of available pore water or porosity for the transport of water and chemical species is
2-19
Chapter 2 Literature Review
an important issue in order to model the hydro-geochemical behaviour o f compacted
bentonite under unsaturated and non-isothermal conditions in HLW repository.
2.6 Moisture transport and microstructure in compacted bentonite
The moisture flow in unsaturated compacted bentonite is strongly influenced by processes
taking place within the microstructure o f the clay grains during the hydration (e.g. Thomas et
al., 2003; Kr6hn, 2003). Although the general two-phase moisture flow (liquid water and
vapour) assumptions and consideration are normally applied for describing the hydraulic
behaviour o f compacted bentonite, water migration between the micro/macropores and
interlayer space due to the hydration acts as a sink or source for the pore water in a variable
suction or temperature environment. As stated previously, the water is immobilised in the
interlayer space and swell at the same time, thereby reducing the available pore space in a
constrained condition (Pusch and Yong, 2003).
Concerning the understanding o f moisture process in compacted bentonite, for some
experiments, modelling o f the moisture transport tends to over-predict the rate o f saturation.
As an example, Thomas et al. (2003) showed that the modelling of moisture transport using
traditional unsaturated hydraulic conductivity, which assumed an increase in hydraulic
conductivity with increasing water content, over-predicts the rate of saturation o f the buffer in
a full-scale experiment conducted at Atomic Energy of Canada Limited’s (AECL’s)
underground research laboratory. They found that the experimental results could be in
agreement with the numerical modelling results through modification of the hydraulic
conductivity and flow rate. The study suggested that the expansion of the microstructure of
the bentonite, as the material becomes saturated, would tend to reduce the void spaces in the
macrostructure, as the material, was constrained from overall swelling. The result in turn is
likely to reduce the material’s hydraulic conductivity.
Cui et al. (2008) presented an experimental investigation on unsaturated hydraulic
conductivity determination o f a compacted sand/bentonite mixture. Three infiltration tests
were undertaken under either constant-volume conditions or free-swell conditions. In order to
calculate the hydraulic conductivity, the total suction changes were monitored at different
locations along the soil specimen. The results under constant volume conditions indicate that
2-20

Chapter 2 Literature Review
when suction was decreasing (during infiltration), the hydraulic conductivity presented an
initial decrease followed by an increase after a certain suction value. They explained this
phenomenon by the fact that wetting under constant-volume condition reduced the volume of
macro-pore family in the soil, thus decreasing the soil permeability and when the macropores
disappeared, the suction became the only factor which drove the water flow and the hydraulic
conductivity increased with further decrease in suction. This hydraulic conductivity
corresponds to the equivalent value o f a soil having a microstructure unchanged during
wetting.
In order to consider the effects o f hydration and microstructure evolution on water transport, a
few models have been suggested in the literature. Xie et al. (2004) presented a hydro
mechanical model which included the microstructure swelling based on the diffuse double
layer theory. According to their proposed model, total porosity is divided into interlayer pores
and interparticle (macro) pores. The interlayer porosity is calculated via DDL theory with
assumption o f parallel arrangement o f plates. In order to model the moisture flow, the
intrinsic permeability variation was considered as a function of the interparticle or effective
porosity. Hence the variations o f the available porosity with chemical variations in the system
were modelled using DDL theory. However, this model assumes a variation o f the interlayer
porosity in unsaturated condition based on a power function with respect to degree of
saturation.
Krohn, (2003) provided some commentary on the variety of conceptual models and how the
flow and absorption rates may affect the micro-structure. Figure 2.10 presents the conceptual
diagrams provided by Kr5hn, (2003), on how the comparative flow and interlayer hydration
rate may affect the absorbed water content in the bentonite. The interlayer space is the
micropores where the water can be absorbed during the hydration and swelling process. In
figure 2.10 a low hydration-to-flow concept is shown (left), whereby the pores in which flow
can occur are only negligibly modified by the flow process. In fact, the rate of water exchange
between the interlayer hydration is slow. On the other hand the interlayer space has swollen
more quickly than the transport, restricting the pores available for flow (figure 2.10, right).
KrOhn, (2003) concluded that the conceptual very low hydration to flow ratio is in
contradiction to experimental observations which show that uptake of liquid water cannot be
significantly increased by applying hydraulic pressure (Pusch and Kasbohm, 2001). In other
2-21

Chapter 2 Literature Review
words, hydration occurs as a much faster process than vapour diffusion during the re
saturation and re-saturation dynamics is predominantly controlled by the vapour supply and
less by the hydration rate (KrShn, 2003). However, the experimental evidence from large
scale tests such as the Prototype Repository Project suggest that where water pressure is
maintained high saturation occurs relatively quickly and where pressure is low saturation is
not reached (Goudarzi and Johannesson, 2007), such differing responses cannot be described
purely by moisture diffusion.
vary low hydration-to-llow ratio very high hydration-to-flow ratio
solids
intci layer spaceinter! aver space
porespace
porespace
Figure 2.10 Effect o f the hydration rate on the water distribution in the bentonite (Krohn, 2003)
Vardon (2009) proposed a time dependent micro-structural modification to the unsaturated
hydraulic conductivity o f compacted bentonite. A first approximation o f a time dependent
material model for bentonite when swelling is restrained was presented. This model was
tested against small scale controlled laboratory tests under non-isothermal conditions and also
against a large-scale test. Comparable results were found in the short term to existing material
models but significantly improved qualitative and quantitative results were found in the
longer term.
2.7 Chemical diffusion in compacted bentonite
In order to predict the performance o f the compacted clay buffer in high-level radioactive
waste repository, the mechanisms by which chemicals migrate through bentonite pore water
must be understood. The transport o f chemical ions in low permeability clays and more
2-22
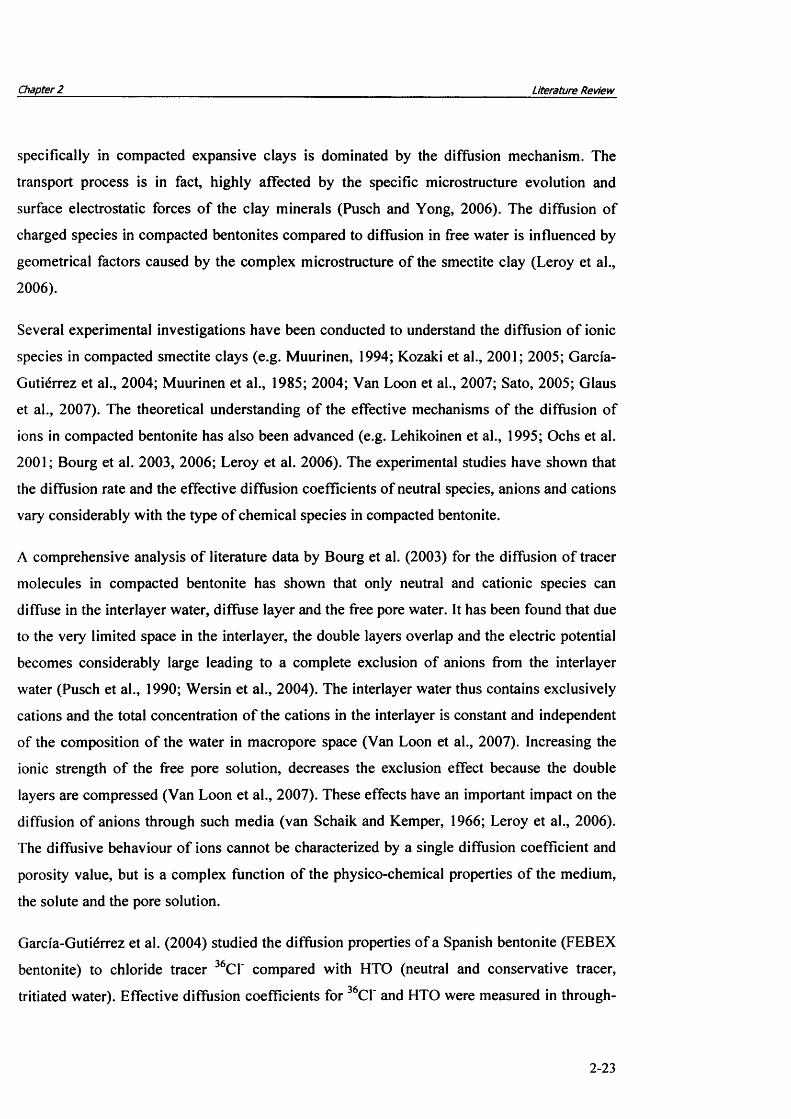
Chapter 2 Literature Review
specifically in compacted expansive clays is dominated by the diffusion mechanism. The
transport process is in fact, highly affected by the specific microstructure evolution and
surface electrostatic forces o f the clay minerals (Pusch and Yong, 2006). The diffusion of
charged species in compacted bentonites compared to diffusion in free water is influenced by
geometrical factors caused by the complex microstructure o f the smectite clay (Leroy et al.,
2006).
Several experimental investigations have been conducted to understand the diffusion o f ionic
species in compacted smectite clays (e.g. Muurinen, 1994; Kozaki et al., 2001; 2005; Garcfa-
Guti6rrez et al., 2004; Muurinen et al., 1985; 2004; Van Loon et al., 2007; Sato, 2005; Glaus
et al., 2007). The theoretical understanding o f the effective mechanisms o f the diffusion of
ions in compacted bentonite has also been advanced (e.g. Lehikoinen et al., 1995; Ochs et al.
2001; Bourg et al. 2003, 2006; Leroy et al. 2006). The experimental studies have shown that
the diffusion rate and the effective diffusion coefficients of neutral species, anions and cations
vary considerably with the type o f chemical species in compacted bentonite.
A comprehensive analysis o f literature data by Bourg et al. (2003) for the diffusion of tracer
molecules in compacted bentonite has shown that only neutral and cationic species can
diffuse in the interlayer water, diffuse layer and the free pore water. It has been found that due
to the very limited space in the interlayer, the double layers overlap and the electric potential
becomes considerably large leading to a complete exclusion of anions from the interlayer
water (Pusch et al., 1990; Wersin et al., 2004). The interlayer water thus contains exclusively
cations and the total concentration o f the cations in the interlayer is constant and independent
of the composition o f the water in macropore space (Van Loon et al., 2007). Increasing the
ionic strength o f the free pore solution, decreases the exclusion effect because the double
layers are compressed (Van Loon et al., 2007). These effects have an important impact on the
diffusion o f anions through such media (van Schaik and Kemper, 1966; Leroy et al., 2006).
The diffusive behaviour o f ions cannot be characterized by a single diffusion coefficient and
porosity value, but is a complex function o f the physico-chemical properties o f the medium,
the solute and the pore solution.
Garci'a-Guti6rrez et al. (2004) studied the diffusion properties o f a Spanish bentonite (FEBEX
bentonite) to chloride tracer 36C1' compared with HTO (neutral and conservative tracer,
tritiated water). Effective diffusion coefficients for 36Cf and HTO were measured in through-
2-23
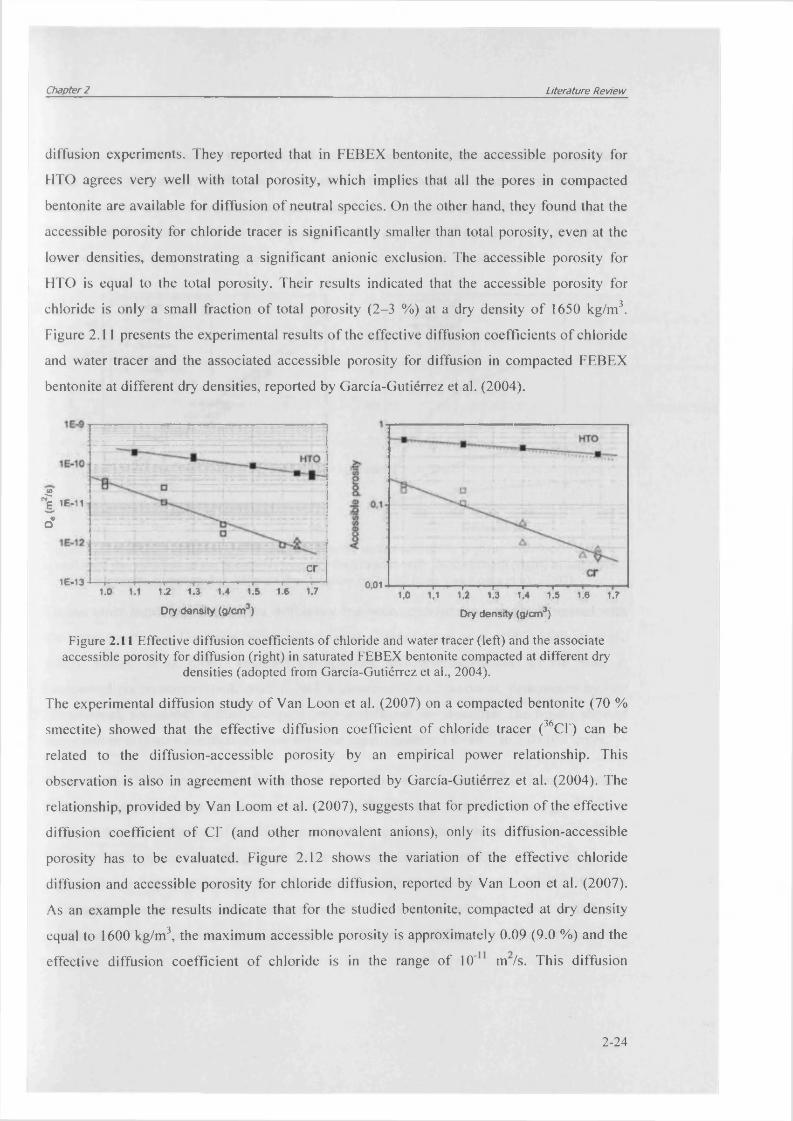
Chapter 2 Literature Review
diffusion experiments. They reported that in FEBEX bentonite, the accessible porosity for
HTO agrees very well with total porosity, which implies that all the pores in compacted
bentonite are available for diffusion o f neutral species. On the other hand, they found that the
accessible porosity for chloride tracer is significantly smaller than total porosity, even at the
lower densities, demonstrating a significant anionic exclusion. The accessible porosity for
HTO is equal to the total porosity. Their results indicated that the accessible porosity for
chloride is only a small fraction o f total porosity (2-3 %) at a dry density o f 1650 kg/m3.
Figure 2.11 presents the experimental results o f the effective diffusion coefficients o f chloride
and water tracer and the associated accessible porosity for diffusion in compacted FEBEX
bentonite at different dry densities, reported by Garcia-Gutierrez et al. (2004).
-------
Figure 2.11 Effective diffusion coefficients of chloride and water tracer (left) and the associate accessible porosity for diffusion (right) in saturated FEBEX bentonite compacted at different dry
densities (adopted from Garcia-Gutierrez et al., 2004).
crIE-13 i • . - t ..............— — ,— •— r -
1.0 1.1 12 1.3 1.4 1.5 1.6 1.7
Dry density (g/cm3)
o.oi , . , . , . . . , . , , « . ,
1,0 1,1 u 1.3 1.4 1.5 1,6 1.7
Dry density (g/cm3)
i >««o*
The experimental diffusion study o f Van Loon et al. (2007) on a compacted bentonite (70 %
smectite) showed that the effective diffusion coefficient o f chloride tracer (36C1‘) can be
related to the diffusion-accessible porosity by an empirical power relationship. This
observation is also in agreement with those reported by Garcia-Gutierrez et al. (2004). The
relationship, provided by Van Loom et al. (2007), suggests that for prediction o f the effective
diffusion coefficient o f Cl' (and other monovalent anions), only its diffusion-accessible
porosity has to be evaluated. Figure 2.12 shows the variation o f the effective chloride
diffusion and accessible porosity for chloride diffusion, reported by Van Loon et al. (2007).
As an example the results indicate that for the studied bentonite, compacted at dry density
equal to 1600 kg/m3, the maximum accessible porosity is approximately 0.09 (9.0 %) and the
effective diffusion coefficient o f chloride is in the range o f 10' m /s. This diffusion
2-24
Chapter 2____________________________________________________________________________Literature Review
coefficient is approximately 100 times less than the tracer diffusion coefficient o f chloride in
water at 25 °C (Lasaga, 1998). The composition o f the solution in contact with the surface
also affects the anion exclusion. With increasing ionic strength in the solution, the charges on
the surface are better shielded resulting in a weaker repulsion o f the anions by the charged
surface and thus leading to a lower exclusion effect (Van Loon et al., 2007).
1300- * — *-1000- • - p . U O O
• <<-1300
* *-1000
O p.1000• M«HN
Figure 2.12 Effective diffusion coefficients of chloride versus accessible porosity to chloride diffusion (left) and the variation of the accessible porosity for chloride with ionic strength (right) in saturated
bentonite compacted at different dry densities (adopted from Van Loom et al., 2007).
0 3& -
It\O Iff'*
0*
5 oi#
la-
10" OOOIlone strangffi [M|
On the other hand, higher apparent diffusivity has been reported for cations, compared with
the water tracer (e.g. Oscarson, 1994; Kozaki et al., 2005; Glaues et al., 2007; Melkior et al.,
2009). Kozaki et al. (2001) reported the apparent diffusion coefficients o f Na+ ions in
compacted Na-montmorillonite and in Na/Ca montmorillonite mixtures, determined by one
dimensional, non-steady diffusion experiments at different dry densities. The results showed
the apparent diffusion coefficients vary between approximately 1.0x1 O'10 to 2.0x10'" m2/s.
o o iGlaus et al. (2007) experimentally studied the diffusion o f sodium ( Na ) and strontium
(i5Srz+) tracers in highly compacted Na-montmorillonite (dry density =1950 kg/m3). They
reported that the diffusion o f the tracer cations through the interlayer water is the dominant
pathway in compacted swelling clays under the experimental conditions tested. They also
showed that in highly compacted smectite clays, the diffusion o f cations is related to their ion
exchange and sorption properties. Comparing different experimental results o f tracer diffusion
coefficient o f sodium with HTO diffusion coefficients in different compacted bentonite,
2-25

Chapter 2 Literature Review
Melkior et al. (2009) reported that the ratio o f the effective diffusion coefficients o f 22Na+
over HTO is greater than one and ranges between 1 and 8.
The increased diffusion o f cations has been explained either by interlayer diffusion (Bourg,
2003; Bourg et al., 2006; Glaus et al., 2007), or by diffusion in the diffuse double layer (DDL)
that surrounds the negatively charged clay surface and contains an excess o f cations (Van
Schaik and Kemper, 1966; Ochs et al., 1998; Leroy and Revil, 2004; Leroy et al., 2006;
Appelo and Wersin, 2007; Jougnot et al., 2009).
The above mentioned findings result to a conclusion that in general larger values for the
effective diffusion coefficients o f cations and smaller values for anions than those for water
tracers (neutral species) have been commonly found in the case o f compacted clays and
compacted bentonite (Bourg et al., 2003, Appelo and Wersin, 2007). Also the results of
investigations o f the diffusion o f anions and cations suggest that the accessible porosity and
the geometrical factor are likely to be different for the various tracers in compacted bentonite
Towards the realistic diffusion behaviour in compacted bentonite, different diffusion regimes
under different porosity levels are required (e.g. Appelo et al., 2010). It requires the modelling
of diffusion of ions under different rates. Since Coulombic forces act between all pairs o f ions
in an electrolyte solution, the diffusion o f a charged ion in pore water is not entirely a random
(i.e. independent) motion. In other words, when charged species are present in solution, the
motion o f one charged species will influence the transport o f another and additional physical
constraint is manifested globally due to the ion-pair forces. The macroscopic effect o f the
Coulombic forces between the ions is typically modelled by incorporation of the electrical
field (Boudreau et al., 2004). Thus, the concentration and flux o f one ion become linked to
those o f the other ions.
2.8 Diffusion under non-isothermal conditions
Due to the heat generation o f the nuclear waste, large thermal gradients will arise in the
engineered barrier system, i.e. the compacted bentonite buffer and the near field around the
repository. Temperature affects the transport process directly through thermally induced
diffusion. In addition to the direct influence o f thermal diffusion, due to the temperature
2-2 6

Chapter 2 Literature Review
dependency o f coefficients and effective factors o f transport mechanisms, it can indirectly
affect the transport process under non-isothermal conditions.
It is well established that under non-isothermal conditions, a temperature gradient can induce
mass flow due to thermal diffusion, i.e. the Soret-Ludwig effect or Soret effect (Ludwig,
1856; Soret, 1880). The Soret coefficient is defined as the ratio of the thermal diffusion
coefficient to the molecular diffusion coefficient (K 1).
Several studies have been conducted on the thermal diffusion in electrolyte solutions (e.g.
Snowdon and Turner, 1960; Leaist and Hui, 1990; Engelhardt and Macdonald, 1997).
However, few experimental investigations have been reported on the thermal diffusion in
soils, especially in the case o f compacted clays (Thornton and Seyfried, 1983; Rosanne et al.,
2003, 2006).
At ambient temperature, the Soret coefficient has been reported in the order o f 10‘3 (K 1) for
binary solutions (Snowdon and Turner, 1960; Lerman, 1979; Lasaga, 1998). Both positive
and negative values have been reported for mixed electrolytes (e.g. Leaist and Hui, 1990).0 1The absolute values o f the Soret coefficient are usually on the order of 10' ~10‘ (K- ) for
usual aqueous solutions or organic mixtures (Platten, 2006). It has been also found that the
Soret coefficient is dependent on the concentration of the solution (Leaist and Hui, 1990;
Engelhardt and Macdonald, 1997). Negative Soret coefficients have also been reported, but
are usually small in magnitude (Leaist and Hui, 1990)
Thornton and Seyfried (1983) reported an average value of around 4x10‘3 (K’1) for multiple
ionic water in sea sediments. However, their experimental results on the thermal diffusion in
sediment-sea water system indicated the different values of the Soret coefficients for different
ions in the range o f 10‘3 (K 1). Rosanne et al. (2003, 2006) also reported an experimental
comparison on thermal diffusion o f NaCl solution in glass powder, mica and argillite clay.
They found that the Soret coefficients for mica and glass powder are very close to the values
reported for the Soret coefficient of NaCl in water. However, the values corresponding to the
argillite clay was found to be five times larger than the value in free water, attributing to the
electrostatic interaction with clay surfaces (Rosanne et al., 2006). The results o f non
isothermal diffusion experiment by Rosanne et al. (2003, 2006) show that the solute transfer
2 -27

Chapter 2 Literature Review
is enhanced by thermal diffusion and the Soret coefficients range between 5x10 3 and
1.3xiO"2 (K'*).
It is noted that in addition to the direct mass flux due to the thermal diffusion, temperature has
an influence on the molecular diffusion and the effective diffusion coefficient. This
phenomenon in aqueous systems has been well studied and established in the literature. In
general, the self/tracer diffusion in pure solvent can be related to temperature using the
Stokes-Einstien definition for self diffusion (e.g. Robinson and Stokes, 1059; Cussler, 1995).
At variable temperature but fixed composition and pressure, self or tracer diffusion coefficient
of ions in pure solution can be extrapolated from one to another temperature based on Stokes-
Einstein relationship. The variation o f diffusion coefficient through this relationship is more
affected by the changes due to the viscosity dependency on temperature rather than due to the
direct temperature variation (Cussler, 1995; Oelkers, 1996).
2.9 Experimental studies on the coupled thermal, hydraulic, chemical and mechanical behaviour of compacted bentonite
A number of experimental investigations have been reported on the coupled physical,
chemical/geochemical and/or mechanical (i.e. THCM) behaviour and processes in compacted
bentonite under repository conditions. The investigations have been conducted mostly at
laboratory scale (e.g. Villar et al., 1996; Cuevas et al., 1997, 2002; Martin et al., 2000;
ENRESA, 2000; ENRESA, 2006; Singh, 2007; Villar et al., 2008a; Villar et al., 2008b;
Gomez-Espina and Villar, 2010; Fernandez and Villar, 2010) and some in mock-up and large
scale under FEBEX project (e.g. ENRESA, 2000; 2006). Most of the experimental studies on
THCM behaviour o f compacted bentonite has been carried out as part o f a major research
study in the framework o f FEBEX project (ENRESA, 2000, ENRESA, 2006). FEBEX
project has aimed to study the transient state o f the near field for a high level radioactive
waste repository in crystalline rock according to the Spanish Reference Concept (ENRESA,
1995). In this disposal concept the canisters enclosing the conditioned waste are placed
horizontally in drifts and surrounded by a clay barrier constructed of highly compacted
bentonite blocks. The experimental work o f the FEBEX project consisted o f three main parts
including an in situ test under natural conditions and at full scale (Grimsel, Switzerland); a
2-28
Chapter 2 Literature Review
mock-up test at almost full scale (CIEMAT, Madrid); and a series of laboratory tests to
complement the information from the two large-scale tests. Under FEBEX project, an
extensive laboratory tests has been conducted to complement the information and obtain
information on the thermal, hydraulic and geochemical processes in the bentonite buffer
(ENRESA, 2000, ENRESA, 2006).
The results o f these experiments have helped to improve the understanding o f the behaviour
of compacted bentonite under coupled THCM conditions and to identify the major processes
affecting the hydro-geochemical behaviour o f clay buffers under non-isothermal conditions of
the repository. In addition, the results have been used for development and calibration o f the
computational tools for further applications in long term assessment analysis. In the
following, a review on the recent laboratory tests conducted on coupled THCM processes on
compacted bentonite is presented.
In order to investigate changes in pore water chemistry of compacted bentonite resulting from
simultaneous heating and hydration, Villar et al. (1996) and Cuevas et al. (1997) carried out
an experiment on FEBEX bentonite compacted at dry density o f approximately 1620 kg/m3.
The bentonite sample (diameter o f 150 mm and height o f 146 mm) was heated at the top at
constant 100 °C. At the bottom, deionized water was supplied for hydration. The test lasted
for 2619 hours. They reported the distribution o f the final water content and the geochemistry
and pore water composition. A redistribution o f salts was observed which was explained by
the advection as water comes in, convection near the heater and diffusion due to concentration
gradients. The results suggested that the electrostatic repulsion on clay surfaces seemed to
reduce the mobility o f sulphate ions with respect to chloride. The thermal gradient also
affected the distribution of the exchangeable cations.
As part of the FEBEX project, Cuevas et al. (2002) carried out a thermo-hydraulic experiment
on bentonite compacted at dry density o f 1650 kg/m3. The main objective o f this work was to
simulate the transport behaviour o f major soluble ions under the influence o f opposing
thermo-hydraulic gradients. The specimen was 0.025 m long and 0.05 m in diameter. Water
was injected under a pressure o f 1.1 MPa at the top of the cell. Two different thermal
gradients were examined, in order to ascertain the effect of temperature in the observed
processes. These include a high-temperature gradient, between 100 and 60 °C (16 °C/cm) to
simulate regions closer to the container, and a low-temperature gradient, between 60 and 35
2-29
Chapter 2 Literature Review
°C (10 °C/cm), to simulate zones near the host rock. The hydration processes was simulated
by using two types o f water, including granitic water to simulate the conditions of the outer
part of the barrier and saline water, which simulates the situation in the internal part o f the
barrier where water is loaded with the ionic species dissolved during its inward movement.
The experiments have been conducted for short periods o f 10-16 days. The results o f the
experiment indicated that the advective transport o f ions from the cold end toward the hot end
during the initial stages o f experiment controlled the behaviour of major dissolved ions. As a
consequence, ionic concentrations were built up at the hot end. Chemicals were also reported
to be transferred backward by diffusion mechanism from the hot end toward the cold end
during the saturation phase. While chloride ions showed conservative behaviour, the
remaining major soluble ions were influenced by precipitation-dissolution and ion exchange
reactions. The short-distance/short-time scales o f these experiments accelerated saturation and
ion transport phenomena, which may have hidden the long-term alteration produced during
the high temperature/low water content transient period near the heater.
G6mez-Espina and Villar (2010) conducted a thermo-hydraulic test on compacted MX-80
bentonite (dry density 1720 kg/m3 with an initial water content of 16%. The experiment has
been part o f the Temperature Buffer Test (TBT) project, which is a full-scale test for HLW
disposal that aims at improving the current understanding of the thermo-hydro-mechanical
(THM) behaviour o f buffers with a temperature around and above 100 °C during the water
saturation transient. The test was performed in a cylindrical cell with internal diameter o f 70
mm and sample length o f 200 mm. The compacted bentonite sample was subjected to a
simultaneous heating and hydration at opposite ends for a period o f 496 days. A constant
temperature was applied at the bottom and top of the specimen equal to 140 °C and at 30 °C,
respectively. Deionised water was injected on top at relatively low pressure equal to 0.01
MPa. The water uptake and distribution o f water content and dry density along the bentonite
were conditioned by the thermal gradient. In terms of moisture transport, the results of
G6mez-Espina and Villar (2010) indicated that water did not penetrate into the column
beyond the area in which the temperature was higher than 100 °C. A convection area was
found to be formed in the hydrated region where the liquid water and dissolved ions has
transferred by advection towards the heater. As the water reached the area with high
temperature, it evaporated which resulted in precipitation of minerals in the region close to
the heater. The composition o f the pore water along the column was shown to be affected by
2-30

Chapter 2 Literature Review
advection, interlayer exchange and dissolution/precipitation processes. Thenardite (anhydrous
sodium sulphate mineral), calcite and dolomite were the mineral phases controlling the
concentration o f the main ions in the pore water, in addition to halite near the heater. The
cation content o f the pore water was conditioned by the changes in the smectite interlayer,
since exchangeable monovalent cations (especially sodium) were replaced by divalent cations
(especially calcium), except in the coldest zone. In addition, near the heater the number of
equivalent positions in the smectite interlayer decreased. The thermal and hydraulic treatment
did not cause significant changes in the smectite or the other mineral phases content o f the
bentonite (G6mez-Espina and Villar, 2010).
Among the laboratory tests started in the framework o f the FEBEX project and continued in
the NF-PRO project, a series of experiments were performed under conditions in which
compacted bentonite was subjected simultaneously to heating and hydration, in opposite
directions and similar to the condition o f the clay barrier in the repository. In particular, a
series o f long term laboratory experiments were conducted under heating and hydration
conditions on a 600 mm (length) and 70 mm (diameter) cylindrical compacted FEBEX
bentonite reported by Villar et al. (2007); Villar et al. (2008a); Villar et al. (2008b) and
Femdndez and Villar (2010). At the bottom part o f the cells a constant temperature of 100 °C
was maintained. On top o f the cell temperature was controlled and fixed at room temperature
(20-30 °C) using a circulation water tank. The granitic water was injected through the upper
surface under a pressure o f 1.2 MPa. Villar et al. (2008a) and Fernandez and Villar (2010)
reported the results o f seven tests performed in the mentioned cells which included 0.5, 1, 2
and 7.6 years lasting experiments under the mentioned conditions. At the end o f each test, the
cell was disassembled and geochemistry o f the bentonite and pore fluid composition was
studied through a series o f post-mortem geochemical laboratory analysis. The results of
hydraulic and geochemical behaviour were reported by Villar et al. (2008b) and Fernandez
and Villar (2010). The results indicated that after 7.6 years, no significant mineralogical
alteration o f the montmorilIonite was observed. However, as a consequence of the hydration
and o f the heating, two types o f processes occurred along the bentonite column. In the coldest
zones, the hydration o f the bentonite diluted the bentonite-pore water and caused the
dissolution o f highly soluble accessory minerals, such as sulfates and carbonates. Chloride
moved with the hydration water towards the hottest zone as a conservative anion by
advection-diffusion affected by anion exclusion. The dissolution of sulfates and carbonates
2-31
Chapter 2 Literature Review
with the hydration water caused changes to the composition o f the exchangeable ions in the
interlayer.
Singh (2007) studied the heat and mass movement in compacted MX-80 bentonite and
Speswhite kaolin. Non-isothermal tests were carried out, with and without applied hydraulic
gradients. The specimens were compacted to a dry density of 1600 kg/m3 with different initial
water contents providing specimens with the diameter o f 100 mm and height o f the 100 mm.
The temperature at the bottom of the cell was maintained at 85 °C by a circular heater. At top
of the specimen the temperature was controlled at 25 °C by circulating water from a water
bath at constant temperature. Distilled water was injected at 600 kPa pressure. The
temperature and relative humidity was monitored in-situ along the depth o f the specimen. A
series o f post-mortem analysis was also conducted to obtain the variation o f the pore fluid
composition in the column. The results showed the gravimetric moisture content decreased
near the hot end when the temperature gradient was applied due to moisture movement in
vapour phase away from the hot region to the cold region. The amount o f drying was found to
be dependent on the initial moisture content. The dry sample had higher drying compared to
the wet sample. The accumulation o f ions including chloride, nitrate and sulphate near the
cold end indicated that the liquid moisture moves towards the hot end from the colder region.
The FEBEX in situ test was performed in a gallery excavated in granite in the northern zone
of the Grimsel underground laboratory operated by NAGRA in Switzerland. The test includes
the heating system, the bentonite barrier and instrumentation, monitoring and control systems.
The drift is 70.4 m long and 2.28 m in diameter. The test zone is located in the last 17.4 m of
the drift where heaters, bentonite and instrumentation were installed. The test zone was sealed
with a concrete plug. The main elements o f the heating system are two heaters (1 and 2),
separated horizontally by 1 m, which simulate full-sized canisters. Heaters are designed to
maintain a maximum temperature o f 100 °C at the steel liner/ bentonite interface. The in situ
test began in February 1997 and the Heater 1 was switched-off in February 2002. Dismantling
of heater 1 was performed from May to September 2002. A comprehensive post-mortem
bentonite sampling and analysis program was designed to characterize solid and liquid
phases, measure physical and chemical changes induced by the combined effect o f heating
and hydration; and test THM and THC models (ENRESA, 2006).
2-32

Chapter 2 Literature Review
The experimental programmes and the achieved results reported have assisted to improve
understanding of the major hydraulic and chemical transport and reactions in compacted
bentonite under similar conditions to the compacted buffer in HLW repository conditions.
They have provided valuable information about the major physical and chemical processes,
and the response o f the bentonite and the trends o f variations in longer periods which have
been adopted to validate or calibrate the computational models. However, the results of these
studies all are limited to relatively short periods of time compared with the long term
exposure o f the buffer to thermo-hydro-geochemical effects.
2.10 Computational studies on the coupled thermal, hydraulic, chemical and mechanical behaviour of compacted bentonite
A number o f coupled thermal, hydraulic, geochemical (and mechanical) computational
simulation studies have been presented on the behaviour of compacted bentonite as the buffer
candidate for the HLW disposal. The majority o f these modelling studies have been based on
the available experimentations on THCM behaviour of compacted bentonite and in order to
calibrate and illustrate the capabilities o f the models. However, the short- and long-term
THCM behaviour o f the compacted bentonite and the engineered barrier systems have also
been the subject o f several numerical modelling investigations. A review on some o f the
recent numerical modelling studies reported on the coupled THCM behaviour o f compacted
bentonite is presented below.
Under the FEBEX project, a coupled thermal, hydraulic, geochemical and mechanical model,
FADES-CORE-LE was presented (ENRESA, 2000). The model is an extension to the existing
model, TRANQUI (Xu et al., 1999). The chemical reactions assume local equilibrium
approach and share an extensive thermodynamic database taken from the EQ3/6 geochemical
code. Chemical processes which can be modelled include homogeneous (e.g. speciation, acid-
base and redox) and heterogeneous reactions (e.g. mineral dissolution and precipitation,
adsorption, ion exchange, gas solution-exsolution). The model also considers radioactive
decay processes. However, the model is limited to two-dimensional domains. In this model
deformation variable is also coupled with moisture, heat and chemical flow equations. This
model is able to handle various geochemical reactions. This model was specifically
2-33
Chapter 2 Literature Review
developed to simulate small to large-scale experiments carried out as part o f FEBEX project
to assess the long-term behaviour o f bentonite clay barriers in the deep nuclear waste
repositories.
A numerical simulation o f the coupled THCM behaviour of compacted bentonite was
presented by Xie et al. (2006) based on the laboratory scale of simultaneous heating and
hydration experiment reported by Cuevas et al. (1997). In this study, a two-phase and non-
isothermal multi-species reactive transport model was developed and implemented in the
object-oriented and process-oriented simulator GeoSys/RockFlow. Geochemical reactions
were incorporated by coupling o f GeoSys/RockFlow to the geochemistry code PHREEQC2.
The reactive transport modelling included heat transport, two-phase flow, multicomponent
transport and geochemical reactions in the liquid phase, i.e. ion exchange, mineral
dissolution/precipitation under equilibrium reactions. The simulation results showed good
agreement with those reported from experimental investigations. It was observed that during
the experiment the highly soluble minerals like calcite, halite and gypsum strongly
determined the pore water chemistry. In terms o f moisture transfer, the model presented by
Xie et al. (2006) incorporated the effects of interlayer/microscopic swelling under constrained
condition on the flow o f water based on the approach proposed by Xie et al. (2003). In this
approach the effective permeability is modified via the swelling of the interlayer and
microstructure based on a DDL calculation. In the simulations, it was shown that swelling
significantly slows down the saturation process, because swelling reduces the porosity in the
bentonite sample.
Seetharam (2003); Seetharam et al. (2006) and Cleall et al. (2007) presented a numerical
simulation o f coupled THCM behaviour of a small scale heating and hydration laboratory test
on compacted FEBEX bentonite, reported by Cuevas et al. (2002). This was achieved via the
application o f a numerical model, COMPASS, which implements a fully coupled THCM
formulation for unsaturated soils, including certain aspects of geochemical reactions by
linking geochemical model M1NTEQA2 (Allison et al., 1991). The simulation consisted of a
25 mm compacted bentonite under a temperature gradient o f 10 °C/cm. Granitic water was
injected at the pressure o f 1.2 MPa from the cold side similar to the conditions presented by
Cuevas et al. (2002). The major concern on this numerical modelling has been on the
capabilities of the model. The reactive transport o f major ionic species in compacted bentonite
2-34

Chapter 2 Literature Review
was simulated under thermo-hydraulic conditions o f the experiment. In terms of heat and
moisture transfer, good correlation was observed between the experimental and numerical
modelling results. For all ions, the model showed a good qualitative and a reasonable
quantitative agreement with respect to the experimental results. However, an overestimation
of ion concentration at the hot end and underestimation at the hydration end for all the ions
was observed. The model also predicted the final concentration of the exchange complex to be
close to that of the initial values correlating well with the experimental observations. The
precipitation/dissolution o f trace minerals (calcite, dolomite, anhydrite and halite) under
equilibrium condition has been considered in this study. The model presented, was not
capable to simulate the chemical reactions under kinetically controlled condition. In this
simulation an elastic model was assumed and acceptable trends in porosity variations was
observed. Further applications o f the developed numerical model and capabilities for
simulation o f coupled THCM behaviour were also presented by Seetharam et al. (2007).
Guimanies et al. (2007) presented a numerical simulation by coupling the reactive transport o f
chemicals with an existing THM model, developed by Olivella et al. (1994). Special attention
has been given to phenomena likely to be encountered in clay barriers used as part of
containment systems o f nuclear waste. In the model, the total analytical concentrations
(including precipitated minerals) are adopted as basic transport variables and chemical
equilibrium is achieved by minimizing Gibbs free energy. As regards to
precipitation/dissolution, both equilibrium and kinetic models are included. To evaluate the
capabilities o f the model, a simulation o f a compacted bentonite under simultaneous hydration
and heating was presented by Guimanies et al. (2007). The simulation was based on the
experimental study presented by Cuevas et al. (1997) on simultaneous heating and hydration
as presented previously. In addition, an example of application of the developed numerical
model was also briefly described by Guimanies et al. (2006) which involved the simulation of
a case o f a large-scale in situ heating test o f that simulates the conditions o f a repository for
high-level nuclear waste (ENRESA, 2000).
A numerical THC model o f FEBEX in situ test was presented by Samper et al. (2008). THC
predictions o f the in situ test have been performed with INVERSE-FADES-CORE code. THC
predicted concentrations systematically overestimated measured values near the heater and
showed gradients sharper than those o f measured data. They suggested that the discrepancy
2-35

Chapter 2 Literature Review
could be overcome by considering bentonite swelling/shrinking and improving the estimate of
water evaporation at heater-bentonite interface. Preliminary results from a coupled THCM
model o f a heating and hydration experiment on FEBEX bentonite indicated that geochemical
results improve when changes in porosity caused by swelling are considered. The
observations from the numerical simulation indicated that the spatial distribution o f the
chloride ions is the result o f the combined effects due to the pore water evaporation near the
heater, water condensation some distance away from heater, dilution due to inflow of granitic
groundwater, advective displacement o f the hydration front, and the solute diffusion which
tends to dissipate solute gradients (Samper et al., 2008).
Yang et al., (2008) conducted a numerical simulation of coupled saturated/ unsaturated water
flow, heat transfer and multi-component reactive solute transport to evaluate the long-term
geochemical evolution in bentonite, concrete and clay formation for a potential geological
radioactive waste repository. The model consisted of a bentonite buffer having a thickness of
0.75 m, a concrete sustainment (0.20 m in thickness) and the clay formation with a thickness
of about 24 m. Simulations were carried out with a general-purpose multicomponent reactive
transport code, CORE2D V4 for a period of one million years. Changes in formation porosity
caused by mineral dissolution/precipitation reactions were taken into account. The focus of
this simulation was on evaluating the trends o f long-term geochemical evolution in a potential
repository due to interactions o f pore water and solid phases. In terms o f moisture transfer, the
bentonite buffer becomes fully saturated in a short period of 20 years. The results o f the
numerical simulation indicated that dissolution o f calcium silicate hydrate (C-S-H or CaO-
SiC>2-H20) in concrete causes an increase in pH from neutral to up to 13 in bentonite buffer
during the whole time period. After CSH minerals in the concrete are exhausted, pH starts to
decrease in the whole system. In addition, mineral precipitation can reduce the pore space in
the bentonite close to the bentonite-concrete interface due to diffusion of a hyper-alkaline
plume from the concrete.
Arcos et al. (2008) presented a series o f numerical simulations on the long-term geochemical
evolution o f bentonite and its pore water in the evolving geochemical environment due to
climate change. The bentonite buffer in the KBS-3 underground nuclear waste repository
concept designed by the Swedish Nuclear Fuel and Waste Management Co. (SKB) has been
the subject of this study. The simulations were conducted by using PHAST v.1.2 (Parkhurst et
2-36

Chapter 2 Literature Review
al., 2004), which is the result of coupling a transport code, HST3D, and a geochemical code,
PHREEQC (Parkhurst and Appelo, 1999). One simulation focused on the modelling o f the
thermal stage (i.e. 1000 years) whilst another two series of simulations were used to model
the average interglacial period (i.e. 60,000 years). The influence of changes in climate has
been tested using three different waters interacting with the bentonite: present-day
groundwater, water derived from ice melting, and deep-seated brine. The model domain
included a bentonite buffer barrier surrounding the copper canisters and the iron insert where
spent nuclear fuel will be placed. The results from the simulations indicated that pore water
chemistry is controlled by the equilibrium with the accessory minerals, especially carbonates.
pH is buffered by precipitation/dissolution o f calcite and dolomite, when present. The
interaction o f granitic groundwater with the bentonite blocks has minor effects on the
chemical evolution o f the pore water. In contrast, the intrusion of ice-melting water, which
can be very dilute but alkaline (pH=9.6), modifies substantially the composition o f pore water
and bentonite. Due to the effect o f a thermal gradient on the bentonite behaviour, the
modelling results showed a redistribution o f accessory minerals (anhydrite and silica) and
cation exchange occupancy in accordance with what has been observed in large-scale
experiments and natural analogues.
Computational modelling investigations have shown that temperature has a profound effect
on hydraulic and chemical behaviour o f compacted bentonite. In addition, although a very
small percentage o f commercially available bentonite consists of accessory minerals such as
gypsum and calcite, these minerals have shown a considerable impact on the pore fluid
composition under the heating and hydraulic conditions. In general, the results of the
computational modelling for the re-saturation or long term performance o f the compacted clay
buffer indicate important developments in the capabilities of the models, although most of the
modelling studies and developed models have some limitations in terms o f the processes
considered or the degree o f coupling THCM behaviour.
2-37
Chapter 2 Literature Review
2.11 Computational schemes and developments in modelling of the reactive transport of multicomponent chemicals
A variety of computational models and codes has been developed during the last three
decades for simulating chemical transport in combination with biogeochemical reactions. The
capabilities of the models for the reactive transport of chemicals have been advanced using
the developments to the theory and computational aspects both in the area of transport
processes and geochemical reactions. Seetharam (2003) presented a comprehensive review of
developments in the reactive transport models by that time; hence it is not repeated here.
For any given reactive transport model, there are two main numerical strategies that require
attention. Firstly, numerical schemes are required to solve the partial differential equations of
transport processes and the non-linear algebraic or partial differential equations representing
the equilibrium or kinetically controlled chemical reactions, respectively. Secondly, a method
is required by which the governing equations for transport process and chemical reactions are
coupled in an efficient manner. In this section, a review on the background and developments
to methods for solving transport and reaction equations are presented.
Several methods have been proposed for solving the coupled transport and reaction equations,
e.g. direct substitution approach (DSA); the mixed differential equation and algebraic
equations (DAE), sequential iterative approach (SIA), sequentially non-iterative approach
(SNIA) and sequentially partly-iterative approach (SPIA) (Samper et al., 2009). The main
proposed and applied computational schemes for solving coupled transport and reaction
governing equations can be categorised into (Steefel and MacQuarrie, 1996):
• Global implicit method, One-step or Direct Substitution Approach (DSA): in this
method the governing equations including both transport and reaction terms are solved
simultaneously which leads to a fully coupled system of equations. The chemical
equations are substituted into the transport equations and it is solved applying the
Newton-Raphson method.
• Operator splitting technique, where the calculation for transport and reaction
equations is decoupled and the partial differential equation for chemical transport and
chemical reactions are solved sequentially. The sequential approaches including SIA,
SNIA and SPIA are among the proposed approaches in this category
2-38

Chapter 2 Literature Review
In the DSA method, the non-linear chemical equations are directly substituted into the
hydrological transport equations and the resulting sets of non-linear partial differential
equations are solved simultaneously using the Newton-Raphson method (Saaltink et al.,
2001).
In the case o f sequential iterative approach (SIA), the transport equations are solved first, then
using the results obtained from the transport step, values of chemical concentrations are
corrected. This procedure is repeated for every iteration within a time step.
Sequential non-iterative approach (SNIA) is a special case of SIA where the chemical
equations are solved only once per time-step, i.e., after the transport step has achieved
converged results (Walter et al., 1994). A modified version of SNIA scheme, known as the
Strang splitting method (Strang, 1968; Zysset and Stauffer, 1994) has also been proposed that
involves centring the reaction step between two transport steps. In this method analysing
time-step is divided into two equal steps, where transport equation is solved for the first half
time-step. Then the equations for chemical reactions are calculated, followed by repeating the
second half time-step transport calculation.
This has been suggested to improve the accuracy of SNIA method. Recently proposed,
sequential partly iterative approach (SPIA) is an improved sequential technique (Samper et al.
2009). In this method after solving the transport equations, at a given time step, chemical
calculations are performed only at the nodes not satisfying a prescribed partly iterative
tolerance. In other words, iteration between transport and chemical equations is required only
in nodes where there is a large mass transfer between the solid and liquid phases (Samper et
al. 2009).
In the computational codes, presented for the modelling of reactive transport o f multiple
chemicals under variable saturation and temperature (and deformation) conditions, different
schemes o f solving the governing equations for the transport and chemical reactions have
been adopted to utilize the advancements in geochemical modelling and in THM models.
Table 2.1 presents a summary o f the coupling schemes adopted for solving the transport and
reaction formulations in some o f the reactive transport models.
2-39
Chapter 2 Literature Review
In general, the global implicit method provides more accurate results than operator splitting
methods but it requires excessive CPU memory and CPU time (Yeh and Tripathy, 1989;
Steefel and MacQuarrie, 1996; Saaltink et al., 2000; MacQuarrie and Mayer, 2005). In
particular, in the case of two and three dimensional problems, using DSA and DAE
approaches, the solution requires excessive CPU memory and CPU time (Yeh and Tripathy,
1989).
In a comparison study between different coupling schemes including DSA, SIA and SNIA,
Steefel and MacQuarrie (1996) concluded that in the case of multiphase and multicomponent
systems, using global implicit method becomes considerably difficult due to the size o f the
required matrix for coupling and enlargement o f sets of non-linear equations which must be
solved. Saaltink et al. (2001) also examined the efficiency and accuracy o f DSA and SIA.
They showed that SIA particularly gives problems for cases with high kinetic rates and cases
with a high number o f flushed pore volumes. On the other hand, the DSA computational
behaviour is less affected by kinetics or large flushing rates than the SIA. Although DSA can
be applied to solve all coupled reactive transport problems, the SIA is faster and requires less
computer memory for large grids and it is computationally a more efficient approach (Steefel
and MacQuarrie, 1996; Samper et al., 2009).
Steefel and MacQuarrie (1996) compared the results of simulations in simple cases using
different sequential coupling methods. They reported that SIA sometimes gives the smallest
error to CPU time ratio, although in other cases, SNIA is more efficient. However, the
accuracy of SNIA is highly dependent on space and time discretisation and the type of
chemical reactions. Xu et al. (1999) also employed SNIA in addition to SIA method and
compared the accuracy and numerical performance of using several test cases. They
demonstrated for a specific case that SNIA is more efficient and requires less CPU time.
However, numerical dispersion was noticed and the accuracy also reduced. Therefore they
concluded that there is no clear proof that SNIA is better than SIA, and it mainly depends on
the choice of the chemical reactions and also on the time and space discretisation. Samper et
al. (2009) showed that numerically SNIA is two to three times more efficient than SIA.
2-40

Chapter 2 Literature Review
Table 2.1 Coupling schemes for transport and reaction models in some of the models/codes developedfor reactive transport modelling
M odel/C ode R eferen ce DSA SIA SNIA S tran g SPIA
PHREEQM Appelo and Willemsen (1987) X
DYNAMIX Liu and Narasimhan (1989) X
HYDROGEOCHEM Yeh and Tripathy (1991) X
MST1D Engesgaard and Kipp (1992) X
UNSATCHEM SimQnek and Suarez (1994) X
CRUNCH Steefel and Yabusaki (1995) X X
TOUGH2 White (1995) X
ARASE Grindrod and Takase(1996) X
TBS Schafer et al. (1998) X
FEREACT Tebes-Stevens et al. (1998) X
MIN3KIN Wernberg (1998) X X
TRANQUI Xu et al. (1999) X X
MINTRAN Walter et al. (1994) X
DIAPHORE Le Gallo e ta l. (1998) X
CHEMFRONTS Baverman et al. (1999) X
PHREEQC2 Appelo and Parkhaust (1999) X
CORE 2D Samper et al. (2000) X X
PHT3D Prommer (2002) X
COMPASS Seetharam (2003) X X
CORE 2D V4 Samper et al. (2009) X X X
GeoSysBRNS Centler et al. (2010) X
THOUGHREACT Xu et al. (2004) X X
SNIA solutions are less accurate and exhibit more numerical dispersion than SIA solutions.
SNIA errors increase with increasing Peclet and Courant numbers. Relative error ranges from
1.3 to 5 % on average, although it may reach locally very large values. The Peclet number
also affects the magnitude o f the differences, although its effect is much smaller than that o f
2-41

Chapter 2 Literature Review
the Courant number. In order to minimize the errors with SNIA, the time step should be
limited to the values in which chemical species are not transported by advection fasther than a
single cell in one time step. This may restrict the simulation to the use o f prohibitively small
time steps. It should be mentioned that the sequential iteration approach (SIA), in theory,
solves this problem. However, it has not been clearly demonstrated that this method provides
a robust solution method for advective transports (MacQuarrie and Mayer, 2005).
The interest in the recent developed reactive transport models has been mainly on coupling
transport of THM models with well established and advanced geochemical models such as
MINTEQA2 or PHREEQC. Some the recent models proposed as a linked transport and
reaction models are as follows:
Prommer (2002) presented a computer code PHT3D for general reactive transport
calculations, coupling MODFLOW/MT3DMS for transport and PHREEQC version 2 for
chemical reactions. The model uses a sequential non-iterative approach where the transport
processes are calculated during a time step, an input file is written for PHREEQC for
calculating reactions such as ion exchange and precipitation or dissolution o f minerals, and
these steps are repeated for subsequent time steps until finished.
Seetharam (2003) presented a coupled THCM model (COMPASS) in which the geochemical
reactions are calculated via linking with geochemical equilibrium model (MINTEQA2)
presented by Allison et al., (1991). This model is capable of modelling the reactive transport
of multicomponent chemicals. Only equilibrium geochemical reaction can be calculated in
this model. Apart from modelling the processes under coupled THCM framework, both SIA
and SNIA have been adopted in this model. This capability can be used in the cases where
uncertainty o f the accuracy o f SIA and SNIA exists; hence the modelling can be performed
under both coupling schemes for comparison.
The reactive transport code, HP1 was presented by Jacques and Simunek (2005) for
modelling reactive transport and biogeochemical processes in variably-saturated porous
media. HP1 results from coupling the water and solute transport model HYDRUS-1D
(Simunek et al., 2008) and PHREEQC version 2 (Parkhurst and Appelo, 1999). HP1 provides
most of the features and capabilities o f the HYDRUS-1D and PHREEQC programs into a
single numerical simulator by using a sequential non-iterative coupling scheme. The HP1 is
2-42

Chapter 2 Literature Review
capable to model the transient water flow in variably-saturated media, transport o f multiple
components, mixed equilibrium/kinetic biogeochemical reactions, and heat transport.
However, the capability o f modelling the transport processes is limited to the one dimensional
analyses. Wissmeier and Barry (2008) presented a one-dimensional flow and solute transport
model in the unsaturated medium by implementing the moisture-based form of Richard’s
equation into the geochemical modelling framework PHREEQC. A second-order, cell-
centred, explicit finite difference scheme was employed for the numerical solution of the
partial differential equations of flow and transport. Geochemical reactions were coupled to
transport processes by non-iterative sequential operator splitting. The scheme is currently
limited to cases where changes in physical fluid properties and hydraulic flow characteristics
due to geochemical reactions are negligible. The model has got all geochemical capabilities of
PHREEQC including complex aqueous speciation, cation exchange, equilibrium phase
dissolution and precipitation, formation o f solid solutions, redox reactions, gas phase
exchange, surface adsorption considering electrostatics and kinetic reactions.
Centler et al. (2010) provided a reactive transport code by coupling o f Biogeochemical
Reaction Network Simulator (BRNS) to the flow and transport simulator GeoSys/RockFlow.
The Biogeochemical Reaction Network Simulator (BRNS) contains a solver for kinetically and
thermodynamically constrained biogeochemical reactions, and GeoSys/RockFlow, a
multidimensional finite element subsurface flow and transport simulator. The coupling
scheme is based on an operator splitting scheme.
From the above review it can be seen that various coupling schemes have been suggested to
solve the governing equations for chemical transport and reactions or to link transport and
reaction models. These schemes have been successfully applied and verified in various
models. It is noted that the computational performance and efficiencies o f the various
suggested coupling schemes are basically affected by the type of the transport problems and
the degree of complexity in geochemical reactions.
2.12 Conclusions
This chapter presents a selected review on the hydraulic and chemical behaviour of
compacted bentonite including the effects due to the microstructure evolution. Recent
2-43
Chapter 2 Literature Review
developments in the experimentation and modelling studies o f the coupled THCM behaviour
of compacted bentonite under thermo-hydraulic conditions of the buffer in HLW repository
were presented. Furthermore recent developed models of the reactive transport of chemicals
in porous media and the computational aspects were considered.
The review indicated that the moisture and chemical transport processes in compacted
bentonite are highly linked with the microstructure evolution o f the smectite minerals in
bentonite and the surface interaction. In terms o f hydraulic behaviour, interaction of water
with smectite minerals, as the major clay mineral component in compacted bentonite, has a
profound effect on the saturation rate o f the buffer. It has been well established that when
water is adsorbed to the interlayer pore space o f the smectite, the available pore space for
water and chemical flow reduces significantly. However, quantitative evaluation of the
amount and the rate of water exchange between immobile interlayer and mobile water/vapour
especially under variable suction and temperature is key parameter for inclusion o f this effect.
In terms o f chemical diffusion in compacted bentonite, generally significant low rate of
diffusion for anionic and high diffusion rate for cationic species has been found in
experimental investigations. These have been suggested to be related to the microstructure
and surface interaction. This effect requires the modelling of the diffusion under different
effective diffusion coefficient combined with electrostatic balance o f pore fluid.
Although, the effect o f thermal diffusion, i.e. Soret-Ludwig effect, has been reported less
important in geological media compared with the molecular diffusion, limited information is
available on this effect and the quantitative evaluation in transport of chemicals in compacted
bentonite. Under non-isothermal conditions, further developments and investigations of the
diffusive behaviour o f multicomponent chemicals, due to the effects of combined
electrochemical and thermal diffusion potentials could provide a better and more confident
understanding of the chemical processes under coupled THCM behaviour.
Available experimental results on coupled THCM behaviour of clay buffer under thermo-
hydraulic conditions have been used in literature for developments of assessment o f the
capabilities o f the computational models over the last few years. Various complexities have
been identified in terms of geochemical and mineralogical behaviour of the clay buffer. A
number of mineral reactions have been considered such as dissolution and precipitation of
2-44

Chapter 2 Literature Review
minerals, ion-exchange and illitization and dissolution. Indeed, all models developed for
studying reactive transport processes have some limitations.
The computational modelling of the reactive transport of multicomponent chemicals in porous
media has advanced over three decades. Most o f the models developed during last few years
have adopted advancements in geochemical and transport modelling by combining separate
models using various coupling schemes.
In conclusion, although there are numerous models available none are comprehensive enough
to deal with all kinds o f chemical transport problems. Especially, where nuclear waste
repository modelling is considered there are only few models available that are capable of
fully coupled THCM simulation on both three-dimensional and variably saturated conditions
in addition to incorporating more comprehensive geochemical reactions acting over various
time-scales. Moreover, these models have not yet been fully validated for all major
applications. They are still in their developmental stages and are used only as research tools.
Therefore, models, which give rigorous treatments to all aspects of coupling THCM
framework in compacted bentonite, need further consideration.
2-45
Chapter 2 Literature Review
2.13 References
Allison, J.D., Brown, D.S., and Novo-Gradac, K.J. (1991). MINTEQA2 User Manual version
3.0. Environmental Research Laboratory, U.S. EPA.
Arcos, D., Grandia, F., Domdnech, C., Fem&ndez, A.M., Villar, M.V., Muurinen, A,.
Carlsson, T., Sellin, P., and Hem£n, P. (2008). Long-term geochemical evolution o f the near
field repository: Insights from reactive transport modelling and experimental evidences.
Journal o f Contaminant Hydrology, 102 (3-4), 196-209.
Appelo, C.A.J., and Wersin, P. (2007). Multicomponent diffusion modeling in clay systems
with application to the diffusion o f tritium, iodide and sodium in Opalinus clay.
Environmental Science and Technology, 41, 5002-5007.
Appelo, C.A.J., Van Loon, L.R. and Wersin, P. (2010). Multicomponent diffusion o f a suite
of tracers (HTO, Cl, Br, I, Na, Sr, Cs) in a single sample o f Opalinus Clay. Geochimica et
Cosmochimica Acta, 74(4), 1201-1219.
Barclay, L.M., and Thompson, D.W. (1969). Electron microscopy o f sodium
montmorillonite. Nature, 222-263.
Bear, J. and Gilman, A. (1995). Migration o f salts in the unsaturated zone caused by heating.
Letters in Mathematical Physics, 19, 139-156.
Birgersson, M., and Kamland, O. (2009). Ion equilibrium between montmorillonite interlayer
space and an external solution-Consequences for diffusional transport. Geochimica et
Cosmochimica Acta, 73, 1908-1923.
Boudreau, B.P., Meysman, F.J.R. and Middelburg J.J. (2004). Multicomponent ionic
diffusion in pore waters: Coulombic effects revisited. Earth Planetary Science Letters, 222,
653-666.
Bourg, I.C., Bourg, A.C.M., and Sposito, G. (2003). Modeling diffusion and adsorption in
compacted bentonite: a critical review. Journal o f Contaminant Hydrology, 61, 293-302
Bourg, I.C., Sposito, G., and Bourg, A.C.M. (2006). Tracer diffusion in compacted, water-
saturated bentonite. Clays and Clay Minerals, 54 (3), 363-74.
Bradbury, M.H., and Baeyens, B. (2003). Porewater chemistry in compacted re-saturated
MX-80 bentonite. Journal o f Contaminant Hydrology, 61, 329-338
2-46
Chapter 2 Literature Review
Centler, F., Shao, H., De Biase, C., Park, C-H., Regnier, P., Kolditz, O., and Thullner, M.
(2010). GeoSysBRNS-A flexible multidimensional reactive transport model for simulating
biogeochemical subsurface processes. Computers and Geosciences, 36, 397-405.
Cleall, P.J., Seetharam, S.C., and Thomas, H.R. (2007). On the inclusion o f some aspects of
chemical behaviour o f an unsaturated soil in thermo-hydro-chemical-mechanical models: II:
Application and transport o f soluble salts in compacted bentonite. Journal o f Engineering
Mechanics, ASCE, 133, 348-356.
Cuevas, J., Villar, M.V., Fernandez, A.M., Gomez, P., and Martin, P.L. (1997). Pore waters
extracted from compacted bentonite subjected to simultaneous heating and hydration.
Applied Geochemistry, 12, 473-481.
Cuevas, J., Villar, M.V., Martin, M., Cobefla, J.C., and Leguey, S. (2002). Thermo-hydraulic
gradients on bentonite: distribution o f soluble salts, microstructure and modification of the
hydraulic and mechanical behaviour. Applied Clay Science, 22, 25-38.
Cui, Y.J., Loiseau, C., and Delage, P. (2002). Microstructure changes of a confined swelling• r/isoil due to suction controlled hydration. Proceeding o f the 3 International Conference on
Unsaturated Soils, Recife, 593-598.
Cui, Y.J., Tang, A.M., Loiseau, C., and Delage, P. (2008). Determining the unsaturated
hydraulic conductivity of a compacted sand-bentonite mixture under constant-volume and
free-swell conditions. Physics and Chemistry o f the Earth, Parts A/B/C, 33 (Supplement 1),
S462-S71.
Cussler, E.L. (1997). Diffusion-Mass Transfer in Fluid Systems. University Press,
Cambridge.
Dixon, D.A., Gray, M.N., and Hnatiw, D.S.J. (1992). Critical gradients and pressures in
dense swelling clays. Canadian Geotechnical Journal, 29, 1113-1119.
Engersgaard, P. and Kipp, K.L. (1992). A geochemical transport model for redox-controlled
movement of mineral fronts in groundwater flow systems: A case of nitrate removal by
Oxidation of Pyrite. Water Resources Research, 28(10), 2829-2843.
2-47
Chapter 2 Literature Review
ENRESA (2000). Full-scale engineered barriers experiment fo r a deep geological repository
fo r high-level radioactive waste in crystalline host rock, FEBEX project. EUR 19147,
Nuclear Science and Technology Series, European Communities, Luxembourg.
ENRESA (2006). Full-Scale Engineered Barriers Experiment, Updated Final Report 1994-
2004. Technical Publication ENRESA 05-0/2006, Madrid.
Engelhardt, G.R., Lvov, S.N., and Macdonald, D.D. (1997). Importance of thermal diffusion
in high temperature electrochemical cells. Journal o f Electroanalytical Chemistry, 429, 193-
201 .
Femdndez, A.M., and Villar, M.V. (2010). Geochemical behaviour of a bentonite barrier in
the laboratory after up to 8 years o f heating and hydration. Applied Geochemistry, 25, 809-
824.
Garcia-Guti^rrez, M., Cormenzana, J.L., Missana, T., and Mingarro, M. (2004). Diffusion
coefficients and accessible porosity for HTO and 36C1 in compacted FEBEX bentonite.
Applied Clay Science, 26(1-4), 65-73.
Glaus, M.A., Baeyens, B., Bradbury, M.H., Jakob, A., Van Loon, L.R. and Yaroshchuk, A.
(2007). Diffusion o f 22Na and 85Sr in montmorillonite: evidence of interlayer diffusion being
the dominant pathway at high compaction. Environmental Science Technology, 41, 478-485.
Gonzalez S&nchez, F, Van Loon, L.R., Gimmi, T., Jakob, A., Glaus, M.A., and Diamond,
L.W. (2008). Self-diffusion o f water and its dependence on temperature and ionic strength in
highly compacted montmorillonite, illite and kaolinite. Applied Geochemistry. 23(12), 3840-
3851.
Gomez-Espina, R., and Villar, M.V. (2010). Geochemical and mineralogical changes in
compacted MX-80 bentonite submitted to heat and water gradients. Applied Clay Science,
47(3-4), 400-408.
Goudarzi, R., and Johannesson, L-E. (2007). Aspo Hard Rock Laboratory, Prototype
Repository, Sensors data Report (Period 010917-070601). Report No 17, SKB, IPR-07-19,
Stockholm.
Grim, R.E. (1962). Applied Clay Mineralogy. McGraw-Hill, New York.
2-48
Chapter 2 Literature Review
Grindrod, P., and Takase, H. (1996), Reactive chemical transport within engineered barriers,
Journal o f Contaminant Hydrology, 21 (1-4), 283-96.
Guimanies, L.D.N., Gens, A., and Olivella, S. (2007). Coupled thermo-hydro-mechanical
and chemical analysis o f expansive clay subjected to heating and hydration. Transport in
Porous Media, 66, 341-372
Homola, A.M., Israelachvili, J.N., Gee, M.L., and McGuiggak, P.M. (1989). Measurements
of and relation between the adhesion and friction o f 2 surfaces separated by molecularly thin
liquid-films. Journal ofTribology, ASME, 111(4), 675-682.
Hueckel, T.A. (1992). Water-mineral interaction in hydromechanics o f clay exposed to
environmental loads: a mixture-theory approach. Canadian Geotechnical Journal, 29, 1071 -
1086.
Hueckel, T.A., Loret, B., and Gajo, A. (2002), Expansive clays as two-phase, deformable,
reactive cotinua: Cocepts and modeling options. Proceedings o f Chemo-Mechanical
Coupling in Clays, From Nano-Scale to Engineering Applications. Hueckel and Loret Di
Maio (Edt.). Bulkema Publisher, 105-20.
Ichikawa, Y., Kawamura, K., Nakano, M., Kitayama, K., and Kawamura, H. (1999). Unified
molecular dynamics and homogenization analysis for bentonite behavior: Current results and
future possibilities. Engineering Geology, 54, 21-31.
Jacques, D., and J. Simunek. 2005. User manual o f the Multicomponent Variably- Saturated
Flow and Transport M odel HP1. Description, verification, and examples. Version 1.0. BLG-
998 Rep. SCK CEN, Mol, Belgium.
Jougnot, D., Revil, A., and Leroy, P. (2009). Diffusion of ionic tracers in the Callovo-
Oxfordian clay-rock using the Donnan equilibrium model and the formation factor.
Geochimica et Cosmochimica Acta, 73(10): 2712-2726.
Jullien, M., Raynall, J., Kohler, E. and Bildstein, O. (2005). Physicochemical reactivity in
clay-rich materials: Tools for safety assessment. Oil and Gas Science and Technology, 60(1),
107-120.
Komine, H., and Ogata, N. (2004). Prediction swelling characteristics o f bentonite. Journal
o f Geotechnical and Geoenvironmental Engineering, ASCE, 130(8), 818-829.
2-49

Chapter 2 Literature Review
Kozaki, T., Inada, K., Sato, S., and Ohashi, H. (2001). Diffusion mechanism of chloride ions
in sodium montmorillonite. Journal o f Contaminant Hydrology, 47, 159-170.
Kozaki, T., Fujishima A., Saito, N., Sato, S. and Ohashi, H. (2005), Effects of dry density
and exchangeable cations on the diffusion process of sodium ions in compacted
montmorillonite, Engineering Geology, 81, 246-254.
Kr5hn, K-P. (2003). New conceptual models for the resaturation of bentonite. Applied Clay
Science, 23, 25-33.
Laird, D.A. (2006). Influence o f layer charge on swelling of smectite. Applied Clay Science,
34, 74-87.
Lasaga, A.C. (1998). Kinetic Theory in the Earth Science. Princeton Series in Geochemistry,
Princeton University Press.
Le Gallo, Y., Bildstein, O., and Brosse., E. (1998). Coupled reaction-flow modelling of
diagenetic changes in reservoir permeability, porosity and mineral compositions. Journal o f
Hydrology. 209:366-388.
Leaist, D.G., and Hui, L. (1990). Conductometric determination of the Soret coefficients of a
ternary mixed electrolyte, Reversed thermal diffusion of sodium chloride in aqueous sodium
hydroxide solutions. Journal o f Physical Chemistry, 94, 447-451.
Lehikoinen, J., Carlsson, T., Muurinen, A., Olin, M., and Salonen, P. (1995). Evaluation o f
factors affecting diffusion in compacted bentonite. In: Murphy, W.M., Knecht, K.A. (Eds.),
Scientific Basis for Nuclear Waste Management XIX. Materials Research Society,
Pittsburgh, PA, 675-682.
Leoroy, P., Revil, A., and Coelho, D. (2006). Diffusion of ionic species in bentonite. Journal
o f Colloid and Interface Science, 296, 248-255.
Likos, W.J. (2004), Measurement o f crystalline swelling in expansive clay. Geotechnical
Testing Journal, 27 (6), 1 -7.
Likos, W.J., and Lu, N. (2006). Pore-scale analysis o f bulk volume change from crystalline
swelling in Na+ and Ca2+ smectite. Clays and Clay Minerals, 54, 516-529.
Likos, W.J., and Way 1 lace, A. (2010). Porosity evolution of free and confined bentonite
during interlayer hydration, Clays and Clay Minerals, 58, 399-414.
2-50

Chapter 2 Literature Review
Liu, C.W., and Narasimhan, T.N., (1989). Redox-controlled multiple species reactive
chemical transport 1. Model development. Water Resources Research, 25(5), 869-882.
Liu, J., Yamada, H., Kozaki, T., Sato, S., Ohashi, H. (2003). Effect of silica sand on
activation energy for diffusion o f sodium ions in montmorillonite and silica sand mixture.
Journal o f Contaminant Hydrology, 61, 85-93.
Low, P.F., and Anderson, D.M. (1958). Osmotic pressure equations for determining
thermodynamic properties o f soil water. Soil Science, 86, 251-253.
Ludwig, C. (1856). Diffusion zwischen ungleich erwwarmten orten gleich zusammengestzter
losungen. Sitz. Ber. Akad. Wiss. Wien Math-Naturw. Kl., 20.
Ma, C., and Hueckel, T. (1993). Thermomechanical effects on adsorbed water in clays
around a heat source. International Journal fo r Numerical and Analytical Methods in
Geomechanics, 17, 175-196.
MacQuarrie K.T.B. and Mayer, K.U. (2005). Reactive transport modeling in fractured rock:
A state-of-the-science review. Earth-Science Reviews, 72, 189-227.
Marcial, D., Delage, P., and Cui, Y.J. (2002). On the high stress compression of bentonite.
Canadian Geotechnical Journal, 39, 812-20.
Martin, M., Cuevas, J.,and Leguey, S. (2000). Diffusion of soluble salts under a temperature
gradient after the hydration o f compacted bentonite. Applied Clay Science, 17, 55-70.
Melkior, T., Gaucher, E.C., Brouard, C., Yahiaoui, S., Thoby, D., Clinard, Ch., Ferrage, E.,
Guyonnet, D., Toumassat, C., and Coelho, D. (2009). Na+ and HTO diffusion in compacted
bentonite: Effect o f surface chemistry and related texture. Journal o f Hydrology, 370(1-4), 9-
20 .
Mitchell, J.K. (1993). Fundamentals o f Soil Behaviour. 2nd edition, John Wiley and Sons,
New Jersey.
Mitchell, J.K. and Soga, K. (2005). Fundamentals o f Soil Behaviour. 3rd edition, John Wiley
and Sons, New Jersey.
Muurinen, A. (1994). Diffusion o f cations and anions in compacted sodium bentonite. VTT
Publications 168, Technical Research Centre o f Finland, Espoo, Finland.
2-51

Chapter 2 Literature Review
Muurinen, A., Kamland, O., and Lehikoinen, J. (2007).Effect of homogenization on the
microstructure and exclusion o f chloride in compacted bentonite Physics and Chemistry o f
the Earth, 32, 485-490.
Nagra. (2002). Project Opalinus Clay: Safety report. Demonstration o f disposal feasibility
fo r spent fuel, vitrified high-level waste and long lived intermediate-level waste
(Entsorgungsnachweis). Nagra Technical Report NTB 02-05, Wettingen, Switzerland.
Ochs, M., Lothenbach, B., Wanner, H., Sato, H., and Yui, M. (2001). An integrated sorption-
diffusion model for the calculation o f consistent distribution and diffusion coefficients in
compacted bentonite. Journal o f Contaminant Hydrology, 47, 283-296.
Oelkers, E. (1996). Physical and chemical properties o f rocks and fluids fo r chemical mass
transport calculations. In Reactive Transport in Porous Media, Reviews in Mineralogy, 34,
130-191.
Olivella, S., Carrera, J., Gens, A. and Alonso, E.E. (1994), Nonisothermal multiphase flow of
brine and gas through saline media, Transport Porous Media, 15, 271-293.
Oscarson, D.W. (1994). Surface diffusion: is it an important transport mechanism in
compacted clays? Clays and Clay Minerals, 42, 534-543
Parkhurst, D.L., and Appelo, C.A.J. (1999). U ser’s Guide to PHREEQC (version 2), U.S.
Geological Survey, Water Resource Investigation Report, 99-4259.
Posiva, (2006). Petrology o f Olkiluoto Aulis Karki, Kivitieto Oy Seppo Paulamaki,
Geological Survey o f Finland, POSIVA 2006-02
Prommer, H., Barry, D.A., and Davis, G.B. (2002). Modelling of physical and reactive
processes during biodegradation o f a hydrocarbon plume under transient groundwater flow
conditions. Journal o f Contaminant Hydrology, 59, 113-131.
Pusch, R. (1994). Waste Disposal in Rock. Developments in Geotechnical Engineering, 76.
Elsevier.
Pusch, R. (2001). The microstructure o f MX-80 clay with respect to its bulk physical
properties under different environmental conditions. Geodevelopment AB.
Pusch, R. (2008). Geological Storage o f Highly Radioactive Waste, Springer, New York.
2-52

Chapter 2 Literature Review
Pusch, R., and HOkmark, H. (1990). Basic model o f water- and gas-flow through smectite
clay buffers. Engineering Geology, 28, 379-389.
Pusch, R., Karnland, O., and Hokmark, H. (1990). GMM: a general microstructural model
fo r qualitative and quantitative studies o f smectite clays, SKB, Technical Report, SKB-90-
43, Stockholm.
Pusch, R., and Kasbohm, J. (2001). Can the water content o f highly compacted bentonite be
increased by applying a high water pressure?. SKB Technical Report, TR-01-33, Stockholm.
Pusch, R., and Yong, R.N. (2006). Microstructure o f Smectite Clays and Engineering
Performance. Taylor and Francis, New York..
Revil, A., and Leroy, P. (2004). Constitutive equations for ionic transport in porous shales.
Journal o f Geophysical Research, 109, B03208, 1-19.
Robinson, R.A., and Stokes, R.H. (1959). Electrolyte Solutions. Butterworth and Co. Ltd.
Rosanne, M., Paszkuta, M., Tevissen, E., and Adler, P.M. (2003). Thermodiflfusion in
compact clays. Journal o f Colloid Interface Science, 267, 194-203.
Rosanne, M., Paszkuta, M., and Adler, P.M. (2006). Thermodiffiisional transport of
electrolytes in compact clays. Journal o f Colloid Interface Science, 299, 797-805.
Salles, F., Beurroies, I., Bildstein, O., Jullien, M., Raynal, J., Denoyel, R., and Van Damme,
H. (2008). A calorimetric study o f mesoscopic swelling and hydration sequence in solid Na-
montmorillonite. Applied Clay Science. 39(3-4), 186-201.
Salles, F., Douillard, J.-M., Denoyel, R., Bildstein, O., Jullien, M., Beurroies, I. and Van
Damme, H. (2009). Hydration sequence o f swelling clays: Evolutions o f specific surface area
and hydration energy, Journal o f Colloid and Interface Science, 333(2), 510-522.
Saaltink, M.W., Carrera, J., Ayora, C. (2001). On the behavior of approaches to simulate
reactive transport. Journal o f Contaminant Hydrology, (48), 213-235.
Samper, J., Xu, T., and Yang, C. (2009). A sequential partly iterative approach for2Dmulticomponent reactive transport with CORE . Computers and Geosciences, 13, 301-316.
Samper, J., Zheng, L., Montenegro, L., Femdndez, A.M., and Rivas, P. (2008). Testing
coupled thermo-hydro-chemical models o f compacted bentonite after dismantling the
FEBEX in situ test. Applied Geochemistry, 23(5), 1186-1201
2-53
Chapter 2 Literature Review
Sato, H. (2005). Effects of the orientation o f smectite particles and ionic strength on diffusion
and activation enthalpies o f I' and Cs+ ions in compacted smectite. Applied Clay Science, 29,
267-281
Sato, H., and Suzuki, S. (2003). Fundamental study on the effect of an orientation of clay
particles on diffusion pathway in compacted bentonite. Applied Clay Science, 23, 51-60
Schafer, D., Schaafer, W., and Kinzelbach, W. (1998). Simulation of reactive processes
related to biodegradation in aquifers: 1. Structure o f the three-dimensional reactive transport
model. Journal o f Contaminant Hydrology, 31,167-186.
Seetharam, S.C. (2003). An investigation o f the thermo/hydro/chemical/mechanical
behaviour o f unsaturated soils. Ph.D. Thesis, Cardiff University, Wales, UK.
Seetharam, S.C., Cleall, P.J., and Thomas, H.R. (2006). Modelling some aspects o f ion
migration in a compacted bentonitic clay. Engineering Geology, 85, 221-228.
Seetharam, S.C., Thomas, H.R., and Cleall, P.J. (2007). Coupled thermo-hydro-chemical-
mechanical model for unsaturated soils-Numerical algorithm. International Journal o f
Numerical Methods in Engineering, 70, 1480-1511.
Simunek, J., van Genuchten, M.Th., and Sejna., M. (2008). The HYDRUS-1D software
package fo r simulating the one-dimensional movement o f water, heat, and multiple solutes in
variably-saturated media. Version 4.0. HYDRUS Software Service 3. Department of
Environmental Sciences, University o f California, Riverside.
Simunek, J., and Suarez, D.L. (1994). Two dimensional transport model for variably
saturated porous media with major ion chemistry. Water Resources Research, 30(4), 1115-
1133.
Singh, R.M. (2007). An experimental and numerical investigation o f heat and mass
movement in unsaturated clays. PhD Thesis, Cardiff University, Wales, UK.
SKB. (1999). Processes in the repository evolution SKB. Technical Report, TR-99-07.
Stockholm, Sweden.
Skipper, N.T., Refson, K., and McConnell, J.D.C. (1991). Computer simulation of interlayer
water in 2:1 clays. The Journal o f Chemical Physics, 94(11), 7434-7445.
2-54

Chapter 2 Literature Review
Snowdon, P.N., and Turner, J.C.R. (1960). The concentration dependence o f the soret effect.
Transaction Faraday Society, 56, 1812-1819.
Soret, Ch. (1880), Influence de la temperature sur la distribution des sels dans leurs solutions,
Acad. Set, Paris, 91(5), 289-291.
Sposito, G. (1984). The Surface Chemistry o f Soils. Oxford Press, New York.
Steefel, C.I., and MacQuarrie, K.T.B. (1996). Approaches to modeling o f reactive transport
in porous media. Reactive Transport in Porous Media, Reviews in Mineralogy, (34).
Mineralogical Society o f America, Washington, DC.
Steefel, C., Rutqvist, J. Tsang, C-F., Liu, H-H., Sonnenthal, E., Houseworth J., and
Birkholzer, J. (2010) Reactive transport and coupled THMprocesses in engineering barrier
systems (EBS). Technical Report, LBNL-3901E, Lawrence Berkeley National Laboratory
(LBNL).
Steefel, C.I., and Yabusaki, S.B. (1996). OS3D/G1MRT, software fo r multicomponent
multidimensional reactive transport: user’s manual and program mer’s guide. Report PNL-
11166. Pacific Northwest National Laboratory, Richland, Washington.
Strang, G. (1968).On the construction and comparison of difference schemes. SIAM Journal
o f Numerical Analysis, 5, 506-517.
Suzuki, S., Prayongphan, S., Ichikawa, Y., and Chae, B.G. (2005). In situ observation of the
swelling o f bentonite aggregates in NaCl solution. Applied Clay Science, 29, 89-98.
Tebes-Stevens, C., Valocchi, A.J., VanBriesen, J.M., and Rittmann, B.E. (1998).
Multicomponent transport with coupled geochemical and microbiological reactions: Model
description and example simulations. Journal o f Hydrology, 209, 8-26.
Thomas, H.R., Cleall, P.J., Chandler, N., Dixon, D., and Mitchell, H.P. (2003). Water
infiltration into a large-scale in-situ experiment in an underground research laboratory.
Geotechnique, 53(2), 207-224.
Thomas, H.R., Cleall, P.J., Dixon, D.H., and Mitchell, P. (2009). The coupled thermal-
hydraulic-mechanical behaviour o f a large-scale in situ heating experiment. Geotechnique,
59, 401-413.
2-55

Chapter 2 Literature Review
Thornton, E.C., and Seyfried, W.E. (1983). Thermodiffiisional transport in pelagic clay:
implications for nuclear waste disposal in geological media. Science, 220, 1156-1158.
Tong F.G., Jing, L, and Zimmerman, R.W. (2009). An effective thermal conductivity model o f
geological porous media fo r coupled thermo-hydro-mechanical systems with multiphase
flow. International Journal o f Rock and Mining Science, 46, 1358-1369.
Tripathy, S., Sridharan, A., and Schanz, T. (2004). Swelling pressures o f compacted
bentonites from diffuse double layer theory. Canadian Geotechnical Journal, 41, 437-450
van Olphen, H. (1977). An Introduction to Clay Colloid Chemistry, John Wiley & Sons, New
York.
van Schaik, J.C., and Kemper, W.D. (1966). Choride diffusion in clay water systems. Soil
Science Society o f America Proceeding. 30, 22-25.
Van Loon, L.R., Glaus, M.A., and MUller, W. (2007). Anion exclusion effects in compacted
bentonite: Towards a better understanding of anion diffusion. Applied Geochemistry, 22,
2536-2552.
Vardon, P.J. (2009). A three-dimensional numerical investigation o f the therm-hydro-
mechanical behaviour o f a large-scale prototype repository. Ph.D. Thesis, Cardiff
University, Wales, UK.
Villar, M.V., Cuevas, J., and Martin, P.L. (1996). Effects o f heat/water flow interaction on
compacted bentonite: preliminary results. Engineering Geology, 41, 257-267.
Villar, M.V., Fernandez, A.M., Martin, P.L., Barcala, J.M., Gomez-Espina, R., and Rivas, P.
(2008b). Effect o f Heating/Hydration on Compacted Bentonite: Tests in 60 cm Long Cells.
Publishing House CIEMAT. Madrid. ISBN: 978-84-7834-597-4.
Villar, M.V., and Lloret, A. (2004). Influence of temperature on the hydro-mechanical
behaviour o f a compacted bentonite. Applied Clay Science, 26, 337-50.
Villar, M.V., S&nchez, M., and Gens, A. (2008a). Behaviour of a bentonite barrier in the
laboratory: experimental results up to 8 years and numerical simulation. Physics and
Chemistry o f the Earth, 33, S476-S485.
2-56

Chapter 2 Literature Review
Walter, A.L., Frind, E.O., Blowes, D.W., Ptacek, C.J. and Molson, J.W. (1994). Modelling of
multicomponent reactive transport in groundwater: Model development and evaluation.
Water Resources Research, 30( 11), 3137-3148.
Wemberg, T. (1998). Multicomponent groundwater transport with chemical equilibrium and
kintetics: model development and evaluation. Hydrological Sciences, 43(2), 299-317.
Wersin, P., Curti, E., and Appelo, C. A. J. (2004). Modelling bentonite-water interaction at
high solid/liquid ratios: swelling and diffuse double layer effects. Applied Clay Science, 26,
249-257.
Wersin, P., Johnson, L. H., and McKinley, I.G. (2007).Performance of the bentonite barrier
at temperatures beyond 100 °C: A critical review. Physics and Chemistry o f the Earth, Parts
A/B/C, 32, 780-788.
White, S.P. (1995). Multiphase nonisothermal transport of systems of reacting chemicals.
Water Resources Research, 31 (7), 1761 -1772.
Wissmeier, L., and Barry, D.A., 2008. Reactive transport in unsaturated soil: comprehensive
modelling of the dynamic spatial and temporal mass balance of water and chemical
components. Advances in Water Resources, 31 (5), 858-875.
Xie, M., Agus, S., Schanz, T., and Kolditz, O. (2004). An upscaling method and numerical
modelling o f swelling/shrinking processes in compacted bentonite /sand mixtures."
International Journal o f Numerical and Analytical Methods in Geomechanics, 28, 1479-
1502.
Xie, M., Bauer, S., Kolditz, O., Nowak, T., and Shao, H. (2006). Numerical simulation of
reactive processes in an experiment with partially saturated bentonite, Journal o f
Contaminant Hydrology, 83, 122-47.
Xu, T., Samper, J., Ayora, C., Manzano, M., and Emilio, C. (1999). Modeling of non
isothermal multi-component reactive transport in field scale porous media flow systems.
Journal o f Hydrology, 214, 144-164.
Yang, C., Samper, J., and Montenegro, L. (2008). A coupled non-isothermal reactive
transport model for long-term geochemical evolution of a HLW repository in clay.
Environmental Geology, 53(8), 1627-1638.
2-57

Chapter 2 Literature Review
Yeh, G.T., and Tripathi, V.S. (1989). A critical evaluation of recent developments in
hydrogeochemical transport models o f reactive multichemical components. Water Resources
Research, 25(1), 93-108.
Yong, R.N. (1999). Overview of modeling of clay microstructure and interactions for
prediction o f waste isolation barrier performance. Engineering Geology, 54, 83-91.
Yong, R.N. (2003). Influence of microstructural features on water, ion diffusion and
transport in clay soils. Applied Clay Science, 23, 3-13.
Yong, R.N., Pusch, R., and Nakano, M. (2010). Containment o f High-Level Radioactive and
Hazardous Solid Wastes with Clay Barriers. Spon Press, New York.
Yong, R.N., and Warkentin, B.P. (1975). Soil Properties and Behaviour, Elsevier,
Amsterdam.
Zhang, F., and Low, P.F. (1995). Effect on monovalent, exchangeable cations and
electrolytes on the retention between swelling pressure and interlayer distance in
montmorillonite. Journal o f Colloid and Interface Science, 173, 34-41.
Zysset, A., Stauffer, F. and Dracos, T. (1994). Modelling of chemically reactive
groundwater transport. Water Resource Research, (30), 2217-2228.
2-58

Chapter 3 Theoretical Formulation
Chapter 3
Theoretical Formulation
3-1

Chapter 3 Theoretical Formulation
3.1 Introduction
This chapter describes the theoretical formulation for thermal, hydraulic, chemical and
mechanical behaviour o f porous media. The main objective is to present the developments in
the context o f this dissertation to the formulation of hydro-geochemical behaviour of
unsaturated soils. Since the primary variables o f the model influence each other (i.e. are
coupled), it is useful to present in reasonable detail the governing equations for all thermal,
hydraulic, chemical and mechanical behaviours.
The governing equations for coupled moisture, air, temperature, and deformation behaviour
have already been covered in detail elsewhere (Ramesh, 1996; Thomas and He, 1998; Cleall,
1998; Mitchell, 2002; Melhuish, 2004; Vardon, 2009). The formulation of the reactive
transport of multicomponent chemical transport was also presented by Seetharam (2003),
where the effects o f geochemical reactions were included via a sink/source term in the
governing chemical transport equation using a geochemical equilibrium model, linked to the
transport model.
General aspects of the theoretical formulation are presented in section 3.2 including the basic
assumptions and the primary variables. The governing equation describing the moisture
transfer is developed in section 3.3 based upon the principle of conservation of mass and
treating moisture flow as a two phase flow process. The effect of the presence of dissolved
chemicals on the flow o f moisture, i.e. osmotic potential effects, is included in the governing
equation for moisture transport. Air transfer is considered in section 3.4 considering air to be
a binary mixture o f dry air and water vapour. Total air content is considered as sum of the
bulk air and the dissolved air in water phase. The governing equation o f heat transfer is
presented in section 3.5 based on the conservation of energy and identifying conduction,
convection and latent heat o f evaporation as the main mechanisms of transfer.
The governing equations for the reactive transport of multicomponent chemicals are
explained in section 3.6. The principle o f mass conservation law is applied to the transport
equation o f multicomponent chemicals. The general flux of each chemical component
includes advective, dispersive and diffusive fluxes. Both molecular and thermal diffusion
potentials are considered in the diffusive flux. In addition, developments to the chemical
transport model via inclusion o f the overall charge conservation, i.e. the electro-neutrality
3-2

Chapter 3 Theoretical Formulation
condition, is included in the governing equation. A theoretical approach is adopted for
evaluation o f the thermal diffusion coefficient or the Soret coefficient.
The homogenous and heterogeneous geochemical reactions are considered as a sink/source
term in the governing equation. The geochemical reactions are calculated utilising an
advanced geochemical model, PHREEQC version 2, adopted to solve mass action equations.
The governing equation for deformation is derived from considerations o f stress equilibrium.
The general formulation for mechanical behaviour is detailed in section 3.7. Finally, a
summary of the formulation o f flow and deformation and the developments made in this
chapter is presented in section 3.8.
3.2 Theoretical formulation-GeneraI aspects
Soil porous medium is considered to be a three-phase system, consisting o f a solid skeleton,
pore water and pore air. The pore water consists of the components of dissolved chemicals
and dissolved air. The pore air is made up of dry air and water vapour. In the following,
formulation the flow o f moisture, air and heat energy in a deformable porous media are
considered. Moisture is considered as the total water in the form of liquid and vapour. The
transfer o f water and vapour is considered utilising the principle o f conservation of mass, as is
the transfer o f pore air. The pore air is considered as binary mixture o f dry air and water
vapour. The dissolved chemical concentration is expressed as a vector o f any number of
chemical species in the system in which the concentration of each species is treated as a
primary variable in this model.
The governing equations are expressed in terms o f five primary variables; namely
• Pore water pressure («/)
• Pore air pressure (ua)
• Temperature (7)
• Dissolved chemical concentrations, e.g. for component fh (c'd ) where i can be 1 to nc components
3-3

Chapter 3 Theoretical Formulation
• Displacement (w)
The behaviour o f all these variables is included within coupled thermo-hydro-chemo-
mechanical (THCM) formulation.
The driving mechanism of liquid water is considered as the total water potential or suction.
Heat transfer is governed by the conservation o f energy, taking into account conduction,
convection and the latent heat o f vapourisation, with radiation assumed to be negligible.
Advection, dispersion and diffusion are considered as the major mechanisms for chemical
transport. The mechanical behaviour is governed by an appropriate constitutive relationship,
e.g. an elasto-plastic relationship for a slightly swelling soil, via consideration of stress
equilibrium. All of the governing equations are then developed in a three-dimensional form.
3.3 Moisture flow
Transfer of moisture in unsaturated soils can be described as a two phase flow process,
comprising water transport as liquid and vapour. The volumetric water content, 6, is defined
as the sum of these phases:
e = e,+ov (3.i)
where 0/ is the volumetric liquid content and 6V is the volumetric vapour content.
Based on the principle o f thermodynamic equilibrium, the volumetric liquid water and water
vapour (equivalent amount o f liquid precipitated) are in equilibrium at any point (de Vries,
1958) giving:
/i n — 0,0 v = — — !- P , (3.2)
Pi
where n is the porosity, pi is the density o f liquid water and p , is the density of water vapour.
The law of conservation o f mass can be considered separately in liquid and vapour phases in
order to derive the general mass conservation for moisture transport.
The law of mass conservation dictates that the time derivative of the liquid water content is
equal to the gradient of the liquid flux. Mathematically this can be expressed as:
3-4

Chapter 3 Theoretical Formulation
f t (p l9 ,SV ) = - d W - ( p ly i) - 5 y p lEss (3.3)
where / is time, V is the gradient operator and SV is the incremental volume, vi is the velocity
of liquid, E„ is a sink/source term representing vaporisation and condensation.
Similarly for the vapour phase, the law o f conservation of mass dictates that the time
derivative o f the vapour content is equal to the gradient of the vapour flux as:
^ ( p A S V ) = - S W ■ (p , v y) - S W ■ (p vy , )+ SVp,Ess (3.4)
where vv is the velocity of vapour and va is the velocity of pore air.
The volumetric air content, 6a, can be expressed considering porosity and volumetric water
content as:
ea = n - e , (3.5)
Substituting equations (3.2) and (3.5) into equation (3.4), the law of conservation o f mass for
liquid vapour flow may now be expressed in terms of porosity and volumetric air content:
(pyO aW ) = - p , 5 W • v Y - 5 W • (a .V .)+ P,5VEss (3.6)ot
Summing the equations o f conservation o f mass for liquid and vapour flow, i.e., equations
(3.3) and (3.6), gives the general equation o f conservation of mass for moisture:
Pi ^ ( 0 iW ) + ^ - ( p ,0 af t ' ) = - p lS W .y , - S W .( p ,v y) - S W .( p „ v J (3.7)ot ot
The volumetric liquid may be expressed in terms of porosity and degree of saturation, giving;
G ^ n S , (3 .8)
Where Sj is degree of saturation of pore water.
Similarly, the volumetric air contents can be expressed in terms of porosity and degree of
saturation, as:
Ga = nSa = n ( l - S , ) (3.9)
where Sa is the degree of saturation of pore air.
3-5

Chapter 3 Theoretical Formulation
The term dV, the incremental volume, is a summation of the void volume and solid volume.
Hence it can be shown that:
SV = (l + e)Srs (3.10)
where SVs is the increment volume of the solids and e stands for the void ratio of soil.
Substituting equations (3.8), (3.9) and (3.10) into equation (3.7) gives:
p , | [nS, (1 + e)SVs ] + f k « d - S, )(1 + e)\yVs =
- P i(l + e)SVsV - p , ( l + c ) ^ V - v Y -(1 + e)SVsV ■ ( p vv , )
Since the volume of the soil (solid) is assumed to remain constant, the term dVs can be
eliminated from equation (3.11). Moreover, the porosity can be related to the void ratio as:
” = (T+e) (3-12)
Substituting porosity from equation (3.12) and eliminating the volume o f solid in equation
(3.11), the general mass conservation equation for moisture becomes:
Pi = ~ P ( 1 + e)V • v, - A ( 1 + e)V • vY -(1 + e )V -(p „ v ,) (3.13)
According to equation (3.13), the total moisture flux includes the components of liquid flux,
vapour flux due to vapour pressure gradients, and vapour flux arising from the bulk flow of
vapour due to movement o f pore air. The flow mechanisms and flow laws that govern them
are discussed below.
3.3.1 Mechanism of liquid water flow
Liquid flow in unsaturated soils can be formulated using Darcy’s equation replacing the
hydraulic gradient with total water potential gradient (Yong and Warkenting, 1975; Lu and
Likos). Hence, the velocity o f liquid water can be expressed in Darcy's equation for
unsaturated flow as:
v, = y/ (3.14)
3-6

Chapter 3 Theoretical Formulation
where ki is unsaturated hydraulic conductivity and y/ is the total water potential.
The total water potential is defined as the energy with which water or liquid is held in a soil
and it might include the components o f matric, osmotic, thermal, electrical and gravitational
potentials (Yong and Warkenting, 1975). In this study the total soil-water potential
components are considered as the sum of the effects related to the components of matric,
osmotic and gravitational potentials. The flow of liquid water due to electrical potential is not
considered in this study. The total soil-water potential, if/, can therefore be expressed as the
sum of its components, given by:
V' = V'm +V'*+V'g (3.15)
where is y/m stands for matric potential, is osmotic potential and y/g is gravitational
potential.
Matric potential can be described as the result o f the combined effects o f capillary and
adsorptive potentials within the soil matrix (Philip, 1977; Derjaguin et al., 1987; Tuller et al.,
1999; Baker and Frydman, 2009). Dominant mechanisms for these effects include (Or and
Wraith, 2001):
• Capillarity caused by liquid-gas and liquid-solid-gas interface interacting within the
irregular geometry of soil pores.
• Adhesion o f water molecules to solid surfaces due to short-range London van der
Walls forces and extension of these effects by cohesion through H bonds formed in the
liquid.
• Ion hydration and binding of water in diffuse layers
The term matric suction or tension is commonly used instead of matric potential mainly
because it is more convenient or intuitive to work with positive terms than negative values
(Or and Wraith, 2001). The absolute value o f the total matric potential can be assumed to be
equal to the difference o f water pressure and air pressure according to Sheng et al. (2008), and
Baker and Frydman (2009) which is equivalent to the definition of matric suction (5 ).
Fredlund and Rahardjo (1993) has defined a macroscopic definition for matric suction as the
3-7

Chapter 3 Theoretical Formulation
difference between pore air pressure and pore liquid pressure. Accordingly matric suction is
mathematically expressed as:
Vm = ~ s = u , - u a (3.16)
Edlefsen and Anderson (1943) stated that in moist conditions where the effects of adsorptive
forces on the free energy o f soil system are negligible, the capillary potential is synonymous
with free energy of the soil-water system. In this condition, the changes in free energy with
temperature are caused by the variation o f the surface tension of water with temperature
(Edlefsen and Anderson, 1943; Fredlund and Rahardjo, 1993). Edelfsen and Anderson (1943)
expressed that the surface energy is solely a function of temperature. Temperature
dependency of surface tension of pure water (£) was given by Edlefsen and Anderson (1943)
and Grant and Salehzadeh (1996) as:
% = a' + b'T (3.17)
where a' is equal to 0.11766 (N .m 1) and b’ is 0.0001535 (N.m ’K-1) for pure water.
Phillip and de Vries (1957) stated that the change of soil-water potential is attributed to
temperature impact on interfacial tension of pure water. Thus, for unsaturated soils, suction is
dependent on the surface energy, which is in turn dependent on the absolute temperature.
Therefore, suction at any moisture content and temperature can be obtained by the following
relationship;
where sr and £r are the suction and the surface energy at the reference temperature Tr,
respectively. £ is the surface energy at the actual temperature T.
It is noted that the application o f the mentioned expression for dependency o f suction to
temperature is theoretically limited to the capillary component of matric soil-water potential
or capillary suction. In the case o f compacted clays, Romero et al. (2001) stated that simple
dependency of suction on temperature based on surface tension can not solely explain the
variation of suction with temperature o f a compacted clay (Boom clay). It was suggested that
at higher moisture values, the inter-aggregate porosity region presents a dominant capillary
storage mechanism containing bulk water. At this level of suction or saturation, temperature
3-8
Chapter 3 Theoretical Formulation
induced changes are mostly related to the changes in interfacial tension, thermal expansion of
entrapped air, releasing air entrapped water. At low water contents, the majority of water is
contained in the intra-aggregate porosity via adsorption storage mechanism of quasi-immobile
water. The latter mechanism is therefore dependent on clay microstructure and pore fluid
chemistry and temperature influence on chemical induced water adsorption potential (Zhang
et al., 1993; Romero et al. 2001). The temperature dependency of soil-water potential or
suction for compacted swelling clays will be discussed further in chapter 6.
The presence o f dissolved solutes in soil water system can decrease the potential energy of
water and the vapour pressure relative to the reference state (pure water) (Or and Wraith,
2001). All inorganic salts and many large organic molecules are osmotically active.
Osmotically active solutes lower the potential energy of water in an ideal membrane (Or and
Wraith, 2001). An ideal membrane completely restricts the passage of ions while non-ideal
membranes do not restrict the passage of all the solutes present in the solvent as it passes the
membrane. A non-ideal membrane’s performance is reflected by osmotic efficiency or
reflection coefficient.
Clays can act as a semi-permeable membrane, defined as the ability of a material to prevent
the passage o f a solute without affecting the passage of the solvent (Mitchell, 1993). The
osmotic potential can be represented as a function of the chemical concentration, temperature,
activity coefficient and osmotic efficiency or reflection coefficient as (e.g. Mitchell, 1993; Wu
and Cheing, 1995):
nc
V ^ - R T c o ^ r A (3.19)/=1
where, R is universal gas constant, y, is the activity coefficient of the ith chemical species in
aqueous. In this equation the unit for chemical concentration is mol/1, and nc represents the
total number of chemical components. a>n denotes the osmotic efficiency coefficient or
reflection coefficient of the soil, y, is the activity coefficient of the f h chemical component.
For ideal membranes which restrict the passage of all charged solutes, coK is equal to 1; for
porous media without membrane properties (e.g. sand), it is equal to zero. The value of
osmotic efficiency depends on the clay properties, i.e. surface charge, exchangeable cation,
porosity or density, mean pore water concentration, and temperature (Kharaka and Berry,
3-9

Chapter 3 Theoretical Formulation
1973; Fritz, 1986). Mitchell (1993) reported the significance of osmotically driven water flow
relative to hydraulically driven water flow in heavily over-consolidated clays and clay shale,
where the void ratio is low and the hydraulic conductivity is also very low.
Gravitational potential is determined solely by the elevation of a point to some arbitrary
reference point. When expressed as energy per unit weight, the gravitational potential is
simply the vertical distance from a reference level to the point of interest (Or and Wraith,
2001) and it is given as:
= P ig* (3.20)
where z is the elevation from the reference level and g is the gravitational constant.
In the case o f compacted smectite clay soils, the organisation of the pore spaces and water in
the system is an essential issue for studying the soil-water interaction and mechanism. For
smectite type o f expansive clays, mechanisms of water sorption and retention in the interlayer
pores results from the adsorption term of matric potential. Beyond the interlayer water
adsorption the effective mechanism in water uptake and retention stems from interactions
described by the osmotic potential (Yong, 1999). The water adsorption in smectite clays is
followed by developing air-water interface due the capillary term of matric potential. When
the pore water exists as capillary water at relatively high degrees of saturation, the capillary
effect is dominant in matric potential. When the pore water exists as adsorbed water films in
the soil, the adsorptive mechanism becomes dominant in the matric potential (Romero and
Vautat, 2002; Delage, 2002; Sheng et al., 2008; Baker and Frydman, 2009).
Fredlund and Raharadjo (1993) have shown that only the water pressure («/) potential should
be used as the driving potential for the liquid water instead of matric potential, which includes
the effects of both water and air pressure. In fact, the variation of the moisture due to the air
pressure is reflected in the liquid transport through the dependency of soil water retention on
matric suction. Following Fredlund and Raharadjo (1993) and by incorporating the gradient
of total potential in terms of total water head, comprising water pressure head, osmotic head
and gravitational head, the velocity o f the liquid flux can be given as:

Chapter 3 Theoretical Formulation
The gradients o f osmotic head can be presented as the head due to the dissolved chemical
concentration gradients and temperature gradient:
dc‘ dT (3.22)
Considering the dependency o f activity coefficient on chemical concentration, the derivative
of osmotic potential with respect to chemical concentration can be given as:
^ = -R T ^ y ,dc'
1 + 5 In Yi d Inc'
(3.23)d
Variation o f the activity coefficient in the range o f normal temperature is almost negligible;
therefore the derivative o f osmotic potential with respect to temperature is obtained as:
dT (3.24)/ = 1
Substituting the expanded forms of matric, osmotic and gravimetric potentials and the
derivative of osmotic potential with respect to chemical concentration and temperature from
equations (3.23) and (3.24), into equation (3.14), the general equation for flux of liquid in
terms of primary variable is obtained as:
V, =Vm, RTco„ nc f d In Yj ' ( Rco„ nc X71 1 + V c i - n v r + v z
_p tg P ig j=l I d\nc'd j I P ig ;= 1 )(3.25)
In general, the hydraulic conductivity is influenced by a number o f factors such as soil fabric,
pore fluid characteristics, particle size and particle distribution, void ratio, and mineralogical
composition (Yong and Warkenitin, 1975; Mitchell, 1933). Degree o f saturation and
turbulence of flow are also known to affect the hydraulic conductivity. However, the
turbulence of flow may be neglected, as flow is slow in clays.
Unsaturated hydraulic conductivity has been often expressed as a power function of the
saturated conductivity, given as:
*/ = * « ( « / ) '
where ksat is the saturated hydraulic conductivity and a , is the power number.
(3.26)
3-11

Chapter 3 Theoretical Formulation
The saturated hydraulic conductivity is itself a function of intrinsic hydraulic conductivity, Kj
and viscosity of flowing fluid, /*/ as (Mitchell, 1993):
K iksal = — (3.27)Mi
Temperature variation influences the absolute viscosity. Kaye and Laby (1973) presented a
relationship between the dynamic viscosity o f liquid water and the absolute temperature valid
in the range 273 < T < 373 (K):
ft, = 661.2(T - 229) ' 1562 xlCT3 ± 0.5% (N.s.m'2) (3.28)
3.3.2 Mechanisms of water vapour flow
As explained earlier, vapour transfer occurs as a result of two main mechanisms, namely;
diffusive and pressure flows. The bulk air is considered to be a binary mixture of water
vapour and dry air (Pollock, 1986) and is dealt with via a generalised Darcy’s law, following
the approach o f a number of researchers (Carman, 1956; Alonso et al., 1988). Diffusive flow
is described by the theory proposed by Philip and de Vries (1957), for diffusive vapour flow
in unsaturated soil.
For small scale problems, Fredlund and Rahardjo, (1993) found that the elevation gradient or
gravitational potential has a negligible effect on air transfer. Therefore, the pressure gradient
is usually considered to be the only driving potential for air transfer. The rate o f flow of air in
unsaturated soil can be defined incorporating Darcy’s law as:
y %= - k aV ua (3.29)
where ka is the unsaturated conductivity of pore air. The unsaturated conductivity of gases in
soil is a function of the pore air properties and volume/mass of soil. As the properties of air
are generally assumed to be constant during the flow process, the volume/mass properties
control the air conductivity (Olson, 1963). In this study the volume/mass properties chosen
are void ratio and degree o f pore air saturation; given as:
K = K { e . S a) (3.30)
3-12

Chapter 3 Theoretical Formulation
Vn = ^ v r Po dT
(3.40)
Since the relative humidity due to matric potential is dependent on both temperature and
matric potential, i.e. suction; the gradient of hm may be expressed as:
m dhm „ dhm „ dhm V/z = —^-Vw - — -V w . + —^ V T
ds a ds 1 dT(3.41)
Similarly, the relative humidity due to osmotic potential is dependent on both temperature and
dissolved chemical concentration. Therefore, the gradient of h„ is expressed as:
vh„ = X — vci +^-vr' t r a c ' d T
(3.42)
Substituting the components of the gradient o f water vapour density in equation (3.39) with
equations (3.40), (3.41) and (3.42), yields:
+ Pok
Grouping similar terms, gives:
h h nm 7idPodT
vr + PoKd h d h d h
a t ° ~ ~ & r 1 + n f ~
tt' dh , , dhy + — ^ v tt r Sc'd ST
(3.43)
Vp„ =
dh dh
: Po KVw, +
a ; .
+. , d p , d h m d hh mh „ + P o h mr f T P \T
A/C
v r + £/=l
pohm ~ idcAVc'
Similarly, the temporal derivative of water vapour density can be given as:
du„
dt
, dh du, , dhmI - * " ' ds J /
dt+
[ ' * - ds J+
d t
, , d p Q . dhm dh_hmh„ —£ + Poh„ —=r + p 0hmr¥T r¥T FT f +Edt /=1
pohdh
m del
dc'.dt
(3.44)
(3.45)
The velocity of water vapour is obtained by substitution of the gradient of water vapour
density from equation (3.44) into equation (3.31):
3-15

Chapter 3 Theoretical Formulation
alms v v a alms v v a
^ Pialms v v
Da,m sK*APi
(3.46)
Experimental work carried out by Philip and de Vries (1957) suggested that the theory
defined in equation (3.46) was not fully valid at increased temperature gradients. They
proposed two refinements to the thermal gradient term. Firstly a flow area factor, f was
included to achieve a reduction of the vapour flow as the available flow area decreased at
higher moisture contents. Secondly a microscopic pore temperature gradient factor, ,
was introduced, which is the ratio of the average temperature gradient in the air filled pores to
the overall temperature gradient. This factor takes into account the microscopic effect of heat
flow paths being shared between sections o f solid and fluid paths, giving rise to microscopic
temperature gradients in the fluid filled pores, which may be much higher than the
macroscopic temperature gradients across the sample as a whole. Including these two
amendments into equation (3.46) yields:
Preece (1975) proposed an expression to evaluate the microscopic pore temperature gradient
factor, based on a proposed geometrical method (de Vries, 1966). This expression was
developed for a sand soil as:
aims v v aalms v v a
D aimsV v A V T \ V T (3.47)
aims v v a
(vr). _ 1 r 2+ (3.48)
VT 3 1 +3 1+ BGV \ + B ( \ - 2 G J
where,
3-16

Chapter 3 Theoretical Formulation
B =_ ( A L+ A lA ,
-1 (3.49)
and;
G = v
0.3333-0.325x n -6 ,
0.0033 + 11.11 x 0.33-0.325 n - 0.09
0.09<9^ <n
o < e t <0.09(3.50)
Xa is the thermal conductivity o f pore air, X\ is the thermal conductivity o f pore liquid and Xv is
the thermal conductivity of pore vapour, which can be defined as:
K = D a , m s V V h L dt(3.51)
where L is the latent heat of vaporisation.
Campbell (1985) represented an expression to evaluate the microscopic temperature gradient
factor for clay soils as a function o f volumetric water content and clay fraction (fc) (Wu and
Cheing, 1995):
^ = 9.5 + 6.00, - 8.5 expj- [(l - 2 .6 /;°5 >, ]*} (3.52)
Ewen and Thomas (1989) suggested two alterations to the extended vapour velocity equation
proposed by Philip and de Vries (1957). They suggested that the vapour flow area factor
should be presented in both temperature and moisture gradients terms. They also suggested
that the form of flow area factor needs to be modified and considered to be equal to the
porosity. Adopting these suggestions in the present work, vapour velocity can be written as:
v.. = <
h 8 h ,
P i dsVw; - DalmsVvXA h 8h,
P i
^ / ^ ■ { k K ^ p A ^ p AP i
n dc„
ds ^
dh AmdT
V T
/ = ! P i
(3.53)
An experimental and numerical study conducted by Singh (2007) into vapour flow in high-
density clays under temperature and hydraulic gradients. It was proposed by Singh (2007) that
3-17

Chapter 3 Theoretical Formulation
additional modification factors are required to the vapour flow factors. Including the proposed
empirical correction factors suggested by Singh (2007), the equation can then be expressed as:
predicted to be 0.17 and 0.60 respectively. However, it was concluded by Singh (2007) that
both further experimental and numerical work is required to characterise the behaviour of
high-density clays. The form of the vapour flow factor, especially, may need to be re
evaluated as a consequence of such work. It is acknowledged that the application of this
approach requires further research and development when considering the movement of
vapour in cohesive soils, especially in compacted swelling clays.
3.3.3 Governing differential equation for moisture flow
The components o f flow for the liquid and vapour were defined in the previous sections. The
governing equations for flow are now included in the equation o f mass conservation for
moisture flow, i.e. equation (3.13) and expanded in terms of its primary variables.
The first two terms of equation (3.11) can be expanded, which leads to the following
expression:
a lm s v a lm s v ‘
p t OS
D , vw(vr)a lm s v * v A (3.54)
a lm s y ‘
where rjj and rj2 are material dependent factors. For MX-80 bentonite these were initially
(3.55)- P / O + O V -v , - p ,{ \ + e ) V - \ y - ( l + OV-(yC\,va)
Dividing equation by (1+e) and replacing e /(l +e) by n yields:
(3.56)- p ,V v, - p ,V v v - V - ( p yv J
3-18

Chapter 3 Theoretical Formulation
Considering the third term, it can be shown that:
de d£v(3.57)
(1 + e)dt dtwhere ev is the volumetric strain which by definition is the rate o f change of void ratio with
respect to initial volume. Substituting this term into equation (3.56) gives:
(3.58)- p , V v , -p ,V v v - V (p„v,)
Matyas and Radhakrishna (1968) proposed that the degree of liquid saturation is a function of
the initial void ratio, the initial degree o f liquid saturation, and the stress parameters, namely;
net stress, deviatoric stress, and suction. However, Alonso et al. (1988) found the influence of
stress on the degree of saturation to be relatively insignificant. The absolute value of total
matric potential can be assumed to be equal to the difference o f water pressure and air
pressure, i.e. matric suction according to Sheng et al. (2008) and Baker and Frydman (2009).
Experimental study o f Thyagaraj and Rao (2010) has shown that the osmotic suction affects
the water content/void ratio o f compacted clays during the wetting path and its role therefore
might become important in determination o f matric suction from the soil water characteristic
curve. However, the osmotic effects are neglected in soil water characteristic behaviour in this
formulation. In other words, it is assumed that the osmotic potential might only affect the rate
of moisture transport, not the equilibrium condition of water. It is noted that the effects of
gravitational potentials is ignored due to the negligible effects in compacted fine soils on the
variation of degree o f saturation with total suction.
If the initial void ratio o f a soil sample is controlled and the sample is remained confined the
variation of degree of saturation can be expressed as a function of total suction, i.e.:
Based on equation (3.18), matric suction is also dependent on temperature. Therefore,
temporal derivative of the degree o f saturation can be expressed in terms of partial derivatives
with respect to the primary variables as:
S, = £ ,(* ) (3.59)
3-19
Chapter 3 Theoretical Formulation
as, aS, dua dS, du, ( dS, ds^ dT(3.60)dt ds dt ds dt y d s d T j dt
The first term in the left side of equation (3.58) can be expressed, with appropriate
substitution from equation (3.60), as:
" ( A - P v )dS,dt
dS, ds dTdt
(3.61)
ds dT
With substitution from equation (3.45) the second term of the left side of equation (3.58) can
also be expressed as:
dpvdt
PoK
+ n^ - s , ^ P o K
It can be shown that:
dhmds
dh__ tnds
du, / S , , dpQ dhm dh— + «(l - S , U mK — + p 0hx — + p 0hm —
dua (i c vsr* » dc'd
dTdt (3.62)
d s v dn = ( \ + e ) = md t dt (3.63)dt dt
where ev is the volumetric strain and e is the strain vector. The strain matrix P and the
differential operator m will be defined in section 3.7. The third term of equation can
therefore be expressed as:
[ p , s , + p A l - S, )]^ L = IP'S, + p , ( l - S , ) ] m r P ^ (3.64)
Substituting vi, va and vv from equations (3.25), (3.29) and (3.46), respectively into the right
side of the governing equation for moisture transport, with some re-arrangements of similar
items, the right side of equation (3.55) can be presented as:
3-20

Chapter 3 Theoretical Formulation
- A V y , “ P / V v v - V ^ v , =
k, dhm- — + Datmsvvnp0hn — - g ds
V-
Vu, + Pvka ~ Da,msvvnpQhndhmmds
Vm.
_ n v „ (v r )« ( h , ?P o_ .n h ?b*_>n h dh* ) , y kiRco* r D„,_rv..n — I hmhx + p Qhm + p 0hn a/T, | + ^v r ar
KRTa>xg Y, 1 +
d\n yjd In c 'y
- D a"nsV v ” P o h
dT ' ar
dhdcL
,=i s
- /7/AT/Vz
V77 (3.65)
Finally, the governing equation o f moisture flow can be represented in a simplified form as:
ar , ^ dua dcdIT dt + c . . - s ^ E c . + c _ a i
7 = 1 ■' d t a?
V • [K„Vk,]+ V • [K itW T ]+ V • [ * faV « .]+ V •fiv
/=!+ Jj
where:
(3.66)
c„ = -n (p , - A .) - «(1 - St )p„h/r ^OS 05 (3.67)
^ , , 0 ^ 1 1 dPo / dhm dh ^C/7. = » ( p / - p v) — + w ( l - 5 / ) hmh „ —- + p 0h „ — - + p 0hm—- dT I dT dT dT (3.68)
Cla = n(Pl - P j ~ + nO ~ S l )Pohuds ds (3.69)
Chd - W(1 - S{)p 0hndh,dc*
c„ = [ S ;^ + ( l - S ;) p v] m rP
K„ =k, dh„
i, ~ „ Datmsv vn pQhn ^g
(3.70)
(3.71)
(3.72)
K , r = D a , m s V v n
(vr)avr
r d p Q dhn dhm v? klRconK K + P o K ~ jT + Po^rt ~df~j - /L—j-y > Cd (3.73)
K , a = P Vk a + D at n , s Kn P o Kd Kmds (3.74)
3-21

Chapter 3 Theoretical Formulation
K< = _k 1R 7 ( ] + cttnrLg d\nc'd j
, dh+ D ctmsVvn P o K T Tdc.t
J, = V - ( -Plk,Vz)
(3.75)
(3.76)
3-22

Chapter 3 Theoretical Formulation
3.4 Dry air transfer
Dry air can be considered to consist o f two forms in unsaturated soil, i.e. bulk air and
dissolved air, (Rodebush and Busswell, 1958). The gradient of air pressure drives the transfer
of bulk air. The bulk air flow can be determined by the use of Darcy’s law. The flow of
dissolved air is also considered as advective flow within the pore liquid. Henry’s law is used
to define the proportion of dry air contained in the pore liquid.
The general law of conservation of mass dictates that the temporal derivative of the dry air
content is equal to the spatial derivative o f the dry air flux. Mathematically this can be
expressed as:
£ [ ( * . + H A = - S W • \p Ja (v , + / / . v , )] (3.77)Otwhere Hs is Henry’s volumetric coefficient o f solubility and pda is the density of dry air.
Substituting equations (3.5) and (3.10) into equation (3.77) yields the mass conservation
equation in terms of degree o f saturation, porosity and void ratio:
| [ ( 5 0 + H ,S , )Pdan(\ + e)SVs ] = -(1 + e ]S V y ■ \pda(v . (3.78)Ot
As stated previously, since SVs is constant, this term can be eliminated from equation (3.78).
Substituting n(\+e) = e and Sa=l-Si, yields:
| - [ ( l - 5 , + H ,S ,)Pdae] = - ( l + e ) V - { p j v , + H ,v ,)] (3.79)OtExpanding the first term of equation (3.79) gives:
£[(1 - S , + H , S , ) p ^ \ =
a a pc (38°)Pd, (1 - S, + H.S, )-A + «(1 - S, + H.S, ) - £ t - ePt. + ePdaH, - j - Ot ot ot ot
Grouping similar terms yields:
3-23
Chapter 3 Theoretical Formulation
- ( 1 - S ,+ H ,S , ) p d.e =
a a ac (381>A*, 0 - ■S, + H .S, U + e{\ - S, + tf.S , ) - S t + ePi. ( / / , - 1 ) - ^
ot dt ot
Substituting equation (3.12) into equation (3.81) and dividing the resultant equation by (J+e)
whilst replacing e!{ 1+e) by n yields:
^ + »(i - s , + h , s , ) % + ( / / , - i ) s s ' -(l + e) dt dt dt (3.82)
- V - ^ ( v . + Z / . v , ) ]
Substituting equations (3.57) and (3.63) into equitation (3.82) yields:
p j \ - s , + H ,S ,) m ' P ^ + «(1 - ,S-; + / / , . 5 , + nP<l<:( // , - l ) ^ =3/ 3/ 3/ (3.83)
- v - k * ( v . + t f , v i)]Following the approach proposed by Thomas and Samson (1995), the density o f dry air, i.e.
pda, is determined. As stated previously, the air phase in soils is considered to be a mixture of
dry air and water vapour. It has been found that the behaviour of this mixture obeys the laws
of a mixture of ideal gases to a sufficient degree of accuracy (Geraminegad and Saxena,
1986). The partial pressures o f dry air and vapour can be expressed as:
Uda= P daR<J (3.84)
and,
uv = p vRyT (3.85)
where Rv and Rda are the specific gas constants of vapour and dry air respectively.
Partial pressure o f air can be given by applying Dalton’s law of partial pressures:
«fl= K * + “v (3.86)
To determine the dry air density, equations (3.85) and (3.86) are substituted into equation
(3.84) that yields:
P * , = - f h ; - ££ L (3.87)d a d a
3-24

Chapter 3 Theoretical Formulation
The partial derivative o f equation (3.87) with respect to time can be expressed as follows:
dPjg _ 1 dUa Pa 9 7 K d P .dt R J - dt T 2 dt Rda dt
It is noted that the last differential term can be obtained from equation (3.45).
(3.88)
Substituting for the time derivative terms o f degree o f saturation from equation (3.60) and
density o f dry air from equation (3.87), velocity o f pore liquid and pore air from equations
(3.25) and (3.29), respectively leads to the governing equation for air transfer in terms of
primary variables. The governing equation for air transfer is therefore given as:
duial dt aT dt
M + c audt ' dtt = 1 dt
= V ■ [KalV u ,]+ V ■ K 7vr] + V • [K aa Vwa]+ V»=1
where;
+ J„(3.89)
Cat = -"Pda (H s ~ 0 ^ - + "(Sa + H sS l ) y ~ ( P A ~ds Rda V ds (3.90)
CaT = ~nPda (H , ~ l )~T~ ds
+ n(Sd + H sS, Ejl- AT Rda
, A , dh dp,. ^P A - t - + p A - r - + hmh„~—
ds ds ds j
c . » p j H , - \ ) ^ + n(Sa + H sS ,^1 R, . dh.
— z ~ p ARda ds
( R dhc dCi = n( s a + H _ , s A - ^ - Pohm^ -
c d. = [ S , / > , + ( l - S f) /> , ]mrP
Kai = P j J L kir.
(3.91)
(3.92)
(3.93)
(3.94)
(3.95)
3-25
Chapter 3 Theoretical Formulation
rr R ® * X T i
/ l <=1 (3.96)
K ^ = P * , k ' - E^ k l
&<*. = ~Pd.II,
r /
R(0
r, ’ r.c'd\ + 51n r , A
5 In c'„d y
(3.97)
(3.98)
(3.99)
3-26
Chapter 3 Theoretical Formulation
3.5 Heat transfer
Heat transfer is widely regarded to occur via three mechanisms namely conduction,
convection and radiation (Jakob, 1949). Heat transfer is also found to occur due to chemical
concentration gradients, i.e. Dufour effect which has not been found to be of significance in
soils (Mitchell, 1993). Therefore, Dufour effect is ignored in this study. The heat transfer due
to radiation mechanism is also ignored, as its influence is assumed to be negligible. The effect
of latent heat of vaporisation is included.
The law of conservation o f energy is applied to form the general equation o f heat transfer. The
law o f conservation o f energy for heat flow dictates that the temporal derivative o f the heat
content, Q, is equal to the spatial derivative o f the heat flux, Q. This may be expressed as:
d(Q5Vl = _ v . (SVQ) (3.100)dt
The heat content of unsaturated soil per unit volume, i.e. Q, is assumed to be the sum of soil
heat storage capacity (Hc) and the contribution resulting from the latent heat of vaporisation
(L). It therefore can be defined as:
Q = H c( T - T r) + LnSaPv (3.101)
where Tr denotes the reference absolute temperature. L is the latent heat o f vaporisation.
Following the approach presented by Ewen and Thomas (1989) the heat capacity of
unsaturated soil, Hc, at reference absolute temperature, Tr, may be defined as:
H c = (l - n)Cp,p , + p., + C ^ S aPda ) (3.102)
where Cps, Cpu Cpv, and Cpda are the specific heat capacities o f solid particles, liquid, vapour,
and dry air respectively and ps is the density o f solid particles.
Following Thomas and He (1995), three modes o f heat transfer are considered: thermal
conduction obeying Fourier’s law, convection o f heat associated with liquid and vapour flow,
and latent heat flow. The heat flux per unit area, Q , is determined therefore as:
Q = - A TV T + L ( \ yp , + v , a ) +
(C ^v,p( + C pvv vA + C pvv , A + C p,„vaA„X7’ _ 7 ’r)
3-27

Chapter 3 Theoretical Formulation
where Xt is the coefficient o f thermal conductivity of unsaturated soil. The coefficient of
thermal conductivity of unsaturated soil has been found to be a function of degree of
saturation, following Thomas and King (1991) it can be given as:
XT = X r {S,) (3.104)
The first term in equation (3.103) reflects the transfer of heat due to conduction. The second
term reflects latent heat flow with vapour movement. Heat convection is considered in the
third term comprising components o f movements due to liquid phase, vapour phase associated
with a vapour pressure gradient, vapour phase associated with the bulk flow of air, and the air
phase. Substituting heat content, Q, from equation (3.102) and heat flux, Q from equation
(3.103) into equation (3.100) yields:
dt
- V
{{HC(T - T r) + LnSaPv)5V) =
- XfVT + L ( v yp, + v„/?y) +(Crl\ , p , + C pvv vp l + C p v hp v + C pda\ , p dp){T - Tr)
(3.105)SV
pv v r / pv
Substituting equation (3.10) into equation (3.105), and cancelling the term SVs yields:
[Hc (T - T r)(\ + e ) \ + ~ [LnSa p A \ + e ) \ = Ot ot
— V •- ^ v r + i (v va + v ap v) +(Cpiy i Pi + C /n,v v/7/ + C pv\ ap v + C pdaYzp da) ( T - T r)
(3.106)(1 + e)
The first term of the left hand side o f equation (3.106) can be expanded further which yields:
f - [Hc (T - Tr )(1 + e)\ = H c (1 + e) ^ + ( T - Tr [// , (1 + e)]ot ot ot
(3.107)
Considering the second term o f equation (3.107) with substitution from equation (3.102) and
rearranging the terms gives:
d dTf [Hc( T - T , ) ( \ + e ) ] = + H A l + e ) — + dt ot
( T - T j j ' l c ^ + n i - C ^ p . + C ^ p , +C pvS>„
Expanding equation (3.108) further and substituting n(l +e) = e yields:
(3.108)
3-28
Chapter 3 Theoretical Formulation
^ [Hc (T - Tr )(1 + e)] = + H C (1 + e) ~ + ot dt
(t - t )—dt
de tC p > P ’ Y t + ~ C p ' P ' + C r ‘ S ' P l + C r - S ° P - + C p* ° S °
Cptpi ~ +c„a -s,ydp '
de~dt
+ e dt dtas,~dt
(3.109)
Noting that de. = (i + e)2 ^ and rearranging similar items, equation (3.109) becomes: dt dt
1 [ffe(7-- r, XI+ e)] = tf,(!+«)?dt dt
+ ( T - T r )
Cp,PsQ + eYdndt
+ (- C p , + C p,S lPl + C „ S . p , + C ^ S ap dlIy \ + e )2 ~Ot
+ e { c pi P i C pv P v C pda Pda )dS,dt
dp, d p da_ ^ . - ^ 1 O,, ^+ eC (\ — + eC . ( I — S ,)
(3.110)
Considering the second term o f equation (3.106), and substituting n(l +e)=e yields:
?-[LnSap v(\ + e)] = ?-[LeSdp , ] dt dt
(3.111)
Expanding equation (3.111) yields:
~ [L n S ap , (1 + e)] = L(l ~ S , ) e ^ ~ L e p v ^ + L ( l - S , ) p / ~ dt dt dt dt
(3.112)
Substituting equation (3.57) and (3.63) into the last term of equation (3.112) and
rearrangement o f the like terms yields:
j - [L n S aPv(1 + e)] = 1(1 - S , ) e ^ - - L e p v ^ + 1 ( 1 - S , ) p , ( l+ e )2^ dt dt dt dt
(3.113)
Substituting equations (3.110), and (3.113) into equation (3.106) yields the governing
equation for heat flow as:
3-29
Chapter 3 Theoretical Formulation
( T - T r)
^ /i \ 2C „ ft( l + e) —
+ (~ C p,P , + C plSlPl + C „ S . p , t V . p 4 )(]+ e ) ^ +ot
pr»
£ (C ,r f f t - C f , P * ~ C p J e P * . + e C p, 0 - S l ) g tdp.
+ H c (1 + e) +1(1 - 5, )e - U p , ^ + i ( l - S, ) f t (1 + e )2 J =5/ OT OT OT
- V -' - ^ V T + L { y y p t + V . p v )
+ i P n * i P i + C p9y yp l + C pv\ tLp v + C pda\ mp da) ( T - T r)
Dividing equation by (J+e) and substituting e/(l+e)=n , yields:
c\ + e)
(3.114)
( T - T r)
V . ( l + e> |Ot
+ {~ C p s P s + C p l S l P l + C p v S aPv + C p d a S aP d a \ + e )dndt
+ n{Cp,p, - C ^ p , - C ^ p Ja + nC^O - S, ) &
+ n C M, ( l - S , ) SPdapdaKl~ J ' , ~ d T
+ + 1(1 - S, ) n - Lnp, + L ( \ - S , ) p , ( \ + e ) ~ =Ot ot ot ot
- V
(3.115)
'-A rv r + z (v vp/ + \ np v)+ (Cpl\ , p l + C pv\ yp, + C pv\ ap v + C pda\ 1ip da) { T - T r)_
Substituting the temporal derivatives o f porosity from equation (3.63), degree of saturation
from (3.60), vapour density from equation (3.35), dry air density from equation (3.87) into the
left hand side o f equation (3.115) and equations (3.25), (2.29) and (3.45) for the velocity
terms o f liquid, air and vapour, respectively, yields;
d°d ,p> duTc" dt Tu dt
c ^ L + c ST + C ^ k + y c Crl dt 77 dt Ta dt
= V • [K„Va(] + V • \Kn VT] + V • [Kn V u ,] + V/ = 1
(3.116)+ JT
where;
3-30
Chapter 3 Theoretical Formulation
C =77
( r - r r>- n ( c „ A - C „ p . - C ^ p S ^ - n C ^ X - S ^ p X
eh.ds
+ nCpJa( \ - S l ) - ^ P 0h,Rda
dhmds
1(1 - S, )npQh„ ^=- + Lnpv
r =^ I T
{ T - T ry
" {C p tP l ~ C pvPv - C pda Pda)3S,ds
„ „ , dhm , dh„ , , 0po+ nCpvO ~ S / ) P0h„ + P0hm + hmhn
+ nCpda{ \ - S , )
-w C ^ O - 5 ,)
+ / / c + L ( \ - S , ) n
Pa_TR..Rd a
. dhm dh dp0Po * ~aT + Po m ”a T + m * ~ds~
c =T a
( T - T ry
. dhm dh dp0P o K ^ ^ P o K ^ + K h , —
" {C p lP l - C p v P v - C p d a P d a l - ^ + n C p v ^ - S ^ P o K
~ L npydS,ds
ds ds
+ n C ^ ( \ - S , ) - j± - - n C p4 , ( \ - S l ) £ - p <>h,da da
dhTYlds
. . dhm dS,+ L( 1 - S, )np0hn — — Lnpv —
r =Wc, | ( T - T r ( 1 - 5 , ) - n C ^ (1 - S , ) A-} +1(1 - S, )n^p0hm | k
C Tu = [ ( T - tX c .S 'P , + C . S . P , + C pd<,SaP<la) + L ( \ - S I)pvW v
_ Lpt p ^ - ( r - T, )cV p, P<K dhPi OS Pi
k t, =ds
+ t r - T . * , n ±
(3.117)
(3.118)
(3.119)
(3.120)
(3.121)
(3.122)
3-31

Chapter 3 Theoretical Formulation
, . Datmsv v xv e a A VT)aXT + L p j ---------------- / -------Pi V T
/ dpn> dh- dhmh h —------ 1- P(\hm ------+ pr\h—-----
dT dT dT
(r kl R(°n ^ i
+ (t ~ T V o D <*tn *sv v Tv R a r & T ) a f , , dP Q , ^ h t_ .v ^ rr-p \P l J y j qj PQ"m qj + PO n qj
Dn l V T 9 n , urit _ at ms v v a _ i_ mLp' ~p,-------PoK ~8T
+ | C ^ p X + C ^ k a + c ^ p , D^ v e - p oK _ CplP, A ,1(7- _ Tr)
+ Lpvka
Pi
ds
K r .=
Kn., =- { T - T r)C pp l lh Lr,
P is\ + eXn y '\ d In cld y
D „ , v t 9„ . dh„+ Lp, ° " v v * ° p 0h - f
Pi dcd
+ ( T - T r) C o , D« ~ y * 0°-poh, ehPi del
J T = ( T - T r)Cplp lV -(k lVz)
(3.123)
(3.124)
(3.125)
(3.126)
3-32

Chapter 3 Theoretical Formulation
3.6 Reactive transport of multicomponent chemicals
The combined effect o f all the, hydrological, physical and geochemical processes on
multicomponent chemical transport must satisfy the principles of conservation of mass and
the principle o f conservation o f charge (e.g. Lasaga, 1979; Lichtner, 1995).The governing
equation for reactive transport o f multicomponent chemicals is formulated from the principles
of mass balance and charge conservation. The reactive transport o f multicomponent chemicals
is described in terms o f a set o f chemical components with the stoichiometries of species that
appear in the fluid. Since terminology o f chemical species or species may be repeatedly used
when the mechanisms or the processes are described, the distinction between species and
component is critical. Species and phases exist as real entities that can be observed in nature,
whereas components are simply mathematical tools for describing composition (Bethke,
1996).
The law of mass conservation for every chemical component describes the transport of a
dissolved chemical component and the associate chemical reactions. The chemical reactions,
in fact, accounts for the rate o f gain or loss o f chemical component due to homogenous and
heterogeneous geochemical reactions (Lichtner, 1995). Following Lichtner (1995) and
Seetharam (2003), the law o f conservation o f mass for the i h chemical component can be
written in a general form for unsaturated porous media as:
j . (e lcids v )+ f t {elsls v ) = - s w - i , p .m )
Ji is the total chemical flux that represents the major hydraulic and physical processes
affecting the transport o f chemical in porous media, s, denotes a geochemical sink/source term
in mass conservation equation which stands for the amount o f f h chemical component which
is produced or depleted due to geochemical reactions. The geochemical sink/source term in
the governing chemical transport equation is evaluated using geochemical model PHREEQC
version 2 which is coupled with the transport model. The geochemical sink/source term is the
resultant of the homogenous and heterogeneous geochemical reactions in the system.
One o f the fundamental properties o f an aqueous solution is that it is electrically neutral on
macroscopic scale (Lichtner, 1996; Bethke, 1996). The general form of charge conservation
can be obtained by multiplying the mass conservation equation by the charge of fh component
and summing over all components (Lichtner, 1996). Accordingly, if equation (3.127) is
3-33

Chapter 3 Theoretical Formulation
multiplied by the associate charge o f the component for every component and followed by
summing over all components, the general charge conservation is obtained:
nc / ~ \ nc nc
) + = 0 (3.128),=i y ,=i 01 /=i
where z, is the charge of t h species and F is the Faraday constant.
The electro-neutrality in principle is associated with two separate physical requirements, if then c *
charge is assumed to be conserved over geochemical reactions, i.e. These;=1 “t
two conditions related to the physical processes, i.e. non-reactive transport, may be given as
(e.g. Lasaga, 1979; Boudreau et al., 2004):
1. The total charge should be conserved, i.e. no net charge condition, given as:
nc
£ £ < ® , / V > 9 = 0 (3.129),=1 01
2. No electrical current should run through the solution, i.e. no current condition, given as:,
nc
£ v (Fz,J , ) = 0 (3.130)(=1
The major mechanisms for the physical processes, i.e. non-reactive transport, comprise the
processes o f advection, dispersion and diffusion in general. The mechanisms of transport of
chemicals and the governing equations are discussed in the following section.
3.6.1 Transport processes and mechanisms
The chemical flux of f h component in general consists o f contributions from advective,
diffusive and dispersive transport mechanisms (Bear and Verruijt, 1987; Lasaga, 1998), given
as:
j . = j Adv + J ;Dlfr +J fD,sp (3.131)
where, J fdv, J,D,1Tand J,DUp stand for advective, diffusive and dispersive flux, respectively.
3-34

Chapter 3 Theoretical Formulation
Each o f the effective transport mechanisms are discussed separately as follows:
3.6.1.1 Advection
Advection describes the movement o f solutes carried by the water flow and can be defined by
a convective flux component. In fact it involves simply the spatial translation of dissolved
chemical species at the rate o f movement o f the bulk fluid (Steefel, 2007). The rate of
transport via advection is the average linear velocity defined in equation (3.25), in the
direction o f flow. The advective flux may be given as (e.g. Bear and Verruijt, 1987; Lasaga,
1998; Seetharam, 2003; Steefel, 2007):
J,Adv= c > , (3.132)
where V| represents the velocity o f liquid water which is calculated using equation (3.25).
In order to consider the osmosis effects on the advective flux, it has been suggested to reduce
the advective flux by a reduction factor as a function o f osmotic efficiency (e.g. Malusis and
Shackelford, 2002; Manassero and Dominijanni, 2003) as:
J,Adv= ( l - ® » , (3.133)
where con is the osmotic efficiency coefficient. In an ideal membrane, no chemicals can move
with liquid which is reflected properly with this equation.
3.6.1.2 Diffusion
The process o f diffusion is the spreading o f the solute molecules through the fluid by virtue of
their kinetic motion, even when the fluid is at rest (Crank, 1975). The forces driving the
diffusion of an aqueous species under isothermal condition, within a solvent reference frame,
are stemmed from both chemical potential and electrical potential gradients, i.e. the
electrochemical potential gradient (Miller, 1966; Lasaga, 1979, Oelker, 1996, Cussler, 1997).
It is also well established that under non-isothermal conditions, a temperature gradient can
also induce mass flow due to thermal diffusion, i.e. Soret-Ludwig effect or Soret effect (e.g.
Lasaga, 1998; Platten, 2006).
3-35

Chapter 3 Theoretical Formulation
The diffusion process in clays and more specifically in compacted swelling clays is highly
affected by the specific microstructure evolution and surface electrostatic forces o f the clay
minerals (e.g. Jougnot et al., 2009; Oscarson, 1994; Pusch and Yong, 2006; Van Loon, 2007;
Appelo and Wesin, 2007). As a result, the diffusion rate o f an ionic species may vary with the
type of moving ion in the system which consequence a macroscopic electrical field in pore
fluid. This requires the modelling o f diffusion process under coupled chemical and electrical
potential effects to maintain the balance in the electroneutrality of pore fluid. Under non-
isothermal conditions and in multiple ionic systems, the diffusion flux has to be obtained due
to electrochemical and thermal diffusion i.e. Soret effect, potentials.
In order to incorporate the electro-neutrality condition in both molecular and thermal
diffusion explicitly, the general derivation o f diffusion flux in aqueous system under coupled
chemical, electrical and thermal potentials is revisited in this section. The derivation follows a
similar to that approach proposed by Lasaga (1979) for multicomponent diffusion under
isothermal condition and adopted by various researchers (e.g. Lichtner, 1995; Oelkers, 1996;
Boudrau et al., 2004; Appelo and Wersin, 2007). However, thermal diffusion is included as an
additional component o f the diffusion flux in the approach proposed.
Lasaga (1998) presented the total diffusive flux o f a chemical component due to the coupled
electrochemical and thermal potentials based on the irreversible thermodynamics:
JDI" = -L „ [V//, + F z , V & \ - L lq (3.134)
where, the first term o f the equation represents the diffusion flux due to the chemical and
electrical potentials and the second term represents the thermal diffusion, where, Lu stands for
the phenomenological transport coefficient due to electrochemical potential and Liq represents
the phenomenological coefficient o f thermally induced chemical diffusion for the i4h chemical
component. //, represents the chemical potential and z, is the charge of the t h chemical
component, respectively. F denotes the Faraday’s constant, 0 refers to the electrical potential
of the solution and T is the absolute temperature.
The chemical potential o f a chemical species in a non-ideal solution is a function of chemical
concentration, activity coefficient and temperature, expressed as (e.g. Lasaga 1979; Oelker,
1996):
3-36
Chapter 3 Theoretical Formulation
fil =M ° + R T \n ( y lc ‘d ) (3.135)where, ft0 denotes the chemical potential at reference state. R is the gas constant, y, is the
• jhactivity coefficient of the / chemical component; which accounts for the non-ideality of the
aqueous solution, i.e. aqueous concentration effects. The activity coefficient decreases with
increasing ionic strength up to 0.1 mol/kg and it is always lower than the concentration,
because charged ions reduce the activity o f each other in solution through interactions
(Merkel et al., 2005).
Following Lasaga (1998) and Ballufi et al. (2005), if the spatial derivative of the gradient of
chemical potential, i.e.,V/^, is replaced by its derivatives with respect to chemical
concentration and temperature, the diffusion flux can be given as:
JDiff =-z,; ii Ml Vc' + F z , V 0 dc'd
4T
1 1
CD
^
+
1 1
v rv
Electrochem ical diffusion V"Thermal diffusion
(3.136)
The term inside the second bracket in the coefficient for thermal diffusion is known as the
heat of transport ( Q ).
The heat o f transport is mathematically a combination o f the derivative o f chemical potential
with respect to temperature and the ratio o f thermally induced diffusion off-diagonal
phenomenological coefficient to the on-diagonal diffusion coefficients (Ballufi et al., 2005)
as:
Q ‘ = T ^ f + ^ - (3.137)
The heat of transport corresponds to the energy state o f the diffusing ions in the regions with
different temperatures which directly corresponds to the entropy of transport (Agar et al.,
1989; Balluffi et al., 2005).
The phenomenological coefficients o f diffusion for each component Lih can be approximated
from their respective tracer diffusion coefficient in water (Lasaga, 1979; Oelkers, 1996) as:
D °cl.t _____ i d
" " R T(3 .1 3 8 )
3-37

Chapter 3 Theoretical Formulation
where refers to the tracer diffusion coefficient o f the subscripted component in pure water.
Substituting the phenomenological coefficient using equation (3.138), following Lasaga
(1979), and the heat of transport, defined by Ballufi et al. (2005) from equation (3.137) into
equation (3.136), the diffusion flux is represented as:
is identical to the diffusive flux for multicomponent chemicals presented by several
researchers (e.g. Lasaga, 1979; Boudrau et al., 2004; Appelo and Wersin, 2007). The third
term represents the effects o f including thermal diffusion in a multi-ionic system.
Overall electroneutrality requires that no electrical current, should run through the solution
(after Lasaga, 1979), i.e., equation (3.128). Incorporating the no electrical current condition,
The gradient o f electrical potential can therefore be determined explicitly from equation
(3.140) as:
(3.139)
Under isothermal conditions, the diffusive flux is limited to the first and second terms which
n c
j = 0 , yields:
(3.140)
v<£ = - K LF
(3.141)nc
Note that the derivative o f chemical potential with respect to chemical concentration is given
as (Oelkers, 1996):
dc'j c' d in c'd )fy* . r t ( x , g in y ,N (3.142)
3-38
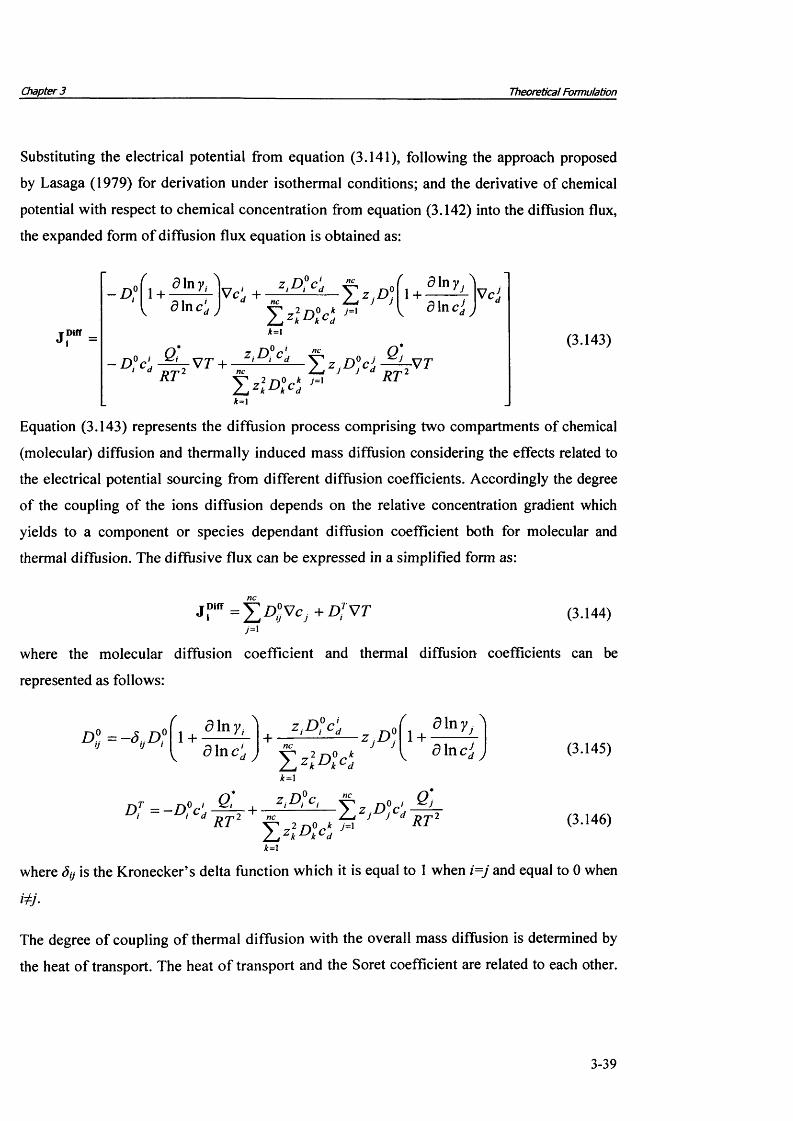
Chapter 3 Theoretical Formulation
Substituting the electrical potential from equation (3.141), following the approach proposed
by Lasaga (1979) for derivation under isothermal conditions; and the derivative o f chemical
potential with respect to chemical concentration from equation (3.142) into the diffusion flux,
the expanded form of diffusion flux equation is obtained as:
j r =
D? 1 +d In yid \n c[
V c ' + *‘D M3 In y,
1 + —S in c ’j j
Vc>d
~ D"cdoi q:RT'
V T +
k=1
' Z z l D l c
n c Q *
^ ZjDy d - J - r S T2 n 0/.* y=1
dR T ‘
*=i
(3.143)
Equation (3.143) represents the diffusion process comprising two compartments of chemical
(molecular) diffusion and thermally induced mass diffusion considering the effects related to
the electrical potential sourcing from different diffusion coefficients. Accordingly the degree
of the coupling of the ions diffusion depends on the relative concentration gradient which
yields to a component or species dependant diffusion coefficient both for molecular and
thermal diffusion. The diffusive flux can be expressed in a simplified form as:
J “m = X ° ° V cy +DJVTj=1
(3.144)
where the molecular diffusion coefficient and thermal diffusion coefficients can be
represented as follows:
r1 + d In yi
5 In c ’+ Z ‘ D ‘ C 'd Z j D 0
n c J J
d ; = - D , c d
X Z*2A °* = 1
0_, q : , z,d ?c,n c
1 +a In c Jd J
R T ‘+ J Cd
, Q),k 7=1 RT'
k=1
(3.145)
(3.146)
where dy is the Kronecker’s delta function which it is equal to 1 when i= j and equal to 0 when
The degree of coupling of thermal diffusion with the overall mass diffusion is determined by
the heat of transport. The heat o f transport and the Soret coefficient are related to each other.
3-39
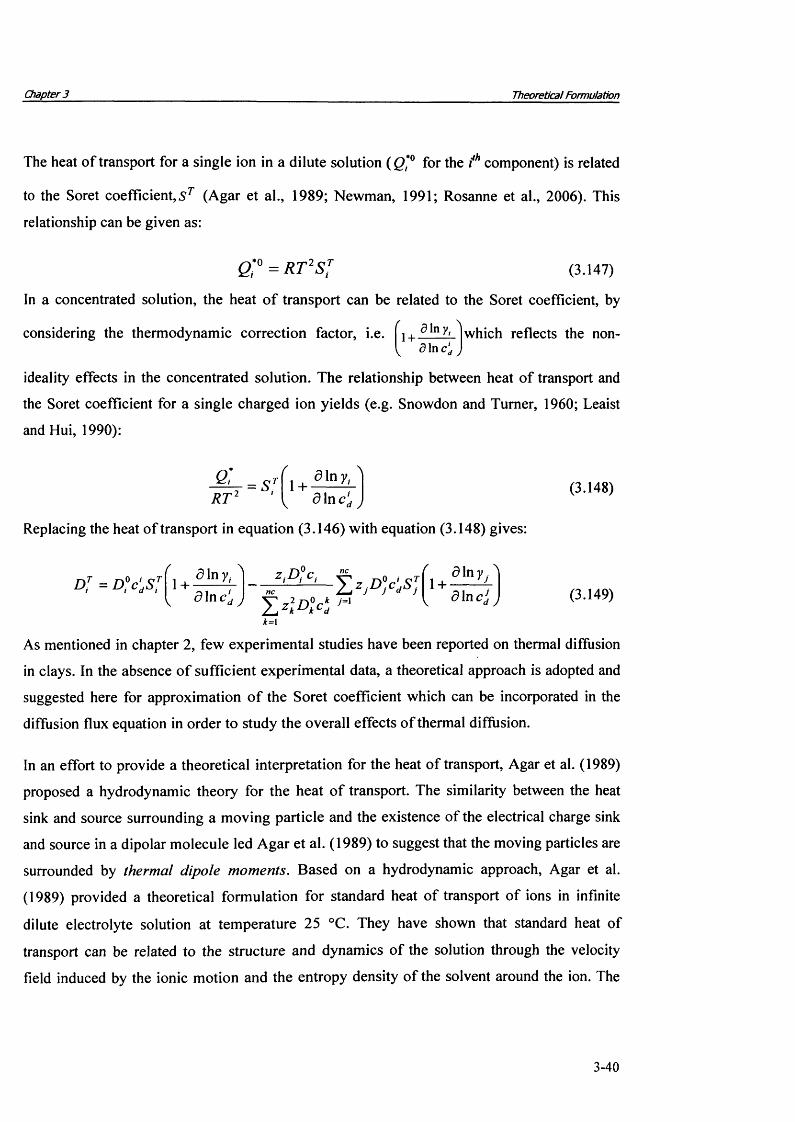
Chapter 3 Theoretical Formulation
The heat o f transport for a single ion in a dilute solution ( Q*° for the fh component) is related
to the Soret coefficient, ST (Agar et al., 1989; Newman, 1991; Rosanne et al., 2006). This
relationship can be given as:
Q]° = RT2S j (3.147)
In a concentrated solution, the heat o f transport can be related to the Soret coefficient, by
considering the thermodynamic correction factor, i.e. 1 + din Yi dlncl
which reflects the non-
ideality effects in the concentrated solution. The relationship between heat of transport and
the Soret coefficient for a single charged ion yields (e.g. Snowdon and Turner, 1960; Leaist
and Hui, 1990):
Q iR T :
= s: i +3 In yf 3 In cl
(3.148)d y
Replacing the heat of transport in equation (3.146) with equation (3.148) gives:
D t = D °c*SJi i d t 1 +3 In yj 3 Inc'
z D"cI I Id J Y ,4 D y d
n i1 +
3 In c j j (3.149)
k=i
As mentioned in chapter 2, few experimental studies have been reported on thermal diffusion
in clays. In the absence o f sufficient experimental data, a theoretical approach is adopted and
suggested here for approximation o f the Soret coefficient which can be incorporated in the
diffusion flux equation in order to study the overall effects o f thermal diffusion.
In an effort to provide a theoretical interpretation for the heat of transport, Agar et al. (1989)
proposed a hydrodynamic theory for the heat o f transport. The similarity between the heat
sink and source surrounding a moving particle and the existence of the electrical charge sink
and source in a dipolar molecule led Agar et al. (1989) to suggest that the moving particles are
surrounded by thermal dipole moments. Based on a hydrodynamic approach, Agar et al.
(1989) provided a theoretical formulation for standard heat of transport o f ions in infinite
dilute electrolyte solution at temperature 25 °C. They have shown that standard heat of
transport can be related to the structure and dynamics of the solution through the velocity
field induced by the ionic motion and the entropy density of the solvent around the ion. The
3-40
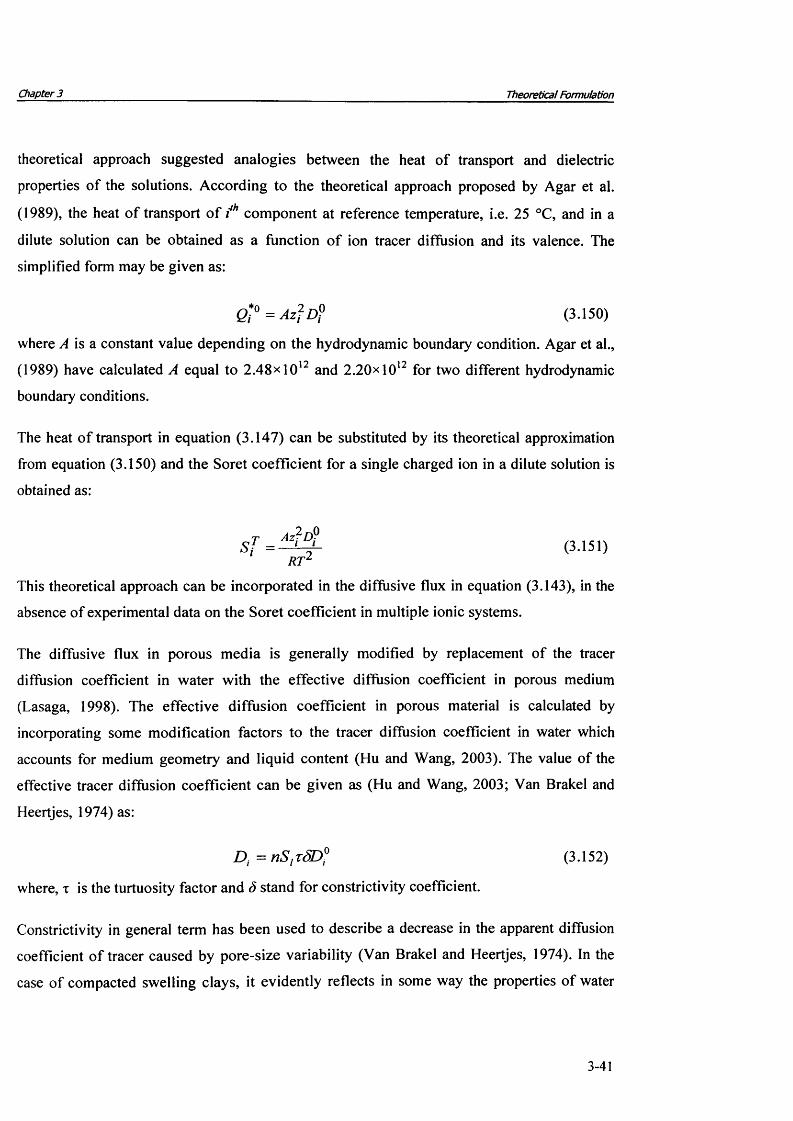
Chapter 3 Theoretical Formulation
theoretical approach suggested analogies between the heat of transport and dielectric
properties of the solutions. According to the theoretical approach proposed by Agar et al.
(1989), the heat o f transport o f f h component at reference temperature, i.e. 25 °C, and in a
dilute solution can be obtained as a function o f ion tracer diffusion and its valence. The
simplified form may be given as:
Q*° = A z f D f (3.150)
where A is a constant value depending on the hydrodynamic boundary condition. Agar et al.,
(1989) have calculated A equal to 2 .48x l012 and 2.20* 1012 for two different hydrodynamic
boundary conditions.
The heat o f transport in equation (3.147) can be substituted by its theoretical approximation
from equation (3.150) and the Soret coefficient for a single charged ion in a dilute solution is
obtained as:
S f = ^ - (3.151)RT
This theoretical approach can be incorporated in the diffusive flux in equation (3.143), in the
absence of experimental data on the Soret coefficient in multiple ionic systems.
The diffusive flux in porous media is generally modified by replacement of the tracer
diffusion coefficient in water with the effective diffusion coefficient in porous medium
(Lasaga, 1998). The effective diffusion coefficient in porous material is calculated by
incorporating some modification factors to the tracer diffusion coefficient in water which
accounts for medium geometry and liquid content (Hu and Wang, 2003). The value of the
effective tracer diffusion coefficient can be given as (Hu and Wang, 2003; Van Brakel and
Heertjes, 1974) as:
D , = nS, tSD (‘ (3.152)
where, x is the turtuosity factor and S stand for constrictivity coefficient.
Constrictivity in general term has been used to describe a decrease in the apparent diffusion
coefficient o f tracer caused by pore-size variability (Van Brakel and Heertjes, 1974). In the
case of compacted swelling clays, it evidently reflects in some way the properties of water
3-41
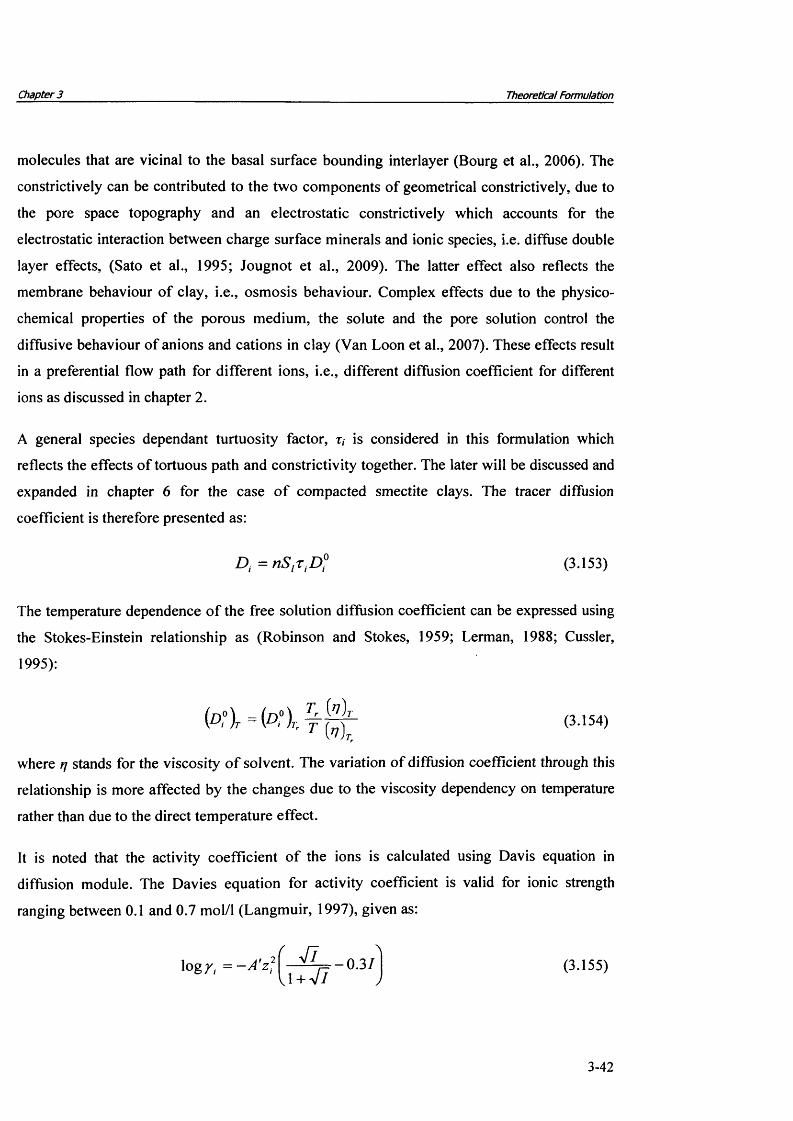
Chapter 3 Theoretical Formulation
molecules that are vicinal to the basal surface bounding interlayer (Bourg et al., 2006). The
constrictively can be contributed to the two components of geometrical constrictively, due to
the pore space topography and an electrostatic constrictively which accounts for the
electrostatic interaction between charge surface minerals and ionic species, i.e. diffuse double
layer effects, (Sato et al., 1995; Jougnot et al., 2009). The latter effect also reflects the
membrane behaviour o f clay, i.e., osmosis behaviour. Complex effects due to the physico
chemical properties o f the porous medium, the solute and the pore solution control the
diffusive behaviour of anions and cations in clay (Van Loon et al., 2007). These effects result
in a preferential flow path for different ions, i.e., different diffusion coefficient for different
ions as discussed in chapter 2.
A general species dependant turtuosity factor, r, is considered in this formulation which
reflects the effects o f tortuous path and constrictivity together. The later will be discussed and
expanded in chapter 6 for the case o f compacted smectite clays. The tracer diffusion
coefficient is therefore presented as:
The temperature dependence o f the free solution diffusion coefficient can be expressed using
the Stokes-Einstein relationship as (Robinson and Stokes, 1959; Lerman, 1988; Cussler,
1995):
relationship is more affected by the changes due to the viscosity dependency on temperature
rather than due to the direct temperature effect.
It is noted that the activity coefficient o f the ions is calculated using Davis equation in
diffusion module. The Davies equation for activity coefficient is valid for ionic strength
ranging between 0.1 and 0.7 mol/1 (Langmuir, 1997), given as:
(3.153)
(3.154)
where rj stands for the viscosity o f solvent. The variation o f diffusion coefficient through this
(3.155)
3-42

Chapter 3 Theoretical Formulation
where, A ’ is a temperature dependent parameter and I stands for ionic strength (i.e.nc
I = 0.5^T 0.00\c'dzf )•/=i
3.6.1.3 Dispersion
Due to the irregular shapes o f grains and pores, local fluid velocities inside individual pores
deviate from the average pore velocity and leading to a mixing process that is
macroscopically similar to mixing caused by the diffusive transport (Steefel, 2008). The term
mechanical dispersion is often used to describe mixing and spreading o f solute due to the
heterogeneity o f the microscopic velocities in the motion o f the fluid in terms of averaged and
measurable quantities (Bear and Verruijt, 1987). This process is caused by three microscopic
processes occurring in the pore channels (Mangold and Tsang, 1991; Oelkers, 1996):
• Mixing within individual pore channels due to differences in velocity of the molecules
between those in the middle o f the channel and those subject to dragging forces along
the pore walls (i.e. friction between mineral grains and fluids leads to relatively slower
flow rates along grain boundaries).
• Mixing caused by differences in pore channel sizes and hence velocities along the
flow path (i.e. the velocity o f solutes flowing in a porous medium varies according to
flow path).
• Differences caused by the branching o f flow channel paths in the solid matrix
(turtuosity) (i.e. at each pore space juncture there is both a mixing and a splitting of
the flow streams).
These three mixing processes cause spreading the solute both in the direction of the flow,
termed longitudinal dispersion, and in directions perpendicular to the flow, called transverse
dispersion. This can be represented by (Bear and Verruijt, 1987):
J,D,S|> =/»S/D„Vci (3.156)
3-43

Chapter 3 Theoretical Formulation
where, Dm is the coefficient o f mechanical dispersion and is considered to be a function of the
average velocity (Pickens and Gillham, 1980).
D. v v
+ ( a L - a T) (3.157)nS, ' - " n S , |v)
where |v| is the absolute average velocity o f advection flow, oll and <xt are longitudinal and
transversal dispersivity parameters, respectively. 8m„ denotes the Kronecker delta. vp and vq
are the velocities o f water in different spatial directions (e.g. x and y)
The chemicals are carried with the liquid flow; therefore the effects o f osmosis are also
applied to the dispersion. In other word, in an ideal membrane, the osmosis effects prevent the
migration o f chemicals with liquid water transfer. If the osmotic effects are also included
similar to the adaptation in equation (3.133); in the case of three dimensional transports, Dm
yields to a square matrix (3x3):
v.v.a 7.|vj + (a i aT) ^ (a L a T) j^J ^TJ ^(aL- a T)-
( \ v y v *{aL- a T) - yv vy v z
VV. V .
(aL- a T) - f
«7-H + (a L ~ < * r) “ « r )
(aL - a T)~’y f - a T|v| + (aL - a T
(3.158)
3.6.2 Geochemical reactions
In order to calculate the geochemical reactions, i.e. the sink/source term in the mass
conservation equation, an advanced geochemical model, PHREEQC version 2, (Parkhurst and
Appelo, 1999) was linked to the chemical transport model. A sequential approach was
incorporated for coupling the transport model and the geochemical model which will be
discussed in detail in the following chapter. In this coupling approach chemical transport
equations are solved first. Then the achieved converged value for each node is transferred to
the geochemical code. The values o f chemical concentration and geochemical parameters are
then updated via the geochemical modelling. The procedure is repeated for all subsequent
time-steps.
3-44

Chapter 3 Theoretical Formulation
PHREEQC version 2 is a computer program designed to perform low-temperature aqueous
geochemical calculations. The chemical reactions in and between aqueous, mineral and gas
phases can be modelled using this model. PHREEQC version 2 is capable to model both
equilibrium controlled and kinetically controlled geochemical reactions. The solid-solution
reactions, surface-complexation, and ion-exchange reactions can be modelled too.
In general, PHREEQC is based on an ion-association aqueous model and has capabilities for
speciation, saturation-index and batch-reaction. Non-equilibrium reactions can also be
modelled, including aqueous-phase mixing, user-specified changes in the elemental totals of
the system, kinetically controlled solid-liquid heterogeneous reactions, and to a limited extend
kinetically controlled aqueous homogeneous reactions. Kinetic reactions can be model with
user-defined rate expressions. Rate expressions written in the Basic language are included in
the input file, and the program uses the Basic interpreter to calculate the rate of reactions.
Modelling the reactions in equilibrium with fixed-volume or fixed-pressure gas phases has
been provided in PHREEQC; as well as modelling formation or dissolution of ideal,
multicomponent or nonideal, binary solid solutions. The generalized two-layer model of
Dzombak and Morel (1990), a model with an explicitly calculated diffuse layer (Borkovec
and Westall, 1983), and a non-electrostatic model (Davis and Kent, 1990) have been
incorporated for modelling surface-complexation reactions. Surface complexation constants
for two of the databases distributed with the program {phreeqc.dat and wateq4f.dat) are taken
from Dzombak and Morel (1990); surface complexation constants for the other database
distributed with the program (minteq.dat) are taken from MINTEQA2 (Allison et al., 1990).
Ion-exchange reactions are modelled with the Gaines-Thomas convention and equilibrium
constants derived from Appelo and Postma (1993) are included in two of the databases
distributed with the program {phreeqc.dat and wateq4f.dat).
The activity coefficient of ions can be calculated by different equations including Davies
equation and extended Debye-Hiickel equation (valid up to 0.7 mol/1). For high ionic
concentrations (up to 6 mol/1), PHREEQC version 2.12 included an implementation of the
Pitzer specific-interaction activity coefficient formulation which can be simply used though
"pitzer.dat" database.
3-45
Chapter 3 Theoretical Formulation
Any number of solution compositions, gas phases, or pure-phase, solid-solution, exchange, or
surface-complexation assemblages can be defined in PHREEQC. Batch reactions allow any
combination o f solution (or mixture o f solutions), gas phase, and assemblages to be brought
together, any irreversible reactions are added, and the resulting system is brought to
equilibrium. If kinetic reactions are defined, then the kinetic reactions are integrated with an
automatic time-stepping algorithm and system equilibrium is calculated after each time step.
Detailed information about the theoretical and numerical formulations of the geochemical
model can be found in Parkhust and Appelo (1999).
The geochemical features which have been so far linked and verified (presented in chapter 5)
include:
• Equilibrium reactions, tested for precipitation/dissolution of minerals
• Kinetically controlled, reactions tested for precipitation/dissolution of minerals
• Ion exchange process, tested under equilibrium conditions
The surface complexation features o f PHREEQC such as the calculation of the diffuse double
layer are not linked explicitly with transport module. However, this feature can be used to
calculate the distribution of chemicals in DDL space.
Mineral precipitation and dissolution during the reactive transport can change the water and
chemical flow properties as the variation of the mineral volume during
precipitation/dissolution can change the available porosity for the flow processes. Porosity
feed back from geochemical model has been also implemented in the computational code.
The volumes of solid minerals which can be accumulated or dissipated after
precipitation/dissolution calculation are likely to change the flow parameters. The porosity is
modified after geochemical calculation and its modified value is sent back to the hydraulic
and chemical transport modules, which modify the transport characteristics such as hydraulic
permeability or diffusion coefficient o f chemicals.
Following Steefel and Lasaga, (1994) and Sonnenthal et al. (2003), the permeability variation
caused by a change in porosity can be simplified form of the Kozeny-Carmen equation;
therefore:
3-46
Chapter 3 Theoretical Formulation
(3.159)
where, ksat and no are the saturated permeability and its associate porosity.
The computational aspects of porosity feed back will be discussed more in the following
chapter.
3.6.3 Implementation of mass and charge conservation laws
The total flux of each component due to the transport mechanism including advection,
diffusion and dispersion can be replaced from equations (3.133), (3.144) and (3.156),
respectively into the mass conservation, equation (3.127), giving:
f f o c i a r )+ j ffas'Sr) = -V • [(1 - a , y d y,sv]~ V . («S,Dm Vc' Sv)(3.160)
In addition to the conservation o f mass, the overall charge must be conserved as stated in
along with the mass conservation equation for non-reactive transport and for all components.
geochemical reaction model, PHREEQC version 2; considers the charge conservation in the
species (and consequently the total concentration o f an element or element valence state) to
produce electro-neutrality in the solution (Parkhust and Appelo, 1999).
diffusive flux. The advective and dispersive fluxes were not considered in that equation
because all ions move with same rate or speed by advection and dispersion. Mathematically,
Lasaga (1979) and Boudreau et al. (2004) have shown that if overall charge conservation
equation is employed explicitly in combination with the nc conservation equations for mass,
equation (3.128). This includes employing no-charge and no-current conditions explicitly
In addition, the electro-neutrality must be maintained during geochemical reactions. The
reactions by adjusting the concentration pH in the solution. When specified, a charge-balance
equation is used in initial solution calculations to adjust the pH or the activity of a master
So far, the no-current condition has been applied explicitly to drive the electrical potential in
r)this is also obtained by integration over no-charge condition, i.e. 2hj^(nS,FzjCJd8V) = 0 .
3-47
Chapter 3 Theoretical Formulation
an over determined system of equations is obtained. To prevent this, Lasaga, (1979) proposed
that one o f the concentrations and its derivatives needs to be eliminated from all the model
equations in order to obtain both conditions explicitly. Hence, a particular dependent ion and
it’s concentration is eliminated from the model and its actual concentration is calculated by
knowing the concentration o f the remained nc-1 components through the charge conservation
equation (Lasaga 1981; Boudreau et al. 2004). In other words, the mass conservation is solved
for nc-1 components where the diffusive flux will no longer contain the mutual dependant
concentration effects. The concentration of the dependant component is then simply
calculated by means of the no-charge constraint. Lasaga, (1979) interpreted that one of the
concentrations and its derivatives need to be eliminated from all the model equations in order
to obtain a solution to a multicomponent ionic diffusion problem. This later procedure is not,
however, a mathematical or physical necessity. It is instead one possible route to solve the
new set of equations (Boudreau et al. 2004).
Accordingly, a particular dependent ion is eliminated from mass conservation and its actual
concentration is calculated by knowing the concentration of the remained nc-1 components
through the no-charge condition. If the first component is arbitrarily considered as dependant
ion, its concentration can be calculated according to the charge conservation equation.
ncz , c ld = - 2 > , c j (3.161)
j = 2
Substituting the concentration o f the first component from equation (3.161) and its derivative
into equations (3.145) and (3.149), the molecular diffusion coefficient and thermal diffusion
coefficient for all components, except the dependent component i.e., first component is
obtained as:
Chapter 3 Theoretical Formulation
d !+ — ----------------------------------
2 (ZiZ)t0 -z ,Df),tei
Diffusion flux for component 2 to nc does no longer contain the concentration of the first
component and its derivatives. Note that this flux is applied for nc-1 component. Hence, one
concentrations. The concentration o f dependent component is then simply calculated by
means of charge conservation, i.e. no-charge constraint.
Bethke (1996) stated that the electroneutrality condition is almost always used to set the bulk
concentration of the species in abundant concentration for which the greatest analytic
uncertainty exists. In practice, this component is generally selected as chloride (Cf) because
most commercial labs, unless instructed otherwise, report a chloride concentration calculated
by a rough charge balance rather than a value resulting from direct analysis.
3.6.4 Governing equations for chemical reactive transport
To form the governing equation for the reactive transport of chemicals, the general mass
conservation presented in equation (3.160) is expanded as follows:
Substituting d V from equation (3.10) in (3.160) yields:
Since the volume of the soil (solid) is assumed to remain constant, the term dVs can be
eliminated from equation (3.164). Moreover, by definition, it is known that n = e/(l+e).
Making these two changes to equation (3.164) yields:
can now solve a reduced set of nc-1 differential equations to obtain the nc-1 principal
+ e W , ] + $ [ » S M 1 + e W s] = - V ■ [(1 - « » , ( ! + e)SVs]
[ InS,DmVc'd(l + e ) 5 V \ - V • £ n S ,T ,D y Cj(l + e)SVs (3.164)
V [nSt'DjVTiX + e W ]
3-49

Chapter 3 Theoretical Formulation
1 + ^{eSis )i _ _ y [A _ \ , 1_ y . J) Vc/ 1( l + e)dt ( \ + e)dt * ^ ^ viJ F>/ *
-V - Z n S f t t i f t c jj =i
- v - ^ r / ^ v r ](3.165)
The first term on the left-hand side o f equation (3.165) can be represented as:
d M _ „ c a t , as,nSi - ^ - + nc' j ^ r + Slc'd de (3.166)(1 + e)dt dt ' '~ d dt ' ^ d (\ + e)dt
Substituting for the second and third terms for the time derivatives in the above equation from
equations (3.60), (3.57) and (3.63) will yield:
d j e S , ^ ) ? < L _ n c i ^ L ^ L + nci ®>Lds_dT_ ( \ + e)d t 1 d t d ds d t d ds dT dt
(3.167)
Substitution of velocity of water with the components from equation (3.25); massjhconservation equation for z component yields:
0 - o M ~ - Vu; + (l ~ ~ f Y j y ,cdVTr l o r l o j -j
nc . .
- { X - m y ^ z + Y X n S ^ +nS,rlD°}7cJ +r,S,T,DjVTj=X
Note that the above equation is applied for the T d to ncth chemical components.
(3.168)
Grouping the similar items, with some rearrangement, the governing equation for the reactive
transport of multicomponent chemicals in terms of primary variables will yield for the t h
chemical (i=2 to nc):
3-50

Chapter 3____________________________________________________________________ Theoretical Formulation
Cc I ^ L + C , M + Cdu
z- + C.d‘ dt °dT dt c<,° dt
V . K ,V » (]+ V . [KCdTVT}+ V . t'K'sVcf.i=1
+ J„
where;
C j = - nc, dSj_ “ ds
C , , = ncC“T d ds dT
n : d s i= nCd 1 7
c «'< = "s <
CCj, = nS,
CCi. = S , c > rP
/?/)) wc= (] - —f Z +"V/A7
Hl& j = 1
r. \ . RTco^ =(1 -<o„)cdkl- ^ - r i
J cd = - ( ! - ® , ) c ^ / V z
d l n / , A 1 + ^
V+ ^ /Dw+i*S/r/D;
(3.169)
(3.170)
(3.171)
(3.172)
(3.173)
(3.174)
(3.175)
(3.176)
(3.177)
(3.178)
(3.179)
If charge is conserved in the reaction sink/source terms separately, the charge conservation is
applied for the 1st chemical component from equation (3.129) which yields:
3-51

Chapter 3 Theoretical Formulation
'ST' c ’ST' j *-*7 ,sr' j dSt ds dT> nS.Z 7 - ^ -L^ - L + > Z,77C71 dt 4** 7 ds dt J d ds dT dt7 = 1 7=1 /=1(3.180)
+ £ z „ c j + £ z 5 c j m r P f t = 0^ J d ds dt 4 - 7 1 d dt7 = 1 7 = 1
Similarly, incorporating the sink/source term for the first component, the governing equation
is obtained in terms of primary variables as:
c ^L + c ZT+C ^ + f c ^-+C ^-+C 3a = 0 manc“l d t CdT d t Cd° d t CdCd d t CdS d t CdU d t (3.181)
7 = 1
where;
n c
C^ = - I \ zjnc7 = 1
dS,ds (3.182)
CcdT ~ X Zj nc7 = 1
t dSj__ds_d ds dT (3.183)
n c 3 0
C cc = nS tzcdcd 1
C c , s = n S I
(3.184)
(3.185)
(3.186)
Cc,u = Z z7‘V > 7’p (3.187)7 = 1
3-52

Chapter 3 Theoretical Formulation
3.7 Deformation behaviour
This section presents the theoretical background o f deformation behaviour in the model. Since
the deformation behaviour is not under detailed investigation in this thesis, only the general
framework o f mechanical/deformation model is provided for the sake of completeness. The
majority of the formulation for deformation behaviour has been previously presented by
Thomas and He, 1998; Cleall, 1998; Mitchell, 2002; Melhuish, 2004 and Vardon, 2009, based
on a elasto-plastic constitutive model, i.e., BBM developed by Alonso et al. (1990).
In this model, deformation is assumed to occur due to stress, suction and temperature. Any
deformation due osmosis effects is not dealt with in this work. It has been stated that the stress
state of soil in relation to volume change behaviour can be described by two independent
stress-state parameters (Fredlund and Rahardjo, 1993). The BBM uses this assumption and
uses two independent stress-state variables, net stress and suction. Alonso et al. (1990)
proposed an elasto-plastic work hardening constitutive model using net mean stress and
suction as the relevant stress variables. The net mean stress was defined as:
cr" — o — u a (3.188)
where o" represents the net stress and a is the total stress. In this work a tension positive sign
convention is adopted for stress, but the pore pressures, ui, and ua are defined as positive in
compression.
For an element o f soil with unit length and a cross sectional area of dxdydz under a system of
three-dimensional stresses and body forces, the stress equilibrium equation in an incremental
form can be represented as:
Ydcr” + Pm dua + db = 0 (3.189)
where b is the vector of body forces and P represents the strain matrix given as:
P =
f 0 0 # 0 #dx dz ay
o a o 4- 4- odz dx dyA. o — —dy dz dx
For a three dimensional analysis, the vector m T is defined as:
(3.190)
3-53

Chapter 3 Theoretical Formulation
m r =[l 1 1 0 0 0] (3.191)
To form a constitutive elasto-plastic model a series o f relationships are required. These are
defined below (Britto and Gunn, 1987; Owen and Hinton, 1980):
• constitutive elastic relationship
• yield function, defining the yield surface in stress space
• flow rule, defining the direction and magnitude of strains produced during yielding
• hardening law, defining the relationship between plastic strain and material hardening
These requirements are discussed briefly as follows.
3.7.1 Constitutive elastic relationship
For a soil exhibiting elasto-plastic behaviour, during any increment of stress, the change of
strain d s is assumed to be divided into elastic and plastic components (Owen and Hinton,
1980). The incremental strain can be expressed as:
d s = d s e + d s p (3.192)
where dse is the incremental elastic component o f strain, and d # is the incremental plastic
component o f strain.
Thomas and He (1995), based on the proposed approach by Wang (1953), stated that the
incremental elastic strain may be written as:
d s e — d s ep + ds* + d S j (3.193)
where s is the strain vector, and the subscripts /?, s, and T, represent the components due to
change in stress, suction, and temperature respectively.
Based on generalised Hooke’s law, the constitutive elastic relationship, i.e. stress-strain
relationship can be described as follows:
d a ’ = Dd e ‘p = D ( d s - d e ‘ - d s ‘ - d e p) (3.194)
where D represents the elasticity matrix.
3-54

Chapter 3 Theoretical Formulation
It is assumed that the elastic deformation o f partially saturated soil is due to changes in the net
stress and the suction under isothermal conditions, (Alonso et al., 1990). Suction changes are
also assumed that only produce volumetric strain. The elastic volumetric strain components
due to suction and temperature changes can be presented as (Thomas and He, 1995):
* g Ks ds t ,de = --- - - ---------- = Asds (3.195)
V CS + Pa,ms)
d e eT = dT + A„ -— dT\ vo
= \ A r + A s — JdT (3.196)
Where v is the specific volume, tcs represents the slope of the specific volume-suction (v-s)
curve, in the elastic region, and p atms, is the atmospheric pressure added to avoid infinite
values o f strain as suction approaches zero, ar stands for the coefficient o f thermal expansion,
and vo is the initial specific volume. The relationships were presented in simplified forms
using parameters As and A t.
3.7.2 Yield function
The yield criteria function determines where stress starts to yield. Alonso et al. (1990)
proposed the use o f two yield functions, the loading-collapse (LC) curve and the suction-
increase (SI) curve. The LC curve indicates that yielding occurs when pre-consolidation
stress reaches a critical stress value, po. The SI curve indicates that yield occurs when suction
reaches a critical value, s0 .These two yield functions can be mathematically represented as:
Fi(p,q,s,p'0) = q2 - M 2(p + ps)(p0 - p)= 0 (3.197)F 2( s , s 0 ) = s - s 0 = 0 (3.198)
where q is the deviatoric stress, M is the slope o f the critical state line, p 0 is the pre
consolidation stress, p s is related to the suction effect on the cohesion o f the soil and so is the
previously attained maximum value o f suction.
Alonso et al. (1990) proposed the following equation, which defines the set of yield p 0 values
for the associated suction values:
3-55
Chapter 3 Theoretical Formulation
13
1° = Po
\ P c ) K P c ;
f M°)-vI *(*)-*■ (3.199)
where pq is the pre-consolidation stress o f saturated soil, p c is the reference stress, is the
stiffness parameter for changes in net mean stress for virgin states of the soil and A(0) is the
stiffness parameter for changes in net mean stress for virgin states of saturated soil.
Alonso et al. (1990) proposed an asymptotic expression for the prediction of the virgin soil
stiffness parameter, A(s), as:
A(s) = A(oX(l - r)exp(- fis) + r ] (3.200)
where /? is a parameter controlling the rate o f increase of soil stiffness with suction, and the
parameter r controls the maximum stiffness o f the soil.
3.7.3 Flow rule
As yield occurs, the plastic strain increment is related to the stress gradient by definition of a
flow rule. This theoretical assumption is termed the flow rule as it governs the plastic flow
after yielding. Therefore, flow rules are required to define the magnitude of plastic strains
produced when the material is yielding. Alonso et al. (1990) proposed two types of flow
rules. An associated plastic flow rule for the SI surfaces and a non-associated flow rule for
the LC yield surface.
Thomas and He (1998) proposed the use o f these functions as plastic potentials. The plastic
potential for LC yield surface Q i, as defined by non-associated flow rule is:
Q x = a qq 2 - M 2{ p + p X P o ~ p ) (3.201)
The plastic potential for SI yield surface Q2, as defined by associated flow rule is:
Q 2 = s ~ s 0 (3.202)
Assuming that the elastic strain increment is zero, aq was defined by Alonso et al. (1990) as:
3-56

Chapter 3 Theoretical Formulation
A/(A/ —9XA/ — 3)f ,_ , 'r 1 9 6(6 - M ) { X(0)/
It is assumed that the strain increment is proportional to the stress gradient of the plastic
potentials which yields:
d £ P = x ' ^ + x ^ (3-204)
where %\ and Xi are ptastic multipliers which are determined through plastic consistency
conditions (Alonso et al., 1990).
Accordingly, the plastic strain increments associated with yield surface Fj is,
& p = X , ^ j 1- = X , M 2(2p + p s - p 0) (3.205)up
de9 " x ' d t = x ' 2aqg (3-206)
Where aq is a constant derived from Ko, the ‘at rest’ stress state, where there is no lateral
deformation as defined by (Alonso et al., 1990).
The plastic strain increment associated with yield surface F2 can be given as:
dsp = x 2 ^ T = X2 (3.207)as
From the above discussions, the total plastic strain increment is considered as a sum of plastic
strain increments due to stress changes and suction changes.
3.7.4 Hardening law
After yielding, the stress level at which further plastic deformation occurs is dependent on the
current degree o f plastic straining. Josa et al. (1987) found there was a coupling between the
hardening o f the two yield surfaces. The yield surfaces are controlled by the hardening
parameters pq ands0 > and they depend on the plastic volumetric strain increm ent^/as:
d e l = d e p,p + d s p„ (3-208)
3-57
Chapter 3 Theoretical Formulation
The two hardening laws for the yield surfaces F\ and F2 are, respectively (Alonso et al.,
1990):
^ - = d£’ (3209) Po A 0 ) ~ Kdsn v . „— = r — (3. 210)
A 0 A s K s
where Xs is the stiffness parameter for changes in suction for suction virgin soil states.
3.7.5 Governing equation for deformation
As shown in section 3.7.1, the elastic stress-strain relationship can be related by the use of
elastic incremental constitutive matrix D. This elastic stiffness matrix is used to predict the
change in stress produced as a result o f changes in volumetric strain. However, if this stiffness
matrix was adopted whilst plastic deformation was occurring it would over-predict the change
in stress. Therefore the stiffness matrix D must be modified taking account of the plastic
strain produced due to an application o f load. The complete elasto-plastic incremental stress-
strain relation may now be formulated, after Owen and Hinton (1980):
d a " = O epd s ep (3.2U)
Mitchell (2002) defined the matrix Dep as:
D a ar \ da da
" — (m YdM (3'212)P { d a
where Ap is the plastic modulus defined as:
da”
^ ° M ^ + p ‘)W ^ P t^ ^ - M1{2p+p‘ ~ p^ (3 2 ,3 )
The stress-strain relationship expressed in equation (3.211) may now be given as:
d a =T>ep ( d s - d s es - d s eT - d s f ) (3.214)
Substitution of equations (3.195) and (3.196) into equation (3.214) gives:
3-58
Chapter 3 Theoretical Formulation
d a " = D e ( d £ - A sd s - ( A T + A s ^ - ) d T - d e ps )dT
(3.215)
The stress equilibrium equation (3.189) can be rewritten with substitution from equation
(3.215) as:
D e p
f fP Tdu + Asdu, - A A dsAt “I" A, ----
dTl T * s dT - A du„ - d s f + Pmdua + db = 0 (3.216)
The governing differential equation for this approach can then be written as:
C « d u , + C ald T + C aud u a + C m d u - PD epd e ? + d b = 0
where;
(3.217)
c * = PD epA ,
C . T = PD„,
(3.218)
(3.219)
Cua = ~ ™ epAs + m P
C = -P D Pu u * e p *
(3.220)
(3.221)
3-59
Chapter 3 Theoretical Formulation
3.8 Summary
This chapter presented the theoretical formulation for the thermo/hydro/chemical/mechanical
behaviour. The governing equations for moisture, air and heat transfer have been modified to
incorporate osmotic effects. Seetharam (2003) presented the effects of osmosis only on liquid
water transport and implicitly in the formulation while in the presented work; the osmotic
potential is calculated explicitly both in liquid water and vapour flow eqaution. Neglecting
included osmotic effect, the governing equations for the moisture and dry air transport are
identical to those proposed earlier (Ramesh, 1996; Thomas and He, 1998; Cleall, 1998;
Mitchell, 2002; Seetharam, 2003; Vardon, 2009). In terms of heat transport, osmosis effects
were included for the sake of completeness as it affects the formulation of fluid flux. In the
case of compacted swelling clay, further modifications to the flow properties and constitutive
equation will be provided in chapter 7 where in particular, a model for approximation of the
interlayer hydrate water is provided and the effects on flow behaviour will be expanded more.
The main contribution o f this chapter is in the development of the reactive transport of
multicomponent chemicals. Charge conservation law was explicitly included in the derivation
of formulation. The diffusive flux was modified in order to include the effect of
electrochemical diffusion potential, developing due to migration of chemical with different
rate of diffusion as it is expected in compacted clays. The formulation of multicomponent
chemical diffusion proposed by Seetharam (2003) is based on Fick’s law of diffusion in
which the overall neutrality condition is not satisfied when ions migrate with different
diffusion coefficients. In the formulation of the general diffusive flux presented in this
chapter, the derivation forces for diffusion are derived from combined electrical and chemical
potential rather than from the chemical concentration potential.
In addition, the effects o f thermal diffusion, i.e. Soret effect, was considered in an explicit
form which is combined with diffusion due to the electrochemical potential. A theoretical
approach for the Soret coefficient was adopted that can be applied in the absence of sufficient
experimental data. The individual requirements of overall charge conservation were included
in the formulation. Provided in this chapter, a general formulation for multi-chemical reactive
transport was presented where the advective flux, molecular and thermal diffusive flux and
dispersive flux have been considered as the main hydro/chemical potentials. The effects of
interlayer hydrate water and osmosis on tracer diffusion coefficient of ions in compacted
3-60

Chapter 3 Theoretical Formulation
clays were considered in a general turtuosity factor which can be different for different ions.
The later will be discussed more in chapter 6 for the case of compacted smectite clays.
Another highlight of the chemical governing equation is the coupling an advanced
geochemical model, PHREEQC version 2, in order to calculate the sink/source reaction term,
which represents the chemical reactions. PHREEQC version 2 has advantages over the
geochemical model, MINTEQA2 utilised by Seetharam (2003). The capability of modelling
kinetically controlled reactions, the implemented Pitzer’s equation for calculating activity
coefficient of ions in high ionic concentration solutions, and the availability of various
databases in the package are among the highlights of this model in the framework of the
modelling geochemical processes in compacted clays. The theoretical basis for the
geochemical reactions has not been covered in this chapter as the proposed model utilises an
existing geochemical model, PHREEQC version 2, for this purpose. Details information about
the theoretical and numerical formulation of PHREEQC version 2 has been provided by
Parkhust and Appelo (1999).
The effects o f mineral precipitation/dissolution on flow parameter were implemented as a
porosity modification feed-back from the geochemical model. In other words, flow
parameters such as hydraulic conductivity, is modified due to variation in porosity with
mineral precipitation or dissolution.
Finally, the theoretical formulation for deformation proposed by Thomas and He (1998) based
on Alonso’s model has been briefly covered.
3-61

Chapter 3 Theoretical Formulation
3.9 References
Allison, J.D., Brown, D.S. and Novo-Gradac, K.J. (1991). MINTEQA2 user manual version
3.0. Environmental Research Laboratory, US EPA.
Alonso, E.E., Gens, A., and Josa, A. (1990). A constitutive model for partially saturated
soils. Geotechnique, 40(3), 405-430.
Agar, J.N., Mou, C.Y., and Lin, J. (1989). Single-ion heat of transport in electrolyte
solutions, A hydrodynamic theory. Journal o f Physical Chemistry, 93, 2079-2082.
Alonso, E.E., Battle, F., Gens, A., and Lloret, A. (1988). Consolidation analysis of partially
saturated soils- Application to earth dam construction. Numerical Methods in Geomechanics,
1303-1308.
Appelo, C.A.J., and Postma, D. (1993). Geochemistry, Groundwater and Pollution. A.A.
Balkema, Rotterdam.
Appelo, C.A.J., and Wersin, P. (2007). Multicomponent diffusion modeling in clay systems
with application to the diffusion of tritium, iodide and sodium in Opalinus clay.
Environmental Science and Technology, 41, 5002-5007.
Baker, R., and Frydman, S. (2009). Unsaturated soil mechanics-Critical review of physical
foundations. Engineering Geology, 106, 26-39.
Balluffi, R.W., Allen, S.M., and Carter, W.C. (2005). Kinetics o f Materials, (ed. Kemper, R.
A.), John Wiley and Sons Inc.
Bear, J. and Verruijt, A. (1987). Modeling Groundwater Flow and Pollution. D. Redel Pub.
Co., Dordrecht.
Bethke, C.M. (1996). Geochemical Reaction Modeling: Concepts and Applications. Oxford
University Press.
Borkovec, M., and Westall, J. (1983). Solution of the \Poisson-Boltzmann equation for
surface excesses of ions in the diffuse layer at the oxide-electrolyte interface. Journal o f
Electroanalytical Chemistry, 150, 325-337.
Boudreau, B.P., Meysman, F.J.R. and Middelburg, J.J. (2004). Multicomponent ionic
diffusion in pore waters: Coulombic effects revisited. Earth Planetary Science Letters, 222,
653-666.
3-62

Chapter 3 Theoretical Formulation
Bourg, I.C., Sposito, G., and Bourg, A.C.M. (2006). Tracer diffusion in compacted, water-
saturated bentonite. Clays and Clay Minerals, 54 (3), 363-74.
Britto, A.M., and Gunn, M.G. (1987). Critical State Soil Mechanics via Finite Elements. Ellis
Horwood Ltd.
Campbell, G.S. 1985. Soil physics with BASIC. Elsevier, New York.
Carman, P.C. (1956). Flow o f gases through porous media. Butterworths Scientific
Publications, London.
Cleall, P.J. (1998). An investigation o f the thermo/hydraulic/mechanical behaviour o f
unsaturated soils, including expansive clays, Ph.D. Thesis. Cardiff University, Wales, U.K.
Crank, J. (1975). The Mathematics o f Diffusion. 2nd ed., Clarendon, Oxford.
Cussler, E.L. (1997). Diffusion-Mass Transfer in Fluid Systems. University Press,
Cambridge, 2nd Edition.
Davis, J.A., and Kent, D.B. (1990). Surface complexation modeling in aqueous
geochemistry. In Hochella, M.F., and White, A.F., (eds.), Mineral-Water Interface
Geochemistry: Washington D.C., Mineralogical Society o f America, Reviews in Mineralogy,
23,177-260.
de Vries, D.A. (1958). Simultaneous transfer of heat and moisture in porous media.
Transaction American Geophysical Union, 39(5), 909-916.
de Vries, D.A. (1966). Physics o f Plant Environment. 2nd Edition, North Holland Publishing
Company, 215-235.
Delage, P. (2002). State of-the-art-report: experimental unsaturated soil mechanics. 3rd
International Conference on Unsaturated Soils, Recife, Brazil.
Derjaguin, B.V., Churaev, N.V., and Muller, V.M. (1987 ). Surface Forces. Plenum, New
York.
Dzombak, D.A., and Morel, F.M.M. (1990). Surface Complexation Modeling-Hydrous
Ferric Oxide. New York, John Wiley.
Edelfsen, N.E., and Andersen, A.B.C. (1943).Thermodynamics o f soil moisture. Hilgardia,
15(2), 31-298.
3-63

Chapter 3 Theoretical Formulation
Ewen, J., and Thomas, H.R. (1989). Heating unsaturated medium sand, Geotechnique, 39(3),
455-470.
Fredlund, D.G., and Rahardjo, H. (1993). Soil Mechanics for Unsaturated Soils. John Wiley,
New York.
Fritz, S.J. (1986). Ideality o f clay membranes in osmotic processes: A review. Clays and
Clay Minerals, 34(2), 214-223.
Grant, S.A., and Salehzadeh, A. (1996). Calculations of temperature effects on wetting
coefficients of porous solids and their capillary pressure functions. Water Resource
Research, 32, 261-79.
Geraminegrad, M., and Saxena, S. (1986). Finite Elements in Plasticity: Theory and
Practice. Pineridge Press Ltd., Swansea.
Hu, Q.H., and Wang, J.S.Y. (2003). Aqueous-phase diffusion in unsaturated geological
media: A review. Critical Reviews in Environmental Science and Technology, 33(3), 275-297
Jakob, M. (1949). Heat Transfer: Vol 1. Wiley.
Josa, A., Alonso, E.E., Lloret, A., and Gens, A. (1987). Stress-strain behaviour of partially
saturated soils. In Proceedings o f the y European Conference on Soil Mechanics and
Foundation Engineering, Dublin, 2, 561-564.
Jougnot, D., Revil, A., and Leroy, P. (2009). Diffusion of ionic tracers in the Callovo-
Oxfordian clay-rock using the Donnan equilibrium model and the formation factor.
Geochimica et Cosmochimica Acta, 73(10): 2712-2726.
Kaye, G.W.C., and Laby, T.M. (1973). Tables o f Physical and Chemical Constants. 14th
Edition, Harlow, Longman.
Kharaka, Y.K., and Berry, F.A.F. (1973). Simultaneous flow of water and solutes through
geological membranes-I. Experimental investigation. Geochimica et Cosmochimica Acta,
37(12), 2577-2603.
Langmuir, D. (1997). Aqueous Environmental Geochemistry. Prentice Hall.
Lasaga, A.C. (1979). The treatment of multicomponent diffusion and ion pairs in diagenetic
fluxes. American Journal o f Science, 279, 324-346.
3-64

Chapter 3 Theoretical Formulation
Lasaga, A.C. (1981). Reply-diffusion of seawater ions: significance and consequences of
cross coupling effects: further comments and clarifications. American Journal o f Science,
281,981-988.
Lasaga, A.C. (1998). Kinetic Theory in the Earth Science. Princeton Series in Geochemistry,
Princeton University Press.
Leaist, D.G., and Hui, L. (1990). Conductometric determination of the Soret coefficients of a
ternary mixed electrolyte-Reversed thermal diffusion of sodium chloride in aqueous sodium
hydroxide solutions. Journal o f Physical Chemistry, 94, 447-451.
Lerman, A. (1979). Geochemical Processes, Water and Sediment Environments. Wiley, New
York.
Lichtner, P.C. (1995). Principles and practice of reactive transport modelling. Material
Research Society Symposium Proceeding, 353, 117-130.
Lichtner, P.C. (1996). Continuum formulation of multicomponent multiphase reactive
transport. In Reactive Transport in Porous Media: Reviews in Mineralogy, 34, 1-81.
Malusis MA, Shackelford C.D. (2002). Theory for reactive solute transport through clay
membrane barriers. Journal o f Contaminant Hydrology, 59,291-316.
Manassero, M., and Dominijanni, A. (2003). Modelling the osmosis effect on solute
migration through porous media. Geotechnique, 53, 481-92.
Mangold, D.C., and Tsang, C.F. (1991). A summary of subsurface hydrological and
hydrochemical models. Review o f Geophysics, 29(1), 51-79.
Mayhew, Y.R., and Rogers, G.F.C. (1976). Thermodynamic and Transport Properties o f
Fluids. 2nd Edition, Blackwell, Oxford.
Melhuish, T.A. (2004). An investigation o f the three-dimensional thermo/hydro/mechanical
behaviour o f large scale in-situ experiments. PhD Thesis, Cardiff University, Cardiff.
Merkel, B.J., Planer-Friedrich, B. and Nordstrom, D.K. (2005). Groundwater Geochemistry:
A Practical Guide to Modeling o f Natural and Contaminated Aquatic Systems, Springer.
Miller, D.G. (1966). Application of irreversible thermodynamics to electrolyte solutions. I
determination of ionic transport coefficients Iy for isothermal vector transport processes in
binary systems. Journal o f Physical Chemistry, 70, 2693-2659.
3-65

Chapter 3 Theoretical Formulation
Mitchell, J.K. (1993). Fundamentals o f Soil Behaviour. John Wiley, New York.
Mitchell, H.P. (2002). An investigation into the thermo/hydro/mechanical interactions
involved in high level nuclear waste disposal. PhD Thesis, University of Wales, Cardiff.
Newman, J. (1991). Electrochemical Systems. Prentice-Hal., New Jeresy, 2nd Edition.
Olson, R.E. (1963). Effective stress theory of compaction. Proceedings o f the American
Society o f Civil Engineering, 81, 27-44.
Oelkers, E. (1996). Physical and chemical properties o f rocks and fluids fo r chemical mass
transport calculations. In Reactive Transport in Porous Media, Reviews in Mineralogy, 34,
130-191.
Or, D., and Wraith, J.M. (2001). Soil Water Content and Potential. In: Warrick A. (ed.), Soil
Physics Companion. CRC Press, Boca Raton, FI.
Oscarson, D.W. (1994). Surface diffusion: Is it an important transport mechanism in
compacted clays? Clays and Clay Minerals, 42, 534-543.
Owen, D.R.J., and Hinton, E. (1980). Finite Elements in Plasticity: Theory and Practice.
Pineridge Press Ltd., Swansea.
Parkhurst, D.L., and Appelo, C.A.J. (1999). User’s Guide to PHREEQC (version 2), U.S.
Geological Survey, Water Resource Investigation Report, 99-4259.
Partington, J.R. (1949). Advanced Treatise on Physical Chemistry, Volume 1, Longmans,
London.
Philip, J.R. (1977). Unitary approach to capillary condensation and adsorption. Journal o f
Chemical Physics, 66, 5069-75.
Philip, J.R., and de Vries, D.A. (1957). Moisture movement in porous materials under
temperature gradients. Transaction American Geophysical Union, 38(2), 222-232.
Pickens, J.F. and Gilham, R.W. (1980). Finite element analysis o f solute transport under
hysteresis unsaturated flow conditions. Water Resource Research, 16, 1071-1078.
Platten, J.K. (2006). The Soret effect: A review of recent experimental results. Journal o f
Applied Mechanics, 73, 5-15.
3-66
Chapter 3 Theoretical Formulation
Pollock, D.W. (1986). Simulation o f fluid flow and energy transport processes associated
with high-level radio active waste disposal in unsaturated alluvium, Water Resources
Research, 22(5), 765-775.
Preece, R.J. (1975). The measurement and calculation o f physical properties o f cable
bedding sands. Part 2; specific thermal capacity, thermal conductivity and temperature ratio
across ‘a ir ’filled pores, C.E.G.B. Laboratory Note No. RD/L/N 231/74.
Pusch, R. (1998). Microstructural evolution o f buffer clay. In Proceedings o f workshop on
microstructural modelling o f natural and artificially prepared clay soils with special
emphasis on the use o f clays fo r waste isolation, Lund, 31-38.
Pusch, R. and Yong, R.N. (2006). Microstructure o f Smectite Clays and Engineering
Performance. Taylor and Francis, New York.
Ramesh, A.D. (1996). Modelling the thermo/hydraulic/mechanical behaviour o f unsaturated
soil using an elasto-plastic constitutive relationship, Ph.D thesis. University of Wales
Cardiff.
Robinson, R.A., and Stokes, R.H. (1959). Electrolyte Solutions. Butterworth and Co. Ltd.
Rodebush, W.H., and Buswell, A.M. (1958). Properties o f Water Substances. Highway
Resources Board Special Report, No. 40.
Romero, E., Gens, A., and Lloret, A. (2001). Temperature effects on the hydraulic behaviour
of an unsaturated clay. Geotechnical and Geological Engineering, 19, 311-32.
Romero, E.M., and Vaunat, J. (2000). Retention curves of deformable clays. In Tarantino, M.
(ed.), Conference on Experimental Evidence and Theoretical Approach in Unsaturated Soils,
Balkema, Rotterdam, 91-106.
Rosanne, M., Paszkuta, M., and Adler, P.M. (2006). Thermodiffusional transport of
electrolytes in compact clays. Journal o f Colloid Interface Science, 299, 797-805.
Sato, H., Yui, M. and Yoshikawa, H. (1995). Diffusion behavior for Se and Zr in sodium-
bentonite. Material Research Society Symposium Proceeding, 353, 269-276.
Seetharam, S.C. (2003). An investigation o f the thermo/hydro/chemical/mechanical
behaviour o f unsaturated soils. Ph.D. Thesis, Cardiff University, Wales, UK.
3-67

Chapter 3 Theoretical Formulation
Sheng D., Gens, A., Fredlund, D.G., and Sloan, S.W. (2008). Unsaturated soils: From
constitutive modelling to numerical algorithms. Computers and Geotechnics, 35 810-24.
Singh, R.M. (2007). An experimental and numerical investigation o f heat and mass
movement in unsaturated clays. PhD Thesis, Cardiff University, Wales, UK.
Snowdon, P.N., and Turner, J.C.R. (1960). The concentartion dependance of the Soret effect.
Transaction Faraday Society, 56, 1812-1819.
Sonnenthal, E., Spycher, N. and Xu, T. (2003). Linking reaction, transport, and hydrological
parameters in unsaturated fractured rock: TOUGHREACT implementation and application.
In Proceedings TOUGH Symposium 2003, Lawrence Berkeley National Laboratory,
Berkeley, California, (http://escholarship.org/uc/item/37f0d52p).
Steefel, C.I. (2008). Geochemical kinetics and transport. In Kinetics of Water-Rock
Interaction Brantley, S.L., Kubicki, J.D., and White, A.F.(ed.) Springer, 545-589.
Steefel, C.I. and Lasaga, A.C. (1994). A coupled model for transport of multiple chemical
species and kinetic precipitation/dissolution reactions with application to reactive flow in
single phase hydrothermal systems. American Journal o f Science, 294, 529-592.
Thomas, H.R., Cleall, P.J., Chandler, N., Dixon, D., and Mitchell, H.P. (2003). Water
infiltration into a large-scale in-situ experiment in an underground research laboratory.
Geotechnique, 53(2), 207-224.
Thomas, H.R., and He, Y. (1995). Analysis o f coupled heat, moisture and air transfer in a
deformable unsaturated soil. Geotechnique, 45(4), 677-689.
Thomas, H.R., and He, Y. (1998). Modelling the behaviour of unsaturated soil using an
elasto plastic constitutive relationship. Geotechnique, 48, 589-603.
Thomas, H.R., and King, S.D. (1991). Coupled temperature/capillary potential variations in
unsaturated soil. Journal o f Engineering Mechanics, ASCE, 117, 2475-2491.
Thomas, H.R., and Samson, M.R. (1995). A fully coupled analysis of heat, moisture and air
transfer in unsaturated soil. Journal o f Engineering Mechanics, ASCE, 12(3), 392-405.
Thyagaraj, T. and Rao, M.S. (2010). Influence o f osmotic suction on the soil-water
characteristic curves o f compacted expansive clay. Journal o f Geotechnical and
Geoenvironmental Engineering, ASCE, 136(12), 1695-1702.
3-68

Chapter 3 Theoretical Formulation
Tuller, M., Or, D., and Dudley, L.M. (1999).Adsorption and capillary condensation in porous
media: liquid retention and interfacial configurations in angular pores. Water Resources
Research, 35, 1949-64.
Van Brakel J. and Heertjes P.M. (1974). Analysis of diffusion in macroporous media in terms
of a porosity, a tortuosity, and a constrictivity factor. International Journal o f Heat and Mass
Transfer, 17, 1093-1103.
Van Loon, L.R., Glaus, M.A., and Miiller, W. (2007). Anion exclusion effects in compacted
bentonite: Towards a better understanding of anion diffusion. Applied Geochemistry, 22,
2536-2552.
Vardon, P.J. (2009). A three-dimensional numerical investigation o f the therm-hydro-
mechanical behaviour o f a large-scale prototype repository. Ph.D. Thesis, Cardiff
University, Wales, UK.
Wang, C. (1953). Applied Elasticity. McGraw-Hill Book Co.
Wu, G., and Chieng, S.T. (1995). Modelling multicomponent reactive chemical transport in
non isothermal unsaturated saturated soils, Part 1-Mathematical model development.
Transactions o f the ASAE, 38(3), 817-826.
Yong, R.N. (1999). Soil suction and soil-water potentials in swelling clays in engineered clay
barriers. Engineering Geology, 54, 3-13.
Yong, R.N., and Warkentin, B.P. (1975). Soil Properties and Behaviour. Elsevier,
Amsterdam.
Zhang, F., Zhang, Z.Z., Low, P.F. and Roth, C.B. (1993). The effect of temperature on the
swelling of montmorillonite. Clay Minerals, 28, 25-31.
3-69

Chapter 4 Numerical Formulation
Chapter 4
Numerical Formulation
4-1

Chapter 4 Numerical Formulation
4.1 Introduction
The numerical formulation of the solution of the governing differential equations representing
heat, moisture, air, multicomponent reactive chemical and deformation behaviour is presented
in this chapter. A finite element method is employed to spatially discretise the equations while
a finite difference algorithm is used to achieve temporal discretisation.The numerical
formulation concerning chemical reaction equations is briefly reviewed as the geochemical
model, PHRREQC version 2 (Parkhurst and Appelo, 1999), is directly implemented without
any modification to its numerical formulation. The sequential non-iterative approach adopted
for solving the coupled chemical transport and reactions are also presented.
The numerical formulation concerning coupled heat, moisture, air and deformation has
already been dealt with in detail by Ramesh (1996); Cleall (1998), Seetharam (2003) and
Vardon (2009). The numerical formulation of the chemical transport equation has been
specifically addressed by Hashm (1999) and Seethram (2003). Seethram (2003) presented the
general numerical formulation for the multicomponent reactive chemical transport governing
equations. In this chapter the numerical formulation for the multicomponent reactive chemical
transport equations and the derivation will be presented in details. For the sake of
completeness the final matrix form of heat, moisture, air and deformation is included.
Section 4.2 deals with the spatial discretisation of flow and deformation variables. In this
section, the use of the Galerkin weighted residual method is presented to discretise the flow
and deformation variables. Sections 4.3 deals with the general representation of the matrix
form of the governing equations the temporal discretisation of the governing equations. A
forward finite difference mid-interval time-stepping algorithm is used to achieve temporal
discretisation. Section 4.4 provides the details of scheme adopted for coupling chemical
transport equation with the geochemical model. The computational aspects of the coupling
method are provided in this section. Finally, section 4.5 presents the overall summary of the
above work.
4-2

Chapter 4 Numerical Formulation
4.2 Spatial discretisation
In the study presented here, the Galerkin weighted residual method is employed for the spatial
discretisation (Zienkiewicz and Taylor, 1989). This method is widely recognised as a general
numerical technique, for the solution of partial differential equation systems subject to
appropriate boundary and initial conditions (Hinton and Owen, 1977). This method has been
also found to be effective for the type of coupled formulations discussed in previous chapter
(e.g. Thomas and He, 1995; Thomas and He, 1998; Seetharam et al., 2007; Seetharam et al.,
2010).
Since the use of the finite element method to spatially discretise governing differential
equations has been broadly described in literature (e.g. Zienkiewicz and Taylor, 1989), the
spatial discretisation of the governing equations is introduced here in an abbreviated form.
Based on the Galerkin weighted residual method, the primary unknowns and their spatial
derivatives can be approximated using shape functions. For an element with nno(je nodes, this
yields:
n node
a ) * G > = Y JN sms (4.1)5 = 1
^node
Vffl = (4.2)5 = 1
where co represents any of the primary variables including w/, T, ua, c ld and u. Ns is the shape
function, the subscript, 5 ,characterises nodal points, the symbol, A, indicates an approximation
form.
4.2.1 Spatial discretisation for chemical flow
The derivation of the chemical flow differential equation is presented below. The numerical
formulation is derived for a single chemical component. The procedure for any number of
components remains the same as this one, and is hence not repeated for “w” number of
chemicals.
The governing differential equation for an arbitrary chemical component can be presented in
terms of the approximate functions as:
4-3

Chapter 4 Numerical Formulation
^ ^ dT ^ &2„ ^^ c j a , c . T o , L c jfl a . 5(3' - C ^ - - C ^
v a / ^ a / cd° dt cdcd dt cds dt cdu dt
+v- M«/J ■i+ V I K rVT +v- a:, y u +v-a
fIC
y k c c v c jy=i
(4.3)+ • / .
where Rq. is the residual error.
In the Galerkin weighted residual approach, this residual over the entire element domain Cf is
attempted to be minimised using the shape functions Nr as weighting coefficients as:
$N rRad Q e = 0n'
(4.4)
Replacing the residual error in equation (4.4) from equation (4.3) yields:
Kn'
_ r 8{il r d t - c d{l° r ^ r —L -c Mcd‘ 8t CdT dt Cda dt CdCd dt Cds dt CdU dt
+V ■ [lCv Vfi ]+ V ■ v f ] + V • [kv Vfi ]+ V •ric.
5 X , VcjCHCH dJ =1
+ X.dne = o (4.5)
Employing integration by parts, the weak form of equation (4.5) may be obtained. For
example the seventh term can be expressed as:
\n ,V • (iC ,V«, )«J* = Jv • {N ' K ^ V u , } / n ‘ - \ K Cd,V u ,V N rd n ' (4.6)£ie
Also the term, Jcd , can be expressed, with an appropriate substitution from equation (3.179)
as:
(4.7)\N rVJCd do6 = jv^N^kiVz^Q6 - j cdk/VzVNrdQe ne ne o e
In a similar manner, by repeating the above process, the rest of the flux terms can be reduced,
and substituting the reduced form in equation (4.5) will yield:
4-4
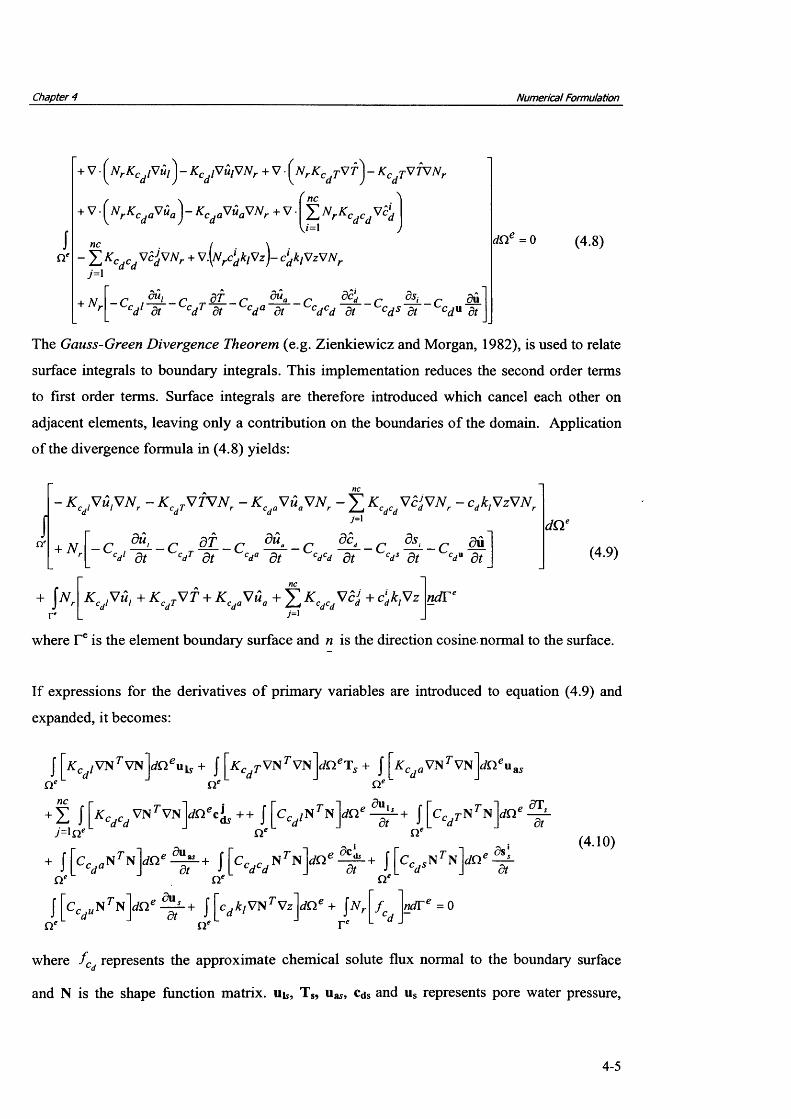
Chapter 4 Numerical Formulation
1Qe
+ V [N rKCdiV u ^ - Kc<j,Vi,VNr + V • (N rKCdTV T }- K ^ V T V N ,
{ \ ( nc + V-[NrKCdaVia)-KcdaViaVNr +V. 'Z NrKcdc V i ‘d\ i=1
- I Kcdcd r t JdVNr + v{N rcidk,V z)- c‘dkiVzVNrj=l
+ N. _C , ^ L - C r S t - C & - - C & - C^ c . l a , C j T X* C , a X* L C j C jds; - c 5u
cd‘ dt cdI dt cda dt cdcd dt cd s dt cd u dt
dne = o (4.8)
The Gauss-Green Divergence Theorem (e.g. Zienkiewicz and Morgan, 1982), is used to relate
surface integrals to boundary integrals. This implementation reduces the second order terms
to first order terms. Surface integrals are therefore introduced which cancel each other on
adjacent elements, leaving only a contribution on the boundaries of the domain. Application
of the divergence formula in (4.8) yields:
- K CjlVu,VNr - K tVTVN, - K Cd„VuaWNr - £ K V c p N , - c„k,VzVNr
+
+ N.
j X
7=1
-r d{i> r dT-r d{i° r M l-r ^ - r Mc d l dt Cd T d t Cd a dt c d c d dt cd s dt c d u dt
dQ e
(4.9)
r*
ncK r ,Vm. + K r rV T + K r Vwfl + Y K c r Vcj + cl,k.VzC j l I cd T cd a a Z - < cd c d d d I
7=1ndTe
where Te is the element boundary surface and n is the direction cosine normal to the surface.
If expressions for the derivatives o f primary variables are introduced to equation (4.9) and
expanded, it becomes:
dCle u.j [ t f c , V N r V N W u l l + \ \ k c ,r V N r V N ’U 2 % + J [ * , . a V N r VNTle Qe Of
J[*V(/VNrvN}"*€i*++ l K ' N 7'N]rfne£i r +7=1 ne Qe ne
f j [ c V rfNr N ] < / n * ^ + j [ c v Nr Nne cie Qe
} [ c Crf„Nr N]rfne - ^ - + j [ c , * /VNr Vz]4Q* + f » r / c U e = 0
dt
dt
(4.10)
dto.e ne~ re
where f c represents the approximate chemical solute flux normal to the boundary surface
and N is the shape function matrix, ul*, Ts, Uay, Cds and us represents pore water pressure,
4-5

Chapter 4 Numerical Formulation
temperature, pore air pressure, dissolved chemical concentration and deformation
respectively.
Equation (4.10) can be rewritten in a concise matrix notation as:
chiC c „ | - 3T- + C ST- + c „ . . i ^ - + c , , ^ S - + C . . 5u
o' dt C->T St v dt V d 8t + Cd“ Stnc
+ ^ c dlu Ls + ^ c dT ^ s "*"^cda lla5 + S ^ c dcdcd.s —j =1
where;
dCie
r 'r ”Cc., = S J k / Nr N d
e=t Qe Jm i-
CcdT = I j [ < V N Ne=lQ*
Ccd, = S j [ c X nW e=lne
TYX »— -j
c V d = Ve=1neTYl r- -j
Ccd» = £ J |Q d„NrN |dne «=1 &
KCdl = 1 j k ^ V N We=loe
TYl r- —|
KcdT = 2e=lQe
K cd» = S f U ^ d V N ^ V N j r f n 6 e=lQc
TYX r* -i
Kcdcd = I / [ ^ V N ^ V nJ ^e=lQ*
m r - | m
V X J ’ v * Une + 2 JN'e“lQe e=lpe
where, ass is the sink/source term for each chemical component.
X. dre
m
= Ue=lQ‘
Cc 5NrA^% cds , dt
dne
The above formulation can be repeated for any number of chemical components.
vectors,
(4.11)
(4.12)
(4.13)
(4.14)
(4.15)
(4.16)
(4.17)
(4.18)
(4.19)
(4.20)
(4.21)
(4.22)
4-6
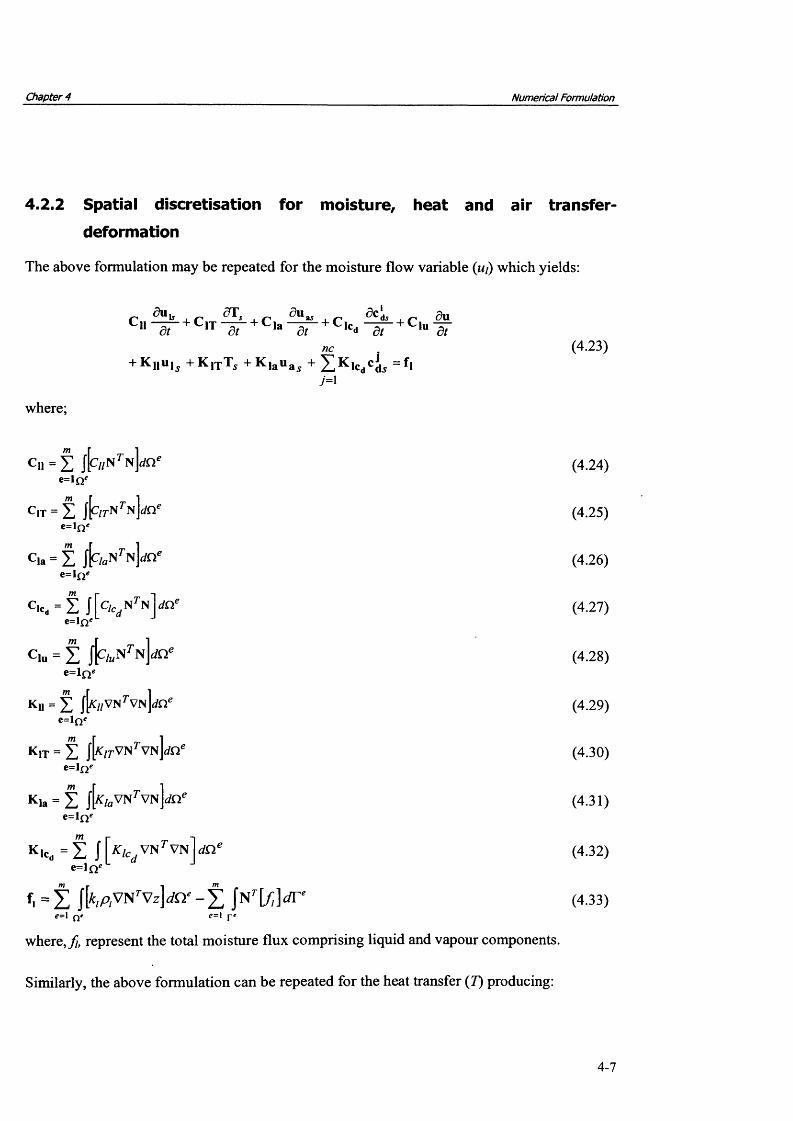
Chapter 4 Numerical Formulation
4.2.2 Spatial discretisation for moisture, heat and air transfer- deformation
The above formulation may be repeated for the moisture flow variable (ui) which yields:
^ ^ ST, , r d u >s , ^C 11 — h t l T — -------r L | a — r L i p — ---------1- L | „ — —11 dt 11 dt ,a dt ,c* dt ,u dt
+ Ki,u i5 + K 1XT, + K lau a5 + t K \ c A s = f >j =1
where;
C|1 = Z }h;NrNjrfnee=lQe
cit = Z JtC/rN r Ne=1fie
Cla = Z jttoN Njdn"e=lQe
m r *1
= z j K ," 1" \ dn‘e=ine
C|„ = Z jfc/„N7'N]dnce-ine
K|| = Z jh;VNrVN]jnee=lo«
:/ r VNr VNk i t = Z ik
Kla = Z |h<,VN7'VNjrfnce=l Oe
m r _ ™iK.cd = Z ||_^V N rVN
e=lQe
(4.23)
m r *i m
f, = Z |[*(AvNrvz]dne- Z {Nr[/]</re = l Q * e = l j-«
where, fi, represent the total moisture flux comprising liquid and vapour components.
(4.24)
(4.25)
(4.26)
(4.27)
(4.28)
(4.29)
(4.30)
(4.31)
(4.32)
(4.33)
Similarly, the above formulation can be repeated for the heat transfer (7) producing:
4-7
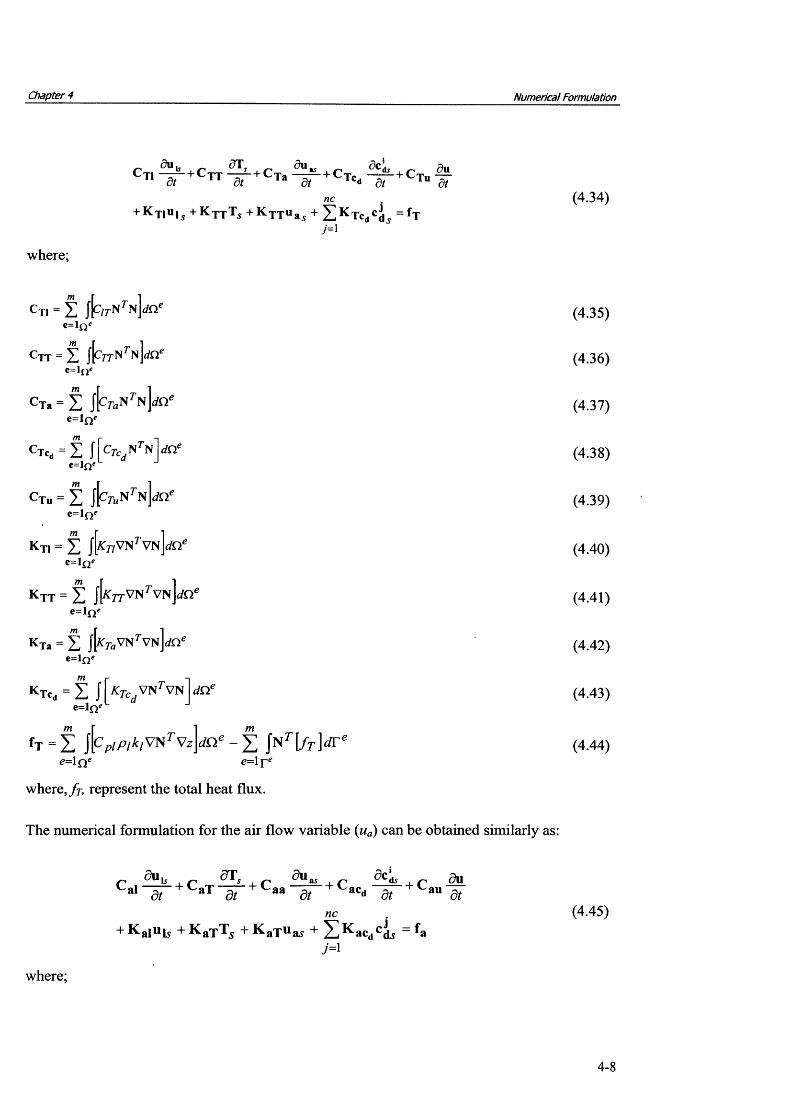
Chapter 4 Numerical Formulation
5u, dT dn.C T1 —-5 7 - + CTT J1 7- + CTa - + Cdt dt Tcj
dCds , r du + L rdt “ ’«• dt
nc+ K t i Ui 5 + K t t T5 + K x t u 3 s + 2 K Tcdc d 5 = f T
M
Tu dt
where;
(4.34)
C TI = E JP/rNNjdfl'e=1Oe
(4.35)
c , T = i | [ r 7TN r N ]dne e=ln *
(4.36)
c Ta = E JPNn]^e = i n e
(4.37)
m f -|
CTc„ = I J C7t " N dCl‘«=*n*
(4.38)
c Tu = E J P t - u N ^ n ] ^ (4.39)
K T1 = £ JVNVN dne e=1Q e
(4.40)
K TT = Z j [ ^ 7 T V N r v N ] ^ e e=1ne
(4.41)
K Ta = Z j[7aVN7’VN]jQee=lQ*
(4.42)
ftl p -1K Tcd = E jk VNVN
e=lQe(4.43)
m r 1 m
fT = E VNr V z J ^ - E jN r [/r ]dree=l e= l
(4.44)
where, fi, represent the total heat flux.
The numerical formulation for the air flow variable (ua) can be obtained similarly as:
du._ du,_ <9TC ai —-— t- C aT — — 1- c
al dt a l dtr ^CA? p du
aa dt ac“ dt au dtnc
+ K ajUj5 + K ajT 5 + K a'puay +j =1
(4.45)
where;
4-8

Chapter 4 Numerical Formulation
c .i = £ j h ^ rNlrf£iCe=lQ* (4.46)
c aT = £ {p„rNrN]rfnee=lQ ‘
(4.47)
Caa = £e= lQe
(4.48)
m r IC»ca = I jk^N rN dC f
e= lff(4.49)
C,a = £ j[ca„NrN]dnce=l^
(4.50)
Kal = £ |[^ V N rVN]rfnce=ln«
(4.51)
KaT = £ JKt-VN^Vn]^ e=lQ«
(4.52)
Kaa = £ |[^oov NrVN]rfnc e=lQe
(4.53)
Ka.„ = £ j k , c VN^VnW e=ln' J
(4.54)
m r 1 mfa=S Jp/P&VNrVzjjQe-X \ ^ T [ f a ] d r e (4.55)
e = l Q e e = l f e
where, f a, represent the total air flux.
The formulation for deformation variables can be presented as:
C"l dt + C u T 5t + C u a 3t + C .... - - f ,du
uu dt ~ ‘U (4.56)
where;
C ul = £ j[B (D cp^ ) N ] v ( d n 'e=ine
C uT = E Je=lfi*L
BDep| — At — INd t
VtdQ.
cua=Z iM^p^
(4.57)
(4.58)
(4.59)
4-9

Chapter 4 Numerical Formulation
mCuu = Z jBDepBr V/rffie
e=\Qe
m
'.=1e = l
§B D v e ? ]d n e + + jN ri rrfr‘n' n' r*
(4.60)
(4.61)
4.3 Temporal discritisation
To determine the values of the primary variables over time an implicit mid-interval forward-
difference time-stepping algorithm was employed. This has been found as a suitable solution
for highly non-linear class of equations such as the current application problem (Thomas et
al., 1998).
The spatially discretised equations for heat, moisture, air, multicomponent reactive chemical
and deformation can be combined in a matrix form. The matrix equation can conveniently be
expressed as:
A^ + B ^ + C = {0} (4.62)
where A, B and C are the matrices o f coefficients and $ is the vector of variables. The
expanded form of matrix presentation is given in figure (4.1).
As reported earlier, the spatially discretised equations are time discretised by the application
of an implicit mid-interval forward difference time-stepping algorithm. This algorithm can be
expressed as:
At+ C * = { 0 } (4.63)
where © represents an integration constant varying from 1 for implict time integration
scheme; 0.5 for Crank-Nicholson scheme and 0 for explicit time integration scheme. The
superscript / represents the level at which the matrices A, B and C are evaluated. This level is
given by:
(j), = &(n + 1)+ (l - (4.64)
4-10

Chapter 4 Numerical Formulation
where *9 is a constant which defines the level at which the matrices are evaluated. For fully
implicit mid-interval forward difference time-stepping algorithm the constants © and 3 take
the values of 1 and 0.5 respectively.
Applying equation (4.64), into equation (4.63), yields:
; 7j+l ina »+I/2 ^ +1 + b
Rearranging equation (4.65) gives:
n+l/2
A t+ C n+l/2
= {0} (4.65)
*n+1
U n+l/2 a n+l/2 , °A -1---------
- i t jh + 1 /2 in
C ”+1/2A t A t
(4.66)
Since equation (4.66) can not be solved directly, as each calculation of <f>n + 1 requires the
determination of the coefficient at the mid-interval; an iterative solution procedure is
necessary. In the current work a predictor-corrector algorithm is used. This method can be
described by the following steps;
i. A first estimate, named the predictor, is produced by evaluating matrices A, B and C at
time n.
ii. The predictor and previous time step values are then used to evaluate matrices A, B and C
at time n + JA. This produces an estimate called the corrector.
iii. For the elasto-plastic algorithm only, a check for yielding is then required. If the
developed strain rate is greater than a specified tolerance, plastic strain will be produced
and hardening parameters will be developed.
iv. Either of the following conditions may then be used to check for convergence;
r - C o c <t lJ.n +1 An+\YiC ~ (P{i-\)C
abs
J.n+1 r (i-l)C
<TL rel
(4.67)
(4.68)
where i is the iteration level, C denotes that the corrector value has been used. TLabs and TLre/
are the matrices of absolute and relative tolerances for each variable. The stress equilibrium
4-11
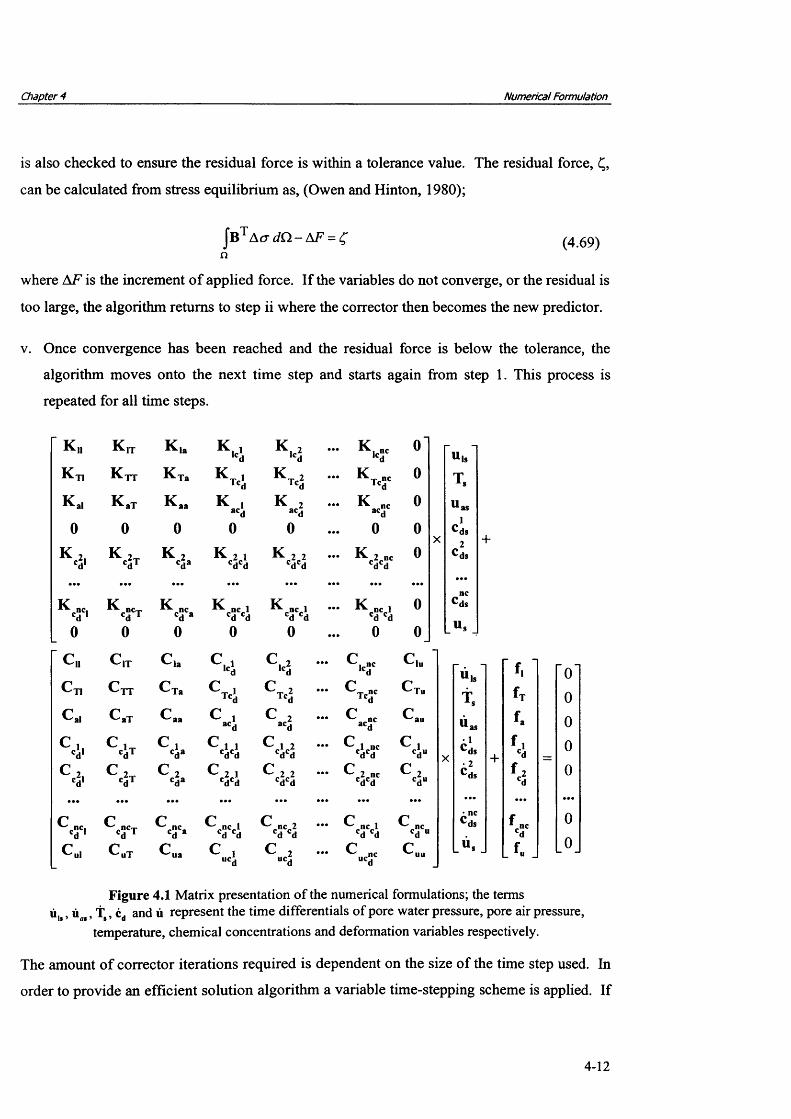
Chapter 4 Numerical Formulation
is also checked to ensure the residual force is within a tolerance value. The residual force, £,
can be calculated from stress equilibrium as, (Owen and Hinton, 1980);
J b T A <t d Q - A F = £ (4.69)
where AF is the increment o f applied force. If the variables do not converge, or the residual is
too large, the algorithm returns to step ii where the corrector then becomes the new predictor.
v. Once convergence has been reached and the residual force is below the tolerance, the
algorithm moves onto the next time step and starts again from step 1. This process is
repeated for all time steps.
“K„ K,t Kla K'ci K 2,ci • • Kk“ o '
KT1 Ktt KTa K 2Tcd • • Kt«Sc 0Kal KaT Kaa K ,aCd K 2acd •• K< 00 0 0 0 0 • 0 0
K* K 2cda K 21cdcd K 22cdcd •* cdcd 0
V K nccd a ^ncl cd cd ^ _nc.l cd cd •* cd cd 00 0 0 0 0 • 0 0
"C„ C|T Cla c ,,cd C 2,cd ... c*SC Clu
C-n Cjt CTa C !Tcd C 2Tcd ... C nc Tuc aI c aT Caa C ,acd C 2acd ... Cac-d Cauc ,cd' C !cdT C,cda cdcd C 12cdcd ... Cclc-cdcd C,cdu
c 2cdT C 2cda CCVd d Cc2c2d d ... C 2 nc d d
C'SC| C nccdT Ccnca cd a Cc-c cd cd d d ... CcdCcd Vc„, CUT cv-ua C ,ucd C 2ucd ... C“cdC
c uu
T
Uas1
CdsX 2
Cds
nc^ds
Us
+
_ _
Uls f . "o'Tx s
f T 0
«as fa 0
X
• 1 ^ds • 2 ^ds
•ncc ds
+ f ci
fc3c
_ f U .
0
0
0
0
Figure 4.1 Matrix presentation of the numerical formulations; the terms Ui.} uag, T , cd and u represent the time differentials of pore water pressure, pore air pressure,
temperature, chemical concentrations and deformation variables respectively.
The amount of corrector iterations required is dependent on the size of the time step used. In
order to provide an efficient solution algorithm a variable time-stepping scheme is applied. If
4-12
Chapter 4 Numerical Formulation
the number of iterations exceeds a specified maximum the time step size is decreased by a
multiplier factor. However, if the number of iterations is lower than a specified minimum
then the time step size is increased by a factor. This leads to an efficient solution algorithm.
This model has been incorporated into a computer code COMPASS, the COde fo r Modelling
PArtially Saturated Soils, which has been incrementally developed at the Geoenvironmental
Research Centre (GRC), Cardiff University (e.g. Thomas et al., 1998).
4.4 Coupling between the transport and chemical reaction model
In this section the method implemented for coupling the chemical transport equations in
transport module, i.e. COMPASS, with the geochemical reaction module, i.e. PHREEQC
version 2 is presented. As reported in chapter 2, the sequential methods, in particular the
sequential iterative approach (SIA) and the sequential non-iterative approach (SNIA) have
been proposed and applied successfully for the coupling transport and chemical equations in
various models/codes. Seetharam (2003) implemented both the sequential iterative and the
sequential non-iterative approach for coupling COMPASS chemical transport module with
geochemical reaction model, MINTEQA2 (Allison et al., 1992). The coupling schemes
implemented in COMPASS-MINTEQA2 have been successfully tested and applied for the
modelling reactive transport of multicomponent chemicals under coupled THCM conditions
by Seetharam et al. (2007), Cleall et al. (2007) and Seetharam et al. (2010).
In this study, a sequential non-iterative approach (SNIA) is used for coupling chemical
transport equations solved by COMPASS and the geochemical reactions which are calculated
by PHREEQC version 2. In this approach, the chemical equations are solved only once
during a time step. In other words, after transport equations have achieved convergence,
concentrations of chemicals are modified using the geochemical model PHREEQC. Then the
corrected values of dissolved chemical concentrations are introduced again into the transport
module for the next step of analysis. Mathematically, the first step of calculations under the
SNIA coupling scheme, which includes transport process can be represented as (Steefel and
MacQuarrie, 1996):
4-13

Chapter 4 Numerical Formulation
transport n
(4.70)
where L is the spatial operators applying to the fluxes. In this stage the results of dissolved
chemical concentrations for previous time step, n is applied in the transport equation to obtain
the new values of dissolved chemical concentrations associate with the transport processes.
This step is followed by solving reaction equations as:
where R symbolises the rate expression for the associated geochemical reactions.
COMPASS has been written in FORTRAN, while PHREEQC is C based program. The two
models were linked together using a Cross-linked subroutine written in C language. In the
Cross-linked subroutine, the results of transport process calculated by COMPASS are
collected first using pointer variables which assist with an efficient and secure data exchange.
Then the main subroutine of PHREEQC program is called and input data required for
geochemical analysis is exchanged. Then PHREEQC calculates the equilibrium or kinetically
controlled chemical reactions which provide the modified concentration of all dissolved
chemicals. The outputs are exchanged again in Cross-linked subroutine and sent back to
interface module of COMPASS. The COMPASS-PHREEQC linked model works based on a
single compiler program. Figure (4.2) presents the coupling approach and modular data
exchange between COMPASS and PHREEQC. It is noted that the time-step of the current
transport analysis is transferred to PHREEQC which is applied for calculating kinetically
controlled reactions.
In order to accelerate computation, provision is made to impose a relative tolerance level
check for dissolved chemical concentration and temperature, i.e. defined in figure (4.2) as
diff\ = (c‘dy ansp°rt - (c y and dijfl = {r)transport -{r)n, respectively. In other words, if the
concentrations of chemicals and the temperature do not vary more than a specific amount
during time steps n and n+1, then the program skips the geochemical analysis.
A feed back between mineral precipitation/dissolution (geochemical model), total mineral
volume and eventually porosity has been provided under the coupling scheme. The amount of
(4.71)
4-14

Chapter 4 Numerical Formulation
mineral precipitate volumes as part of solid phase is updated from the results of geochemical
analysis. As the result of changes in the mineral volume, the porosity varies and the flow
parameters including hydraulic conductivity and tortuosity factor for chemical diffusion are
changed. The resultant concentrations of minerals calculated from equilibrium
precipitation/dissolution reactions or kinetically controlled reactions are used to calculate the
total amount of volume related to the precipitation/dissolution process during each time-step.
The mineral volume for each node is updated after geochemical reaction step and sent back to
the transport module. Then porosity is modified for each integration point in an element
where the hydro/chemical flow properties such hydraulic conductivity or diffusion coefficient
is evaluated in the model.
The numerical formulation concerning reactive chemical equations is not dealt within this
work as the geochemical model, PHREEQC version 2 (Parkhurst and Appelo, 1999), is
directly used without any modification to its numerical formulation. However, it is
worthwhile to review the numerical method implemented in PHREEQC. The geochemical
model PHREEQC employs two different numerical solutions depending on the type of
reaction. Those can be summarised as follows (Parkhurst and Appelo, 1999):
A modified Newton-Raphson method is employed for solving non-linear algebraic equations
for chemical reactions under equilibrium condition. The solution technique assigns initial
values to the master unknowns and then uses a modification of the Newton-Raphson method
iteratively to revise the values of the master unknowns until a solution to the equations has
been found within specified tolerances.
PHREEQC solves the differential equations for kinetically controlled reaction using a Runge-
Kutta algorithm by Fehlberg (1969), which integrates the rate of reactions over time. The
scheme includes a Runge-Kutta method with lower order to derive an error estimate with up
to six intermediate evaluations of the derivative. The error estimate is compared with a user-
defined error tolerance to automatically decrease or increase the integration time interval to
maintain the errors within the given tolerance. Furthermore, if the rates in the first three
Runge-Kutta evaluations differ by less than the tolerance, the final rate is calculated directly
and checked once more against the required tolerance.
4-15
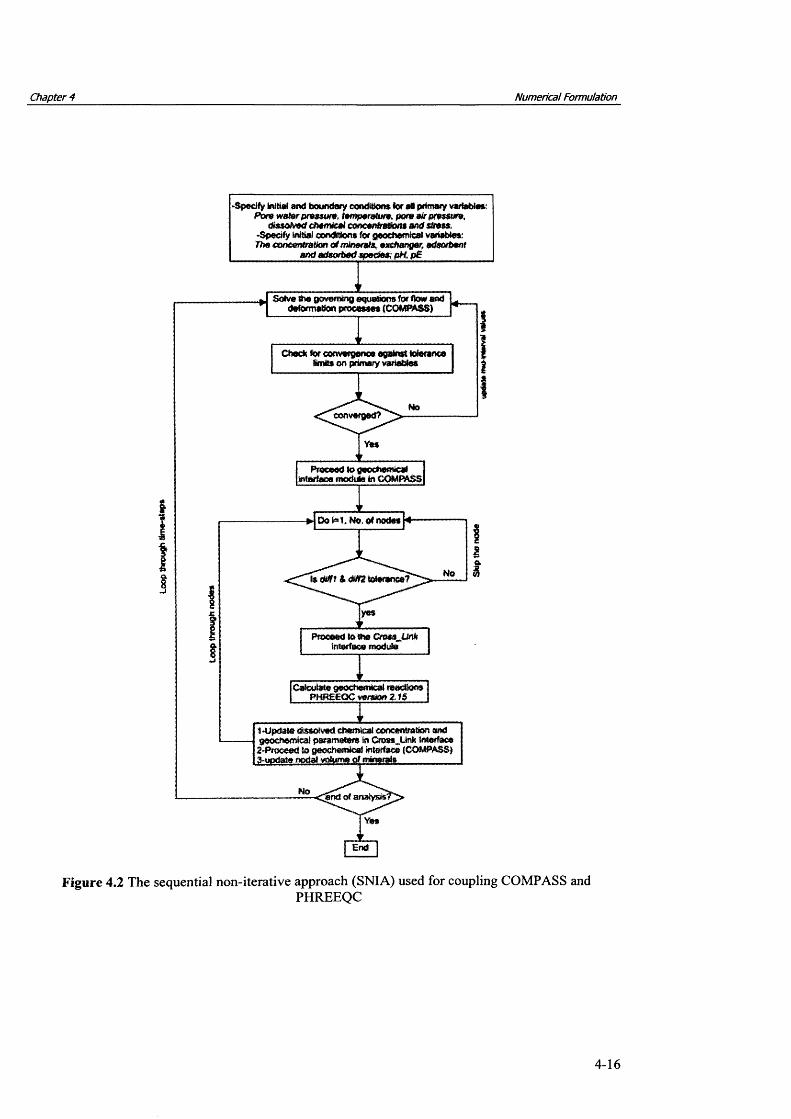
Chapter 4 Numerical Formulation
t
Wo
Ye*
Noledflff l<M2iotor*ncel
Ho
Ye*
End
Do l»1. No. of node*
PHREEQC version 2,15
Proceed to fleochenwcel (otartooe module in COMPASS
Proceed to the CtvmJJnk interface module
Solve fine governing equations for flow end deformation processes (COMPASS)
Check lor converyeno* against tolannc* Kmiis on primary variables
geochemical parameters 2-Pfoceed lo geochtmAca
1-Update dissolved chemical concewration and - - - Link Interface
•Specify Initial end boundary condition* lor a* primary variable*: Pore water prossora, temperature, pore air pressure,
dissofrerfchamfcaf concentrattonsands&ess -Specify initial conditions for geochemical variables:The concrmfrabon of minerals, exchanger, adsorbent
_____________ and adsorbed spocto& pH, p£_____________
Figure 4.2 The sequential non-iterative approach (SNIA) used for coupling COMPASS andPHREEQC
4-16

Chapter 4 Numerical Formulation
4.5 Summary
A numerical solution of the coupled flow and deformation formulation given in Chapter 3 has
been presented. Spatial discretisation of the five governing differential equations has been
achieved using a finite element method, whilst an implicit forward difference, mid-interval
time stepping algorithm has been employed to achieve temporal discretisation. The chemical
transport module of the flow and deformation model has been coupled to the geochemical
model, PHREEQC version 2, with minor modifications to the latter code, via sequential non
iterative coupling techniques. The implementation of the coupling techniques has been
described. In addition, the algorithm of porosity modification feed back from geochemical
analysis has been explained in this chapter. The model has been incorporated into an existing
computer code COMPASS which has been developed at the Geoenvironmental Research
Centre, Cardiff University.
4-17

Chapter 4 Numerical Formulation
4.6 References
Allison, J.D., Brown, D.S., and Novo-Gradac, K.J. (1991). MINTEQA2 User Manual version
3.0. Environmental Research Laboratory, U.S. EPA.
Cleall, P.J. (1998). An investigation o f the thermo/hydraulic/mechanical behaviour o f
unsaturated soils, including expansive clays, Ph.D. Thesis. Cardiff University, Wales, U.K.
Cleall, P.J., Seetharam, S.C., and Thomas, H.R. (2007). On the inclusion of some aspects of
chemical behaviour of an unsaturated soil in thermo-hydro-chemical-mechanical models: I
Model development. Journal o f Engineering Mechanics, ASCE, 133, 338-347.
Fehlberg, E. (1969). Klassische Runge-Kutta-Formeln funfter und siebenter Ordnung mit
Schrittweiten-Kontrolle. Computing, 4, 93-106.
Hashm, A. A. (1999). A study o f the transport o f a selection o f heavy metals in unsaturated
soils. Ph.D thesis. University of Wales, Cardiff, UK.
Hinton, E., and Owen, D.R.J. (1977). Finite Element Programming, Computational
Mathematics and Applications. Academic Press, London.
Owen, D.R.J., and Hinton, E. (1980). Finite Elements in Plasticity: Theory and Practice.
Pineridge Press Ltd., Swansea.
Parkhurst, D.L., and Appelo, C.A.J. (1999). U ser’s Guide to PHREEQC (version 2), U.S.
Geological Survey, Water Resource Investigation Report, 99-4259.
Ramesh, A.D. (1996). Modelling the thermo/hydraulic/mechanical behaviour o f unsaturated
soil using an elasto-plastic constitutive relationship. Ph.D. Thesis. University of Wales, UK.
Seetharam, S.C. (2003). An investigation o f the thermo/hydro/chemical/mechanical
behaviour o f unsaturated soils. Ph.D. Thesis, Cardiff University, Wales, UK.
Seetharam, S.C., Thomas, H.R., and Cleall, P.J. (2007). Coupled thermo-hydro-chemical-
mechanical model for unsaturated soils-Numerical algorithm. International Journal o f
Numerical Methods in Engineering, 70, 1480-1511.
Seetharam, S.C., Thomas, H.R., and Vardon, P.J. (2010). Non-isothermal multi-component
reactive transport model for unsaturated soils. International Journal o f Geomechanics,
ASCE, doi.org/10.1061/(ASCE)GM. 1943-5622.0000018.
4-18

Chapter 4 Numerical Formulation
Steefel, C.I., MacQuarrie, K.T.B. (1996). Approaches to modeling o f reactive transport in
porous media, Reactive. Transport in Porous Media, Reviews in Mineralogy, (34).
Mineralogical Society of America, Washington, DC.
Thomas, H.R., and He, Y. (1995). Analysis o f coupled heat, moisture and air transfer in a
deformable unsaturated soil. Geotechnique, 45(4), 677-689.
Thomas, H.R., and He, Y. (1998). Modelling the behaviour of unsaturated soil using an
elasto plastic constitutive relationship. Geotechnique, 48, 589-603.
Thomas, H.R., Rees, S.W., Sloper, N.J. (1998). Three-dimensional heat, moisture and air
transfer in unsaturated soils. International Journal o f Numerical and Analytical Methods in
Geomechanics, 22(2), 75-95.
Vardon, P.J. (2009). A three-dimensional numerical investigation o f the therm-hydro-
mechanical behaviour o f a large-scale prototype repository. Ph.D. Thesis, Cardiff
University, Wales, UK.
Zienkiewicz, O.C., and Morgan, K. (1982). Finite Elements and Approximation. John Wiley
and Sons.
Zienkiewicz, O.C., and Taylor, R.L. (1989). The Finite Element Method. McGraw Hill, 4th
edition.
4-19

Chapter 5 Verification and Validation
Chapter 5
Verification and Validation
5-1
Chapter 5 Verification and Validation
5.1 Introduction
In this chapter a description o f the verification and validation tests carried out as part of the
research is presented. Verification and validation tests are obviously essential steps before
application of the model for predictive purposes. It is noted that verifications tests are carried
out to explore whether the solution algorithm of the model is correct, whilst validations are
carried out to examine the value of the underlying conceptual model. The developments to the
theoretical formulation of hydraulic and chemical behaviour, presented in chapter 3 and their
implementation in the numerical model are examined via the series of verification and
validation tests reported in the chapter.
The numerical model has already been examined for a number of test cases involving coupled
moisture, air, heat and deformation (e.g. King, 1994; Sansom, 1995 and Cleall, 1998). In
addition, developments to COMPASS model presented by Thomas and He (1995); Thomas
and Sansom, 1995; Thomas and He (1998), Thomas et al. (1998) and Cleall (1998) was also
re-verified and tested by Mitchell (2002) for coupled thermal, hydraulic and mechanical
behaviour. In terms of reactive transport of chemicals, the verification of the chemical
transport module o f the model has been examined by Seetharam (2003). A comprehensive
series of verifications o f the chemical transport in COMPASS model was performed by
Seetharam (2003). In addition, the coupling between the chemical transport model, i.e.
COMPASS and the geochemical reaction model, i.e. MINTEQA2 (Allison et al. 1991), was
also verified by Seetharam (2003) and Cleall et al. (2007) for different geochemical features
included in the model.
Section 5.2 will present the verification and validation tests carried out on the inclusion of
osmosis phenomenon on moisture transport in the model. Two verifications are presented
with regards to moisture flow due to chemo-osmosis. First a verification test is presented
under saturated conditions where a chemical gradient in the system causing a gradient of
water pressure. The results are compared with the results of an analytical solution at steady-
state. Another series o f verifications are also performed under unsaturated conditions.
Comparison is made against experimental data. The focus of the simulation is to examine the
model for the approach adopted for the inclusion of the osmotic effects on vapour movement.
5-2

Chapter 5 Verification and Validation
In terms of chemical behaviour, section 5.3 presents the verifications of the advances included
in the chemical transport model. Two verifications are presented in order to check the
theoretical components included in the governing equation for the reactive transport of
multicomponent chemicals under isothermal condition. The results of the model for
multicomponent chemical diffusion are first presented via an example of pure diffusion in a
binary ionic solution, i.e. a solution containing two ionic species. In the second verification,
results of the modelling pure diffusion in a mixed electrolyte system under isothermal
conditions are examined via a similar simulation, reported by Lichtner (1995) and Appelo
(2007). The verification of the model in terms of thermal effects on the diffusion process, i.e.
Soret effect, in multiple ionic species is also presented and the validity of the theoretical
approach proposed for the calculation of the Soret coefficient are also examined. In the third
verification, the diffusion model for multicomponent chemicals due to temperature gradients,
i.e. Soret effect, is examined via a series of experimental results reported by Leaist and Hui
(1990). Simulations have been performed using the values for the Soret coefficients reported
by Leaist and Hui (1990). In addition, similar series of simulations are repeated using the
theoretical approach adopted for determination of the Soret coefficient.
The coupling between chemical transport model, COMPASS and chemical reaction model,
PHREEQC version 2, is examined for the geochemical features presented in section 5.4. The
results of the simulations using the developed model, i.e. COMPASS-PHREEQC, are verified
against several well established verification examples, used in other codes or via analytical
solutions. In general, the coupled set of governing equations describing multicomponent
transport and chemical reactions are not amenable to analytical solutions except in the
simplest cases. In this section the developed coupled reactive chemical transport model is
examined for the geochemical reaction features including precipitation and dissolution
reactions under equilibrium condition, precipitation and dissolution under kinetically
controlled condition and equilibrium ion exchange reaction. The verifications of the coupling
of binary solution transport and dissolution/precipitation of mineral reactions are presented
first. These include the mineral precipitation reaction under equilibrium and kinetically
controlled conditions. The results of numerical model are compared with the results of
analytical solutions. A verification of multicomponent chemical transport coupled with
multiple mineral precipitation/dissolution reactions is also presented where the results are
compared with the result o f a well established verification test used in several reactive
5-3

Chapter 5 Verification and Validation
transport codes. Finally a verification test on the multicomponent ionic transport coupled
with ionic exchange process is given and the results of numerical model are compared with a
similar simulation using the reactive transport model, PHREEQC version 2.
The approach adopted for considering porosity modification feed-back from geochemical
reaction modelling and the effects on hydro/chemical transport properties are also
demonstrated. The results of a preliminary simulation of the effects of coupling porosity and
mineral reactions are presented, acknowledging the fact that further usage of this coupling
requires more verification/validation. The numerical simulation test is designed to
demonstrate the effect of mineral precipitation/dissolution reaction on chemical diffusion.
Section 5.5 presents then results of the above mentioned simulations.
Finally section 5.6 provides a summary and conclusions from the above work.
5-4
Chapter 5 Verification and Validation
5.2 Osmotic potential effects on moisture transport
This section presents the verification result of chemo-osmosis potential component included
in the governing equation for moisture flow. According to the formulation proposed for
moisture transfer, a gradient in the osmotically active ions in aqueous phase of the soil can
cause a flow of liquid water and vapour in the system.
5.2.1 Osmotic potential under saturated conditions (Test 1)
5.2.1.1 Introduction
This simulation considered a two dimensional (2D) soil domain (0.10 x 0.10 m). The soil
initially contained no chemicals but subjected to a solution with some amount of Na+ and Cl’
dissolved ions. The soil was assumed as a fully saturated system. Specific boundary
conditions were designed which simplify the analytical solution for verification of the
osmosis phenomenon. The chemical concentrations at boundaries were assumed as fixed
values which provide constant concentration gradients over the domain at steady-state
condition. Due to the gradient of chemical concentration in the domain, a gradient of water
pressure is established in order to balance the osmosis potential over the domain. At steady-
state conditions, the developed pressure and the gradients of water pressure can be
analytically calculated for the above mentioned case. A series of simulations were performed
assuming different values for osmotic efficiency under the boundary conditions presented
above.
5.2.1.2 Numerical model conditions
Applying above mentioned conditions, a series of simulations were performed using the
approach adopted for osmosis induced water transport. A two-dimensional finite elements
domain was discretised to 100 equally sixed 4-noded quadrilateral elements. A constant time-
step of 3600 seconds was considered. The simulation was carried out under coupled thermal,
hydraulic and chemical behaviour and under isothermal conditions. The system considered
was initially saturated and the water pressure and chemical concentrations were initially set as
zero in the domain. The water pressure was also considered fixed at one boundary condition
while the other side was considered as impermeable boundary for water flow. The pore water
5-5
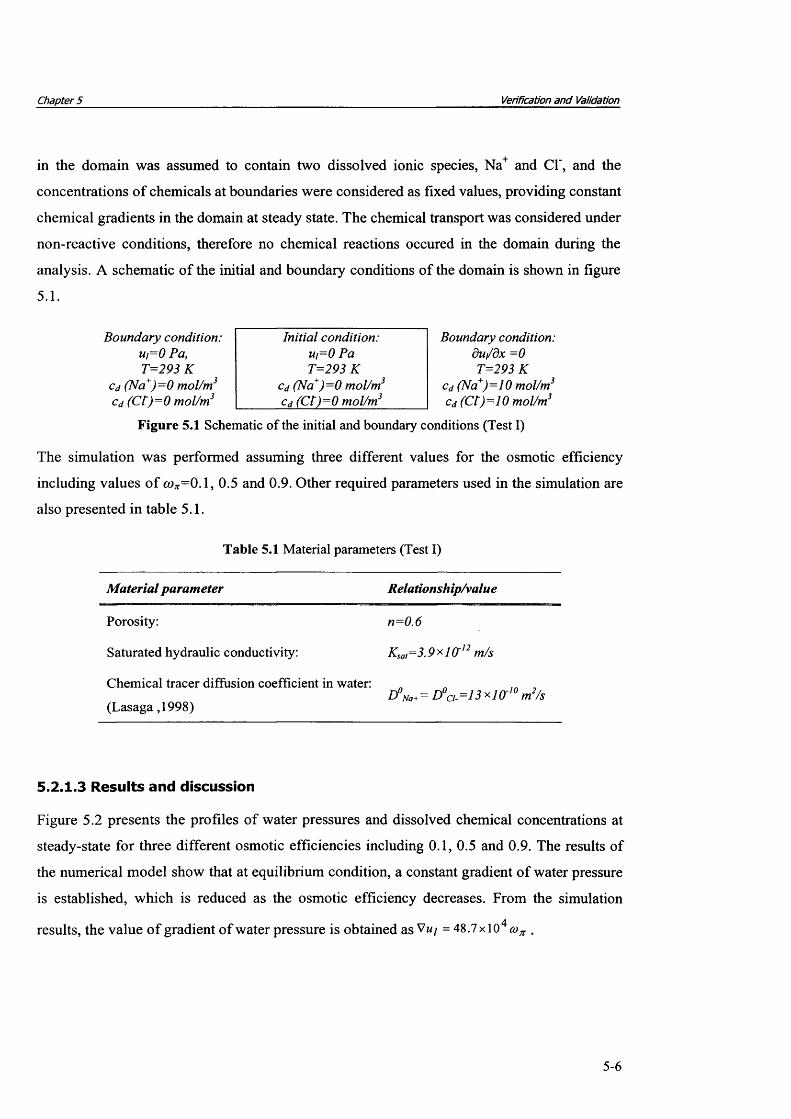
Chapter 5 Verification and Validation
in the domain was assumed to contain two dissolved ionic species, Na+ and Cl', and the
concentrations of chemicals at boundaries were considered as fixed values, providing constant
chemical gradients in the domain at steady state. The chemical transport was considered under
non-reactive conditions, therefore no chemical reactions occured in the domain during the
analysis. A schematic of the initial and boundary conditions of the domain is shown in figure
5.1.
Boundary condition: u/=0 Pa, T=293K
Cd (Na+)=0 mol/m3 Cd (CI)=0 mol/m3
Initial condition: U/-0 Pa T=293K
Cd (Na+)=0 mol/m3 Cd (CI)=0 mol/m3
Boundary condition: du/dx =0 T=293K
Cd (Na+)=10 mol/m3 Cd (Ct)=10 mol/m3
Figure 5.1 Schematic of the initial and boundary conditions (Test I)
The simulation was performed assuming three different values for the osmotic efficiency
including values of (on=0.1, 0.5 and 0.9. Other required parameters used in the simulation are
also presented in table 5.1.
Table 5.1 Material parameters (Test I)
Material parameter Relationship/value
Porosity: n=0.6
Saturated hydraulic conductivity: Ksa,=3.9><1 O'12 m/s
Chemical tracer diffusion coefficient in water:
(Lasaga ,1998)D%a+= D°r,=13 xlO'10 m2/s
5.2.1.3 Results and discussion
Figure 5.2 presents the profiles of water pressures and dissolved chemical concentrations at
steady-state for three different osmotic efficiencies including 0.1, 0.5 and 0.9. The results of
the numerical model show that at equilibrium condition, a constant gradient of water pressure
is established, which is reduced as the osmotic efficiency decreases. From the simulation
results, the value o f gradient o f water pressure is obtained as Vw/ = 48.7 x 10⁴ con .
5-6

Chapter 5_____________________________________________________________________ Verification and Validation
According to the formulation developed in chapter 3, the flow o f liquid water due to pressure
and osmotic potential under isothermal conditions can be given as:
-k , _ k,RTcon ^vi = — - V m / + —------- — > Yi
1 Pig 1 P i g 71 +
d In Yi a In cL
(5.1)
This equation is a simplified form o f the velocity o f liquid presented in chapter 3, i.e. equation
(3.25) if the gravitational potential is neglected.
1050000
pore w ater pressure
40000 dissolved chemical concentrationtoQ.
0)i—ui f )(/>2>
30000
Q_L_| 20000
CDO
CL10000
0.06 0.08 0.10.02 0.040
1oE
6 £
- 4
- 2
wtoo£(D
-Co~o<u>o</)tob
D ista n c e (m)
Figure 5.2 Profiles o f pore water pressure and chemical distributions at steady-state for Test I
For the specific impermeable boundary condition for the water flow, presented in figure 5.1,
the velocity o f liquids becomes zero at steady-state condition. Therefore, at steady-state, if the
activity coefficients o f chemicals are assumed as 1, i.e. ideal solution, equation (5.1) yields:
n c
Vu, = R T m ^ 'Z i=1
(5.2)
5-7
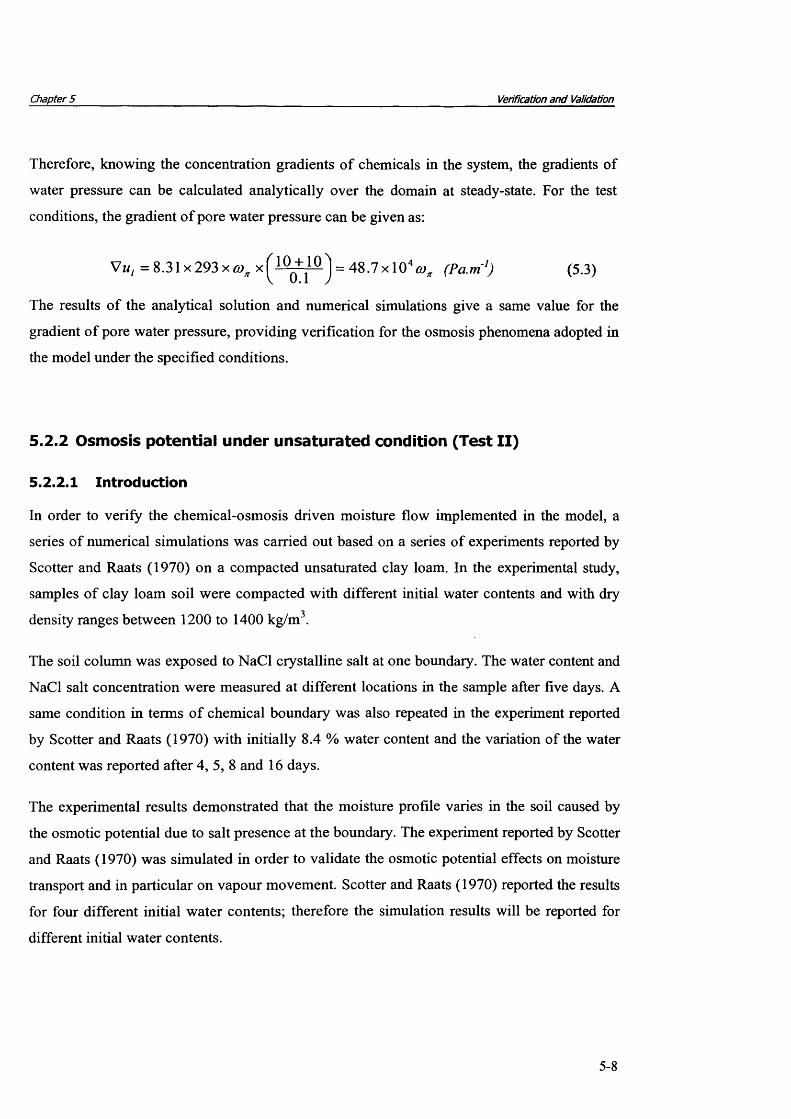
Chapter 5 Verification and Validation
Therefore, knowing the concentration gradients of chemicals in the system, the gradients of
water pressure can be calculated analytically over the domain at steady-state. For the test
conditions, the gradient of pore water pressure can be given as:
Vuj = 8 .3 1 x 2 9 3 x 6 ^ = 4 8 .7x10 4coff (Pa.m 1) (5.3)
The results of the analytical solution and numerical simulations give a same value for the
gradient of pore water pressure, providing verification for the osmosis phenomena adopted in
the model under the specified conditions.
5.2.2 Osmosis potential under unsaturated condition (Test II)
5.2.2.1 Introduction
In order to verify the chemical-osmosis driven moisture flow implemented in the model, a
series of numerical simulations was carried out based on a series of experiments reported by
Scotter and Raats (1970) on a compacted unsaturated clay loam. In the experimental study,
samples of clay loam soil were compacted with different initial water contents and with dry
density ranges between 1200 to 1400 kg/m3.
The soil column was exposed to NaCl crystalline salt at one boundary. The water content and
NaCl salt concentration were measured at different locations in the sample after five days. A
same condition in terms of chemical boundary was also repeated in the experiment reported
by Scotter and Raats (1970) with initially 8.4 % water content and the variation of the water
content was reported after 4, 5, 8 and 16 days.
The experimental results demonstrated that the moisture profile varies in the soil caused by
the osmotic potential due to salt presence at the boundary. The experiment reported by Scotter
and Raats (1970) was simulated in order to validate the osmotic potential effects on moisture
transport and in particular on vapour movement. Scotter and Raats (1970) reported the results
for four different initial water contents; therefore the simulation results will be reported for
different initial water contents.
5-8

Chapter 5 Verification and Validation
5.2.2.2 Numerical model conditions
The domain consists of a two dimensional horizontal soil domain (16 x 3.15 cm) width. The
analysis domain is discretised into 200 equally sized 2D elements. In order to prevent
numerical oscillation and to achieve a better convergence due to the high concentration
gradients, 8-node quadrilateral elements were used in the simulation. The variable time-step
scheme implemented in COMPASS was employed which allowed the time-step incerase or
decrease by a mutipliyer factor depending on the convergence. The value of 3600 seconds
was considered as the maximum allowed time-step based on tials with different values. The
simulations were performed using non-reactive transport of chemicals model, therefore no
coupling was made with geochemical model.
The soil initially contained no chemicals including sodium and chloride dissolved ions. At the
boundary soil was exposed to concentrated ions which were reasonable to assume a fixed
concentration for the dissolved sodium and chloride ions. This concentration was considered
as the corresponding values o f sodium and chloride concentrations in equilibrium with 1 mol/1
NaCl salt, i.e. saturated salt solution (Scotter and Raats, 1970). Both boundary sides were
assumed as impermeable to moisture flow. A schematic of the initial and boundary conditions
used in the simulations is shown in figure 5.3.
B ou ndary con dition: d u /d x - 0 T = 2 9 3 K
Cd (N a +)= 5 8 8 0 m ol/m 3
cd ( C l ) - 5 8 8 0 m ol/m 3
In itia l condition:Test II-A: w = 3 .9 % , u,= -7.1 *106 P a T est II-B: w = 6.6%>, u,= -1 .8*10? P a Test II-C: w = 8 .4 % , u,= -7 .7*10? P a
T est II-D : w = 1 1 .6 % , u,= -4.1 *10? P a T = 2 9 3 K
cd (N a+) = 0 m ol/m 3 __________ cd ( C l ) - 0 m ol/m 3__________
B oundary condition: d u /d x -0 T = 2 9 3 K
dcc/dx =0
Figure 5.3 Schematic o f the initial and boundary conditions (Test II)
The material parameters, required in the analysis were adopted from Scotter and Raats (1970),
except for hydraulic conductivity which was not reported there. The van Genuchten equation
for the soil water characteristic curve (van Genuchten, 1980) was used to establish the
suction-water content relationship. The best fitted equation and the required parameter for van
Genuchten’s model, was obtained based on the experimental data provided by Scotter and
Raats (1970). The initial values of pore water pressure were extracted from the soil water
characteristics for different initial water contents in the experiment. The osmosis efficiency
5-9
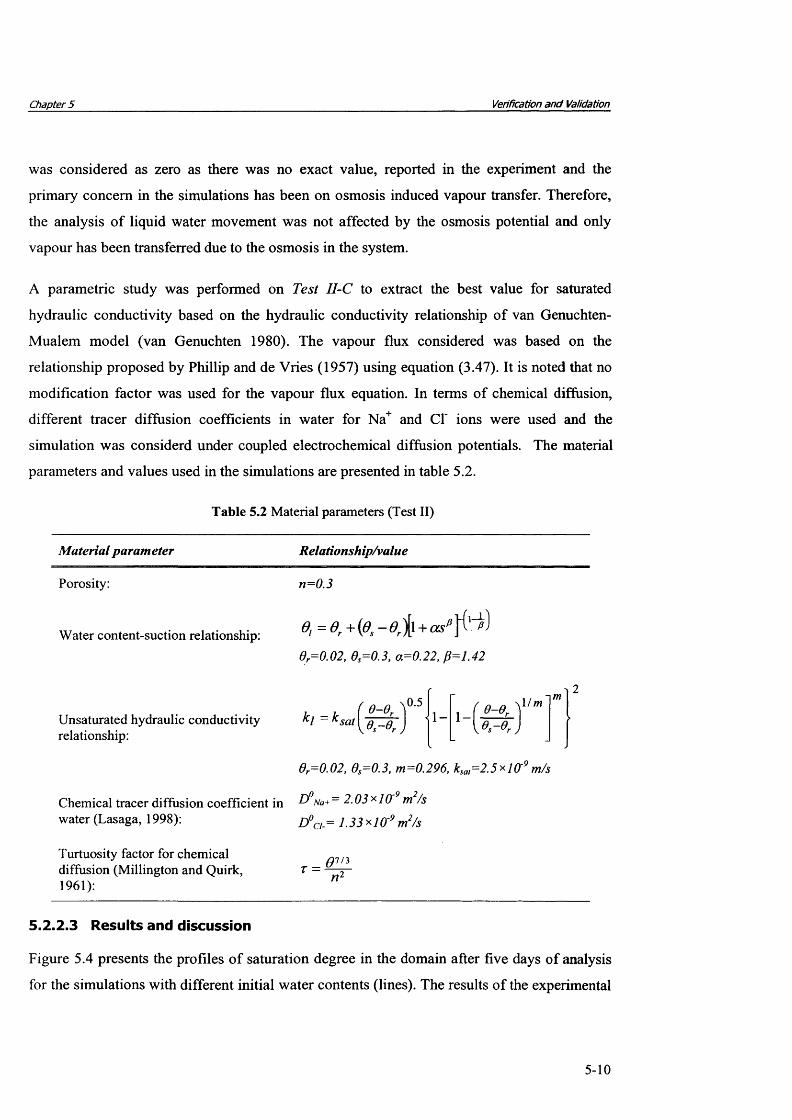
Chapter 5 Verification and Validation
was considered as zero as there was no exact value, reported in the experiment and the
primary concern in the simulations has been on osmosis induced vapour transfer. Therefore,
the analysis of liquid water movement was not affected by the osmosis potential and only
vapour has been transferred due to the osmosis in the system.
A parametric study was performed on Test 11-C to extract the best value for saturated
hydraulic conductivity based on the hydraulic conductivity relationship of van Genuchten-
Mualem model (van Genuchten 1980). The vapour flux considered was based on the
relationship proposed by Phillip and de Vries (1957) using equation (3.47). It is noted that no
modification factor was used for the vapour flux equation. In terms of chemical diffusion,
different tracer diffusion coefficients in water for Na+ and Cl’ ions were used and the
simulation was considerd under coupled electrochemical diffusion potentials. The material
parameters and values used in the simulations are presented in table 5.2.
Table 5.2 Material parameters (Test II)
Material parameter Relationship/value
Porosity:
Water content-suction relationship:
Unsaturated hydraulic conductivity relationship:
Chemical tracer diffusion coefficient in water (Lasaga, 1998):
Turtuosity factor for chemical diffusion (Millington and Quirk,1961):
5.2.2.3 Results and discussion
Figure 5.4 presents the profiles of saturation degree in the domain after five days of analysis
for the simulations with different initial water contents (lines). The results of the experimental
n = 0 .3
0 ,= 0 r + { 0 . - e r' i i + c B ' ] t e )
0r=O.O2, 0S=0.3, a -0 .2 2 , 0=1.42
6r= 0 .02, 6S= 0 .3, m =0.296 , ksal= 2 .5*10r9 m /s
D°Na+ = 2 .0 3 * 1 O'9 m2/s
D°a = 1 .33*1(T9 m2/s
r = S—/ n
ki = k sat0-9r0,-0,
0.51- 1- e-er
0,-e,
Mm
5-10

Chapter 5 Verification and Validation
work reported by Scotter and Raats (1970) have been also presented in this figure for
comparison (symbols). A good correlation in the profiles o f the degree o f saturation between
the results o f numerical simulation and experimental data is observed. As it is anticipated
from osmosis phenomenon, moisture and dominantly water vapour tend to migrate from the
soil domain towards the boundary due to the high concentration o f dissolved chemicals at
boundary. The consequence is an increase in the degree o f saturation in the salt boundary
regions as observed in figure 5.3. Both numerical model and experimental results indicate that
the drying region in the domain is limited mostly to about 3 to 6 cm distance from the salt
boundary.
0.6
0.5
Test Aco
TO3roIQ
Test Bo<1)03 0 .3 -05<15Q Test C
0.2Test D
0 .06 0.08 0.10 0.120.00 0.02 0 .04 0.14
Distance from salt source (m)
Figure 5.4 Profiles of the degree of saturation in the domain considering different initial water contents. Lines represent the results of the numerical model and symbols show the experimental
results reported by Scotter and Raats (1970)
In comparison between the numerical model results and experimental data, the numerical
model resulted larger decrease in the moisture content in the drying regions. As reported
earlier, no modification factors were used for the components o f vapour flux equation
proposed by Phillip and de Vries (1957). The higher drying can be related to the vapour flux
equation used in the simulation.
5-11

Chapter 5 Verification and Validation
Figure 5.5 also shows the profiles o f distribution o f dissolved chemicals in the first five
centimetres o f the domain close to the salt boundary, after five days o f test. The results o f the
numerical simulations are shown by the lines and symbols represent the experimental results
reported by Scotter and Raats (1970). In analysis with higher initial water contents, i.e. Test
II-D, a good agreement the numerical results and experimental data is observed. The results of
the numerical model show higher values for the dissolved chemicals in the cases with lower
initial water contents. However, the general trend demonstrates similar qualitative trend
observed in the experiment, especially in prediction o f the region affected by the diffusion.
However, the discrepancies are greater with lowering the initial water content which can be
related to the fact that no chemical reaction was considered in the simulation whilst the
precipitation o f salt is likely to occur.
6000
• Numerical model (w =3.9%)roE=5 5000E,c01 4000 cSoco.° 3000
A Exp. results (w =3.9%)
Numerical model (w =6.6%)
■ Exp. results (w =6.6%)
- - Numerical model (w =8.4%)
O Exp. results (w=8.4%)
Nuemrical model (w =11.6%)
Exp. results (w=11.6%)2000"OCD>OC/1COTO 1000
0.030.01 0.02 0.04 0.050Distance from salt (m)
Figure 5.5 Profiles of the dissolved chemical concentrations in the first 5 cm of the domain considering different initial water contents.
As mentioned earlier, Scotter and Raats (1970) repeated the experiment for the sample with
initial water content o f 8.4 % and reported the results o f degree o f saturation for the periods o f
4, 5, 8 and 16 days. The numerical simulations on Test II-C, i.e. with initial water content o f
8.4%, are also repeated and the results for the mentioned periods are collected. Following
Scotter and Raats (1970), the results o f moisture profile are provided as a function o f distance
5-12
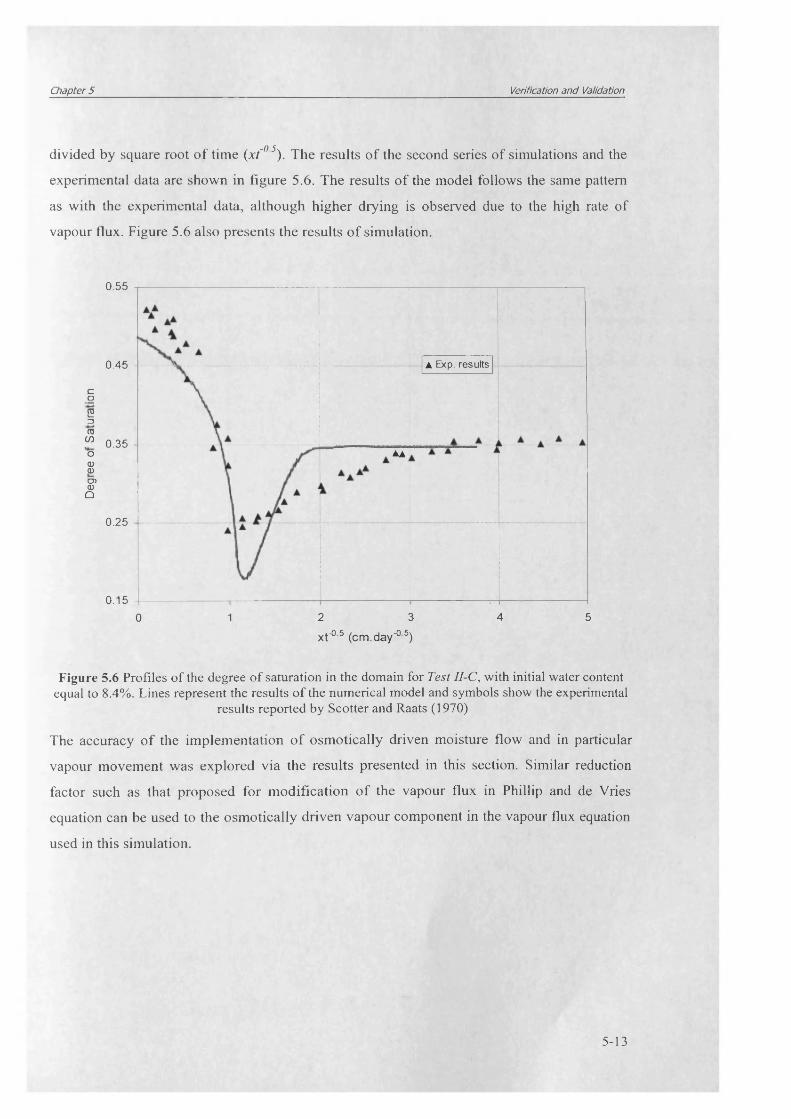
Chapter 5 Verification and Validation
divided by square root o f time (xf0 5). The results o f the second series o f simulations and the
experimental data are shown in figure 5.6. The results o f the model follows the same pattern
as with the experimental data, although higher drying is observed due to the high rate o f
vapour flux. Figure 5.6 also presents the results o f simulation.
0 .5 5
▲ Exp. results0 .4 5
co
E= 3
TOif)O 0 .3 5 ▲▲<D<D030)O
0 .2 5
0 .1 5
2 3 40 1 5
xf° 5 (cm.day'0 5)
Figure 5.6 Profiles of the degree of saturation in the domain for Test II-C, with initial water content equal to 8.4%. Lines represent the results of the numerical model and symbols show the experimental
results reported by Scotter and Raats (1970)
The accuracy o f the implementation o f osmotically driven moisture flow and in particular
vapour movement was explored via the results presented in this section. Similar reduction
factor such as that proposed for modification o f the vapour flux in Phillip and de Vries
equation can be used to the osmotically driven vapour component in the vapour flux equation
used in this simulation.
5-13
Chapter 5 Verification and Validation
5.3 Verification of Multicomponent Chemicals Transport
In this section the verifications of the non-reactive transport model for multicomponent
chemicals are presented. The first two tests deal with the diffusion model adopted for
multicomponent chemicals under coupled electrochemical potentials and isothermal
conditions. The third example provides a verification test for the approach used for diffusion
of multicomponent chemicals under coupled electrochemical and thermal potentials. The
multicomponent diffusion model is verified in binary and ternary electrolyte solutions under
coupled electrochemical and thermal potentials. First, the charge conservation or electro
neutrality condition in the model is checked during thermal diffusion in binary and ternary
electrolyte solutions using the experimentally determined thermal diffusion coefficients, i.e.
the Soret coefficients. Secondly, the theoretical approach adopted for the approximation of the
Soret coefficient is validated. In this test, theoretical approach proposed for approximation of
the Soret coefficient in chapter 3, is examined against, a series of experimental data. All
verifications are performed in electrolyte solutions.
5.3.1 Diffusion of binary electrolyte solutions under electrochemical potential (Test III)
5.3.1.1 Introduction
The multicomponent diffusion model is verified in this simulation for binary electrolyte
solutions. A binary electrolyte solution contains an ion pair including a cationic and an
anionic chemical species. In the case of binary solutions, the multicomponent diffusion
formulation due to the electrochemical potential can be simplified and expressed via Fick’s
law of diffsuion, using a modified diffusion coefficient (Cussler, 1997). Therefore in this
case, the multicomponent diffusion model is verified against modelling the problem using
Fick’s law of diffusion.
The general diffusion flux due to electrochemical potential presented in equation (3.143) can
be simplified for the case of binary solutions. The equation can be reduced to a problem of
diffusion under the second Fick’s diffusion law.
5-14

Chapter 5 Verification and Validation
The general diffusive flux due to electrochemical potential (under isothermal condition),
presented in equation (3.143) for an ionic species can be given as:
- D ° 1 +d In yt d In c\ .* j=\ 3 In c JdJ
Vcj
k=\
(5.4)
For a binary ionic solution and if the effect of thermodynamic correction factor,
d In yti.e. 1 -h Y , is ignored, the diffusive flux for the cationic (component 1 in this simulation)
d In
and anionic species (component 2 in this simulation) become:
J Difr = - D ° V c 1 H Z' ^ >1 C(i \z D °V c l + z Z)°Vc21y Cd ^ 2 j O l , 2n 0 2 ^ Z2^2 VCrfJz ] D ] cd + z 2D 2cd
J D i f f r \ u v 7 iV C . +
z D °c 22 2 d - ^ [ z . ^ V c i + z . A V c j ]
(5.5)
(5.6)z i D , c d + z^D^Cj
Based on equations (3.129) and (3.161), the charge conservation dictates that at any point in
the solution:
nc
1Lz icd =0i=i
For a binary solution, e.g. NaCl or CaSO /’, the equation (5.7) reduces to:
(5.7)
Z xC d ZoC2 d
The spatial differential form of the equation (5.8) also yields:
z xV c xd = - z 2Vc;
(5.8)
(5.9)
Replacing the conditions presented in equations (5.8) and (5.9) into the diffusion fluxes yield
a simplified form as:
D i f f _ j D i f f _ ( Z 1 Z 2 ) A ^ 2 \ J r \V cZ i D ? - z , D ° d
(5.10)'1 1 2 2
For a binary solution containing single ionic species, e.g. NaCl where zj+zr=0, the equations
(5.10) yield a further simplified form:
5-15
Chapter 5 Verification and Validation
JDiff _ jDiff _ _ 2A °A Q y 1 ,r .
1 2 ■ a ° + A° d ( }
The flux equation is in fact, in the form of diffusion flux based on Fick’s first diffusion law
which is solely based on concentration gradients. The only difference is in the diffusion
coefficient which is modified using a harmonic mean o f the diffusion coefficients of the ion
pairs in the binary solution. A similar derivation of the diffusion in a binary solution has been
also presented by Cussler (1997) and Jungnickel et al. (2004).
If the diffusion process of the binary solution is modelled via the multicomponent diffusion
formulation, the same results shall be generated with modelling via Fick’s diffusion approach
considering the harmonic mean of the diffusion coefficients of the ion pairs. This condition is
examined to verify the approach adopted for multicomponent diffusion approach in the case
of binary solutions.
5.3.1.2 Numerical model conditions
A series of numerical simulations on the diffusion of binary solutions are performed. The
numerical model developed here for the diffusion of multicomponent is examined against the
Fick’s diffusion model implemented in COMPASS. The implementation of the Fick’s law of
diffusion in the model was extensively verified with different examples and against analytical
solutions and other numerical models by Seetharam (2003), providing confidence in the
application of the model for the purpose o f comparison.
Two different binary solutions were used in the simulation comprising NaCl and HC1
electrolyte solutions. The domain consisted of an electrolyte tube (0.1x0.1 m) containing
NaCl or HC1 which was exposed to same electrolyte solution but with different concentration
at one boundary side. The domain initially contained no electrolyte solution including NaCl
or HC1. At one boundary, a fixed concentration of NaCl or HC1 was considered and at the
other boundary, an impermeable condition was assumed. Figure 5.7 provides a schematic
representation of the initial and boundary conditions of the electrolyte tube.
The 2D domain was discretised into 100 equally sized 4-noded quadrilateral elements. The
system considered was saturated and the porosity was set as one. The water pressure and
temperature were fixed during the analysis in the whole domain; therefore the transport flux
5-16

Chapter 5 Verification and Validation
occurred purely by isothermal diffusion. The simulations were performed under coupled THC
behaviour in the model. A fixed time-step of 3600 seconds was used for all simulations.
B oundary condition: ui=100 P a T = 2 9 3 K d c /d x - 0
Figure 5.7 Schematic of the initial and boundary conditions (Test III)
Different tracer diffusion coefficients in water (D°) were considered for the involving
chemical components in the simulation based on multicomponent approach whilst in the
modelling based on Fick’s law of diffusion a harmonic mean was applied according to
equation (5.11). The diffusion coefficient of Na+, Cl', and H+ in water were considered as
13.3xlO'10, 20.3xlO'10, and 93.1 xlO'10 m2/s, respectively (Lasaga 1998).
Calculation of the harmonic mean of the tracer diffusion coefficient gives the value of
16.1 xlO 10 and 33.3x1 O'10 m2/s for NaCl and HC1, respectively.
5.3.1.3 Results and discussion
Due to the higher concentration of the electrolyte solution at the boundary, ions diffuse into
the tube. In the case of simulation under the multicomponent diffusion model, ions migrate
from the boundary with different rates due to the difference in the diffusion coefficients used
in the simulation data and the general conservation of charge adopted in the formulation
provides a coupling between chemical and electrical diffusion potentials.
In the case of simulations based on the Fick’s law of diffsuion, ion pairs diffuse with the same
rate of diffusion considering that same diffusion coefficients for the latter analysis were used
as the harmonic mean between the diffusion coefficients of the ionic pairs.
Figure 5.8 shows the simulation results of the chemical concentration patterns of Na+ or Cf
ions, i.e. NaCl binary solution at different times of analysis according to the multicomponent
diffusion approach and based on the Fick’s law of diffusion. In figure 5.9, the modelling
results of the profile for H+ or Cf ions, i.e. HC1 binary solution at different times of analysis is
also presented. The symbols represent the results of simulation based on multicomponent
diffusion approach and lines give the results based on the Fick’s law of diffusion.
B ou ndary condition: u i= 100 P a T = 2 9 3 K
Cd (N a +o r H ) = 100 m ol/m 3
Cd (C T )-1 0 0 m ol/m 3
In itia l condition: u i= 100 P a T = 2 9 3 K
Cd (N a+ o r FT ) = 0 m ol/m 3 Cd ( C t ) - O m ol/m 3
5-17

Conc
entra
tions
of
disso
lved
ions
(mol/
rrf)
Conc
entra
tions
of
disso
lved
ions
(mol/
rtf)
Chapter 5 Verification and Validation
100
80 - 1000 h60
a Multicomponent Diffusion Approach
Fick's Diffsuion40
100 h50 h
20 10 h
0 0.04 0.06 0.08 0.10.02
Distance (m)
Figure 5.8 Profiles of the concentrations of Na+ and Cf ions in the domain.
100 1000 h
a Multicomponent Diffusion Approach
Fick's Diffsuion
40
100 h50 h20 10 h
0.02 0.04 0.06 0.080 0.1
Distance (m)
Figure 5.9 Profiles of the concentrations of H+ and Cl' ions in the domain.
5-18

Chapter 5 Verification and Validation
The modelling results based on multicomponent approach and Fick’s diffusion with the
assumption of harmonic mean yield to same values of ionic concentrations at different time of
analysis both for NaCl and HC1 solutions. The diffusion coefficient of H+ is about five times
greater than that of Na+ which results a higher rate of diffusion in the system for the case of
HC1 binary solution. However, the overall rate of diffusion for HC1 solution is about three
times higher than that for NaCl based on harmonic mean used in the simulation. The results of
modelling shows that the overall charge neutrality is conserved and the same values for
anionic and cationic species are obtained during analysis based on multicomponent approach.
5.3.2 Diffusion of multiple ions in electrolyte solution under electrochemical potential (Test IV)
5.3.2.1 Introduction
In this example, the theoretical and numerical model adopted for multicomponent chemical
transport under electrochemical diffusion potential is examined in the case of an electrolyte
solution containing multiple ionic species. This example was adopted from a similar
verification test reported by Lichtner (1995) and Appelo (2007). This verification consisted of
a pure diffusion with different diffusion coefficients under isothermal conditions in an
electrolyte solution consisting of four ionic species.
Following Lichtner (1995), the domain consisted of a 10 mm long electrolyte tube containing
NaCl and HNO3 , which was exposed to a similar mixed electrolyte solution but with different
concentrations at one boundary side. The domain considered initially contained a solution of
NaCl and HNO3 with concentration of 0.1 mol/m . At the boundary, the tube was exposed to
a NaCl solution with the same concentration as exists initially in the domain, whilst having a3 3different concentration of HNO3 (10' mol/m ). In terms of modelling, the electrolyte system
of mixed NaCl and HNO3 solution can be considered as a multicomponent system consisting
of four chemical components o f Na+, Cf, H+ and NO3'.
5.3.2.2 Numerical model conditions
The domain was discretised into 100 equally sized 4-noded quadrilateral elements. The
system was saturated and the porosity was considered as one (pure aqueous system). A fixed
5-19
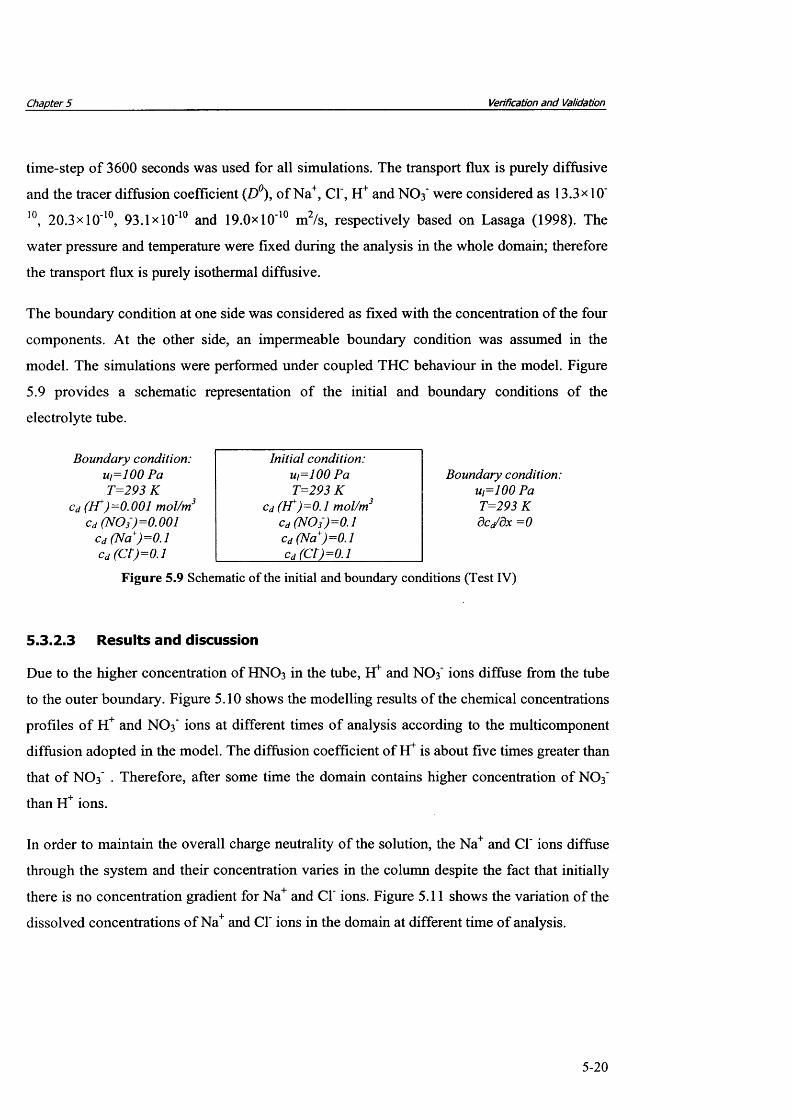
Chapter 5 Verification and Validation
time-step of 3600 seconds was used for all simulations. The transport flux is purely diffusive
and the tracer diffusion coefficient (D°), of Na+, Cl", H+ and NO3' were considered as 13.3x 10"
10, 20.3xlO'10, 93.1 xlO' 10 and 19.0xl0"10 m2/s, respectively based on Lasaga (1998). The
water pressure and temperature were fixed during the analysis in the whole domain; therefore
the transport flux is purely isothermal diffusive.
The boundary condition at one side was considered as fixed with the concentration of the four
components. At the other side, an impermeable boundary condition was assumed in the
model. The simulations were performed under coupled THC behaviour in the model. Figure
5.9 provides a schematic representation of the initial and boundary conditions of the
electrolyte tube.
B ou n dary condition: u i= 100 P a T = 2 9 3 K
Cd ( I t ) = 0.001 m ol/m 3 cd (N O 3)= 0 .0 0 1
cd (N a+)= 0 .1Cd(cr)=o.i
Figure 5.9 Schematic of the initial and boundary conditions (Test IV)
5.3.2.3 Results and discussion
Due to the higher concentration of HNO3 in the tube, H* and NO 3' ions diffuse from the tube
to the outer boundary. Figure 5.10 shows the modelling results of the chemical concentrations
profiles of H+ and NO 3" ions at different times of analysis according to the multicomponent
diffusion adopted in the model. The diffusion coefficient of FT is about five times greater than
that of NO 3' . Therefore, after some time the domain contains higher concentration of NO3'
than H+ ions.
In order to maintain the overall charge neutrality of the solution, the Na+ and Cl" ions diffuse
through the system and their concentration varies in the column despite the fact that initially
there is no concentration gradient for Na+ and Cl" ions. Figure 5.11 shows the variation of the
dissolved concentrations of Na+ and Cl" ions in the domain at different time of analysis.
In itia l condition: u i= 100 P a T = 2 9 3 K
cd ( F t ) - 0 . 1 m ol/m 3 cd (NO 3')= 0 .1 cd (N a+)= 0 .1 cd (C Q = 0 .1
B ou ndary condition: u i= 100 Pa T = 293 K dctdx -0
5-20

Chapter 5 Verification and Validation
0.01 h0.08
0.1 hEoE
0.1 h.2 0 06 '
2 1 i8 0.04co
1.0 h
--N 03- — H+
0.02 - — 10 h *-
10 h
0 0.2 0.4 0.6 0.8 1Distance (cm)
Figure 5.10 Concentration patterns of NO3' and H+ at different times
0 . 1 2
--CI- — Na+1.0 h
0.1 h0.1110 h
EoE 0.01 hCOcoc:<DOc:ooco
- 10 h —
0.09 -0.1 h
0.080.2 0.4 0.6 0.8 10
Distance (cm)
Figure 5.11 Concentration patterns of Cl' and Na+ at different times
In order to demonstrate the difference between modelling the example via the
multicomponent approach and Fick’s law, the simulation is repeated via Fick’s diffusion
5-21

Chapter 5 Verification and Validation
model using different diffusion coefficient for the ions as stated before. Figure 5.12 shows the
results o f variation o f ions in the system based on Fick’s law o f diffusion after one hour
analysis. The results o f the modelling based on multicomponent approach after one hour
analysis is also repeated in figure 5.13, by means o f comparison.
0.12
"e 0.08 -"oEc•2 0.06 -2c
§g 0.04co
Cl-Na+N03-H+
0.02 -
0 0.2 0.4 0.6 0.8 1Distance (cm)
Figure 5.12 Concentration profiles of dissolved ions after 1.0 hour based on Fick’s diffusion model
The results based on Fick’s law o f diffusion for each component follows its actual
concentration gradient, without considering the overall neutrality condition in the domain.
Therefore, as expected the chemical concentration o f sodium and chloride ions does not vary
in the system.
When each ion diffuses with its own diffusion coefficient, analysis based on Fick's law of
diffusion, gives a constant concentration o f Na+ and CF during the analysis since there is not
absolute concentration gradient for these ions. In comparison, the concentration o f Na+ and
CF varies based on the multicomponent approach modelling whilst it remains constant
according to the modelling based on Fick’s law. Figure 5.14 shows the variation o f total
charge along the domain based on multicomponent approach and Fick’s law o f diffusion
assuming different diffusion coefficients for chemicals after one hour o f simulation.
5-22
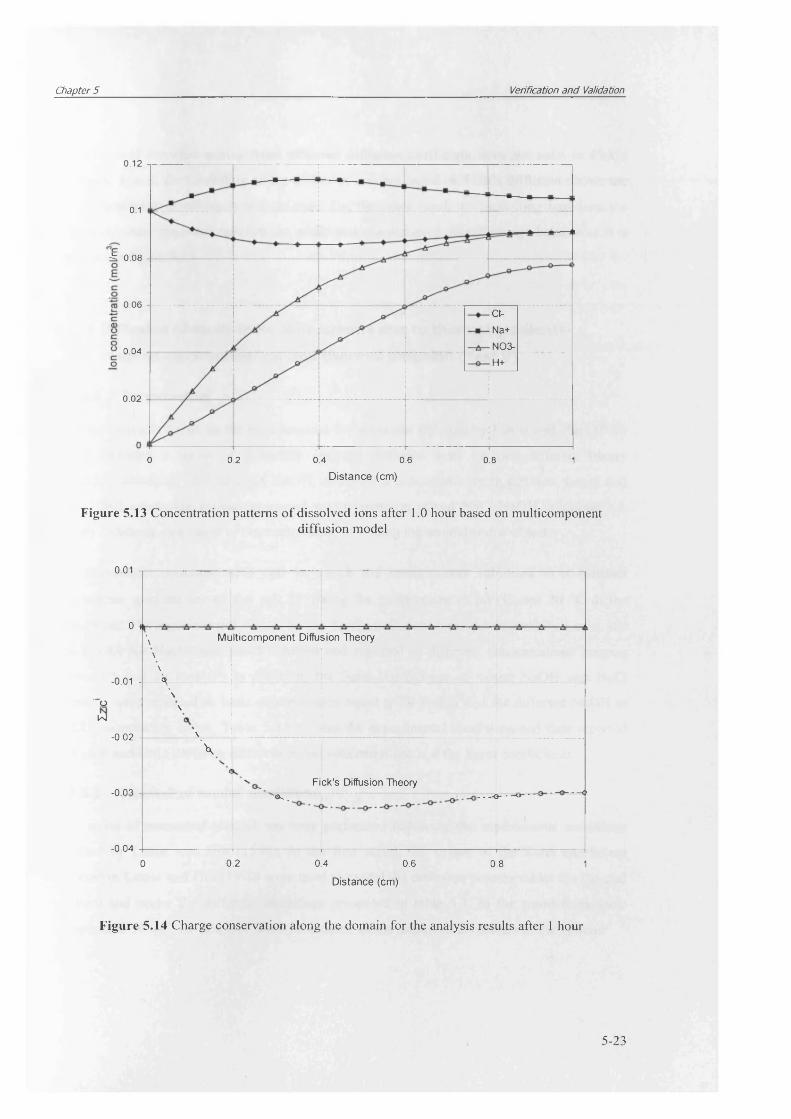
Chapter 5 Verification and Validation
0.12
0.1
^ 0.08
0.06Cl-Na+N03-H+
0.04
0.02
0.20 0.4 0.6 0.8 1Distance (cm)
Figure 5.13 Concentration patterns of dissolved ions after 1.0 hour based on multicomponentdiffusion model
0.01
n iu 1
-0.01 -
“ ow
-0.02 -
\ Mu\
\
\\
\
\
ilticomponent Diffu;5 ion Theory
-n m -
\c
Fick’s Diffusion Theory. —T\---- 1\\J
-0.04 -
®'. ---- ----- -----
I T ' I ------- 1------------------------0 0.2 0.4 0.6 0.8 1
Distance (cm)
Figure 5.14 Charge conservation along the domain for the analysis results after 1 hour
5-23

Chapter 5 Verification and Validation
The electrical potential arising from different diffusion coefficient does not exist in Fick’s
approach; hence, the modelling of the diffusion process based on Fick’s diffusion shows the
overall neutrality condition is not satisfied. On the other hand, the modelling based on the
multicomponent approach satisfies the additional constraint of overall charge balance as it is
observed in figure 5.14.
5.3.3 Diffusion of multi-ionic components due to thermal gradients- coupled electrochemical and thermal diffusion (Test V)
5.3.3.1 Introduction
The simulation is based on the experimental investigation reported by Leaist and Hui (1990)
which included a series of thermally induced diffusion tests on two different binary
electrolyte solutions, i.e. NaCl and NaOH, at different concentrations. In addition, Leaist and
Hui (1990) conducted another series of experiments on mixed NaCl-NaOH solutions, i.e.
ternary solutions, in a range of concentrations, providing the second series of tests.
The experiment consisted of a cell in which the solution was subjected to a constant
temperature gradient across the cell by fixing the temperature at 30 °C and 20 °C at the
boundaries. The experimental values of the Soret coefficient were determined by Leaist and
Hui (1990) for NaOH and NaCl solution and reported in different concentrations ranging
between 5 and 20 mol/m . In addition, the Soret coefficients of mixed NaOH and NaCl
solutions were reported at ionic concentration equal to 20 mol/m3and for different NaOH to
NaCl concentration ratios. Table 5.3 provides the experimental conditions and data reported
by Leaist and Hui (1990) on different initial concentrations and the Soret coefficients.
5.3.3.1 Numerical model conditions
Two series of numerical simulations were performed following the experimental conditions
reported by Leaist and Hui (1990). In the first series, the values of the Soret coefficient
reported in Leaist and Hui (1990) were used to model the diffusion process under the thermal
gradient and under the different conditions presented in table 5.3. In the simulations ionic
components of Na+, CF and OH' were considered as the dissolved chemicals in the system.
5-24
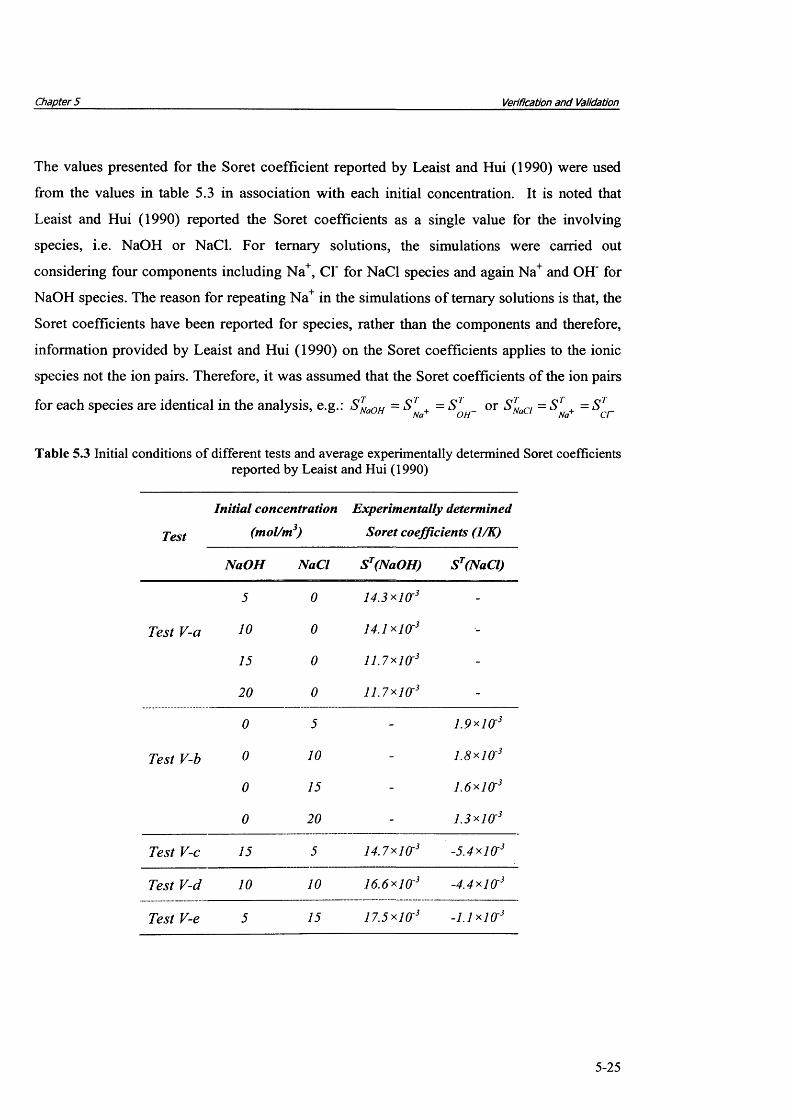
Chapter 5 Verification and Validation
The values presented for the Soret coefficient reported by Leaist and Hui (1990) were used
from the values in table 5.3 in association with each initial concentration. It is noted that
Leaist and Hui (1990) reported the Soret coefficients as a single value for the involving
species, i.e. NaOH or NaCl. For ternary solutions, the simulations were carried out
considering four components including Na+, Cl" for NaCl species and again Na+ and OH' for
NaOH species. The reason for repeating Na+ in the simulations of ternary solutions is that, the
Soret coefficients have been reported for species, rather than the components and therefore,
information provided by Leaist and Hui (1990) on the Soret coefficients applies to the ionic
species not the ion pairs. Therefore, it was assumed that the Soret coefficients of the ion pairs
for each species are identical in the analysis, e.g.: S TNaOH = S T + = S T or S TNaCl = S T + = S T
Table 5.3 Initial conditions of different tests and average experimentally determined Soret coefficientsreported by Leaist and Hui (1990)
Initial concentration Experimentally determined
Test (mol/m3) Soret coefficients (1/K)
NaOH NaCl ST(NaOH) ST(NaCl)
5 0 1 4 .3 * 1 O'3 -
Test V-a 10 0 1 4 .1 * 1 O'3 -
15 0 1 1 .7 * 1 0 '3 -
20 0 1 1 .7 * 1 0 '3 -
0 5 - i . 9 * i a 3
Test V-b 0 10 - 1 .8 * 1 Of3
0 15 - 1 .6 * 1 O'3
0 20 - 1 .3 * 1 O'3
Test V-c 15 5 1 4 .7 * 1 O'3 -5 .4 * n r 3
Test V-d 10 10 1 6 .6 * 1 0 '3 -4 .4 * 1 O'3
Test V-e 5 15 1 7 .5 * 1 O'3 - i . i * i a 3
5-25
Chapter 5 Verification and Validation
In the second series of analysis, the theoretical approach adopted for calculating the Soret
coefficient based on Agar et al. (1989) was applied in the numerical simulation instead of the
experimentally determined values used in the first series of simulation. Similar conditions
applied in the first series were used in the second series. The second series of simulation
provided a validation test for the theoretical approach for determination of the Soret
coefficient in comparison with the results in the first series. The values of the Soret coefficient
were calculated based on the tracer diffusion coefficient of each component using equation
(3.151).
The studied 2D domain is 1 cm long which was discretised into 100 equally sized 4-noded
quadrilateral elements. The temperature was fixed at 20 and 30 °C at the boundaries and the
initial temperature was 25 °C. The system considered is saturated and porosity was assumed
equal to one. The water pressure was constant along the domain during the analysis, providing
a purely diffusive flux. Figure (5.15) presents schematics of the initial and boundary
conditions for different simulations performed on binary and ternary solution.
Different diffusion coefficients were considered for the various chemical components. The
simulation was carried out with variable time-steps and continued to reach steady-state
conditions for the dissolved chemical concentrations. The tracer diffusion coefficients (D°) of
Na+, CF, OH' were considered equal to 13.3xlO'10, 20.3xl0'10, 52.7xlO'10 m2/s, respectively
based on Lasaga (1998). Since different diffusion coefficients are used in the simulation, the
overall charge must be conserved during the analysis, according to the formulation of
diffusion developed earlier, providing a verification test on diffusion under non-isothermal
conditions.
5.3.3.3 Results and discussion
Figure 5.16 and Figure 5.17 shows the simulation results of concentration variation of ions at
steady state for binary solution containing different initial concentrations of NaOH and NaCl,
respectively, i.e. Case V-a and V-b in figure 5.15. The lines represent the results based on the
theoretical approach for the Soret coefficient and the symbols show the simulation results
based on the experimentally determined Soret coefficient values reported by Leaist and Hui
(1990).
5-26

Chapter 5 Verification and Validation
B oundary condition: ui=100 Pa T = 2 9 3 K d c /d x = 0
In itia l condition: u i= 100 P a T = 2 9 8 K
cd (N a+) = cd (O H )= 5 m ol/m 3 10 m ol/m 3 15 m ol/m 3 20 m o l/m 3
Boundary condition: ui=100 Pa T = 3 0 3 K d c /d x = 0
Test V-a
B oundary condition: u i=100 P a T = 2 9 3 K d c /d x = 0
In itia l condition: U j - 1 0 0 P a T = 2 9 8 K
cd (N a+) = cd (C T)= 5 m ol/m 3 10 m ol/m 3 15 m ol/m 3 20 m ol/m 3
Boundary condition: Ui=100 P a T = 3 0 3 K d c /d x = 0
Test V-b
B oundary condition: ui=100 P a T = 2 9 3 K d c /d x = 0
B oundary condition: ui=100 Pa T = 2 9 3 K d c /d x - 0
B oundary condition: u i= 100 Pa T = 2 9 3 K d c /d x = 0
In itia l con dition: u i= 100 P a T = 2 9 8 K
cd (N a+) = cd ( C l ) = 0 .005 cd (N a+) = cd (0 1 T )= 0 .0 1 5
Test V-c
In itia l con dition: ut= 1 0 0 P a T = 2 9 8 K
cd ( N a ) = cd (C O = 0 .0 1 cd (N a+) = cd (OH )=O .Q 1
Test V-d
In itia l con dition: u /= 100 P a T = 2 9 8 K
cd (N a+) = cd (C I)= 0 .0 1 5 c d (N a+) = cd ( O H )= 0 .005
B oundary condition: ui=100 Pa T = 3 0 3 K d c /d x = 0
B ou ndary condition: ui=100 P a T = 3 0 3 K d c /d x = 0
B oundary condition: u/=100 P a T = 3 0 3 K d c /d x = 0
Test V-e
Figure 5.15 Schematic of the initial and boundary conditions (Test V)
The results indicate that ion pairs in each binary solution migrate with the same rate under
coupled thermal potential, sourcing from boundary condition and electrochemical potential
arising from the application of different diffusion coefficients. The simulation results also
show a good match between the theoretical approach adopted for thermal diffusion and the
experimental values reported by Leaist and Hui (1990).
5-27

Chapter 5 Verification and Validation
Figure 5.17, 5.18 and 5.19 shows the simulation results of concentration o f CF and OH' ions
at steady state for mixed solutions o f NaOH and NaCl at two different ratios o f concentrations
of NaOH over NaCl, i.e. case III, IV and V in figure 5.15. The symbols show the results based
on the experimentally determined values for the Soret coefficient reported by Leaist and Hui
(1990). The lines represent the results based on the theoretical approach for Soret coefficient,
i.e. equation (3.151).
20 mol/m320
15 mol/m3
12
mol/m:
8
5 mol/m3
40.006 0.008 0.010.002 0.0040
Distance from cold end (m)
Figure 5.16 Simulation results of variation of Na+ and OH' at steady state and at different initial binary solutions of NaOH. Lines represent the results based on the theoretical approach adopted for
the Soret coefficient and symbols show the simulation results based on the reported values of the Soretcoefficients by Leaist and Hui (1990) (Test V-a)
The results show a good correlation between simulation based on the adopted approach and
on the experimentally determined values for the Soret coefficient in the case o f OH' ions.
However, in the case o f ternary solutions, Leaist and Hui (1990) reported negative values for
the Soret coefficient for NaCl. This implies that in the ternary solutions, chloride ions tend to
move toward hot side in contrast with the general trend observed in binary solutions. Such a
trend in the distribution o f chloride is not observed in the results o f simulation using the
theoretical approach adopted for thermal diffusion effects. However, the coupling o f the
chemical and electrical potential effects reduces the rate of chloride migration away from heat
source. The model results for all simulations conserve the overall charge during the analysis
and at steady state, verifying the charge conservation in the transport equation for
multicomponent chemicals under coupled electrochemical and thermal diffusion potentials.
5-28

Chapter 5 Verification and Validation
20
n"E
16
o 1 2
O
20 mol/m3o Q D II
c c [I o moi/rn
*j l—S—a □ ii
10 mol/m3II 11 u c,
t n n i
5 m ol/m 3
0.002 0.004 0.006 0.008Distance from cold end (m)
0.01
Figure 5.17 Simulation results of variation of Na+ and Cl' at steady state and at different initial binary solutions of NaCl. Lines represent the results based on the theoretical approach adopted for the Soret
coefficient and symbols show the simulation results based on the reported values of the Soret coefficients by Leaist and Hui (1990) (Test V-b)
16NaOH
roE 15 mol/moEcorocCDOczooCo
5 mol/nrNaCl
0.0060.004 0.008 0.010.002
D istance (m)
Figure 5.18 Simulation results of concentration profiles of ions at steady state for ternary mixed NaCl and NaOH solution at NaOH/NaCl molarity ratio of 3, based on the theoretical approach adopted for
the Soret coefficient (lines) and based on the values for the Soret coefficients (Test V-c)
5-29

Chapter 5 Verification and Validation
12
11 NaOH
10 mol/m
10
NaCl
10 mol/m39
8
0 0.002 0.004 0.006 0.008 0.01Distance (m)
Figure 5.19 Simulation results of concentration profiles of ions at steady state for ternary mixed NaCl and NaOH solution at NaOH/NaCl molarity ratio of 1, based on the theoretical approach adopted for
the Soret coefficient (lines) and based on the values for the Soret coefficients (Test V-d)
20
sr 16
IE
12
cO 8
NaCl
15 mol/m3
NaOH
-----— .................. i5 mol/m3
*—a— a— tr—'t
0.002 0.004 0.006Distance (m)
0.008 0.01
Figure 5.20 Simulation results of concentration profiles of ions at steady state for ternary mixed NaCl and NaOH solution at NaOH/NaCl molarity ratio of 1/3, based on the theoretical approach adopted for
the Soret coefficient (lines) and based on the values for the Soret coefficients (Test V-e)
5-30

Chapter 5 Verification and Validation
5.4 Reactive transport of multicomponent chemicals: verification of the coupling of the COMPASS and PHREEQC models
Verification tests on the developed chemical module of the model including the coupling
transport with the geochemical reaction model are presented in this section. The verification
examples on the geochemical reaction features included under the coupled chemical transport
model, i.e. COMPASS and reaction model, PHREEQC version 2 are presented.
The geochemical reaction features of PHREEQC2 which have been linked and tested in the
following sections under the context of coupling COMPASS-PHREEQC are as follows:
• Mineral precipitation and dissolution under equilibrium condition
• Kinetically controlled mineral precipitation and dissolution reactions
• Ion exchange process under equilibrium condition.
5.4.1 Chemical transport with mineral precipitation/dissolution reaction (Test VI)
5.4.1.1 Introduction
In order to verify the model for simulation of transport process coupled with a mineral
precipitation and dissolution reaction front, a test similar to that reported by Xu and Pruess
(1998) was adopted. Two series of simulations were performed assuming mineral
precipitation and dissolution under equilibrium and kinetically controlled reactions. The
results of the numerical model are compared with the results of an analytical solution for the
case of binary solution transport with mineral precipitation/dissolution in the specific
conditions, provided by Xu and Pruess (1998).
The studying system corresponds to one-dimensional transport of two hypothetical species A
and B which originate from the dissolution of a mineral phase ABS (i.e., ABS = A+ + B'). This
verification series is similar to those performed by Xu and Pruess (1998). Two series of
numerical simulations were performed. First the reactive transport of a binary solution with
equilibrium mineral precipitation/dissolution was studied. The results are compared with the
5-31

Chapter 5 Verification and Validation
the results of an analytical solution provided by Xu and Pruess (1998). The second simulation
deals with the transport of the same binary solution with kinetically controlled mineral
reactions. Xu and Pruess (1998) provided an analytical solution for the problem under steady-
state conditions. The results at steady-state will be compared with the results of the analytical
solution. Finally, the results of simulations with different rates of mineral
precipitation/dissolution reaction are compared with simulation under equilibrium condition.
5.4.1.2 Numerical model conditions
The system was considered as 1 m of saturated medium under a steady flow of a solution
from one boundary containing same concentration of chemical B+ as it in the domain, but
with a different concentration of component A + compared with the corresponding value of the
initial state. The domain was discretised into 100 equally 4-noded quadrilateral elements. A
variable time-step was considered for the simulation which allows the time-step to be
increased or decreased depending on convergence. The maximum allowable time-step was
3600 seconds. Temperature is fixed in the domain; therefore the modelling is performed under
isothermal condition. The porosity and pore velocity of the study domain was considered as
0.4 and 0.1 m/day. A fixed pore water pressure was designed in the boundary to provide the
required constant pore velocity.
The domain initially contained same concentrations of A+ and R components. At the
boundary, the concentrations of A + and R were considered to be different. The concentrations
of ionic chemicals were considered relatively low, therefore, the ionic activity can be assumed
equal to the concentration and the activity modification factor can be ignored in calculations.
Figure 5.21 shows a schematic of the initial and boundary conditions used in the verification.
B oundary condition: u i=10 P a T = 2 9 3 K dcj/dx = 0
F ig u r e 5.21 Schematic of the initial and boundary conditions (Test VI)
Physical and chemical parameters required for the modelling are summarised in table (5.5).
Following Xu and Pruess (1998), a first-order kinetic rate of reaction, i.e. rAB, is considered
for the simulations based on kinetically controlled condition based on Lasaga (1994).
B oundary con dition: u,= 5 1 .2 7 P a
T = 2 9 3 K Cd (A )=0.01 m ol/m 3 Cd (B )= 0.1 m ol/m 3
In itia l condition: u/= 10 P a T = 2 9 3 K
Cd (A )= 0 .1 m ol/m 3 Cd (B )= 0.1 m ol/m 3
A B ( s )= 1 .2 4 * 1 O'3 m ol/kg d ry so il
5-32

Chapter 5 Verification and Validation
An B
(5.12)e g
where k represent the kinetic rate constant, o is the specific surface area and Keq is the
equilibrium constant of the reaction.
T able 5.5 M aterial parameters (Test VI)
M aterial param eter Relationship/value
Porosity: n= 0.4
Degree o f saturation S,= 1.0
Pore water velocity: Vi=v/n= 0.1 m/day ==1.157*1 O'6 m/s
Hydraulic conductivity: k,= 1.1 *10r4 m/s
Diffusion coefficient o f chemicals: D,= 0 m2/s
Dispersivity coefficient (Longitudinal) a.[= 0.02 m
Equilibrium constant o f reaction at 25 °C
A B (s)= A + + BTlog Keq= -8.0
5.4.1.3 Analytical solution under equilibrium condition
Xu and Pruess (1998) provided an analytical solution for the specified problem under
equilibrium condition. The solution is repeated here for the sake of completeness. Under the
specified conditions, the governing equation for transport of ionic components A and B due to
the advective-dispersive flux based on a simplified from of equation (3.127) can be given as:
K = ^ + D ^ l + rAB (5 ,3 )at 1 dx dx2 AB
d c j d c B .= - V i - i r - + D ^ r 2 + r AB (5-14)d t dx dx
where Vi is the pore velocity defined as:
n
where V| is the Darcy’s liquid flux, defined in equation (3.25).
V ,= ^ (5.15)
5-33
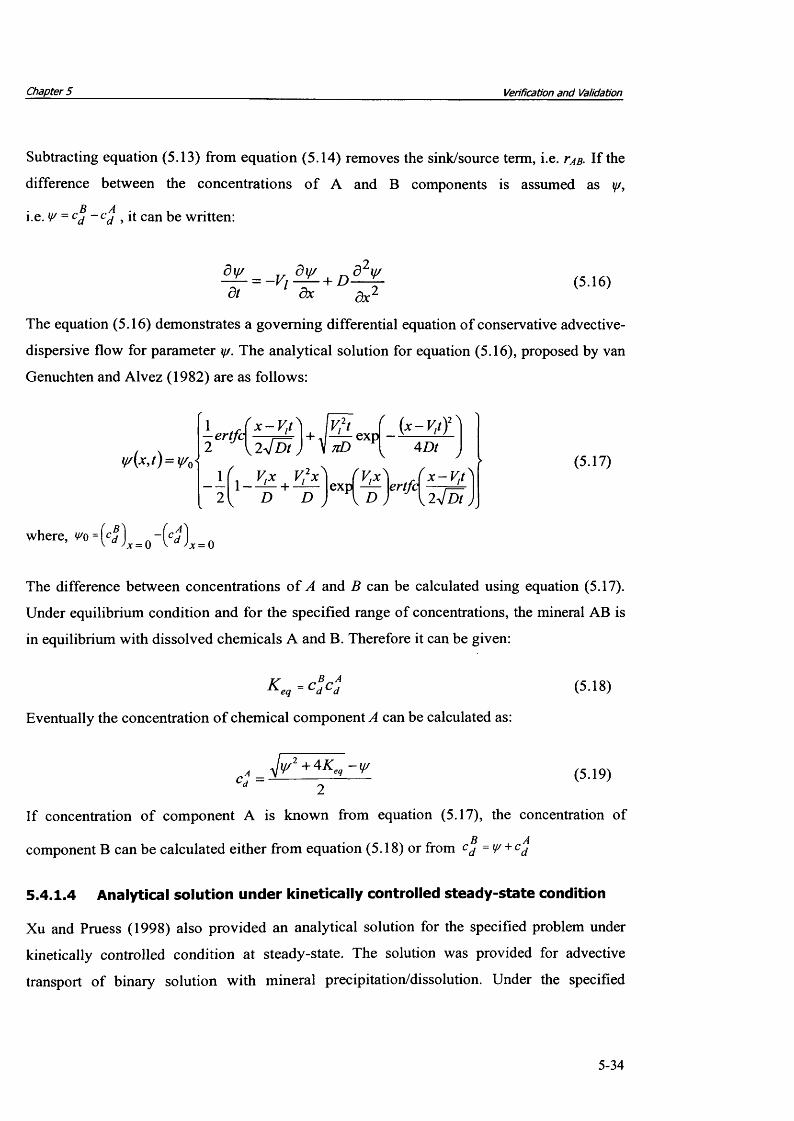
Chapter 5 Verification and Validation
Subtracting equation (5.13) from equation (5.14) removes the sink/source term, i.e. r B- If the
difference between the concentrations o f A and B components is assumed as y/,
B Ai.e. V = cd - c d , it can be written:
^ = -V l ? if - + D d 2 '>/ (5.16)5t dx Qx-
The equation (5.16) demonstrates a governing differential equation of conservative advective-
dispersive flow for parameter yj. The analytical solution for equation (5.16), proposed by van
Genuchten and Alvez (1982) are as follows:
~ ertfcvtt
2 yfDt+ A-*— exp
\ ttD ^
' V.x V,2x^1 — + —---D D
J VixexdV D
4 Dt
f „ertfc v,t
2-fDt
(5.17)
The difference between concentrations o f A and B can be calculated using equation (5.17).
Under equilibrium condition and for the specified range of concentrations, the mineral AB is
in equilibrium with dissolved chemicals A and B. Therefore it can be given:
K eq - e f t (5.18)
Eventually the concentration o f chemical component A can be calculated as:
c i = (5.19)V<y2+ 4 K tq - y /2
If concentration of component A is known from equation (5.17), the concentration ofB Acomponent B can be calculated either from equation (5.18) or from cd =V + Cd
5.4.1.4 Analytical solution under kinetically controlled steady-state condition
Xu and Pruess (1998) also provided an analytical solution for the specified problem under
kinetically controlled condition at steady-state. The solution was provided for advective
transport of binary solution with mineral precipitation/dissolution. Under the specified
5-34

Chapter 5 Verification and Validation
conditions, the governing equation for transport o f ionic components of A and B due to the
advective flux based on simplified from of equation (3.127) can be given as:
_ y dc<j + r qV l AB Udx
- Vt C L- + r AU= 0
(5.20)
(5.21)dx ' 'AB
Similar to the analytical solution under equilibrium condition, if the equations (5.20) and
(5.21) are subtracted from each other, they yield:
d[cBd - c Adj _ V V d d j = Q (5.22)/ dx
This equation indicates that the difference between concentrations of component A and B
remains constant which is equivalent to the difference at boundary, i.e.
w =(c' L 0-(c4 = o -
Therefore, the rate o f mineral reaction can be re-written based on one of the component
concentrations as:
rAB = k(7 1 —c d ( cd - n
K eq
The equation (5.21) is then simplified as:
■V,dcd t—JL- + kcr dx K eq
= 0
The solution for the above equation can be given as (Xu and Pruess, 1998):
(5.23)
(5.24)
4 - ^ e x pcH =
JCd.
1 ~ A exp xd.
(5.25)
where
5-35

Chapter 5 Verification and Validation
n __ ( c d )x = 0 \
(c |),=0-^2
d - V>K * e k c r ^ -A ^ )
(5.26)
(5.27)
and values of 2/ and X2 are the roots of the following second-order polynomial equation:
X1 - ¥ o X - K eq= 0 (5.28)
5 .4 .1 .5 R e s u l ts a n d d i s c u s s io n
Figure 5.22 shows the variation of concentration of chemicals A and B in the domain
calculated using numerical model and analytical solution under equilibrium condition for
mineral precipitation. The results are presented for five days analysis and indicate a match
between the numerical model and analytical solution.
0 . 2
Simulation resu lts
A Analytical solution
~ 0.15 -
0.05 -
Results after 5 days
0.6 0.80.4 10 0.2Distance (m)
Figure 5.22 Concentration patterns of dissolved ions after 5 days under mineral equilibrium condition, resulted form numerical model (lines) and analytical solution (symbols)
The concentration of component A at the boundary is lower than in the solution. Accordingly
and in order to maintain the equilibrium between mineral and dissolved components, some
5-36

Chapter 5 Verification and Validation
mineral has been dissolved in to the system which has increased the concentration o f
component B from the initial level. Therefore, after some time, the re-equilibrated system,
contains an unequal solution in terms o f ionic components A and B. However, the
equilibrium condition between the mineral content and dissolved chemicals always remainso
based on the defined equilibrium constant, i.e. 10’ .
As reported previously, the same simulation was repeated considering the mineral reaction
under kinetic condition according to the relationship defined in equation (5.12). Note that in
the simulation based on kinetically controlled condition, dispersion coefficient was set to
zero, providing a pure advective flow. The kinetic rate constant is assumed as 2x1 O'10 mol.s'
.m' and the specific surface area was considered equal to 1.0 m /l.
0.2
0.15 -EoECOtzo Simulation results
0.12cCDOcooco
A Analytical solution
0 0.2 0.4 0.6 0.8 1
D istance (m)
Figure 5.23 chemical concentration profiles at steady-state under kinetically controlled condition resulted from the numerical model (lines) and the analytical solution (symbols)
Figure 5.23 shows the concentration patterns o f dissolved chemicals A and B in the domain,
calculated by the numerical modelling and analytical solution under kinetically controlled
condition for mineral precipitation/dissolution. The results are presented at steady-state in
order to compare with the results o f the analytical solution. The numerical model and
analytical solution provide same results and agree well with each other. The results indicate
5-37

Chapter 5 Verification and Validation
that at steady-state, the concentrations of the dissolved chemicals at the boundary have
changed to the concentration of the flushing solution through precipitation of the AB mineral
in the domain.
A series of numerical simulations was also performed under different kinetic reaction rates.
Different values for the reaction rate constants were assumed including 2xl0"8, 2^1 O'9 and
2x 10¹⁰ mol s'1 m‘2, similar to the modelling examples reported by Xu and Pruess (1998). The
results are also compared with those under equilibrium condition. In this series of analysis
dispersion coefficient was assumed equal to 0.02, providing an advective-dispersive flow
regime in the domain. In these simulations the major aims have been to demonstrate the
difference in the reactive transport behaviour of the model under equilibrium and kinetic
mineral reaction.
0.2
k=2x10'
t r 0 . 1 5
k=2x10'
o R esults b a se d on equilibrium reactiono 0.05
0.60.4 0.8 10.20Distance (m)
Figure 5.24 chemical concentration profiles after five days of numerical analysis resulted different under kinetically controlled condition resulted (lines) and under equilibrium condition (symbols)
Figure 5.24 shows the results of simulations in terms of dissolved chemical concentrations
under kinetic with different rates and equilibrium after five days. As it is expected, with
increasing the reaction rate, the concentration profile tends to a similar profile resulted under
5-38

Chapter 5 Verification and Validation
equilibrium precipitation and dissolution reaction at same time (symbols). The results are in
agreement with the results of a similar simulation reported by Xu and Pruess (1998).
5.4.2 Chemical Transport with multiple Precipitation/Dissolution Front (Test VII)
5.4.2.1 Introduction
This simulation aims to verify the ability o f the developed model for simulation of the
reactive transport of multicomponent chemicals with precipitation and dissolution. The
verification test was first formulated by Engesgaard and Kipp (1992) and has been also used
by Prommer (2002) for verification of PHT3D code and Cleall et al. (2007) for verification of
the coupling between COMPASS and MINTEQA2. The verification considered is a
hypothetical example of a 2D domain in which an aqueous water composition, in equilibrium
with calcite, is flushed by a solution with a different chemical composition which leads to
multiple precipitation/dissolution fronts o f calcite and dolomite.
5.4.2.2 Numerical model conditions
A two dimensional 0.5 m long column was considered with a uniform mesh of 0.01 m long 4-
noded quadrilateral elements. A constant time-step of 200 seconds is used in the simulation
which provided a good convergence. The simulation was performed under isothermal
conditions and equilibrium controlled geochemical reaction. Four dissolved ionic components
were considered in the model, in equilibrium with two minerals including calcite and
dolomite.
B ou n dary con d ition :u ,= 1 7 3 .70 P a
T = 2 9 8 K
In itia l con dition: u i= 10 P a T - 2 9 8 K
Cd (M g2 ) = 1 .0 m o l/m 3Cd (M g2+) = 0 m ol/m 3
cd (C F )= 0B ou ndary condition:
U/-10 P a T = 2 9 8 K dcd/dx -0
cd ( C I ) = 2 .0 Cd (C a 2 ) = 0 c d ( C 0 32) = 0
p H = 7 .06
cd (C a 2+ ) = 1 .2 4 * 1 Of1cd ( C 0 2' ) - 1 .2 4 * 1 Or1
p H = 9 .91C a C 0 3 (s) = 2 .2 0 X1 O'5 m ol/kg d ry so il
C a M g (C O 2' ) 2(s )= 0
Figure 5.25 Schematic of the initial and boundary conditions (Test VII)
5-39

Chapter 5 Verification and Validation
At one boundary, fixed concentrations of dissolved ions are assumed while at the other end,
impermeable chemical boundary condition is assumed. A fixed pore water pressure at each
boundary is assumed, providing a constant pore water velocity. Figure 5.25 presents a
schematic of the initial and thermal, hydraulic and chemical conditions considered in this
simulation. The system considered is saturated and porosity was assumed as 0.32. The bulk
density is 1800 kg/m3. Pore velocity and dispersivity coefficient are 9.37* 10'6 m/s and 0.002
m, respectively. Table 1 presents the required physical and chemical properties.
Table 5.6 Material parameters (Test VII)
M aterial param eter Relationship/value
Porosity: n= 0.32
Pore water velocity: V,=v,/n= 9.37x10'6 m/s
Hydraulic conductivity: k,= 1.1 x i a 4 m/s
Diffusion coefficient o f chemicals: Di~ 0 m2/s
Dispersivity coefficient (Longitudinal) aL- 0.0067 m
Equilibrium constant o f reactions at 25 °C:
CaC03 (s)= Ca2+ + C 032'
CaMg(C032')2 (s)= Ca2+ + Mg2++ 2C 032‘
log Keq= -8.47
log Keq= -17. 7
5.4.2.3 Results and discussion
Figure 5.26 shows the dissolved chemical distribution in the domain after 21000 seconds of
simulation. The time was selected to compare the results with same simulation, reported by
Engesgaard and Kipp, 1992. The numerical model results for calcite and dolomite mineral
concentrations are also presented in figure 5.27. The results of the modelling reported by
Engesgaard and Kipp (1992) are also provided in each figure for comparison.
Higher concentration of Mg2+ ions and lower Ca2+ ions migrate from the boundary to the
domain. In order to maintain the equilibrium between dissolved chemicals and minerals,
calcite is dissolved into the pore fluid, providing more calcium ions whilst dolomite
5-40

Chapter 5 Verification and Validation
precipitated in the domain. As a result, the concentration of calcium ions varies in the region,
affected by dissolution of calcite and precipitation of dolomite.
2.5
cr
- - Engesgaard & Kipp (1992)5OEc/>CoCD
cscooco
Ca
0.1 0.4 0.50.2 0.30Distance (m)
Figure 5.26 Concentration profiles of dissolved chemical components after 21,000 seconds of analysis
2.5
Calcite ..........LOoX
1.5Dolomite
oEco52.cCDocoO
- - Engesgaard & Kipp (1992)
0.5
0.50.3 0.40.20.10Distance (m)
Figure 5.27 Calcite and Dolomite concentration profiles at 21,000 second
5-41
Chapter 5 Verification and Validation
In the area close to boundary, further flushing of the dissolved ions with water, has resulted in
dissolution of both minerals. Therefore, both minerals were dissolved completely in the
approximately 8 cm away from the boundary.
The results of the numerical simulation and those reported by Engesgaard and Kipp (1992)
agree very closely. The difference in the case of mineral precipitation/dissolution results near
the sharp front can be attributed to adopted algorithms used by Engesgaard and Kipp (1992),
to avoid numerical instabilities caused by mineral switching between precipitation and
dissolution as mentioned by Cleall et al. (2007).
5.4.3 Chemical Transport with Multiple Ion Exchange (Test VIII)
5.4.3.1 Introduction
This section provides a verification test on coupling ion exchange geochemical reaction under
equilibrium feature of PHREEQC with chemical transport model. This verification has been
used in PHREEQM (Nienhuis et al., 1991) and also in PHREEQC version 2 by Parkhurst and
Appelo (1999) as example simulations. This example has been also used by Prommer (2002)
for verification of PHT3D code.
The simulation consisted of a hypothetical flushing column in which the pore fluid initially
contained NaNC>3 and KNO3 solutions. The column was flushed at a constant discharge with a
CaCb solution from the boundary. The medium had a total cation exchange capacity of
l . lx l 0”3 mol/1 and initially consisted of Na- and K-exchanger. The concentration of the
chemicals and the composition of the exchanger varied with time when the solution was
brought to equilibrium with the flushed solution containing calcium ions. In this verification,
the results of the numerical model for the specified test are compared with the results of
simulation using PHREEQC version 2.15 for the same problem. It is noted that PHREEQC
has the capability of modelling one dimensional reactive transport under saturated condition
as stated in chapter 3.
5-42

Chapter 5 Verification and Validation
5.4.3.2 Numerical model conditions
The analysing domain length is 0.08 m with porosity of 1.0, discretised into 40 elements
consisting 4-noded quadrilateral elements. A constant time-step of 90 seconds was considered
for the simulation. The simulation was performed under isothermal condition. Five ionic
components were considered in the model including Ca2+, Cl', K+, Na+ and NO3'. The
exchanger components are considered as Na-, K- and Ca-X, where X is the exchanger body.
Boundary condition:
ui=884.56 Pa T=293K
cd (Ca2+)=0.6 mol/m3Cd(cr)=i .2
cd (K/)=0 cd (Na/)=0 cd (NO{)=0
pH =7.0
Figure 5.28 Schematic o f the initial and boundary conditions (Test VIII)
Table 5.7 Material parameters (Test VIII)
M aterial param eter Relationship/value
Porosity: n= 1.0
Pore water velocity: Vi=v/n= 1.0 m/day =1.157*I d 5 m/s
Hydraulic conductivity: m/s k,= 1.157*10'3
Diffusion coefficient o f chemicals: m2/s Dj= 0
Dispersivity coefficient (Longitudinal) m aL= 0.002
Equilibrium constant o f reactions at 25 °C
Na-X= Na' + X log Keq= 0.0
K-X= K + X log Keq= 0.7
Ca-X2=Ca2' +2X log Keq= 0.8
Initial condition: u\=100 Pa T=293K
cd (Ca2+)= 0 mol/m3 cd (C I)= 0 cd (K+)=0.2
cd (Na+)-1 .0 cd (NOi)=1.2
pH =7.0
Na-X=5.493 * 10'1 mol/m3 K-X=5.507*1 ff1
Ca-X2=0
Boundary condition:
ui=100 Pa T=293K dcd/dx =0
5-43
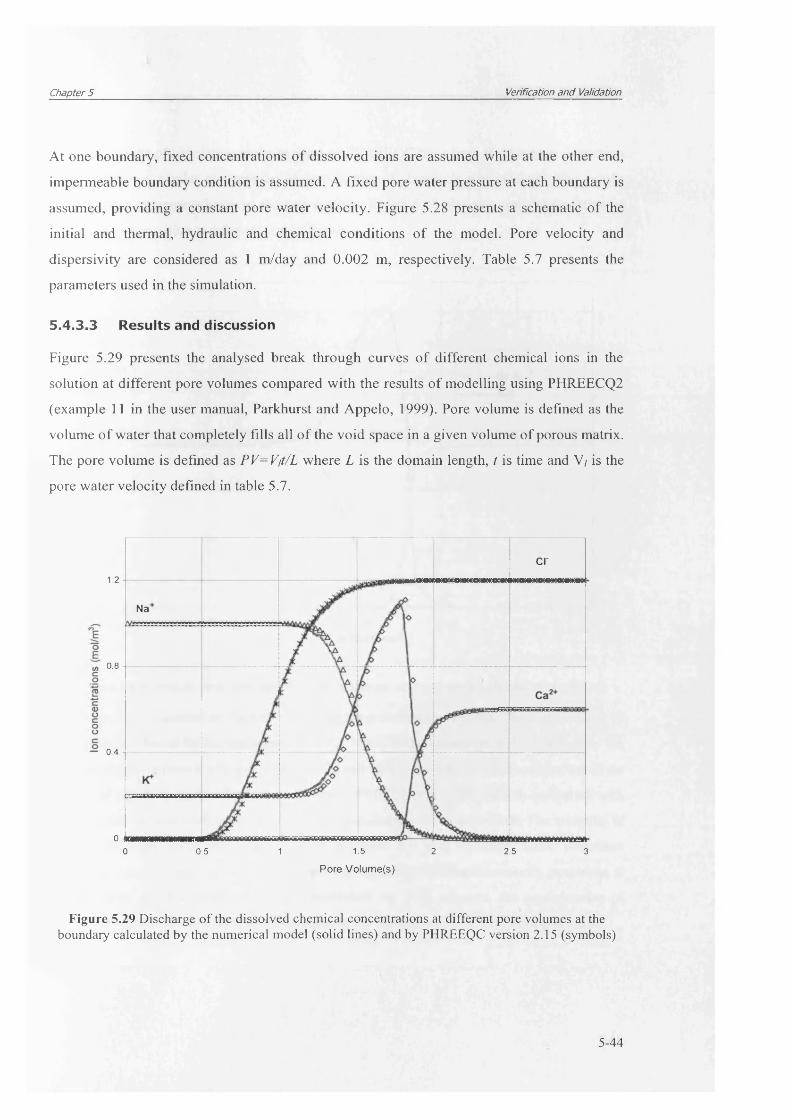
Chapter 5 Verification and Validation
At one boundary, fixed concentrations o f dissolved ions are assumed while at the other end,
impermeable boundary condition is assumed. A fixed pore water pressure at each boundary is
assumed, providing a constant pore water velocity. Figure 5.28 presents a schematic o f the
initial and thermal, hydraulic and chemical conditions o f the model. Pore velocity and
dispersivity are considered as 1 m/day and 0.002 m, respectively. Table 5.7 presents the
parameters used in the simulation.
5 .4 .3 .3 R e s u l ts a n d d is c u s s io n
Figure 5.29 presents the analysed break through curves o f different chemical ions in the
solution at different pore volumes compared with the results o f modelling using PHREECQ2
(example 11 in the user manual, Parkhurst and Appelo, 1999). Pore volume is defined as the
volume o f water that completely fills all o f the void space in a given volume o f porous matrix.
The pore volume is defined as PV=Vit/L where L is the domain length, t is time and V/ is the
pore water velocity defined in table 5.7.
cr1.2
Na
0.8
0.4
00 1 1.5 2 2.5 30.5
Pore Volume(s)
Figure 5.29 Discharge of the dissolved chemical concentrations at different pore volumes at the boundary calculated by the numerical model (solid lines) and by PHREEQC version 2.15 (symbols)
5-44

Chapter 5 Verification and Validation
Since the results o f simulation in the manual o f PHREEQC have been presented as a function
o f pore volume, similar presentation o f distribution o f chemicals was selected. The results
show a close agreement between the two models. Figure 5.30 also presents the variation of
exchanger composition at different pore volumes.
Ca-X2- -N a -X
K-X
~ 0.8
0.6
0.2
0 0.5 1.5 2 2.51 3
Pore Volume(s)
Figure 5.30 Numerical model prediction of the exchanger composition at different pore volumes
When the inlet solution is flushed to the aqueous-exchanger system, the composition o f
exchanger is affected by the replacement o f Ca2+ ions in the exchanger and consequently the
concentration o f aqueous solution changes. Chloride is a conservative solute and arrives in the
effluent at about 0.5 pore volume. The sodium initially present in the column exchanges with
the incoming calcium and is eluted as long as the exchanger contains sodium. The midpoint o f
the breakthrough curve for sodium occurs at about 1.5 pore volumes. Since potassium
exchanges more strongly than sodium (larger log Keq in the exchange reactions), potassium is
released after sodium. Finally, when all potassium has been released, the concentration of
calcium increases to a steady-state value equal to the concentration in the infilling solution.
5-45

Chapter 5 Verification and Validation
The simulation results are closely correlated with the results calculated by PHREEQC that has
been well verified for one dimensional reactive transport in saturated systems. This allows
demonstrating the correctness of the implementation of the approach adopted for reactive
transport under equilibrium ion exchange reaction over the particular bench-mark.
5.5 Modelling feed-back of mineral precipitation/dissolution reactions on flow process
This section provides a preliminary verification of the porosity modification feed-back from
geochemical reaction modelling. This example was designed to demonstrate the effects of
mineral precipitation on the transport process through porosity variation. It is noted that this
inclusion is tested in the early stages of developments in the model, acknowledging the fact
that more robust analytical or modelling comparison is required for further applications
5.5.1 Chemical diffusion with mineral precipitation/dissolution reaction with flow modification feed back (Test IX)
5.5.1.1 Introduction
This simulation was designed to demonstrate the effects of porosity modification due to
mineral precipitation on the diffusion of a binary solution. In the simulation, a saturated low
porosity porous medium was considered which initially contains no dissolved chemicals and
minerals. The domain was exposed to a super-saturated binary solution at one boundary. The
diffusion process is coupled with mineral precipitation. Diffusion of the binary solution
through the domain was investigated numerically under the porosity feed back implemented
algorithm and without this effect. The feed-back between mineral precipitation volume and
porosity affects the turtuosity of chemical diffusion which changes the diffusion pattern of
chemicals.
5.5.1.2 Numerical model conditions
The analysing domain length considered is 2D (0.1x0.1 m) with porosity of 0.05. The domain
was discretised into 100 equally sized elements consisting 4-nodded quadrilateral elements. A
5-46

Chapter 5 Verification and Validation
variable time-step was used, allowing the variation of time-step depending on convergence.
The simulation was performed under isothermal and saturated conditions. Therefore, water
pressure and temperature were fixed during the analysis. These assumptions lead to pure
isothermal diffusion flow in the domain.
Two ionic components were considered in the model including, hypothetically A+ and B~ in
equilibrium with AB mineral. At one boundary, fixed concentrations of dissolved ions are
assumed while at the other end, an impermeable boundary condition is assumed. The solution
at one boundary is considered as super-saturated solution. Figure 5.31 presents a schematic of
the initial and thermal, hydraulic and chemical conditions of the model.
B ou n dary condition:
u /= 100 Pa T = 2 9 8 K
Cd (A +) = 2 5 m ol/m 3 Cd (B>)= 25 m ol/m 3
Figure 5.31 Schematic of the initial and boundary conditions (Test IX)
Table 5.8 presents the physical and chemical parameters used for simulation.
Table 5.8 Material parameters (Test VIII)
M aterial param eter Relationship/value
Porosity: n = 0.05
Degree of saturation: S ,= 1.0
Hydraulic conductivity: m/s K sa,= l .O x l f f 13
Tracer diffusion coefficient of chemicals in water: m 2/s
D°(A )=■ D ° (B )= 1 0 x l( r '°
Equilibrium constant of reactions at 25 °C
A B (s) = A + + R lo g K eq= -4 .64
Molar volume of AB(s) m3/m ol Vm= 7 .5 x 10'13
The turtuosity factor for chemical diffusion is considered via a modified equation, proposed
by Millington and Quirk (1961). As a first approximation, the effect of mineral precipitate
volume on turtuosity is included as an additional term to the original turtuosity factor
proposed by Millington and Quirk (1961) as:
In itia l con dition: u /= 100 P a T = 2 9 8 K
Cd (A +) = 0 m ol/m 3 C d(B ')= 0 m ol/m 3
A B (s)z=0 m ol/m 3 so il
B oundary condition:
u i-1 0 0 P a T = 2 9 8 K d c /d x = 0
5-47
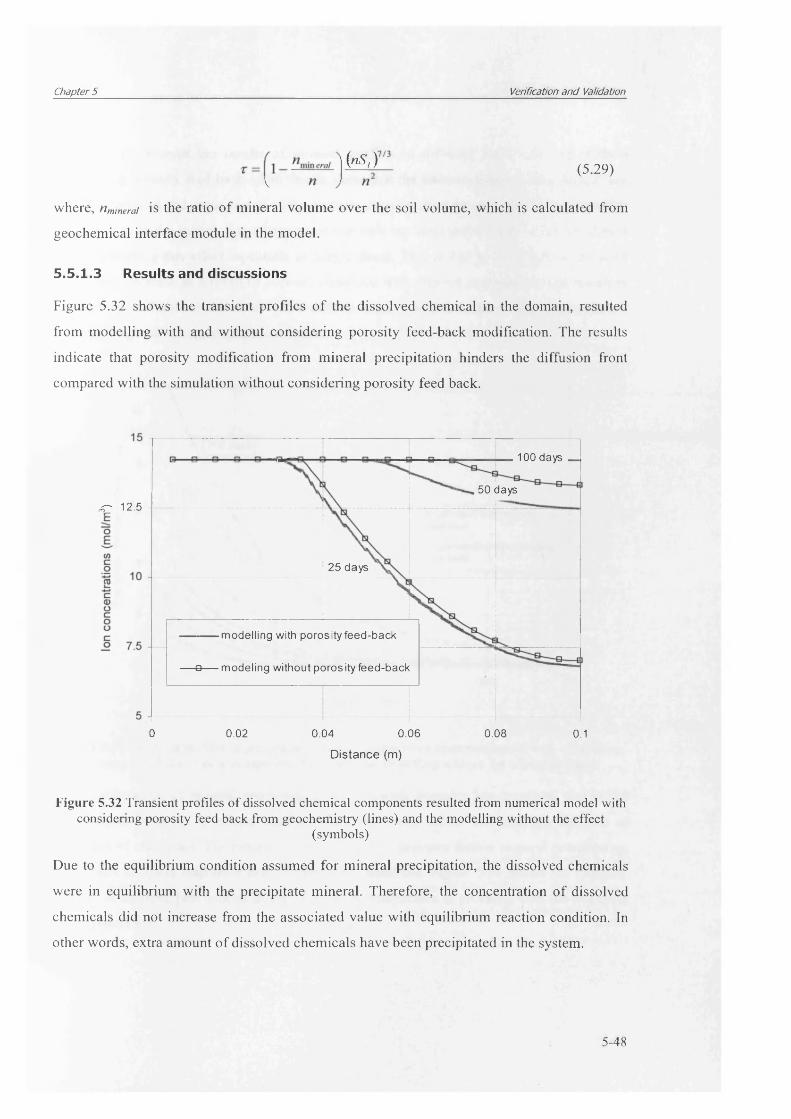
Chapter 5 Verification and Validation
T = { \ - \(nSi) (5 2 9 )V n ) n2
where, nminerai is the ratio o f mineral volume over the soil volume, which is calculated from
geochemical interface module in the model.
5 .5 .1 .3 R e s u l ts a n d d is c u s s io n s
Figure 5.32 shows the transient profiles o f the dissolved chemical in the domain, resulted
from modelling with and without considering porosity feed-back modification. The results
indicate that porosity modification from mineral precipitation hinders the diffusion front
compared with the simulation without considering porosity feed back.
100 days _
50 daysST 12.5 -
25 days
modelling with porosity feed-back
-a— modeling without porosity feed-back
0 0.02 0.06 0.080.04 0.1
Distance (m)
Figure 5.32 Transient profiles of dissolved chemical components resulted from numerical model with considering porosity feed back from geochemistry (lines) and the modelling without the effect
(symbols)
Due to the equilibrium condition assumed for mineral precipitation, the dissolved chemicals
were in equilibrium with the precipitate mineral. Therefore, the concentration o f dissolved
chemicals did not increase from the associated value with equilibrium reaction condition. In
other words, extra amount o f dissolved chemicals have been precipitated in the system.
5-48
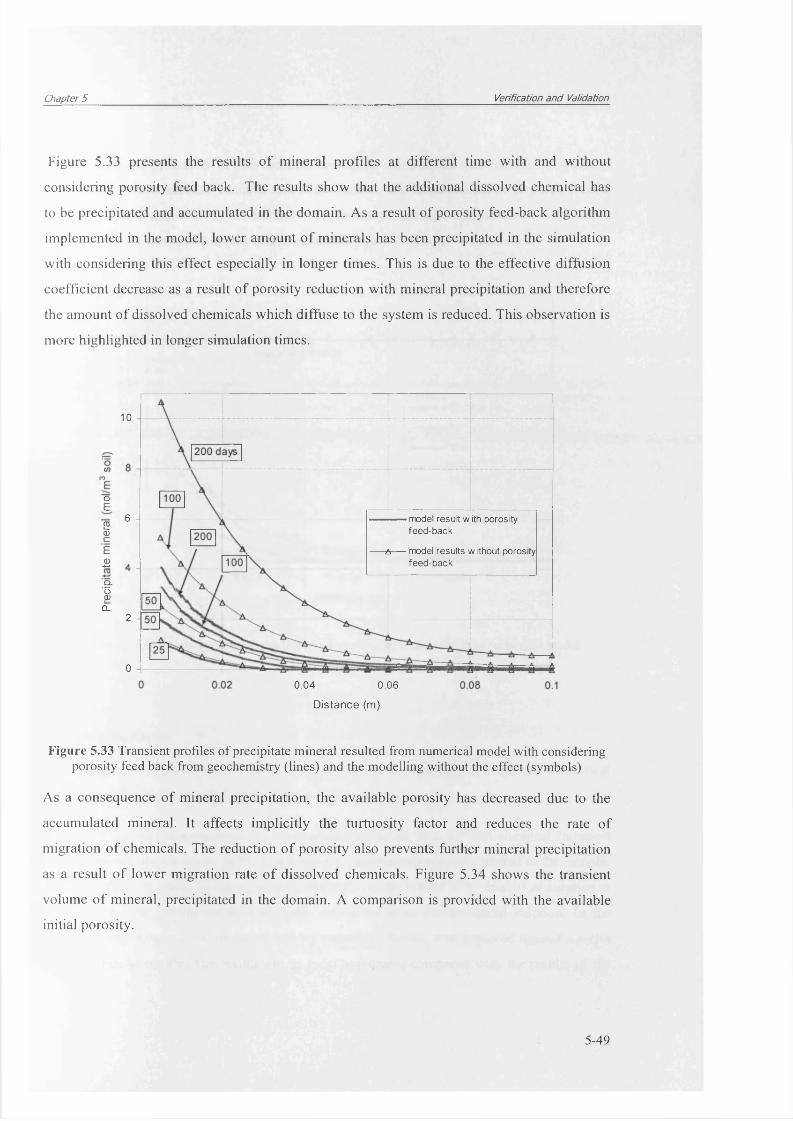
Chapter 5 Verification and Validation
Figure 5.33 presents the results o f mineral profiles at different time with and without
considering porosity feed back. The results show that the additional dissolved chemical has
to be precipitated and accumulated in the domain. As a result of porosity feed-back algorithm
implemented in the model, lower amount o f minerals has been precipitated in the simulation
with considering this effect especially in longer times. This is due to the effective diffusion
coefficient decrease as a result o f porosity reduction with mineral precipitation and therefore
the amount o f dissolved chemicals which diffuse to the system is reduced. This observation is
more highlighted in longer simulation times.
10
oE
2 6a>c
E£ A'q.oa)a
2
00.04 0.06
D istance (m)
model resu lt w ith porosity fe e d -b a ck
-A— model re su lts w ithout porosity fe e d -b a ck
Figure 5.33 Transient profiles of precipitate mineral resulted from numerical model with considering porosity feed back from geochemistry (lines) and the modelling without the effect (symbols)
As a consequence o f mineral precipitation, the available porosity has decreased due to the
accumulated mineral. It affects implicitly the turtuosity factor and reduces the rate of
migration o f chemicals. The reduction o f porosity also prevents further mineral precipitation
as a result o f lower migration rate o f dissolved chemicals. Figure 5.34 shows the transient
volume o f mineral, precipitated in the domain. A comparison is provided with the available
initial porosity.
5-49
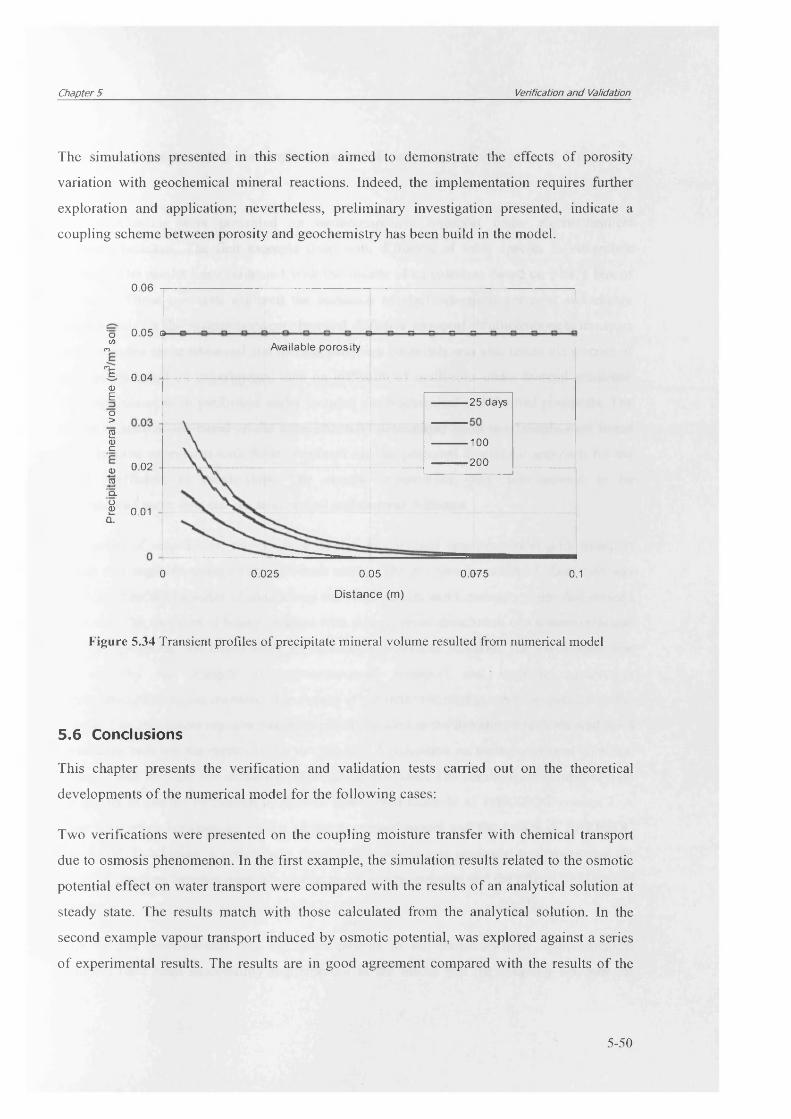
Chapter 5 Verification and Validation
The simulations presented in this section aimed to demonstrate the effects o f porosity
variation with geochemical mineral reactions. Indeed, the implementation requires further
exploration and application; nevertheless, preliminary investigation presented, indicate a
coupling scheme between porosity and geochemistry has been build in the model.
0.06
'o 0.05 {)■ v>rt
% 0.04<u EO >
2 CD CO 002 roQ.O2 0.01 CL
Available porosity
25 days
100
200
0 0.025 0.05 0.075 0.1
Distance (m)
Figure 5.34 Transient profiles of precipitate mineral volume resulted from numerical model
5.6 Conclusions
This chapter presents the verification and validation tests carried out on the theoretical
developments o f the numerical model for the following cases:
Two verifications were presented on the coupling moisture transfer with chemical transport
due to osmosis phenomenon. In the first example, the simulation results related to the osmotic
potential effect on water transport were compared with the results o f an analytical solution at
steady state. The results match with those calculated from the analytical solution. In the
second example vapour transport induced by osmotic potential, was explored against a series
of experimental results. The results are in good agreement compared with the results o f the
5-50

Chapter 5 Verification and Validation
experiments, demonstrating the implementation of osmotically driven vapour flux in the
model.
Two simulations were presented on multicomponent transport under electrochemical
diffusion potential. The first example dealt with diffusion of ionic species in electrolyte
solution. The results were compared with the results of calculations based on Fick’s law of
diffusion. These two tests explored the inclusion of electrochemical potential and charge
conservation for the multicomponent chemical diffusive transport. Multicomponent transport
under coupled electrochemical and thermal diffusion potentials was also tested via a series of
simulations based on experimental data on diffusion of multi-ions under thermal gradients.
The simulations were performed under coupled electrochemical and thermal potentials. The
results of simulations based on the experimentally determined Soret coefficients were found
to be in close agreement with those simulated via the proposed theoretical approach for the
Soret coefficient at steady-state. The charge conservation was demonstrated to be
implemented under coupled electrochemical and thermal diffusion.
In a series of simulations, the coupling of the geochemical reaction model with transport
model was explored against various bench marks. The reactive transport of chemicals was
examined first with a series o f simulations with equilibrium and kinetically controlled mineral
reactions. The transport of binary solution with precipitation/ dissolution of a mineral reaction
was first presented and tested using an alternative analytical solution. The verification was
followed by an example of multicomponent transport and multiple equilibrium
precipitation/dissolution reactions. The results of the latter simulation were compared with the
results of an alternative reactive transport model reported in the literature which showed good
correlation between the results of the two models. Verification on multicomponent chemical
transport and multiple ion exchange reaction was provided. The results were compared with
the results of similar simulation using well established example of PHREEQC version 2. A
close correlation between the results of the developed model and the results of PHREEQC
was found. In addition, a preliminary simulation example was presented to demonstrate the
effect of coupling between mineral reaction and porosity variation and the effects on chemical
transport.
This chapter demonstrated that the developments in the formulation of hydro-chemical
transport have been successfully implemented in the model and the coupling between the
5-51

Chapter 5 Verification and Validation
transport model, COMPASS and the reaction model PHREEQC has been achieved under the
conditions and scopes of the studied bench mark tests. Within this chapter the confidence was
built in the theoretical approach and numerical implementation, via as series of verification
exercise, for further applications and exploration the developments provided in the model.
5-52
Chapter 5 Verification and Validation
5.7 References
Agar, J.N., Mou, C.Y., and Lin, J. (1989). Single-ion heat of transport in electrolyte
solutions, A hydrodynamic theory. Journal o f Physical Chemistry, 93, 2079-2082.
Allison, J.D., Brown, D.S., and Novo-Gradac, K.J. (1991). MINTEQA2 user manual version
3.0. Environmental Research Laboratory, U.S. EPA.
Appelo, C.A.J. (2007). Multicomponent diffusion in clays. Water Pollution in Natural
Porous Media Proceeding, Instituto Geologico de Espana, Madrid, 3-13.
Cleall, P.J. (1998). An investigation o f the thermo/hydraulic/mechanical behaviour o f
unsaturated soils, including expansive clays. Ph.D. Thesis, Cardiff University, Wales, UK.
Cleall, P.J., Seetharam, S.C., and Thomas, H.R. (2007). On the inclusion of some aspects of
chemical behaviour of an unsaturated soil in thermo-hydro-chemical-mechanical models: I
Model development. Journal o f Engineering Mechanics, ASCE, 133, 338-347.
Cussler, E.L. (1997). Diffusion-Mass Transfer in Fluid Systems. University Press,
Cambridge.
Engesgaard, P., and Kipp, K.L. (1992). A geochemical transport model for redox-controlled
movement of mineral fronts in groundwater flow systems: A case of nitrate removal by
oxidation of pyrite. Water Resource Research, 28(10), 2829-2843.
Jungnickel, C., Smith, D. and Fityus, S. (2004). Coupled multi-ion electrodiffusion analysis
for clay soils. Canadian Geotechnical Journal, 41, 287-298.
King, S.D. (1994). A potential based model o f coupled heat and moisture transfer in
unsaturated soil. Ph.D. Thesis, University o f Wales, Cardiff, U.K.
Lasaga, A.C. (1998). Kinetic Theory in the Earth Science. Princeton Series in Geochemistry,
Princeton University Press.
Leaist, D.G., and Hui, L. (1990). Conductometric determination of the Soret coefficients of a
ternary mixed electrolyte-Reversed thermal diffusion of sodium chloride in aqueous sodium
hydroxide solutions. Journal o f Physical Chemistry, 94, 447-451.
Lichtner, P.C. (1995). Principles and practice of reactive transport modelling. Material
Research Society Symposium Proceeding, 353, 117-130.
5-53

Chapter 5 Verification and Validation
Millington, R.J., and Quirk, J.M. (1961). Permeability of porous solids. Transaction Faraday
Society, 57, 1200-1207.
Mitchell, H.P. (2002). An investigation into the thermo/hydro/mechanical interactions
involved in high level nuclear waste disposal. PhD Thesis, University of Wales, Cardiff.
Nienhuis, P., Appelo, C.A.T., and Willemsen, A. (1991). Program PHREEQM, Modified
from PHREEQE for use in mixing cell flow tube. The Netherlands, Amsterdam Free
University.
Parkhurst, D.L., and Appelo, C.A.J. (1999). U ser’s guide to PHREEQC (version 2), U.S.
Geological Survey, Water Resource Investigation Report, 99-4259.
Philip, J.R., and de Vries, D.A. (1957). Moisture movements in porous materials under
temperature gradients. Transactions American Geophysical Union, 38(2), 222-232.
Prommer, H. (2002). A reactive multicomponent transport model fo r saturated porous media.
PHT3D user’s manual, version 1.0. University o f Edinburgh, Edinburgh.
Sansom, M.R. (1995). A fully coupled numerical analysis o f mass, air and heat transfer in
unsaturated soil. PhD Thesis, University of Wales, Cardiff, UK.
Scotter, D.R., and Raats, P.A. (1970). Movement of salt and water near crystalline salt in
relatively dry soil. Soil Science, 100 (1), 170-178.
Seetharam, S.C. (2003). An investigation o f the thermo/hydro/chemical/mechanical
behaviour o f unsaturated soils. Ph.D. Thesis, Cardiff University, Wales, UK.
Thomas, H.R., and He, Y. (1995). Analysis of coupled heat, moisture and air transfer in a
deformable soil. Geotechnique, 45(4), 677-689.
Thomas, H.R., and He, Y. (1998). Modelling the behaviour of unsaturated soil using an
elasto-plastic constitutive relationship. Geotechnique, 48(5), 589-603.
Thomas, H.R., He, Y., and Onofrei, C. (1998). An examination of the validation of a model
of the hydro/thermo/mechanical behaviour of engineered clay barriers. International Journal
o f Numerical and Analytical Methods in Geomechanics, 22, 49-71.
Thomas, H.R., and Samson, M.R. (1995). A fully coupled analysis of heat, moisture and air
transfer in unsaturated soil, Journal o f Engineering Mechanics, ASCE, 12(3), 392-405.
5-54

Chapter 5 Verification and Validation
van Genuchten, M.Th. (1980). A closed-form equation for predicting the hydraulic
conductivity of unsaturated soils. Soil Science Society o f America Journal, 44, 892-898.
Vardon, P.J. (2009). A three-dimensional numerical investigation o f the therm-hydro-
mechanical behaviour o f a large-scale prototype repository. Ph.D. Thesis, Cardiff
University, Wales, UK.
Xu, T., and Pruess, K. (1998). Coupled modeling o f non-isothermal multiphase flow, solute
transport and reactive chemistry in porous and fractured media: 1. Model development and
validation. Lawrence Berkeley National Laboratory Report, LBNL-42050, Berkeley,
California.
5-55

Chapter 6 Simulation of the Reactive Transport of Chemicals under Coupled THC Conditions
Chapter 6
Simulation of the Reactive Transport of Chemicals under Coupled THC Conditions
6-1
Chapter 6 Simulation of the Reactive Transport of Chemicals under Coupled THC Conditions
6.1 Introduction
This chapter presents a series of numerical simulations of the reactive transport of chemicals
under coupled thermal, hydraulic, chemical framework. The numerical investigation has been
conducted on hydro-geochemical behaviour of compacted clay under simultaneous heating
and hydration. In particular, combined effects due to the electrochemical and thermal
diffusion potentials on transport of ionic species in compacted clays are investigated in the
simulation series presented in this chapter.
The simulations aimed to test the numerical model behaviour under coupled THC conditions
and more importantly to investigate the coupled electrochemical and thermal diffusion
potentials effects on the distribution of chemicals in a clay system. As reported in chapter 2, it
has been well established that under non-isothermal conditions, a temperature gradient can
induce mass flow due to thermal diffusion, i.e. Soret effect. Thermal diffusion behaviour
could be more complicated due to coupling with electrochemical diffusion potential in multi
ionic systems. Therefore, in the modelling of the transport of multicomponent ionic
chemicals, the electrochemical diffusion potential needs to be coupled with thermal diffusion
in order to obtain an overall understanding of the combined effects as described in the
theoretical formulation of multicomponent chemical transport presented in chapter 3.
Although the contribution of thermally induced diffusion in diffusive transport is reported to
be small in geological materials compared to diffusion due to chemical potential (Lasaga,
1998), consideration of the effect is required for the analysis of mass transport, especially in
cases where long term impacts are considered, e.g. compacted clays as the candidate buffer in
nuclear waste disposal concept. The effects o f thermal diffusion on the reactive transport were
studied in the simulations based on the theoretical approach adopted for calculating the Soret
coefficient.
The behaviour of the developed model for the reactive transport of a multicomponent
chemical model under THC conditions was investigated via a simulation of the phenomena in
unsaturated compacted clay. The simulation considers a 0.1 m long unsaturated compacted
clay, subjected to heating from one side and hydration with distilled water from the other side.
It is noted that this simulation was adopted from a similar modelling example given by Cleall
et al. (2007).
6-2

Chapter 6 Simulation of the Reactive Transport of Chemicals under Coupled THC Conditions
6.2 Model domain and conditions
The simulations considered, consist of a two dimensional clay domain (0.1 m long and 0.01 m
wide). The soil is initially unsaturated and deionised water at pressure of 1.5 MPa was
injected at one boundary side (hydration side). A temperature gradient was applied across the
length of the domain by fixing the temperature at 25 °C at the hydration end and at 40 °C at
the opposite end. The hot side is assumed to be impermeable to flow.
The clay initial moisture condition was considered similar to the initial condition of a swelling
clay, i.e. FEBEX bentonite, compacted at dry density of approximately 1700-1800 kg/m3,
(e.g. ENRESA, 2000). The initial porosity of the clay was considered as 0.35. The system was
initially unsaturated with a degree of saturation equal to 65%. Based on the water retention
relationship, given by ENRESA (2000), the initial pore water pressure of the 65 % degree of
saturation is obtained equal to approximately -100 MPa.
With regards to the chemical conditions, the pore water was hypothetically considered as
binary chemical system, containing two dissolved ionic species, i.e. Ca2+ and SO42', in
equilibrium with the anhydrite mineral. Anhydrite mineral reaction has been reported as one
of the precipitation/dissolution reactions in bentonite under HLW repository condition
(ENRESA, 2000). The reaction can be presented as:
C aS04 = Ca2+ + S O /'
Figure (6.1) provides a schematic diagram of the THC initial and boundary conditions of the
domain.
Boundary condition:
uj=1.5 MPa T = 298K
cd (C<f*)=cd (SO42-)=0
F ig u r e 6 .1 Schematic o f the initial and boundary conditions
The domain was discretised into 100 equally sized 4-noded quadrilateral elements. The
numerical simulation was performed under THC framework for a period of 200 days
considering a variable time-step. An initial time-step of 360 seconds was considered which
was allowed to vary depending on the convergence rate. The maximum time-step was allowed
Initial condition:
ui= -100 MPa T = 298K
Cd (Ca2+)=14.25 mol/m3 cd (SQ42') =14.25 mol/m3
Boundary condition'.
dui/dx =0 T =313K dcd/dx =0
6-3
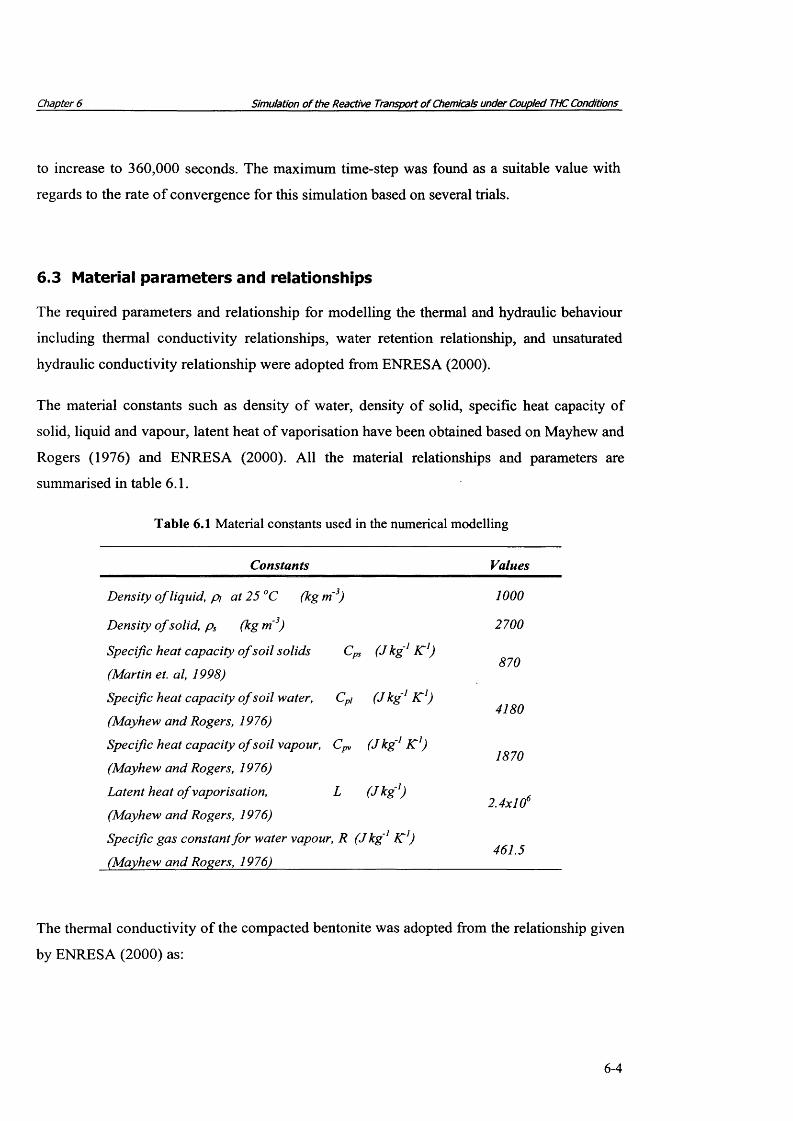
Chapter 6 Simulation of the Reactive Transport of Chemicals under Coupled THC Conditions
to increase to 360,000 seconds. The maximum time-step was found as a suitable value with
regards to the rate of convergence for this simulation based on several trials.
6.3 Material parameters and relationships
The required parameters and relationship for modelling the thermal and hydraulic behaviour
including thermal conductivity relationships, water retention relationship, and unsaturated
hydraulic conductivity relationship were adopted from ENRESA (2000).
The material constants such as density of water, density of solid, specific heat capacity of
solid, liquid and vapour, latent heat of vaporisation have been obtained based on Mayhew and
Rogers (1976) and ENRESA (2000). All the material relationships and parameters are
summarised in table 6.1.
Table 6.1 Material constants used in the numerical modelling
Constants Values
D en sity o f liqu id, p i a t 25 °C (kg m'3) 1000
D en sity o f so lid , p s ( k g n i3) 27 0 0
S pecific h ea t c a p a c ity o f s o il so lid s Cps ( J k g ' K ' )870
(M artin et. al, 1998 )
S pecific h ea t c a p a c ity o f so il w a ter, Cp\ (Jk g ' K<)4 180
(M ayh ew a n d R ogers, 1976)
S pecific h ea t ca p a c ity o f so il vapour, Cpy ( J k g ' K ' )1870
(M ayh ew a n d R ogers, 1976)
L a ten t h ea t o f vaporisa tion , L
(M ayh ew a n d R ogers, 1976)
( J k g ' )2 .4x106
S pecific g a s con stan t f o r w a te r vapour, R (J kg'1 K 1)
(M ayh ew a n d R ogers, 1976)461 .5
The thermal conductivity of the compacted bentonite was adopted from the relationship given
by ENRESA (2000) as:
6-4

Chapter 6 Simulation of the Reactive Transport of Chemicals under Coupled THC Conditions
1 + exp - ~ (6 .1)
\ X J
where X is the thermal conductivity in W/m.K, Si is the degree of saturation, Ai is the value of
X associated with Sr = 0, A2 is the value of X for Sr = 1, xo is the degree of saturation for
which the thermal conductivity is the average value between the extreme values, and dx is a
parameter. The values of these fitting parameters are as follows (ENRESA, 2000):
Ai=0.57 ± 0.02; A2=1.28 ± 0.03; x0 =0.65 ± 0.01; dx= 0.100 ± 0.016
The van Genuchten expression (van Genuchten, 1980) was used for describing suction-degree
of saturation relationship based on ENRESA (2000) for compacted bentonite, given as:
where, S/o and Sirmax are the residual and maximum degree of saturation and p o (MPa) and a
are material constants.
The parameters for van Genuchten’s moisture relationship have been given also in ENRESA
(2000), given as:
po = 14.5; X= 0.17; Sl0 = 0.0; Sirmax = 1.00
The unsaturated hydraulic conductivity o f compacted bentonite is often expressed by means
of a power law for the relative permeability (ENRESA, 2000) as:
Corresponding saturated hydraulic conductivity in this simulation study was considered as
The vapour flux was considered based on the Phillip and de Vries (1958) equation as
presented in equation (3.53) in the theoretical formulation.
- a
S l = S U + ( S , ^ - S h ) 1 +S 1 - a (6.2)
\ P 0 )
k l = k sat{S i)n (6.3)
1.0x10‘13 m/s and n equal to 3.
6-5

Chapter 6 Simulation of the Reactive Transport of Chemicals under Coupled THC Conditions
With regards to the chemical transport modelling, different tracer diffusion coefficients were
considered for the chemical components involved in the model. The tracer diffusion
m2/s, respectively (Lasaga, 1998).
At variable temperature but fixed composition and pressure, self or tracer diffusion coefficient
of ions in pure solution can be extrapolated from one to another temperature based on Stokes-
Einstein relationship (Cussler, 1997). Similar approach was used to calculate the variation of
tracer diffusion coefficients with temperature, given as:
where ij represents the viscosity of solvent, i.e. water in this case. To is the reference
temperature.
The tortuosity factor for chemical transport is calculated based on the relationship proposed
by Millington and Quirk (1961) for unsaturated porous medium defined as
where 6i represents the volumetric water content and n is porosity.
As mentioned in chapter 2, it is well known that in a highly compacted bentonite, the
accessible porosities for anions are generally not equal to the total porosity due to the anion
exclusion phenomenon, caused by negatively charged clay surfaces. As a result, only a small
fraction of the total pore volume is available for anionic transport. However, for cations and
neutral species it can be assumed that the entire pore volume is available for transport. As
formulated in chapter 3, i.e. equation (3.153), one way of incorporating variability in the
accessible porosity for different ions is proposed here by introducing an additional term, the
correction factor for accessibility k , which can be different for anionic and catonic species in
compacted bentonite. This modification can be represented as:
coefficients of Ca2+ and SO42" in water were considered equal to 7.9x1 O'10 and 10.6x1 O'10
(6.4)
(6.5)
(6 .6)
where the superscript i indicates the ith chemical component.
6-6

Chapter 6__________________________ Simulation of the Reactive Transport of Chemicals under Coupled THC Conditions
Based on the effective diffusion coefficient relationship, given in equation (6.6), the variation
in the magnitude of effective diffusion coefficients for different ionic species in multiple ionic
systems of the clay pore fluid, is related to i): the difference in the tracer diffusion coefficient
of different ionic species and ii): the difference in the turtuosity factor for anionic and cationic
species in compacted clays.
Accordingly, two series of simulation were performed where once k was assumed as 1.0 for
both anionic and cationic component. This simulation represents the condition where the
variations in the diffusion coefficients of anionic and cationic species originated from their
different tracer diffusion coefficient in water. In the second simulation k was assumed as 0.1
for anionic component and equal to 1.0 for cationic component. The difference in the
diffusion coefficient for ionic species is therefore derived from their different tracer diffusion
coefficients in water and different turtuosity factors. The latter assumption gives higher values
for the effective tracer diffusion of ions than that expected in compacted clays but it assists
with demonstrating the contribution of thermal diffusion in the formulation developed for
chemical transport under non-isothermal conditions.
The thermal diffusion coefficient, i.e. the Soret coefficient, was calculated using the
theoretical approach presented in chapter 3. The values of the Soret coefficients in dilute
electrolyte solution were calculated using the approach proposed by Agar et al. (1989) based
on equation (3.151). This equation is repeated here as:
SJ <6'7>* RT2
where A is a constant value depending on the hydrodynamic boundary condition (i.e.19 192.48x 10 and 2.20* 10 for two different hydrodynamic boundary conditions, based on Agar
et al., 1989). Here an average value of the two hydrodynamic boundary conditions was used
for parameter A due to the uncertainty in the condition in soils. However, the variations in A
are found to not be very influential on the overall magnitude of the Soret coefficient.
In order to investigate the effects related to the thermal diffusion contribution on the ion
migration, in each series of simulations, the analysis was performed once considering the
thermal diffusion effect applying the theoretical approximation for the Soret coefficient. The
6-7
Chapter 6 Simulation of the Reactive Transport of Chemicals under Coupled THC Conditions
same analysis was repeated without considering Soret effect in the diffusion fluxTassuming St = 0 .
With regards to the geochemical reaction parameters, the equilibrium constant of the
anhydrite mineral precipitation/dissolution reaction was adopted from the database of
PHREEQC version 2.15 (minteq.dat data base, Parkhurst and Appelo, 1999). Therefore, the
equilibrium constant o f the reaction (log Keq) and the enthalpy difference of the reaction (AH0)
(at reference temperature, 25 °C) were considered equal to -4.637 and -3.769 kcal,
respectively.
6-8

Chapter 6 Simulation of the Reactive Transport of Chemicals under Coupled THC Conditions
6.4 Numerical simulation results
The results o f the numerical simulation in terms o f the temperature, degree o f saturation,
dissolved chemicals and anhydrite mineral content are presented in this section.
6.4.1 Temperature and moisture distribution
Figure (6.2) shows transient profiles o f temperature in the domain. Steady-state temperature
profile is achieved across the domain within a few hours. Achieving the final steady state of
the temperature profile is coupled to the moisture fields, and it is affected, in particular, by the
dependence o f the thermal conductivity on the degree o f saturation.
316
initial — ♦— 1 Hour(s)— o — 2
312
* 308 --- steady state sr<Dro<uCLI 304l-
300 -
2962 4 6 80 10
Distance from hydration end (cm)
Figure 6.2 Transient profile of temperature in the domain
Figure (6.3) provides the results o f moisture profiles at different times o f analysis. During the
initial stages, up to approximately 2 days, the moisture content o f the soil is reduced at the hot
end due to vapour flow away from the heater. After 2 days, the model predicts that the
resaturation front has reached the hot end and the moisture content gradually increases in the
whole domain. The resaturation o f the whole domain is completed after 50 days.
6-9

Chapter 6 Simulation of the Reactive Transport of Chemicals under Coupled THC Conditions
50 days
30 days
0.9 \co 15 days
c/) 10 days.o 0.8<Da> " * 5 daysx»05©Q
2 days1 day,0.25 day
0.7
- r .Initial
0.60 2 4 6 8 10
Distance from hydration end (cm)
Figure 6.3 Transient profile of degree of saturation in the domain
6.4.2 Dissolved chemicals and mineral distribution
As reported in section 6.3, two series o f simulation were performed using different values for
k in the turtuosity factor relationship. These two simulations represent the condition where the
variations in the diffusion coefficients o f anionic and cationic species originated only from
their different tracer diffusion coefficients in water or a combination o f the latter effect and
the difference in the turtuosity factor o f anions and cations. In each series once the simulation
was performed with the thermal diffusion effects and once without it. This assists with
understanding the magnitude o f the contribution o f the thermal diffusion on the overall
distribution o f dissolved ions and mineral.
6 .4 .2 .1 A n a ly s is r e s u l t s w i t h k = 1 f o r b o th a n io n ic a n d c a t io n ic c o m p o n e n t s
Figure (6.4) shows the results o f transient profile o f the dissolved ion concentrations for the
first series o f analysis in which k is assumed as 1.0 in the effective diffusion coefficients o f
6-10

Chapter 6 Simulation of the Reactive Transport of Chemicals under Coupled THC Conditions
both calcium and sulphate ions. Figure (6.5) also presents the pattern of dissolution-
precipitation behaviour of anhydrite mineral for the same series of analysis. The Soret
coefficient was considered in this simulation.
The model predicted identical results for the concentration of the calcium and sulphate
although different diffusion coefficients have been used in the simulation. This is attributed to
the overall charge neutrality condition which was adopted in the formulation of the
multicomponent reactive transport, presented in chapter 3.
c?O* 13 -~oE
u...
CMVOC/5
o+CJroO
— ——Initial- -o- - - 0.25 day(s)
u—O - -x- -(/)co-•■ --15-H 30- ♦ - - 5 0 100- 9 200
Ec<DOCoO
6 80 2 4 10
Distance from hydration end (cm)
Figure 6.4 Transient profiles of the dissolved ion concentrations (k =1.0 and with considering theSoret effect)
During the initial stages, the model predicts reduction in the dissolved ion concentrations and
anhydrite mineral concentration near the hydration end. The decrease in the dissolved ion
concentrations is due to the advective flow toward the hot end which leads to the dissolution
of the anhydrite mineral, to maintain the equilibrium condition between solid and aqueous
phases. Temperature variation in the domain affects the equilibrium condition between
anhydrite mineral phase and dissolved ions which is controlled mathematically by the
equilibrium constant in the mass action law of the reaction.
6-11

Chapter 6 Simulation of the Reactive Transport of Chemicals under Coupled THC Conditions
The drop in the dissolved calcium concentration at hot end can be attributed to the
precipitation o f mineral caused mainly by the temperature. Due to the migration o f dissolved
ions to the hot end, the amount o f precipitate anhydrite increases towards the hot end in the
regions beyond the dissolution front up to about 30 days.
5
oCOS'T>CD^ 3 OE ---------- Initial
- • - o- -- 0.25 day(s)co2C 2 Q)OcoO • - - -1 5
H 3050
100-©— 200
1c<
00 2 4 6 8 10
Distance from hydration end (cm)
Figure 6.5 Transient profiles of the anhydrite concentration ( k =1.0 and with considering the Soreteffect)
After 30 days, the system is almost saturated and the dissolved ions tend to move towards
lower concentrations in the hot end. Thermal diffusion effect push the ions from hot end to
the cold side which consequences in reduction in the rate o f mineral precipitation at the hot
region. The ion migration induced by temperature can further enhance dissolution of
anhydrite in the hot region and toward the cold end to maintain the equilibrium between
dissolved ion concentration and mineral content. After 50 days, the system is saturated and
the concentration o f anhydrite reduces near the hot end and is dissolved after 200 days which
results in the release o f higher amount o f dissolved ions to the pore.
6-12

Chapter 6 Simulation of the Reactive Transport of Chemicals under Coupled THC Conditions
As mentioned earlier, a similar simulation was repeated without considering the effects o f the
thermal diffusion in the simulation, i.e. ST=0, to investigate the importance and the magnitude
o f the effect on the transient distribution o f dissolved ions and mineral phase, Figure (6.6)
demonstrates the results o f the transient profile o f the dissolved ion concentrations neglecting
the effects related to the thermal diffusion. The profiles o f the anhydrite mineral distribution
are shown in figure (6.7).
15
13
Initial- - - o- - - 0.25 day(s)11
- - • ■ - - 1 5 1----- 30
50 100— e— 200
9
70 2 4 6 8 10
oXOE
OCO
o>♦—oco
c<L>ocoO
Distance from hydration end (cm)
Figure 6.6 Transient profiles of the dissolved ion concentrations (re =1.0 and without considering theSoret effect)
In the early stages o f resaturation, the results demonstrate a similar distribution pattern for
dissolved chemicals and anhydrite precipitated compared with the previous results. The
similar trends for the dissolved chemicals and the dissolution front at the hydration end are
attributed to the advective nature o f the transport o f ions for up to 15 days o f analysis.
After about 50 days the entire amount o f available anhydrite mineral is dissolved in the
aqueous phase in the region close to the hydration side and the dissolved ions start to diffuse
due to the concentration gradient towards the hot end with a lower dissolved concentration.
6-13

Chapter 6 Simulation of the Reactive Transport of Chemicals under Coupled THC Conditions
Initial---o --- 0.25 day(s)
bxo</)^ 12- T3 CD
"oE
• - - -1 5
100200co
CD
cCDUCoOOJTITD£=<
2 4 6 8 10
Distance from hydration end (cm)
Figure 6.7 Transient profiles of the anhydrite concentration (k =1.0 and without considering the Soreteffect)
Comparison o f results with and without thermal diffusion potential indicates that thermal
diffusion affects the migration o f ions and mineral deposition not only at the hot side but also
in the hydration end. The thermal diffusion effect reduces the rate o f precipitation o f migrated
dissolved ions to the hot region and enhances the migration o f dissolved ions towards the
hydration end. The ion migration induced by temperature can further enhance dissolution of
anhydrite in the hot region and ion migration towards the cold end to maintain the equilibrium
between dissolved ion concentration and mineral content.
6 .4 .2 .2 A n a ly s is r e s u l t s w i t h k e q u a l t o 0 .1 fo r a n io n ic a n d e q u a l t o 1 .0 fo r
c a t io n ic c o m p o n e n t
Figure (6.8) shows the results o f transient profile o f the dissolved ion concentrations for the
second series o f analysis which different k values were used in the turtuosity coefficient
6-14

Chapter 6 Simulation of the Reactive Transport of Chemicals under Coupled THC Conditions
relationship, equal to 0.1 and 1.0 for sulphate and calcium ions, respectively. Figure (6.9) also
presents the pattern o f dissolution-precipitation behaviour o f anhydrite mineral for the same
series o f analysis. The Soret coefficient was also considered in this simulation based on the
theoretical approach adopted in the governing formulation.
oX
oE
Oco
Too
cCDOcoO
16
12
Initial...fy... o.25day(s)
8
- -x- -
•-- — 154
50 100 0 200
00 2 4 6 8 10
Distance from hydration end (cm)
Figure 6.8 Transient profiles of the dissolved ion concentrations (k =0.1 and with considering theSoret effect)
The model predicted identical results for the concentrations o f the calcium and sulphate
although the effective diffusion coefficient o f calcium used in the simulation is about 10 time
greater that that for sulphate ions. This is attributed to the overall charge neutrality condition
under coupled electrochemical and thermal diffusion potentials, adopted in the formulation of
the multicomponent reactive transport.
Similar to the previous simulation series, during the initial stages, the model predicted a
reduction in the dissolved ion concentrations and anhydrite mineral concentration near the
hydration end. This is due to the advective flow toward the hot end. Similarly, the drop in the
dissolved chemical concentrations at the hot end can be attributed to the precipitation of the
6-15

Chapter 6 Simulation of the Reactive Transport of Chemicals under Coupled THC Conditions
mineral caused by the higher temperature and decreasing moisture content due to vapour
flow.
Initial---o- - 0.25 day(s)
oX
oto
■OCD
■X
~oE
• - - -1 5
100200
co
cCDOcoOa?tz■o
JZ<
0 jjfer0 2 4 6 8 10
Distance from hydration end (cm)
Figure 6.9 Transient profiles of the anhydrite concentration k =0.1 and with considering the Soreteffect)
In order to demonstrate the magnitude o f the thermal diffusion effects, the simulation is
repeated but without considering thermal diffusion effects, i.e. Sf=0. Figure 6.10 presents the
profile o f dissolved ions distribution in the domain resulted from the modelling without
considering the Soret effects. Figure 6.11 also shows the transient profile o f the distribution of
precipitate anhydrite mineral for the analysis.
The results o f the distribution o f the dissolved chemicals with and without the Soret effects
are almost identical for the second series o f analysis. However, the distribution o f the
anhydrite mineral in the domain has been affected by the thermal diffusion. In the early stages
o f resaturation, up to about 15 days, the distribution pattern is similar to that presented in
figure 6.9.
6-16

Chapter 6 Simulation of the Reactive Transport of Chemicals under Coupled THC Conditions
16
12
8
- -x- -
• - - -1 5
4100200
00 2 4 6 8 10
Distance from hydration end (cm)
Figure 6.10 Transient profiles of the dissolved ion concentrations (k =0.1 and without considering theSoret effect)
After 30 days, when the system became almost saturated and the dissolved ions tended to
move towards lower concentrations. Thermal diffusion effects decrease the rate of
precipitation o f migrated dissolved ions at vicinity o f the hot region and the subsequent
increase in the precipitate amount o f mineral near the heater.
Comparison o f results with and without Soret effects shows that the effects o f thermal
diffusion are highlighted at the hot end where the amount o f precipitate is less that the amount
obtained from the analysis without considering thermal diffusion effects after 200 days o f
analysis.
The results o f the modelling with and without thermal diffusion effects indicate that the
effects of thermal diffusion are highlighted at the hot end where thermal diffusion decreases
the amount o f precipitate minerals in this region. Indeed, the overall impact o f thermal
diffusion depends on the effective diffusion coefficient in the system.
6-17

Chapter 6 Simulation of the Reactive Transport of Chemicals under Coupled THC Conditions
— — Initial- - -o- - - 0.25 day(s)
oX
oV)
"OCD
OE
• - - -1 5H 30
50 100
— 200
coTOc<DocoO0iZ“O>>
-C<
0 Ifcr0 2 4 6 8 10
Distance from hydration end (cm)
Figure 6.9 Transient profiles of the anhydrite concentration (k =0.1 and without considering the Soreteffect)
In comparison between the results o f the first and second simulations, where the average
effective diffusion coefficients o f the ions are greater in the first series, it is observed that
thermal diffusion effect has considerable impacts in the dissolved chemicals and mineral
distribution in the system. In the case o f highly compacted bentonite, the second analysis
condition would be more towards the realistic condition in terms o f the effective rate o f
diffusion. In clay deposits, such as Boom clay where the diffusion coefficients for HTO has
been reported in the range o f 10‘10 m2/s (Aertsens et al. 2004), the first simulation
assumptions from the effective diffusion coefficients are close to the reported values.
Therefore, the contribution o f the thermal diffusion might be an important aspect in this type
o f clays as the host formation o f the HLW disposal system.
6-18
Chapter 6 Simulation of the Reactive Transport of Chemicals under Coupled THC Conditions
6.5 Conclusions
This chapter presents the modelling results of the reactive transport of chemicals in a
compacted clay system using the model (COMPASS-PHREEQC). The results of the
simulation of an unsaturated clay domain with a binary ionic pore fluid system were
presented. The behaviour of the system in terms of heat, moisture transfer, dissolved
chemicals and mineral content was investigated under a coupled thermal, hydraulic and
chemical framework.
The results demonstrated the effects of the coupled electrochemical and thermal diffusion
potentials on the behaviour of a binary ionic system in equilibrium with a mineral under THC
conditions. Modelling results showed that the distribution of dissolved chemicals and
precipitated minerals can be affected by thermal diffusion impacts, particularly, after
completing the re-saturation of the clay system. Diffusion is the dominant transport
mechanism after saturation when no advection occurs. At this stage a combination of
diffusion due to the concentration gradient and due to the thermal diffusion potential controls
the transport of chemicals. The simulations results demonstrate the charge conservation
condition implemented in the theoretical formulation under advective-diffusive flow regime.
The simulation examples showed that the contribution of the Soret effect in the overall
process of reactive diffusion could change the distribution of minerals in the boundary
regions, especially close to the heat source where a high degree of precipitation of minerals is
expected. Variation in the amount of precipitate mineral induces changes to the available
porosity for hydraulic processes and aqueous chemical reaction which could be an important
issue for example in the case o f compacted clay buffer in nuclear waste disposal repositories
where minerals would be likely precipitated in the vicinity of heater.
As mentioned in chapter 2, there is limited information available on the effects of the thermal
diffusion, especially in multiple ionic systems and in clays. The theoretical approach adopted
for this effect in the formulation of the model and an example simulation presented, can
potentially be utilised for the assessment of the effect. It is acknowledged that some
simplifications have been made in the simulation work, and hence it is anticipated that
improved solutions can be achieved by including more complexities into the model.
6-19

Chapter 6 Simulation of the Reactive Transport of Chemicals under Coupled THC Conditions
6.6 References
Aertsens, M., Wemaere, I., and Wouters, L. (2004). Spatial variability of transport
parameters in the Boom Clay. Applied Clay Science, 26, 37-45.
Agar, J.N., Mou, C.Y., and Lin, J. (1989). Single-ion heat of transport in electrolyte
solutions. A hydrodynamic theory. Journal o f Physical Chemistry, 93, 2079-2082.
Cleall, P.J., Seetharam, S.C., and Thomas, H.R. (2007). On the inclusion of some aspects of
chemical behaviour of an unsaturated soil in thermo-hydro-chemical-mechanical models: II
Application and transport o f soluble salts in compacted bentonite. Journal o f Engineering
Mechanics, ASCE, 133, 348-356.
Cussler, E.L. (1997). Diffusion-Mass Transfer in Fluid Systems. University Press,
Cambridge.
ENRESA, (2000). Full-scale engineered barriers experiment for a deep geological
repository fo r high-level radioactive waste in crystalline host rock, FEBEX project. EUR
19147, Nuclear Science and Technology Series, European Communities, Luxembourg.
Lasaga, A.C. (1998). Kinetic Theory in the Earth Science. Princeton Series in Geochemistry,
Princeton University Press.
Mayhew, Y.R., and Rogers, G.F.C. (1976). Thermodynamic and Transport Properties o f
Fluids. 2nd edition, Oxford: Blackwell.
Millington, R.J., and Quirk, J.M. (1961). Permeability of porous solids. Transaction
Faraday Society, 57, 1200—1207.
Parkhurst, D.L., and Appelo, C.A.J. (1999). U ser’s guide to PHREEQC (version 2), U.S.
Geological Survey, Water Resource Investigation Report, 99-4259.
Philip, J.R., and de Vries, D.A. (1957). Moisture movements in porous materials under
temperature gradients. Transactions American Geophysical Union, 38(2), 222-232.
van Genuchten, M.Th. (1980). A closed-form equation for predicting the hydraulic
conductivity o f unsaturated soils. Soil Science Society o f America Journal, 44, 892-898.
6-20

Chapter 7 ________________________________ Transport Processes in Compacted Swelling Clays-Microstructural Effects
Chapter 7
Transport Processes in Compacted Swelling Clays-Microstructural Effects
7-1

Chapter 7 Transport Processes in Compacted Swelling Clays-Microstructural Effects
7.1 Introduction
As reported in chapter 2, it has been found that water molecules in the interlayer pore space of
swelling clays (between individual layers or lamellas of mineral units) have different physical
properties, e.g. density and viscosity, from those in free water. This fraction of the pore water
is widely regarded as immobile water or adsorbed component in solid phase. The fraction the
interlayer water to the intralayer/interparticle water is significantly greater in compacted
smectite clays compared with that in non-swelling or low-swelling clays, as discussed in
chapter 2.
The microstructural evolution o f the clay and the physical state of pore water can effectively
control the hydraulic, chemical and mechanical behaviour of compacted smectite (Pusch and
Yong, 2006). Since the major fraction of the pore water in compacted bentonite is located in
the interlayer or micropores, an accurate estimation of the amount of this water fraction is an
important issue for modelling the hydro-geochemical behaviour of compacted swelling clays.
An evaluation of the quantity of the interlayer water is therefore required first. Secondly, the
physical contribution o f the interlayer water hydration or dehydration in the formulation of
the water and chemical transport model, is required to incorporate an important aspect of the
physical behaviour o f compacted swelling clays.
In this chapter, a model for calculating the interlayer (and intralayer/interparticle) water
fraction in compacted smectite clays, e.g. bentonite is presented. The model is theoretically
based on a thermodynamic modelling framework. In this approach, the interlayer hydration
and dehydration is treated as a geochemical reaction and aimed to provide a link between the
geochemical microstructural features o f the smectite minerals, and the macroscopic properties
and behaviour.
Section 7.2 presents the theoretical background and formulation of the geochemical solid
solution model o f smectite hydration/dehydration. The model is based on the thermodynamic
approach proposed by Ransom and Helgeson, (1994) in which the problem of hydration-
dehydration of smectite is addressed as a solid solution reaction with water molecules. The
solid solution model o f hydration/dehydration can be applied in variable temperature and
relative humidity conditions. The temperature and suction dependency of the model proposed
for hydration/dehydration o f smectite is discussed in section 7.3. In section 7.4, the
7-2

Chapter 7 Transport Processes in Compacted Swelling Clays-Microstructural Effects
hydration/dehydration model is extended to calculate the interlayer water content of
compacted smectite clays. The theoretical model of hydration/dehydration is applied to derive
an approach in order to evaluate the amount of interlayer water in smectite clay as a variable
function of suction, temperature and the interlayer cation.
Section 7.5 presents the results o f model application in the case of compacted and saturated
Na-smectite clay (MX-80 bentonite). The parameters required for the solid solution model of
hydration/dehydration proposed by Ransom and Helgeson (1994) is investigated and modified
in the case of the mentioned smectite. This required re-visiting the derivation of the model
parameters, discussed in detail in this section. The variation of the interlayer water content
with temperature and suction, based on the model is also presented and discussed. Since there
is no alternative model or exact experimental data on the variation of interlayer water content
with temperature or suction, the results are qualitatively compared.
Section 7.6 deals with the inclusion o f the interlayer hydrate water effects on the hydraulic
behaviour of confined compacted smectite clays, using the solid solution model of
hydration/dehydration. The interlayer water adsorption effect on water transport is implicitly
included via modification of the hydraulic conductivity. The background of the hypothesis is
explained in this section followed by a modified equation for unsaturated hydraulic
conductivity as an initial approximation of the interlayer water variation impact.
In section 7.7, the proposed hydraulic conductivity equation, modified by the interlayer
hydration/dehydration impacts is investigated against experimental studies of moisture
transport in compacted bentonite (FEBEX bentonite) under isothermal and non-isothermal
conditions. The simulations of moisture transfer are based on a series of experimental
investigations on the compacted FEBEX bentonite reported by Villar et al. (2005). Two series
of simulations are reported under isothermal condition and under thermal gradients and using
the modified hydraulic conductivity with interlayer water effect and without this effect. The
results are compared with the experimental results in terms of relative humidity variations in
the system.
A conclusion of the chapter is presented in section 7.8.
7-3

Chapter 7 Transport Processes in Compacted Swelling Clays-Microstructural Effects
7.2 A geochemical solid-solution model for the hydration/dehydration of smectite
The hydration and dehydration process consists of sequential adsorption/desorption of one,
two and three layers of water molecules to and from the interlayer pore space between the
mineral lamellas in smectite rich clay. The process is driven primarily by the energy
associated with, initially the hydration of mineral surfaces and consequently with hydration of
exchangeable interlayer (e.g., Iwata et al., 1995; Likos, 2004).
The process of hydration and dehydration of smectite consists of addition or loss of interlayer
water in 2:1 silicate sheet of the mineral. During the hydration/dehydration process, the
composition and crystalline structure of the mineral layers remains unchanged. As a result,
the process of hydration/dehydration can be regarded as a reversible heterogeneous
geochemical reaction between a symbolic hydrous and its homologous anhydrous
counterparts similar to the hydration/dehydration of a solid solution (e.g. Tardy, 1990;
Ransom and Helgeson, 1994; Vidal and Dubacq, 2009). In other words, smectite solid phase
can be considered as a regular solid solution of hydrous and anhydrous components that differ
only by some moles of water molecules presented in the interlayer pores. This case is similar
to the hydration/dehydration of gypsum where two molecules of hydrated water remain
attached to the structural formula (Tardy, 1990):
CaS04 .2H20 CaS04 + 2H20
Following a similar hypothesis, Ransom and Helgeson (1994) addressed the problem of the
hydration/dehydration of smectite as a geochemical process of solid solution reaction with
water molecules. In terms of hydrous and anhydrous smectite components, this can be
represented as:
H ydrous sm ectite (hs) <-» A nhydrous sm ectite (as)+ n cH 20
where nc represents the number of moles of H2O involved in the reaction.
The structural formula for one mole of a hydrous smectite solid solution can be expressed as
(Ransom and Helgeson, 1994):
Ai(B?x+ R 2y +)q(Alz Si^_z )O w (OH)2 • nc H 2Q
7-4

Chapter 7 Transport Processes in Compacted Swelling Clays-Micmstructural Effects
where A is a proxy for the interlayer cation, R represents the interlayer cations and the
subscripts i, x, y, and z designate the number of moles of the respective cations per Oio(OH) 2 ,
which is the half unit cell o f structural formula, q is the number of occupied octahedral sites
per mole of the mineral.
In the hydration/dehydration model proposed by Ransom and Helgeson (1994), the number of
water moles per smectite half formula unit, i.e. Oio(OH)2 , is assumed to be independent of the
interlayer cations. In addition, the surface area of same smectite remains constant when the
interlayer cation is exchanged with different cations.
The law of mass action for the hydration/dehydration reaction of smectite according to the
solid solution model ( hs <-» as + ncH 20 ) can be written as:
K = (7.1)
Where Keq represents the equilibrium constant of the reaction and ®h2o refers to the activity
of adsorbed water. aas and ahs denotes the activity of the anhydrous and hydrous components
of the smectite solid solution, respectively.
Expressing the activities in terms of product of molar fraction and the activity coefficients
gives:
a as ~ as (7*2)
®hs ~ ^hs^hs (2-3)
where Xas and XhS represents the mole fractions of anhydrous and hydrous smectite,
respectively. Xas and Xhs is the activity coefficient of anhydrous and hydrous smectite.
For a binary solid solution, the mole fraction of anhydrous and hydrous phase is defined as
(Ransom and Helgeson, 1994):
m,X h s = ' - X as = m (7.4)
as hs
where mas and rtihs stand for the number of moles of anhydrous and hydrous smectite.
7-5
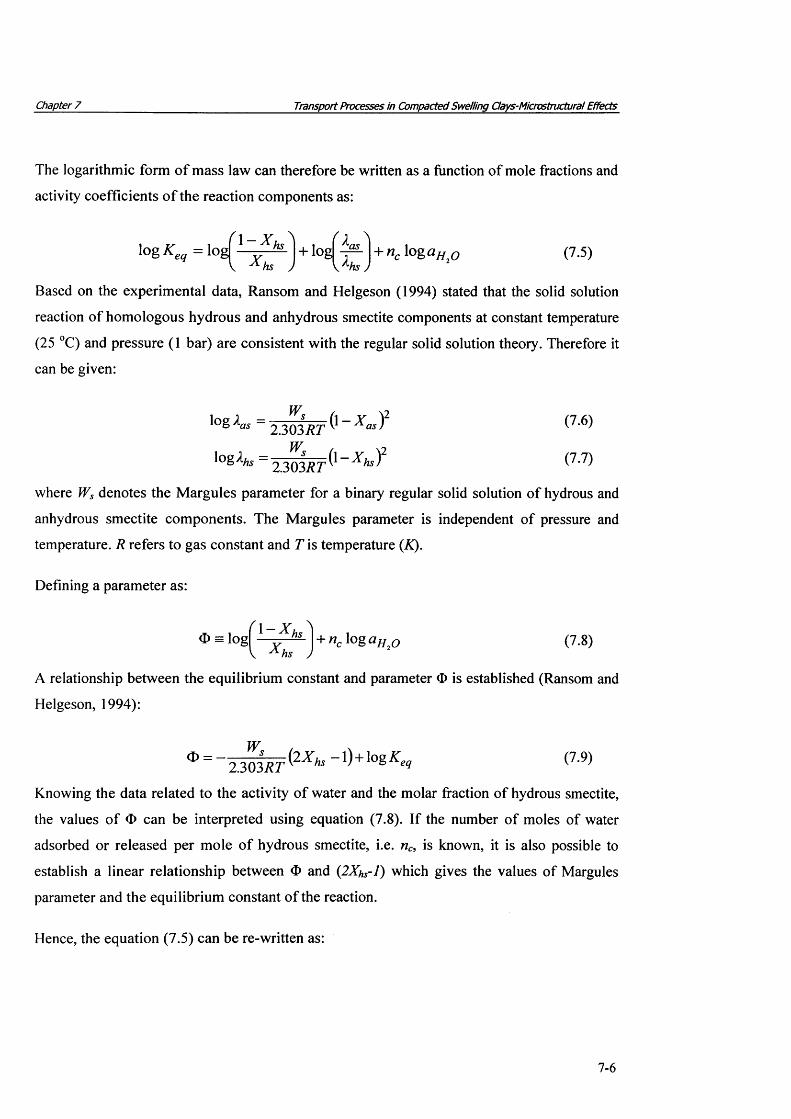
Chapter 7 Transport Processes in Compacted Swelling Clays-Microstructural Effects
The logarithmic form of mass law can therefore be written as a function of mole fractions and
activity coefficients o f the reaction components as:
log K eq = logf + l o g f + nc log0 ^ 0 (7.5)y^hs j
hs hs )
Based on the experimental data, Ransom and Helgeson (1994) stated that the solid solution
reaction of homologous hydrous and anhydrous smectite components at constant temperature
(25 °C) and pressure (1 bar) are consistent with the regular solid solution theory. Therefore it
can be given:
log* " ° 2 303RT (7'6)
l0gXhs = 2.303R T ^ - Xh*)2 <7.7)
where Ws denotes the Margules parameter for a binary regular solid solution of hydrous and
anhydrous smectite components. The Margules parameter is independent of pressure and
temperature. R refers to gas constant and T is temperature (X).
Defining a parameter as:
l - X \= l°g| ' y ' hS +«clO g«H 0 (7.8)
V A hs J
A relationship between the equilibrium constant and parameter <X> is established (Ransom and
Helgeson, 1994):
(79)
Knowing the data related to the activity of water and the molar fraction of hydrous smectite,
the values of <I> can be interpreted using equation (7.8). If the number of moles of water
adsorbed or released per mole of hydrous smectite, i.e. nc, is known, it is also possible to
establish a linear relationship between O and (2XhS-1) which gives the values of Margules
parameter and the equilibrium constant of the reaction.
Hence, the equation (7.5) can be re-written as:
7-6

Chapter 7 Transport Processes in Compacted Swelling Clays-Microstructural Effects
■°g K eq = logf ‘ y ''S ) + t -H i p-r (2 X hs ~ 0+ "c \°%aH,0 (7.10)eq ^ Xfc J ' 2.303RT
According to the equation (7.10), the amount of molar fraction of hydrous member of the
solid solution reaction can be calculated at any temperature and activity of water, if the
equilibrium constant and Margules parameter of the solid solution reaction are known.
Ransom and Helgeson (1994) calculated the number of water moles per Oio(OH) 2 (i.e. nc) of a
fully hydrated smectite (i.e., Xhs= 1) based on the analysis of the reported XRD results. They
concluded that the basal spacing between dioctahedral aluminous layers extends from 10 A to
15.7 A in a fully hydrated smectite. They reported the moles number of interlayer water per
Oio(OH) 2 (nc) o f fully hydrated smectite as 4.5 which corresponds to the basal spacing of 15.7
A. This amount of water corresponds to two layers of water in the interlayer space (Cuadros,
1997).
Although basal spacing between the dioctaheral layers of smectite may differ with the
exchangeable cations, Cuadros (1997) reported that the maximum number of water moles per
half formula unit considering two layers of water is approximately 4.5 for smectite exchanged
with Na, Ba, Li, Ca, Mg, and Sr cations but the behaviour of K and Cs-smectite is different.
Base on the experimental data on the water-vapour pressure isotherm studies on Na and Ca
smectite, Ransom and Helgeson (1994) calculated the equilibrium constant and Margules
parameter of the solid solution model for Na- and Ca-smectite solid solutions assuming that
fully hydrous smectite contains two mono layers of water or 4.5 moles of water in the
interlayer space.
In the formulation o f the solid solution model for hydration/dehydration, the natural variations
in the hydration/dehydration behaviour of smectite exchanged with different exchangeable
cations is considered through the dependency of Margules parameter (fVs) and the values of
Gibbs free energy o f the reaction on the interlayer cation. Ransom and Helgeson, (1994) also
provided theoretically the values of Margules parameters and standard Gibbs free energy of
the hydration/dehydration reaction at standard pressure of 1 bar and temperature 25 °C for
different homo-ionic smectite solid solutions with different interlayer cations. The later
calculations for different homo-ionic smectites were adopted based on the thermodynamic
parameters obtained of hydration/dehydration of Na- and Ca-smectite and by assuming that
7-7
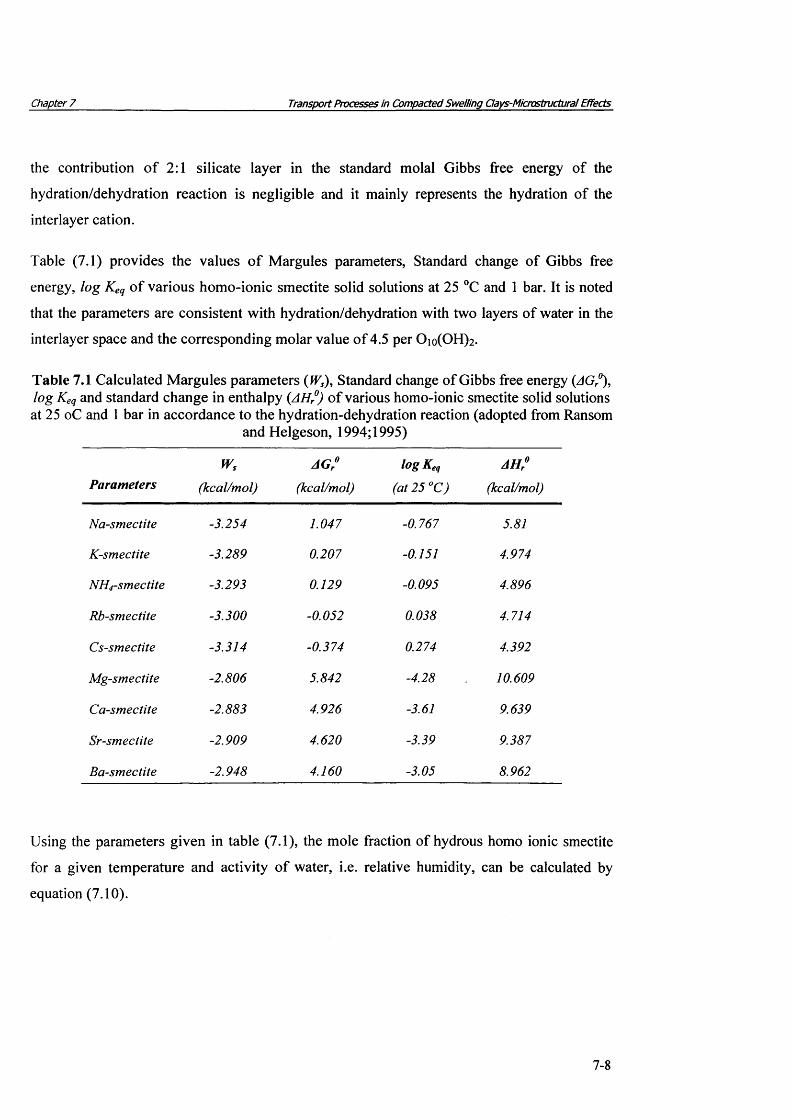
Chapter 7 Transport Processes in Compacted Swelling Clays-Microstructural Effects
the contribution o f 2:1 silicate layer in the standard molal Gibbs free energy of the
hydration/dehydration reaction is negligible and it mainly represents the hydration of the
interlayer cation.
Table (7.1) provides the values o f Margules parameters, Standard change of Gibbs free
energy, log Keq o f various homo-ionic smectite solid solutions at 25 °C and 1 bar. It is noted
that the parameters are consistent with hydration/dehydration with two layers of water in the
interlayer space and the corresponding molar value of 4.5 per Oio(OH)2 .
Table 7.1 Calculated Margules parameters (Ws), Standard change of Gibbs free energy (AGr°), log Keq and standard change in enthalpy (AHr°) o f various homo-ionic smectite solid solutions at 25 oC and 1 bar in accordance to the hydration-dehydration reaction (adopted from Ransom
and Helgeson, 1994; 1995)
ParametersWs
(kcal/mol)
AGr°
(kcal/mol)
log Keq
(at 25 °C)
AHr°
(kcal/mol)
Na-smectite -3.254 1.047 -0.767 5.81
K-smectite -3.289 0.207 -0.151 4.974
NH4-smectite -3.293 0.129 -0.095 4.896
Rb-smectite -3.300 -0.052 0.038 4.714
Cs-smectite -3.314 -0.374 0.274 4.392
Mg-smectite -2.806 5.842 -4.28 10.609
Ca-smectite -2.883 4.926 -3.61 9.639
Sr-smectite -2.909 4.620 -3.39 9.387
Ba-smectite -2.948 4.160 -3.05 8.962
Using the parameters given in table (7.1), the mole fraction of hydrous homo ionic smectite
for a given temperature and activity of water, i.e. relative humidity, can be calculated by
equation (7.10).
7-8
Chapter 7 Transport Processes in Compacted Swelling Clays-Microstructural Effects
7.3 Suction and temperature dependency of the hydration/dehydration
The mole fraction o f hydrous smectite is controlled by the parameters of the solid solution
model presented in equation (7.10) including:
• Activity o f water {log amo)
• Temperature (7)
• Equilibrium constant of the reaction {log Keq)
• Margules parameter {Ws).
The activity of water can be related to the relative humidity and soil water potential (suction)
in the system as:
where s is suction and vw is the molar volume of water. PH0 and P% 0 are the partial pressures
of water in soil and in a pure solution under identical conditions, respectively. R is gas
constant.
Based on equation (7.11), activity of water can be related to the suction and temperature.
Consequently, the amount o f the partial molar of hydrated smectite can also be determined at
a given suction and temperature from equation (7.10).
The equilibrium constant o f the reaction varies also with temperature (Ransom and Helgeson,
1995). The temperature dependency of the equilibrium constant of the reaction can be also
expressed as a function of standard enthalpy of reaction ( AH® ) and the standard change of
heat capacity o f the reaction at constant pressure, ( AC°p ), (Langmuir, 1997). Accordingly, the
variation of the equilibrium constant of the reaction can be represented as (Langmuir, 1997):
model
1” 52.303RT (7.11)
aiogKeq _ AHQrJ AC°p AC°p dT 2.303RT2 2.303RT2 + 2.303RT
(7 .1 2 )
7-9

Chapter 7 Transport Processes in Compacted Swelling Clays-Microstructural Effects
Integrating the equation (7.12), the equilibrium constant at any temperature can be therefore
calculated from its value at reference temperature, the standard values o f enthalpy at reference
temperature given by Ransom and Helgeson (1994 and 1995) for different homo-ionic
smectite (i.e. table 7.1) and the heat capacity o f the reaction as:
A H 0 AC0 AC0!°g K eq = ( log K e q \ r + 2.3037? ~ T ^ + 2.303R T~r ~ ^ + 2.303R
The values o f standard heat capacity o f hydration/dehydration reaction at different
temperatures and pressures were calculated by Ransom and Helgeson, (1995) for a binary
solid-solution o f smectite. The reported values o f AC°by Ransom and Helgeson (1995) for
smectite solid solution at different temperatures ranging from 25 to 300 °C show that the
variation o f a c J is almost negligible in temperature ranges between 25-150 °C, hence it can be
approximated as a constant value in that range o f temperature considered in the scope o f this
research ( A * 69.13 c a l / m o l ) .
-1
^ -2 S’
-3 -
-4 -
-5
!
k
^ JIT
k
i r "
--- • I---------
^ 4 V ' ' , A
a*
r *
i
a
r*
K
....
IS'" A
f ........—
r ^
■............— * — Na-smectite-Ransom & Helgeson (1994)
— A— Ca-smectite-Ransom & Helgeson (1994)
— • — Mg-smectite-Ransom & Helgeson (1994)1r '
i--------------- i------- ------- i-------------- 1-------------- i------------2 5 5 0 75 100
Temperature ( ° C)125 150 175
Figure 7.1 Variation of the logarithm of equilibrium constant of the hydration/dehydration reactions with temperature for different homo-ionic smectite solid solutions
7-10
Chapter 7 Transport Processes in Compacted Swelling Clays-Microstructural Effects
Figure 7.1 presents the variation o f the logarithm of equilibrium constant for different homo
ionic smectite solid solutions, using the reported values of log Keq at standard state by Ransom
and Helgeson (1994; 1995).
As discussed in this section, the presented model of hydration/dehydration provides a
theoretical framework to calculate the amount of the mole fraction of the hydrous homo-ionic
smectite and its variation with the primary variables of suction and temperature. In the
following section the solid solution model is applied to calculate the interlayer water content
in compacted smectite clay.
7.4 Evaluation of the interlayer water content in compacted smectite clays
In this section, a formulation for evaluating the amount of interlayer water based on the mole
fraction of hydrous smectite is derived. In fact, this section explains the way that the
hydration/dehydration model can be extended for evaluating the interlayer water content and
then the messo/macro water content/porosity in which the flow of water and transport of
chemicals takes places. The model benefits from the capability to apply under unsaturated and
non-isothermal conditions as it is based on the hydration/dehydration model presented in
previous section.
As reported in section 7.2, each mole of a fully hydrated smectite contains one mole
anhydrous smectite and nc moles o f the attached/adsorbed interlayer water. A mole of fully
hydrated smectite may contain 4.5 moles of H2 O assuming two layers of interlayer water
according to Ransom and Helgeson (1994). In other words, each mole of smectite in a fully
hydrated condition can be defined as a mole of anhydrous smectite with nc moles of adsorbed
interlayer H2 O. Therefore, the total molar mass of anhydrous smectite can adsorb
V/L volumetric amount o f the interlayer water in a fully hydrated condition ( Xhs = 1) given
as:
v l I L = ™ a s n c v i l ( 7 - 1 4 )
7-11

Chapter 7 Transport Processes in Compacted Swelling Clays-Microstructural Effects
where mas is the total molar mass o f anhydrous smectite in soil, and vn is the molar volume of
interlayer water which is about 17.22 cnrVmol given by Ransom and Helgeson, (1995) at 25
°C. It is noted that the interlayer molar volume of water is lower than the corresponding
average values for bulk water (i.e. 18.0 cm3/mol) as stated Ransom and Helgeson (1994).
The total molar mass o f anhydrous smectite (mas) can then be approximated by dividing the
total mass of dry smectite (i.e. anhydrous smectite) to the molar mass of dry smectite msm.
M smm = -* 2 - (7.15)
as msm
where ” is the total mass o f dry smectite at macro scale.
The total mass o f the dry smectite, i.e., anhydrous component, in macro scale can be
calculated knowing the partial dry density o f smectite and the total volume of the soil as:
M sd% = PdmVT (7-16)
where pdsm represents the partial bulk dry density of smectite. vT is the total volume of the dry
smectite.
By replacement o f the amount o f the total mass o f dry smectite with equation (7.16), the total
molar mass o f smectite is given as:
stnma, = ^ - V T (7.17)
sm
Therefore the total volume o f interlayer water in fully hydrated condition (i.e., x hs = l ) yields:
smV IL= £ d _ „ y VT (7.18)
YYlUlsm
In partially hydrated conditions (or at any molar fraction of hydrous smectite, Xhs < 1), total
volume of the interlayer water can therefore be calculated as:

Chapter 7 Transport Processes in Compacted Swelling Clays-Microstructural Effects
The volumetric content o f the interlayer water 0\L can further be given as a function o f dry
density and the molar fraction o f hydrous smectite as:
The interlayer space is always saturated with water and the adsorption/desorption o f
water/vapour due to the variation in suction or temperature is manifested through the
expansion or contraction o f basal spacing (Hueckel et al., 2002), i.e.#/1 = njL.
The volume fraction o f the interlayer water in compacted smectite, fu , then is calculated as:
In general, the smectite clays may contain some impurities or non-smectite solid portion such
as quartz, feldspar, and clay minerals such as kaolinite, and illite. The partial dry density o f
smectite o f clay can be calculated, knowing the mass fraction o f smectite in clay and bulk dry
density o f the clay as (Idemitsu et al., 1996; Liu et al., 2003; Bourg, 2004):
where Xsm is the mass fraction o f smectite in clay and pd represents the bulk dry density o f the
smectite minerals or other impurities is assumed similar to that o f smectite (i.e. p im = psm ~
2840 kg/m3) according to Bourg et al. (2006).
For a given hom o-ionic smectite (smectite with single ion type in the interlayer) with a
specific dry density and a partial smectite percentage, equation (7.20) gives the volumetric
content o f the interlayer water, in accordance with the molar fraction o f hydrous smectite
which itself can be calculated using equation (7.10) as a function o f relative humidity (or
suction) and temperature.
In this section a model was proposed for quantification o f the interlayer water content in
compacted smectite clays. The developed model utilises a geochemical reaction concept for
interlayer hydration/dehydration. In the proposed model the molar fraction o f hydrous
(7.20)
(7.22)
clay. ps denotes the density o f non-smectite minerals or impurities. Here the density o f non-
7-13

Chapter 7 Transport Processes in Compacted Swelling Clays-Microstructural Effects
smectite and consequently the amount o f interlayer water can be calculated mainly as a
function o f suction, temperature, dry density and smectite content and the type o f interlayer. It
is noted that the developed model provides the volumetric amount o f water to the two or three
monolayers o f H2O which are adsorbed into the interlayer space. This is not necessarily the
same as the water content o f clay, as the water content includes contributions from pore and
surface adsorbed water (Ransom and Helgeson, 1995).
The developed model is applied and validated in the following sections and the outcomes will
be discussed.
7.5 Application and adaptation of the model for compacted Na-smectite clay
In this section, the results o f the application o f the developed mode, described in previous
sections, for compacted hom o-ionic Na-smectite clay are presented. The model has been
applied also for compacted M X-80 bentonite. The proposed model for hydration/dehydration
is re-visited to validate and adopt it o f the case o f M X-80 compacted bentonite.
7.5.1 Interlayer porosity of saturated compacted Na-smectite
In a fully saturated condition, i.e., when the activity o f water or relative humidity reaches to
one, the mole fraction o f hydrous Na-smectite (XhS) at 25 °C is obtained equal to 0.62 using
equation (7.10) in accordance with the reported values o f -0.767 and -3.254 kcal/mol for log
Keq and Ws, respectively, presented in table 7.1 (Ransom and Helgeson, 1994). It is assumed
that maximum two monolayers o f water are adsorbed in the interlayer space (Ransom and
Helgeson, 1994). Using the average value o f mass density o f montmorillonite (i.e. psm= 2840
kg/m3), the volumetric content o f interlayer water or interlayer porosity as a function o f dry
density can be obtained based on equation (7.20) as:
e',L = nIL = 0 .62 p T = 0 .13 p f (7.23)
Liu and Lin (2005) suggested that the applied basal spacing o f 15.7 A for fully hydrated Na-
smectite in the solid-solution model o f Ransom and Helgeson (1994) needs to be revised to
7-14

Chapter 7 Transport Processes in Compacted Swelling Oays-Microstructural Effects
—19 A which corresponds to three layers o f water in the interlayer space. They calculated the
number o f m oles o f water released by the dehydration o f fully hydrous smectite equal to 7.16
corresponding to three layers o f water. They reported the equilibrium constant and Margules
parameter o f hydration/dehydration reaction o f Na-smectite solid solution considering three
layers o f interlayer water (nc = 7.16). They found that the log Keq yields to -1.76 at 25 °C
considering three layers o f adsorbed water for Na-smectite and Margules parameter was
found close to the calculated value by Ransom and Helgeson (1994), i.e., Ws= -3.14 kcal/mol.
If three layers o f hydrated water, i.e. nc=7.16, is considered in the thermodynamic solid
solution model o f hydration/dehydration based on Liu and Lin (2005) and by applying the
values o f -1.76 and -3.14 kcal/mol for log Keq and Ws, respectively, the mole fraction o f
hydrous component o f smectite solid solution is obtained equal to 0.79 (Liu and Li, 2005).
Consequently from equation (7.20), the interlayer volumetric water content o f a fully smectite
clay yields to:
e ‘L = „ 1L = 0 .7 9 p f = 0.26 pF (7.24)
The fraction o f interlayer water in compacted smectite clays has been estimated by some
researchers under saturated and isothermal conditions. Kozaki et al. (2001) calculated the
fraction o f interlayer porosity in compacted saturated smectite as a function o f internal
specific surface area (i.e., the specific area o f the basal surface bounding to the interlayer), the
interlayer water thickness and gravimetric water content from the equation:
a in t . j n„ _ A s 1L P w ( n
(7-25)
where Asm is the internal specific surface area which is calculated as the difference between
total specific surface area and external specific surface area which are measured using the
EGME and BET experimental methods, respectively( A'snt = AEGME - ABET). w is the
gravimetric water content and p w denotes the specific mass o f water, dn represents the
average thickness o f interlayer water observed by X-ray diffraction analysis (XRD) which is
equal to:
^IL ~ ^basal spacing ~ smectite sheet (7.26)
7-15
Chapter 7_________________________________Transport Processes in Compacted Swelling Clays-Microstructural Effects
The XRD results o f Kozaki et al. (1998) on a Na-smectite (purified Kunipia-F bentonite with
more that 95% sodium montmorillonite) compacted to different dry densities indicated that
only three layers o f hydrate water can be adsorbed in the interlayer space in the range o f
smectite dry densities from 980 to 1270 kg/m3 and only two layers o f interlayer water at dry
densities ranging between 1570-1800 kg/m . The presence o f both 2- and 3-layer hydrate
water was observed in smectite dry densities between 1370 and 1470 kg/m3 (Bourg et al.,
2006). Based on these observations, Kozaki et al. (2001) calculated the interlayer fraction o f
pore water assuming that there are only three layers o f water in the interlayer space at dry
densities o f 700 up to 1300 kg/m3 and only two layers o f interlayer water from 1400 to 1800
kg/m3.
Bourg et al. (2006) also calculated the interlayer water porosity in saturated compacted Na-
smectite assuming that at some ranges o f dry densities only 3-layers or 2-layers o f hydrate
water exist in the interlayer space whilst in a transition state o f dry densities both 2-layers and
3-layers o f hydrates water co-exit in the interlayer space. They modified the Kozaki et al.,
(2001) approach to calculate interlayer porosity, given as:
n i L =
int. J i UT /P d ( 7 -2 7 )
£ 2 -la yer £ 2-layer
K d2-layers ^3-layers
where flayer and d3.iayer are the thicknesses o f 2- and 3-layer hydrates water, respectively. The
volume fraction o f the 2-layer hydrate water in the total interlayer water is expressed by flayer
parameter. This parameter is defined as equal to 0 for the smectite partial dry densities
between 980-1270 kg/m3 and equal to 1 for the partial dry densities from 1570 to 1760 kg/m3.
At dry densities from 1270 to 1570 kg/m3, Bourg et al. (2006) assumed a linear increase for
this parameter which starts from 0 at dry density equal to 1270 kg/m3 and 1 at dry density o f
1570 kg/m3.
Figure (7.2) shows the variation o f the interlayer porosity o f saturated Na-smectite with dry
density for pure smectite clay calculated based on the developed model assuming 2 layers o f
hydrate water. In addition, the results o f calculation assuming 3-layers o f hydrated water
based on the parameters suggested by Liu and Lin (2005) for solid solution model are also
presented. The values o f interlayer porosity for a Na-smectite calculated and reported by
7-16
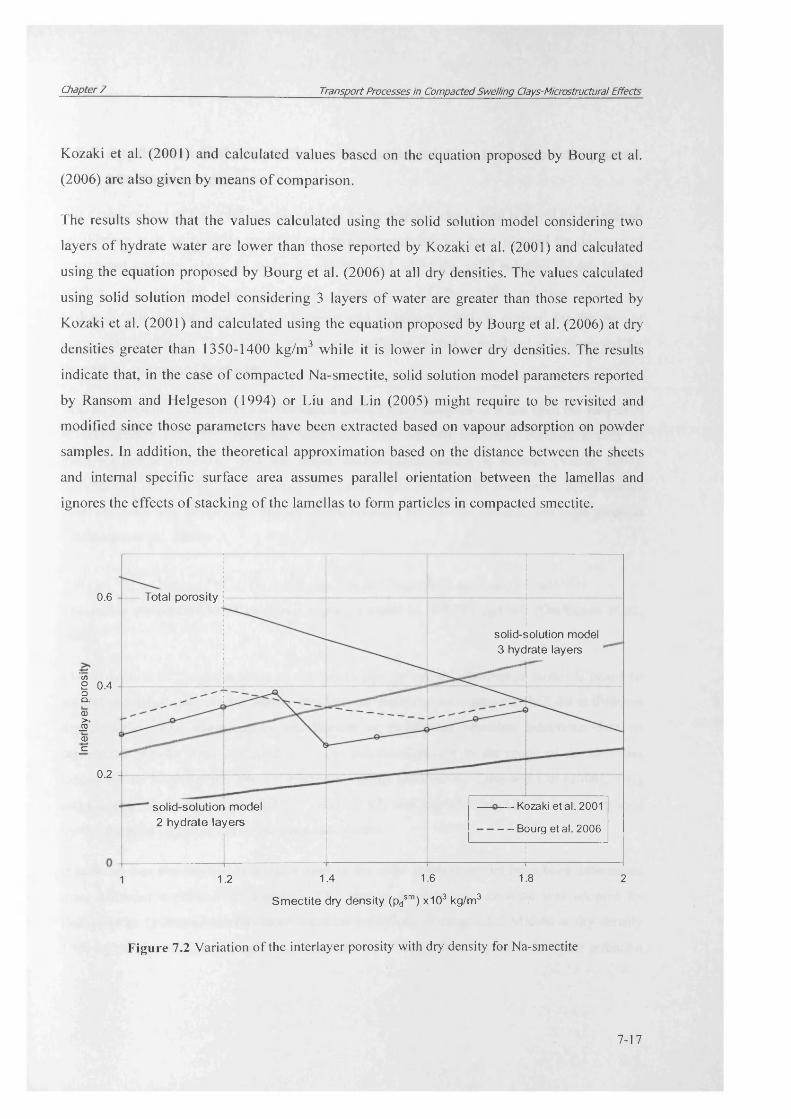
Chapter 7 Transport Processes in Compacted Swelling Clays-Microstructural Effects
Kozaki et al. (2001) and calculated values based on the equation proposed by Bourg et al.
(2006) are also given by means o f comparison.
The results show that the values calculated using the solid solution model considering two
layers o f hydrate water are lower than those reported by Kozaki et al. (2001) and calculated
using the equation proposed by Bourg et al. (2006) at all dry densities. The values calculated
using solid solution model considering 3 layers o f water are greater than those reported by
Kozaki et al. (2001) and calculated using the equation proposed by Bourg et al. (2006) at dry
densities greater than 1350-1400 kg/m3 while it is lower in lower dry densities. The results
indicate that, in the case o f compacted Na-smectite, solid solution model parameters reported
by Ransom and Helgeson (1994) or Liu and Lin (2005) might require to be revisited and
modified since those parameters have been extracted based on vapour adsorption on powder
samples. In addition, the theoretical approximation based on the distance between the sheets
and internal specific surface area assumes parallel orientation between the lamellas and
ignores the effects o f stacking o f the lamellas to form particles in compacted smectite.
Total porosity0.6
solid-solution model 3 hydrate layers
c/>2 0.4oQ.(D>03—a>c
0.2
Kozaki e ta l. 2001solid-solution model 2 hydrate layers - - Bourg e ta l. 2006
1.61.4 1.8 21.21Sm ectite dry density (pdsm) x103 kg/m3
Figure 7.2 Variation of the interlayer porosity with dry density for Na-smectite
7-17
Chapter 7 Transport Processes in Compacted Swelling Clays-Micmstructural Effects
7.5.2 Application and adaptation of the solid solution model for compacted MX-80 bentonite
The development o f the solid solution model for hydration/dehydration is based on the vapour
equilibrium tests on powder smectite and this approach has not been adopted for the case o f
compacted smectite clays. In order to validate and adopt the solid solution model, in this
section, the required thermodynamics parameters o f the solid solution model o f
hydration/dehydration proposed by Ransom and Helgeson (1994) is derived for the case o f
compacted bentonite. The validity o f the solid solution model is explored and improved for
the case o f compacted bentonite.
MX-80 bentonite is considered as the bench mark for the analyses as it has been the subject o f
several studies on water retention behaviour. The MX-80 bentonite consists mainly o f
montmorillonite (65-90% ) and the major exchangeable cation is sodium (Villar, 2007).
Accordingly the M X-80 is considered as a homo ionic Na-smectite with about 22.5 percents
other minerals and impurities. The structural formula for MX-80 smectite has been given as
(Gailhanou et al., 2007):
{^ll.593F e0+184^S0.228F e0J84Ti0.011 0.026 a 0.435^a 0.010 \^ 0 .388^3.612 ) ’ ^ lO ( O H ) 2
The molar mass o f M X-80 has been reported equal to 378.787 (g/mol) (Gailhanou et al.,
2007).
The derivation o f the parameters o f the developed hydration/dehydration model is based on
several published data on the vapour equilibrium isotherms o f compacted MX-80 at different
dry densities. The water/vapour equilibrium or isothermal retention behaviour data on
compacted M X-80 were collected from the published results in the range o f dry densities
from 1400 to 1800 kg/m3. The experimental results reported by Tang and Cui (2006), Tang
and Cui (2010), Delage et al., (2006), Villar (2007) and Jacinto et al., (2009) have been used
for the purpose o f validition o f the proposed model.
It is noted that the experimental data used in the solid solution model have been determined
from different experimental methods. The vapour equilibrium technique was adopted by
Delage et al. (2006) to obtain water retention behaviour o f compacted MX-80 at dry density
1700 kg/m3 in a confined condition. Tang and Cui (2005; 2010) reported the water retention
7-18

Chapter 7 Transport Processes in Compacted Swelling C/ays-Microstructura/ Effects
o f compacted M X-80 at dry density 1650 and 1820 kg/m3. Villar (2007) reported the retention
behaviour o f compacted MX-80 at dry density 1300 and 1600 kg/m3 using cell method in
which the swelling constrained system is exposed to different relative vapour pressures. In
addition the water retention behaviour o f compacted MX-80 at dry density 1600 kg/m3 was
also presented by Villar (2007) using two other different methods. More recently Jacinto et
al., (2009) reported the water/vapour adsorption o f compacted MX-80 at dry density o f 1600
and 1700 kg/m3 under confined condition and at different temperatures.
Figure (7.3) presents the vapour isothermal retention behaviour o f compacted MX-80 at
different dry densities at ambient temperature reported in the above mentioned studies. The
results are presented in terms o f water content (mw/ms) versus activity o f water ( aH ). In the
graph trends o f the data variations have been shown to illustrate the differences.
0.5
o Pow der MX-800.4
a C om pacted MX-80 R2 = 0.8622
o o
O A09O)E
E 0 .2 - A R? = 0.9654o <
o o0.1 o o
0.6 0.80.4 10.203H20
Figure 7.3 Vapour adsorption behaviour in compacted and powder MX-80 reported in the literature. Lines represent the best fitted trend to demonstrate the variation trend
In order to compare the water retention behaviour o f MX-80 in compacted form with the
powder behaviour, available data on the water retention behaviour o f powder MX-80 or Na-
Wyoming smectite were also gathered. The results reported by Keren and Shainberg (1975);
7-19

Chapter 7 Transport Processes in Compacted Swelling Qays-Microstructural Effects
Delage et al. (2008), M ontes et al. (2003) and Mooney et al. (1952) are also plotted in figure
(7.3). Note that Ransom and helgeson (1994), derived the required solid solution parameters
based on the vapour adsorption isotherms, reported by Keren and Shainberg (1975). Indeed,
the effects o f laboratory methods or errors on the comparison between the reported data have
been neglected.
The comparison between the behaviour o f compacted and powder samples indicates small
difference in the retention behaviour o f water compacted samples and powder samples at
relative humidity less than about 70-80 %. However, at greater water activity or relative
humidity, the behaviour o f the compacted samples is different from the powder as powder
samples have higher water content compared with the compacted samples. Similar results on
the behaviour o f compacted and powder samples has been reported in Delage et al. (2005) and
Tang and Cui (2010).
One conclusion might be the thermodynamic parameters o f the solid solution model o f Na-
smectite, derived by Ransom and Helgeson (1994), which were based on the experimental
data on powder samples, can only be used to calculate the hydration state o f the compacted
smectite in a specific range o f activities o f water or relative humidity. At high water activities,
the model parameters require to be modified.
In order to validate and evaluate the parameters required o f the thermodynamic solid solution
model o f hydration/dehydration in compacted Na-smectite, the experimental data reported on
the water retention o f M X-80 bentonite compacted at dry densities in the range o f 1600-1800
kg/m3 were used. The experimental data on the water retention behaviour o f compacted MX-
80 wass analysed follow ing the interpretation procedure and stages o f data analysis and
derivation o f the thermodynamic solid solution parameters, reported by Ransom and Helgeson
(1994).
The data interpretation and derivation o f the thermodynamic model and parameters required
the following steps:
1. The amount o f adsorbed mass o f water in the interlayer space and the equivalent mole o f
H20 m olecules adsorbed into the interlayer were calculated knowing the amount o f total
7-20

Chapter 7 Transport Processes in Compacted Swelling Qays-Microstructural Effects
water at any relative humidity values and the amount o f adsorbed water in kaolinite clay
at the same relative humidity as suggested by Ransom and Helgeson (1994), using:.
mn = {g s - 2g k ) ¥ r -jyi w (7.28)
where mu represents the molar content o f the interlayer H2O per mole o f smectite. gs and
gk are the total mass o f water adsorbed in smectite and kaolinite, respectively measured
during water-vapour isothermal test. Ms and M w stands for the molecular weight o f water
and smectite.
An exponential regression on the vapour adsorption data o f kaolinite, reported by
Johansen and Dunning (1959) was used to calculate the amount o f moles o f water in the
interlayer at given relative humidity related to the experimental data reported for the water
adsorption behaviour in compacted M X-80
2. The next step was to define the amount o f hydrous fraction o f smectite (Xhs) by knowing
the moles o f interlayer water and the number o f water layers in the interlayer. Villar
(2007) reported the basal spacing o f compacted MX-80 bentonite at dry densities 1300
and 1600 kg/m3 and at different values o f relative humidity. The results indicate that the
measured basal spacing o f samples does not exceed about 15.55 and 15.99 A, at low
suction values, i.e. 1.3 MPa. The basal spacing o f samples is reduced slightly with
increasing in the suction values in the range o f 1.3 to 19.9 MPa and remains almost in the
equivalent thickness corresponding to two monolayers o f adsorbed water. It is only
dropped to about 12.7 A which is equivalent to the thickness o f one mono layer water in
the interlayer space at relatively high suction value o f 127.2 MPa. Therefore, in the range
o f dry densities studied here (i.e., 1600-1800 kg/m3) we assume that no more than two
layers o f hydrated water exist in the interlayer space which is equivalent to 4.5 water
moles in fully hydrated smectite same as the value used by Ransom and Helgeson (1994).
Knowing the m oles o f interlayer water in water-vapour vapour isotherm behaviour, the
mole fraction o f hydrous component o f smectite solid solution assuming two monolayers
o f interlayer water at fully hydrated state can be given as:
Y m lL (7 .2 9 )
7-21

Chapter 7 Transport Processes in Compacted Swelling Clays-Microstructural Effects
3. The parameter O was calculated using equation (7.8) and the variation o f this parameter
with 2XhS- l was produced.
4. Based on equation (7.9), if the best linear variation o f parameter O versus (2XhS-l) is
produced, the Margules parameter and log Keq o f the solid solution reaction o f
hydration/dehydration can be obtained from the slope o f the linear relationship O versus
(2Xhs-l) to obtain the slope o f the trend line, i.e. Ws/2.30RT and interception point, i.e. log
Keq.
The values o f parameter O were calculated knowing the activity o f water and XhS and plotted
versus (2Xhs-J) in figure (7.4).
o
The best fitted line related to compacetd bentonite y = 0 .5 2 0 1 x -1.1687 *
. R2 = 0 .4236
A * A&* A1
a Calculated for com pacted bentonite based on Exp. data
Solid solution model-calculated b ased on R ansom and H elgeson (1994) param eters
•3
• R ansom & H elgeson, 1994 data
•40.50-0.5 11
( 2 X h S - 1 )
Figure 7.4 Using the linear relationship of G> versus (2Xhs-J) to obtain the slope WS/2.30RT andintercept log Keq
The liner relationship between O and (2XhS- l ) as proposed by Ransom and Helgeson (1994) is
also presented in figure (7.4) which was calculated based on equation (7.9) and using the
Margules parameter and log Keq reported by Ransom and Helgeson (1994) for Na-smectuite
(refer to table 7.1). Figure (7.4) also shows the data related to the variation o f O versus (2Xhs-
7-22
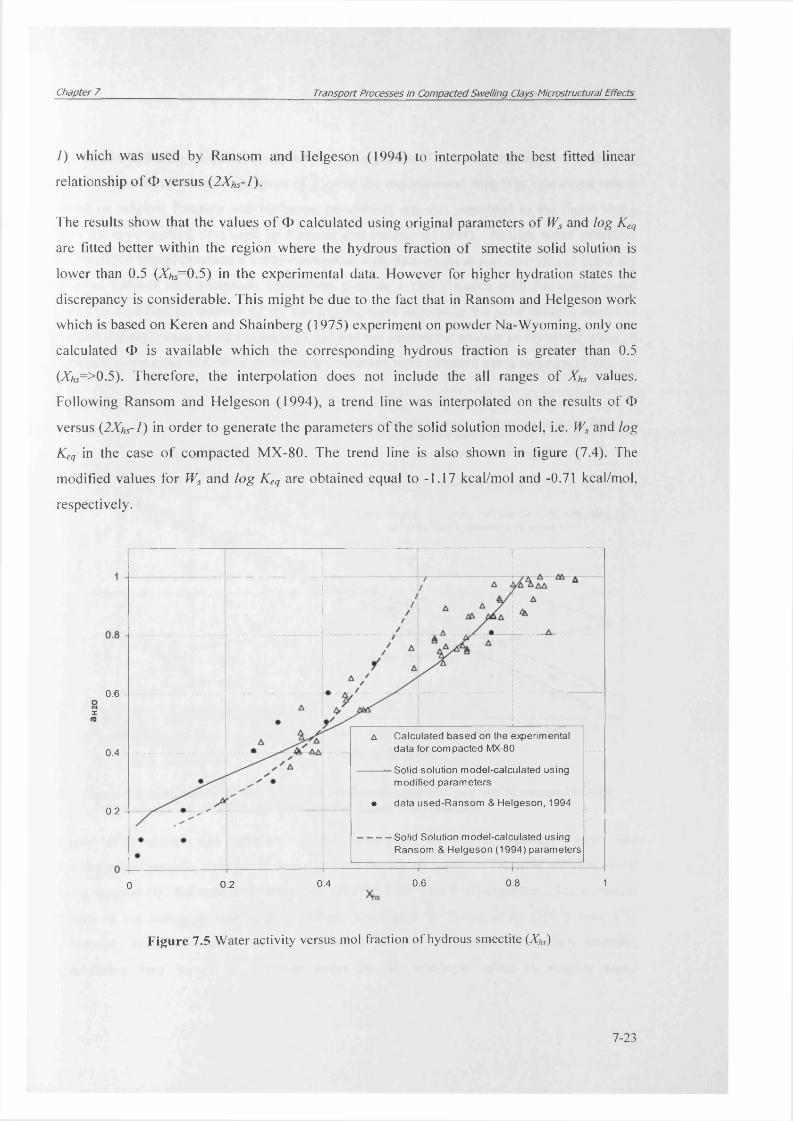
Chapter 7 Transport Processes in Compacted Swelling Clays-Microstructural Effects
1) which was used by Ransom and Helgeson (1994) to interpolate the best fitted linear
relationship o f O versus (2XhS- l ).
The results show that the values o f O calculated using original parameters o f Ws and log Keq
are fitted better within the region where the hydrous fraction o f smectite solid solution is
lower than 0.5 ( ^ = 0 .5 ) in the experimental data. However for higher hydration states the
discrepancy is considerable. This might be due to the fact that in Ransom and Helgeson work
which is based on Keren and Shainberg (1975) experiment on powder Na-Wyoming, only one
calculated O is available which the corresponding hydrous fraction is greater than 0.5
(^ = > 0 .5 ) . Therefore, the interpolation does not include the all ranges o f Xhs values.
Following Ransom and Helgeson (1994), a trend line was interpolated on the results o f O
versus (2Xhs- l ) in order to generate the parameters o f the solid solution model, i.e. Ws and log
Keq in the case o f compacted M X-80. The trend line is also shown in figure (7.4). The
modified values for Ws and log Keq are obtained equal to -1.17 kcal/mol and -0.71 kcal/mol,
respectively.
0.6 -
z
a Calculated based on the experimental data for compacted MX-80
Solid solution model-calculated usingmodified parameters
• data used-Ransom & Helgeson, 1994
0.4 -
0.2
— Solid Solution model-calculated using Ransom & Helgeson (1994) parameters
0.6 0.8 10.40.20
F igure 7.5 Water activity versus mol fraction of hydrous smectite (Xhs)
7-23

Chapter 7 Transport Processes in Compacted Swelling Clays-Microstructural Effects
The results o f the XhS calculated values based on equation (7.9) incorporating the modified Ws
and log Keq are represented in figure (7.5) with the experimental data. The calculated values
based on original Ransom and Helgeson parameters are also presented in the figure along
with the experimental data used by Ransom and Helgeson (1994). At high water activities,
the modified model presents a better correlation with data whilst at low activities o f water the
original Ransom and Helgeson parameters provide a closer match with the experimental
data.The modified parameters o f Ws and log Keq were applied in the solid solution model o f
hydration/dehydration using equation (7.10) and the volumetric amount o f interlayer water o f
saturated compacted M X-80 at different dry densities were obtained using equation (7.20).
1.0— Intra-layer porosity- Solid solution model, calculated
using modified parameters
* Intra-layer porosity-Flisch & Yong, 2006Total theoretical porosity0.8
i— Intra-layer porosity-Bourg et al., 2003
Intra-layer porosity-solid solution model, calculated using Ransom & Helgeson's parameters0.6 A
0.4
Interlayerporosity
0.2
0.01.2 1.4 1.6 1.8 210.80.6
Bulk dry density (x103 kg/m3)
Figure 7.6 Variation of the interlayer and intralayer/interparticle porosity in saturated MX-80 bentonite compacted at different dry densities.
Figure (7.6) shows the variation o f the volumetric content o f interlayer water and
intralayer/interparticle volumetric water content calculated based on the solid solution model
using original (by Ransom and Helgeson, 1994) and the modified parameters. The estimated
results o f the intralayer/interparticle porosity calculated by Bourg et al. (2003) were also
presented. They estimated that the interlayer porosity o f compacted sodium smectite,
considering two layers o f hydrates water in the interlayer space is roughly equal
7-24

Chapter 7 Transport Processes in Compacted Swelling Clays-Microstructural Effects
to niL -Q -I6pd . In addition, the variation o f the intralayer/interparticle porosity o f MX-80
bentonite, reported by Pusch and Yong (2006) have also been shown in the graph.
The results indicate that the calculated values using solid solution model are closely match
with those calculated or reported by Bourg et al. (2003) and Pusch and Yong (2006).
However, the solid solution model using the original parameters resulted greater values while
using the modified parameter are in close agreement with the results o f Bourg et al. (2003)
and Pusch and Yong (2006).
7.5.3 Interlayer water variations with suction and temperature for compacted MX-80
As discussed in section 7.3, the proposed solid solution model for hydration/dehydration o f
smectite is capable to m odel the process at variable relative humidity (or suction) and
temperature. In this section, the solid solution model results, applied for calculating the
interlayer hydrate water o f compacted M X-80 at different suction and temperature values are
presented. The variation o f the interlayer water content with suction o f M X-80, compacted at
dry density o f 1600 kg/m3, was calculated using the solid solution model. The modified
values for the Margules parameter and equilibrium constant for MX-80, presented in section
7.5.2 were used to calculate the volumetric content o f the interlayer water.
Figure 7.7 shows the results o f the modelling o f the interlayer water content at different
suction values. Total volumetric water content versus suction has been also presented in the
graph, based on the experimental results, presented by Jacinto et al. (2009). In addition, the
calculated values o f the solid solution model using the Margules parameter and equilibrium
constant o f Na-smectite, proposed by Ransom and Helgeson (1994) was also presented in this
figure.
The results show that the interlayer volumetric water content has decreased with increasing
suction as the total water content decreases. However the major variation o f the interlayer
water content occurred in the range o f suction values between 1.1 xlO7 and 1.1 xlO8 Pa using
the modified parameters in the solid solution model. The amount o f the interlayer water
content reaches to a constant value in suction values less than l .lx lO 7 Pa, while the total
7-25
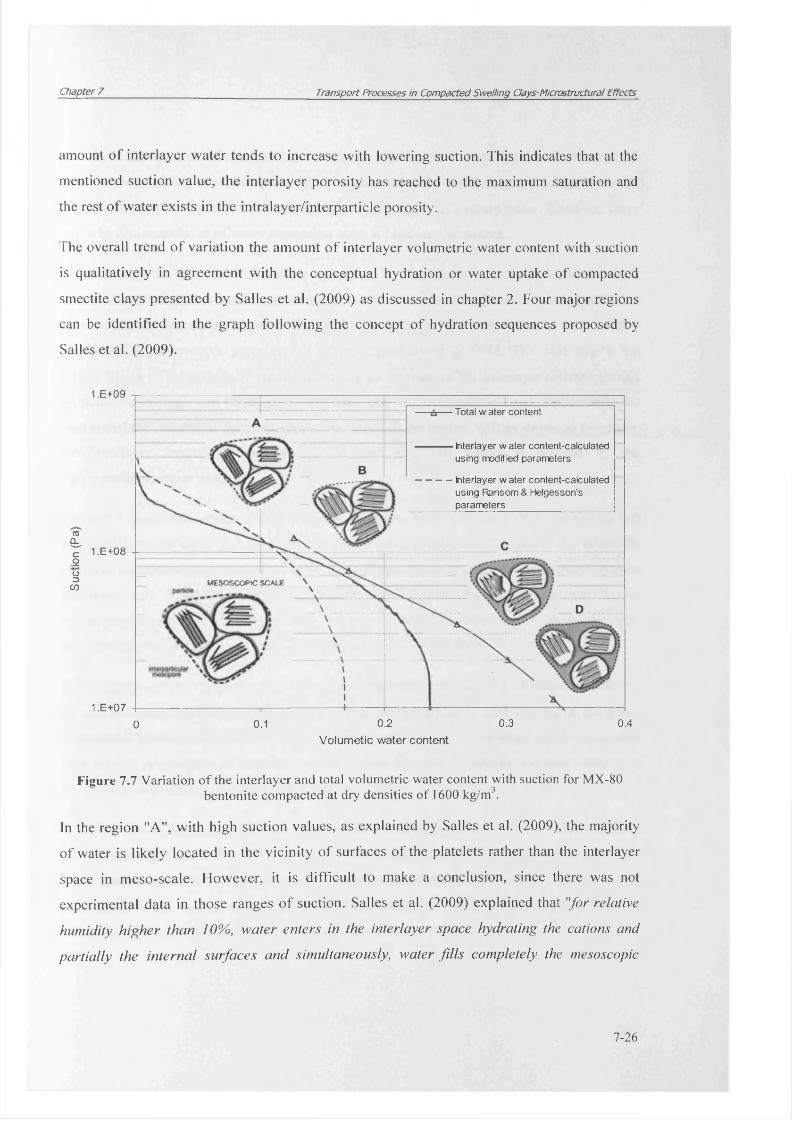
Chapter 7 Transport Processes in Compacted Swelling Qays-Microstructural Effects
amount o f interlayer water tends to increase with lowering suction. This indicates that at the
mentioned suction value, the interlayer porosity has reached to the maximum saturation and
the rest o f water exists in the intralayer/interparticle porosity.
The overall trend o f variation the amount o f interlayer volumetric water content with suction
is qualitatively in agreement with the conceptual hydration or water uptake o f compacted
smectite clays presented by Salles et al. (2009) as discussed in chapter 2. Four major regions
can be identified in the graph following the concept o f hydration sequences proposed by
Salles et al. (2009).
1.E+09Total w ater content
—— Interlayer w ater content-calculated using modified parameters
Interlayer w ater content-calculatedusing Ransom & Helgesson's parameters___________________
toa.^ 1.E+08 oo13
COMESOSCOPIC SCALE
1 .E+070.2 0.3 0.40.10
Volumetic water content
Figure 7.7 Variation of the interlayer and total volumetric water content with suction for MX-80 bentonite compacted at dry densities of 1600 kg/m3.
In the region "A", with high suction values, as explained by Salles et al. (2009), the majority
o f water is likely located in the vicinity o f surfaces o f the platelets rather than the interlayer
space in m eso-scale. However, it is difficult to make a conclusion, since there was not
experimental data in those ranges o f suction. Salles et al. (2009) explained that "for re la tiv e
h u m id ity h ig h e r th a n 1 0 % , w a te r e n te r s in th e in te r la y e r s p a c e h y d ra tin g th e c a tio n s a n d
p a r t ia l ly th e in te r n a l s u r fa c e s a n d s im u lta n e o u s ly , w a te r f i l l s c o m p le te ly the m e so sc o p ic
7-26

Chapter 7 Transport Processes in Compacted Swelling Clays-Microstructural Effects
porosity". The amount o f the interlayer water in this region is very low based on the solid
solution model using modified parameter, because the solid solution model is based on the
concept o f complete hydration or dehydration o f two layers o f hydrate water. However, there
might be one monolayer o f water remaining even at high suction values.
Between regions "B", and "C", water uptake to the interlayer space was initiated which
became almost complete in suction values around l .lx lO 7 Pa. This behaviour is in qualitative
agreement with the results reported by Salles et al. (2009). They stated that "at 54% relative
humidity, the m esoscopic porosity for Na-montmorillonites is filled. The next step is the
further filling o f the interlayer space, producing an increase o f the interlayer distance (called
crystalline swelling), the breaking o f particles into smaller particles, and concurrently the
increase o f the volume o f the m esoscopic porosity". In the region "D", as shown in the graph,
the interlayer hydration was completed and the rest water is located in the
intralayer/interpartice porosity.
Figure 7.8 shows the results o f modelling the interlayer water content at different suction and
temperature values using the solid solution model using equations (7.10) and (7.20) where the
values o f equilibrium constant o f the model at different temperatures were calculated based on
equation (7.13) . Total volumetric water content versus suction, are based on the experimental
results presented by Jacinto et al. (2009) on the water retention behaviour o f compacted MX-
80 at dry density o f 1600 kg/m3 and at temperatures 20, 40 and 80 °C.
The variation o f the mole fraction o f hydrous smectite with activity o f water at different
suction and temperatures can be calculated from equation (7.10) using log Keq at the given
temperature. A s mentioned in section 7.3, log K eq at a given temperature can be calculated
from log K eq at reference temperature and the values for heat o f enthalpy and heat capacity o f
the reaction, reported by Ransom and Helgeson (1995).
It is observed in figure 7.8 that the values o f the interlayer volumetric water content reduced
with increasing temperature. Even at relatively low suctions, where the amount o f interlayer
water content tends to a threshold value, increasing temperature reduces the interlayer water
content. In other words, temperature variation induces a water mass exchange between
interlayer and intralayer/interparticle space.
7-27

Chapter 7 Transport Processes in Compacted Swelling Clays-Microstructural Effects
1.E+09
a Exp. total water content-20 C
o Exp. total water content-40 C
• Exp. total water content-80 C
Interlayer water content-calculated using modified parameters
•2 1 .E+08
40
20 °C
1.E+070.40 0.1 0.2
Volumetic water content
Figure 7.8 Variation of the interlayer and total volumetric water content with suction and temperature for MX-80 bentonite compacted at diy densities of 1600 kg/m3.
In fact during heating, the adsorbed water (i.e. interlayer water) may degenerate into bulk
water in macro pores that permits the cluster to be contracted and consequences the stack to
be collapsed (Derjaguin et al., 1986). According to Ma and Hueckel, (1992), temperature
increase results an inter-constituent mass exchange between the adsorbed water in the
interlayer pores and the bulk water whose physical properties are similar to the free water.
This statement is in agreement with the theoretical calculations based on the solid solution
model. This behaviour in saturated condition is illustrated in figure 7.9. As an application, this
suggest that in compacted bentonite buffer, in the region close to the heater, the liquid
moisture can be exchanged between the adsorbed interlayer phase to free water phase in
which dissolved ions exists. As a result, the available space for ions to move is increased.
As presented in previous sections, the developed model for hydration/dehydration and
interlayer water content/porosity evolution can be used in variable suction and temperature
conditions such as the condition in HLW disposal conditions. The developed model provides
a geochemical approach to link between microstructure and pore water/porosity evolution. In
following section, the model is extended and applied to include microstructure effects due to
7-28

Chapter 7 Transport Processes in Compacted Swelling Clays-Microstructural Effects
the interlayer water hydration/dehydration in water transport properties o f compacted
bentonite.
Interparticle
water
Interlayer ^
water
Solid
Temp.= T, Temp.= r2> Ti
Figure 7.9 Illustration of the water exchange between interlayer porosity and intralayer/interparticle porosity with increasing temperature, adopted from Ma and Hueckel (1992).
7.6 Proposed approach for representing the interlayer water effects on
water transport model (an example application of the model)
The developed model for calculating the interlayer water content in compacted smectite clays
has potential applications in the modelling o f hydraulic, chemical and mechanical behaviour
o f expansive smectite rich clay. In this section, and as an example application, the effects o f
the interlayer hydration/dehdation are introduced in simulating the liquid water transport via a
modified hydraulic conductivity approach.
7.6.1 Background of the hypothesis
The flow o f water in unsaturated clays is controlled mainly by the available porosity for flow
o f water, i.e. free porosity, and the degree o f saturation o f the free porosity (e.g. Fredlund and
Rahardjo, 1993; Thomas et al., 2003; Thomas et al., 2009). These two factors represent, in
total, the amount o f volumetric content o f the free water in soil. Regarding the water flow in
confined compacted swelling clays and in particular compacted smectite clays, Pusch et al.
(1990) stated that a proportion o f the water that is held in the soil may be absorbed into the
7-29
9999992
11555

Chapter 7 Transport Processes in Compacted Swelling Clays-Microstructural Effects
micro-structure and unavailable for flow. If this material is restrained from expanding then the
swelling particle would reduce the size o f the macro-pores where flow can easily occur
(Pusch, 1998).
Mitchell (2002), Thomas et al. (2003) and Vardon (2009) have adopted the concept o f
macropore size reduction due to the micropore water adsorption, suggested by Pusch (1998),
into the hydraulic conductivity relationship in the case o f compacted bentonite. As the first
assessment, this approach was performed by simply assuming that, for a particular geometry,
as the material approached saturation the hydraulic conductivity tends to zero for a compacted
bentonite, i.e. M X-80. This implies that all o f the moisture in the soil, at this state, would be
considered as bound water, and the macro voids would be progressively eliminated. The
amount o f adsorbed water assumed by Mitchell (2002) and Thomas et al. (2003) was in fact
based on Pusch et al. (1990), who estimated that for a sodium montmorillonite o f dry density
1730 kg/m , 94 % o f the water present in the clay would be bound to the microstructure. It
was found that this approach has greatly improved the correlation o f the numerical modelling
results with the experimentally measured results based on a series o f simulations (e.g. Thomas
et al., 2003). The approach adopted initially, to assess the validity o f the hypothesis was
simply to modify the hydraulic conductivity variation to accommodate this effect.
In the modified hydraulic conductivity relationship suggested by Thomas et al. (2003), it was
assumed that the transition o f water between macro-porosity and micro-porosity happens
instantaneously. In other words, the hydration process was considered as a process with a
much faster rate than the advective flow o f water occurs in the system.
The adsorption o f water to the micropores can be a time-dependent process as it has been
suggested by Tang and Cui (2005) suggested that this could take a number o f months.
According to the kinetic nature o f water adsorption process, Vardon (2009) proposed a
conceptual transient model for water adsorption into the interlayer and adopted this model to
modify the hydraulic conductivity. A modified form o f the hydraulic conductivity relationship
has been proposed by Vardon (2009) for high density swelling clays where the micro
structure changes over time in response to change in degree o f saturation. The modified
hydraulic conductivity relationship was used in a simulation o f non-isothermal moisture
transfer in a small scale experiment. Improvements in absolute values and perhaps more
7-30

Chapter 7 Transport Processes in Compacted Swelling Clays-Microstructural Effects
importantly, the temporal gradients, especially at the later stages were reported using the
modified hydraulic conductivity relationship.
The amount o f water which is adsorbed to the interlayer space or microspores has been
approximated in the study presented by Mitchell (2002), Thomas et al. (2003) and Vardon
(2009) and there is a real uncertainty about the amount o f interlayer water and its variation
with suction or temperature. The solid solution model proposed for hydration and dehydration
provides a unique platform, to the knowledge o f the author, for calculating the equilibrium
amount o f water which is exchanged between the inter-layer porosity (micropores) and
intralayer/interparticle (macropores). In addition, a kinetically controlled formulation can
easily be adopted to include the rate o f water exchange between two levels o f porosities, if the
kinetics parameters o f water/vapour adsorption to the interlayer are known.
In the following section, a similar approach for modification o f hydraulic conductivity due to
the interlayer water adsorption proposed by Mitchell (2002), Thomas et al. (2003) and Vardon
(2009) is adopted where the equilibrium amount o f interlayer water is calculated by the solid-
solution model. It is fully recognised that this represents a first attempt only at simulating this
behaviour. It is noted that it is assumed that the interlayer hydration/dehydration occurs
instantaneously. In other words, the process is studied under equilibrium condition,
acknowledging the fact that the process might require to be considered as a kinetically
controlled reaction in a more realistic framework.
7.6.2 Modified hydraulic conductivity relationship
Based on the preceding discussion in section 7.6.1 a conceptual model to include the effects
o f hydration/dehydration o f the interlayer on liquid water transport properties o f confined
swelling clay is presented in this section. It is assumed that the water that is available for flow
is only contained within the intralayer/interparticle porosity. In addition, it is assumed that the
water transfer between the interlayer and intralayer/interparticle is an instantaneous process.
Therefore, it is assumed that the amount o f interlayer water is always in equilibrium with total
suction and temperature in system.
7-31
Chapter 7 Transport Processes in Compacted Swelling Qays-Microstructural Effects
The basic hydraulic conductivity relationship that has been modified is based upon the
approach for M X-80 by Borgesson and Hemelind (1999) as:
* / = * * * & ) “ (?-3°)
where ki is the unsaturated hydraulic conductivity, ksat is the saturated hydraulic conductivity,
Si is the degree o f saturation and a is a parameter usually between 3 and 10 which has been
calibrated to 3 for compacted M X-80 and FEBEX bentonite by Borgesson and Hemelind
(1999) and Villar et al. (2005), respectively.
Mitchell (2002) defined a relationship for the change in hydraulic conductivity, as a first
approximation, based upon a fixed absorbed proportion, taken as 94% for a particular case
study, and the assumption that the volume o f water absorbed would be equal to the volume o f
macro-pore reduction, given as:
* /= * * » ( S / ) “ ( l-0 .9 4 S 7 ) (7.31)
Vardon (2009) extended this relationship including a time-variant absorbed/free water ratio.
The proposed relationship yields:
* I = k s a '(S i)a ( \- c o abs S ,) (7.32)
where coabs is the proportion o f pore-water absorbed, allowing for time-dependent processes in
the absorption o f pore-water into the micro-pores.
If the amount o f interlayer adsorbed water is calculated using the developed model o f
hydration/dehydration using equations (7.10), (7.13) and (7.20) which varies with suction and
temperature, equation (7.32) can be adopted as:
k i = k sat(S,)a ( \ - f IL) (7.33)
where f a is equal to the ratio o f interlayer volumetric water content ( $jL ) to the total
volumetric water content (0/):
e}Lf l l = \ (7 -3 4 )
7-32

Chapter 7 Transport Processes in Compacted Swelling Qays-Microstructural Effects
It is acknowledged that the modified hydraulic conductivity proposed here might be
contradictory with conventional understanding and observations in experimental studies that
hydraulic conductivity increases with degree o f saturation, and eventually reaches to the
saturated hydraulic conductivity. As reported in chapter 2, the results o f unsaturated hydraulic
conductivity determination in a compacted sand-bentonite by Cui et al. (2008), indicated that
under constant-volume conditions when suction was decreasing (during infiltration), the
hydraulic conductivity presented an initial decrease followed by an increase after a certain
suction which is not in agreement with the traditional understanding about the unsaturated
hydraulic conductivity variation. Cui et al. (2008) stated that wetting under constant-volume
condition reduced the volume o f macro-pore family in the soil, thus decreasing the soil
permeability. When the macropores were disappeared, the suction became the only factor
which drove the water flow and the hydraulic conductivity increased with further decrease in
suction. Mechanisms that occur in different scales o f pore size variation and the way these
affect the water transport are not fully understood in the literature. The modified relationship
proposed here is the initial step to include the effects o f the interlayer swelling on decreasing
the rate o f water flow in confined conditions.
Figure (7.10) presents an example o f the variation o f hydraulic conductivity with degree o f
saturation for compacted M X-80 at dry density o f 1600 kg/m3, calculated using the original
relationship proposed by Borgesson and Hemelind (1999) and using the modified relationship
presented in equation (7.40).
As it is seen in this figure, with increasing the degree o f saturation, hydraulic conductivity is
increased both in the relationship proposed by Borgesson and Hemelind (1999) and the
modified relationship presented in equation (7.33). However, the rate o f increase in the
hydraulic conductivity with saturation is much lower in the case o f the modified hydraulic
conductivity compared with the relationship proposed by Borgesson and Hemelind (1999).
This is due to the fact that with increasing degree o f saturation, the interlayer water increases
and tends toward the maximum value at saturated condition. As a result it reduces the
hydraulic conductivity. At low saturation degrees, the hydraulic conductivity is mainly
controlled by the power function o f the degree o f saturation {S t) and the two models yielded
same results.
7-33

Chapter 7 Transport Processes in Compacted Swelling Clays-Microstructural Effects
1: k=k sat (S i)3 (Borgesson and Hemelind, 1999)
2: k = k sal (S i)3(1-f il)1.2E-13 -
■o 8.0E-14
4.0E-14
0.0E+000 0.2 0.4 0.6 0.8 1
Degree of saturation
Figure 7.10 Variation of hydraulic conductivity of compacted MX-80 bentonite calculated using the relationship proposed by Borgesson and Hemelind (1999) and using the modified relationship
considering interlayer water effects
7.7 Simulation of isothermal and non-isothermal transfer of moisture in
compacted sm ectite clay (FEBEX bentonite)
A series o f numerical simulation o f small scale laboratory tests on moisture transfer in
compacted FEBEX bentonite has been undertaken to validate the proposed modification to
the hydraulic conductivity relatioship due to the interlayer hydration/dehydration. Two series
o f numerical simulation results are presented which include the hydraulic behaviour o f a 400
mm long cylindrical compacted FEBEX bentonite with a diameter o f 70 mm. In the first test,
the moisture transfer in compacted clay has been investigated on a sample exposed to the
infiltration o f water under isothermal condition. In the second simulation, same compacted
soil has been under the effects a simultaneous heating and hydration condition. In this test,
water was injected from one boundary whilst the soil was exposed to a constant temperature
gradient by fixing the temperature at boundaries.
7-34

Chapter 7 Transport Processes in Compacted Swelling Clays-Microstructural Effects
The simulations are based on a series o f infiltration tests performed and reported by Villar et
al. (2005) and in THERESA (2007). The experimental cell internal diameter was 70 mm and
inner length 400 mm. The compacted samples were made o f blocks o f FEBEX clay,
compacted with its hygroscopic water content (about 14 %) at a nominal dry density o f 1650
kg/m3. Granitic water was injected through the upper lid o f the cell at a pressure o f 1.2 MPa,
simulating the water that saturates the barrier in a repository excavated in granitic rock in the
Spanish concept (ENRESA, 1995). In the case o f non-isothermal test, bottom surface o f the
sample was heated at a temperature o f 100 °C, which is the temperature expected on the
surface o f the waste container in the Spanish concept (ENRESA 1995). Temperature at the
top part o f sample was fixed at constant temperature (around 20 to 30 °C). A schematic
diagram o f the setup is shown in figure 7.11.
Hydrationcircuit
Teflon»*»»» CoolingBentonite
Figure 7.11 Schematic of infiltration experimental set (Villar et al., 2005)
The samples were hydrated from the top end and in the case o f the non-isothermal test it was
heated from the bottom. Temperature and relative humidity were measured. There sensors
were located at 100, 200 and 300 mm away from the heater or hydration boundaries. The
results o f sensor measurements for up to 30,000 hours were reported by Villar et al. (2005)
7-35

Chapter 7 Transport Processes in Compacted Swelling Qays-Microstructural Effects
which are used for validation o f the numerical model and the approach adopted for modelling
the effects o f interlayer hydration/dehydration on moisture transport.
7.7.1 Model domain and time-step
As shown in figure 7.11 the bentonite cell is o f 400 mm height and 70 mm diameter. The
simulation was performed under two-dimensional framework using an axi-symmetric
analysis, as the domain is symmetrical about the vertical axis. The domain was discretised
into 300 unequally sized, 4-noded axi-symmetric elements. A denser mesh was used in the
heating boundary region in order to prevent numerical instability and improve the
convergence. The first 200 mm in the heating side (bottom) o f the sample was discretised into
equally sized 1 mm elements. For the rest o f the domain, i.e. 200 mm, equally sized 2 mm
elements were used. The simulation was performed under coupled thermal and hydraulic
framework.
A variable time-step was used, allowing the variation o f time-step depending on convergence.
Under this scheme, i f the convergence criteria are satisfied for the primary variables within a
specified numbers o f attempts, time-step is allowed to increase by a certain rate. On the other
hand, if the primary variables are not converged in a certain number o f attempts, the time-step
is reduced for the following time o f analysis. The maximum time-step and rate o f time-step
increase was considered as 500,000 seconds and 1.05, yielding more stable convergence
based on different trial values used in the simulation.
7.7.2 Material parameters
The clay studied here, i.e. FEBEX bentonite, consists mainly o f smectite clay, i.e.
montmorillonite 90-92 weight percentage (Fernandez et al. 2004). The specific gravity is 2.70
± 0.04. The liquid limit o f the bentonite is 102 ± 4% and the plastic limit is 53 ± 3%. The total
specific surface area has been determined as 725±47 m2/g. The external specific surface area,
determined by N 2 adsorption, is 62 m2/g (ENRESA, 2000; Fernandez et al., 2004). The
FEBEX bentonite has a high cation exchange capacity, i.e. CEC-1000 meq/kg o f dry soil,
(ENRESA, 2000; Fernandez et al., 2004). The total exchangeable cation (CEC) o f the FEBEX
7-36
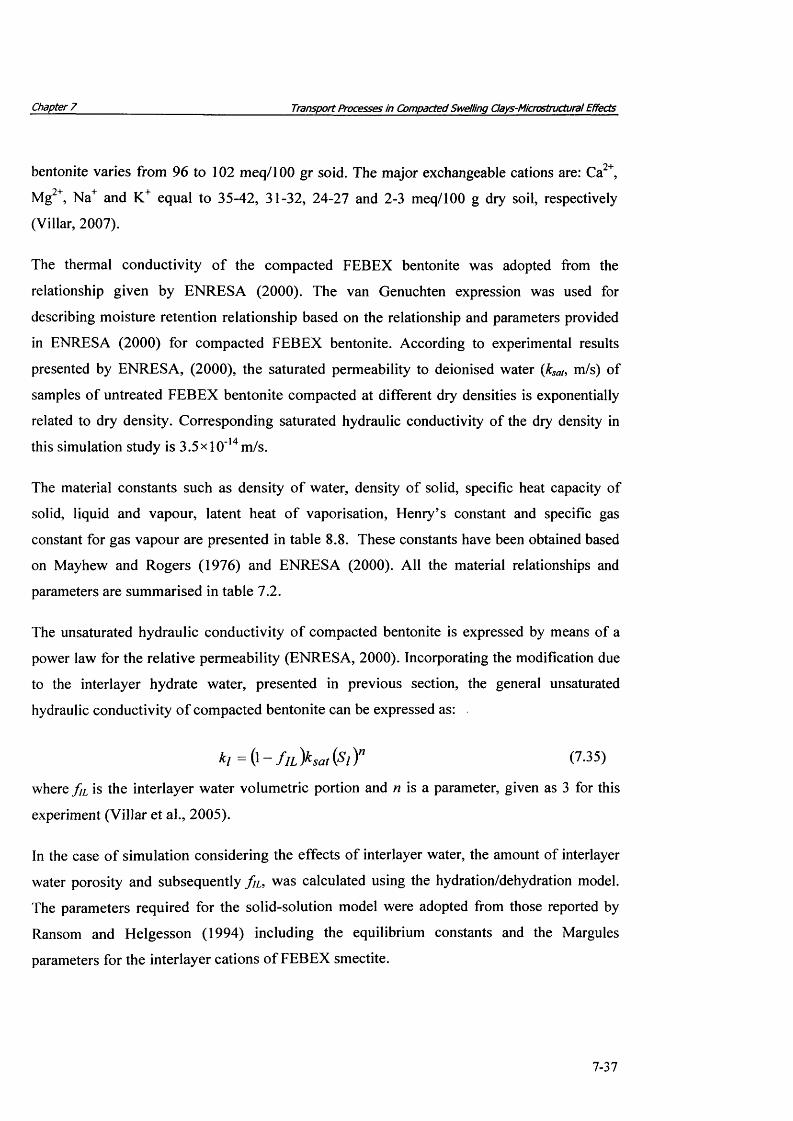
Chapter 7 Transport Processes in Compacted Swelling Clays-Microstructural Effects
bentonite varies from 96 to 102 meq/100 gr soid. The major exchangeable cations are: Ca2+,
Mg2+, Na+ and K+ equal to 35-42, 31-32, 24-27 and 2-3 meq/100 g dry soil, respectively
(Villar, 2007).
The thermal conductivity o f the compacted FEBEX bentonite was adopted from the
relationship given by ENRESA (2000). The van Genuchten expression was used for
describing moisture retention relationship based on the relationship and parameters provided
in ENRESA (2000) for compacted FEBEX bentonite. According to experimental results
presented by ENRESA, (2000), the saturated permeability to deionised water (ksat, m/s) o f
samples o f untreated FEBEX bentonite compacted at different dry densities is exponentially
related to dry density. Corresponding saturated hydraulic conductivity o f the dry density in
this simulation study is 3.5x1 O'14m/s.
The material constants such as density o f water, density o f solid, specific heat capacity o f
solid, liquid and vapour, latent heat o f vaporisation, Henry’s constant and specific gas
constant for gas vapour are presented in table 8.8. These constants have been obtained based
on Mayhew and Rogers (1976) and ENRESA (2000). All the material relationships and
parameters are summarised in table 7.2.
The unsaturated hydraulic conductivity o f compacted bentonite is expressed by means o f a
power law for the relative permeability (ENRESA, 2000). Incorporating the modification due
to the interlayer hydrate water, presented in previous section, the general unsaturated
hydraulic conductivity o f compacted bentonite can be expressed as:
* / = ( l - / / Z > * » ( S 7 ) " (7.35)
where f IL is the interlayer water volumetric portion and n is a parameter, given as 3 for this
experiment (Villar et al., 2005).
In the case o f simulation considering the effects o f interlayer water, the amount o f interlayer
water porosity and subsequently fu , was calculated using the hydration/dehydration model.
The parameters required for the solid-solution model were adopted from those reported by
Ransom and H elgesson (1994) including the equilibrium constants and the Margules
parameters for the interlayer cations o f FEBEX smectite.
7-37

Chapter 7 Transport Processes in Compacted Swelling Clays-Microstructural Effects
The theoretical solid solution model proposed by Ransom and Helgeson (1994) has been
developed for smectites with homogenous interlayer cations, e.g. Na-smectite or Ca-smectite.
In addition, Ransom and Helgeson (1994) also extended the formulation for smectite with
binary mixed ionic layers, e.g. Na/Ca-smectite. However, the application is not as technically
feasible as in the range o f applications considered in this study, since it includes difficulties
and uncertainties regarding the calculations o f mixed layer smectite. Instead, the mixed layer
smectite is here considered as a parallel system, composed o f a several different uniform-layer
smectite with a percentage o f contribution to the hydration/dehydration process by their
percentage weight in CEC.
Table 7.2 Material parameters/relationships
Parameters/relationship
T herm al con du ctiv ity :
\ “ x J
A ,= 0 .5 7 ± 0 .0 2 , A 2= 1 .2 8 ± 0 .0 3 x 0 = 0 .6 5 ± 0 .0 1 , dx= 0 .100 ± 0 .0 1 6
W ater re ten tion :
m ax
P o — 30, A.— 0.32, S/o — 0.10, Sirmax — 1.00
H ydrau lic con du ctiv ity : (m /s)
*/ = ( ! - / / / . )ksat(SiT ,log*M /= - 2 .9 6 ^ - 8 .5 7 , n = 3
D en sity o f liqu id: p i= 1 0 0 0 (k g m -3 )
D en sity o f so lid : p s= 2 7 0 0 (k g m -3 )
P o ro sity : n - 0 .4 0
S pecific h ea t c a p a c ity o f s o il so lid s: Cps= 8 7 0 (J k g -1 K -J)
S pecific h ea t c a p a c ity o f so il w a ter: Cpi = 4 180 (J kg-1 K - l)
S pecific h ea t c a p a c ity o f so il vapou: 0 ^ = 1 8 7 0 (J kg-1 K - l)
7-38

Chapter 7 Transport Processes in Compacted Swelling Clays-Microstructural Effeds
In the case o f FEBEX bentonite, the mixed Ca/Mg/Na/K system o f this clay is considered as a
composition o f homo-ionic Ca-, Mg-, Na- and K- smectites. The fraction o f each o f these
uniform smectites is obtained knowing their cation exchange ratio to the total CEC. This yield
to approximately 38.5, 31.5, 25.5 and 2.5 percents o f Ca-, Mg-, Na- and K-smectite,
respectively, based on the average values o f cation exchange composition reported by Villar
(2007). The parameters o f Ws and logKeq reported by Ransom and Helgeson (1994, 1995),
(refer to table 7.1) were incorporated in the solid solution modelling o f hydration/dehydration
o f FEBEX. The contribution o f K-smectite is neglected because o f the relatively small ratio.
The correction factors to the vapour fluxes o f the Phillip and de Vries model were applied
following the suggestions o f Melhuish (2004) and Singh (2007) as discussed in chapter 3. The
temperature induced vapour flux was modified by a factor o f 0.25 and isothermal vapour flux
by a 0.7 factor. These values were found to yield appropriate amounts o f drying. It is noted
that it is difficult to separate the moisture flow into the constitutive vapour and liquid phases
and that the calibration o f the vapour law will impact the prediction o f the hydraulic
conductivity. The calibration o f rji and rj2 is close to the values found experimentally by Sing
(2007) for a compacted sample o f M X-80 bentonite (rj]=0.16 and rji=0.6). It is noted that tj2
is o f less importance due to the lower magnitude o f the differential.
7.7.3 Initial and boundary conditions
In all o f the simulation cases the initial and boundary conditions are as shown on figure 7.12.
The initial conditions are uniform with a temperature o f 25 °C (measured) and a pore-water
pressure o f approximately - 9 0 MPa, corresponding value to the initial degree o f saturation
equal to 58.6% based on the moisture retention relationship. It is assumed that the temperature
is in equilibrium with the laboratory conditions and is equal to 298 K.
Referring to the heating/hydration cell used in the experimental work, at the radial boundary a
heat flux is required to be considered in the model representing the heat loss from the cell.
Theoretically this heat loss is equal to 2.3 W/m2/K, calculated from the PTFE casing and
foam insulation, both 15 mm thick and having thermal conductivities o f 0.25 and 0.4W/m/K
respectively (Villar et al., 2008). A lower value o f heat flux, i.e. 1.78 W/m2/K, was used in
simulation compared with the theoretically calculated value to give better correlation for
7-39

Chapter 7_______ Transport Processes in Compacted Swelling Qays-Microstructural Effects
temperature distribution with those reported in the experiment. This can be explained that in
the experimental cell, a layer o f air trapped in radial boundary o f the sample, may have
provided an extra isolation layer. In addition, the radial boundary is prescribed as being
hydraulically and chemically impermeable.
Boundary conditions:
u ,= 1 .2 x l0 6 P a
T = 2 9 8 K
I **£! .gi >I 1I 8i "ei 3! S
I 5I |I H! ^
Initial conditions:
u,= - 9 0 * l ( f P a
T = 2 9 8 K
O)C•2'Hi
•ss:©
s:
fiq
I
Boundary conditions:
d u /d x = 0
T = 2 9 8 K (iso th erm al test)
T = 3 7 3 K (non- iso therm al
Figure 7.12 Schematic of the initial and boundary conditions for TH simulation of heating andhydration test
In the case o f simulation under non-isothermal condition, at the base o f the sample the
temperature is fixed at 100 °C and is also impermeable. At the top end atmospheric
temperature was maintained (and recorded) and a pore-water pressure o f 1.2 MPa applied
after 65 hours and impermeable before (Villar et al., 2005; THERESA, 2007), as the
boundary conditions to reflect these conditions that were applied.
Two series o f analyses have been undertaken for both isothermal and non-osothermal
infiltration. The hydraulic conductivity relationship once was applied with considering
interlayer water correction factor, i.e. k t = (l - f iL )k sa t{ S iY and once without considering this
effect, i.e. k t = k sat ( S j ) n . The results for each test are compared with the experimental results,
reported by Villar et al. (2005).
7-40

Chapter 7 Transport Processes in Compacted Swelling Clays-Microstructural Effects
7.7.4 Simulation results of the isothermal infiltration test
Figure 7.13 shows the results o f a simulation o f the infiltration experiment under isothermal
condition using the modified relationship for the unsaturated hydraulic conductivity by
interlayer hydrate water, i.e. kt = ( l - / / z , )**,,(<$/)"• Figure 7.14 presents the results using the
relationship for the unsaturated hydraulic conductivity without considering interlayer hydrate
water effect, i.e.£/ = k sat(Sl )n . The temporal variations o f the relative humidity in 100, 200,
and 300 mm distance from the heater (bottom) o f the cell, resulted from the numerical
simulation and measured in the sensors during the experiment, have been presented in both
graphs.
>.
ECD>
CDa:
100
80 -
^ 60
40
20
c□
c
)c\
i
3 d] °
□
“ / " I/ J
ii
i _ j
L-" " ~ <
i _JU - " jL - - " '
__ — * — ‘ i_____________i
0 ** *\
--------- 100 mm d istance from the heater
--------- 200 mm
----------300 mm
• Exp. results-100 mm
▲ Exp. results-200 mm
□ Exp. results-300 mm
i i ---------1------------------- --------------------15000 10000 15000
Time (hours)20000 25000 30000
Figure 7.13 Profiles of degree of saturation resulted from numerical simulation using modified hydraulic conductivity relationship (lines) and laboratory experiment (symbols)-isothermal test
The comparison between the results o f these two analyses shows that the simulation using
modified hydraulic conductivity based on the proposed approach decreased the rate o f
hydration front. In the bottom boundary (300 mm from the injection water side or 100 mm
from the heater), modelling with the original hydraulic conductivity over-predicted the
relative humidity in comparison with the measured data. Flowever, the results o f the
7-41

Chapter 7 Transport Processes in Compacted Swelling Clays-Microstructural Effects
numerical modelling using the modified hydraulic conductivity are in good quantitative
agreement with the experimental results at this point in the sample.
100
80 -
60
■7R 40
20 -
-gE3-C<1)>To(DOH
___ „
j____________ _ E
_- —L - r . ' ! ..... a
] _____
a
, o
\ \ A
!A
I "*
[*
*
4*
► •
In / «
►
►
200 mm 300 mm
• Exp. results-100 mm▲ Exp. results-200 mm□ Exp. results-300 mm
5000 10000 15000
Time (hours)
20000 25000 30000
Figure 7.14 Profiles of degree of saturation resulted from numerical simulation using original hydraulic conductivity (lines) and laboratory experiment (symbols)-isothermal test
In the case o f the middle sample sensor (200 mm away from heater or hydration side), a
similar trend is also observed where modelling with the modified hydraulic conductivity
relationship has yielded better agreement with the experiment. However, in the case o f the
sensor located at the 100 mm from the hydration side, under-prediction is seen in the results
o f the modelling using the modified hydraulic conductivity. In the modelling using the
modified hydraulic conductivity, with increasing the degree o f saturation, the fraction o f the
volume o f the soil occupied by the interlayer hydrate water to the total water volume is
increased which results to the decline o f the rate o f saturation and water movement. This
mechanism has reduced the overall saturation rate o f the sample in comparison with the
modelling using the original hydraulic conductivity.
At the bottom end and the middle o f the sample, i.e. 100 mm and 200 mm distance from the
water injection point, the rate o f water from the simulation using the original hydraulic
7-42

Chapter 7 Transport Processes in Compacted Swelling Clays-Microstructural Effects
conductivity is greater than the results o f the modelling with the modified hydraulic
conductivity. The results o f simulation with the modified hydraulic conductivity have shown
a closer agreement with the experimental results compared with those obtained from the
simulation using the original hydraulic conductivity model. The results indicate that the
saturation o f the sample might occur at a greater rate than that observed in the experiment if
the original hydraulic conductivity is used. However, lower rate o f saturation can be achieved
via the proposed model which is in agreement with the experimental observation. This is an
important issue to estimate the re-saturation o f the compacted clay buffer which in fact is
related to the corrosion o f the canister. Application o f the modified hydraulic conductivity via
the proposed hydration/dehydration model offers a good correlation with the experimental
bench mark, improving the confidence for further applications o f the model.
7.7.5 Simulation results of the non-isothermal infiltration test
Figure 7.15 shows the simulation results o f the infiltration experiment under thermal gradient
using the modified relationship for the unsaturated hydraulic conductivity by interlayer
hydrate water, i.e. kt = (l - fn )k sat{S if • Figure 7.16 also presents the results using the original
relationship for the unsaturated hydraulic conductivity without considering interlayer hydrate
water effect, i.e .£ , = k sat(S j)n . The temporal variations o f the relative humidity in 100, 200,
and 300 mm distance from the heater (bottom) o f the cell, resulted from the numerical
simulation and measured in the sensors during the experiment have been presented in both
graphs.
The results o f modelling using the modified hydraulic conductivity are qualitatively and to
some extend quantitatively in good agreement with the experimental results compared with
the simulation results using the original hydraulic conductivity. Especially close to the heater,
i.e. sensor 3, modelling using the original hydraulic conductivity has highly over-predicted
the relative humidity (and moisture content). In the other two locations, i.e. sensors 1 and 2, it
is also observed that the original hydraulic conductivity has predicted higher relative humidity
than those resulted from the modified relationship. At the hydration side the original hydraulic
conductivity relationship and the modified relationship with fixed hydraulic conductivity at
saturation, seem to maintain a good fit with the experimental results.
7-43
Chapter 7 Transport Processes in Compacted Swelling Clays-Microstructural Effects
100
80
■gE3_C
60
a)>
40
100 mm distance from the heater 200 mm 300 mm• Exp. results-100 mma Exp. results-200 mm□ Exp. results-300 mm
20
0 5000 10000 15000 20000 25000 30000
Time (hours)
Figure 7.15 Profiles of degree of saturation resulted from numerical simulation using modified hydraulic conductivity (lines) and laboratory experiment (symbols)-non-isothermal test
Similar to the non-isothermal case, variation o f the interlayer water has reduced the rate o f
water migration towards the heater in the modelling with the modified hydraulic conductivity.
Importantly the gradients o f the relative humidity (and moisture content) with respect to time
at the end o f the analysis are much improved using the modified hydraulic conductivity which
gives more confidence to long term predictive simulations. In fact the modelling results o f the
isothermal condition using the modified hydraulic conductivity relationship seem to simulate
the quantitative and qualitative results well with the important aspect for long term analyses,
where the overall saturation o f the sample in o f the prediction interest.
In the example simulations presented on hydraulic and thermo-hydraulic behaviour o f
compacted bentonite, the microstructure effects due to the interlayer hydration/dehydration
was investigated via the proposed model and the modified unsaturated hydraulic conductivity.
As an attempt for coupling between microstructure evolution and macroscopic behaviour, the
developed model showed a very good correlation with experimental results.
7-44

Chapter 7 Transport Processes in Compacted Swelling Clays-Microstructural Effects
100
-1 0 0 mm distance from the heater------ - 2 0 0 mm
- 3 0 0 mm• Exp. results-100 mm▲ Exp. results-200 mm□ Exp. results-300 mm
0 -|--------------------------1---------------------------1--------------------------1--------------------------r--------------------------i-------------------------
0 5000 10000 15000 20000 25000 30000
Time (hours)
Figure 7.16 Profiles of degree of saturation resulted from numerical simulation using original hydraulic conductivity (lines) and laboratory experiment (symbols)-non-isothermal test
7.8 Conclusions
This chapter presents an approach for modelling the hydration/dehydration process and
evaluating the pore water physical evolution in compacted smectite clays based on a
geochemical solid solution concept. Utilising the model proposed in this section, the amount
o f interlayer adsorbed water can be calculated based on a thermodynamic solid solution
approach. In addition, the developed model is capable o f estimating the interlayer water
content variation for a given bentonite at different suctions and temperatures.
The model presented for hydration/dehydration o f smectite provides a flexible computing
platform for evaluation the interlayer and inter/intra-aggregate porosity or pore water under
the variable conditions o f suction and temperature. This can help to model the hydraulic and
chemical transport processes in compacted swelling clay where the water physical properties
7-45

Chapter 7 Transport Processes in Compacted Swelling Clays-Microstructural Effects
differ in micro pore scale to that in messo/macro pore scale and the ratio o f the interlayer to
the intralayer/interparticle porosity is considerable at high dry densities.
The hydration/dehydration model was adopted for the case o f a compacted sodium bentonite,
i.e. MX-80. The solid solution model estimates the water distribution in micro and
messo/macro levels in saturated M X-80 compacted at different dry densities, in agreement
with those estimated and reported in the literature. In addition, the variation o f the interlayer
water content in comparison with total water content, demonstrates that even at high suction
values, there is a possibility o f coexistence o f the water in the interlayer and intralayer space.
Solid solution model also showed that variation in temperature can also induce water transfer
between the interlayer and intralayer or interparticle. In fact, in compacted bentonite under
repository condition, which is exposed to high temperature, an exchange o f water between the
interlayer and intralayer or interparticle porosity provides a higher risk o f water and chemical
movements in the area close to the heater where higher free water might exists due to this
mass exchange.
The microstructure evolution through the interlayer hydration and swelling under confined
condition has the potential to delay the re-saturation o f the buffer material. This process may
change the time when the canister may begin to corrode, which is significant for performance
assessment. A modified form o f the hydraulic conductivity relationship has been proposed for
materials where the micro-structure changes in response to changes in suction and
temperature. This is o f relevance for high density swelling clays that are proposed to be used
in waste isolation. Modification to the existing concept o f the modified unsaturated hydraulic
conductivity relationships is presented which allows the inclusion o f the solid solution model
for hydration/dehydration o f smectite to be used to calculate the corresponding values o f the
interlayer porosity.
Two series o f small scale experiments on moisture transfer in compacted bentonite under
isothermal condition and under thermal gradient have been utilised to compare the modified
unsaturated hydraulic conductivity relationship against a standard relationship. The results o f
the modelling using the modified relationship indicate improvements against the ‘standard’
relationship. In particular, the behaviour o f the highly compacted bentonite in the long term is
improved, i.e. the gradients o f saturation were improved which may in turn yield significantly
7-46

Chapter 7_________________________________Transport Processes in Compacted Swelling Clays-Microstructural Effects
improved long term predictions. This gives increased confidence in longer term predictions
made using numerical simulation.
7-47
Chapter 7 Transport Processes in Compacted Swelling Clays-Microstructural Effects
7.9 References
Bourg, I.C., Bourg, A.C.M., and Sposito, G. (2003). Modeling diffusion and adsorption in
compacted bentonite: a critical review. Journal o f Contaminant Hydrology, 61, 293-302.
Bourg, I.C. (2004). Tracer diffusion o f water and inorganic ions in compacted saturated
sodium bentonite, PhD Thesis, University o f California, Berkeley, USA.
Bourg, I.C., Sposito, G., and Bourg, A.C.M. (2006). Tracer diffusion in compacted, water-
saturated bentonite. Clays and Clay Minerals, 54 (3), 363-74.
Borgesson, L., and Hemelind, J. (1999). Preliminary modelling o f the water saturation phase
o f the buffer and backfill materials, SKB, IPR-00-11, Stockholm.
Cuadros, J. (1997). Interlayer cation effects on the hydration state of smectite. American
Journal o f Science, 297, 829-41.
Cui, Y.J., Tang, A.M., Loiseau, C., and Delage, P. (2008). Determining the unsaturated
hydraulic conductivity o f a compacted sand-bentonite mixture under constant-volume and
free-swell conditions. Physics and Chemistry o f the Earth, Parts A/B/C, 33 (Supplement 1),
S462-S71.
C ui, Y.J., Yahia-Aissa, M., and Delage, P. (2002). A model for the volume change behavior
of heavily compacted swelling clays. Engineering Geology, 64, 233-250.
Delage, P., Marcial, D., Cui, Y.J., and Ruiz, X. (2006). Ageing effects in a compacted
bentonite: a microstructure approach. Geotechnique, 56(5), 291-304.
Derjaguin, B.V., Churaev, N.V., and Muller, V.M. (1987). Surface Forces. Plenum, New
York.
ENRESA. (1995). Almacenamiento Geologico Profundo de Residuos Radiactivos de Alta
Actividad (AGP), Disehos Conceptuales Genericos. Technical Publication ENRESA 11/95,
Madrid.
ENRESA. (2000). Full-scale engineered barriers experiment fo r a deep geological
repository fo r high-level radioactive waste in crystalline host rock, FEBEX project. EUR
19147, Nuclear Science and Technology Series, European Communities, Luxembourg.
7-48

Chapter 7 Transport Processes in Compacted Swelling Oays-Microstructura! Effects
Fernandez, A.M., Baeyens, B., Bradbury, M., and Rivas, P. (2004). Analysis of the pore
water chemical composition of a Spanish compacted bentonite used in an engineered barrier.
Physics and Chemistry o f the Earth, 29, 105-118.
Fredlund, D.G., and Rahardjo, H. (1993). Soil Mechanics fo r Unsaturated Soils. John Wiley
and Sons Inc., New York.
Gailhanou, H., van Miltenburg, J.C., Rogez J., Olives, J., Amouric, M., Gaucher, E.C., and
Blanc, P. (2007). Thermodynamic properties o f anhydrous smectite MX-80, illite IMt-2 and
mixed-layer illite-smectite ISCz-1 as determined by calorimetric methods. Part I: Heat
capacities, heat contents and entropies. Geochimica et Cosmochimica Acta, 7, 5463-5473.
Hueckel, T.A., Loret, B., and Gajo, A. (2002), Expansive clays as two-phase, deformable,
reactive cotinua: Cocepts and modeling options, In Chemo-Mechanical Coupling in Clays;
From Nano-Scale to Engineering Applications, Bulkema Publisher, 105-20.
Iwata, S., Tabuchi, T., and Warkentin, B.P. (1995). Soil-Water Interactions: Mechanisms and
Applications, 2nd edition, Marcel Dekker, New York.
Jacinto, A.C., Villar. M.V., Gomez-Espina, R., and Ledesma, A. (2009). Adaptation of the
van Genuchten expression to the effects of temperature and density for compacted
bentonites. Applied Clay Science, 42, 575-82.
Johansen, R.T., and Dunning, H.N. (1959). Water-vapor adsorption on clays. Clays and Clay
Minerals, 23, 249-258.
Keren, R., and Shainberg, I. (1975). Water vapour isotherms and heat of immersion Na/Ca-
montmorilIonite systems I: Homoionic clay. Clays and Clay Minerals, 23, 193-200.
Kozaki, T., Fujishima, A., Sato, S., and Ohashi, H. (1998). Self-diffusion of sodium ions in
compacted sodium montmorillonite. Nuclear Technology, 121, 63-69.
Kozaki, T., Saito, N., Fujishima, A., Sato, S., and Ohashi, H. (2001). Diffusion mechanism of
chloride ions in sodium montmorillonite. Journal o f Contaminant Hydrology, 47, 159-70.
Langmuir, D. (1997). Aqueous Environmental Geochemistry. Prentice Hall.
Likos, W.J. (2004). Measurement o f crystalline swelling in expansive clay. Geotechnical
Testing Journal, 27 (6), 1-7.
7-49

Chapter 7 Transport Processes in Compacted Swelling Clays-Microstructural Effects
Liu, C.W., and Lin, W.S. (2005). A smectite dehydration model in a shallow sedimentary
basin: model development. Clays and Clay Minerals, 53 (1), 55-70.
Liu, J., Yamada, H., Kozaki, T., Sato, S., and Ohashi, H., (2003). Effect of silica sand on
activation energy for diffusion of sodium ions in montmorillonite and silica sand mixture.
Journal o f Contaminant Hydrology, 61, 85-93.
Ma, C., and Hueckel, T. (1992). Stress and pore pressure in saturated clay subjected to heat
from radioactive waste: a numerical simulation. Canadian Geotechnical Journal, 29, 1087-
1094.
Mayhew, Y.R., and Rogers, G.F.C. (1976). Thermodynamic and Transport Properties o f
Fluids. 2nd edition, Oxford: Blackwell.
Melhuish, T.A. (2004). An investigation o f the three-dimensional thermo/hydro/ mechanical
behaviour o f large scale in-situ experiments. PhD Thesis, Cardiff University.
Mitchell, H.P. (2002). An investigation into the thermo/hydro/mechanical interactions
involved in high level nuclear waste disposal. PhD Thesis, University of Wales, Cardiff.
Montes-H, H., Duplay, J., Martinez, Gerauda, L, and Rousset-Toumiera, B.(2003).Influence
of interlayer cations on the water sorption and swelling-shrinkage of MX80 bentonite.
Applied Clay Science, 23, 309-321.
Mooney, R.W., Keenan, A.C., and Wood, L.A. (1952). Adsorption of water vapour by
montmorillonite, II: effect o f exchangeable ions and lattice swelling as measured by x-ray
diffraction. Journal o f American Chemical Society, 74, 1371-1374.
Philip, J.R., and de Vries, D.A. (1957). Moisture movements in porous materials under
temperature gradients. Transactions American Geophysical Union, 38(2), 222-232.
Pusch, R. (1998). Microstructural evolution of buffer clay. Proceedings o f workshop on
microstructural modelling o f natural and artificially prepared clay soils with special
emphasis on the use o f clays fo r waste isolation. Lund, 31-38.
Pusch, R., Karnland, O., and Hokmark, H. (1990). GMM: a general microstructural model
for qualitative and quantitative studies o f smectite clays, SKB, Technical Report, SKB-90-
43, Stockholm.
7-50

Chapter 7 Transport Processes in Compacted Swelling Clays-Microstructural Effects
Pusch, R., and Yong, R.N. (2006). Microstructure o f Smectite Clays and Engineering
Performance. Taylor and Francis, New York.
Ransom, B., and Helgeson, H.C. (1994). A chemical and thermodynamic model of
aluminous dioctahedral 2:1 layer clay minerals in diagnetic processes: Regular solution
representation of interlayer dehydration in smectite, American Journal o f Science, 294, 449-
484.
Ransom, B., and Helgeson, H.C. (1995). A chemical and thermodynamic model of
aluminous dioctahedral 2:1 layer clay minerals in diagnetic processes: Dehydration of
dioctahedral aluminous smectites as a function of temperature and depth in sedimentary ',
American Journal o f Science, 295, 245-281.
Salles, F., Douillard, J.-M., Denoyel, R., Bildstein, O., Jullien, M., Beurroies, I. and Van
Damme, H. (2009). Hydration sequence of swelling clays: Evolutions of specific surface area
and hydration energy, Journal o f Colloid and Interface Science, 333(2), 510-522.
Singh, R.M. (2007). An experimental and numerical investigation o f heat and mass
movement in unsaturated clays. PhD Thesis, Cardiff University, Wales, UK.
Tang, A.M., and Cui, Y.J. (2005). Controlling suction by the vapour equilibrium technique at
different temperatures and its application in determining the water retention properties of
MX-80 clay. Canadian Geotechnical Journal, 42, 287-96.
Tang, A.M., and Cui, Y.J. (2010). Effects of mineralogy on thermo-hydro-mechanical
parameters of MX80 bentonite. Journal o f Rock Mechanics and Geotechnical Engineering, 2
(1), 91-96.
Tardy, Y. (1990). Gibbs free energy o f formation of hydrated and dehydrated clay minerals.
2nd International Symposium on Geochemistry o f the Earth's Surface and o f Mineral
Formation. Aix en Provence, France, 255-258.
Thomas, H.R., Cleall, P.J., Chandler, N., Dixon, D., and Mitchell, H.P. (2003). Water
infiltration into a large-scale in-situ experiment in an underground research laboratory.
Geotechnique, 53(2), 207-224.
Thomas, H.R., Cleall, P.J., Dixon, D., and Mitchell, H.P. (2009). The coupled thermal-
hydraulic-mechanical behaviour of a large-scale in situ heating experiment. Geotechnique,
59(4), 401-413.
7-51
Chapter 7 Transport Processes in Compacted Swelling Clays-Microstructural Effects
van Genuchten, M.Th. (1980). A closed-form equation for predicting the hydraulic
conductivity o f unsaturated soils. Soil Science Society o f America Journal, 44, 892-898.
Vardon, P.J. (2009). A three-dimensional numerical investigation o f the therm-hydro-
mechanical behaviour o f a large-scale prototype repository. Ph.D. Thesis, Cardiff
University, Wales, UK.
Vidal, O., and Dubacq, B. (2009). Thermodynamic modelling of clay dehydration, stability
and compositional evolution with temperature, pressure and H2O activity. Geochimica et
Cosmochimica Acta, 73(21), 6544-6564.
Villar, M.V. (2007). Water retention o f two natural compacted bentonites. Clays and Clay
Minerals, 55(3), 311-322.
Villar, M.V., Martin, P.L., and Barcala, J.M. (2005). Infiltration tests at isothermal
conditions and under thermal gradient. CIEMAT, Technical Report CIEMAT/DMA
/M2140/1/05, Madrid.
7-52

Chapter 8______ Numerical Simulation of the Coupled THC Behaviour of Compacted Bentonite
Chapter 8
Numerical Simulation of the Coupled Thermal, Hydraulic and Chemical Behaviour of Compacted Bentonite
8-1

Chapter 8 Numerical Simulation of the Coupled THC Behaviour of Compacted Bentonite
8.1 Introduction
This chapter presents the results o f the simulation of a heating and hydration experiment
carried out by CIEMAT, Spain, on compacted FEBEX bentonite clay as part of a major
research study in the framework o f FEBEX project (ENRESA, 1998; ENRESA, 2000,
ENRESA, 2006). The simulation presented in this chapter aimed to investigate the thermal,
hydraulic and geochemical behaviour o f compacted bentonite subjected to simultaneous
heating and hydration condition, representing the boundary conditions of the buffer material
in the geological disposal of HLW. In addition, this simulation exercise will be used to test
and validate the model for complex and coupled behaviour which is achieved by comparing
the results of the heating and hydration experiments with those obtained from the numerical
simulation.
The simulation o f the heating and hydration is based on a series of experiments, reported by
Villar et al. (2007); Villar et al. (2008a); Villar et al. (2008b) and Fernandez and Villar
(2010). In these experimental investigations, the FEBEX bentonite samples, compacted at dry
density of 1660 kg/m3, were hydrated from the top while a thermal gradient was applied
sourcing from the bottom of the cell. A large scale and laterally gas- and water-tight
experimental cell with an inner length o f 600 mm and internal diameter of 70 mm has been
used to conduct the experiment for different periods of time ranging from 0.5 to 7.6 years. At
the bottom part o f the cells a constant temperature of 100 °C was set. This temperature is
expected at the surface o f the waste container in the Spanish disposal concept (ENRESA,
1995). On top o f the cell, temperature was controlled and fixed at room temperature (around
20-30 °C) using a circulation water tank. The water was injected through the upper surface
under a pressure o f 1.2 MPa. The injected solution was granitic water with 0.2 % salinity,
simulating the water that is likely saturate the barrier in a repository excavated in granitic rock
under the Spanish repository concept (ENRESA, 1995). Figure 8.1 shows a schematic
diagram of the experimental setup.
Seven experimental tests were conducted in the mentioned cells which included 0.5, 1, 2 and
7.6 years lasting experiments under the mentioned conditions. Temperature in different
positions along the bentonite column and water intake were measured and monitored during
the tests. At the end o f the thermo-hydraulic treatment for each test, the cell was disassembled
and the clay columns extracted, weighed and sub-sampled. The experiments were followed by
8-2
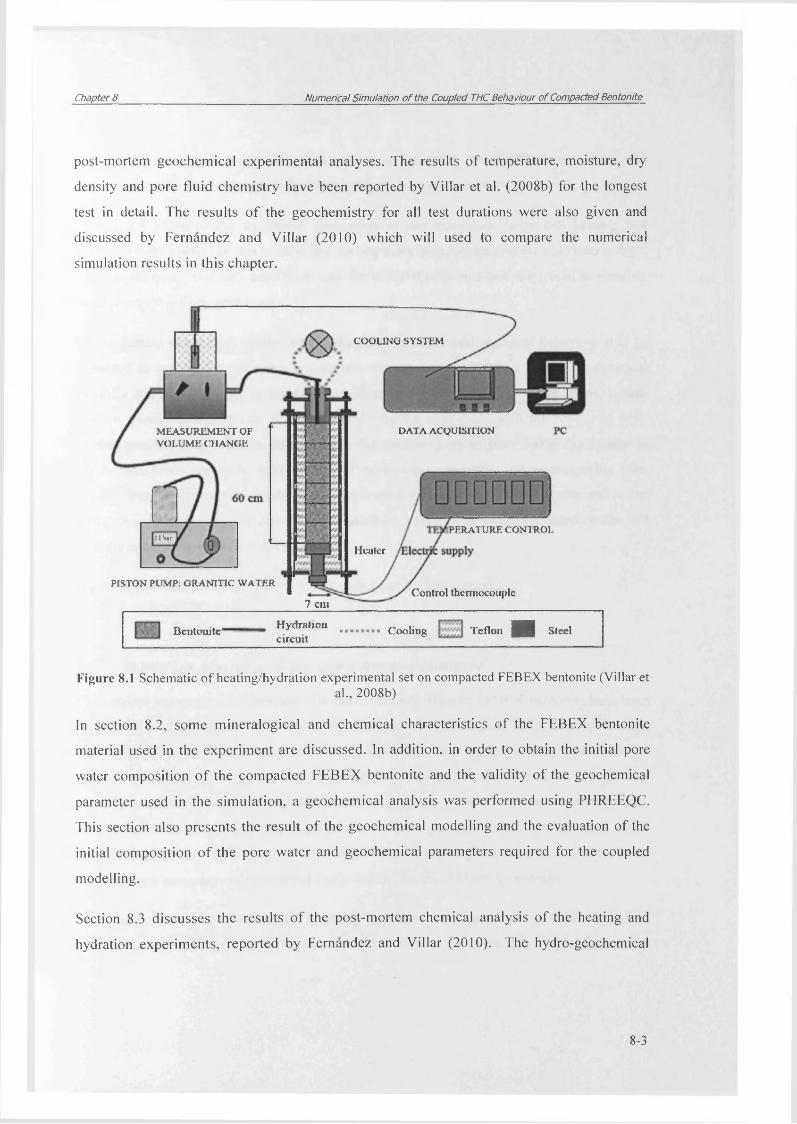
Chapter 8 Numerical Simulation of the Coupled THC Behaviour of Compacted Bentonite
post-mortem geochemical experimental analyses. The results o f temperature, moisture, dry
density and pore fluid chemistry have been reported by Villar et al. (2008b) for the longest
test in detail. The results o f the geochemistry for all test durations were also given and
discussed by Fernandez and Villar (2010) which will used to compare the numerical
simulation results in this chapter.
Figure 8.1 Schematic o f heating/hydration experimental set on compacted FEBEX bentonite (Villar etal., 2008b)
In section 8.2, some mineralogical and chemical characteristics o f the FEBEX bentonite
material used in the experiment are discussed. In addition, in order to obtain the initial pore
water composition o f the compacted FEBEX bentonite and the validity o f the geochemical
parameter used in the simulation, a geochemical analysis was performed using PHREEQC.
This section also presents the result o f the geochemical modelling and the evaluation o f the
initial composition o f the pore water and geochemical parameters required for the coupled
modelling.
Section 8.3 discusses the results o f the post-mortem chemical analysis o f the heating and
hydration experiments, reported by Fernandez and Villar (2010). The hydro-geochemical
COOLING SYSTEM
DATA ACQUISITIONMEASUREMENT OF VOLUME CHANGE
rPERATURB CONTROLi i b u
Heater
PISTON PUMP: GRANITIC WATERControl thermocouple
7 cm
Bentonite' Hydrationcircuit
Cooling Teflon H Steel
8-3

Chapter 8 Numerical Simulation of the Coupled THC Behaviour of Compacted Bentonite
post-mortem results are presented which will be used to check the numerical simulations and
also to assist with the explanation the complex behaviour of the system.
Section 8.4 presents the numerical simulation of the mentioned large cell heating and
hydration experiment. In this section, the assumptions, material parameters and relationships,
initial conditions, boundary conditions and the material constants that were used to simulate
the experiment will be presented.
The numerical simulation results for temperature, moisture and chemical behaviour will be
presented in section 8.5. In order to compare the numerical modelling results for chemical
variables and geochemistry o f the system with those reported from the experiments, a post
mortem geochemical analysis is required. Section 8.6 also deals with the results of post
mortem geochemical analysis. Accordingly, the geochemistry of pore water-clay system in
the domain including ionic composition o f pore water, minerals and exchangeable ions,
resulted from the numerical model and experimental data provided by Fernandez and Villar
(2010) is presented and discussed. Where available, comparisons of the simulated results will
be made against the experimental results.
Section 8.6 presents a summary and conclusion from the above work.
8.2 FEBEX b en ton ite and th e pore w ater chem istry
The detailed mineralogical, physical and chemical properties of FEBEX bentonite have been
extensively studied and can be found in the literature (e.g. ENRESA, 2000; Fernandez et al.,
2001; Fernandez et al., 2004). The FEBEX bentonite, used in the heating and hydration
experiment consists, mainly of smectite clay, i.e. montmorillonite (90-92 wt. %). It also
contains numerous accessory minerals (Fernandez et al. 2004). Some accessory minerals,
such as carbonates, chlorides and sulphates, have been identified in FEBEX bentonite which
might influence on the chemistry evolution of the pore water (Fernandez et al. 2004). Table
8.1 presents a summary o f the mineral composition of typical FEBEX bentonite.
The specific gravity o f the FEBEX bentonite has been reported as 2.70 ± 0.04. The liquid
limit of the bentonite is 102 ± 4% and the plastic limit is 53 ± 3%. The hygroscopic water
8-4

Chapter 8 Numerical Simulation of the Coupled THC Behaviour of Compacted Bentonite
content in equilibrium with the laboratory atmosphere is 13.7 ± 1.3%. The total specific
surface area has been determined as 725±47 m2/g. The external specific surface area,
determined by N 2 adsorption, is 62 m2/g (ENRESA, 2000; Fem&ndez et al., 2001; Fem&ndez
et al., 2004).
Table 8.1 Major main and accessory mineral contents o f FEBEX bentonite (Fernandez et al., 2004)
M a in m in e r a ls w t % A c c e sso ry m in era ls w t %
S m ectite 9 2 ± 3 O rg a n ic m a tte r (as C O 2) 0 .35± 0 .05
Q u artz 2±J C a rb o n a te s (ca lc ite , do lom ite) 0.60±0.13
P la g io c la se 2±1 S o lu b le su lp h a tes (gypsum ) 0.14±0.01
C r is to b a lite 2± 1 L ow so lu b le su lph a tes (barite, ce lestite ) 0 .12±0 .05
C h lo rid es (halite) 0.13 ±0 .02
The FEBEX bentonite has a high cation exchange capacity, i.e. CEC~1000 meq/kg of dry
soil, (ENRESA, 2000). Table 8.2 shows the exchangeable cation composition of FEBEX
bentonite. Based on the average values o f the exchangeable cations shown in table 8.2, the
FEBEX bentonite can be represented as a Ca/Mg/Na smectite.
Table 8.2 Average values o f cation exchange complex composition o f the FEBEX bentonite
ca tio n e x c h a n g e a b le
(m eq /kg so il)
E N R E S A ,(2 0 0 0 )
F ern an dez e t al. (2001)
F ern andez e t al. (2004)
C a2+ 4 2 0 346 .2 3 31 .0
3 2 0 340.1 331 .5
Na* 2 5 0 31 1 .8 2 69 .5
K / 25 19.4 22 .9
S r2' 0 0 4.3
C E C 1002 1020 959 .2
The initial gravimetric water content o f the bentonite sample for the previously-referred
heating and hydration experiment is approximately 14%. At such low water content, it is
difficult to extract the pore water even by the squeezing technique (Fernandez et al. 2001).
8-5

Chapter 8 Numerical Simulation of the Coupled THC Behaviour of Compacted Bentonite
Hence, there is no experimental information available as regards the initial conditions of the
pore water chemistry o f bentonite in this range of compaction. An alternative solution is to
simulate the pore water chemistry using a geochemical model knowing necessary material
parameters such as selectivity coefficients and mineral composition and by using realistic and
available thermodynamic constants. Employing geochemical modelling, the pore water
composition o f the FEBEX bentonite at different dry densities has been investigated and
reported in the literature (e.g. ENRESA 1998; ENRESA 2000; Fernandez et al., 2001;
Ferndndez et al., 2004; Seetharam, 2003; Cleall et al., 2007).
The pore water chemistry o f FEBEX bentonite compacted at dry density of 1650 kg/m was
modelled using PHREEQC version 2.17, in order to obtain the composition of the initial pore
water, mineral and exchangeable ions which were applied in the numerical model. This also
assisted with validating the geochemical parameters used in the numerical model. This was a
necessary step to establish a sound geochemical modelling approach before proceeding with
any coupled modelling.
Geochemical modelling o f pore water o f FEBEX bentonite was conducted at two different
solid/water ratios including:
• Solid/water ratio o f 100/14, (w =14 %), representing the initial condition of the
compacted bentonite
• Solid/water ratio o f 1/4 (w = 400 %), the water content at which the experimental post
mortem chemical analyses were conducted (Fernandez and Villar, 2010). The results
associated with this water content represent the reference condition of the post
mortem geochemical results for comparison or further discussions.
The geochemical analysis for evaluating the initial/reference pore water composition of
the FEBEX bentonite was performed using PHREEQC version 2. Following ENRESA
(2000) and Fernandez et al. (2001), the geochemical processes that have been considered
for the geochemical modelling of the initial pore water in this study can be given as:
• Dissolution-precipitation o f minerals including calcite, halite and gypsum
8-6
Chapter 8 Numerical Simulation of the Coupled THC Behaviour of Compacted Bentonite
• Ion exchange reactions including sodium, calcium, magnesium and potassium
exchangeable ions
• Equilibrium with atmospheric CO2 partial pressure i.e. Pco2 ~10‘3 5
It was also assumed that the clay mineral is thermodynamically stable at pH values between 7
and 11 (Fernandez et al., 2001).
The steps which were followed in the geochemical modelling of the initial pore water
composition can be described as:
1. Definition o f the initial condition: including the amounts of the mentioned soluble
minerals o f bentonite, and the content o f exchangeable cations of the smectite. The initial
values were adopted from those used for a similar simulation by Fem&ndez et al. (2001).
Table 8.3 presents the initial values o f accessory mineral and exchangeable cations in the
model.
2. Determination o f the thermodynamics o f mineral reactions and selectivity coefficients for
the exchange reactions. The values o f selectivity coefficients for exchange reaction
reported by Fernandez et al. (2001) were employed. For mineral reactions the data-base of
phreeqc.dat o f PHREEQC version 2.17 (Parkhurst and Appelo, 1999) was used. A
summary o f the equilibrium constants for the ion exchange reactions is presented in table
8.4. The thermodynamics parameters o f mineral reaction are also given in table 8.5.
3. Equilibration o f the whole system with pure water with pH 7.72.
The results o f geochemical modelling the pore water composition o f the FEBEX bentonite in
equilibrium with distilled water are presented in table 8.6 at two gravimetric water contents of
0.14 and 4. The results o f a similar modelling by Fernandez et al. (2001) corresponding to the
water content o f 0.14 is also presented for comparison. In the case of initial pore-water
chemistry o f bentonite with the water content o f 4, the aqueous extract results reported by
Fernandez et al. (2004) and Fernandez and Villar (2010) are also provided by means of
comparison.
8-7

Chapter 8 Numerical Simulation of the Coupled THC Behaviour of Compacted Bentonite
Table 8.3 Average values of accessory minerals and cation exchange complex of the FEBEX bentonite adopted in pore water geochemical analysis from Fernandez et al. (2001)
Mineral/Exchangeable , , ...________________ ______________(mol/kg dry soil)
C a lc ite 0 .060
G ypsu m 0 .010
H a lite 0 .022
C a -X 2 0.171
M g - X 2 0 .167
N a -X 0.304
K - X 0 .019
Table 8.4 Equilibrium constants o f ion exchange reactions for the FEBEX bentonite adopted fromFernandez et al. (2001)
Cation exchange reactions Log Keq at 25 °C
N a -X = N a + X 0 .0
C a -X 2= C a 2' + 2 X 0.774
M g - X ^ M g 2' + 2 X 0.655
K -X = K ' + X 0 .878
Table 8.5 Thermodynamic parameters used for dissolution/precipitation of minerals adopted from p h r e e q c .d a t data-base o f PHREEQC version 2 (Perkhurst and Appelo, 1999)
Thermodynamic dataMineral reactions
Log Keq at2 5 °C
AHr° (kcal)
A n h yd rite C a S O j= C a 2' + S O / ' -4 .3 6 0 -1 .7 1 0
G ypsu m C a S 0 p 2 H 20 = C a 2i + S O / + 2H 20 -4 .5 8 0 -0 .109
H a lite N a C l= N a ' + C l 1.582 0 .918
C a lc ite C a C 0 3= C a 2* + C O s2' -8 .4 8 0 -2 .2 9 7
8-8

Chapter 8 Numerical Simulation of the Coupled THC Behaviour of Compacted Bentonite
The results show that the initial concentration of ions at a water content of 14 % is different
from those resulted for at water content of 400 %equal to 1/4 aqueous extract results, with the
exception of chloride ion that the total molar mass of chloride per unit weight of the soil
remains constant. It has also been found experimentally that unlike other ions which might be
influenced by precipitation-dissolution and ion exchange reactions, the chloride ions vary
linearly as a function o f the solid/liquid ratio (ENRESA, 2000; Femdndez et al., 2001).
A close agreement can be seen between the results this study and those reported by Fem&ndez
et al. (2001). From the results presented in table 8.6, it can be observed that the modelled
results agree very closely with the experimental results of aqueous extraction, with the
exception o f magnesium. This could be attributed to the modelling assumption where only
carbonate mineral was considered in the precipitation/dissolution reaction whilst FEBEX
bentonite contains both calcite and dolomite. Nevertheless, there is a general agreement
between the modelled and experimental results.
Table 8.6 The results o f geochemical analysis o f pore fluid composition for the FEBEX bentonite attwo solid/water ratios
soil/water ratio=100/14 soil/water ratio=l/4water content=14% water content=400%
FEBEX Bentonitepore water composition P H R E E Q C
This s tu d y
P H R E E Q C b y F ern an dez e t al. (2001)
P H R E E Q C
This stu dy
E xperim entalresu lts
F ern andez e t a l (2001)
C l (m o l/l) 1.58*10' 1.59*10 ' 7 5.56*1 O'3 4.95*10
S O / (m o l/l) 3.47*102 3.27 *102 2.57*103 2.45*1 Or
H C O i (m o l/l) 4.32*1 o 4 4.09*1 O'4 2.27*1 a 3 2.96*1(1'
C a 2 (m o l/l) 2.23*1 a 2 2.29*1 O'2 1.83*1 O'4 1.25*10‘
M g 2 (m o l/l) 2.70*1 a 2 2.34* 10'2 2.16*1 O'4 1.37*10‘
N a ‘ (m o l/l) 1.29*10J 1.30*10 1.21 *10 2 1.25*1 a-
K (m o l/l) i . n * i o 3 1.68*1 a 3 1.08*10'4 1.83*1(F
p H 7.73 7.72 8.60 8.73
The results o f the geochemical analysis o f pore fluid at water content equal to 0.14 have been
used as the initial geochemical condition o f the compacted bentonite in the numerical
8-9

Chapter 8 Numerical Simulation of the Coupled THC Behaviour of Compacted Bentonite
simulation in terms o f the initial conditions for major dissolved chemicals, ion exchange and
mineral composition. In addition, the results of the pore fluid composition analysis at
soil/water ratio equal to 1/4 have been used as the reference composition when the results of
post-mortem model are compared with the experimental results.
8.3 Hydro-geochemical results of the heating and hydration experiments
As reported in section 8.1, at the end of the thermo-hydraulic treatment for each heating and
hydration test, reported by Villar et al. (2008 a,b), the cell was disassembled and the clay
column extracted, weighed and sub-sampled. Once the bentonite column was extracted, it was
sawn into 24 cylindrical sections of 25 mm in thickness and post-mortem geochemical
analyses were conducted on each section (Fernandez and Villar, 2010). The appearance of the
compacted bentonite sample upon extraction is presented in figure 8.2.
Figure 8.2 Appearance o f the bentonite column after two years of heating and hydration upon extraction and establishment o f the 24 sampling sections (adopted from Fernandez and Villar, 2010)
8.3.1 Experimental m ethodologies of post-mortem analyses
The experimental investigations and methodologies described below were applied to
determine the geochemical and mineralogical properties of the FEBEX bentonite in each of
the sections at the end of the heating and hydration tests.
In terms of mineralogical analysis, XRD (X-Ray Diffraction), SEM (Scanning Electron
Microscopy) and FTIR (Fourier transform Infrared) tests were conducted. X-Ray diffraction
patterns were obtained on random powders and in oriented aggregates in order to identify the
mineralogical phases in the bentonite samples. Scanning electron microscope examinations
were used to define the microstructure of the minerals, the possible alteration products and the
8-10

Chapter 8 Numerical Simulation of the Coupled THC Behaviour of Compacted Bentonite
accessory minerals. FTIR spectra can serve as a fingerprint for mineral identification and
provides information about mineral structure, degree of regularity within the structure, nature
of isomorphic constituents (e.g. the nature o f the octahedral cations in clay minerals),
distinction of molecular water from constitutional hydroxyl, and presence of both crystalline
and non crystalline impurities (Fernandez and Villar, 2010).
The pore water of the bentonite was obtained by two different techniques, squeezing and
aqueous extract tests. The soluble elements were determined in aqueous extract solutions. In
the aqueous extract technique, the subsamples were crushed without previous drying, and
placed in contact with deionised, degassed water at a solid to liquid ratio of 1:4, shaken end-
over-end and allowed to react for two days under atmospheric conditions. After phase
separation by centrifugation the supernatant solutions were filtered through syringe filter and
analysed.
The pore water of the most hydrated sections o f some of the tests was obtained and reported
by the squeezing technique (Cuevas et al., 1997; Fernandez, 2004). In this method, a squeezer
was designed to compress the sample uniaxially by means of an automatic hydraulic ram
operating downwards, the squeezed water being expelled through a system of filters into
vacuum vials at the top and bottom o f the cell. Once the water extraction was completed, the
water sample was collected, avoiding any contact with the atmosphere, weighed, filtered and
it was analysed.
8.3.2 Experimental results of post-mortem analyses
The distribution of water content along the bentonite column at the end of the heating and
hydration tests reported by Villar et al. (2008a) is shown in figure 8.3. This figure also shows
the variation of the dry densities measured along the bentonite column at the end of the tests.
In terms of moisture variations in the cell, a significant gradient can be observed even in the
longest test. The results show that the water content increased within the closest 20 cm from
the hydration surface in the 6-month test, and within 40 cm in the 12- and 24- month tests. In
the 7.6-year test the increase o f water content took place all over the column except in the 10
cm closest to the heater (Villar et al., 2008a). The dry density decreases from the heater
8-11

Chapter 8_____________________________ Numerical Simulation of the Coupled THC Behaviour of Compacted Bentonite
towards the hydration surface following an approximately linear trend. The dry density varied
in the domain caused by the different swelling of the bentonite, since the most hydrated
sections have swollen more (Villar et al., 2008a, b). After 6 months, the closest 18 cm to the
heater experienced a desiccation that is not recovered after 24 months; hence in this area, the
water content remained below the initial value, being close to 6% in the vicinity of the heater.
In the areas affected by hydration, the densities decreased below the initial value (nominal
1650 kg/cm3) due to the expansion caused by saturation. On the contrary, near the heater, the
dry density increased, due to the shrinkage caused by desiccation (Villar et al., 2008a).
d 6 m onths Filled symbols: tests HI Open symbols: tests FQa 12 months
24 monthsS? 30
♦ 92 m onths
& 25
Initial
1.80
1.75
1.70
f 1.65
% 1.60
K 1.555T3 1.50e*Q 1.45
1.40
1.35
A □ o 6m <2 £
2
III
* A *A 12 I « 24 i
«□
e &♦ 92inonths
.. . « ? O .a
* ♦ A ! ? * $S ■ a'« * T
, ,A I ^
•Filled syi Open syr
mbols: test nbols lest:
a HI------s FQ
10 20 30 40 50Distance to the heater (cm)
10 20 30 40 50Distance to the heater (cm)
60
Figure 8.3 Final water content and dry densities along the bentonite columns of the different tests performed at 0.5-, 1-, 2- and 7.6 years (Villar et al., 2007, 2008a,b). FQ and HI: Tests for hydro
mechanical and geochemical post-mortem analyses, respectively.
With regards, to the mineralogical studies, Fernandez and Villar (2010) reported that the
mineral phases observed in the XRD results were similar to those of the untreated sample.
The observations performed with the SEM technique in samples taken at different positions
along the bentonite columns from the different tests indicated different accessory minerals
(chlorides, sulfates and carbonates) seemed to have formed at different positions along the
bentonite columns, depending on the duration of the tests and the extension of the hydration
front. No obvious change was observed by FTIR analyses in the FEBEX bentonite samples
after the 7.6-a heating and hydration test.
Figure 8.4 presents the concentrations of major soluble ions measured in aqueous extracts, i.e.
obtained by mixing soil and deionised water in a 1/4 ratio, and reported by Fernandez and
Villar, (2010). In general, the aqueous extracts showed that there were changes in
8-12
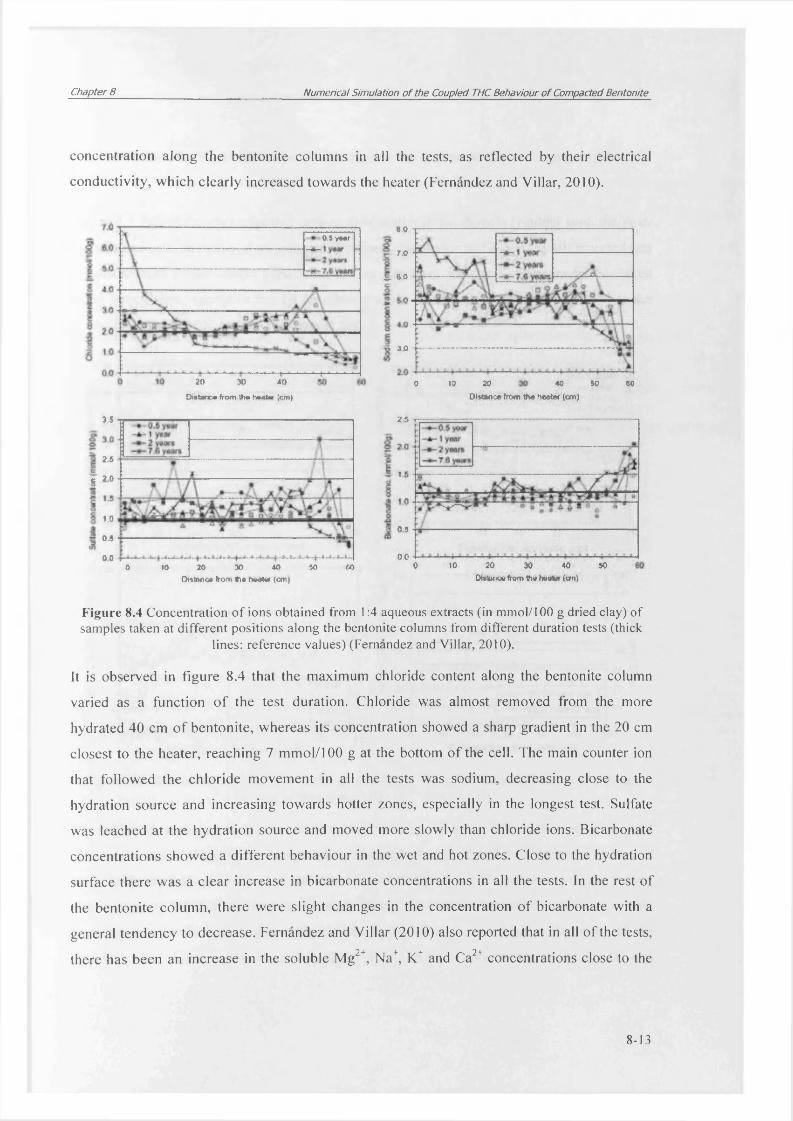
Chapter 8_____________________________ Numerical Simulation of the Coupled THC Behaviour of Compacted Bentonite
concentration along the bentonite columns in all the tests, as reflected by their electrical
conductivity, which clearly increased towards the heater (Fernandez and Villar, 2010).
0.5 y**r
2 0 3 0 4 0
Dntanc* from tha h»ala> (cm}
0.0
70
S 6 0
30
5 0to 20 40 CO0Distonce from tha hooter (cm)
2.5
25
e 20
1.0
090 0
30 40 50 60a to 20Dtetuoc* from fie heater (cm)
25
0 5
0.020 500 10 30 40
Dtetexse from 1h« heater (on)
Figure 8.4 Concentration of ions obtained from 1:4 aqueous extracts (in mmol/100 g dried clay) of samples taken at different positions along the bentonite columns from different duration tests (thick
lines: reference values) (Fernandez and Villar, 2010).
It is observed in figure 8.4 that the maximum chloride content along the bentonite column
varied as a function o f the test duration. Chloride was almost removed from the more
hydrated 40 cm of bentonite, whereas its concentration showed a sharp gradient in the 20 cm
closest to the heater, reaching 7 mmol/100 g at the bottom of the cell. The main counter ion
that followed the chloride movement in all the tests was sodium, decreasing close to the
hydration source and increasing towards hotter zones, especially in the longest test. Sulfate
was leached at the hydration source and moved more slowly than chloride ions. Bicarbonate
concentrations showed a different behaviour in the wet and hot zones. Close to the hydration
surface there was a clear increase in bicarbonate concentrations in all the tests. In the rest of
the bentonite column, there were slight changes in the concentration of bicarbonate with a
general tendency to decrease. Fernandez and Villar (2010) also reported that in all of the tests,
there has been an increase in the soluble Mg2+, Na+, K+ and Ca2+ concentrations close to the
8-13

Chapter 8 Numerical Simulation of the Coupled THC Behaviour of Compacted Bentonite
heater, whereas the K+ content also increased near the hydration source, decreasing the Na+
content.
Figure 8.5 shows the exchangeable cations distribution in the domain resulted from the post
mortem analysis. In terms o f exchangeable cations, Fernandez and Villar (2010) reported that
the distribution o f the cation population at clay interlayer remained approximately constant
along the column, except in the 20 cm closest to the heater and in the 14 cm closest to the
hydration source in the case o f the longest test.
0,5 y*ar \ yoar 2 yoars 7,6 y&3 ts.
-KX 7.6-year test CEC 7.6-year teat
to 20 30 40■f*50
Distance from the heater {cm)
* 0.5 y*ar -A - 1 year -*■ 2 years— 7.6 years
* 0.5 year* f year* 2 yearsX 7.6 years
10 20 80 40 SO 90
Distance from the heater (on)10 2 0 3 0 4 0 5 0
Distance from the heater (cm)
10 2 0 30 4 0 5 0Distance from the (water (cm)
5.0
l «*c5“ 4.0 4)I ” 2 30J 2JS
I 2.0
Figure 8.5 Distribution of the cation exchange population along the bentonite columns at differentperiods of time (Fernandez and Villar, 2010).
The Ca2+ exchange population was reported higher in the vicinity o f the hydration surface and
clearly decreased close to the heater zone. The exchangeable Mg2+ concentration decreased
close to the hydration source and increased significantly in the 15 cm closest to the heater.
The exchangeable Na+ tended to decrease along the whole bentonite column, but this
tendency was particularly apparent close to the hydration surface and especially in the 20 cm
closest to the heater (where exchangeable Mg2+ and K+ concentrations increased, and
8-14

Chapter 8 Numerical Simulation of the Coupled THC Behaviour of Compacted Bentonite
exchangeable Ca2+ also decreased). In the case o f K+ exchange population; although there was
a slight increase along the entire bentonite column, this tendency was more prominent
towards the heater and close to the hydration surface.
8.4 Numerical simulation of the heating/hydration test
This section deals with the numerical simulation o f the coupled thermal, hydraulic and
chemical behaviour o f the heating and hydration tests on compacted FEBEX bentonite
reported by Villar et al. (2008b) and Fernandez and Villar (2010) as presented in the previous
section. The required parameters for thermal, hydraulic and chemical transport were adopted
in the model based on the reported values and relationships in the literature for compacted
FEBEX bentonite. In order to compare the results o f the numerical modelling with reported
experimental results, the chemical results o f the numerical simulations for the periods of 6,
12, 24, and 92 months have been re-analysed geochemically, simulating the post-mortem
geochemical batch equilibrium test, conducted in the experimental study by Villar et al.
(2008b) and Fernandez and Villar (2010). Finally the results o f model are discussed and
compared with those reported from the experimental study.
8.4.1 Model domain and time-step
As shown in figure 8.1 the bentonite cell is of 600 mm height and 70 mm diameter. Since the
hydration water and the heating are applied uniformly on the top and bottom faces
respectively, this problem can be construed to be effectively a one-dimensional problem.
However the modelling was performed under two-dimensional problem.
The domain was discretised into 500 unequally sized, 4-noded axi-symmetric elements. An
axi-symmetric analysis was used, as the domain is symmetrical about the vertical axis. A
denser mesh was used in the heating and hydration boundary regions in order to prevent
numerical instability and improve the convergence. The first 200 mm in the heating side
(bottom) and the hydration side (top) of the sample was discretised into equally sized 1 mm
elements. For the rest o f the domain, i.e. 200 mm in the middle, equally sized 2 mm sized
elements were used.
8-15
Chapter 8 Numerical Simulation of the Coupled THC Behaviour of Compacted Bentonite
A variable time-step was used, allowing the variation of time-step depending on convergence.
Under this scheme, if the convergence criteria are satisfied for the primary variables within a
specified numbers o f iterations, time-step is allowed to increase by a specified rate. On the
other hand, if the primary variables are not converged in a certain number of attempts, the
time-step is reduced for the following time of analysis. The maximum time-step and increase
rate of time-step were considered as 500000 seconds and 1.05, respectively. These values
provided a better convergence rate compared with some other trial values.
The simulation was performed under coupled thermal, hydraulic and chemical framework. It
is noted that the mechanical and deformation behaviour was not considered in the model.
However the effects o f variation in the available porosity for the flow of water and chemicals
due to the hydration or heating were partly considered through the implicit modification of the
hydraulic conductivity with interlayer hydration/dehydration effects, as discussed in chapter
7.
As it can be observed in the experimental results o f dry density variation, reported by Villar et
al. (2008a) and Villar et al. (2008b) shown in figure 8.3, dry density changed from the initial
value of around 1650 kg/m3 to the a maximum range of 1700-1750 kg/m3 in the area close to
the heater and to a minimum o f approximately 1400-1450 kg/m3. This indicates that the total
porosity could theoretically be reduced to 0.35 in the vicinity of heater and increased to 0.47
in the hydration zone from the initial values o f approximately 0.39. The effect of porosity
variation in the heater zone is small. However, in the hydration side, since the cell was
constrained for swelling the increase in the porosity is supposed to reduce the
intralayer/interparticle porosity (macropores) which was considered implicitly in the
hydraulic transport. Therefore the contribution o f the mechanical/deformation modelling
effects are likely to be less effective in comparison with directs effects of thermal, hydraulic
and chemicals effects, acknowledging the fact that towards understanding the swelling
pressure development in the system and more accurate justifications o f the coupled processes,
mechanical behaviour is also an important element of the model.
8-16

Chapter 8 Numerical Simulation of the Coupled THC Behaviour of Compacted Bentonite
8.4.2 Material parameters and relationships for modelling of thermal and hydraulic processes
The material parameters and relationships for thermal and hydraulic simulation are similar to
those presented in section 7.7.2 o f chapter 7. For sake of completeness these parameters are
presented in details here.
The material constants such as density o f water, density of solid, specific heat capacity of
solid, liquid and vapour, latent heat o f vaporisation, Henry’s constant and specific gas
constant for gas vapour are presented in table 8.7. These constants have been obtained based
on Mayhew and Rogers (1976) and ENRESA (2000).
Table 8.7 Material constants used in the numerical modelling
Constants Values
D en sity o f liqu id , p i a t 2 5 °C (kg m 3) 1000
D en sity o f s o lid , p s (kg m '3) (M artin e t al., 1998), 2 7 0 0
P o ro sity , n 0 .40
S p ecific h ea t c a p a c ity o f s o il so lid s Cps (J kg'1 K 1)87 0
(M artin et. al, 1 9 9 8 )
S p ecific h e a t c a p a c ity o f s o il w a ter , Cpi (J kg'1 K 1)4180
(M ayh ew a n d R ogers, 1 976 )
S p ecific h ea t c a p a c ity o f s o il vapou r, (J kg'1 K 1)1870
(M ayh ew a n d R ogers, 1 9 76 )
L a ten t h ea t o f va p o r isa tio n , L (J kg'1)
(M ayh ew a n d R o g ers, 1976 )2.4x1 ( f
S p ec ific g a s co n s ta n t f o r w a te r vapou r, R (J kg'1 K 1)
(M a yh ew a n d R o g ers , 1976 )461 .5
The thermal conductivity o f the compacted FEBEX bentonite was adopted from the
relationship given by ENRESA (2000) as:
8-17

Chapter 8 Numerical Simulation of the Coupled THC Behaviour of Compacted Bentonite
(8 .1)
where X is the thermal conductivity in W/m.K, Si is the degree of saturation, A y is the value of
X for Sr = 0, A2 is the value o f X for Sr = 1, xo is the degree of saturation for which the thermal
conductivity is the average value between the extreme values, and dx is a parameter. The
values of these fitting parameters, based on the experimental evidence, are as follows
(ENRESA, 2000):
A ,=0.57 ± 0.02; A2=1.28 ± 0.03; x0 =0.65 ± 0.01; dx= 0.100 ± 0.016
The van Genuchten expression was used for describing the moisture retention relationship
based on the relationship and parameters provided in ENRESA (2000) for compacted FEBEX
bentonite. The parameters for van Genuchten’s moisture relationship (van Genuchten, 1980)
have been given also in ENRESA (2000) for a range of initial dry densities. The general form
of the degree o f saturation-suction relationship for compacted FEBEX bentonite used in the
simulation is given as:
where, S/o and Sirmax are the residual and maximum degree of saturation and p 0 (MPa) and a
are material constants. These parameters depend on the initial dry density of the soil.
For the experiment under consideration, the average dry density of the bentonite clay is
approximately 1650 kg/m3 in the in-placed condition (Villar et al. 2008b; Fernandez and
Villar, 2010). Corresponding to this dry density the fitting parameters for the above equation
are as follows (ENRESA, 2000):
po = 30; X= 0.32; S,0 = 0.10; S ,rmcvc = 1.00
According to experimental results presented by ENRESA, (2000), the saturated permeability
to deionised water (ksat, m/s) o f samples o f untreated FEBEX bentonite compacted at different
dry densities is exponentially related to dry density (pd, g/cm3). An empirical relationship for
- a
max (8.2)
8-18

Chapter 8 Numerical Simulation of the Coupled THC Behaviour of Compacted Bentonite
saturated hydraulic conductivity has been proposed as a function of dry density for compacted
FEBEX bentonite as:
log ksat = - 2 3 6 Pd ~ 8-57 (8.3)This relationship is valid for the dry densities range between 1470 and 1840 kg/m3 (Villar et
al., 2008b). Corresponding saturated hydraulic conductivity of the dry density in this
simulation study is 3.5><1 O'14 m/s.
The unsaturated hydraulic conductivity o f compacted bentonite is often expressed by means
of a power law for the relative permeability (ENRESA, 2000). Incorporating the modification
due to the interlayer hydrate water, presented in chapter 7, the general unsaturated hydraulic
conductivity o f compacted bentonite can be expressed as:
*/ = 0 - / /Z > * w (S /)" (8-4)
where f a is the interlayer water volumetric portion and n is a constant which has been given as
3 for this experiment (Villar et al., 2008a).
Table 8.8 Parameter used in the hydration/dehydration model for the FEBEX bentonite in order to calculate interlayer hydrate water content or equivalent porosity
Parameters Ca-smectite Mg-smectite Na-smectite
P e rc e n ta g e % 3 7 34 29
Ws (k ca l/m o l) -2 8 8 3 -2 8 0 6 -3 254
lo g K eq a t 2 5 °C -3 .61 -4 .2 8 -0 .7 6 7
A H r° (k ca l/m o l) 9 6 3 0 10609 58 1 0
In order to calculate the amount o f interlayer water porosity and subsequently fa , the
hydration/dehydration model presented in chapter 7 was employed. Using this model, the
amount of interlayer water porosity can be calculated knowing the suction and temperature.
To apply the hydration/dehydration model for calculating interlayer porosity, the smectite
clay portion o f FEBEX bentonite, i.e. 92% of total solid, was considered as a complex of Ca-,
Mg- and Na-smectite with percentage of each ion, as it was presented in table 8.2. For the
sake o f completeness the required parameters for each smectite component were adopted from
8-19

Chapter 8 Numerical Simulation of the Coupled THC Behaviour of Compacted Bentonite
those reported by Ransom and Helgeson (1994) in the interlayer hydration model. A summary
of parameters used in the modelling of hydrate water amount is given in table 8.8.
8.4.3 Material parameters and relationships for modelling of the reactive transport of chemicals
As stated in chapter 3 the effective diffusion coefficients for chemical diffusion in the
formulation are obtained knowing the water tracer diffusion coefficients of each species and
the turtuosity factors. According to equation (3.153), the relationship applied for
determination of the effective tracer diffusion coefficients in the model is:
D f f = nS/TjD® (8.5)
where r, is the turtuosity factor for the f h component. Si represents the degree of saturation
and n is porosity. D? is tracer diffusion coefficient in water for the i h component.
The values o f tracer diffusion coefficients o f ions in water at 25 °C are shown in table 8.9
according to the values reported by Lasaga (1998).
Table 8.9 Tracer diffusion coefficients of the ionic species involved in the simulation
D0, (m2/s)Chemical component
Lasaga (1998j
cr 2.03* Iff9
so 42- 1.07*lff9
HCOi 1.18*lff9
Ca2+ 0.79 x Iff9
Mg2+ 0.70* Iff9
Na 1.33* Iff9
IC 1.96*1 ff9
At variable temperature but fixed composition and pressure, self or tracer diffusion coefficient
of ions in pure solution can be extrapolated from one to another temperature based on the
8-20
Chapter 8 Numerical Simulation of the Coupled THC Behaviour of Compacted Bentonite
Stokes-Einstein relationship (Cussler, 1997). Similar approach was used to calculate the
variation o f tracer diffusion coefficients with temperature, given in equation (3.154):
where 77 represents the viscosity o f solvent, i.e. water in this case. To is the reference
temperature.
The effect of porosity and moisture content on diffusion coefficient was considered using a
similar relationship proposed by Revil and Jougnot (2008) for unsaturated diffusion
coefficients o f ions in porous media. As reported in chapter 2, different effective porosities for
diffusion of anionic and cationic species should be considered in the case of compacted
smectite clays, representing the effects related to the interlayer hydrate water and diffuse
double layer development in the system. Accordingly, the turtuosity factor proposed by Revil
and Jougnot (2008) was modified and the porosity was replaced by the effective porosity. The
modified relationship used in this simulation can be given as:
threshold for degree o f saturation, suggested by Revil and Jougnot (2008). m and n are
constants. In this study the values o f Sf, m and n are considered equal to 0, 2.5 and 2.75,
respectively.
As discussed in chapter 2, the values of effective porosity for anions diffusion can be
approximated from:
where n is the total porosity, nn represents the interlayer porosity and nDDL is the porosity
associated with developed diffusion layer.
The interlayer porosity was calculated by the hydration/dehydration model proposed in
chapter 7. The model gives the amount of the interlayer porosity at saturated state and
ambient temperature equal to about 0.27. The effective porosity for chloride diffusion has
been given in the range o f 0.02-0.03 for FEBEX bentonite compacted at dry density of 1650
(8.6)
where nejj is the effective porosity for diffusion of ionic species. Si is the percolation
n}ef f = n ~ n IL ~ n DDL (8.8)
8-21

Chapter 8 Numerical Simulation of the Coupled THC Behaviour of Compacted Bentonite
kg/m3 and at saturated state (Garcia-Gutierrez et al., 2004). DDL porosity was approximated
as a constant value o f 0.105 for the anionic species to produce the effective porosity using
equation 8 . 8 in the range of 0.02-0.03 at saturated state, i.e., nej j = 0.4-0.27-0.105 = 0.025 .
Including the above turtuosity factor and volumetric water content using the above equations,
the corresponding value for the effective diffusion coefficient for chloride in FEBEX
bentonite compacted at dry density of 1650 kg/m3 and at saturated condition is obtained equal
to 1.27x1 O' 12 m2/s which is close to the experimentally determined value of approximately12 21.1x10' m /s reported by Garcia-Gutierrez et al. (2004). For all anionic species same
turtuosity factor was applied.
The effective porosity o f cations was assumed as the effective porosity for water tracer HTO
diffusion, given as total porosity in compacted bentonite soils (Garcia-Gutierrez et al., 2004;
Mekior et al. 2009). In the simulation presented here, the effective porosity for cations was
considered as the total porosity. However it is noted that higher diffusion rate for cations than
HTO has been also reported due to the interlayer diffusion or surface diffusion, as discussed
in chapter 2 .
Applying total porosity to the turtuosity factor equation for cations, the effective diffusion
coefficient for cations is obtained in the range of 6.32xl0'n to 1.56xlO'10 m2/s. These values
are also in agreement with the values reported for HTO effective diffusion coefficient equal to
5.8x10 11 m2/s, for compacted saturated FEBEX bentonite at dry density of 1650 kg/m3
(Garcia-Gutierrez et al., 2004).
Regarding the geochemical reactions, similar assumptions made for the evaluation of the
initial pore water composition of the FEBEX bentonite, presented in section 8.2, were
considered in the simulation of reactive transport of chemicals. Only in the case of calcite
reactions, dissolution and precipitation of calcite was considered under kinetically controlled
condition to model the more realistic behaviour as a time-dependent geochemical process.
The geochemical parameters required are the thermodynamic constants for all the reactions.
The thermodynamics constant of mineral reactions including equilibrium constant and
enthalpy at reference state are adopted from the phreeqc.dat data-base implemented in
PHREEQC package (Perkhurst and Appelo, 1999). The values of equilibrium constant of ion
8-22

Chapter 8 Numerical Simulation of the Coupled THC Behaviour of Compacted Bentonite
exchange reactions for FEBEX bentonite, reported by Fernandez et al. (2001) were used. The
required equilibrium constants of ion exchange reactions can be found in table 8.4.
Table 8.5 also presents the thermodynamics parameters of mineral reactions. The kinetic
parameters are also required for calculating the rate of calcite dissolution-precipitation. The
relationship for kinetic rate o f calcite dissolution/reaction proposed by Plummer et al. (1978)
will be used. The kinetic rate equation of calcite reaction and the required parameters of the
model proposed by Plummer et al. (1978) have been included in phreeqc.dat data-base in
PHREEQC and will be used in the simulation. Table 8.10 presents the kinetic data for calcite
reaction used in the simulation.
Table 8.10 Kinetics parameter used for modelling calcite reaction adopted from phreeqc.dat data-base of PHREEQC version 2 (Perkhurst and Appelo, 1999)
Kinetic reactions Kinetic data
CaCOj=Ca2> + C 0 32'
Rate o f reaction (R):
s = *(£)Vn f ( j iW o c m 2/-1, a=0.6, n=2/3
k ~ k\Qj_j+k\aj_i^co*3 + ^3a H20444 7177
log*! =0.198— — log/fc2 =2.840
n = IAPKeq
log *3 = -5.86 - if T <= 298
Keq: Equilibrium constant from table 8.5
1737logJfc3 = 1.10 if T > 298
IAP: Ion Activity Product
H2CO3 ~CO2(aq) H2CO3
8.4.4 Initial and boundary conditions
The bentonite cell is initially set to be in equilibrium with the laboratory conditions (14%
gravimetric water content) (Villar et al., 2008). This amounts corresponds to an initial degree
of saturation (Si) equal to 58.6% (based on n=0.4) and corresponds to suction value of 90.0
MPa based on the moisture retention relationship, i.e. equation 8.2. It is assumed that the
temperature is in equilibrium with the laboratory conditions and is equal to 298 K.
8-23
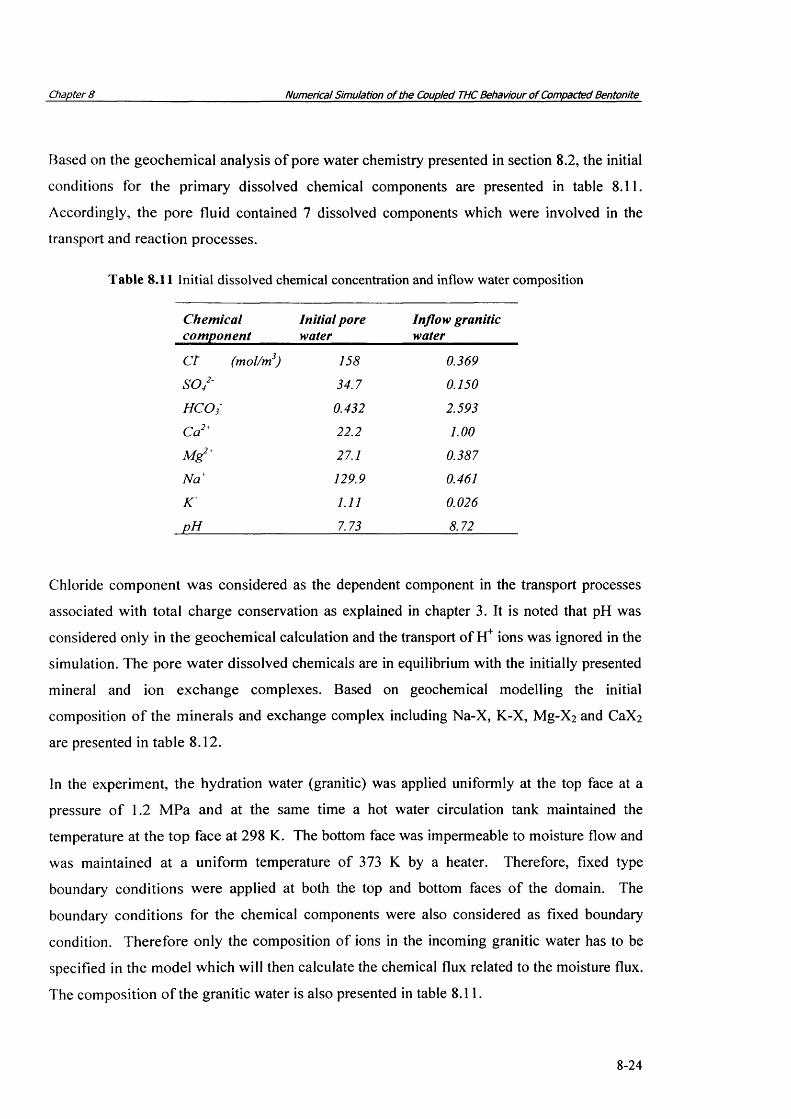
Chapter 8 Numerical Simulation of the Coupled THC Behaviour of Compacted Bentonite
Based on the geochemical analysis of pore water chemistry presented in section 8.2, the initial
conditions for the primary dissolved chemical components are presented in table 8 .1 1 .
Accordingly, the pore fluid contained 7 dissolved components which were involved in the
transport and reaction processes.
Table 8.11 Initial dissolved chemical concentration and inflow water composition
Chemicalcomponent
Initial pore water
Inflow granitic water
C t (m ol/m 3) 158 0.369
S O / ' 34.7 0.150
H C O f 0.432 2.593
C a 2" 22 .2 1.00
M g 2' 27.1 0.387
N a 129.9 0.461
K ' 1.11 0.026
p H 7.73 8.72
Chloride component was considered as the dependent component in the transport processes
associated with total charge conservation as explained in chapter 3. It is noted that pH was
considered only in the geochemical calculation and the transport of H+ ions was ignored in the
simulation. The pore water dissolved chemicals are in equilibrium with the initially presented
mineral and ion exchange complexes. Based on geochemical modelling the initial
composition o f the minerals and exchange complex including Na-X, K-X, Mg-X2 and CaX2
are presented in table 8 . 1 2 .
In the experiment, the hydration water (granitic) was applied uniformly at the top face at a
pressure o f 1.2 MPa and at the same time a hot water circulation tank maintained the
temperature at the top face at 298 K. The bottom face was impermeable to moisture flow and
was maintained at a uniform temperature of 373 K by a heater. Therefore, fixed type
boundary conditions were applied at both the top and bottom faces o f the domain. The
boundary conditions for the chemical components were also considered as fixed boundary
condition. Therefore only the composition of ions in the incoming granitic water has to be
specified in the model which will then calculate the chemical flux related to the moisture flux.
The composition of the granitic water is also presented in table 8.11.
8-24

Chapter 8 Numerical Simulation of the Coupled THC Behaviour of Compacted Bentonite
Table 8.12 Initial quantities o f minerals and exchangeable ions in FEBEX bentonite
Initial minerals and cation mol/kg dryexchangeables soil
Calcite 0.060
Gypsum 0.0054
Halite 0.0
Anhydrite 0.0
Ca2h (Ca-X2) 17.15* Iff2
Mg2+ (Mg-Xz) 16.7*1 ff2
Na (Na-X) 30.4* Iff2
K' (K-X) 1.90* Iff2
Referring to the heating/hydration cell used in the experimental work, at the radial boundary a
heat flux is required to be considered in the model representing the heat loss from the cell.
Theoretically this heat loss is equal to 2.3 W/m2/K, calculated from the PTFE casing and
foam insulation, both 15 mm thick and having thermal conductivities of 0.25 and 0.4W/m/K
respectively (Villar et al. 2008b).
Similar to the coupled TH simulations presented in chapter 7 on compacted FEBEX in a
similar cell, a lower value o f heat flux, i.e. 1.78 W/m /K, was used in simulation compared
with the theoretically calculated value to give better correlation for temperature distribution
with those reported in the experiment. This can be explained that in the experimental cell, a
layer of air trapped in radial boundary of the sample, may have provided an extra isolation
layer. In addition, the radial boundary is prescribed as being hydraulically and chemically
impermeable.
A schematic o f the initial and boundary conditions used in the simulations is shown in figure
8.5.
8-25

Chapter 8 Numerical Simulation of the Coupled THC Behaviour of Compacted Bentonite
I,=600 mm
Top Boundary conditions:
u,=1.2*l(f Pa, T=298 K (25 °C)
D isso lved io n s (m ol/m 3 water):
cd (Cr)=0.369, cd (SO/-)=0.15,
cd (HCOi)=2.593, cd (Ca2+)=1.00
cd (Mg2*)=0.387, cd (Na+)=0.461, cd
(tC)-0 .026
pH =8.72
Initial conditions:
u,= -90 * l ( f Pa, T=298 K (25 °C)
D isso lved io n s (m o l/m 3 water):
cd (C0=158.78, cd (S O /)= 34 .70
cd (HCOi)=0.43, cd (Ca2+)=22.20
cd (Mg2+)=27.10, cd (Na+)= 129.95
cd (lC)=1.10, pH =7.72
M in e ra ls (m o l/k g so il):
Anhydrite=0.0, Gypsum=0.0054
Halite=0.0, Calcite=0.06
E x c h a n g ea b le io n s (m o l/kg so il):
Ca-X2=17 .15*W 2, Mg-X2=16.7*1 Or2
Na-X=30.4*1 O’2, K-X=1.90*10r2
r =35 mm
Bottom Boundary conditions:
du/dx = 0, T=373 K (100 °C)
dc/dx =0
!fs
I <0
II4as
Figure 8 .6 Schematic of the initial and boundary conditions for THC simulation of heating andhydration test
8-26
Chapter 8 Numerical Simulation of the Coupled THC Behaviour of Compacted Bentonite
8.5 Simulation results
The results o f the numerical simulation in terms of the temperature, moisture and
geochemistry o f the clay-water system including major cations and anions, minerals and
exchange capacity are presented in this section.
In terms of temperature and moisture distribution, the results of the numerical modelling will
be directly compared with experimental results reported by Villar et al. (2008b).
As stated earlier once the heating and hydration experiment has been completed, in the
experimental work o f Villar et al. (2008b) and Fernandez and Villar (2010), the bentonite cell
was sliced into 24 sections and each section was subjected to a series of pore water extract
analysis (post-mortem analysis) under a different solid/water ratio compared with the in-place
condition, i.e. 1 (solid):4 (aqueous). Due to the different conditions in the post-mortem
analyses compared with the in-place conditions in terms of water content and temperature, the
equilibrium composition o f ions might be different due to further dissolution of trace minerals
which might also trigger ion exchange reactions. Therefore, in order to compare the model
results with the experimental date reported by Villar et al. (2008b) and Fernandez and Villar
(2010), i.e. 1:4 aqueous extract method, it was necessary to geochemically re-equilibrate the
model results with the additional amount o f water at ambient temperature with a series of post
geochemical modelling. Then the results o f post-mortem modelling were comparable with the
experimental results. Hence, as regards the results pertaining to geochemistry, two sets of
model results are presented. The first set o f model results represent the in-place conditions, in
terms of water content and temperature (referred to as in-place analysis) in the bentonite cell
during the experiment, whilst the second set o f model results represent the post-mortem
conditions (referred to as post-mortem analysis) so that a comparison of the model results can
be made against the 1:4 aqueous extract results.
8.5.1 Temperature distribution
Figure 8.7 presents the transient simulated results of temperature distribution in the bentonite
cell and those reported by Villar et al.(2008b) for the periods of 6, 12, 24 and 92 months. The
numerical results correlated well with the experimental results. The temperature distribution
8-27
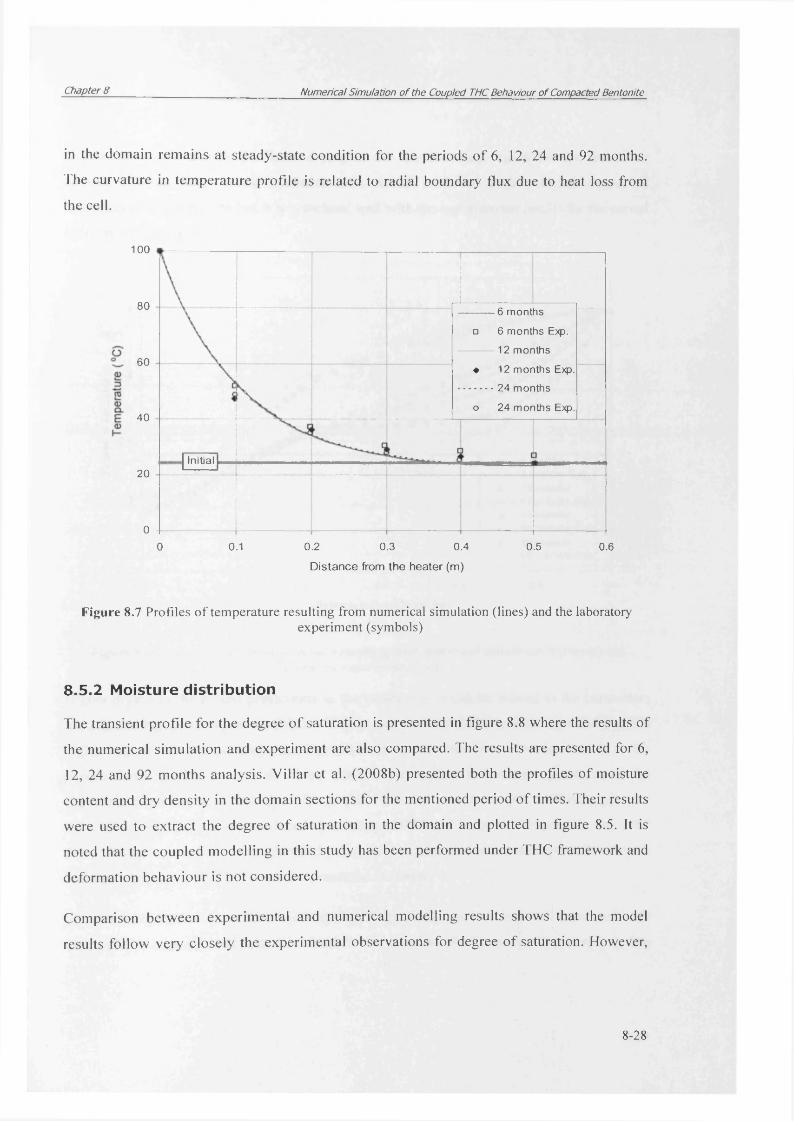
Chapter 8 Numerical Simulation of the Coupled THC Behaviour of Compacted Bentonite
in the domain remains at steady-state condition for the periods of 6, 12, 24 and 92 months.
The curvature in temperature profile is related to radial boundary flux due to heat loss from
the cell.
100
80 6 m onths
□ 6 m onths Exp.
12 months
♦ 12 m onths Exp.
24 m onths
o 24 m onths Exp.
60
40
Initial20
00 0.2 0.3 0.40.1 0.5 0.6
Distance from the heater (m)
Figure 8.7 Profiles of temperature resulting from numerical simulation (lines) and the laboratoryexperiment (symbols)
8.5.2 Moisture distribution
The transient profile for the degree of saturation is presented in figure 8.8 where the results of
the numerical simulation and experiment are also compared. The results are presented for 6,
12, 24 and 92 months analysis. Villar et al. (2008b) presented both the profiles of moisture
content and dry density in the domain sections for the mentioned period of times. Their results
were used to extract the degree of saturation in the domain and plotted in figure 8.5. It is
noted that the coupled modelling in this study has been performed under THC framework and
deformation behaviour is not considered.
Comparison between experimental and numerical modelling results shows that the model
results follow very closely the experimental observations for degree of saturation. However,
8-28

Chapter 8 Numerical Simulation of the Coupled THC Behaviour of Compacted Bentonite
the numerical model over-predicted drying in the hot boundary region for the first three
periods o f simulation. In the hydration side, model predicted slightly higher degree of
saturation up to 24 months but it is correlated well with the experimental results for the period
of 92 months analysis.
-b-na*«*°*DnDaa
<V0.8 O sOsO s
° „ o ^ oo0! t• — _ _ _--- ”*T*0.6
o> > 6 months - - 6 months-Exp.> 12 months 12 months-Exp. 24 months
24 months-Exp.i 92 months 92 months-Exp.
Initial
0.4
0.20.2 0.3 0.4 0.5 0.60 0.1
Distance from the heater (m)
Figure 8.8 Profiles o f degree of saturation resulting from numerical simulation (symbols) andlaboratory experiment (lines)
Higher drying in the model predictions in the heater region can be related to the parameters
used in the vapour transport model, i.e. Phillip and de Vries (1957), which generally yields
higher vapour flux due to temperature gradient. It is noted that two correction factors to the
vapour fluxes o f Phillip and de Vries model were applied following suggestions of the
experimental and numerical study of Singh (2007) as discussed in chapter 3. The temperature
induced vapour flux has been reduced by a factor of 0.25 and isothermal vapour flux by a 0.7
factor. These values have been obtained based on the coupled thermal and hydraulic analysis
on same compacted FEBEX bentonite presented in chapter 7.
The rate of hydration due to the injecting fluid is gradually reduced and well correlated with
the results o f experimental hydration front for the duration of 92 months. This is mainly due
8-29

Chapter 8 Numerical Simulation of the Coupled THC Behaviour of Compacted Bentonite
to the application o f the interlayer hydrate modification factor, i.e. (l-fu) in the effective
hydraulic conductivity relationship, i.e. equation (8.4). With increasing degree of saturation,
hydraulic conductivity increases by a power function. At the same time, interlayer hydration
reduced the hydraulic conductivity as the interlayer water ratio approaches higher values
through (l-fu ) parameter.
Since the degree o f saturation profiles are qualitatively close to the experimental data in
general, more confidence was obtained on the evaluation of the advection flow of ions in the
system in chemical transport analysis.
8.5.3 Geochemistry and pore fluid composition
8.5.3.1 Chloride (Cl") distribution (In-place analysis results)
Figure 8.9 presents the transient results of chloride ions at four different times, i.e. 6, 12, 24
and 92 months. The results are given in terms of molar mass of the ions per mass of dry soil
(mol/kg dry soil) to show the variations o f the ion concentration from the initial condition. It
can be observed that the model predicts a build up of chloride, flushing towards heater in the
areas close to the hydration side. This is attributed to the advective flow of chloride ions from
the hydration side which also results in accumulation of chloride ions in the first 200 mm
close to the hydration side. The front peak in chloride profile is extended towards the middle
of the domain with time.
Moreover, due to the increase in temperature in the areas close to the heater, liquid water is
suggested to be transferred toward the heater due to the hydraulic potential. The water has
carried the available chloride in the domain towards the heater. At the same time, moisture
transfer can also take place simultaneously from the hot end towards the cold end in the form
of water vapour. The chloride ions carried by liquid flow remained at the hot end, as vapour
cannot carry chemicals with it.
The process o f simultaneous water and vapour movement in the areas close to the heater has
resulted in higher amount o f chloride, precipitated by the heater while the chloride content
was reduced from the initial amount in the area of approximately 80 to 300 mm away from
the heater.
8-30

Chapter 8 Numerical Simulation of the Coupled THC Behaviour of Compacted Bentonite
0.08
6 months
12 months0.06
24 m onthsoCO
TDD) 0.04
OE
92 months
InitialO
0.02
0 0.1 0.30.2 0.4 0.5 0.6
Distance from the heater (m)
Figure 8.9 Profiles o f chloride contents resulting from the numerical simulation at different times
8 .5 .3 .2 C h lo r id e (C l ) d i s t r i b u t io n ( P o s t - m o r te m s im u la tio n r e s u l t s )
Figures 8.10 presents a comparison o f post-mortem analysis results against the experimental
results, reported by Fernandez and Villar (2010) for the dissolved chloride ion concentrations
at different time intervals. The results o f the numerical model are presented with lines and the
symbols represent the experimental reported values.
As chloride behaves as a conservative anion, the chloride distribution in the domain has not
been affected by geochemical reaction during post-mortem analysis. The chloride profile
related to the in-place and post-mortem analysis, yielded exactly same values as expected.
From figure 8.10, it can be seen that there is a good qualitative correlation between the
experimental and model results for the period o f 6 , 12 and 24 months. The magnitude
accumulation peaks o f chloride in the area o f hydration side are also close to the experimental
results for the periods o f 6 , 12 and 24 months. In the second half o f the domain which was
more affected by temperature increase (refer to figure 8.7), the results for the 6 , 12 and 24
8-31

Chapter 8 Numerical Simulation of the Coupled THC Behaviour of Compacted Bentonite
months are in qualitative agreement with the experimental results. The results for the first
three periods o f analysis indicate a similar pattern in the increase and decrease o f the amount
o f chloride in the vicinity o f heater and in the distance o f 1 0 0 - 2 0 0 mm away from the heater,
respectively. The magnitude and locations o f variations o f the chloride content resulted from
the numerical simulation and experimental investigation are in a close agreement.
0.08 T--------------------- .---------------------,-------------------- ---------------------T--------------------
0 06 ............. 24 m onths▲ 24 months-Exp.
~ ° ---------- 92 months“ a 92 months-Exp.■o - - 5K- - Initial-Exp.0 )0 .0 4 -........................................................................................................................ j.................... o .................
"o^ •
0. 02C
00 0.1 0.2 0.3 0.4 0.5 0.6
D istance from the heater (m)
Figure 8.10 Profiles o f chloride contents at different times, resulting from the post-mortem analysis (lines) and experimental results (symbols) reported by Fernandez and Villar (2010)
The results o f model for the 92 months test show a higher amount o f chloride in the area o f
100-300 mm in the vicinity o f the hydration side compared with the experimental results. For
the periods o f 92 months, numerical model also shows continues increase in the amount o f
accumulated chloride by the heater. However, the model predicted a lower amount o f chloride
close to the heater. The experimental results show that chloride was almost removed from the
more hydrated 400 mm o f bentonite, whereas its concentration showed a sharp gradient in the
2 0 0 cm closest to the heater.
The maximum value o f chloride content reaches approximately 0.07 mol/kg, at the hot end o f
the experiment whilst the numerical model yields 0.04 mol/kg for 92 months time. The
-- - - - - - - - - - - - - - - - - - - - - 6 monthso 6 months-Exp.
• 12 months-Exp.0 / 1 m a r ' ) t b o
▲ 24 months-Exp.\ J d - 1 1 1 U l I U I O
a 92 months-Exp. - )K- - Initial-Exp.
•
A
8-32

Chapter 8 Numerical Simulation of the Coupled THC Behaviour of Compacted Bentonite
experimental results indicate that the flow o f chloride has more been regulated due to the
combination o f chloride diffusion in the first 2 0 0 mm towards the heater and chloride
advection in the vicinity o f heater. However, model result shows that after 92 months part o f
the chloride have been diffused toward the hydration boundary due to the concentration
gradient.
8 .5 .3 .3 S u l f a te ( S 0 42 ) d i s t r ib u t io n ( I n - p la c e a n a ly s is r e s u l t s )
In addition to the thermal and hydraulic transport processes, dissolved sulfate distribution in
the domain was affected by the geochemical reactions, in particular, gypsum and anhydrite
dissolution and precipitation. Figure 8.11 presents the distribution profile o f sulfate in the
domain resulted from the numerical analysis.
0.02
6 m onths
12 m onths0.015
24 m onthsow“OO)^ 0.01oE,
CNI
OCO
92 m onths
0.005 Initial
0.40.2 0.3 0.5 0.60.10
Distance from the heater (m)
Figure 8.11 Profiles o f the dissolved sulfate contents resulting from the numerical simulation atdifferent times
The sulfate behaviour was affected by the equilibrium reactions with anhydrite and gypsum
minerals. The domain initially contained some gypsum but no anhydrite (table 8.12).
8-33

Chapter 8 Numerical Simulation of the Coupled THC Behaviour of Compacted Bentonite
Therefore, when the concentration o f sulfate reduced by advancing hydration, gypsum was
dissolved which was controlled by the amount o f the dissolved sulfate in the area affected by
hydraulic process. The results o f gypsum distribution in the domain, i.e. figure 8.12, also
indicate that almost all gypsum was dissolved in 50 mm distance from hydration boundary.
The peak o f leached sulfate in the hydration side is also located in the same region where
gypsum has been dissolved.
0.008
6 m onths
12 m onths
24 months
92 months0.006
Initial
05
3 0.004
r ~Q.
0.002
0.3 0.4 0.5 0.60.20 0.1
D istance from the heate r (m)
Figure 8.12 Profiles o f gypsum contents resulting from the numerical simulation at different times
The model results show that the amount o f sulfate in the domain is constantly higher than the
initial amount for the distance o f 400 mm between the 100 to 500 mm away from hydration
side for the time periods o f 6 , 12 and 24 months. Obvious higher and constant concentration
o f sulfate is observed for the distance o f about 250 mm between 50 to 300 mm away from
hydration end. This behaviour is also related to the gypsum dissolution where amount of
gypsum has decreased according to the results presented in figure 8.12. Due to the
equilibrium mineral condition, the amount o f dissolved sulfate has increased and remained
constant in the mentioned area.
8-34

Chapter 8 Numerical Simulation of the Coupled THC Behaviour of Compacted Bentonite
The amount o f sulfate shows a decrease in the areas close to the heater. This is believed due
to the precipitation o f anhydrite as it can be seen in figure 8.13. The equilibrium constant of
mineral reactions for gypsum and anhydrite are very close whilst their enthalpies o f reaction
are different, leading to a different behaviour o f these two minerals at the regions with higher
temperature. The distribution o f the dissolved sulfate at hot end is believed to be attributed to
the precipitation o f anhydrite due to the higher temperature.
0 . 2
0.15oxn"Ocn
0.10)cTJ>»
-C£Z<
- - 6 months
12 months0.0524 months
92 months
0.2 0.3 0.4 0.5 0.60 0.1D istance from the heater (m)
Figure 8.13 Profiles o f anhydrite contents resulting from the numerical simulation at different times
The results, presented in figure 8.13, indicate that anhydrite has been precipitated in the
vicinity o f heater in a considerable amount. The amount o f precipitated anhydrite has reached
to about 0.125 m ol/kg soil for the period o f 92 months by the heater. On the other hand, the
system initially contained 5.43><10'3 (mol/kg) gypsum. Also from figure 8.11 it can be seen
that gypsum was dissolved in the hydration side due to the reduction o f dissolved chemicals
o f calcium and sulfate in this region. In the model, gypsum behaviour was considered in
instantaneous equilibrium with dissolved calcium and sulfate. Therefore gypsum was
dissolved into the system to provide the balance between mineral phase and dissolved calcium
and sulfate which were flushed towards the heater.
8-35

Chapter 8 Numerical Simulation of the Coupled THC Behaviour of Compacted Bentonite
8 .5 .3 .4 S u l f a t e ( S 0 42 ) d is t r ib u t io n (P o s t -m o r te m s im u la t io n r e s u l t s )
Figure 8.14 presents a comparison between post-mortem model results and the experimental
results for the dissolved sulfate ion concentration at different time intervals. From this figure
it can be seen that there is a reasonable qualitative agreement in terms o f distribution pattern
between the model and experimental results for all time intervals. In the area o f hydration,
numerical model predicted the precipitated magnitude o f sulfate close to those reported in the
experiment. However the locations o f peaks are slightly different in the model compared with
the experimental results.
0.12
oCO
"Oo> 0.08
oE,
Oco0.04
00 0.1 0.2 0.3 0.4 0.5 0.6
Distance from the heater (m)
Figure 8.14 Profiles o f dissolved sulfate contents at different times, resulted from the post-mortem simulation (lines) and experimental results (symbols) reported by Fernandez and Villar (2010)
As stated by Fernandez and Villar (2010) gypsum is more stable at ambient conditions, the
transition o f gypsum to anhydrite being above 43-57 °C and anhydrite seemed to have
precipitated close to the heater, decreasing the sulfate concentration in this zone. The model
shows also an over-prediction at the hot end and an under-prediction in the area close to the
hot end, affected by the coupled thermally induced liquid-vapour movement. It is suggested
that the over-prediction at the hot end is due to the high amount o f anhydrite precipitation in
the in-place numerical modelling results (refer to figure 8.13).
------- - 6 months□ 6 month-Exp.
— 12 monthso 12 months-Exp.
• - 24 months♦ 24 months-Exp.
— 92 monthsA 92 months-Exp.X Initial-Exp.
8-36

Chapter 8 Numerical Simulation of the Coupled THC Behaviour of Compacted Bentonite
8 .5 .3 .5 B ic a r b o n a te (H C 0 3 ) d i s t r ib u t io n ( I n - p la c e a n a ly s is r e s u l t s )
Figure 8.15 shows the results o f numerical simulation for the dissolved bicarbonate at
different times in the domain. The concentration o f bicarbonate has been increased close to
the hydration side due to the higher concentration at the boundary. The concentration peaks
are located about 58 mm from the hydration side with considerable increases with time.
Higher amount o f bicarbonate than the initial values was injected by the water at this
boundary and accumulated in a limited region close to the boundary.
5.E-03
- - 6 m onths
12 months4.E-03
24 m onths
92 m onths
^ 3.E-03"Dcn
2.E-03
1.E-03 -
Initial0.E+00
0.2 0.3 0.4 0.5 0.60.10D istance from the heater (m)
Figure 8.15 Profiles o f the bicarbonate contents resulting from the numerical simulation at differenttimes
Due to the considerable low rate o f precipitation/dissolution o f calcite, the initial amount o f
calcite was not changed for different periods o f analysis. The XRD analysis reported by Villar
et al. (2008b) also showed that in the 92 months test, a slight decrease in the calcite content
with respect to the original bentonite was detected in all the powder samples after the test.
Therefore, the behaviour o f bicarbonate was not affected by calcite reactions.
8-37
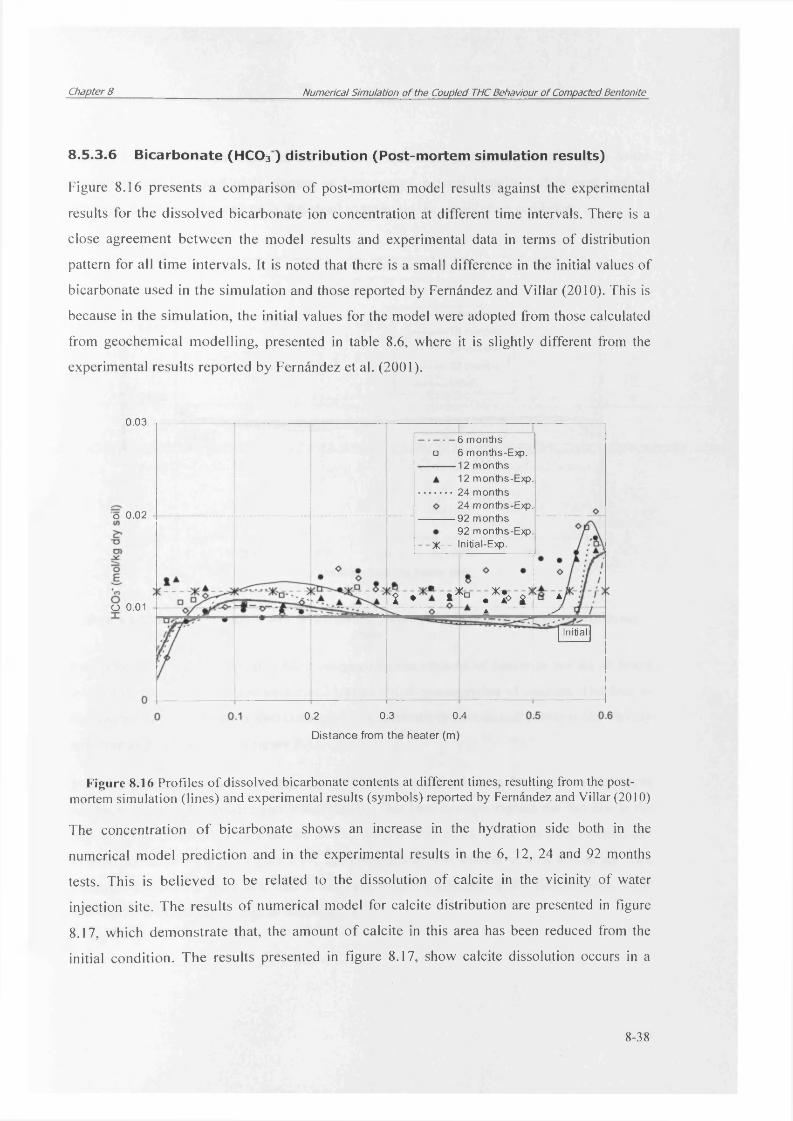
Chapter 8 Numerical Simulation of the Coupled THC Behaviour of Compacted Bentonite
8 .5 .3 .6 B ic a r b o n a te (H C 0 3 ) d i s t r ib u t io n ( P o s t - m o r te m s im u la tio n r e s u l ts )
Figure 8.16 presents a comparison o f post-mortem model results against the experimental
results for the dissolved bicarbonate ion concentration at different time intervals. There is a
close agreement between the model results and experimental data in terms o f distribution
pattern for all time intervals. It is noted that there is a small difference in the initial values o f
bicarbonate used in the simulation and those reported by Fernandez and Villar (2010). This is
because in the simulation, the initial values for the model were adopted from those calculated
from geochemical m odelling, presented in table 8 .6 , where it is slightly different from the
experimental results reported by Fernandez et al. (2001).
0.03
-----------6 months□ 6 months-Exp.
12 months 12 months-Exp. 24 months 24 months-Exp. 92 months 92 months-Exp.
o 0.02
X- - Initial-Exp.
2 ♦ I *n . *J> AO 0.01
Initial
0.2 0.3 0.4
D istance from th e heate r (m)
Figure 8.16 Profiles o f dissolved bicarbonate contents at different times, resulting from the postmortem simulation (lines) and experimental results (symbols) reported by Fernandez and Villar (2010)
The concentration o f bicarbonate shows an increase in the hydration side both in the
numerical model prediction and in the experimental results in the 6 , 12, 24 and 92 months
tests. This is believed to be related to the dissolution o f calcite in the vicinity o f water
injection site. The results o f numerical model for calcite distribution are presented in figure
8.17, which demonstrate that, the amount o f calcite in this area has been reduced from the
initial condition. The results presented in figure 8.17, show calcite dissolution occurs in a
8-38

Chapter 8 Numerical Simulation of the Coupled THC Behaviour of Compacted Bentonite
region o f about 100 mm close to the hydration side. This is because in this region lower
amount o f calcium and high amount o f bicarbonate existed initially before post-mortem
analyses. As the results, calcite is dissolved to maintain the equilibrium condition.
0.090 —
0.075 -
o(A
TJO)| j 0.060 -oE,0)o(TJo
0.045 -
0.030 -0 0.1 0.2 0.3 0.4 0.5 0.6
D istance from the heater (m)
Figure 8.17 Profiles of calcite distribution resulting from the post-mortem simulation at differenttimes
Precipitation o f calcite has also been occurred in the vicinity o f heater as results o f lower
initial concentrations o f bicarbonate and higher initial concentration o f calcium. The drop in
the amount o f bicarbonate is also correlated to a reduction in the amount calcite in the vicinity
o f heater as it can be seen in figure 8.17.
Similar explanation about the behaviour o f bicarbonate and calcite in the experimental results
has been given by Fernandez and Villar (2010). This idea can also explain the fact that in the
regions about 50 to 300 mm from the heater, that the amount o f calcite has been reduced due
to dissolution according to figure 8.17, and consequently the amount o f bicarbonate has been
increased in all time intervals. This is the area which is affected by the simultaneous water
and vapour transfer due to higher temperature.
6 months
8-39

Chapter 8 Numerical Simulation of the Coupled THC Behaviour of Compacted Bentonite
8 .5 .3 .7 S o d iu m ( N a +) d is t r ib u t io n ( I n - p la c e a n a ly s is r e s u l t s )
Figure 8.18 presents the results o f numerical simulation for dissolved sodium at different
times in the domain. It can be seen that the trends for sodium concentration variations follow
a similar pattern as observed in the case o f chloride (refer to figure 8.9). The concentration of
sodium is reduced in the vicinity o f hydration side due to the advection process. The flushed
sodium is accumulated in the first half o f the domain away from the hydration side, with
almost constant peak values.
0.03
S ' 0.02Initial
o>
6 months
12 months
- • 24 months
92 months
0.50.2 0.3 0.4 0.60 0.1Distance from the heater (m)
Figure 8.18 P ro f i le s o f th e d is s o lv e d so d iu m co n ten ts re su ltin g from th e n u m erica l s im u la tio n atd if fe re n t tim es
The accumulated sodium ions, flushed by water has been transferred by water and through
diffusion further toward the heater, providing an area with greater amount o f sodium than the
initial ranges between 50 mm to 350 mm away from the hydration source.
In the area which is affected by temperature, simultaneous water and vapour flow due to
temperature gradient affects the behaviour o f sodium similar to chloride. In addition, ion
exchange reactions also affect the available sodium in the system, as will be discussed in
section (8.5.4).
8-40

Chapter 8 Numerical Simulation of the Coupled THC Behaviour of Compacted Bentonite
8 .5 .3 .8 S o d iu m (N a +) d i s t r ib u t io n ( P o s t - m o r te m s im u la t io n r e s u l t s )
Figure 8.19 presents a comparison o f post-mortem model results against the experimental
results for the dissolved sodium in the domain at different times. The general trend for
distribution o f sodium ions is in agreement with those form experimental results for all time
intervals. However, in the vicinity o f heater higher concentrations o f sodium were predicted
by the model which can be related to the higher drying exhibited in the periods o f 6 , 12, 24
months at this region predicted by the numerical model.
0.2
0.15
o</)T3
0.1
0.05
— i- - - - - - - - - - - - - - - - - - - - - - - - - 1- - - - - - - - - - - - - - - - - - - - - - - - 1- - - - - - - - - - - - - - - - - - - - - - - - - i- - - - - - - - - - - - - - - - - - - - - -
0.2 0.3 0.4 0.5 0.6
D istance from the heater (m)
6 months□ 6 months-Exp.
12 monthsa 12 months-Exp.
24 months• 24 months-Exp.
92 monthso 92 months-Exp.X initial-Exp.
Figure 8.19 P ro f i le s o f th e d is s o lv e d so d iu m co n ten ts a t d iffe ren t tim es , re su ltin g fro m th e p o s tm o r te m s im u la tio n ( l in e s ) a n d e x p e r im e n ta l re su lts (sy m b o ls ) rep o rted by F e rn a n d e z an d V illa r (2 0 1 0 )
The transport processes o f sodium ions have only been affected by the ion exchange reaction
as sodium ions were not involved in any mineral precipitation and dissolution reactions. Part
o f the high accumulation o f sodium ions in the vicinity o f heater can be related to the ion
exchange process as will be discussed in section (8.5.4).
8-41

Chapter 8 Numerical Simulation of the Coupled THC Behaviour of Compacted Bentonite
8 .5 .3 .9 C a lc iu m (C a 2+) d i s t r ib u t io n ( I n - p la c e a n a ly s is r e s u l t s )
Figure 8.20 presents the profiles o f the calcium ion distribution in the domain resulted from
the numerical simulation at different times. The concentration o f calcium was reduced in the
vicinity o f hydration side due to the advection process and the flushed sodium in this region
was accumulated in the first 300 mm from the water injection side.
0.005
0.004
Initialo£ 0.003T3CD
■5~ 0.002
CMTOo 6 months
12 months
- - 24 months0.001
92 months
0.2 0.3 0.4 0.5 0.60 0.1D istance from the heater (m)
Figure 8.20 Profiles o f the dissolved calcium contents resulted from the numerical simulation atdifferent times
The concentration o f calcium was also increased close to the heater and reduced in the area
between about 50 to 300 mm from the heater. This behaviour is affected by temperature and
simultaneous water and vapour flow.
Dissolved calcium has been involved in four geochemical processes which have affected the
calcium behaviour. These geochemical reactions included anhydrite, gypsum and calcite
reactions and ion exchange. Since calcite dissolution was considered as a kinetically
controlled reaction and no sign o f calcite variation was observed (as discussed previously),
therefore it is believed that only gypsum and anhydrite dissolution-precipitations has been
affected on the behaviour o f calcium among all mineral reactions.
8-42
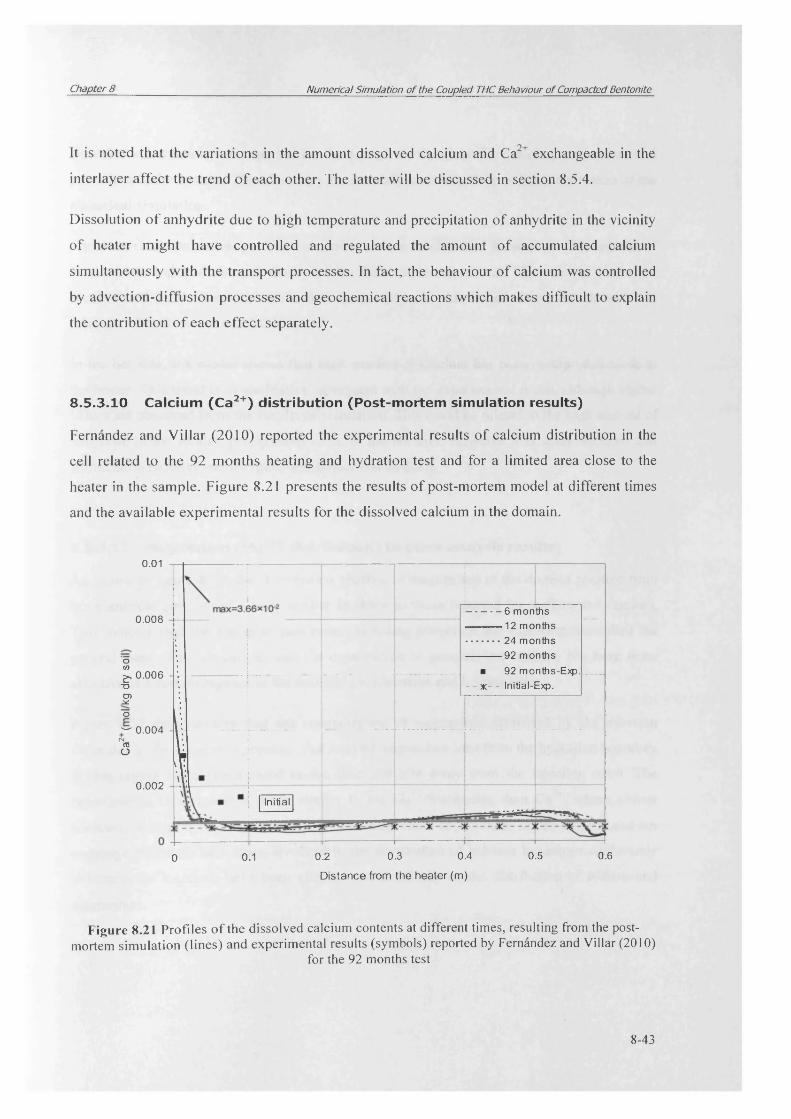
Chapter 8 Numerical Simulation of the Coupled THC Behaviour of Compacted Bentonite
It is noted that the variations in the amount dissolved calcium and Ca2+ exchangeable in the
interlayer affect the trend o f each other. The latter will be discussed in section 8.5.4.
Dissolution o f anhydrite due to high temperature and precipitation o f anhydrite in the vicinity
o f heater might have controlled and regulated the amount o f accumulated calcium
simultaneously with the transport processes. In fact, the behaviour o f calcium was controlled
by advection-diffusion processes and geochemical reactions which makes difficult to explain
the contribution o f each effect separately.
8 .5 .3 .1 0 C a lc iu m (C a 2+) d i s t r i b u t io n ( P o s t - m o r te m s im u la t io n r e s u l t s )
Fernandez and Villar (2010) reported the experimental results o f calcium distribution in the
cell related to the 92 months heating and hydration test and for a limited area close to the
heater in the sample. Figure 8.21 presents the results o f post-mortem model at different times
and the available experimental results for the dissolved calcium in the domain.
0.01
5 months---------- 12 months 24 months---------- 92 months
■ 92 months-Exp.- - x - - Initial-Exp.
0.008
o10 0.006
T>O)JX.O~ 0.004
CM03o
0.002Initial
0.3 0.4 0.5 0.60.20.10D istance from the heater (m)
Figure 8.21 Profiles o f the dissolved calcium contents at different times, resulting from the postmortem simulation (lines) and experimental results (symbols) reported by Fernandez and Villar (2010)
for the 92 months test
8-43

Chapter 8 Numerical Simulation of the Coupled THC Behaviour of Compacted Bentonite
No other information was reported for the rest of the durations for calcium, magnesium and
potassium in the system. Therefore very limited data are available to validate the results of the
numerical simulation.
The numerical simulation predicted a similar pattern as observed for sodium. The amount of
calcium was reduced close to the hydration from the initial amount. The calcium ions were
accumulated in the first half o f the domain in hydration side for all time intervals which is
related to the advection mechanism.
In the hot side, the model shows that high amount of calcium has been precipitated close to
the heater. This trend is in qualitative agreement with the experimental result, although higher
values are observed from the results o f simulation. This could be related to the high amount of
anhydrite in the model, precipitated close to the hot end. However it is acknowledged that
justification requires more experimental data and analysis.
8.5.3.11 Magnesium (Mg2*) distribution (In-place analysis results)
As shown in figure 8.22, the distribution profiles of magnesium in the domain resulted from
the numerical simulation is very similar in shape to those reported for sodium and calcium.
This indicate that the transport processes, including advection and diffusion controlled the
general trend o f major cations and the contribution of geochemical reaction has been more
effective in a certain regions in the domain, i.e. hydration and heating sides.
Figure 8.22 demonstrates that the concentration of magnesium decreased by the injecting
water due to the advection process. The leached magnesium ions from the hydration boundary
in this region were precipitated in the first 250 mm away from the injection point. The
behaviour in this region is more similar to the Na+ distribution than Ca2+, where almost
constant concentration peaks are seen in both magnesium and sodium. In fact mineral and ion
exchange reactions have been involved in the distribution of calcium behaviour whilst only
ion exchange reactions have been affected geochemically on the distribution of sodium and
magnesium.
8-44

Chapter 8 Numerical Simulation of the Coupled THC Behaviour of Compacted Bentonite
0.008
0.006
oto
cn V0.004
InitialEAo> - - 6 m onths
12 months0.002
24 m onths
92 m onths
0 0.1 0.2 0.3 0.4 0.60.5
Distance from the heater (m)
Figure 8.22 P ro f ile s o f th e m a g n e s iu m c o n te n ts re s u ltin g fro m th e n u m erica l s im u la tio n a t d iffe ren tt im e s
Since dissolution/precipitation o f dolomite was not considered in this numerical simulation,
there is some uncertainty about the fate o f magnesium in the domain. However it is suggested
that transport processes had a greater contribution to the distribution o f magnesium.
8 .5 .3 .1 2 M a g n e s iu m (M g 2+) d i s t r ib u t io n ( P o s t - m o r te m s im u la tio n r e s u l t s )
The available experimental results reported by Fernandez and Villar (2010) for magnesium
distribution is also limited for the duration o f 92 months test and only for a limited regions
closed to the heater similar to the calcium case. Therefore this limited data is used to check
the results o f the numerical simulation. Figure 8.23 shows the results o f post-mortem model at
different times and the available experimental results for the dissolved magnesium in the
domain.
The numerical simulation predicted a similar pattern as observed for sodium and calcium. The
amount o f magnesium was reduced close to the hydration from the initial amount. The
8-45

Chapter 8 Numerical Simulation of the Coupled THC Behaviour of Compacted Bentonite
leached calcium ions were accumulated in first half o f the domain in hydration side for all
time intervals. The concentration o f magnesium was increased close to the heater and reduced
in the area between about 50 to 300 mm from the heater. This trend is in qualitative
agreement with the experimental result.
oV)
T 3O)oE
0.01
0.008
0.006 ^
0.004
0.002
max=3.32*1 O’2
Initial
6 m onths
12 m onths
24 m onths
---------- 92 m onths
- - - Initial-Exp.
■ 92 months-Exp.
0.2 0.3 0.4
Distance from the heater (m)
Figure 8.23 Profiles o f the dissolved magnesium contents at different times, resulting from the postmortem simulation (lines) and experimental results (symbols) reported by Fernandez and Villar (2010)
for the 92 months test
Fernandez and Villar (2010) stated that the magnesium increase in the experimental results
can be a consequence o f different processes influenced by temperature (near the heater) and
the advance o f the water front along the bentonite column. They reported the effective
geochemical reactions on magnesium behaviour as: precipitation o f calcite closed to the
hottest zones; dolom ite dissolution simultaneously enhanced by the temperature, calcite
precipitation, and dissolution o f sulphate; and the release o f Mg2+ from the interlayer o f
smectite in the coolest zone due to calcite and sulphate (gypsum) dissolution. It is noted that
dolomite reaction was not considered in the simulation mainly because the initial amount was
not reported in the literature clearly (e.g. whilst it was required in the geochemical modelling
o f the initial pore fluid composition). The absence o f dolomite in the reactions applied in the
8-46

Chapter 8 Numerical Simulation of the Coupled THC Behaviour of Compacted Bentonite
numerical simulation, has limited the contribution o f different geochemical mechanisms to the
ion exchange reaction. This will be discussed in the ion exchangeable section.
8 .5 .3 .1 3 P o ta s s iu m (K +) d i s t r ib u t io n ( I n - p la c e a n a ly s is r e s u l t s )
Figure 8.24 shows the distribution profiles o f potassium in the domain resulted from the
numerical simulation for different periods o f time. Close similarity exists between the
behaviour o f potassium and other cations in terms o f general distribution pattern. As
mentioned previously, the behaviour is believed to be more controlled by advection-diffusion
process and less by geochem ical reactions.
3.0E-04
- - 6 m onths2.5E-04 - 12 m onths
24 m onths
92 m onths^ 2.0E-04
Initialo> 1.5E-04
1.0E-04
5.0E-05
0.0E+000.50.2 0.3 0.4 0.60.10
Distance from the heater (m)
Figure 8.24 Profiles of potassium contents resulting from the numerical simulation at different times
From this figure it can be seen that the concentration o f potassium has decreased close the
injecting water due to the advection process. The flushed ions in this region were precipitated
in the region between 50 to 350 mm away from the injection point. The behaviour in this
region is more similar to the Na+ and Mg2+ in terms o f distribution pattern where almost
constant concentration peaks are seen in all three cations. Only ion exchange reactions have
8-47
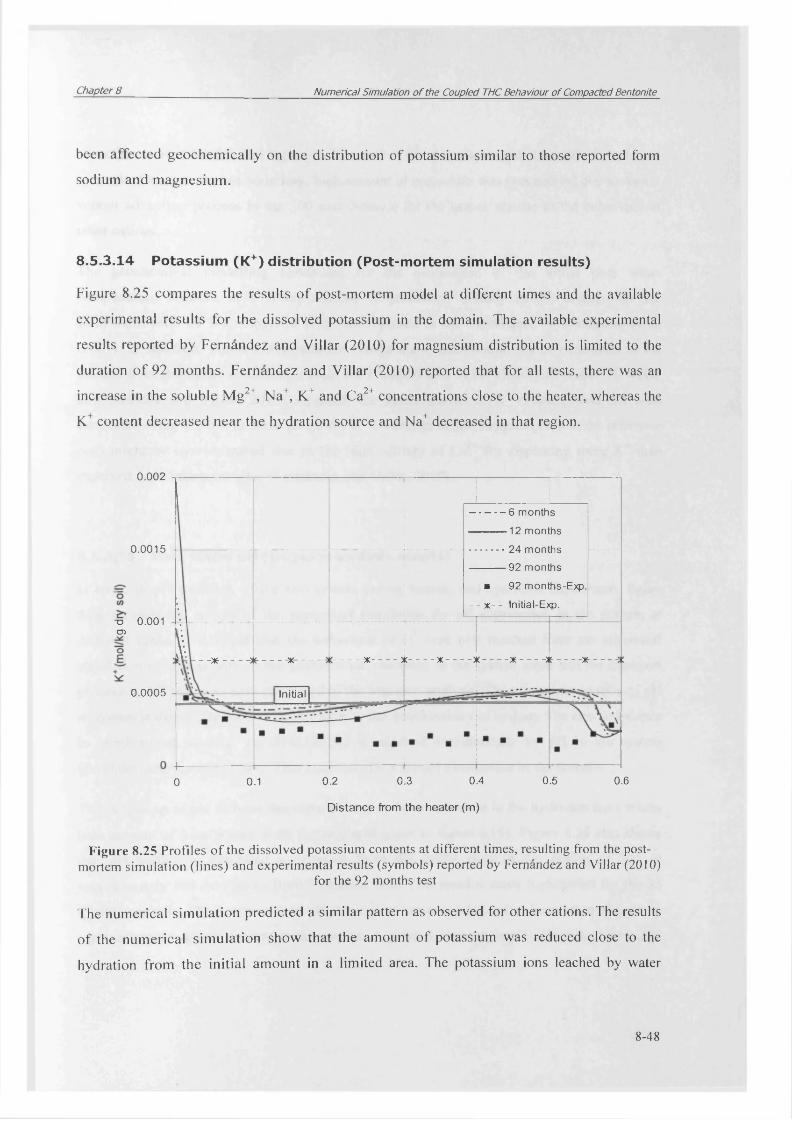
Chapter 8 Numerical Simulation of the Coupled THC Behaviour of Compacted Bentonite
been affected geochem ically on the distribution o f potassium similar to those reported form
sodium and magnesium.
8 .5 .3 .1 4 P o ta s s iu m (K +) d i s t r i b u t io n ( P o s t - m o r te m s im u la t io n r e s u l t s )
Figure 8.25 compares the results o f post-mortem model at different times and the available
experimental results for the dissolved potassium in the domain. The available experimental
results reported by Fernandez and Villar (2010) for magnesium distribution is limited to the
duration o f 92 months. Fernandez and Villar (2010) reported that for all tests, there was an
increase in the soluble Mg2+, Na+, K+ and Ca2+ concentrations close to the heater, whereas the
K+ content decreased near the hydration source and Na+ decreased in that region.
0.002
6 months
---------- 12 months
24 months
92 months
■ 92 months-Exp.
- - x - - Initial-Exp.
0.0015 -
-a 0.001 o>
- - x *- x x * x )jc x i — -x- —
0.0005 - Initial
0.50.2 0.3 0.4 0.60.10
Distance from the heater (m)
Figure 8.25 Profiles o f the dissolved potassium contents at different times, resulting from the postmortem simulation (lines) and experimental results (symbols) reported by Fernandez and Villar (2010)
for the 92 months test
The numerical simulation predicted a similar pattern as observed for other cations. The results
o f the numerical simulation show that the amount o f potassium was reduced close to the
hydration from the initial amount in a limited area. The potassium ions leached by water
8-48

Chapter 8 Numerical Simulation of the Coupled THC Behaviour of Compacted Bentonite
advection were added in the region in first half of the domain in hydration side for all time
intervals. Close to the hot boundary, high amount of potassium was precipitated due to water-
vapour advection process in the 300 mm distance for the heater, similar to the behaviour of
other cations
The geochemical modelling conducted for the assessment of the initial pore water
composition, resulted in a lower amount of potassium initially in the domain for the
solid/water ratio o f 1/4 compared with that reported in the experiment by Fem&ndez et al.
(2001). In addition, numerical simulation results show small variations of potassium in the
domain from the initial condition, except for a limited area in the vicinity of heater. However
as Fernandez and Villar (2010) reported, the determination of K+ exchangeable has been
conducted using CSNO3 method where the K+ content in all the samples (even in the reference
one) might be overestimated due to the high affinity of Cs2+ for displacing more K+ than
expected from interlayer sites (Fernandez and Villar, 2010).
8.5.3.15 Pore w ater pH (In-place analysis results)
In terms of pH variation o f the soil system during heating and hydration experiment, figure
8.26 presents the results o f the numerical simulation for pH distribution in the domain at
different times. It is noted that the behaviour o f H+ (and pH) resulted form the numerical
simulation is related only to the geochemical reactions in the system since and the transport
process of H+ ions was not considered in the transport analysis. Therefore the variation of pH
in system is directly related to the changes in the geochemistry of system. The charge balance
in geochemical module, i.e. PHREEQC, is adjusted automatically by pH in the system
(Parkhurst and Appelo, 1999). This also can affect the pH distribution in the domain.
The behaviour o f pH follows the same pattern as the bicarbonate in the hydration zone where
high amount o f bicarbonate were accumulated (refer to figure 8.15). Figure 8.26 also shows
that pH variations exhibited a decrease from the initial state in the region of 200 to
approximately 500 mm away from hydration side. This trend is more highlighted for the 92
months analysis. The decrease o f pH in this region can be related to the dissolution of gypsum
and increase in sulfate content in this region. A general increase in pH values is observed in
8-49

Chapter 8 Numerical Simulation of the Coupled THC Behaviour of Compacted Bentonite
the area o f 1 0 0 mm close to the heater side which can be related to the precipitation o f
anhydrite where the gypsum content was reduced.
1 0
6 months
12 months
924 months
92 months
8
Initial
7
60.1 0.2 0.3 0.4 0.5 0.60
Distance from the heater (m)
Figure 8.26 P ro f i le s o f p H d is tr ib u tio n in th e d o m ain re su ltin g from th e n u m erica l s im u la tio n atd if fe re n t tim es
8 .5 .3 .1 6 P o re w a t e r pH ( P o s t - m o r te m s im u la tio n re s u l ts )
The experimental results have been only reported for the period o f 92 months. These
experimental results are compared with the experimental results. Figure 8.27 presents a
comparison o f post-mortem model results against the experimental results for the dissolved
sodium in the domain at different times.
The model results follow same pattern as the bicarbonate variation as shown in figure 8.16.
The pH o f the system increased in the hydration side and decreased in the hot bottom similar
to the pattern o f bicarbonate presented in figure 8.11. The latter is in qualitative agreement
with the trend observed in the experiment and reported by Fernandez and Villar (2010). It is
also noted that the lowering pH in the heater side can be related to the precipitation o f calcite.
Similarly calcite dissolution has controlled the pH increase in the hydration side.
8-50

Chapter 8 Numerical Simulation of the Coupled THC Behaviour of Compacted Bentonite
Initial
8 n -A-—a-x- a-----*-------- * — * * ------------ * —
XCL 6 m onths
12 m onths
24 m onths
92 m onths
a 92 months-Exp.
— o— R eference pH-Exp. Fernandez et al. 2004
- - x — R eference pH-Exp. H uertas e ta l. 2000
0.2 0.4 0.50 0.1 0.3 0.6Distance from the heater (m)
Figure 8.27 Profiles o f the pH distribution in the domain at different times, resulting from the postmortem simulation (lines) and the experimental results (symbols) reported by Fernandez and Villar
(2010) for the 92 months heating and hydration test
The values o f pH reported by Fernandez and Villar (2010) for the 92 months experiment are
generally lower than the pH values resulted from the numerical simulation. This is because o f
the difference in the initial pH value o f the soil in the numerical simulation and in the
experiment reported by Fernandez and Villar (2010). The initial pH value calculated from the
geochemical pore water simulation, presented in table 8 . 6 was used as the reference value for
the numerical simulation results. As stated in section 8.2, the reference value o f pH o f the soil
at solid/water ratio o f }A (i.e. pH=8.60) is in close agreement with the experimental value
reported by Fernandez et al. (2004) for the same water/solid ratio (i.e. pH=8.73). However,
the pH o f the FEBEX bentonite at the same solid/water ration reported by ENRESA (2000)
(i.e. pH=7.93) is different from the value given by Fernandez (2004). The variation o f the pH
after 92 month heating and hydration is closer to the value o f pH reported by ENRESA
(2000). The difference can be related to variations o f the FEBEX material and its constituents
used in ENRESA (2000) and Fernandez et al. (2004).
8-51

Chapter 8 Numerical Simulation of the Coupled THC Behaviour of Compacted Bentonite
8 .5 .3 .1 7 E x c h a n g e a b le io n s d is t r ib u t io n ( I n - p la c e a n a ly s is r e s u l t s )
The results o f the numerical model for the distribution o f Ca2+, Mg2+, Na+ and K+
exchangeable ions are presented in figures 8.28, 8.29, 8.30 and 8.31, respectively, at different
time periods. The results show that except for limited regions close to the boundaries small
variations from the initial condition have occurred in the composition o f the exchangeable
ions.
0.2
0.18oto
T3O) initial
0.16oE
JDXlro<u0.14
CDXoXCD+o 0.12
- - 6 months
12 months
24 months
92 months
0.10 0.1 0.2 0.3 0.4 0.5 0.6
D istance from the heater (m)
Figure 8.28 Profiles o f the exchangeable calcium contents resulting from the numerical simulation atdifferent times
Close to the hydration boundary greater amount o f Ca2+ exchangeable ions and lower amount
Na+ exchangeable ions are observed. The values for magnesium and potassium varied also
slightly in this region. A s shown in figure 8.12, dissolution o f gypsum in this region has
resulted in higher amount o f calcium ions which has replaced sodium ions in the interlayer. In
other words, sodium ions are released into the system and calcium ions are replaced on to the
vacant sodium sites leading to an increase in Ca2+ exchangeable concentration.
With regards to K+ and Mg2+ exchangeable concentrations, they remain nearly constant over
the range o f solid to liquid ratios as these ions are not greatly influenced by
dissolution/precipitation process unlike sodium and calcium whose concentrations depends on
8-52

Chapter 8 Numerical Simulation of the Coupled THC Behaviour of Compacted Bentonite
the solubility o f halite, calcite, gypsum and anhydrite (Fernandez et al., 2000; ENRESA,
2000).
0.2
- - 6 monthso(/) 12 months
24 months0.18
92 monthsoEJS?X )03030 3C03
szInitial
o 0.16 x <D+CN
0.140.2 0.40 0.1 0.3 0.5 0.6
D istance from the heater (m)
Figure 8.29 Profiles o f the exchangeable magnesium contents resulting from the numerical simulationat different times
Close to the heater, exchangeable composition shows higher amount o f sodium and
magnesium than the initial state. On the other hand calcium and potassium exchangeable ions
reduced. In the region close to the heater, precipitation o f anhydrite and dissolution o f gypsum
affects the exchangeable ions composition. The pore fluid in this region was more
concentrated with sodium and magnesium than calcium due to the precipitation o f anhydrite.
This resulted to the replacement o f calcium exchangeable ions with sodium and calcium. To a
lesser extent potassium exchangeable ions have been also replaced by sodium and magnesium
ions in the interlayer, providing the equilibrium condition in exchangeable composition.
8-53
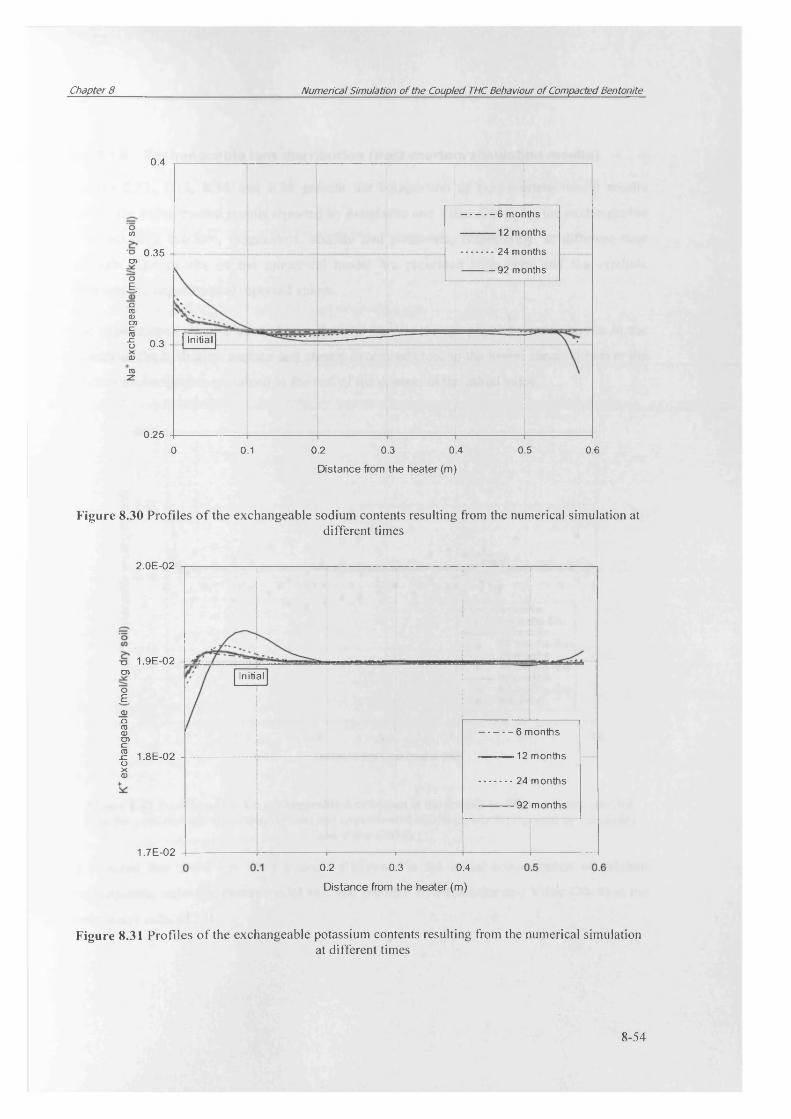
Chapter 8 Numerical Simulation of the Coupled THC Behaviour of Compacted Bentonite
0.4
6 monthsocn
■o 0.35 cn
12 months
24 months
92 monthsoE.
-QTOBcncaj=ux0)
Initial0.3
TOz
0.250 0.1 0.2 0.3 0.4 0.5 0.6
Distance from the heater (m)
Figure 8.30 Profiles o f the exchangeable sodium contents resulting from the numerical simulation atdifferent times
2.0E-02
T 3cn
"oE.0)_Qro(Ucncros zoX(U
1.9E-02 -J
1.8E-02
1.7E-02
Initial
6 months
12 months
24 months
92 months
0.2 0.3 0.4
D istance from the heater (m)
Figure 8.31 Profiles of the exchangeable potassium contents resulting from the numerical simulationat different times
8-54

Chapter 8 Numerical Simulation of the Coupled THC Behaviour of Compacted Bentonite
8 .5 .3 .1 8 E x c h a n g e a b le io n s d is t r ib u t io n ( P o s t -m o r te m s im u la tio n r e s u l ts )
Figures 8.32, 8.33, 8.34 and 8.35 present the comparison o f post-mortem model results
against the experimental results reported by Fernandez and Villar (2010) for the exchangeable
ions including calcium, magnesium, sodium and potassium, respectively, at different time
intervals. The results o f the numerical model are presented with lines and the symbols
represent the experimental reported values.
The experimental results have shown that the Ca2+ exchange population was higher in the
vicinity o f the hydration surface and clearly decreased close to the heater zone.. However the
calcium exchangeable remained in the rest o f the domain as the initial value.
0.26
0.22 -
2?■Ocn
“oE,0) 0.18
-Q CD CD C CDszoX3
0.14
0.1
■g—
□ ° □ 3 . _
□ □□
□ A
A
o □ A A A r — i*L ..... Initial _
. <o□
------
------
----
O •
o •
\ •
• 1 \
1 A A V A A■V - - X o j i — X - , )
o
e* - K - - - - * Jo□
----------6 monthsa 6 months-Exp.
a 12 months-Exp.o
V V
--------------1 ■ r~ — -" - " ■ H
............ 24 months• 24 months-Exp.
----------92 monthso 92 months-Exp.
Initial-Exp.
I0.1 0.2 0.3 0.4
D istance from the heater (m)
0.5 0.6
Figure 8.32 Profiles o f the Ca exchangeable distribution in the domain at different times, resulted from the post-mortem simulation (lines) and experimental results (symbols) reported by Fernandez
and Villar (2010)
It is noted that there has been a small difference in the initial concentration o f calcium
exchangeable values between model and that reported by Fernandez and Villar (2010) at the
solid/water ratio o f 1/4.
8-55

Chapter 8 Numerical Simulation of the Coupled THC Behaviour of Compacted Bentonite
As Fernandez and Villar (2010) reported, in the case o f 92 month test the sum o f the
exchangeable cations, i.e. CEC, has shown an increase from the original value for FEBEX
bentonite from 102 to 106 meq/lOOgr soil. Therefore they have normalised all the results with
respect to the resulted CEC (refer to figure 8.5). However total exchangeable cations
remained constant and equal to the initial value in the numerical simulation for all time
periods. The general increase from the initial value observed in experimental results for
calcium exchangeable can be related to this modification.
0.25
T3cn
"oE,0)-Orocn
0.2 h
P 0.15
0.1
oo o
A A• □
A A A A D D O a AD X A x D - A X ^ ° X O A.X S . X ° I X ° » X * Initial *
6 months□ 6 months-Exp.
---------- 12 monthsa 12 months-Exp
24 months• 24 months-Exp.
----------92 monthso 92 months-Exp.
- - x - - Initial-Exp.
0.1 0.2 0.3 0.4 0.5 0.6
D istance from the heater (m)
Figure 8.33 Profiles o f the Mg exchangeable distribution in the domain at different times, resulting from the post-mortem simulation (lines) and experimental results (symbols) reported by Fernandez
and Villar (2010)
Experimental results show that exchangeable Mg2+ concentration decreased close to the
hydration source and increased significantly in the 150 mm closest to the heater. Fernandez
and Villar (2010) stated that the increase in exchangeable magnesium in the 200 mm closest
to the heater observed in the longest test and to a much lesser extent in the 24 months test
could be related to the dissolution o f dolomite. However since dolomite was not considered in
simulation as previously discussed in section 8.5.3.12, the increase in the amount o f
8-56
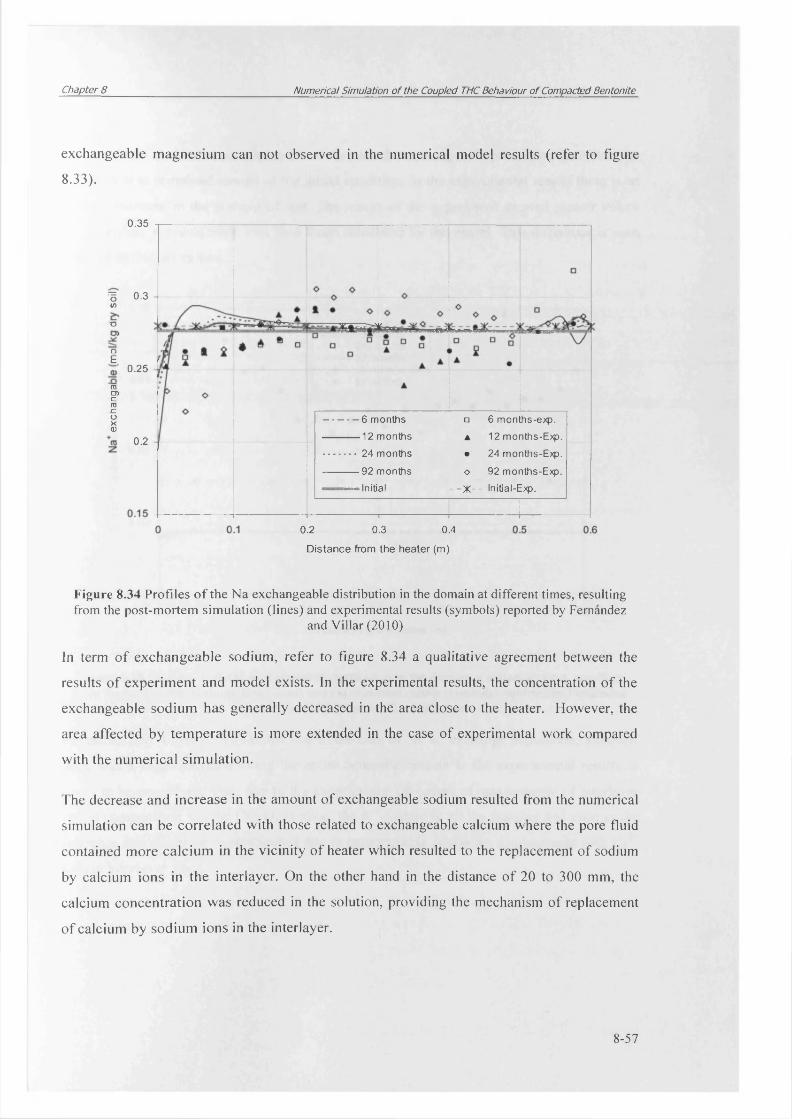
Chapter 8 Numerical Simulation of the Coupled THC Behaviour of Compacted Bentonite
exchangeable
8.33).
0.35
^ 0.3in
"O
oE,
■CDc0 3
-CoX0)
0.25
0.2
a sip
----------6 months □ 6 months-exp.---------- 12 months ▲ 12 months-Exp............. 24 months • 24 months-Exp.
----------92 months o 92 months-Exp.-u... initial - X - - Initial-Exp.
magnesium can not observed in the numerical model results (refer to figure
0.2 0.3 0.4
D istance from the heater (m)
Figure 8.34 Profiles o f the Na exchangeable distribution in the domain at different times, resulting from the post-mortem simulation (lines) and experimental results (symbols) reported by Fernandez
and Villar (2010)
In term o f exchangeable sodium, refer to figure 8.34 a qualitative agreement between the
results o f experiment and model exists. In the experimental results, the concentration o f the
exchangeable sodium has generally decreased in the area close to the heater. However, the
area affected by temperature is more extended in the case o f experimental work compared
with the numerical simulation.
The decrease and increase in the amount o f exchangeable sodium resulted from the numerical
simulation can be correlated with those related to exchangeable calcium where the pore fluid
contained more calcium in the vicinity o f heater which resulted to the replacement o f sodium
by calcium ions in the interlayer. On the other hand in the distance o f 20 to 300 mm, the
calcium concentration was reduced in the solution, providing the mechanism o f replacement
o f calcium by sodium ions in the interlayer.
8-57
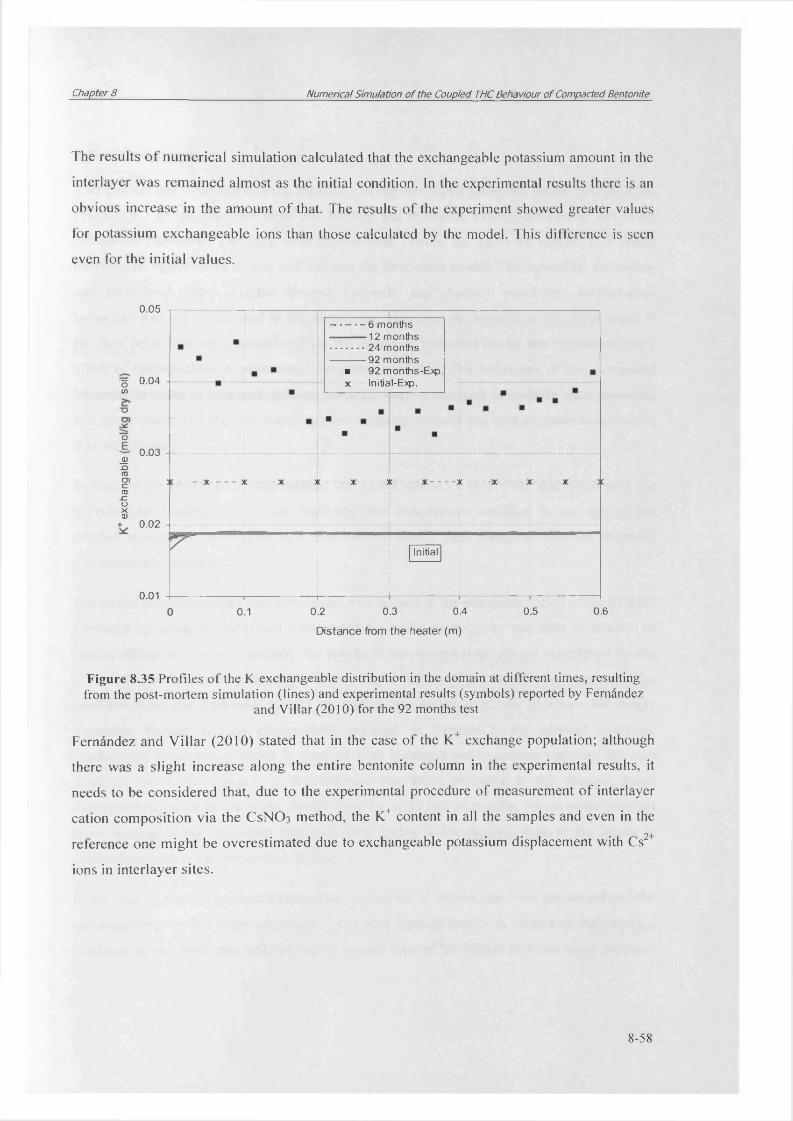
Chapter 8 Numerical Simulation of the Coupled THC Behaviour of Compacted Bentonite
The results o f numerical simulation calculated that the exchangeable potassium amount in the
interlayer was remained almost as the initial condition. In the experimental results there is an
obvious increase in the amount o f that. The results o f the experiment showed greater values
for potassium exchangeable ions than those calculated by the model. This difference is seen
even for the initial values.
0.05
5 0.04 ,CO
T 3
OE,jy-OrocncroszoXCD
0.03
0.02
0.01
6 months 12 months 24 months 92 months
■ 92 months-Exp.- - x - - Initial-Exp.
x - - -x- x x x -x - x x x x - x x >c
Initial
0.1 0.2 0.3 0.4
D istance from the heater (m)
0.5 0.6
Figure 8.35 Profiles of the K exchangeable distribution in the domain at different times, resulting from the post-mortem simulation (lines) and experimental results (symbols) reported by Fernandez
and Villar (2010) for the 92 months test
Fernandez and Villar (2010) stated that in the case o f the K+ exchange population; although
there was a slight increase along the entire bentonite column in the experimental results, it
needs to be considered that, due to the experimental procedure o f measurement o f interlayer
cation composition via the CsNCb method, the K+ content in all the samples and even in the
reference one might be overestimated due to exchangeable potassium displacement with Cs2+
ions in interlayer sites.
8-58
Chapter 8 Numerical Simulation of the Coupled THC Behaviour of Compacted Bentonite
8.6 Conclusions
This chapter has demonstrated the capability o f the developed numerical model (COMPASS-
PHREEQC) to sim ulate the large cell heating and hydration experiment carried out as on
compacted bentonite. The long term experimental results, i.e. up to 92 months (7.6 years)
provided an opportunity to test and validate the developed model. The numerical simulation
was performed under coupled thermal, hydraulic and chemical conditions. Deformation
behaviour was not considered in this simulation. However, the impacts o f interlayer water in
the flow behaviour were considered via the interlayer hydration model that represents major
effect o f deformation in constrained boundary condition. The behaviour o f the compacted
bentonite in terms o f heat and moisture transfer, reactive transport o f multiple ionic chemicals
and geochemistry o f the clay water system including mineral and exchangeable composition
was investigated
In term o f the temperature distribution, the model showed a very close agreement with the
experimental results. The results indicated that temperature variation in the system has
reached steady-state conditions in a considerably shorter time compared with the hydraulic
and chemical variables.
The model also showed a close correlation with respect to the saturation period o f the FEBEX
bentonite by using the proposed unsaturated hydraulic conductivity and after calibration o f
vapour diffusivity terms. Especially the results o f the numerical model and experiment for the
92 months are in c lose agreement in terms o f the degree o f saturation which improves the
confidence on the hydraulic m odel to predict the variation o f the moisture for longer
durations. Similar to the observations reported in chapter 7, the adopted hydraulic
conductivity relationship which is coupled with interlayer water content variation has also
modified the water transport in the example simulation presented in this chapter. Small
discrepancies are observed in the shorter tests, i.e. 6 , 12 and 24 months, where model resulted
more wetting in the hydration side and more drying in the regions close to the heater in
comparison with the experimental results.
In the case o f each o f chem ical behaviour, two series o f simulations were performed and the
corresponding results were presented. The first type o f results is related to the in-place
condition in the bentonite cell, whilst the second type o f the results reported were the post
8-59
Chapter 8 Numerical Simulation of the Coupled THC Behaviour of Compacted Bentonite
mortem geochem ical analysis results, corresponding to a 1:4 aqueous extract post-analysis.
The results o f post-m ortem analysis can be used to check the validity o f the model via the
comparison with the available experimental results reported by Femdndez and Villar (2010).
The results o f in-place simulation provide the information about the condition o f the
compacted bentonite under the associated environmental conditions that can not be directly
measured in the test.
In comparison between the results o f post-mortem analysis between experiment and
numerical model the fo llow ing conclusions can be drawn:
• The simulation results o f the chloride ions showed a good qualitative agreement with
the experimental results especially for the periods o f 6, 12 and 24 months. Chloride
behaves as a conservative anion (Fernandez and Villar 2010). The lowre chloride
concentration in the results o f numerical simulation can be due to the flow regime o f
moisture in the system , where the cycle o f evaporation-condensation mainly
controlled the distribution o f chloride. In addition, exclusion effects due to the
overlapping diffuse layer can be an effective issue in chloride distribution.
• The results for bicarbonate and sulfate spatial distribution are in agreement with the
experimental results. Bicarbonate showed a nearly constant value along the domain
except at boundary conditions affected by calcite dissolution and precipitation. It has
also been found that bicarbonate distribution has been controlled by calcite dissolution
reaction. A consistency between pH and bicarbonate behaviour was observed in the
model results which is in agreement with experimental observation reported by
Fernandez and Villar (2010).
• The distribution o f sodium ions agreed qualitatively with those reported in the
experimental results, showing the accumulation o f sodium ions in the heater side. The
rest o f the cations (Ca2+, M g2+ and K+) showed reasonable correlation with respect to
the limited available experimental results. However over prediction o f ion
concentrations at the hot side for all the cations was observed in simulation results.
• In terms o f the exchangeable ion variations, the model also correctly predicted the
qualitative distribution o f exchangeable Na+ and Ca2+ ions in the domain. The results
8-60
Chapter 8 Numerical Simulation of the Coupled THC Behaviour of Compacted Bentonite
indicated that except in the hot region, the distribution o f these exchangeable ions
remained close to that o f the initial values. Higher concentrations o f Na+ exchangeable
is observed in the vicinity o f heater than the experiment which indicates more
dissolved sodium has been entered to the interlayer o f the clay replacing Ca2+ ions. In
the case o f exchangeable M g2+, the experimental results showed a general increase
from the initial value. However such a behaviour was not observed in the model due to
the absent o f dolom ite in the numerical simulation. In the case o f K+ the discrepancy
between numerical and experimental results can be the related to the experimental
method for determination o f exchangeable ions which resulted in higher replacement
o f interlayer potassium as Fernandez and Villar (2010) suggested.
• Although there w as no quantitative experimental information available for the
transient and spatial mineral behaviour, the model showed compatible trends in
comparison with the pore fluid composition. Gypsum was dissolved in the area close
to the heat boundary, producing considerable amount o f dissolved sulfate. As
mentioned before, the equilibrium constant o f mineral reactions for gypsum and
anhydrite are very close w hilst their enthalpies o f reaction are different, leading to a
different behaviour o f these tw o minerals at the regions with higher temperature. The
excess amounts o f calcium and sulfate, accumulated due to transport process and
dissolution o f gypsum at hot end, were precipitated as anhydrite mineral.
Key conclusions o f the coupled THC simulation on compacted FEBEX bentonite can be
summarised as:
• In general the results for thermal, hydraulic and chemical behaviour are in good
agreement with the experiment. The results thus have provided improved confidence
in the m odel’s ability to simulate the coupled behaviour o f compacted smectite clays.
Application o f the model for long term simulation o f the buffer under repository
condition can provide information about the performance and the physical and
chemical state o f the compacted bentonite.
• Elevated temperature in the heater side showed a profound effect on the distribution o f
ions and minerals especially. Higher flow o f water and vaporisation is likely to have
occurred in the system, facilitating the migration o f major ionic species towards the
8-61
Chapter 8 Numerical Simulation of the Coupled THC Behaviour of Compacted Bentonite
heater by advection mechanism. The presence o f a high amount o f chloride in the
vicinity o f the heater can enhance the corrosion rate o f the canister in a real scenario.
• The small portion o f the accessory minerals in FEBEX bentonite such as gypsum and
carbonates, showed considerable effects on the distribution o f some ions and
geochem ical behaviour o f the system under heating and hydration.
• Except for approximately 100 mm distance from the heater, the composition o f
exchangeable ions remained the same as the initial condition based on the in-situ
simulation results. This indicates the possibility o f conversion o f FEBEX bentonite
from Ca/M g-sm ectite clay to Na/M g smectite. The consequence in long term can
affect the sw elling pressure predicted for FEBEX.
Finally, it is acknowledged that several simplifications have been made in the simulation
work; hence it is expected that improved results can be obtained by including more
complexities into the m odel.
8-62

Chapter 8 Numerical Simulation of the Coupled THC Behaviour of Compacted Bentonite
8.7 References
Cleall, P.J., Seetharam, S.C., and Thomas, H.R. (2007). On the inclusion o f some aspects o f
chemical behaviour o f an unsaturated soil in thermo-hydro-chemical-mechanical models: II:
Application and transport o f soluble salts in compacted bentonite. Journal o f Engineering
Mechanics, ASCE, 133, 348-356.
Cussler, E.L. (1997). Diffusion-M ass Transfer in Fluid Systems. University Press,
Cambridge.
ENRESA. (1995). Alm acenam iento Geologico Profundo de Residuos Radiactivos de Alta
A ctividad (AGP), D isehos Conceptuales Genericos. Technical Publication ENRESA 11/95,
Madrid.
ENRESA. (1998). FEBEX. Bentonite: origin, properties and fabrication o f blocks.
Publicacidn Tecnica ENRESA 4/98, Madrid.
ENRESA. (2000). F ull-scale engineered barriers experiment fo r a deep geological
repository fo r high-level radioactive w aste in crystalline host rock, FEBEX project. EUR
19147, Nuclear Science and Technology Series, European Communities, Luxembourg.
ENRESA. (2006). Full-Scale E ngineered Barriers Experiment, Updated Final Report 1994-
2004. Technical Publication ENRESA 05-0/2006, Madrid.
Fernandez, A.M., Baeyens, B., Bradbury, M., and Rivas, P. (2004). Analysis o f the pore
water chemical composition o f a Spanish compacted bentonite used in an engineered barrier.
Physics and Chem istry o f the Earth , 29, 105-118.
Fernandez, A.M., Cuevas, J., and Rivas, P. (2001). Pore water chemistry o f the FEBEX
bentonite. M aterial R esearch Society Symposium Proceeding. 663, 573-588.
Fernandez, A.M., and Villar, M.V. (2010). Geochemical behaviour o f a bentonite barrier in
the laboratory after up to 8 years o f heating and hydration. A pplied Geochemistry, 25, 809-
824.
Garcia-Gutierrez, M., Cormenzana, J.L., Missana, T., and Mingarro, M. (2004). Diffusion
coefficients and accessible porosity for HTO and 36C1 in compacted FEBEX bentonite.
A pplied C lay Science , 26, 65-73.
8-63
Chapter 8 Numerical Simulation of the Coupled THC Behaviour of Compacted Bentonite
Lasaga, A.C. (1998). K inetic Theory in the Earth Science. Princeton Series in Geochemistry,
Princeton University Press.
Martin, M., Cuevas, J., and Leguey, S. (2000). Diffusion o f soluble salts under a temperature
gradient after the hydration o f compacted bentonite. A pplied Clay Science, 17, 55-70.
Mayhew, Y.R., and Rogers, G.F.C. (1976). Thermodynamic and transport properties o f
fluids. 2nd edition, Oxford, Blackwell.
Melkior, T., Gaucher, E.C., Brouard, C., Yahiaoui, S., Thoby, D., Clinard, C., Ferrage, E.,
Guyonnet, D., Toumassat, C., and Coelho, D. (2009). Na+ and HTO diffusion in compacted
bentonite: Effect o f surface chemistry and related texture. Journal o f Hydrology, 370, 9-20.
Parkhurst, D.L., and Appelo, C.A.J. (1999). User's guide to PHREEQC (version 2), U.S.
Geological Survey, Water Resource Investigation Report, 99-4259.
Philip, J.R., and de Vries, D.A. (1957). Moisture movements in porous materials under
temperature gradients. Transactions Am erican Geophysical Union, 38(2), 222-232.
Plummer, L.N., Wigley, T.M.L., and Parkhurst, D.L. (1978). The kinetics o f calcite
dissolution in C02-water systems at 5-60 °C and 0. 0-1.0 atm CO2 . American Journal o f
Science, 278, 179-216.
Ransom, B., and Helgeson, H.C. (1994). A chemical and thermodynamic model o f
aluminous dioctahedral 2:1 layer clay minerals in diagnetic processes: Regular solution
representation o f interlayer dehydration in smectite, American Journal o f Science, 294, 449-
484.
Revil, A., and Jougnot, D. (2008). Diffusion o f ions in unsaturated porous materials. Journal
o f C olloid and Interface Science, 319, 226-235.
Seetharam, S.C. (2003). An investigation o f the thermo/hydro/chemical/mechanical
behaviour o f unsaturated soils. Ph.D. Thesis, Cardiff University, Wales, UK.
Singh, R.M. (2007). An experim ental and numerical investigation o f heat and mass
movement in unsaturated clays. PhD Thesis, Cardiff University, Wales, UK.
Van Loon, L.R., Glaus, M.A., and Muller, W. (2007). Anion exclusion effects in compacted
bentonite: Towards a better understanding o f anion diffusion. A pplied Geochemistry, 22,
2536-2552.
8-64

Chapter 8 Numerical Simulation of the Coupled THC Behaviour of Compacted Bentonite
van Genuchten, M.Th. (1980). A closed-form equation for predicting the hydraulic
conductivity o f unsaturated soils. Soil Science Society o f America Journal, 44, 892-898.
Villar, M.V., Fernandez, A.M., Gomez, R., Barrenechea, J.F., Luque, F.J., Martin, P.L., and
Barcala, J.M. (2007). State o f a bentonite barrier after 8 years o f heating and hydration in the
laboratory. In: Dunn, D.S., Poinssot, C., Begg, B. (Eds.), Scientific Basis fo r Nuclear Waste
M anagement XXX, M ateria l Research Society Symposium Proceedings, 985, 0985-NN11-19.
Villar, M.V., Fernandez, A.M., Martin, P.L., Barcala, J.M., Gomez-Espina, R., and Rivas, P.
(2008b). Effect o f H eating/H ydration on Com pacted Bentonite: Tests in 60 cm Long Cells.
Publishing House CIEMAT. Madrid.
Villar, M.V., Sanchez, M., Gens, A. (2008a). Behaviour o f a bentonite barrier in the
laboratory: experimental results up to 8 years and numerical simulation. Physics and
Chemistry o f the Earth , 33, S476-S485.
8-65

Chapter 9 Conclusions and Suggestions for Further Research
Chapter 9
Conclusions and Suggestions for Further Research
9-1
Chapter 9 Condusions and Suggestions for Further Research
9.1 Conclusions
In order to investigate the hydro-geochemical processes in unsaturated soils a coupled THCM
numerical model has been developed in this thesis. This chapter aims to synthesise the
conclusions pertinent to the developments in this thesis and relate them to the objectives
presented at the start o f this work. Key contributions and advancements will be highlighted
throughout this chapter followed with opportunities for further work. The following
conclusions can be drawn from the work presented in this thesis.
9.1.1 Theoretical and numerical formulation
A theoretical formulation for coupled flow o f moisture, heat, air, multicomponent chemicals
and deformation have been developed in the framework o f coupled THCM modelling as
presented in chapter 3. In particular, the formulations o f hydraulic and chemical/geochemical
behaviour have been advanced. In terms o f hydraulic behaviour, the chemical osmosis
potential was included in the governing equations for water and vapour, incorporating an
explicit coupling between hydraulic behaviour and dissolved chemical variations in the
formulation. The inclusion o f chemo-osmosis in the governing equation o f moisture flow,
assisted with an important step towards understanding the effects o f chemistry on water and
vapour flow in unsaturated soils. According to the developed model, if the dissolved
concentrations o f chemicals vary in pore fluid, the variation o f moisture in soil due to the
chemo-osmosis is evaluated using the proposed formulation and knowing the osmosis
properties o f the soil.
Based on the state o f the art review presented in chapter 2, different rate o f diffusion for
anionic and cationic species has been found in experimental investigations in compacted
clays. This effect requires the modelling o f the diffusion under different effective coefficients
combined with electrostatic balance o f pore fluid. It was realised that this effect and the
quantitative evaluation in transport o f chemicals in compacted clay especially under non-
isothermal conditions has received limited attention and is yet to be investigated in detail. A
transport formulation o f multicomponent chemicals was developed in which various
potentials on diffusion o f multiple chemicals were included in the governing equation
considering overall charge conservation. Transport o f multicomponent ions was explained via
9-2

Chapter 9 Conclusions and Suggestions for Further Research
coupled electrochemical diffusion potential and thermal diffusion potential (i.e. the Soret
effect). To the knowledge o f the author, this is a novel formulation which enables modelling
the diffusion o f ionic species in multiple species systems either under isothermal or non-
isothermal conditions.
The thermal diffusion coefficient or the Soret coefficient was addressed in the formulation via
a theoretical approach. The adopted theory to evaluate the Soret coefficient provides a novel
modelling platform for the assessment o f the impact o f transport o f temperature on transport
o f ionic species in multicomponent system and under different diffusion coefficients. In the
case o f compacted clay buffer, the proposed transport formulation significantly improves the
capability to assess the fate o f chemicals under non-isothermal condition especially in long
term studies.
A major contribution to the reactive transport model was made via coupling an advanced
geochemical model, PHREEQC version 2, to calculate the chemical reaction sink/source in
the governing equation. The inclusion o f PHREEQC model to the transport formulation offers
various capabilities to the reactive transport formulation o f the model. The ability o f the
PHREEQC to model mixed equilibrium and kinetically controlled chemical reactions, various
homogeneous and heterogeneous reactions such as mineral reactions, ion exchange and, the
activity coefficients o f ions in high ionic solutions, and the availability o f various databases
are among the key potential advantages o f this model in the framework o f the modelling
geochemical processes. The developed reactive transport model, benefits from the advances
both in the transport module under coupled THCM framework, COMPASS and in the
reaction module where PHREEQC provides a wide range o f advantages to model
geochemical reactions.
An important development was initiated to couple chemical/geochemical with mechanical
behaviour in the theoretical basis o f the model. Accordingly the effects o f mineral
precipitation/dissolution on flow parameters were implemented as a porosity modification
feed-back from the geochemical model. In other words, flow properties such as hydraulic
conductivity, was modified due to variation in porosity with mineral precipitation or
dissolution. This inclusion has improved the abilities o f the model to evaluate the hydro
chemical behaviour in low porosity materials where long-term issues related to the mineral
precipitation or dissolution can alter the flow regime in the system.
9-3

Chapter 9 Conclusions and Suggestions for Further Research
A numerical approximation was adopted to solve the series o f the governing equations for all
primary variables related to the flow and deformations. A finite element solution was
employed for spatial discritisation based on Galerkin weighted residual method. A finite
difference scheme for temporal discritisation was employed based on a forwards difference,
mid-interval time stepping algorithm. Based on the comprehensive review on the
computational aspects o f the reactive transport o f chemical, presented in chapter 2, sequential
approach was found to be efficient to solve the governing equations for transport and
chemical reactions. Hence, the coupling between the transport and geochemical models was
achieved with adaptation o f a sequential non-iterative approach. The developed theoretical
formulation and the numerical solution present a robust and advanced computational
approach to study the hydro-geochemical processes in the framework o f coupled THCM
behaviour.
9.1.2 Verification and validation of the numerical model
A series o f verification exercises have been presented on the developments to the hydro
geochemical formulation implemented in THCM model. Analytical solutions, alternative
numerical solutions or the experimental data have been used to verify different developments
made in the theoretical/numerical formulation o f the model. Three classes o f problems were
verified under the development context o f this thesis, which included:
Two verifications were provided on the effects o f coupling chemical processes with moisture
flow via the chemo-osmosis phenomena. In the first example, implementation o f the osmotic
potential effects on water transport in the model was tested against the results o f an analytical
solution under steady-state condition. In the second example, osmosis driven vapour transport
was validated against a series o f experimental results. The comparison indicated the
mathematical correctness o f the approach adopted in chemo-osmosis inclusion in the model
under the conditions o f the specified examples.
Two verifications were presented dealing with the transport o f multiple ionic species under
isothermal conditions. Based on these examples, the implementation o f coupling between
electrical and chemical potential effects on diffusion was examined. The results of
multicomponent approach for modelling the diffusion in binary and ternary solutions were
9-4
Chapter 9 Conclusions and Suggestions for Further Research
compared with the results o f modelling the diffusion o f same problem based on Fick’s law o f
diffusion using analytically derived diffusion coefficient. Non-isothermal multicomponent
chemical diffusion was also explored via a series o f simulations based on available
experimental data on diffusion o f multi-ions under thermal gradients. In this series of
simulations, the theoretical approach adopted for calculating the Soret coefficient was also
validated in multiple ionic systems. Within the conditions o f the presented simulation
examples, the formulation adopted for multicomponent diffusion due to the electrochemical
potential was verified.
Coupling the geochemical reaction model PHREEQC with the transport model was verified
for the geochemical reactions including mineral dissolution/precipitation and ion exchange.
Verification on the transport o f binary solution with mineral reaction under both equilibrium
and kinetics was conducted against the results o f an analytical solution. Verification was also
carried out on multicomponent transport and multiple precipitation/dissolution reactions. The
reactive transport o f chemicals with ion exchange reactions was checked based on the results
of a similar simulation using well established example o f PHREEQC version 2. In addition, a
preliminary simulation example was presented to demonstrate the effect o f coupling between
mineral reaction and porosity variation and the effects on chemical transport.
Within the verification/validation tests presented in chapter 4, each development in the
theoretical formulation o f hydraulic and chemical behaviour was explored and the accuracy o f
the implementation was examined over a particular range o f conditions under consideration.
Hence, confidence was built in the theoretical approach and numerical implementation for
further applications and exploration o f the developments provided in the model.
9.1.3 Reactive transport under coupled THC conditions
A series o f simulations was carried out using the developed model to investigate the reactive
transport o f chemicals under coupled thermo-hydro-chemical conditions. The simulation
aimed mainly to study the reactive transport o f chemicals with emphasis on coupled
electrochemical and thermal diffusions. In fact, the simulations were designed to investigate
the effects related to thermal diffusion potential, i.e. the Soret effect, in a binary ionic system
in equilibrium with mineral reactions. The theoretical approach for calculation o f the Soret
9-5

Chapter 9 Conclusions and Suggestions for Further Research
coefficient was used in theses series o f simulations. The simulations were carried out on two
different conditions in terms o f the effective diffusion coefficient o f chemicals in the system.
In addition, the magnitude o f the thermal diffusion effects was investigated via a same
simulation in each series, once with considering the Soret effect and once without that.
The simulation results verified the charge conservation condition implemented in the model
under variable saturated and non-isothermal conditions where the transport o f chemicals takes
place due to simultaneous advection and diffusion in the system. These series o f simulations
provided interesting information about the magnitude and importance o f the thermal diffusion
effects and the way it affects the hydro-geochemistry o f the system. Modelling results showed
that the distribution o f the dissolved chemicals and precipitated minerals can be affected by
thermal diffusion impacts, particularly, after completing the re-saturation o f the clay system.
Under the saturated condition, a combination o f diffusion due to the concentration gradient
and the thermal diffusion potential controls the transport o f chemicals depending on the
effective diffusion coefficient.
The simulation examples also indicated that the contribution o f the Soret effect in the overall
process o f reactive diffusion could change the distribution o f minerals, especially in the
boundary regions close to the heat source where a high degree o f precipitation o f minerals
was expected. The overall impact o f thermal diffusion was found to be dependent on the
effective diffusion coefficient in the system. This series o f simulations assisted to explore the
developments to the modelling o f temperature impacts on the reactive diffusive transport o f
chemicals in a clay system where limited information and analysis is available.
9.1.4 Transport Processes in compacted bentonite and microstructure evolution
The state o f the art review, presented in chapter 2, on the behaviour o f compacted smectite
clays indicated that the moisture and chemical transport processes are highly linked with the
microsturcture evolution o f the smectite minerals and the surface interactions. It has been
suggested that when water is adsorbed to the interlayer pore space o f the smectite, the
available pore space for water and chemical flow reduces significantly. A lack of a robust
model for calculation o f the amount and the rate o f water exchange between immobile
9-6
Chapter 9 Conclusions and Suggestions for Further Research
interlayer and mobile water/vapour especially under variable suction and temperature has
been reported. This area was identified as a critical issue towards modelling the hydro
geochemistry o f compacted swelling clays.
A theoretical approach was presented for modelling the hydration/dehydration process and the
pore water/porosity evolution in compacted swelling clays (smectite). The developed model is
based on a thermodynamic approach in which the hydration/dehydration o f smectite was
treated as a geochemical solid solution reaction.
Based on the proposed model, the amount o f interlayer water and micro/macro porosity
evolution was calculated for a compacted bentonite. It was shown that the developed model
can estimate the interlayer water content for a given bentonite and its variation with suction
and temperature. The model was adopted for the case o f a compacted sodium bentonite and
the distribution o f water in micro and messo/macro levels in saturated compacted bentonite at
different dry densities was evaluated using the developed model. The results indicated a good
correlation between the model and those estimated and reported in the literature.
An exclusive advantage o f the developed model is the capability to evaluate the variation of
the interlayer water and micro/macro porosity under variable suction and temperature
conditions. To assess that, the variation o f the interlayer water content with suction and
temperature was modelled for a compacted sodium rich bentonite using the developed model.
The model results suggested that even at high suction values, there is a possibility o f
coexistence o f the water in the interlayer and intralayer/interparticle space. The model was
also explored under non-isothermal conditions which indicated the water transfer between the
interlayer and intralayer/interparticle due to temperature variation which is an important issue
in the assessment and understanding o f temperature impacts on flow processes.
A modified form o f the unsaturated hydraulic conductivity relationship was proposed for
compacted swelling clays where the microstructure changes via micro/macro porosity in
response to changes in suction and temperature. Accordingly, the proposed model for
interlayer hydration/dehydration o f smectite was coupled with the unsaturated hydraulic
conductivity to calculate the corresponding values o f the interlayer porosity. The hydraulic
behaviour o f compacted bentonite using the developed unsaturated hydraulic conductivity
was investigated via a simulation o f two series o f small scale experiments, one the under
9-7
Chapter 9 Condusions and Suggestions for Further Research
hydraulic gradient and the second under a thermo-hydraulic gradient. In comparison with the
experimental data, the model response with modified unsaturated hydraulic conductivity
relationship was tested against the standard hydraulic conductivity relationship. The results of
the modelling using the modified relationship indicated significant improvements against the
results o f same simulation via the adopted standard relationship. In particular, the hydraulic
behaviour o f the model for the highly compacted bentonite in the long term was improved, i.e.
the gradients o f saturation were improved which may in turn yield significantly improved
long term predictions. In fact the microstructure evolution through the interlayer hydration
and swelling was found as the dominant potential to delay the re-saturation o f the buffer
material. This gives increased confidence in longer term predictions made using numerical
simulation. The developed model for hydration/dehydration is a novel approach which
included some aspects o f microstructure evolution o f compacted swelling clay in the hydro
chemical transport modelling.
9.1.5 Simulation of a heating and hydration experiment of a compacted bentonite
A numerical simulation was carried out on hydro-geochemical behaviour o f compacted
bentonite o f a large-cell heating and hydration experiment using the developed numerical
model. The behaviour o f the compacted bentonite in terms o f heat and moisture transfer,
reactive transport o f multiple ionic chemicals and geochemistry o f the clay water system
including mineral and exchangeable composition was investigated for a period o f up to 92
months (7.6 years). The impacts o f microstructure swelling and shrinkage in the flow
behaviour were considered via the developed interlayer hydration model that represents the
major effect related to the deformation under constrained boundary conditions.
The results o f the simulation demonstrated a close agreement with the experimental results in
terms o f temperature profile. The model also showed a good correlation with respect to the
saturation degree o f the FEBEX bentonite using the modified hydraulic conductivity with
interlayer water model, proposed in chapter 7 and with calibration o f vapour diffusivity terms.
The results o f the numerical model and experiment for the 92 months are in close agreement
in terms o f the degree o f saturation which improve confidence in the hydraulic behaviour of
9-8
Chapter 9 Conclusions and Suggestions for Further Research
the model. With regards to geochemical behaviour, two series o f simulation were performed
representing in-place and post-mortem conditions in the bentonite cell experiment. The results
of in-place simulation provided the information about the condition o f the compacted
bentonite under the associated environmental condition in the test while the post-mortem
analysis was utilised to validate the model against the experimental results.
A good qualitative agreement was observed regarding chloride distribution, especially for the
periods o f 6, 12 and 24 months by comparison between the post-mortem results o f the
simulation and those reported from the experiment,. The results for the bicarbonate and
sulphate spatial distribution are also in reasonable agreement with the experimental results.
Bicarbonate showed a nearly constant value along the domain except at boundary conditions
affected by calcite dissolution and precipitation. The distribution o f sodium ions qualitatively
agreed well with those reported in the experimental results, showing the accumulation of
sodium ions in the heater side. The rest o f the cations (Ca2+, Mg2+ and K+) showed reasonable
correlation with respect to the limited available experimental results. However, over
prediction o f some ions at the hot side for the cations was observed in simulation results. In
terms o f the exchangeable ion variations, the model also correctly predicted the qualitative
distribution o f exchangeable Na+ and Ca2+ ions in the domain.
The in-place chemical and geochemical results o f the simulation indicated that the small
portion o f the accessory minerals in bentonite such as gypsum and carbonate has considerable
effects on the distribution o f some dissolved ions and the geochemical behaviour o f the
system under heating and hydration. In particular gypsum has been dissolved in the area close
to the heat boundary, which was resulted in producing considerable amount o f dissolved
sulfate. Excess amounts o f calcium and sulfate, accumulated in the region close to the heater
due to the combined effects related to the ion transport and dissolution o f gypsum at hot side.
The model capability for considering kinetically controlled geochemical reactions has
provided important and more realistic information about fate o f calcite and its
precipitation/dissolution behaviour.
It was found from the in-place simulation results that the behaviour o f pH follows the same
pattern as the bicarbonate in the hydration zone where high amount o f bicarbonate was
accumulated. The pH variation was found to be correlated with dissolution o f gypsum and
precipitation o f anhydrite during the heating and hydration experiment. The results indicated
9-9
Chapter 9 Condusions and Suggestions for Further Research
that the distribution o f the exchangeable ions remained close to that of the initial values,
expect for a limited region close to the heater.
The results o f post-mortem analysis assisted to explore the accuracy o f the model and to
validate the developed model under complex conditions o f experimental work considered.
Accordingly it can be claimed that the developed model has successfully simulated the hydro
geochemical behaviour o f the studied compacted clay under coupled and complex THC
framework. In addition, the in-place chemical/geochemical condition o f the simulation bench
mark provided important information especially with regards to the accessory minerals and
exchangeable ions distribution. Overall the model results have been satisfactory and thus have
provided improved confidence in the ability o f the developed model to simulate the thermal,
hydraulic and chemical/geochemical behaviour o f bentonite type soil.
9.1.6 Overall conclusions
In terms o f overall conclusions that can be drawn from the research performed, the following
observations are presented:
• Several aspects relating to the theoretical modelling o f the hydraulic and chemical
behaviour o f unsaturated soils have been developed in this thesis. For example a
description o f chemo-osmosis phenomenon has been achieved, which explicitly explains
water and vapour flow induced by chemical variations. In the author’s opinion, the
formulation developed for the transport o f multicomponent chemicals is a new
theoretical solution for the modelling the diffusion o f multiple ionic species due to
combined chemical, electrical and thermal potentials.
• Coupling o f the robust geochemical model PHREEQC (version 2) to the THCM model
significantly improves the capability to simulate the reactive transport o f chemicals
under mixed equilibrium/kinetically controlled chemical reactions. Advanced
geochemical features are thus introduced into the coupled THCM model.
• Verification and validation o f the developed model has been pursued, exploring the
accuracy o f the theoretical formulations and the numerical approach. The results
indicated that the techniques, adopted to solve the governing equations for flow and
9-10

Chapter 9 Conclusions and Suggestions for Further Research
deformation, and the sequential scheme, implemented to solve the governing equations
for reactive transport o f chemicals, provide an efficient solution for the problems
considered.
• The effect o f thermal diffusion on the reactive transport o f chemicals under coupled
THC conditions was investigated via a series o f simulations using the new model. The
results indicate the importance o f the Soret effect on the distribution o f chemicals and
minerals in the system. The dependency o f the Soret effect on the effective diffusion
coefficient o f the chemicals in soil is also revealed.
• The inclusion o f a hydration/dehydration model in a modified form o f unsaturated
hydraulic conductivity, significantly improved the prediction o f water transport and re
saturation time o f a compacted bentonite under both isothermal and non-isothermal
water infiltration. In the author’s opinion the proposed model provides a novel
framework, based on a flexible geochemical approach. Improved understanding and
modelling o f effects related to microstructural and porosity evolution on flow processes
in swelling clays has thus been achieved.
• Simulation o f hydro-geochemical processes under simultaneous heating and hydration
o f compacted bentonite demonstrated the capabilities o f the new model. The results
achieved have been in agreement with experimental results, providing improved
confidence in the ability o f the model to simulate the thermal, hydraulic and
chemical/geochemical behaviour under the presence o f multicomponent chemicals and
mixed geochemical processes. Results obtained from the simulations o f coupled thermo-
hydraulic and thermo-hydro-chemical behaviour o f compacted bentonite have improved
the quality o f modelling o f the physical and chemical processes in compacted swelling
clays.
• As the result o f this study, it is claimed that a new model has been developed, which is
an advanced tool for assessing hydro-geochemical processes under variable physical,
chemical and mechanical conditions in unsaturated soils. Applications o f the work to the
case o f compacted swelling clays have been carried out throughout this thesis. The
developed model has thus been shown to be an appropriate model for such compacted
swelling clays.
9-11

Chapter 9 Condusions and Suggestions for Further Research
9.2 Suggestions for further research
The developed model was applied in this thesis to simulate the hydro-geochemical processes
under coupled THCM behaviour o f compacted swelling clays. However, the numerical code
is under constant development to improve and test it capabilities. The following suggestions
are made for further research and developments especially for modelling the coupled
processes in compacted bentonite:
Utilising the proposed model for interlayer water/porosity evolution, the transport formulation
of multicomponent chemical can be extended considering different diffusion classes in
different porosity levels in compacted bentonite. In other words, the diffusion can be
considered in three different porosity levels including interlayer, diffuse layer and free water.
This provides a platform to investigate the coupled diffusion with surface complexation/ion
exchange provided by PHREEQC. This modification can be utilised for the assessment of
radionuclides diffusion in compacted bentonite.
The interlayer hydration/dehydration model presented in chapter 7 has a significant potential
for further development and applications in modelling the hydraulic and
chemical/geochemical behaviour in compacted swelling clays. Implementation o f this model
to the flow parameters can further be extended. A kinetic approach for modelling
hydration/dehydration may provide better estimation for temporal variation o f the interlayer
water and the consequences on flow parameters. Since major aqueous geochemical reactions
are thought to be occurred in macropore water, the interlayer water model can be adopted to
re-visit the geochemical analysis o f the pore fluid composition. It is anticipated that it results
with high ionic concentration pore fluid in compacted bentonite that the capability of
PHREEQC to geochemical modelling the solution with high ionic strength encountering
further analysis in combination with interlayer porosity model.
The coupling between porosity/permeability variations with geochemical reactions via
mineral dissolution/precipitation has been implemented in the model. However, the scheme
for coupling porosity variation with geochemistry required further verification/validation. In
particular, the efficiency o f porosity feed back from geochemical model under SNIA coupling
algorithm needs to be evaluated. The feedback o f chemical reactions on transport properties
adds another non-linearity to the system, requiring efficient algorithms to reach an accurate
9-12
Chapter 9 Condusions and Suggestions for Further Research
solution in reasonable computer time. Other coupling schemes suggested in the literature, in
particular sequential partly iterative approach (SPIA) and sequential iterative approach (SIA)
are suggested to check the numerical efficiency and improve the scheme adopted in this work.
Chapters 7 and 8 presented the simulations results o f laboratory scales TH and THC
behaviour using developed theory and numerical model, showing the predictive capabilities of
the model. Further applications o f the model for the hydro-geochemical behaviour of
compacted bentonite under coupled THCM condition for longer thermal period is proposed to
investigate the major processes. Indeed inclusion o f more capabilities o f PHREEQC in
modelling geochemical reactions into the coupled THCM model such as surface
complexation, explicit calculation o f the diffuse layer composition, and redox reactions can
improve the capabilities o f the model.
The developed hydro-geochemical model is a robust and flexible computational tool which
incorporated advanced theoretical and experimental knowledge in the field o f unsaturated
soils into the coupled physico-chemical and mechanical modelling. The model in general can
be extended for applications related to the other porous materials and in the engineering o f
recent challenges in geoenvironment such as geological sequestration o f CO2 .