
Environmental Studies for Vishnugad Pipalkoti Hydro Electric ...
313
THDC INDIA LIMITED Environmental Studies for Vishnugad Pipalkoti Hydro Electric Project Final Report Consolidated Environmental Assessment (EA) (Volume – I) November 2009 CONSULTING ENGINEERING SERVICES ( INDIA ) PRIVATE LIMITED 57, Manjusha Building (5th Floor), Nehru Place New Delhi - 110 019 Public Disclosure Authorized Public Disclosure Authorized Public Disclosure Authorized Public Disclosure Authorized Public Disclosure Authorized Public Disclosure Authorized Public Disclosure Authorized Public Disclosure Authorized Public Disclosure Authorized Public Disclosure Authorized Public Disclosure Authorized Public Disclosure Authorized Public Disclosure Authorized Public Disclosure Authorized Public Disclosure Authorized Public Disclosure Authorized
-
Upload
khangminh22 -
Category
Documents
-
view
1 -
download
0
Transcript of Environmental Studies for Vishnugad Pipalkoti Hydro Electric ...
THDC INDIA LIMITED
Environmental Studies for Vishnugad Pipalkoti Hydro Electric Project
Final Report
Consolidated Environmental Assessment (EA)
(Volume – I)
November 2009
CONSULTING ENGINEERING SERVICES ( INDIA ) PRIVATE LIMITED57, Manjusha Building (5th Floor), Nehru Place New Delhi - 110 019
Pub
lic D
iscl
osur
e A
utho
rized
Pub
lic D
iscl
osur
e A
utho
rized
Pub
lic D
iscl
osur
e A
utho
rized
Pub
lic D
iscl
osur
e A
utho
rized
Pub
lic D
iscl
osur
e A
utho
rized
Pub
lic D
iscl
osur
e A
utho
rized
Pub
lic D
iscl
osur
e A
utho
rized
Pub
lic D
iscl
osur
e A
utho
rized
Pub
lic D
iscl
osur
e A
utho
rized
Pub
lic D
iscl
osur
e A
utho
rized
Pub
lic D
iscl
osur
e A
utho
rized
Pub
lic D
iscl
osur
e A
utho
rized
Pub
lic D
iscl
osur
e A
utho
rized
Pub
lic D
iscl
osur
e A
utho
rized
Pub
lic D
iscl
osur
e A
utho
rized
Pub
lic D
iscl
osur
e A
utho
rized
wb20439
Typewritten Text
E2246 v1

Project : Environmental Studies for Vishnugad Pipalkoti Hydro-Electric Project Page:1 Document : 2008026/EC/Final Report Date: Nov 2009 Table of Contents Revision: R4
TABLE OF CONTENTS
Page #
Volume - I 1. Introduction & Project Description ..............................................................................1 to 21
1.1 Introduction .............................................................................................................1-11.2 Background of Study ....................................................................................................1-21.3 Scope of Work .............................................................................................................1-21.4 Study Area .............................................................................................................1-31.5 Context of Project .........................................................................................................1-3
1.5.1 Hydropower Potential Assessment...................................................................1-31.5.2 Hydropower Potential in India...........................................................................1-41.5.3 Necessity of Hydropower Development in Uttarakhand ...................................1-5
1.6 Project Location ............................................................................................................1-71.7 Project Highlights .........................................................................................................1-91.8 Analysis of Alternatives.................................................................................................1-9
1.8.1 Dam Site...........................................................................................................1-91.8.2 Other Components .........................................................................................1-121.8.3 No Project Scenario........................................................................................1-18
1.9 Upstream & Downstream Linkages ............................................................................1-181.10 Construction Material ..................................................................................................1-191.11 Infrastructure Works ...................................................................................................1-191.12 Power Potential and Installed Capacity.......................................................................1-201.13 Power Evacuation.......................................................................................................1-201.14 Project Cost and Implementation Schedule ................................................................1-201.15 Structure of Report .....................................................................................................1-21
2. Policy, Legal & Regulatory Framework ......................................................................1 to 10 2.1 Constructional Provisions ........................................................................................2-1 2.1.1 Water Resources ..........................................................................................2-1 2.1.2 Constitutional Provision related to Environment ...........................................2-1 2.2 Environmental Regulations & Legal Framework for the Project ................................2-2 2.2.1 Environment (Protection) Act, 1986...............................................................2-2 2.2.2 EIA Notification, September 2006 .................................................................2-3 2.2.3 Forest (Conservation) Act, 1980 and its amendment ...................................2-3 2.2.4 Wild Life (Protection) Act, 1972 .....................................................................2-3 2.2.5 Water (Prevention & Control of Pollution) Act, 1974 & Air (Prevention & Control of Pollution) Act, 1981...........................................2-4 2.2.6 Biological Diversity Act, 2002 ........................................................................2-4 2.2.7 Hazardous Wastes (Management and Handling) Amendment Rules, 2003 ...............................................................................2-4 2.2.8 Serais Act, 1867 ............................................................................................2-4

Project : Environmental Studies for Vishnugad Pipalkoti Hydro-Electric Project Page:2 Document : 2008026/EC/Final Report Date: Nov 2009 Table of Contents Revision: R4
Page #
2.2.9 Indian Fisheries Act, 1897 .............................................................................2-5 2.2.10 Factories Act, 1948........................................................................................2-5 2.2.11 Ancient Monuments and Archaeological Sites and Remains Act, 1958 .................................................................................2-5 2.3 Statutory Clearances Obtained for the Project .........................................................2-5 2.3.1 Environmental Clearance ..............................................................................2-5 2.3.2 Forest Clearance ...........................................................................................2-7 2.3.3 NOC from State Pollution Control Board ..........................................................2-7 2.4 Applicability of the World Bank Safeguard Policies.......................................................2-8 3. Baseline Environment, Impacts & Mitigation Measures............................................1 to 205 3.1 Introduction .............................................................................................................3-1 3.2 Topography .............................................................................................................3-1 3.3 Geology & Geotechnical Aspects .................................................................................3-2 3.3.1 Geomorphology ................................................................................................3-2 3.3.2 Seismicity of the Area.......................................................................................3-4 3.3.3 Thermal Springs ...............................................................................................3-5 3.3.4 Geology of the Project Area..............................................................................3-6 3.3.5 Various Studies ................................................................................................3-7 3.3.6 Recommendations............................................................................................3-9 3.4 Meteorology ...........................................................................................................3-11 3.4.1 General Meteorological Scenario ...................................................................3-11 3.4.2 Meteorological Scenario during Study Period.................................................3-12 3.5 Landslide ...........................................................................................................3-13 3.5.1 Salient Features of the Major Landslides .......................................................3-13 3.5.2 Result of Landslide Hazard Zonation Study....................................................3-14 3.5.3 Potential Impacts and Mitigation Measures ....................................................3-15 3.6 Land Environment.......................................................................................................3-16 3.6.1 Land Requirement ..........................................................................................3-16 3.6.2 Land Use ........................................................................................................3-16 3.6.3 Soil Quality .....................................................................................................3-16 3.6.4 Agriculture ......................................................................................................3-17 3.6.5 Sedimentation and Silt Erosion ......................................................................3-18 3.7 Managed River Flow...................................................................................................3-22 3.7.1 Study Components .........................................................................................3-22 3.7.2 Catchment Area of Alaknanda River .............................................................3-22 3.7.3 River Flow Measurement................................................................................3-23 3.7.4 River Flow – Alaknanda River .......................................................................3-27 3.7.5 Tributaries of Alaknanda.................................................................................3-32 3.7.6 Flow Duration Curve& Temporal Variation- Alaknanda River ........................3-32 3.7.7 River Water Quality .......................................................................................3-34 3.7.8 Sedimentation.................................................................................................3-37 3.7.9 Pollution Load Study.......................................................................................3-38
Project : Environmental Studies for Vishnugad Pipalkoti Hydro-Electric Project Page:3 Document : 2008026/EC/Final Report Date: Nov 2009 Table of Contents Revision: R4
Page #
3.7.10 Analysis of Minimum Flow ..............................................................................3-58 3.7.11 Uses of Water.................................................................................................3-61 3.7.12 River Bed Utilization Survey ...........................................................................3-63 3.7.13 Water Usage Survey ......................................................................................3-64 3.7.14 Waterborne Disease.......................................................................................3-64 3.7.15 Downstream Hazards .....................................................................................3-68 3.8 Aquatic Ecology ..........................................................................................................3-72 3.8.1 Secondary Data Review .................................................................................3-72 3.8.2 Primary Survey ...............................................................................................3-72 3.8.3 Methodology ...................................................................................................3-76 3.8.4 Results & Analysis .........................................................................................3-77 3.8.5 Migration Route & Period of Migration of Mahseer in Alaknanda River .........................................................................................3-83 3.8.6 Riparian Vegetation ........................................................................................3-84 3.8.7 Assessment of Impacts on Aquatic Ecology & Mitigation Measures...............3-85 3.9 Terrestrial Biodiversity ................................................................................................3-90 3.9.1 Background. ...................................................................................................3-90 3.9.2 Biodiversity Assessment Methodology ...........................................................3-90 3.9.3 Biodiversity of Uttarakhand State ...................................................................3-92 3.9.4 Biodiversity of Alaknanda River Basin ..........................................................3-100 3.9.5 Nandadevi Biosphere Reserve .....................................................................3-103 3.9.6 Biodiversity of Project Influence Area ...........................................................3-112 3.9.7 Biodiversity of Project Immediate Affected Area...........................................3-125 3.9.8 Biodiversity of Project Affected Area ............................................................3-130 3.9.9 Impacts on Flora...........................................................................................3-152 3.9.10 Impacts on Fauna.........................................................................................3-157 3.10 Archaeological Survey ..............................................................................................3-164 3.10.1 Historical Background...................................................................................3-164 3.10.2 Historical Archaeology..................................................................................3-166 3.10.3 Explored & Excavated Archaeological Sites in the Region...........................3-167 3.10.4 Exploration Results.......................................................................................3-168 3.10.5 Comprehensive Description of Archaeological Evidence .............................3-168 3.10.6 Impacts and Mitigation Measures .................................................................3-184 3.11 Impacts generated by construction activities ............................................................3-189 3.11.1 Ambient Air Quality.......................................................................................3-189 3.11.2 Ambient Noise Level.....................................................................................3-191 3.11.3 Construction Camp.......................................................................................3-196 3.11.4 Human Health...............................................................................................3-197 3.11.5 Employment and Training Activities..............................................................3-198 3.12 Socio Economic Impacts...........................................................................................3-199

Project : Environmental Studies for Vishnugad Pipalkoti Hydro-Electric Project Page:4 Document : 2008026/EC/Final Report Date: Nov 2009 Table of Contents Revision: R4
Page #
Volume - II 4.0 Environmental Management Plan (EMP) ................................................................... 1 to 135 4.1 Objective of the EMP ...................................................................................................4-2 4.2 Environmental Management process ...........................................................................4-2 4.3 Institutional & Implementation Arrangement ................................................................4-3 4.3.1 Activities within Project Area.............................................................................4-3 4.3.2 Activities in the Project Influence Area .............................................................4-5 4.3.3 Activities in the Catchment ..............................................................................4-6 4.4 Biodiversity Management..............................................................................................4-9 4.4.1 Conservation Plan of Project Influence Area ....................................................4-9 4.4.2 Conservation Plan of Project Affected Area ...................................................4-10 4.4.3 Compensatory Afforestation Plan ...................................................................4-11 4.4.4 Budget for Biodiversity Management..............................................................4-12 4.5 Catchment Area Treatment Plan ................................................................................4-13 4.5.1 Need for Catchment Area Treatment..............................................................4-13 4.5.2 Project area in the CAT Plan ..........................................................................4-13 4.5.3 Objective of the CAT Plan ..............................................................................4-14 4.5.4 Plantation in the Reserved Forest Areas ........................................................4-16 4.5.5 Plantation in the Civil Soyam and Van Panchayat Areas ...............................4-16 4.5.6 Drainage Line Treatment & Soil Conservation Work ......................................4-17 4.5.7 Wildlife/ Biodiversity Protection Works ...........................................................4-17 4.5.8 Responsibility of Forest Department.............................................................. 4-18 4.5.9 Responsibility of THDC ..................................................................................4-19 4.5.10 Financial Provision for CAT Plan ....................................................................4-19 4.5.11 Agencies involved in the Implementation of the Plan .....................................4-20 4.6 Muck Disposal Management Plan ..............................................................................4-22 4.6.1 Introduction.....................................................................................................4-22 4.6.2 Excavation of Muck and its Disposal ..............................................................4-22 4.6.3 Muck Disposal Sites .......................................................................................4-23 4.6.4 Conclusion......................................................................................................4-26 4.6.5 Planning & Management of Muck Disposal ....................................................4-29 4.6.6 Budget ...........................................................................................................4-32 4.6.7 Recommendations .........................................................................................4-33 4.7 Fish Management Plan...............................................................................................4-33 4.7.1 Characteristics of Endangered Fish................................................................4-33 4.7.2 Sustenance of Fisheries .................................................................................4-33 4.7.3 Management Measures..................................................................................4-33 4.7.4 Proposed Budget for Fish Management .........................................................4-35 4.7.5 Recommendations..........................................................................................4-36 4.8 Greenbelt Development Plan.....................................................................................4-37 4.8.1 Species Suggested for Plantation ..................................................................4-37

Project : Environmental Studies for Vishnugad Pipalkoti Hydro-Electric Project Page:5 Document : 2008026/EC/Final Report Date: Nov 2009 Table of Contents Revision: R4
Page #
4.8.2 Precautionary Measures.................................................................................4-38 4.8.3 Budget for Greenbelt Development Plan ........................................................4-38 4.9 Soil Erosion & Sediment Control.................................................................................4-40 4.10 Quarry & Borrow Area Management...........................................................................4-41 4.11 Solid Waste Management...........................................................................................4-43 4.12 Management Measures for Road Construction ..........................................................4-45 4.13 Construction Camp & Construction Workers ..............................................................4-50 4.13.1 Sanitation Facilities.........................................................................................4-50 4.13.2 Provision of Fuel.............................................................................................4-51 4.13.3 Other Facilities................................................................................................4-51 4.14 Public Health Delivery System....................................................................................4-52 4.14.1 Development of Medical Facilities ..................................................................4-52 4.14.2 Proposed Health Facilities at Construction Sites & Labour Camp ..................4-52 4.14.3 Health Extension Activities .............................................................................4-53 4.14.4 Budget for Public Health Delivery System ......................................................4-53 4.15 Responsibility Matrix ...................................................................................................4-55 4.16 Environmental Monitoring Plan ..................................................................................4-75 4.16.1 Introduction.....................................................................................................4-75 4.16.2 Water Quality .................................................................................................4-75 4.16.3 Ambient Air Quality & Meteorology.................................................................4-76 4.16.4 Noise ..............................................................................................................4-77 4.16.5 Ecology...........................................................................................................4-77 4.16.6 Soil Erosion & Siltation ...................................................................................4-77 4.16.7 Incidence of Water Related Diseases.............................................................4-78 4.16.8 Land Use ........................................................................................................4-78 4.16.9 Environmental Monitoring Budget...................................................................4-79 4.16.10 Adaptive Environmental Management Requirement .....................................4-80 4.17 Good Practices ...........................................................................................................4-82 4.17.1 Landscaping & Re-vegetation.........................................................................4-82 4.17.2 Vegetation Clearing ........................................................................................4-82 4.17.3 Loading & Removal of Waste Forestry Products ............................................4-83 4.17.4 Storage, Handling & Emergency Response for Hazardous Chemical ......................................................................................4-84 4.17.5 Emission & Dust Control.................................................................................4-86 4.17.6 Environmental Training for Construction Workers ..........................................4-86 4.17.7 On-site Traffic & Access Management ...........................................................4-87 4.17.8 HIV/AIDS Prevention Measures .....................................................................4-88 4.18 Capacity Building of THDC .........................................................................................4-89 4.18.1 Environmental Management measures taken by THDC..................................4-89 4.18.2 ISO 14001 Environment Management System ................................................4-90 4.18.3 OHSAS 18001..................................................................................................4-98 4.18.4 Safety Manual of THDC....................................................................................4-98 4.18.5 Corporate Social Responsibility......................................................................4-104 4.18.6 Disaster Management Plan ............................................................................4-107

Project : Environmental Studies for Vishnugad Pipalkoti Hydro-Electric Project Page:6 Document : 2008026/EC/Final Report Date: Nov 2009 Table of Contents Revision: R4
Page #
4.18.7 Adaptive Capacity Development ....................................................................4-112 4.18.8 Institutional Setup and Capacity Building .......................................................4-115 4.18.9 Training for Environmental Staff .....................................................................4-123 4.18.10 Budget for Capacity Building ........................................................................4-130 4.18.11 Lesson Learnt by THDC ..............................................................................4-1334.19 Budget for Implementation of EMP.....................................................................................4-135
LIST OF ANNEXES (Volume –I)
Annex–3.1.1 Public consultation for VPHEP
Annex-3.4.1 Meteorological data
Annex-3.7.1 Format for River Flow Measurement
Annex-3.7.2 Sources of Drinking Water
Annex-3.8.1 Aquatic Ecology
Annex-3.9.1 Format for Terrestrial Biodiversity Assessment
Annex-3.11.1 Relevant Indian Standards
LIST OF ANNEXES (Volume –II)
Annex-4.15.1 Forms for Environmental Management Plan
Annex-4-18.1 ISO 14001:2004 Requirements
Annex-4-18.2 Organizational Setup of THDC
Annex-4-18.3 Details of Training Program attended by VPHEP Staff
Annex-4.19.1 EMP Implementation Schedule

Project : Environmental Studies for Vishnugad Pipalkoti Hydro-Electric Project Page:7 Document : 2008026/EC/Final Report Date: Nov 2009 Table of Contents Revision: R4
LIST OF TABLES (Volume –I) Table-1.5.1 River Basin-wise Hydroelectric Power Potential Identified in Reassessment Study Table-1.5.2 Major Hydro-Power Projects under construction in Uttarakhand Table-1.5.3 Major Hydro Schemes Identified in Ganga valley Table-1.5.4 Energy Status of India and Northern Region Table-1.8.1 Summary of findings of various Alternatives of Dam Site Table-1.10.1 Details of Construction Material Required Table-1.10.2 Sources of Construction Material Table-3.3.1 Detail of Thermal springs Table-3.3.2 Litho-Tectonic Setup of the Vishnugad-Pipalkoti H-E Project Table 3.6.1 Proposed Land Acquisition Details Table-3.6.2 Land use pattern of the Project Influence Area Table-3.7.1 Tributaries of River Alaknanda in the Project Stretch Table 3.7.2 Historical Minimum Flow of River Alaknanda (in m3/s) Table-3.7.3 Discharge of River Alaknanda (in m3/s) at Dam Site Table-3.7.4 Average, lean and peak flow in river Alaknanda (in m3/s) at Dam Site Table-3.7.5 Lean Season Flow of the Tributaries of Alaknanda (2008-09) Table-3.7.6 Surface Water Quality Monitoring Location Table-3.7.7 Results of On-site Surface Water Quality Monitoring during May 08 Table-3.7.8 Results of On-site Surface Water Quality Monitoring during October 08 Table-3.7.9 Results of On-site Surface Water Quality Monitoring during January 09 Table-3.7.10 Salient features of the Tributaries Cross-Sections Table-3.7.11 Existing Inflows (February 2009) in Alaknanda River (study stretch) Table-3.7.12 Calibrated Parameters for Water Quality Modeling Table-3.7.13 Future inflows during construction phase (Without Sewage Treatment) Table-3.7.14 Future inflows during implementation phase (Without any treatment) Table 3.7.15 Drinking water sources in the area Table-3.7.16 Diseases recorded at PHC Chamoli, 2006--2008 Table-3.7.17 Diseases recorded in CHC Joshimath, 2006-2008 Table-3.7.18 Water depth and spread downstream of dam in the event of Dam Break Table-3.7.19 List of Villages which will be affected in case of Dam Failure Table-3.8.1 Periphyton dwelling in the Project Stretch Table-3.8.2 Phytoplankton dwelling the sites in Project Stretch Table-3.8.3 Zooplankton found in the Project Stretch Table-3.8.4 Macrozoobenthos dwelling the river in the Project Stretch Table-3.8.5 Fish dwelling in Alaknanda River and its tributaries in the project stretch Table-3.8.6 Mean Density (g.m-3) of Mahseer Table-3.8.7 Mean Density (g.m-3) of Snow trout Table 3.8.8 Riparian vegetation reported along the Alaknanda River and its Tributaries Table 3.9.1 Assessment of Forest Cover of Uttarakhand Table 3.9.2 Plantation carried by Forest Department in Uttarakhand Table 3.9.3 Plantation Carried in Kedarnath Forest Division Table 3.9.4 Plantation Carried in Badrinath Forest Division Table 3.9.5 Medicinal Plants of Uttarakhand Table 3.9.6 Flora Recorded under the Project Influence Area (7km)

Project : Environmental Studies for Vishnugad Pipalkoti Hydro-Electric Project Page:8 Document : 2008026/EC/Final Report Date: Nov 2009 Table of Contents Revision: R4
Table: 3.9.7 Ecological Features of Major Species Table 3.9.8 Uses of Major species by Community Table 3.9.9 Important Medicinal Plants of Project Influence Area Table 3.9.10 Wildlife of Project Influence Area Table 3.9.11 Wildlife Census Data of Badrinath Forest Division Table 3.9.12 Census Data of Wildlife of Kedarnath Wildlife Sanctuary Table 3.9.13 Flora of Project Immediate Affected Area Table 3.9.14 Flora of Project Affected Areas Table 3.9.15 Flora of Approach Road to Dam Site Table 3.9.16 Flora of Approach Road to Langsi Adit Table 3.9.17 Flora of Approach Road to Maina Adit Table 3.9.18 Flora of Approach Road to Powerhouse & Colony Site Table 3.9.19 Assessment of Flora of Dam Site Table 3.9.20 Assessment of Flora of Powerhouse & Colony Site Table 3.9.21 Assessment of Flora of Dwing Langsi Site Table 3.9.22 Assessment of Flora of Gulab Koti Table 3.9.23 Assessment of Flora of Quarry Site Birahi Table 3.9.24 Assessment of Flora of Quarry Site Patalganga Table 3.9.25 Diversity Index of Project Affected Area Table 3.9.27 Birds of Project Site Table 3.9.28 Comparative Status of Natural Resources in the Project Area Table 3.9.29 Girth size of Major Tree Species Table 3.9.30 Assessment of Impacts and Mitigation Measures Table-3.10.1 Typological Distribution of Archaeological remains Table 3.10.2 Distance of Archaeological locations from river Alaknanda Table-3.11.1 Summary of ambient Air Quality Monitoring (Unit : µg/m3)Table-3.11.2 Noise Level Monitoring at NQ1 Table-3.11.3 Noise Level Monitoring at NQ2 Table-3.11.4 Noise Level Monitoring at NQ3 Table-3.11.5 Noise Level Monitoring at NQ4 Table-3.11.6 Noise Level Monitoring at NQ5 Table-3.12.1 Demographic features of project District Table-3.12.2 Work Participation in project District Table-3.12.3 Land Holding Pattern for the project District Table 3.12.4 List of Project Affected Villages Table-3.12.5 Detail of Land owners Affected Table-3.12.6 Details of Structures Affected under the Project Table-3.12.7 Project affected Families and Population Table-3.12.8 Details of village wise number of affected vulnerable persons Table-3.12.9 Loss of income due to Grazing/Vanpanchayat land
LIST OF TABLES (Volume –II)
Table-4.4.1 Species Suggested for Plantation under Compensatory Afforestation Plan Table-4.4.2 Year wise Budget for Biodiversity Management Table-4.5.1 Land Use Classification in Revised Catchment Area Treatment Plan (in Ha)

Project : Environmental Studies for Vishnugad Pipalkoti Hydro-Electric Project Page:9 Document : 2008026/EC/Final Report Date: Nov 2009 Table of Contents Revision: R4
Table-4.5.2 Financial Provision for Eco-restoration Table-4.5.3 Year wise Financial Target for Ecorestoration Table-4.6.1 Capacity and Location of Disposal Area Table-4.6.2 Budget for Implementation of Muck Disposal Plan Table 4.7.1 Components for Hatchery Development for VPHEP Table 4.7.2 Proposed budget by Dept of Fisheries, Govt. of Uttarakhand Table 4.7.3 Budget for Fish Management Table-4.8.1 Species Suggested for Plantation under Greenbelt Development Plan Table-4.8.2 Budget for Greenbelt Development Plan Table-4.10.1 Species Suggested for Slope Stabilization Table-4.10.2 Cost Estimate for Restoration of Quarry Sites Table-4.11.1 Budget for Solid Waste Management Table-4.12.1 Budget for Implementation of EMP Measures for Road Construction Table-4.13.1 Budget for Sanitary Facilities for Labour Camps Table-4.13.2 Cost Estimate for LPG Distribution Table-4.13.3 Cost Estimate for Kerosene Distribution Table-4.14.1 Budget for Public Health Delivery System Table-4.15.1 Environmental Management Measures & Responsibilities - Pre-construction Stage Table-4.15.2 Environmental Management Measures & Responsibilities - Construction Stage Table-4.15.3 Environmental Management Measures & Responsibilities – Operation Stage Table-4.16.1 Summary of Environmental Monitoring Programme during Construction Phase Table-4.16.2 Summary of Environmental Monitoring Programme during Operation Phase Table-4.16.3 Budget for Environmental Monitoring Programme Table 4.17.1 Responsibility for AIDS/HIV Protection Table-4.18.1 Water Depth and Spread Downstream of Dam in the event of Dam Break Table-4.18.2 List of Villages which will be affected in case of Dam Failure Table 4.18.3 Budget for Adaptive Capacity Development Table-4.18.4 Projects under THDC within India Table-4.18.5 Overseas Projects under THDC Table-4.18.6 Comparative Strength of THDC with National & International Hydropower
Companies Table-4.18.7 Qualification of Environmental Staff in the five units in Corporate Division in S&E
Department Table-4.18.8 Future Environmental Manpower required for various Projects Table-4.18.9 Trainings Identified for Environmental Management Table-4.18.10 List of the Power Sector Training Institutes Recognized by CEA Table-4.18.11 Training Institutions that can be contacted for Capacity Building Table-4.18.12 Year wise Estimate for Environmental Training Table-4.18.13 Proposed Tentative Capacity Building Budget for VPHEP Table-4.18.14 Tentative Estimate for Environmental Training Table-4.19.1 Summary of EMP Budget

Project : Environmental Studies for Vishnugad Pipalkoti Hydro-Electric Project Page:10 Document : 2008026/EC/Final Report Date: Nov 2009 Table of Contents Revision: R4

Introduction & Project Description
11.1 Introduction .................................................................................................1 1.2 Background of the Study ............................................................................2 1.3 Scope of Work...............................................................................................2 1.4 The Study Area ............................................................................................3 1.5 Context of the Project .................................................................................3 1.6 Project Location ..........................................................................................7 1.7 Project Highlights........................................................................................9 1.8 Analysis of Alternatives.............................................................................9 1.9 Upstream & Downstream Linkages ......................................................18 1.10 Construction Material ..............................................................................19 1.11 Infrastructure Works.................................................................................19 1.12 Power Potential & Installed Capacity ..................................................20 1.13 Power Evacuation .....................................................................................20 1.14 Project Cost & Implementation Schedule .............................................20 1.15 Structure of the Report .............................................................................21 1.1 INTRODUCTION
THDC India Limited proposes to commission Vishnugad Pipalkoti Hydro-electric Power (VPHEP) Project on the river Alaknanda, a major tributary of the river Ganga. It is a run-of-the-river (ROR) hydropower project with an installed capacity of 444 Mega Watts. A dam is to be located at village Helong in Joshimath Tehsil and an underground power house, at village Haat in Chamoli Tehsil.
The Government of India has requested World Bank financing for VPHEP. Prior to GoI’s decision to request World Bank funding, THDC had already undertaken an Environmental Impact Assessment (EIA) of VPHEP through Water & Power Consultancy Services (WAPCOS), a PSU under Ministry of Water Resources, engaged in consultancy in water resources, water supply, hydro power and allied sectors. The Project also obtained Environmental Clearance from the Statutory Authority on the basis of this original EIA.
On reviewing the approved EIA of VPHEP, it was found that some aspects, such as managed river flow, terrestrial biodiversity, environmental impacts of advanced construction sites and archaeological survey etc., needed further analysis to strengthen the report and to comply with World Bank policy requirements for environmental assessment. In order to address these shortcomings, THDC assigned the work to M/s
Environment & Ecology Department
Project : Environmental Studies for Vishnugad Pipalkoti Hydro-Electric Project Page: 2 of 21 Document : 2008026/EC/Final Report Date: Nov 2009 Chapter-1 : Introduction and Project Description Revision: R4
Consulting Engineering Services (India) Private Limited, New Delhi to carry out additional environmental studies and consolidate the initial EIA into a comprehensive Environmental Assessment in line with the requirements of the Government of India and the World Bank.
In addition, the Social Impact Assessment (SIA) & Resettlement Action Plan (RAP) has been undertaken through the Centre for Management & Social Research (CMSR), Hyderabad. The project involves acquisition of public (government and forest land) and private land from titleholders located in 19 villages. The acquisition of land and consequent displacement will have potential impacts on the social, economic, cultural and environmental attributes of the affected population.
1.2 BACKGROUND OF THE STUDY
River Alaknanda is originating from the glacial regions of the Himalayas. The river has tremendous scope for development of hydro-power, which needs to be harnessed to meet the ever-growing demand for power. At present, various hydropower schemes are in different stages of development on the river. Vishnugad Pipalkoti hydropower is one such scheme envisaged in this region. The operation of VPHEP is linked to the upstream projects on Vishnugad (by M/S Jai Prakash) and Topovan- Vishnugad (by M/S NTPC). Downstream of this project, further run of the river power projects are planned.
1.3 SCOPE OF WORK
The brief Scope of Work of the Environmental Study is given below:
Review of available reports / studies Analysis of residual Gaps
Archaeological study Preparation of management plan for preventing landslide Preparation of management plan for muck disposal sites Analysis of alternatives Review of Catchment Area Treatment Plan Development of comprehensive environmental monitoring plan
Environmental screening of the advanced construction works/ sites and preparation of environmental analysis report
Assessment of managed river flow issues Measurement of current river flow of the tributaries Water use & river bed utilization survey Study of aquatic ecology Pollution load study Water borne diseases Downstream hazards
Analysis of the managed flow issues and recommendation of management measures
Establishment of baseline conditions of terrestrial biodiversity
Project : Environmental Studies for Vishnugad Pipalkoti Hydro-Electric Project Page: 3 of 21 Document : 2008026/EC/Final Report Date: Nov 2009 Chapter-1 : Introduction and Project Description Revision: R4
Policy & legal context Baseline of the project’s influence area Baseline of the project’s impacted area Assessment of direct, indirect, cumulative and induced impacts Impacts on Nanda Devi Biosphere Reserve
Recommendation of management measures related to terrestrial biodiversity Development of an adaptive Environmental Capacity Building plan for THDC Preparation of consolidated EA and EMP Reports Assist THDC in Public Disclosure
1.4 THE STUDY AREA
The study area includes the area between proposed intake structure to tailrace outlet and stretches immediately above and downstream of the project, including influence area of 7km around the project (27 km).
1.5 CONTEXT OF THE PROJECT Development of hydro power resources is important for energy security of the country. Considering the fact that hydro power is a renewable source of energy and is environment-friendly compared to coal based thermal power plants, and also the fact that India has huge hydro power potential, policy decisions were taken at national level to develop hydro power to meet the country’s growing energy demand. It takes about 10 years for developing a large size hydro project from planning to commission. It is therefore necessary to prepare a long term plan of hydropower development
1.5.1 Hydropower Potential Assessment A systematic survey of hydro power potential in India was first undertaken during the period 1953 to 1959 by the erstwhile Central Water and Power Commission. According to this survey, hydro power potential of the country was assessed to be about 42,000 MW from a total of 250 schemes. This survey provided the base for development of hydro power projects in the country for the next two decades. During the period 1978 to 1987, a re-assessment of hydro power potential was undertaken by the Central Electricity Authority (CEA) on the advice of the Planning Commission. The scope of the re-assessment study included assessment of Gross Theoretical Potential, Secondary Energy contribution and Identification of possible sites for Pumped Storage development in addition to assessment of economic potential and computation of annual energy contribution in dependable and average flow conditions. The re-assessment study assessed the hydro power potential of the country at about 84,000 MW from a total of 845 schemes. In addition, 56 sites for development of pumped storage schemes with total likely installed capacity of about 94,000 MW were also identified in various regions of the country. The river basin-wise hydro power potential identified in this study is given in Table-1.5.1.

Project : Environmental Studies for Vishnugad Pipalkoti Hydro-Electric Project Page: 4 of 21 Document : 2008026/EC/Final Report Date: Nov 2009 Chapter-1 : Introduction and Project Description Revision: R4
Table-1.5.1 River Basin-wise Hydroelectric Power Potential Identified in Reassessment Study
River Basin No. of Schemes
Potential of 60% load factor (MW)
Date of Completion of Study
Indus 190 19,988 March , 1983
Brahmaputra 226 34,920 January, 1984
Ganga 142 10,715 August, 1984
Central Indian River 53 2,740 June, 1985
West flowing Rivers of Southern India 94 6,149 November, 1985
East flowing Rivers of Southern India 140 9,532 April, 1986
Total 845 84,044 ≅ Installed capacity
– 1,50,000 MW
Pumped Storage Scheme Sites 56 94,000 MW August, 1984
Source: Central Electricity Authority The reassessment study revealed that the State of Uttarakhand in the Ganga basin has substantial potential for development of hydro power. The whole of Uttarakhand practically comes under the Ganga Basin, particularly, Upper Ganga Sub-Basin.
1.5.2 Hydropower Potential in India As per the Central Electricity Authority of India, 2009, the status of Hydro power potential development of the country is: Identified capacity : 148701 MW Capacity Developed : 33091.5 MW (22.25%) Capacity under Construction : 12970 (8.72%) Capacity yet to be Developed : 102639.5MW (69.02%) India is currently facing an energy deficit. In Northern region there is an energy deficit of 13.41 percent and a peaking deficit of 17.62 percent and the demand for energy is projected to rise further. According to estimates by the Central Electricity Authority, the demand for peaking power in the Northern Region alone is projected to rise from 35,145 MW during 2007-08 to 48137 MW in 2011-12. To meet the all India peak demand and energy requirement at the end of 12th Plan, a capacity addition of more than 90,000 MW has been assessed during 12th Plan (2012-2017), which includes 30,000 MW of hydro electric power. To achieve the ambitious programme of hydro capacity addition in the 12th Plan period, shelf of hydro power projects with aggregate installed capacity of 58,573 MW were identified by CEA in the year 2006-07.

Project : Environmental Studies for Vishnugad Pipalkoti Hydro-Electric Project Page: 5 of 21 Document : 2008026/EC/Final Report Date: Nov 2009 Chapter-1 : Introduction and Project Description Revision: R4
1.5.3 Necessity of Hydropower Development in Uttarakhand The requirement of power (Source: Ministry of Power) during the year 2002-03 in the state of Uttarakhand and the Northern Region was 3774 MU and 156610 MU against availability of 3670 MU and 144218 MU respectively. Thus there was a deficit of 2.8% and 9.1% respectively. The main resources for generating electricity are by utilizing the hydro potential available along the river drops besides the use of fossil fuel. With the limited coal resources and difficult oil position all over the world, it is necessary that electric generation be aimed to achieve the economic balance of 40:60 between the hydro and thermal generation of power, as against the existing 25:75 ratio. To improve the share of hydro-power generation, it is essential to develop hydro-electric power potential. Uttarakhand is one state which has tremendous scope for development of Hydro power projects. The hydro power potential of the State is assessed by CEA on 31 Jan 2009 is given below. Identified Capacity : 18,175 MW Capacity Developed : 3056.1 MW (16.81%) Capacity under Construction : 1850 MW (10.18%) Capacity yet to be Developed : 13269 MW (73.01%) The details of major hydro power projects under construction in the state of Uttarakhand are listed in Table-1.5.2.
Table-1.5.2 Major Hydro-Power Projects under construction in Uttarakhand
S. No. Project Capacity (MW)
1. Maneri Bhali Stage II 340
2. Lakhawar Vyasi Stage-I 300
3. Lakhawar Vyasi Stage-II 120
4. Srinagar H.E.Project 330
5. Vishnuprayag Scheme 400
6. Tehri Dam Project, Stage-I 1,000
7. Tehri Dam Project, Stage-II 1,000
8. Koteshwar Dam Project 400
9. Dhauliganga H.E. Project, Stage-I 280
Total 4,170
Source: EIA Report prepared by WAPCOS There is an urgent need to develop its huge untapped hydro power potential capacity with the purpose of harnessing hydro-power resources in the state for economic well being and growth of the people in the whole region. The Alaknanda valley has a vast potential for water resources development, substantial of which is yet to be harnessed. Accordingly, a number of hydro-power schemes have been envisaged on river

Project : Environmental Studies for Vishnugad Pipalkoti Hydro-Electric Project Page: 6 of 21 Document : 2008026/EC/Final Report Date: Nov 2009 Chapter-1 : Introduction and Project Description Revision: R4
Alaknanda and its tributaries, many of which are in different stages of construction / investigations. Some of the major hydro-electric schemes identified in Ganga Valley for development in the state of Uttarakhand are given in Table-1.5.3.
Table-1.5.3 Major Hydro Schemes Identified in Ganga valley S. No Name of Scheme River Basin
1 Badrinath Alaknanda 2 Jhelam Tamak Dhauliganga 3 Malari Jelam Dhauliganga 4 Rishi Ganga-I Rishiganga 5 Rishi Ganga-II Rishiganga 6 Deodi Rishiganga 7 Harsil Dam Rishiganga 8 Gangotri Bhagirathi 9 Bhairon Ghati Bhagirathi 10 Khartoli Lumti Talli Sarda 11 Kalika Dantu Sarda 12 Mapang Bagudiyar Sarda 13 Sela Urthing Sarda 14 Sirkari Bhoyl Rus Bagar Sarda 15 Sobla Jhimrigaon Sarda 16 Sirkari Bhyol Bagudiyar Sarda 17 Chhanger Chal Sarda 18 Kharsiya Bada Sarda 19 Garba Tawaghat Sarda 20 Garjla Dam Sarda 21 Bokang Belling Sarda 22 Nelang Jadhganga 23 Karmoli Jadhganga 24 Jadhganga Jadhganga 25 Devasari Dam Pinder 26 Gohana Tal Birahinganga
Source: DPR; Volume-I, Main Report The Power Supply and Demand scenario at the end of the 10th and 11th Plans for the Northern Region and the Country as a whole considering the benefits arising out of the ongoing schemes would be as follows (Source : 16th Electric Power Survey):
Table-1.5.4 Energy Status of India and Northern Region India Northern Region Energy Status
2006 – 2007 2006 – 2007 2011 - 12
Energy demand (MU) 719097 220820 308528
Energy Available (MU) 626621 181468 249731*
Surplus / Deficit in (MU) -92476 -39352 -58797
Surplus Deficit in % -12.9% -17.3% -19.05%
Peak demand (MW) 115705 35540 49674

Project : Environmental Studies for Vishnugad Pipalkoti Hydro-Electric Project Page: 7 of 21 Document : 2008026/EC/Final Report Date: Nov 2009 Chapter-1 : Introduction and Project Description Revision: R4
India Northern Region
Peak availability (MW) 101527 29667 35073*
Deficit in (MW) -14178 -5873 -1460
Surplus / Deficit in % -12.3% -17% -29.4%
Source: DPR; Volume-I, Main Report
There is Energy and Peaking deficit of 12.3% and 17% respectively in India and Northern Region by the end of 10th Plan. The energy will be 19% and 29% at the end of 11th Plan respectively in India and Northern Region hence the capacity addition by implementing the Vishnugad Pipalkoti H.E. Project is pertinent. VPHEP is suited to help provide peaking power to the national grid. Once commissioned, the project will provide 1813 million units of electricity each year to the Northern Region to meet India’s growing energy needs. The Project shall also help to improve the hydro-thermal mix in the country.
1.6 PROJECT LOCATION
Vishnugad Pipalkoti Hydro Electric Project (4 x 111 MW) is located on Alaknanda River, a major tributary of river Ganga, in district Chamoli in the state of Uttarakhand. It is a run-of-the river hydro power project & envisages construction of a diversion dam of 65 m height near village Helong (79o29’30” E and 30o30’50” N). An underground power house is proposed at village Haat (79o24’56” E and 30o25’31”N), 3 km from Pipalkoti.
View of Dam Site
The nearest railway station is at Rishikesh about 225km from project site. National Highway NH-58 from Ghaziabad-Rishikesh –Pipalkoti-Joshimath is located on the Left Side of the River and all the project components are located on right bank of the river. The Index of the project is given as Figure-1.1. The location of the project site in Uttarakhand is given in the Figure-1.6.1.

Project : Environmental Studies for Vishnugad Pipalkoti Hydro-Electric Project Page: 8 of 21 Document : 2008026/EC/Final Report Date: Nov 2009 Chapter-1 : Introduction and Project Description Revision: R4
Figure-1.6.1 Location of Project Site in Uttarakhand
Pakistan
Project Site

Project : Environmental Studies for Vishnugad Pipalkoti Hydro-Electric Project Page: 9 of 21 Document : 2008026/EC/Final Report Date: Nov 2009 Chapter-1 : Introduction and Project Description Revision: R4
1.7 PROJECT HIGHLIGHTS The project comprises the following main components:
Dam Site: A 65m high concrete diversion dam with spillway section having 4 No. 6.6m x 15m opening is proposed near village Helong. The reservoir will have a gross storage capacity of 3.63 million cum, out of which 2.47 million cum shall be live storage. A diversion cum spill tunnel of 10 m dia shall divert the discharge of 725 m3/sec during the construction period.
Power House Site: The power house site is located inside a hill in right bank of
Alaknanda River downstream of Haat village. It will comprise of two separate underground caverns for installation of turbines and transformers. The dimensions of power house will be 127 m x 20.3 m x 50 m. The size of transformer cavern is 112 m x 16 m x 24.5 m. The power house will have 4 units of 111MW. The project would afford an annual energy generation of 1813.03 GWH on 90% dependability basis
Head Race Tunnel: 13.4 km long & 8.8 m dia modified horse shoe shaped head
race tunnel has been proposed on right bank of the Alaknanda River.
Tail Race Tunnel: 3.07km long & 8.8 m dia modified horse shoe shaped tail race tunnel has been proposed on right bank of the Alaknanda River.
Intake structure with 3 No. modified horse shoe shaped intake tunnel of 6m
diameter 3 No. underground sedimentation chambers Silt flushing tunnel of size 3.6m x 4.0m Earlier, four Adits located at Gulabkothi village (Adit -1), Langsi (Adit-2), Maina
Nadi (Adit- 3) and Adit-4 on U/s of Surge shaft had been envisaged by Project. THDC India Ltd has introduced, Tunnel Boring Machine for the portion of Head race tunnel operations. This will reduce the use of identified muck disposal sites. Adit–1 at Gulabkoti & Adit-4 on U/s Surge Shaft shall be utilized for muck disposal and will be constructed. Adit 3 at Maina Nadi shall be considered for construction at later stage in view of any contingency
1.8 ANALYSIS OF ALTERNATIVES 1.8.1 Dam Site
In 1984, Uttar Pradesh (U.P.) Irrigation Department identified Vishnugad – Pipalkoti Hydro Electric Project (VPHEP) for development with an installed capacity of 340 MW. Several alternative sites were considered in the identification report which included barrage at Helong and underground power house at Birahi on the right bank. The report also considered construction of a high dam and creation of a large storage. Two alternatives were considered. In the first case, an underground power house at Birahi on right bank was considered, and in the second alternative, a surface power house near village Haat, on the left bank, was proposed. However, no detailed investigations were carried out at the time.
Project : Environmental Studies for Vishnugad Pipalkoti Hydro-Electric Project Page: 10 of 21 Document : 2008026/EC/Final Report Date: Nov 2009 Chapter-1 : Introduction and Project Description Revision: R4
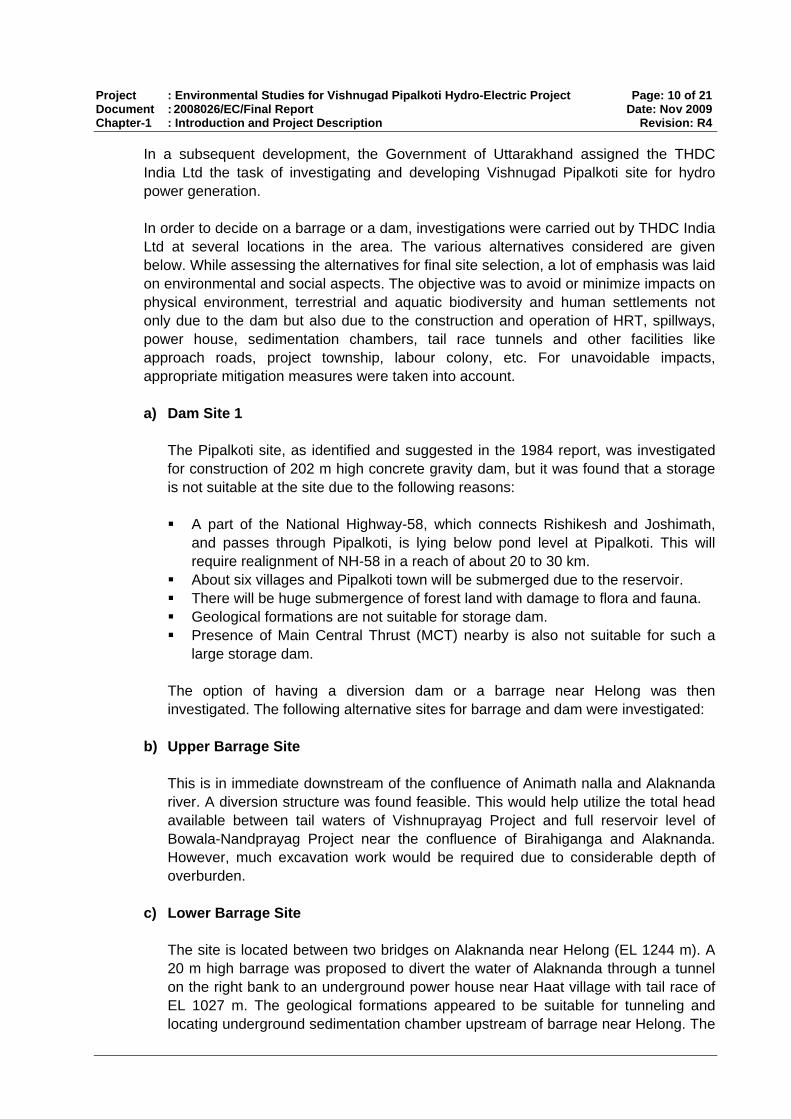
In a subsequent development, the Government of Uttarakhand assigned the THDC India Ltd the task of investigating and developing Vishnugad Pipalkoti site for hydro power generation. In order to decide on a barrage or a dam, investigations were carried out by THDC India Ltd at several locations in the area. The various alternatives considered are given below. While assessing the alternatives for final site selection, a lot of emphasis was laid on environmental and social aspects. The objective was to avoid or minimize impacts on physical environment, terrestrial and aquatic biodiversity and human settlements not only due to the dam but also due to the construction and operation of HRT, spillways, power house, sedimentation chambers, tail race tunnels and other facilities like approach roads, project township, labour colony, etc. For unavoidable impacts, appropriate mitigation measures were taken into account. a) Dam Site 1
The Pipalkoti site, as identified and suggested in the 1984 report, was investigated for construction of 202 m high concrete gravity dam, but it was found that a storage is not suitable at the site due to the following reasons: A part of the National Highway-58, which connects Rishikesh and Joshimath,
and passes through Pipalkoti, is lying below pond level at Pipalkoti. This will require realignment of NH-58 in a reach of about 20 to 30 km.
About six villages and Pipalkoti town will be submerged due to the reservoir. There will be huge submergence of forest land with damage to flora and fauna. Geological formations are not suitable for storage dam. Presence of Main Central Thrust (MCT) nearby is also not suitable for such a
large storage dam. The option of having a diversion dam or a barrage near Helong was then investigated. The following alternative sites for barrage and dam were investigated:
b) Upper Barrage Site This is in immediate downstream of the confluence of Animath nalla and Alaknanda river. A diversion structure was found feasible. This would help utilize the total head available between tail waters of Vishnuprayag Project and full reservoir level of Bowala-Nandprayag Project near the confluence of Birahiganga and Alaknanda. However, much excavation work would be required due to considerable depth of overburden.
c) Lower Barrage Site The site is located between two bridges on Alaknanda near Helong (EL 1244 m). A 20 m high barrage was proposed to divert the water of Alaknanda through a tunnel on the right bank to an underground power house near Haat village with tail race of EL 1027 m. The geological formations appeared to be suitable for tunneling and locating underground sedimentation chamber upstream of barrage near Helong. The

Project : Environmental Studies for Vishnugad Pipalkoti Hydro-Electric Project Page: 11 of 21 Document : 2008026/EC/Final Report Date: Nov 2009 Chapter-1 : Introduction and Project Description Revision: R4
site falls in the vicinity of MCT. The barrage, if located here, would not be able to utilize the full head available between Vishnugad and Helong, but the discharges of Karmanasa and Kalpganga rivers would be available for power generation.
d) Dam Site 2 The site is about 120 m downstream of dam site 1. There is strong possibility of rock fall here on right abutment. Depth of overburden is little over 19 m.
e) Dam Site 3 The site, located about 200 m downstream of dam site 2, was not found suitable as about 20 m thick river borne material terrace exists above water level on the left and right bank. There is also possibility of rock fall.
f) Dam Site 4 The location is about 1.5 km downstream of dam site 1. Construction of a small dam was considered with head race tunnel (HRT) on right bank and underground power house near Haat village. The area above the site, at a higher level, is covered with debris and forests. There is a major shear zone upstream, but is sufficiently away from the proposed dam site. Geologically, the site reveals hard and compact quartzite and is comparatively free from the danger of rock fall. The proposed tunnel on the right bank will not have to cross MCT. Waters from Karmanasa and Kalpganga rivers will be fully utilized. Since the gorge is steep and narrow, underground sedimentation chamber will be required.
g) Dam Site 5 Taking into consideration the studies carried out by THDC India Ltd, detailed investigations were carried out by the DPR consultants. On the basis of these investigations, a new site has been selected for construction of a diversion dam with low height spillway. This site is 50 m downstream of dam site 1, near village Helong. A summary of the findings of various alternatives is given in Table-1.8.1.
Table-1.8.1 Summary of findings of various Alternatives of Dam Site
Alternatives Location Environmental, Social & Technical issues
Remarks
D-1 site Near Pipalkoti Pipalkoti town and 6 villages will submerge
Huge forestland under submergence
NH-58 below pond level, will need realignment in 20/30 km stretch
Main Central Thrust close to the site
Calcareous rock-not suitable for
Not suitable

Project : Environmental Studies for Vishnugad Pipalkoti Hydro-Electric Project Page: 12 of 21 Document : 2008026/EC/Final Report Date: Nov 2009 Chapter-1 : Introduction and Project Description Revision: R4
Alternatives Location Environmental, Social & Technical issues
Remarks
storage dam Upper Barrage Site
Just d/s of Animath nala - Alaknada confluence
Overburden depth too much- much excavation required
Not suitable
Lower Barrage Site
Near Helong Close to MCT Full head not able to utilize
Not suitable
D-2 Site 120 m d/s of D-1 Overburden depth too much Not suitable D-3 Site 200 m d/s of D-2 Rockfall prone
20m thick river borne material terrace above water level on both bank
Not suitable
D-4 Site 1.5 km of d/s of D-1 Least environmental and social problem
Found suitable
D-5 50 m d/s of D-4 Most appropriate from environmental, social and technical aspects
Finally selected
Conclusion: On the basis of these investigations, Alternative-D5 has been selected for construction of a diversion dam with low height spillway.
1.8.2 Other Components Once the dam site was finalized, location/ alignments of other project components like HRT, power house, approach road etc. were selected. Environmental and social aspects were taken into consideration while finalizing the location/ alignments of these components, as detailed below: a) Head Race Tunnel (HRT) Alignment
The 13.4 km long 8.8 m dia modified horse shoe shaped head race tunnel has been proposed on right bank of the river. The geological profile of the rock structure in the tunnel are completely folded and faulted. The alignment of the tunnel is crossed by several perennial and ephemeral nallas and Maina nadi, which is an important drainage and intersects the tunnel at a distance of about 9 km from the dam. The alignment of the tunnel has been optimally fixed to provide adequate rock cover below the nala crossings. As the most critical stretch of the HRT passes through Maina nadi which required proper rock cover, detailed and adequate site investigations were carried out for finalizing and selecting the layout of the alignment. The construction of HRT will not have any significant impact on environment as it is an underground tunnel. The HRT traverses though sparsely vegetated area with scattered Pine trees. It does not involve clearing of land. Hence the flora & fauna of the area will not have any adverse impact. It does not involve acquisition of land hence the individual and community will not be affected.

Project : Environmental Studies for Vishnugad Pipalkoti Hydro-Electric Project Page: 13 of 21 Document : 2008026/EC/Final Report Date: Nov 2009 Chapter-1 : Introduction and Project Description Revision: R4
b) Power House Geology and ecology of the area, availability of head and discharge in the river, as well as human habitation and density of population are some of the main issues considered for the location of the Hydro-Electric Power Project. Although the proposed project falls outside the buffer zone of the Nanda Devi Biosphere Reserve, which is also a World Heritage Site, in order to minimize the impact on the surrounding environment THDC abandoned the option of Surface Power House and opted for the proposed underground structure which is more secure and environmentally viable. The Power House site is selected inside a hill in right bank of Alaknanda river downstream of Hat village covering an area of 2.00 ha. The underground power house was also proposed as the river banks are steep and there was paucity of space for surface power house in other alternate site which was considered near Birahi Ganga confluence with Alaknanda River. In fact the hill slopes of the surrounding area are considerably steep and constructing a surface power house by excavation was also not considered practical. So the site which is located about 15 km downstream of the proposed diversion dam was selected for the construction of underground power house. The detailed topographical study of the area surrounding and the geological investigations carried out also revealed that the power house complex was suitable for accommodating other tunnels such as cable tunnel, ventilation tunnel, adit tunnel to penstock. Therefore the orientation of the power house has been decided on the basis of in-situ stress and foliation direction. View of Power house site The under ground power house complex will comprise of two separate caverns. The main machine hall cavern is 127m long, 20.3m wide and 50m high. It will have a 35m long service bay and 20m long control room and space for 4 units of 111 MW. The transformer cavern will be 112m long, 16m wide & 24.5m high to accommodate transformer and Gas Insulated Switchgear (GIS) etc. The draft tubes shall be provided with a draft tube gate. The construction of under ground power house site is likely to reduce the impact on surrounding environment. The area is sparsely vegetated and floral species found at the site are common in occurrence and are found extensively throughout the degraded areas. The site in located on right side of the river hence the traffic on NH -58 on left bank will not be impacted significantly.
c) Spillway & Energy Dissipation For optimal utilization of the head and water available from the different streams joining the river the site an ogee spillway with vertical gates is proposed to pass the

Project : Environmental Studies for Vishnugad Pipalkoti Hydro-Electric Project Page: 14 of 21 Document : 2008026/EC/Final Report Date: Nov 2009 Chapter-1 : Introduction and Project Description Revision: R4
design flood of 8004 m3/sec corresponding to PMF. Four openings, each with clear opening of size 6.6m x 15m (height) are proposed to cater to design flood discharge which is inclusive of one gate for additional factor of safety as per BIS Code. Radial Gates will be operated by means of hydraulic hoists. Provision of stop log gates with gantry crane has also been made. Energy dissipation is proposed through a trajectory type of bucket which throws the feet of water through the air and into the plunge pool. Protection works in term of concrete apron are proposed immediately downstream of bucket.
d) Approach Roads Vishnugad Pipalkoti H E Project is connected on Ghaziabad –Haridwar-Rishikesh-Srinagar-Pipalkoti-Joshimath-Mana National Highway (NH- 58). The project site is about 225 k m from Rishikesh. Various approach roads covering a total length of 25.578 km length are proposed to be constructed in the project area to provide good accessibility to various work fronts i.e. Dam Site, Power House, Adits, Quarry & Borrow Area, Muck Disposal Sites, Pot Yard Area etc. The various components of the project will be connected by project road diverted from National Highway (NH-58). They are as follows: (i) Approach Road to dam site ( Animath to Dam) (ii) Approach Road to Langsi Adit (Gulabkoti to Dwing) (iii) Approach Road to Maina Adit (Pipalkoti to Maina Nadi) (iv) Approach Road to Power house & colony site (Koriya to Siyasain) These roads will cover a total area of 38 Ha. The road to dam complex will be diverted from the NH-58 and will be connected to dam top, bridge, and various work fronts up to river bed etc and will be of permanent nature. The site does not have any rare/endangered or threatened species of flora. It traverses through the Van Panchayat area and the species found at the location are common and planted. The construction of road does not involve disturbance to any wildlife habitat and human settlement. There is no settlement located at the site hence no impact on local people due to the road construction.
Approach Road to Langsi Adit (Old road route to Badrinath below NH 58)
Starting point of Approach Roadto Dam site

Project : Environmental Studies for Vishnugad Pipalkoti Hydro-Electric Project Page: 15 of 21 Document : 2008026/EC/Final Report Date: Nov 2009 Chapter-1 : Introduction and Project Description Revision: R4
Construction of approach road to Langsi Dwing Adit does not involve any road cutting on left bank. The existing PWD road which was an old road route to Badrinath will be utilized from Langsi up to the Bridge on Alaknanda. The section will be updated and connected to the adit portal opposite Patal Ganga. It will avoid cutting of trees, cutting of hill and land acquisition on the left bank. Therefore the impacts on environment and social aspects are minimized by the utilizing the old abandoned road The approach from National Highway near Pipalkoti will be diverted to the adit portals on Maina Nadi and will be of permanent nature. It will provide connectivity to the villages on the right bank Tenduli, Math and Guniyala. The villagers have to frequently/ daily walk and reach Pipalkoti for marketing, hospital, school etc. The construction of road will save time and energy of the villagers.
Approach Road to Maina Adit View of Approach Road to Power House Site
The approach road near Kodia village will be of permanent nature and diverted to connect power house, switch yard, surge shaft top & bottom, TRT outfall and residential/non residential complex will be of dual carriage way. The alignment traverses through open area with some agricultural land. There is no forest present in the area. The vegetation is dominated by thorny bushes and all species found are common in occurrence.
e) Project Township The proposed project township is in Siyasain which is located on the right bank of Alaknanda River approx. 20 km downstream from the dam site. The proposed township site is a flat patch of land with gentle slope of approx. 13 Ha. Within this township residential / non-residential buildings, Post office, Bank, Fire station, Guest houses, Market, Police station etc., will be provided for the officers and staff for operation and maintenance of the plant. Water treatment plant/ Sewage treatment is also planned to be provided for a clean living environment. The complex is planned to be located on the right bank of Alaknanda, D/S of the power house road bridge near village Jaisal/Siyasain. The proposed site falls in building Zone-V (Seismic Zoning Map of India, IS 1893 part I, 2002). All the project components will be looked after from this residential/ non-residential complex. This site has been selected as it has good accessibility with the surrounding facility area, power house, dam site of THDC and the nearest commercial complex i.e.

Project : Environmental Studies for Vishnugad Pipalkoti Hydro-Electric Project Page: 16 of 21 Document : 2008026/EC/Final Report Date: Nov 2009 Chapter-1 : Introduction and Project Description Revision: R4
market, community center, guest houses, hotels, offices etc. located at Pipalkoti. The local town of Pipalkoti is located approx. 4km away from this proposed project township. Secondly most of the construction activities related to the dam construction are located on the right bank of the Alaknanda River. This site has been selected, as major portion of the land is barren with a minimal covering of grass, few scattered trees, a school and few houses of the Jaisal/Siyasain village. Major portion of this site (i.e. approx. 60 % of the total area belongs to village panchayat) and about 40% of the land is forest land. Sites on the left bank were not considered as NH-58 transverses on the left bank of Alaknanda River. But proper approach roads for various work areas for construction and operation and maintenance of the project would be provided and diverted from National Highway at different locations by bridges across Alaknanda River for various approach roads.
f) Contractors Accommodations
The proposed contractors accommodation including the labour camps and construction workers camps are to be located in Gulabkoti, Langsi, Guniyala and Batula. The contractors accommodation, labour and construction workers camps at Gulabkoti, Langsi (Dwing) and Batula are located on the left bank of the river as topography on the right bank are steep as there is paucity of space and flat land on the right bank. These site has been selected by project authority as they have good accessibility with the surrounding facility area, power house, dam site of THDC and the nearest commercial complex These labour camps and construction workers camps and the various components of the project will be connected by the 4 project roads diverted from National Highway no. 58 (NH-58) by bridge crossing over Alaknanda River at four points at Haat, Tenduli, Huna and Tapan Nala. Presently all these bridge crossings are foot bridges. Four new bridges are also under construction over Alaknanda River at Birahi, Haat, Pipalkoti, Langsi and Helong.
g) Quarry and Borrow Areas The Quarry Areas sites are located at Gulabkoti. Patalganga and Gari gaon. Gulabkoti Quarry area is located around 2 km downstream of the proposed dam site and adjacent to National Highway (NH-58). The Patalganga Quarry area with terrace deposits to be used as coarse aggregate in concrete for non-wearing surfaces is located at about 5 km downstream of the dam site. The third site of Garigaon near Birahi River for coarse aggregate to be used in concrete for non-wearing surfaces is located at 5 km away from the proposed power house. All these Quarry areas have been selected as they are near the proposed construction sites for the various components of the project like Power House, Dams, Head and Tail Race Tunnels and Surge Shafts. The proposed quarry sites also have good accessibility and are well connected with the surrounding facility areas of power house and dam site of THDC by the four approach roads from NH-58 to dam site, Langsi to Dwing, Pipalkoti to Maina Nadi and Koriya to Siyasain.
Project : Environmental Studies for Vishnugad Pipalkoti Hydro-Electric Project Page: 17 of 21 Document : 2008026/EC/Final Report Date: Nov 2009 Chapter-1 : Introduction and Project Description Revision: R4
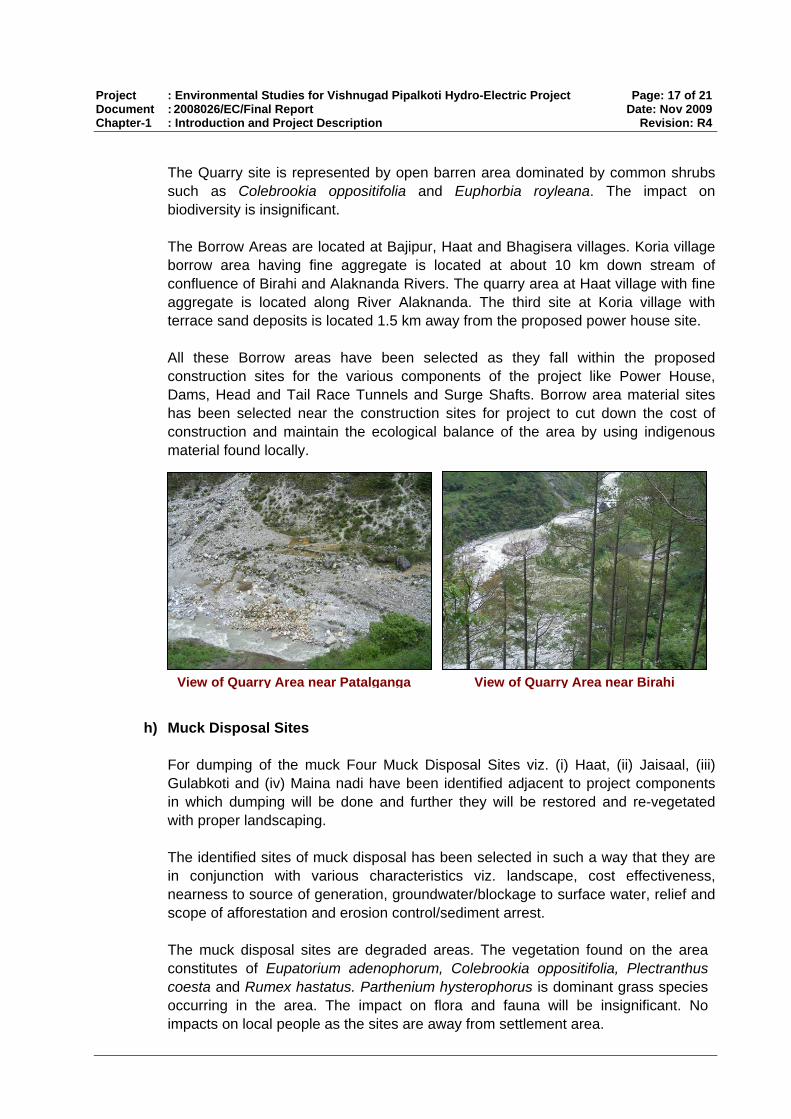
The Quarry site is represented by open barren area dominated by common shrubs such as Colebrookia oppositifolia and Euphorbia royleana. The impact on biodiversity is insignificant. The Borrow Areas are located at Bajipur, Haat and Bhagisera villages. Koria village borrow area having fine aggregate is located at about 10 km down stream of confluence of Birahi and Alaknanda Rivers. The quarry area at Haat village with fine aggregate is located along River Alaknanda. The third site at Koria village with terrace sand deposits is located 1.5 km away from the proposed power house site. All these Borrow areas have been selected as they fall within the proposed construction sites for the various components of the project like Power House, Dams, Head and Tail Race Tunnels and Surge Shafts. Borrow area material sites has been selected near the construction sites for project to cut down the cost of construction and maintain the ecological balance of the area by using indigenous material found locally.
View of Quarry Area near Patalganga View of Quarry Area near Birahi
h) Muck Disposal Sites For dumping of the muck Four Muck Disposal Sites viz. (i) Haat, (ii) Jaisaal, (iii) Gulabkoti and (iv) Maina nadi have been identified adjacent to project components in which dumping will be done and further they will be restored and re-vegetated with proper landscaping. The identified sites of muck disposal has been selected in such a way that they are in conjunction with various characteristics viz. landscape, cost effectiveness, nearness to source of generation, groundwater/blockage to surface water, relief and scope of afforestation and erosion control/sediment arrest. The muck disposal sites are degraded areas. The vegetation found on the area constitutes of Eupatorium adenophorum, Colebrookia oppositifolia, Plectranthus coesta and Rumex hastatus. Parthenium hysterophorus is dominant grass species occurring in the area. The impact on flora and fauna will be insignificant. No impacts on local people as the sites are away from settlement area.

Project : Environmental Studies for Vishnugad Pipalkoti Hydro-Electric Project Page: 18 of 21 Document : 2008026/EC/Final Report Date: Nov 2009 Chapter-1 : Introduction and Project Description Revision: R4
1.8.3 No-Project Scenario
The demand for power in the agricultural, industrial and domestic sectors in Uttarakhand and other States in the northern region of India is increasing. Most of the States in the region are experiencing power shortage. In order to overcome this shortage, it is felt necessary to increase generation of hydro power, for which there is huge potential in Uttarakhand. The Central Electricity Authority (CEA), in its 16th Electric Power Survey, projected the growth in demand in the northern region at the rate of 7 % during the 10th Plan and at the rate of 6.9 % during the 11th Plan. The current deficit in power supply in Uttarakhand is 2.8 % and in the northern region as a whole, 9.1 %. VPHEP is one of the important projects to improve the power generation. In the ‘No-Project-scenario’, that is, if VPHEP does not materialize, the present environmental status in the area may not change, but this may lead to other problems like:
• Non-availability of electricity affecting households, hospitals, tourism and other
commercial activities, industry and agriculture. • Dependence on diesel generators and firewood to meet local requirements, leading
to green house gas emissions and other environmental and health related problems. Taking all these aspects into consideration, it may be stated that environmental and health related problems would be there in the ‘No-Project-Scenario’ and, at the same time, power shortage problems will aggravate. It is, therefore, concluded that VPHEP is required to be implemented with adequate safeguards for environmental and social concerns due to the project.
1.9 UPSTREAM AND DOWNSTREAM LINKAGES
The proposed Vishnugad Pipalkoti Hydro Electric Project (VPHEP) to be located in Chamoli district of Uttarakhand is envisaged as a run off river scheme to harness hydro potential of river Alaknanda available between tail water level of Tapovan – Vishnugad Hydro Electric Project and Bowala Nandprayag Hydro Electric Project. The scheme envisages utilization of 228.86 cumecs discharge and design head of 237.0 m to generate 444 MW of hydropower. There are several hydro projects expected to come up upstream and downstream of the VPHEP. The proposed up-stream projects are as follows: a) Tapovan Vishnugad (Dhauli Ganga River) b) Lata Tapovan (Dhauli Ganga River) c) Vishnu Prayag Scheme Alaknanda River- Badrinath HPP d) Malari Jhelum on Dhauliganga e) Jhelum Tamak on Dhauliganga Hydro power projects likely to come up in the down stream section are as follows: a) Bowala Nand Prayag Hydro Electric Project (Alaknanda River)

Project : Environmental Studies for Vishnugad Pipalkoti Hydro-Electric Project Page: 19 of 21 Document : 2008026/EC/Final Report Date: Nov 2009 Chapter-1 : Introduction and Project Description Revision: R4
b) Nand Prayag -Langasu(Alaknanda River) c) Utvasu Dam (Alaknanda River) d) Srinagar Hydro Electric Project (330 MW) Alaknanda River
1.10 CONSTRUCTION MATERIAL
The details of construction material and source of Construction material required for the project is given in tables below.
Table-1.10.1 Details of Construction Material Required Material Quantity Quantity of material to be excavated 1413800 m3
Concrete 400,000 m3
Steel 50,000 Tonnes Source: EIA Report prepared by WAPCOS
Table-1.10.2 Sources of Construction Material S.No. Material Source
1. Coarse Aggregate • Rock quarry in power house area • Rock quarry in shaft drift area • Riverbed materials along river Birahi • Boulders along river bed along river Birahi • Terrace deposit in Patalganga
2. Fine Aggregate • Crushed sand made out of rock 3. Cement • From Open market 4. Steel • Rishikesh stock yard 5. Explosives • Authorized dealers from Dehradun 6. Miscellaneous materials like drill
nodes, diamond bits, welding rods, oil & lubricants, etc.
• From open market
Source: EIA Report prepared by WAPCOS
1.11 INFRASTRUCTURE WORKS
The implementation of the project requires development of infrastructure works at site, so as to facilitate timely completion of the project and proper operation & maintenance of the project. The Infrastructure works include
Communication: The nearest rail head is Rishikesh at about 225 km from the project site. The project is located on the right bank of Alaknanda river. National Highway no. 58 from Ghaziabad-Rishikesh –Pipalkoti- Joshimath is passing nearby the Dam complex and Power House complex.
Pipalkoti is well connected by telephone lines and also covered under BSNL mobile network. For effective execution and monitoring of the work at various work fronts and for liaison with the Consultants, various authorities and the contractors etc., an electronic automatic exchange of 100 lines will be required. BSNL net work of 200 mobiles may also be arranged for the project during execution & operation & maintenance.

Project : Environmental Studies for Vishnugad Pipalkoti Hydro-Electric Project Page: 20 of 21 Document : 2008026/EC/Final Report Date: Nov 2009 Chapter-1 : Introduction and Project Description Revision: R4
Approach Roads and Bridges: Approach roads and bridges planned
Water Supply & Sewage Disposal: The water requirement for all residential accommodation for officers & staff, hospitals and other utilities will be met by lifting the water from Alaknanda River and subsequent water treatment as per standard practice. The water will be supplied to various users by a dedicated water supply network laid in the area A dedicated sewer line is proposed in the residential & non residential area which will be connected to the sewage treatment plant d/s of residential complex.
Power Supply: The construction power at various works fronts and power for
residential / non buildings and other infrastructure facilities will be taken from Uttaranchal Power Corporation. However, to ensure continuous and un interrupted power supply for the project, stand by arrangements of power from DG set will also be made during execution and operation and maintenance of the project
1.12 POWER POTENTIAL & INSTALLED CAPACITY
The power potential studies have been carried out for VPHEP. This is a run-of-the-river type development with diurnal storage and would utilize a net rated head of water of 204.72 m. The plant would operate as peak load station. For determination of power potential, the following efficiency applicable for Francis turbine driven generating unit have been considered: • Efficiency of turbine: 94.5% • Efficiency of Generator :98.5% • Combined efficiency of turbine and generator: 93.08% The power potential studies carried out indicates that installed capacity of 444 MW comprising 4 generating units of 111 MW each would be required for this power project to derive optimum power benefits.
1.13 POWER EVACUATION
The power of this project is intended to be evacuated by proposed 400 kV D/C line to Pooling Station (Kunwari Pass). The total length of this line from Vishnugad-Pipalkoti Hydro Electric Project to Pooling Station (Kunwari Pass) is 30 km.
1.14 PROJECT COST & IMPLEMENTATION SCHEDULE The cost of the Project at March’08 PL is Rs. 2491.58 Crores including IDC and FC of Rs. 366.8 Crores. The first year and levellised tariff from the project would be Rs.2.53/KWh and Rs.2.07/KWh respectively. The Project is planned to be completed by June, 2013.

Project : Environmental Studies for Vishnugad Pipalkoti Hydro-Electric Project Page: 21 of 21 Document : 2008026/EC/Final Report Date: Nov 2009 Chapter-1 : Introduction and Project Description Revision: R4
1.15 STRUCTURE OF THE REPORT
The structure of the Consolidated EA report is given below
Chapter-1 : Introduction and Project Background Chapter-2 : Policy and Regulatory Framework Chapter-3 : Baseline Environment, Impacts & Mitigation Measures Chapter-4 : Environmental Management Plan Annexes

Policy, Legal & Regulatory Framework
22.1 Constitutional Provisions ........................................................................1 2.2 Environmental Regulations & Legal Framework for the Project ..............................................................................................2 2.3 Statutory Clearances obtained for the Project .......................................5 2.4 Applicability for the World Bank Safeguard Policies...........................8
2.1 CONSTITUTIONAL PROVISIONS
The constructional provisions and key points of policy and regulatory framework of India are discussed below: 2.1.1 Water Resources
• As per Constitution of India water is primarily a State subject and the role of
Government of India comes in only in the case of interstate river waters. • States are free to enact “water” laws and frame policies in accordance with
this provision. • Regulation and development of inter-state rivers and river valleys is under the
control of the Union. • Indian Parliament may, by law (1) provide for the adjudication on any dispute
or complaint with respect to the use, distribution or control of the waters of, or in, any inter-state river or river valley” and (2) “that neither the Supreme Court nor any other court shall exercise jurisdiction in respect of any such dispute or complaint” as referred to in (1).
2.1.2 Constitutional Provision related to Environment
The first constitutional provisions related to environment were made in the Forty-Second Amendment to the Indian Constitution. This amendment was passed in response to India being party to the Stockholm Declaration adopted by the International Conference on Human Environment in 1972. The Forty-Second Amendment introduced Article 48-A into the Directive Principles of State Policy in Chapter IV of the Constitution. The article declared the State's responsibility to protect and improve the environment and safeguard the forests and wildlife of the country. Another provision, included in Article 51-A (g), stipulated the duty of every citizen to "protect and improve the natural environment including forests, lakes, rivers and wildlife and to have compassion for living creatures." These amendments imposed an obligation on the Government and the courts to protect the environment for the people and the nation. Specific Reference to Environment Protection in the Constitution The State's responsibility with regard to environmental protection has been laid
Environment & Ecology Department

Project : Environmental Studies for Vishnugad Pipalkoti Hydro-Electric Project Page: 2 of 10 Document : 2008026/EC/Final Report Date: Nov 2009 Chapter-2 : Policy, Legal & Regulatory Framework Revision: R4
down under Article 48-A of our Constitution, which reads as follows: "The State shall endeavour to protect and improve the environment and to safeguard the forests and wildlife of the country". Environmental protection is a fundamental duty of every citizen of this country under Article 51-A(g) of our Constitution which reads as follows: "It shall be the duty of every citizen of India to protect and improve the natural environment including forests, lakes, rivers and wildlife and to have compassion for living creatures." Article 21 of the Constitution is a fundamental right which reads as follows: "No person shall be deprived of his life or personal liberty except according to procedure established by law." Article 48-A of the Constitution comes under Directive Principles of State Policy and Article 51 A(g) of the Constitution comes under Fundamental Duties. The State's responsibility with regard to raising the level of nutrition and the standard of living and to improve public health has been laid down under Article 47 of the Constitution which reads as follows: "The State shall regard the raising of the level of nutrition and the standard of living of its people and the improvement of public health as among its primary duties and, in particular, the State shall endeavour to bring about prohibition of the consumption except for medicinal purposes of intoxicating drinks and of drugs which are injurious to health." The 42nd amendment to the Constitution was brought about in the year 1974 makes it the responsibility of the State Government to protect and improve the environment and to safeguard the forests and wildlife of the country. The latter, under Fundamental Duties, makes it the fundamental duty of every citizen to protect and improve the natural environment including forests, lakes, rivers and wildlife and to have compassion for living creatures.
2.2 ENVIRONMENTAL REGULATIONS & LEGAL FRAMEWORK FOR THE PROJECT 2.2.1 Environment (Protection) Act, 1986
The Environment (Protection) Act is the most comprehensive law on the subject. The law grants power to the Central Government to take all measures necessary to protect and improve the quality of environment and to prevent pollution of the environment. In terms of responsibilities, the Act and the associated Rules requires for obtaining environmental clearances for specific types of new/expansion projects

Project : Environmental Studies for Vishnugad Pipalkoti Hydro-Electric Project Page: 3 of 10 Document : 2008026/EC/Final Report Date: Nov 2009 Chapter-2 : Policy, Legal & Regulatory Framework Revision: R4
(addressed under Environmental Impact Assessment Notification, 14th September 2006) and for submission of an environmental statement to the State Pollution Control Board annually.
2.2.2 EIA Notification, September 2006 As per the EIA Notification, 14th September 2006, new projects or activities require Prior Environmental Clearance. Projects have been grouped under Category ‘A’ requiring clearance from Expert Appraisal Committee (EAC) of MoEF, GoI and Category ‘B’ requiring clearance from the State Expert Appraisal Committee (SEAC). All hydropower projects with more than or equal 50 MW capacity and/or 10,000 ha of culturable command area come under “Category A”. Projects less than 50 MW capacity but more than or equal 25 MW capacity and loss than 10,000 ha of culturable command area come under “Category B”. The concerned Committee (EAC or SEAC) will finalize the TOR on the basis of Form-1, proposed TOR & Pre-Feasibility/ Feasibility Report. Environmental Impact Assessment study is to be carried out as per the TOR provided by the Committee. Public Hearing is required for Category ‘A’ project.
2.2.3 Forest (Conservation) Act, 1980 and its amendment This Act provides for the conservation of forests and regulating diversion of forestlands for non-forestry purposes. When projects fall within forestlands, prior clearance is required from relevant authorities under the Forest (Conservation) Act, 1980. State Governments cannot de-reserve any forestland or authorize its use for any non-forest purposes without approval from the Central Government. For diversion of forestland, the project proponent needs to apply to the State Government. Depending on the area required to be diverted, the proposals are cleared by MoEF Regional or Central Offices provided that the cost of compensatory afforestation, cost of rehabilitation of endangered/rare species of flora/fauna, and the net present value of the forest resources are deposited upfront with the state Forest Department.
2.2.4 Wild Life (Protection) Act, 1972 Wild Life (Protection) Act, 1972, amended in 2002 and in 2006, provides for “the protection of wild animals, birds and plants, and for matters connected therewith or ancillary or incidental thereto, with a view to ensuring the ecological and environmental security of the country”. Under the Act, animals include “mammals, birds, reptiles, amphibians, fish, other chordates and invertebrates, and also includes their young and eggs”. Wildlife is defined to include “any animal, aquatic or land vegetation which forms part of any habitat”, which has been interpreted to imply that the destruction of habitat amounts to destruction of wildlife itself. The Wild Life (Protection) Act provides for two kinds of protection to species–protection of specific endangered species listed in Schedules I, II, III and IV

Project : Environmental Studies for Vishnugad Pipalkoti Hydro-Electric Project Page: 4 of 10 Document : 2008026/EC/Final Report Date: Nov 2009 Chapter-2 : Policy, Legal & Regulatory Framework Revision: R4
(especially against hunting), regardless of its location, and the protection of all species in designated Protected Areas (PAs). Protected Areas categories include national parks, sanctuaries, conservation reserves, community reserves and tiger reserves, notified under Sections 18, 35, 36A, 36C and 38V of the Act. While ‘biosphere reserves’ are not legally a PA category, they are an important entity since they are formed by a Central Government notification under the UNESCO-Man and Biosphere programme. The Wild Life (Protection) Act restricts entry into a Sanctuary and National Park, and nobody is allowed in, except certain specified categories, such as those permitted by the Chief Wildlife Warden, or those who have immovable property within the limits of the national park/sanctuary. The Act also states that no person shall destroy, exploit or remove any wildlife from a national park/ sanctuary or destroy or damage the habitat of any wild animal or deprive any wild animal or its habitat within such a national park.
2.2.5 Water (Prevention & Control of Pollution) Act, 1974 & Air (Prevention & Control of Pollution) Act, 1981 These two laws are in force to prevent and control land-based pollution. These laws prescribe the standards for effluent discharge and air emissions and established the State Pollution Control Board to enforce the provisions of the Acts. The requirement is to obtain a No Objection Certificate i.e., Consent to Establish and Consent to Operate from State Pollution Control Board.
2.2.6 Biological Diversity Act, 2002 The Ministry of Environment and Forests has enacted the Biological Diversity Act, 2002 under the United Nations Convention on Biological Diversity signed at Rio de Janeiro on the 5th day of June, 1992 of which India is also a party. This Act is to “provide for the conservation of biological diversity, sustainable use of its components, and fair and equitable sharing of the benefits arising out of the sued of biological resources, knowledge and for matters connected therewith or incidental thereto.” As per the provision of the Act, certain areas, which are rich in biodiversity and encompasses unique and representative ecosystems are identified and designated as biosphere reserve to facilitate its conservation.
2.2.7 Hazardous Wastes (Management and Handling) Amendment Rules, 2003 These Rules classify used mineral oil as hazardous waste under the Hazardous Waste (Management & Handling) Rules, 2003 that requires proper handling and disposal. Organisation will seek authorisation for disposal of hazardous waste from concerned State Pollution Control Boards (SPCB) as and when required.
2.2.8 Serais Act, 1867 The Act enjoined upon a keeper of Serai or an inn to keep a certain quality of

Project : Environmental Studies for Vishnugad Pipalkoti Hydro-Electric Project Page: 5 of 10 Document : 2008026/EC/Final Report Date: Nov 2009 Chapter-2 : Policy, Legal & Regulatory Framework Revision: R4
water fit for consumption by “persons and animals using it” to the satisfaction of the District magistrate or his nominees. Failure for maintaining the standard entailed a liability of rupees twenty.
2.2.9 Indian Fisheries Act, 1897 The Indian Fisheries Act, 1897 contains seven sections. Section 5 of the Act prohibits destruction of fish by poisoning waters.
2.2.10 Factories Act, 1948 Factories Act, 1948 is a social welfare legislation intend to secure health, safety and welfare of the workers employed in factories. However, some of the provisions of this Act are concerned with prevention of water pollution.
2.2.11 Ancient Monuments and Archaeological Sites and Remains Act, 1958 The legal requirement is to obtain from ASI a no-objection certificate if any protected cultural property is within 10km of the project.
2.3 STATUTORY CLEARANCES OBTAINED FOR THE PROJECT The VPHE project has been developed by meeting the requirements of the State as well as Central Government environmental regulations. Following clearances have been obtained for the project. 2.3.1 Environmental Clearance
A 3-stage procedure for project preparation as per the guidelines of the Ministry of Power was followed for VPHEP. Activities of the three stages were tied up with a clearance from the Ministry of Environment & Forest (MoEF), Government of India. Stage-I Environmental Clearance This comprised activities for preliminary selection of the project site including a desk study on meteorology, hydrology & topography; establishment of observations for weather & river flow; preliminary layout of project facilities; preliminary cost estimate as well as cost estimates for Stage-II activities. Site Clearance (Stage-I) for VPHE project was obtained from the MoEF in July 2003. Stage-II Environmental Clearance Stage-II clearance is only for undertaking investigations at the site and for collection of environmental data for preparation of EIA report as per EIA

Project : Environmental Studies for Vishnugad Pipalkoti Hydro-Electric Project Page: 6 of 10 Document : 2008026/EC/Final Report Date: Nov 2009 Chapter-2 : Policy, Legal & Regulatory Framework Revision: R4
Notification 1994. Site Clearance (Stage-II) for VPHE project was obtained from the MoEF in May 2005. Stage-III Environmental Clearance Environmental Clearance for VPHE project was obtained from the MoEF in August 2007. Environmental Clearance was granted by MoEF subject to strict compliance of the terms and conditions as given below: Part-A: Specific conditions: i) 6,202 hectare degraded catchment area of high & very high category to be
treated. Catchment Area Treatment Plan has been proposed should be completed in three years.
ii) 346 project affected families are likely to loose their agricultural land. All the PAFs would be compensated as per the rates that would be assessed and decided by the district authorities. Over and above these compensation, the PAFs will be given “land for land” or “Vocation/Job” or “financial assistance” in addition to various rehabilitation benefits as per the NPRR-2003.
iii) A Monitoring Committee for R&R should be constituted which must include representative of project affected persons from SC/ST category and a women beneficiary.
iv) All the equipment which are likely to generate high noise levels are to be fully mollified (noise reduction measures) in view of the proximity of the project to Nanda Devi Biosphere Reserve.
v) 3 cum minimum water flow should be released down stream during lean season.
vi) Consolidation and compilation of the muck should be carried out in the muck dump sites and the dump sites should be above high flood level.
vii) The project area is situated in close proximity of Nanda Devi Biosphere Reserve, the possibility of the endemic flora can not be ruled out completely. Hence, suggested the plantation of those species which come under Rare, Endangered and Threatened (RET) category, if any, should be planted during the implementation of CAT and Compensatory Afforestation works.
viii) Commitment made during public hearing should be fulfilled. Part-B: General conditions: i) Adequate free fuel arrangement should be made for the labour force
engaged in the construction work at project cost so that indiscriminate felling of trees is prevented.
ii) Fuel depot may be opened at the site to provide the fuel. Medical facilities as well as recreational facilities should also be provided to the labourers.

Project : Environmental Studies for Vishnugad Pipalkoti Hydro-Electric Project Page: 7 of 10 Document : 2008026/EC/Final Report Date: Nov 2009 Chapter-2 : Policy, Legal & Regulatory Framework Revision: R4
iii) All the labourers to be engaged for construction works should be thoroughly examined by health personnel and adequately treated before issuing them work permit.
iv) Restoration of construction area including dumping site of excavated materials should be ensured by leveling, filling up of borrow pits, landscaping etc. The area should be properly treated with suitable plantation.
v) Financial provision should be made in the total budget of the project for implementation of the above suggested safeguard measures.
vi) A Multidisciplinary committee should be constituted with representatives from various disciplines of forestry, ecology, wildlife, soil conservation, NGO etc. to oversee the effective implementation of the suggested safeguard measures.
vii) Six monthly monitoring reports should be submitted to the Ministry and its Regional Office, Lucknow for review.
2.3.2 Forest Clearance
For the VPHE project, 100.39 ha of forest land is to be diverted; out of which 23.13 ha of land shall be required for underground works. The balance of 77.26 ha shall be utilized to create the necessary facilities and infrastructures under VPHEP. Forest clearance is required to acquire forest land for the project. After joint survey and verification of forest land to be transferred for the project, GoUK has recommended the forestland to be acquired for the project for approval before MoEF and clearance is expected shortly. The events of Forest Clearance are given below: Sl. No. Events 1. Submission of case to Forest department 2. Forwarding of case to C.F. by D.F.O 3. Forwarding of case to Nodal Office by C.F. 4. Forwarding of case to Govt. of Uttarakhand by Nodal Office 5. Clearance by Govt. of Uttarakhand 6. Forwarding of case by Nodal Office to MoEF Lucknow/ MoEF Delhi 7. Clearance from MoEF Committee 8. Approval from MoEF Committee 9. Raising of Demand of NPV etc. by Nodal Office 10. Deposit of NPV and funds for compensatory Afforestation 11. Final approval from MoEF 12. Raising of Demand by Nodal office for lease rent 13. Deposition of lease rent 14. Possession of land
2.3.3 NOC FROM STATE POLLUTION CONTROL BOARD No Objection Certificate (NOC) under Water (Prevention and Control of Pollution) Act, 1974 and Air (Prevention and Control of Pollution) Act, 1981 is a mandatory requirement for Hydropower project. To obtain NOC from Uttara
Project : Environmental Studies for Vishnugad Pipalkoti Hydro-Electric Project Page: 8 of 10 Document : 2008026/EC/Final Report Date: Nov 2009 Chapter-2 : Policy, Legal & Regulatory Framework Revision: R4
Khand Pollution Control Board (UKPCB) a detailed environmental impact assessment study was carried out and public hearing was undertaken through UKPCB. NOC (Consent to Establish) for VPHE project was obtained from the UKPCB in April 2007. Condition laid by the State Government i) To provide monthly progress report regarding use of essential
equipments/tools, forestation, inflow purification equipments and establishment of management of noise pollution control.
ii) Operation of hydro-power project can not be started without taking No Objection Certificate (Consent to Operate) under Air and Water Act.
iii) Submit the order copy of proposed purification for pollution control and supply of construction material.
iv) Geological setting of the project & nearby area is to be surveyed through concerned department and their recommendation is to be implemented.
v) Minimum flow is to be maintained in the Alaknanda River which is required for aquatic life.
vi) There should be no negative impact on regional forest resources, biota (fauna & flora) and livelihood due to project implementation. NOC is to be obtained from Forest Department, Department of Fisheries, Agriculture and other concerned departments within three months and to be submitted in the State Pollution Control Board otherwise NOC released from the board will be treated as cancelled.
vii) The Muck disposal proposal is to be submitted before starting the construction work
2.4 APPLICABILITY OF THE WORLD BANK SAFEGUARD POLICIES
The World Bank safeguard concerns and the policies that are applicable to the VPHEP are summarized below. The project has been designed with full compliance to the requirement of WB safeguard policies. • Environmental Assessment (OP/BP 4.01) - APPLICABLE
The major environmental issues in the project would include (a) disturbance to the forest cover in the project influence area, and the catchment; (b) impacts on the potential water use downstream; (c) induced erosion and landslides in the project area and its vicinity; (d) impacts from the project’s associated facilities; and (e) the construction-related impacts.
• Natural Habitats (OP/BP 4.04) –APPLICABLE The natural habitat is triggered as a part of the project area falls in the transitional zone of Nanda Devi Biosphere Reserve. The impact will be insignificant and, localized and limited to construction phase only. Appropriate measures are suggested to mitigate and enhance the surrounding environ of the project area.

Project : Environmental Studies for Vishnugad Pipalkoti Hydro-Electric Project Page: 9 of 10 Document : 2008026/EC/Final Report Date: Nov 2009 Chapter-2 : Policy, Legal & Regulatory Framework Revision: R4
• Forests (OP/BP 4.36) - APPLICABLE For the proposed development, there will be direct impact on forest due to acquisition of forest land. The project acquires 100.39 ha of forest land out of which 23.13 ha land shall be required for underground works. Total 6,153 trees are to be felled, out of which 4,672 trees come under private land and the balance 1,481 trees come under forestland. The species reported are commonly distributed throughout the project immediate influence area and project influence area. Therefore, adverse impact on terrestrial biodiversity due to tree felling is not envisaged.
• Involuntary Resettlement (OP/BP 4.12) - APPLICABLE The project involves land acquisition and physical displacement. For the proposed development, 31.621 ha private land is to be acquired and total number of project affected families are 769 of which about 265 are displaced/Homestead Oustee (HSO) (source: RAP, VPHEP)
• Indigenous Peoples (OD 4.20) – NOT APPLICABLE The impact on tribal is negligible for the proposed development. Out of the total population of the study area, general caste comprised 76.1%, scheduled caste (SC) comprises 17.4% and scheduled tribe (ST) comprises only 6.5%. The socio-economic characteristics of general caste and tribal of the project area reveal that agriculture is the main occupation. The tribal of the study area do not exhibit any indigenous characteristics as described in the Bank’s Operational Policy on Indigenous Peoples as confirmed by the social analysis described in EIA Report. The analysis carried out by the borrower indicates that the tribal are fully integrated into the mainstream economy of the local area.
• Safety of Dams (OP/BP 4.37) - APPLICABLE The project is a run of the river scheme involving construction of a 65m high diversion dam across river Alaknanda. The dam is to be constructed following the Bank’s policy on safety of dams (as the project will be funded by the World Bank). The borrowers (THDC) have their own Safety Manual/ Safety Assurance Plan, which will takes care of the safety features for the project, and reconfirms the safety of the dam.
• Physical Cultural Resources (OPN 11.03) –APPLICABLE Within the project affected area, there are few old abandoned building/ structures, which lie on the way from Haat village to Siyasain village. Pilgrims used to halt at this place during their journey to Badrinath. It is suggested that the exact age of the structures may be ascertained. However, for the proposed development there will be

Project : Environmental Studies for Vishnugad Pipalkoti Hydro-Electric Project Page: 10 of 10 Document : 2008026/EC/Final Report Date: Nov 2009 Chapter-2 : Policy, Legal & Regulatory Framework Revision: R4
no impact on the structures. There is only a small possibility of impacts on cultural properties (such as community religious properties, sacred groves, and chance-finds). The EIA includes procedures to identify such properties, and mitigate and manage impacts in the case, such properties are impacted. During construction if any artifacts are found then the chance find procedure will be applicable.
• Projects in Disputed Areas (OP/BP/GP 7.60) – NOT APPLICABLE No part of the project area is under any international dispute.
• Projects on International Waterways (OP/BP/GP 7.50) –APPLICABLE The Alaknanda is a tributory of Ganga River that begins at the confluence of the Satopanth and Bhagirath Kharak glaciers in Uttarakhand. It meets the Bhagirathi R at Devprayag after flowing for approx. 229 km through the Alaknanda valley. After Devprayag, the river is known as the Ganga. The source of Alaknanda river is close to the international boundary -China hence it is applicable.
Baseline Environment, Impacts & Mitigation Measures
33.1 Introduction .................................................................................................1 3.2 Topography ..................................................................................................1 3.3 Geology & Geotechnical Aspects .............................................................2 3.4 Meteorology ...............................................................................................11 3.5 Land Slide ...................................................................................................12 3.6 Land Environment ....................................................................................16 3.7 Managed River Flow.................................................................................22 3.8 Aquatic Ecology & Fish Diversity .........................................................72 3.9 Terrestrial Biodiversity ...........................................................................90 3.10 Archeological Survey .............................................................................164 3.11 Impacts Generated by Construction Activities .................................189 3.12 Socio-economic Study.............................................................................199
3.1 INTRODUCTION
Baseline environmental study was conducted to understand the present status of the environmental resources in the project area.The environment status of project area was based on detailed field survey and secondary data review. The environmental study was conducted in the Project Influence Area-PIA (7km around the Project Sites), Project Immediate Affected Area-PIAA (500m on either side of Project sites) and at the Project Affected Areas-PAA (land acquired for Project). The Environment Assessment consisted review of topography, geology, hydrology, landuse, aquatic ecology, terrestrial biodiversity and archaeology of the Project area. Primary survey was followed by consultation with local people to get the relevant information about the area. Public consultation is attached as Annex 3.1.1. (11 environmental and 18 social consultations were held) The Project sites with sampling locations are attached as Drawing 2008026/EC/VPHEP/01. Environmental impact assessment involved prediction of potential impacts by the development of the project on the surrounding area. Based on baseline environmental status and proposed project activities potential impacts have been assessed and predicted and appropriate mitigation measures are suggested to avoid / reduce/ compensate the potential adverse impacts and enhance the positive impacts.
3.2 TOPOGRAPHY The topography is by and large rugged, the entire region is mountainous. The cross profiles of the fluvial valleys show convex form with steep valley sides, interlocking spurs
Environment & Ecology Department

Project : Environmental Studies for Vishnugad Pipalkoti Hydro-Electric Project Page: 2 Document : 2008026/EC/Final Report Date: Nov 2009 Chapter-3 : Baseline Environment, Impacts & Mitigation Measures Revision: R4
descending towards the main channel, hanging valleys, water falls and rapids and terraced agricultural fields on the gentle slopes on the valley sides. The clustering of villages is confined mainly on the gentle slopes of the ridges on the fluvial terraces. The construction of project does not have any significant impact on the topography as it is a run off project with underground tunneling. Mitigation Measures • Landscaping / reclamation of quarry/ borrow area • Implementation of muck disposal plan • Implementation of green belt development
3.3 GEOLOGY & GEOTECHNICAL ASPECTS The region belong to Garhwal Group, rocks belonging to Proterozoic age are exposed in the area. These are separated in the north from Central Crystalline group of rocks by the Main Central Thrust. 3.3.1 Geomorphology
The area is drained by Alaknanda River, which has originated from the Satopanth-Bhagirath Kharak group of glacier. There are number of countless perennial and ephemeral tributaries of River Alaknanda. The prominent tributaries of River Alaknanda are Dhauli Ganga, Nandakini, Pinder, Mandakini and Bhagirathi. This is an antecedent river and flows transverse to the structural axes in a deeply incised channel with irregularly terraced patches of Quaternary gravelly and sandy deposits along its path in the Inner Lesser Himalayan belt. The Inner Lesser Himalayan belt south of Helong is of comparatively gentle gradient and milder topography than metamorphic belt of Higher Central Himalaya. The hills around the valley rise to lofty heights highly dissected and reveal various geomorphic landforms. The average height ranges from 1500 m to 4500 m. Generally higher slopes shows gentle slopes, while the lower reaches shows deep recently rejuvenation, dissected topography and concave hill slope. Around Pipalkoti three prominent river terraces have been reported while the maximum villages of the project area are situated over the colluvial deposits. The small streams feeding the main river flow to the structural strike and drain the areas either northeastward or southwestward. Generally a trellis type of drainage has developed in this area. Most of the geomorphic features present in the project area are the result of polycyclic endogenic and exogenic processes of varying intensities through times. From Dam site to TRT outfall Alaknanda River is drained by its three major tributaries namely Maina Nadi, flowing almost in northwest-southwest direction, while the Patal Ganga and Garur Ganga flowing in southeast-

Project : Environmental Studies for Vishnugad Pipalkoti Hydro-Electric Project Page: 3 Document : 2008026/EC/Final Report Date: Nov 2009 Chapter-3 : Baseline Environment, Impacts & Mitigation Measures Revision: R4
northwest direction. This is an antecedent river and flow transverse to the structural axes in gorgeous channels with irregularly terraced patches of sub-recent gravelly and sandy deposits along their paths. The study area is covered by closely spaced network of channels, tributaries and streams fed by spring water. It seems that the drainage of the area is still in its mature stage, which is mainly controlled by lithology, structure and tectonics. Higher order streams have both tectonic and lithological control while lower order streams have developed on the neo-tectonic uplifts etc. The present landscape scenario of the study area represents the complex process of denudation under the influence of fluvial condition, which was later modified by recent reactivation. The area is characterized by gentle and mature topography exhibiting tell-tale evidence of recent rejuvenation. The Alaknada watershed in the project area is part of Inner Lesser Himalaya with minimum and maximum altitudes of 1000 m and 5100 m above sea level. It is deeply dissected resulting in steep valley flanks and narrow crested ridges. The valley flanks have a slope of 70o to 90o and width of valley floor is limited to width of drainage channel. The higher peaks are snow-clad during the winter season. The geomorphic cycle is in youthful stage. The hill slopes are formed of frequent rock outcrops, free faces (rocky cliffs), and mantle of colluvium and in places deposits of quaternary. The geomorphic processes operative are sheet wash (laminar flow), fluvial dissection and deposition, freezing and thawing, and mass wasting. The Alaknanda River from Helong to Birahi has almost flow along northeast-southwest direction. The valley floor is narrow, valley sides are steeper, axial slope of valley is not yet graded and hence the flow is swift. The rocky hill slopes form riverbanks in most of the places and 2 to 8 m high vertical face within fluvial terraces (in patches) form the bank in a few places. Major tributaries such as Dwing Gad, Tirosi Gad, Mena nadi, Ghanpani Nala and Jaisal Nala (all in the right bank of Alaknanda) have near straight valleys indicating structural control but the tributaries of Mena Nadi viz. Gangartoli and Barma Gad flow in a cascade pattern indicating glacial origin. Mena Nadi is the major tributary of Alaknanda in the project area which is feeding by its nine tributaries namely Gangartoli Gad, Barma Gad, Dogara Gad, Gairal Gad, Bagdari Gad, Rikhni Gad, Pang Gad, Sari Gad and Laudau Gad. Gangartoli Gad has originated from Kalpani Glacier and Barma Gad is originated from Ruptalla bank, while all the other tributaries are spring fed. The tributary valleys are deep, narrow, steep, and channel gradient is higher. The Alaknanda river valley and its tributary valleys are being down-cut and have rocky channel with channel materials formed mostly of pebbles, cobbles and boulders resting over rocky floor. On both the bank of Alaknanda along the hill slopes from channel to crest there are no significant break in slope. The fluvial terrace is preserved in the powerhouse area near bridge mainly on the left bank of river. The terraces have near flat topography with very gentled axial and cross slopes. The fluvial terrace material consists of predominantly cobbles, boulders, pebbles which are semi- rounded to rounded in a matrix of

Project : Environmental Studies for Vishnugad Pipalkoti Hydro-Electric Project Page: 4 Document : 2008026/EC/Final Report Date: Nov 2009 Chapter-3 : Baseline Environment, Impacts & Mitigation Measures Revision: R4
coarse sand and they are semi-consolidated. The direct effects of surface drainage and associated landslides have given rise to a wide variety of soil types on moderately sloping to moderately steep sloping banks of the river Alaknanda in the form of a narrow valley. These are excessively drained loamy-skeletal soils with slight stoniness and moderate erosion. The soil on cliff and precipitous slopes are excessively drained loamy skeletal soils with strong stoniness and very severe erosion. On the summit and ridge tops different types of soil is present. Steeply sloping (>30o) surfaces register mostly coarse-grained soils with rock fragments. Moderately steep slope (16o-30o) surfaces exhibit thick soil cover. They are well to somewhat excessively drained, coarse-loamy to fine-loamy soils, with little or no rock fragments. Moderately sloping (<15o) surfaces are composed of well-drained fine-loamy soils with local strewn pebbles on the surface. They are also associated with coarse loamy soils at places
3.3.2 Seismicity of the Area State comes under Seismic Zones V and IV of Seismic Zoning Map of India, which corresponds to Zone Factors of 0.36 and 0.24 (effective peak ground acceleration in terms of ‘g’) (IS 1893 part I, 2002). The earthquake record reveals that several seismic events have ravaged different parts of the State in the last 200 years Oldham (1869) mentions of a strong earthquake occurring in the upper valley of Ganga on 1st September 1803 at 1.35 hrs. The tremors, which were reported to be very violent, killed 200-300 people at Barabal and inflicted severe damage at Badarinath. Another major earthquake of an estimated magnitude of 6.5 at Richter’s scale occurred in Mathura 1 hrs 5 min before the Upper Ganga event. The Oldham catalogue mentions of another major earthquake near Gangotri on 25 May 1816 that included numerous landslides. On 28 August 1916 an earthquake of magnitude 7.5 on Richter’s Scale having its epicenter in west Nepal had a considerable influence in Kumaon region and caused heavy damage at Dharchula. In the Kapkot earthquake of 28 December 1958 over a dozen houses collapsed. The 29th July 1980 Dharchula-Bajang earthquake of M 6.1 and epicentral intensity VIII on MM scale caused extensive damage and even well constructed building in Dharchula town were not spared. The tremors induced numerous landslides and ground fissures. The most destructive earthquake documented so far in Uttarakhand was that of Uttarkashi of 20th October 1991 which took a toll of 768 human lives, caused injuries to 5000 people and damaged 45,765 houses, besides inducing numerous rock slides, ground fissures and changes in hot spring chemistry (GSI, 1992). The epicentral tract occupying an area of 20 sq km around Maneri in Bhagirathi valley recorded an intensity of IX on MSK-64 scale. The main shock was followed by a series of over 2000 aftershocks in a period of two months. On the 29 March 1999 another major earthquake shook the entire State and inflicted moderate to heavy damage in the central part of Uttarakhand. The

Project : Environmental Studies for Vishnugad Pipalkoti Hydro-Electric Project Page: 5 Document : 2008026/EC/Final Report Date: Nov 2009 Chapter-3 : Baseline Environment, Impacts & Mitigation Measures Revision: R4
event, referred to as Chamoli earthquake, registered a magnitude of 6.8 at Richter’s scale and an epicenter intensity of VIII. Its effects, most severe in the Alaknanda valley, were noticeable as far as up to Delhi. The strong motions damaged a total of 1,87,619 houses in Chamoli, Rudraprayag, Tehri and Pauri districts causing death of 106 persons and injuries to 453. Numerous landslides were induced by the tremors apart from development of tension fissures. Uttarakhand, including the western part of Nepal Himalaya has been classified in to four hazard classes as very high (VHH), High (HH), moderate (MH) and (LH) (Pande 1996). The HH zone lying between energy contours 1015 and 1017 ergs km-2 yr-1 occupies 36% area of Uttarakhand and encompasses major parts of Uttarkashi, Chamoli, Bageshwar, Almora, Pithoragarh and Champawat districts. Here, possibility of occurrence of earthquake of 6<M<7 exists in every 100 years. The MH zone, where there is possibility of 5<M<6 in every 100 years, spreads in 41% of the area. Places like Purola, Tehri, Rudraprayag and Haridwar fall under this zone. GSI and BRGM France carried out an exercise on seismic hazard assessment of Northwest India in 1994-95 (Pandey 1996). It evaluated the Peak Ground Acceleration (PGA) values using a probabilistic approach. In Uttarakhand – West Nepal the PGA varied from 130 cm/sec2 in the Foot Hill region to 340 cm/sec2 in the Indo-Nepal border, respectively, corresponding to a return period of 475 years. These values were of the order of 290-320 cm/sec2 in the Uttarkashi- Chamoli region. Since the project area forms a part of the Seismic Zone V, which corresponds to a zone factor of 0.36 (Effective Peak Ground Acceleration in terms of ‘g’ as per IS 1893: Part 2002). The north dipping Main Central Thrust (MCT) lies about 2 km northeast of the proposed dam site and the seismic status of this thrust is not properly known. The Alaknanda fault, and Srinagar thrust (NAT) are located about 32 km and 45 km southwest respectively of the proposed dam site. A number of other less prominent structural dislocations are also present in the area. All the project components of this project lie downstream of the Main Central Thrust.
3.3.3 Thermal Springs In the Garhwal Himalaya, as many as 62 thermal springs are reported. As per the Geothermal Atlas of India (GSI Pub.) as many as 19 thermal springs have been recognized in Alaknanda valley from Kharbagar in the south (29o59’30”: 79o55’56”) to Madhyamaheshwar (30o59’20”: 79o12’30”) and the area includes the Tapovan (30o 29’30” : 79o 33’30”) which is upstream of the dam site in the Dhauli Ganga valley. In addition to this site, one hot spring had been reported on the right bank of river Dhauliganga closer to river bank at Charmi Village (30o30’49.6’’: 79o36’36.9’’) during the geological mapping of Tapovan-Vishngad Hydroelectric Project.

Project : Environmental Studies for Vishnugad Pipalkoti Hydro-Electric Project Page: 6 Document : 2008026/EC/Final Report Date: Nov 2009 Chapter-3 : Baseline Environment, Impacts & Mitigation Measures Revision: R4
During the reconnaissance and mapping of the Dam site area, for locating the intakes and sedimentation tank, hot water springs have been recorded at three location, two are closer to the right bank and one to the left bank. In the drill hole El. 1229.07 (Ground Elevation) (E3843517.505, N754281.482) on the right bank (No.DH-8) hot water was encountered in overburden and the temperature was 68oC recorded by drilling party. The details of the thermal springs are presented in Table-3.3.1.
Table-3.3.1 Detail of Thermal springs Location Lat/Long Elevation Geological Setting Approx
Temperature(oC)
Left Bank of Alaknada
E3843547.416N754365.372
1230.30 m On the left bank of river through the vertical joints in quartzites
50oC (approx.)
Right Bank of Alaknada
E3843492.948N754411.086
1231.84 m Through foliation joint of the quartzite on the right bank.
55oC (approx.)
Right Bank of Alaknada
E3843500.135N754407.922
1231.20 m Through oblique joint of the quartzite on the right bank.
60oC (approx.)
Source: DPR, VPHEP
3.3.4 Geology of the Project Area The project area forming a part of Alaknanda valley exposes rocks belonging to Garhwal Group and Central Himalayan Crystalline and are composed mainly of calc arenaceous rocks with basic intrusive and migmatite bodies, while around Helong low to medium grade metamorphic rocks are exposed. The rocks occurring at the dam site are quartzites and along most of the length of the tunnel alignment are: quartzite with biotite schist, interbedded and interbanded grey slates and dolomites/limestone, grey thinly bedded slates with minor interbeds of limestone, dolomitic limestone with subordinate grey slates, grey pyritous shale / slates, thinly bedded dolomitic limestones, grey slate / phyllite, white siliceous dolomite with magnesite and talc schist; light grey dolomite with stromatolitic structures, interbedded quartzite phyllite and dolomite belong to Garhwal Group.Calcareous shale and dolomitic limestone / dolomite are observed at the dam site. Along Tail race Tunnel, dolomitic limestone, metabasics, augen gneisses and schist are observed. The Lithootectonic set up in the Vishnugad Pipalkoti H.E. Project area is given in Table-3.3.2.
Table-3.3.2 Litho-Tectonic Setup of the Vishnugad-Pipalkoti H-E Project
Litho-Units Lithology Joshimath Fm. (Inner Crystalline)
Kyanite gneiss, banded augen gneiss, migmatite, garnetiferous-biotite-schit and amphibolite
---------------Vaikrita Thrust / MCT-II---------------- (Jharkula-Bargaon-Saldhar)
Central Crystalline
Helong Fm. (Outer Mylonitised augen gneisses and migmatites, mica-

Project : Environmental Studies for Vishnugad Pipalkoti Hydro-Electric Project Page: 7 Document : 2008026/EC/Final Report Date: Nov 2009 Chapter-3 : Baseline Environment, Impacts & Mitigation Measures Revision: R4
Litho-Units Lithology Crystalline) schist, amphibolites and crystalline marble
Sericite quartzite and quartz mica schist Quartzite and chlorite schist.
-----------------Munsiari Thrust / MCT-I / Floor Thrust----------------- (1.5 km South-west of Helong to south of Tapovan via Salur)
Garhwal Group / Lesser Himalaya
Chamoli/ Gulabkoti Formation
Grey fine-grained dolostone. Siliceous on the top and base. Numerous magnesite lenses. Medium grained, grey to greyish green quartzite along the contact. Subordinate schistose quartzites with a thin band of amphibolite.
----------------------Gulabkoti Thrust (?)------------------------
Pipalkoti Formation Alternate slate and dolostone units. Slates are mainly graphitic and calcareous. Thinly intercalated limestone and slate unit. In the upper horizon of this unit limestone becomes massive and contains chip of bluish limestone. This is arenaceous phyllite and chloritoid slate. Numerous pockets of magnesite.
-------------------------Birhi Fault------------------------ Shear Zone: Mylonite quartzites, blasto mylonites,
augen mylonites, augen schists. Thin amphibolites along Birhi fault.
---------------------------Chinka Fault------------------------------
Chamoli/ Chinka Formation
Pure quartzites of greyish green colour. Orthoquartzites and subordinate schistose quartzites
Source: DPR VPHEP
3.3.5 Various Studies
• Seismic Refraction Studies The Seismic refraction studies in the dam area on surface and subsurface was carried out by CWPRS, Pune. Seismic refraction survey both on land and under water was carried out along five traverses upstream of proposed dam axis. The seismic traverse on land reveled three subsurface layers consisting of loose boulders, 2nd layer indicate compact / partially saturated boulders. The depth of rock as per the interpreted results is from 15 m to 23 m. No major shear zone or fault has been detected in the foundation of dam complex which may create problem during execution. This has been confirmed by the various hole drilled in the dam complex where in the compact rock is available at 10 to 25 m depth.

Project : Environmental Studies for Vishnugad Pipalkoti Hydro-Electric Project Page: 8 Document : 2008026/EC/Final Report Date: Nov 2009 Chapter-3 : Baseline Environment, Impacts & Mitigation Measures Revision: R4
• Electrical Resistivity Survey & Investigation For the efficient and economical design of earthing system of transmission towers so as to minimise the transmission losses, apparent resistivity of the subsurface material is required. As lower the apparent resistivity of the material better will be the electrical contact and hence minimum the transmission losses. With the above in view electrical resistivity profiling and imaging survey at two terraces in the switch yard area to measure apparent and true resistivity of the subsurface strata was carried out. The apparent resistivity values will help in deciding the level and in designing the earthing system for electrical installations efficiently and economically. The profiling was carried out in the terraces in switchyard area. The centre of the electrodes in both the cases was moved by 2 m i.e. apparent resistivity profile with 10 m electrode separation on the lower level terrace revealed that depending on the variation of resistivity, the area along this profile can be divided into three zones. Zone-1 having average apparent resistivity 235 ohm m is the most conducting of the three zones. For Zone-II & III, the apparent resistivity is 290 ohm-m and 420 ohm-m respectively. It is inferred from the results that apparent resistivity values for these three zones that along this traverse from upstream to dam stream either clay or moisture content or both are decreasing. On lower level terrace zone-1 with lower apparent resistivity values should be preferred for earthing purpose. On the upper level terrace, the more or less uniform nature of strata is available. However, the resistivity imaging carried out at the upper level terrene revealed that in the middle of profile there exists a narrow zone with high trace resistivity values. This zone either be avoided for earthing purpose or special care are to be taken for earthing to minimize the transmission losses. • Geo-thermal Investigation Hot springs have been noticed near the dam area. To have on the spot assessment Geo-thermal investigations have been taken up through GSI & IIT Roorkee, and the effect of results will considered during detailed design stage of the project. • Tectonics The main tectonic unit namely the higher Himalyan central crystalline is thrust South ward along the main central thrust (MCT) over the rocks belonging to the lesser Himalyan. Gneisses of the Joshimath formation are falling into a broad symform with plunge towards north. Major tectonic lineament has been identified along Dhauli Ganga and Alaknanda valley’s having general westerly trend. The other lineaments are along NW & NE-SW directions. Few minor lineaments are noted along N-S ad NNE-SSW direction.

Project : Environmental Studies for Vishnugad Pipalkoti Hydro-Electric Project Page: 9 Document : 2008026/EC/Final Report Date: Nov 2009 Chapter-3 : Baseline Environment, Impacts & Mitigation Measures Revision: R4
• Design Seismic Parameter The project area falls under seismic zone V of seismic zoning map of India (IS8493:2002) corresponding to zone factors of 0.36 & 0.24 (effective peak ground acceleration in terms of (g) of seismic intensities VIII and > IX (MSK-64 scale). Detailed site specific seismic study to estimate the design parameters are being worked out by IIT, Roorkee.
3.3.6 Recommendations • Dam: The geological mapping has indicated that rock types exposed on both
the bank are quartzites with minor bands of schist. At least two drift at the Final Dam site one at the left bank and other on the right bank should be excavated at the final dam axes to know the depth of the stripping during pre-construction period. Exploration by ten Drill holes on the left and right bank of the river has been carried out. These drill holes have proved overburden up to 25 m below which bed rock consist of quartzites with minor bands of schist down to the bottom of the hole.
• Desilting Chamber: In the desilting area it is likely to encounter hot water
springs as has been recorded in the dam site area. Therefore it is suggested to take care of the findings of geothermal investigations.
Accordingly, project authorities have taken up the Geo-thermal investigations separately & the results will be taken into consideration during the execution of the project.
• Diversion Tunnel: For locating the inlet portal of the diversion tunnel the rock is not available as proved by the drill hole (DTH-2), drilled at the site i.e., the initial reach will be in open cut / channel with suitable protective measures of the bank / slope before opening the portal in the quartzite.
• Head Race / Tail Race Tunnel: A drill hole is drilled along the HRT
alignment at the Ghanpani nala, to ascertain the depth of overburden and physical condition of the rock at the tunnel grade. In addition to the general tunneling problems high temperature during tunneling may also be encountered. Geo-thermal investigations already conducted. Accordingly, preventive measures should be adopted in the effective reaches. Due to the presence of sets of number of joints the tunnel is beset with the problems of rock fall and roof collapse in the reaches where chlorite schist, shale/slates shall be encountered. This problem is likely to be more pronounced in the weak zones where water seepage is also encountered. Mena Nadi is another important drainage which has to be negotiated by the

Project : Environmental Studies for Vishnugad Pipalkoti Hydro-Electric Project Page: 10 Document : 2008026/EC/Final Report Date: Nov 2009 Chapter-3 : Baseline Environment, Impacts & Mitigation Measures Revision: R4
HRT. Three number drill holes have been drilled during the feasibility stage in this area. The area has been topographically resurveyed which indicate that more than 3 D rock cover (30.50 m) shall be available while driving the tunnel at the proposed location of the crossing. A fault has been interpreted along Mena Nadi which shall have to be negotiated while driving the HRT. It is suggested that advance probe hole may be planed along the HRT alignment in this reach to know the tunneling condition in advance and for planning the support system. The flat dips occurring in certain reaches of HRT may also pose problems of roof collapses and over breaks. The zones where the rocks are more closely jointed and charged with water shall require heavy supports therefore it is suggested that advance probe hole ahead of face are very necessary to know such eventuality in advance. In addition, fore polling, control blasting, rock bolting, shotcreating and steel rib support etc. shall also be planned in advance while driving the tunnel. In the course of tunneling water seepage is apprehended below the major perennial streams and dolomite reaches. These reach of the tunnel calls for suitable tunneling technique, supporting systems and monitoring connectivity with excavations.
• Surge Shaft / Pressure Shaft: The surge shaft will be located in the hard and compact, moderately jointed dolomite and no major problem is anticipated during the excavation of surge shaft / pressure shaft but encountering of inflow of water can not be rulled out in the pressure shaft excavation.
• Power House & Transformer Caverns: The underground power house/
Transformer caverns are being planned to be located in moderately jointed and compact dolomite. Suitable drainage galaries all around and these caverns shall have to be planed in advance for excavating the power house cavity as ingress of water while excavation can not be rulled out and the same have to be retained during Operation & Maintenance of the project. Proper steel support system alongwith rock bolts, shotcrete etc. are to be planned in advance while excavating the power house cavity. As the dolomite which shall be encountered during excavation are expected to be moderately to highly jointed, and water charged. Control blasting with protective measures shall have to be adopted for safe excavation of these cavities. A detailed Scientific and Technical studies to determine seismic parameters with regard to the safety of the dam have been conducted by Dept. of Earthquake Engineering, IIT Roorkee. Based on this, dynamic analysis has also been conducted. The studies have been approved by the National

Project : Environmental Studies for Vishnugad Pipalkoti Hydro-Electric Project Page: 11 Document : 2008026/EC/Final Report Date: Nov 2009 Chapter-3 : Baseline Environment, Impacts & Mitigation Measures Revision: R4
Standing Committee on Seismic Design Parameters (NCSDP). It has been concluded that the present design of the dam is safe.
• During tunnel construction and underground power house construction proper air circulation should be maintained inside the work area. Proper ventilation should be provided.
• Employees should be removed from any area where there is air borne
contamination at a concentration which exceeds the exposure limit for that contamination.
• Portable instruments should be provided to test atmosphere quantitatively for
carbomn monoxide, hydrogen sulphide, nitrogen dioxide, flammable or toxic gases.
• Whenever workers are liable to be injured by sliding or falling of material
from roof , face or wall of the tunnel, suitable measyres such as shoring, spray creating, use of rock bolts or other appropriatre measures should be taken to ensure safety of workers. The stability of temporary support should be checked regularly.
• Emergency generators should be provided to ensure adequate illumination of
the tunnel.
• No person should be employed in compressed air unless he as been examined by medical practioner and cerified fit for such employment.
• Internetional guidelines for underground work with respect to air circulation,
fire protection, communication, health, emergency preparedness must be followed.
3.4 METEOROLOGY 3.4.1 General Meteorological Scanerio
The climate of the area is tropical characterized by a hot summer from March to Mid June, a little humid monsoon or rainy season stretching from Mid June to mid October, a short pleasant post-monsoon from middle of October to November, and a very cool winter spanning between December to February. Therefore, climatologically, four seasons viz. summer (pre-monsoon), monsoon, post-monsoon and winter could be deciphered comprising the following months: Summer : March, April, May Monsoon : June, July, August, September, mid October Post-monsoon : mid October, November Winter : December, January, February.

Project : Environmental Studies for Vishnugad Pipalkoti Hydro-Electric Project Page: 12 Document : 2008026/EC/Final Report Date: Nov 2009 Chapter-3 : Baseline Environment, Impacts & Mitigation Measures Revision: R4
The Temperature in the area varies with elevation. It rises rapidly after March and the month of July is the hottest month of the year with mean daily maximum temperature going up to 27-28oC. With the withdrawal of monsoons, by the end of September, there is a sharp decrease in temperatures. The months of December and January are the coolest months of the year, with mean daily minimum tempoerature as low as 4-5oC The average annual rainfall is about 125 cm per annum. The maximum rainfall is received in the months of July and August. About 60% of the rainfall is received under the influence of south west monsoons during the months from July to September. On an average, there are about 88 rainy days (i.e. days with rainfall of 2.5 mm) in a year. The average `humidity’ is about 61% Apart from the monsoon months, humidity is around 50-55% throughout the year.
3.4.2 Meteorological Scenario during Study Period A meteorological monitoring station was established at Pipalkoti for collection of meteorological data from November 2008 to December 2008. A double storied building free from any obstruction around was considered for setting up the weather station. A temperature and humidity combined sensor, rain fall sensor and wind sensors (both wind speed and wind direction) were mounted on a T-bar assembly. Output of all these sensors was connected to the data logger to obtain automatic continuous recording of hourly values. The detailed on-site hourly monitoring results of meteorological parameters i.e., temperature, humidity, rainfall, wind speed and wind direction presented in Annex-3.4.1.
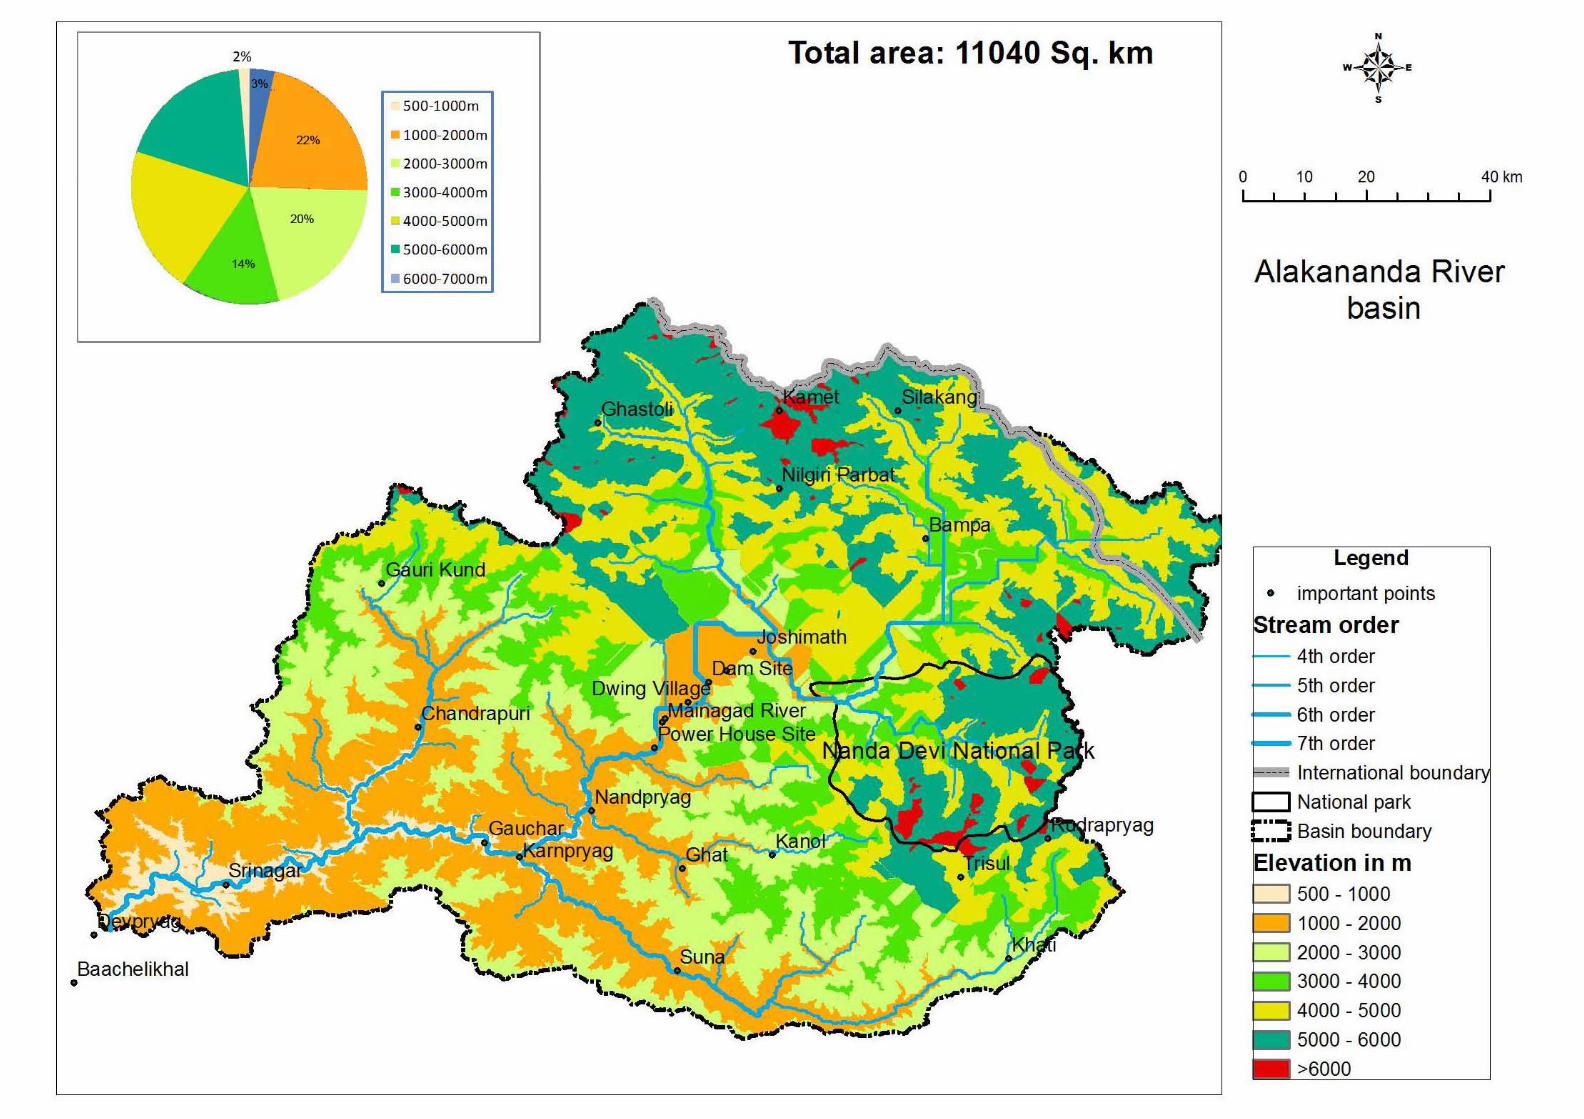

Project : Environmental Studies for Vishnugad Pipalkoti Hydro-Electric Project Page: 13 Document : 2008026/EC/Final Report Date: Nov 2009 Chapter-3 : Baseline Environment, Impacts & Mitigation Measures Revision: R4
3.5 LANDSLIDE The stability of an area depends on the combined effect of lithology, slope morphometry, structure, relative relief, landuse and land cover and hydro-geological condition. 3.5.1 Salient Features of the Major Landslides
Along the road section of the project area some major landslide occurs, which are active particularly during the monsoon period and disturbed the communication system and many time paralyzed the life of area. The general descriptions of these landslides are as follows:
View of Lanslide in the Project Area
Helong Landslide: It is situated at a distance of 25.8 km from Pipalkoti on the left bank of river Alaknanda near the bypass to Badrinath. It is a debris slide and the rocks are biotite schist with minor bands of metabasics come under the Central Crystalline category. Dam Axis Landslide: This landslide is located just 200 m upstream from the dam axis on the right bank of the river, about 19.20 km from the Pipalkoti. The rock type exposed is quartzite with thin bands of schist band, belonging to Garhwal Group. Gulabkoti Landslide: On the northeastern slope of Gulabkoti village toppling failure landslide was reported and situated 18 km from the Pipalkoti. It is debris cum planar type of failure and is located about 1 km downstream from the dam axis. The landslide affected area is barren (without trees cover) while surrounding area is covered by pine trees. The rock type is quartzite belong to Garhwal Group of rock. Langsi Landslide: Langsi landslide is situated about 15.8 km from Pipalkoti at Langsi village. It is debris slide, showing slumping nature. The landslide zone is active along the Patal Ganga valley through which the fault is running. The dolostone and slates which are present at the base of this landslide are highly crushed because of this fault belonging to Garhwal Group of rocks. The crown of the landslide is about 100 m above the road.

Project : Environmental Studies for Vishnugad Pipalkoti Hydro-Electric Project Page: 14 Document : 2008026/EC/Final Report Date: Nov 2009 Chapter-3 : Baseline Environment, Impacts & Mitigation Measures Revision: R4
Patal Ganga Debris Slide: On the right bank of Patal Ganga, 14 km from Pipalkoti huge debris landslide is present. The landslide is debris type showing the rotational movement. All along the landslide Uttis tress are present while the surrounding area of landslide is covered by Surai tress. At the right bank of the landslide at the base level slates are exposed but in the upstream direction in the toe level rocks are not exposed. The causative factors of these landslides are toe cutting, pore water pressure as indicated by numbers of streams in landslide area and presence of Patal Ganga Fault. Patal Ganga Rock Slide: Patal Ganga rock slide is situated 13 km from Pipalkoti. The landslide zone is active along the Patal Ganga valley. The length of the road affected by slide is about 60 m. The slide area is barren but the surrounding area is covered by thin forest (Pine) cover. Tangni (Pagal Nala) Landslide: Tangni landslide is located about 11 km from Pipalkoti at an altitude of about 1450 m near Tangni village. It is along the perennial nala and mainly on the left bank of the nala. It is a rock cum debris slide. On the right bank massive slate with dolomite bands are exposed along the road section, while on the right banks rocks are exposed on the crown level. Along the boundaries of landslide dense mixed forest of pine and oak are present. The length of the road affected by the side is about 200 mts. The slope area is covered with loose pulverized rock materials. The rock types are dolomite with bands of slates Pakhi Landslide: This slide is located at 9 km upstream from Pipalkoti on Haridwar – Badrinath road about 1.8 km from Pakhi village. It is complex type of slide including planar-toppling failure. The slide area is barren while at the crown pine trees are present. Pipalkoti Landslide: This slide is located at 1.4 km upstream from Pipalkoti on Haridwar – Badrinath road about 1.4 km from Pipalkot. It is rock cum debris slide. The rock types are slates with minor quartz veins and dolomite bands belong to Garhwal Group of rocks. Three sets of joints are present and vertical joints are very prominent and along these joints shear zone is present. The slide area is barren while left portion of slide area Pine and Surai tress are present
3.5.2 Result of Landslide Hazard Zonation Study
Landslide hazard Zonation refers to the division of a land surface into
homogeneous areas or domains and their ranking according to degrees of actual/potential hazard caused by mass-movement. On the basis of the total estimated hazard (TEHD), five categories of landslide hazard zones have been identified namely, very low hazard, low hazard, moderate hazard, high hazard and very high hazard. Likelihood of landslide is higher on slopes showing steep angles, highly weathered and fractured lithology large unforested watershed and at locations showing concave transverse sections

Project : Environmental Studies for Vishnugad Pipalkoti Hydro-Electric Project Page: 15 Document : 2008026/EC/Final Report Date: Nov 2009 Chapter-3 : Baseline Environment, Impacts & Mitigation Measures Revision: R4
where colluvium is accumulated. This discriminates function also expresses the capability of groundwater flow to reach the potential failure site.
124.34 sq. km. area (without river/water bodies) has been taken into
consideration for the landslide hazard zonation study. 35.527 percent of the area is under the low hazard category while very low hazard, moderately hazard, high hazard and very high hazards cover an area of 3.019 percent, 29.649 percent, 24.873 percent and 6.928 percent.
In the study area very high hazard zone (VHH) are located along the valley
of riverbed, in the Patal Ganga and Birahi Ganga area where old landslide and rock debris are accumulated and along the escarpment of Karmnasa river.
High hazard zones are more common around the left bank of Alaknanda
around Tangni, northeastern side of Helong, around Batula and southwestern side of Dwing area.
Moderate hazard zones are present in the north of Dungri, around Kiruli,
Gadora and around Baimru area.
Low hazard and very low hazardous area are mainly restricted to cultivated fields, alpine zone and in the area with gentle slope with good vegetated cover. The dam and surge shaft area come under the low hazardous zone while the TRT outfall area come under the moderate hazardous zone.
3.5.3 Potential Impacts and Mitigation Measures
The landslide at Pipalkoti, Pakhi, Tangri, Patal Ganga, Langsi, Gulabkoti and Helong are observed along the road section, fall on the left side of the river. Most of the project activities desiltation chamber, Head Race Tunnel, Power House and Tail Race Tunnel are located in the right bank of the river. On right bank the landslides are dam axes landslide, 1 km downstream of dam axes, Tapon and Dwing landslides. Occurrence of land slide due to road cutting may take place on either side. Since the dam and surge shaft area come under the low hazardous zone while the TRT outfall area come under the moderate hazardous zone the triggering of landslide due to project activites is lileky to be insignificant or moderate.
The very low hazard and low hazard zones are considered safe for development schemes.
The moderate hazard zones may contain some local vulnerable zones of instability, which could be controlled with appropriate slope measures. Wherever required checkdams spurs and vegetative measures must be undertaken.

Project : Environmental Studies for Vishnugad Pipalkoti Hydro-Electric Project Page: 16 Document : 2008026/EC/Final Report Date: Nov 2009 Chapter-3 : Baseline Environment, Impacts & Mitigation Measures Revision: R4
Wherever, high hazard and very high hazard zones present it could be avoided. Drainage must be provided along roads.
Plantation must be carried along the approach roads. Green belt development program may be undertaken, vegetation tends to
reduce surface water runoff and thus reduce the potential for erosion thus enhancing stability of slope. The barren and sparsely vegetated areas show faster erosion and greater instability.
The slope stabilization techniques are elaborated in Chapter-4, EMP under section 4.12.
3.6 LAND ENVIRONMENT
The details of landuse, impacts and mitigation measures is given below 3.6.1 Land Requirement
A total of 141.55 hectares (ha) of land is required to create the necessary facilities and infrastructure and other activities under VPHEP. Of the total land required, 100.39 ha (includes 23.13 ha land for underground works) is forest land and 9.539 ha belongs to PWD and shall be transferred to project. The private land of 31.621 ha shall be acquired for the project.
3.6.2 Land Use
Agriculture is the major landuse in the area. All the Govt land is categorized as Forestland. There are scattered Pine forests in the project area.
Table-3.6.1 Land use pattern of the Project Influence Area
Landuse Cover Area (ha) Dense Vegetation 4475 (13.6%) Open Vegetation 5797.3 (17.6%) Water bodies/River bed 199 (0.60%) Exposed Rock 4071 (12.4%) Agricultural land 9830.8 (29.9%) Grassland 2143.4 (6.5%) Scrub 3247 (9.9%) Snow 1120 (3.3%) Silty land 2034.5 (6.2%) Total 32918 100% Source: DPR VPHEP Note : Figure in brackets indicate percentage
3.6.3 Soil Quality Soil is the product of geological, chemical and biological interactions. The soil in a region vary according to altitude and climate. The soil in the project and the study areas, like any other region of Himalayas are young. The vegetal cover is one of the most important influencing factor characterizing the soil types in a region. Soil on the slope above 30o, due to erosion and mass wasting processes,

Project : Environmental Studies for Vishnugad Pipalkoti Hydro-Electric Project Page: 17 Document : 2008026/EC/Final Report Date: Nov 2009 Chapter-3 : Baseline Environment, Impacts & Mitigation Measures Revision: R4
are generally shallow and usually have very thin surface horizons. Such soils have medium to coarse texture. Residual soils are well developed on level summits of lesser Himalayas, sub-soils are deep and heavily textured. High contents of organic matter are found in its `A’ horizon and are acidic in nature. Valley soils are developed from colluvium and alluvium brought down from the upper slopes and thus, are deposited in the valleys and low-lying tracts or river terraces as a process of aggradation. In general north facing slopes support deep, moist and fertile soils. The south facing slopes on the other hand, are too precipituous and well exposed to denudation.
3.6.4 Agriculture
The agriculture of Garhwal Himalayas exhibits a great deal of variability in crop diversity, crop composition and crop rotation. The region can be divided into the following three agro-climatic zones along the elevation gradient: • Lower altitude (500 m to 1000 m) • Middle altitude (1000 m to 1800 m) • Higher altitude (> 1800 m) Agriculture is the main source of livelihood of the people of the State, more than 75% are engaged either in agriculture or its allied practices. Cultivation in the state is done mainly in the narrow patches of terraced fields on hilly slopes. The project area is located in the middle altitude area. The cropping pattern in this zone is built around two major cropping seasons, viz. kharif (April-October) and rabi (October-April). Paddy, maize and pulses are the major kharif crops. During rabi season, crops such as wheat, barley, mustard, peas are grown. Temperate fruits such as apple, pear, peach, plum, apricot, cherry and walnut are grown in the places of 1000 – 3000 m altitude. Other fruits grown in the state are citrus, mango, guava, papaya and strawberry. Among vegetables potato is the most important cash crop.
Orange common fruit in the area View of paddy transplantation

Project : Environmental Studies for Vishnugad Pipalkoti Hydro-Electric Project Page: 18 Document : 2008026/EC/Final Report Date: Nov 2009 Chapter-3 : Baseline Environment, Impacts & Mitigation Measures Revision: R4
3.6.5 Sedimentation and Silt erosion
For sediment handling of the VPHEP a very crucial choice has to be made, whether storage in the reservoir should be maintained through reservoir flushing from time to time or whether the reservoir should be allowed to fill up through sedimentation. The notion that reservoir sedimentation will be minimal or even that storage can be regained by discharging excess water through the gates during the monsoon does not hold. The flow velocities will be very low in (at least) the vicinity of the gates and significant sediment will take place. Effective flushing (i.e. flushing that regains storage) requires drawdown of the water level, hence the power plant cannot be operated during reservoir flushing. Advantages of maintaining reservoir storage through regular flushing are mainly 1) the sediment concentration in the intake will be smaller thus repair/maintenance costs of turbines will reduce drastically; and 2) with the storage a larger part of the flow during the lean period can be used for peak-hour production. To achieve the latter benefit flushing would only be required on the falling limb of the hydrograph. The main disadvantage is that high sediment concentrations occur during flushing events with potential negative environmental effects downstream. As an example: the model simulations have shown that flushing for 2 days with the radial gates fully open can recover 30 days of sedimentation during a “mean monsoon” period. This implies that the concentration – as an order of magnitude estimate – will be 15 (=30 divided by 2) times larger than the natural sediment concentration in the river for the same discharge. Another way to put the flushing concentration into perspective is that the flushing concentration corresponds to the (natural) river concentration that would occur for a 4 times larger discharge. If for instance only half of the flushing concentration would be acceptable then the duration of the reservoir flushing would have to double, and the power revenue reduced correspondingly.
Desilting Chambers The design operates with three parallel desilting chambers each with a length of 350 m, width of 16 m and height of 20.6 m. The sediment from these chambers is flushed through a silt flushing tunnel of size 3.6 m (W) x 4.0 m using a flushing discharge of 47.6 m3/s, which corresponding to approximately 20% of the intake flow. A perforated slab will be provided above a duct/trench of size 1m by 1.5 m in the desilting chamber to enhance sediment flushing. The desilting chambers were designed to trap 90% of sediment of size 0.2 mm and larger, but the analysis presented in this report suggests that the efficiency is only 78% when continuous flushing is taking place (i.e. intake discharge = turbine discharge + flushing discharge). Without the flushing discharge the trapping efficiency goes up to 98%. This improved trapping seems to suggest that intermittent flushing is better than continued flushing, but with intermittent flushing it may be necessary to stop the turbines if insufficient water is available. Combining the hydraulic analysis with a simple cost model leads to the following conclusions.
i. The optimal depth of desilting chambers is about 17.5 m. ii. Three and four chambers (with the same total costs) appears to be almost
equally optimal but since the basic assumptions underlying the analyses ap-pears to be best satisfied in case of larger desilting chambers (less hydraulic wall effect) it is proposed that three chambers as also proposed in the DPR design is the most optimal.

Project : Environmental Studies for Vishnugad Pipalkoti Hydro-Electric Project Page: 19 Document : 2008026/EC/Final Report Date: Nov 2009 Chapter-3 : Baseline Environment, Impacts & Mitigation Measures Revision: R4
iii. The optimal length of the desilting chambers depends on the reservoir operation. If live storage in the reservoir is maintained through regular reservoir flushing and thus providing trapping of sediment in the reservoir then the optimal length will be 390 m. If not, and thus the full sediment concentration is allowed to enter the intake then a length of 490 m (or more) will be optimal.
Hydro-mechanical Parts Keeping in view the presence of silt in the water and the possibility of silt erosion of underwater parts, the optimum speed of 250 rpm is recommended. The design provides various means facilitating easy maintenance:
A butterfly valve (Main Inlet Valve) at each turbine inlet for isolation of turbine as and when required for maintenance.
The power house layout is such that the runner can be dismantled in position and removed from the bottom of the unit.
A separate drainage sump will be provided in the power house at a convenient location. For dewatering the turbines, a separate sump is envisaged in the power house.
It is further proposed: That thermal sprayed hard metallic coatings by HPHVOF/HVOF
technique or any other proven superior coating shall be applied on runners, guide vanes, top and bottom liner plates and labyrinth seals.
To follow a modular concept of repair and replacement by adopting standard repair procedures and keeping an inventory of spares
To schedule repair and replacement work for the periods when flow in river is low to minimize the effect on revenue generation. For this reason loss of revenue due to down-time has been disregarded.
That an on-line silt monitoring system for monitoring the concentration of particles, which will pass through turbine to be able to shut down immediately the machine in case of too high concentration of particles. It should be emphasized that loss of generation on account of stopping the machine during monsoon period is much less than the cost and the consequences of damage to the machinery. Given the rapid development of various types of coatings and therefore the (inherent) limited practical experience with these coatings, it is highly recommended to request the bidders to guarantee the performance of the coating applied. Such guarantees shall be specified on performance basis.
Optimum Sediment Operation When the sediment laden water enters the backwater of the reservoir the transport capacity of the flow decreases and sediment will start to settle. In this way the reservoir will gradually fill up starting upstream with a sedimentation “front” migrating through the reservoir. While the reservoir fills up the scope for operation will decrease and hence the possibility for storing water during off-peak periods to enable peaking production will decrease. Moreover, the retention time in the reservoir (and thus the settling time) decreases so that more sediment will enter the power intake. An important aspect of sediment handling is therefore to decide at which stage of the in-filling of the reservoir to start flushing to evacuate the sediment deposited. Flushing of the sediment deposited close to the radial gates will be much more efficient than flushing sediment

Project : Environmental Studies for Vishnugad Pipalkoti Hydro-Electric Project Page: 20 Document : 2008026/EC/Final Report Date: Nov 2009 Chapter-3 : Baseline Environment, Impacts & Mitigation Measures Revision: R4
deposited at the tail end of the reservoir. There will thus be a trade of between water usage for flushing and the benefit of the storage regained by flushing as well as the benefit of reduced sediment concentration in the intake. The two-dimensional M21C model has quantified the water usage for different flushing scenarios and the “Reservoir Model” has determined the sediment concentration at the power in-take associated with the various flushing scenarios. These model simulations in combination with a simple model for estimation of loss of revenue due to decreased life storage and water usage for reservoir flushing have identified the optimal flushing strategy involving start of flushing when life storage has been reduced with about 40%. This requires flushing about 4 times each year (in an average year) with each flushing lasting about three days. The turbines have to be closed down during flushing. The revenue loss for flushing the reservoir and reduced life storage compared to a “no sediment” scenario is about 5%. Future Sediment Handling (for Operation) Optimum sediment operation will be complex with many factors affecting the necessary decisions to be taken. For instance a decision about flushing the desilting chambers would have to consider the following factors: How much sediment is deposited in the flushing trench of the desilting chambers and what is the likely increase of that? This would thus involve 1) Monitoring of sediment in trench and 2) A forecast of (near) future reservoir inflow (water and sediment). What is the available flow for flushing thus a forecast of required production is required. How is the downstream conditions (flow and sediment transport) and what possible environmental constraints would there be in relation to sediment flushing. This complexity calls for a Decision Support System (DSS) that integrates real-time monitoring data with forecasts values of inflow and production and a decision tree that will guide the operator to take the right decision. A real-time monitoring system should comprise discharge and sediment concentration at inflow to the reservoir, sediment concentration at intake, after desilting chambers (head race tunnel) and at sediment flushing channel from desilting chambers built up of sediment in trench of desilting chambers and at selected locations in the reservoir including in front of the intake.
Impact on Land Environment
Quarry sites identified for the project are at Gulabkoti quarry (2 km from dam
site), Patalganga quarry (5 km from dam site), Birahi quarry ( 5 km from power house site). The quarrying operations are semi-mechanized in nature.
Quarrying operation involve cutting a face of the hill. A permanent scar is likely to be left once quarrying activities are over.
The quary sites may become a potential source of landslide under the action of wind and other erosional forces, get slowly weathered and after some time, they are likely to become a potential source of landslide
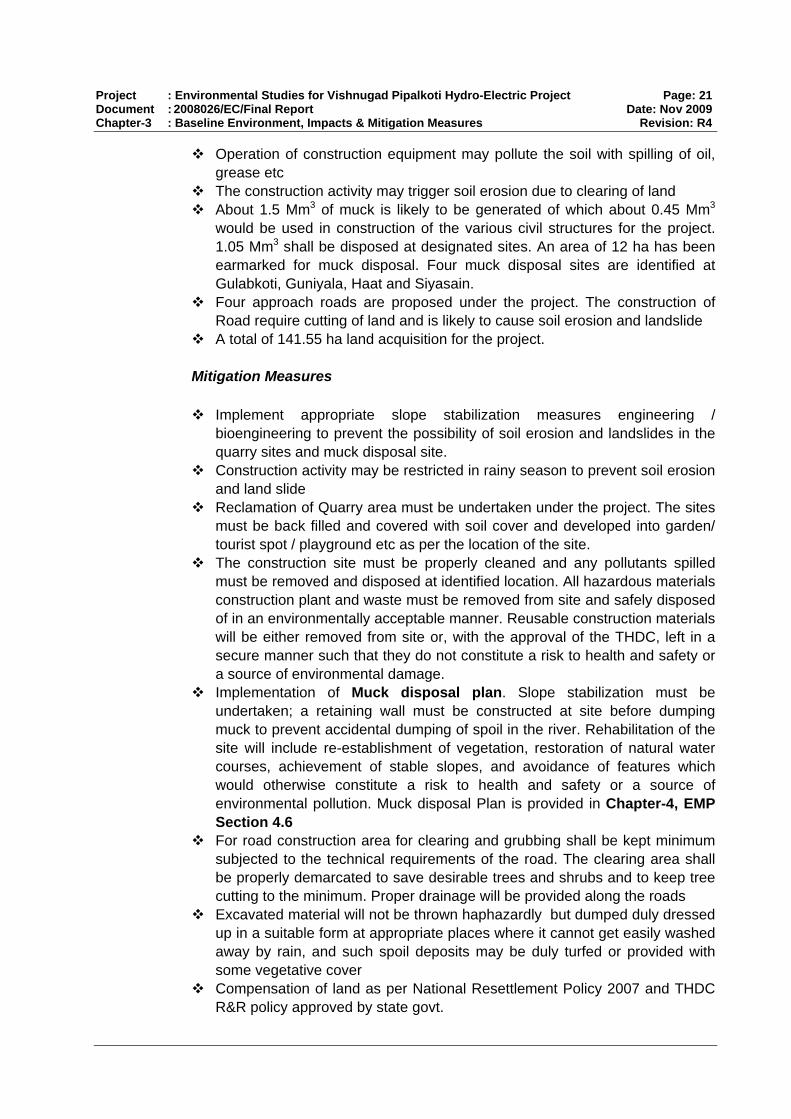
Project : Environmental Studies for Vishnugad Pipalkoti Hydro-Electric Project Page: 21 Document : 2008026/EC/Final Report Date: Nov 2009 Chapter-3 : Baseline Environment, Impacts & Mitigation Measures Revision: R4
Operation of construction equipment may pollute the soil with spilling of oil, grease etc
The construction activity may trigger soil erosion due to clearing of land About 1.5 Mm3 of muck is likely to be generated of which about 0.45 Mm3
would be used in construction of the various civil structures for the project. 1.05 Mm3 shall be disposed at designated sites. An area of 12 ha has been earmarked for muck disposal. Four muck disposal sites are identified at Gulabkoti, Guniyala, Haat and Siyasain.
Four approach roads are proposed under the project. The construction of Road require cutting of land and is likely to cause soil erosion and landslide
A total of 141.55 ha land acquisition for the project.
Mitigation Measures
Implement appropriate slope stabilization measures engineering / bioengineering to prevent the possibility of soil erosion and landslides in the quarry sites and muck disposal site.
Construction activity may be restricted in rainy season to prevent soil erosion and land slide
Reclamation of Quarry area must be undertaken under the project. The sites must be back filled and covered with soil cover and developed into garden/ tourist spot / playground etc as per the location of the site.
The construction site must be properly cleaned and any pollutants spilled must be removed and disposed at identified location. All hazardous materials construction plant and waste must be removed from site and safely disposed of in an environmentally acceptable manner. Reusable construction materials will be either removed from site or, with the approval of the THDC, left in a secure manner such that they do not constitute a risk to health and safety or a source of environmental damage.
Implementation of Muck disposal plan. Slope stabilization must be undertaken; a retaining wall must be constructed at site before dumping muck to prevent accidental dumping of spoil in the river. Rehabilitation of the site will include re-establishment of vegetation, restoration of natural water courses, achievement of stable slopes, and avoidance of features which would otherwise constitute a risk to health and safety or a source of environmental pollution. Muck disposal Plan is provided in Chapter-4, EMP Section 4.6
For road construction area for clearing and grubbing shall be kept minimum subjected to the technical requirements of the road. The clearing area shall be properly demarcated to save desirable trees and shrubs and to keep tree cutting to the minimum. Proper drainage will be provided along the roads
Excavated material will not be thrown haphazardly but dumped duly dressed up in a suitable form at appropriate places where it cannot get easily washed away by rain, and such spoil deposits may be duly turfed or provided with some vegetative cover
Compensation of land as per National Resettlement Policy 2007 and THDC R&R policy approved by state govt.

Project : Environmental Studies for Vishnugad Pipalkoti Hydro-Electric Project Page: 22 Document : 2008026/EC/Final Report Date: Nov 2009 Chapter-3 : Baseline Environment, Impacts & Mitigation Measures Revision: R4
The management of Quarry and borrow area is provided in Chapter-4, EMP Section 4.10 and Soil Erosion and Sedimentation control measures are provided in Chapter 4-EMP Section 4.9.
3.7 MANAGED RIVER FLOW
3.7.1 Study Components
The managed flow studies intend to identify the critical stretches of the river Alaknanda (within the study stretch) for flow requirements considering aquatic habitats, cultural values, water quality and waste assimilation. The major study components as per the Scope of the Work are as follows: River flow measurement Water Usage Survey Aquatic Ecological Studies Pollution Load Studies Assessment of Water Borne Diseases Downstream Hazards
3.7.2 Catchment Area of Alaknanda River
The topography of Alaknanda River divides itself into two distinct zones; the greater Himalayas which are snow fed and the lesser Himalayas which are normally rainfed. The mountain topography is such that the river Alaknanda provide natural drops together with perennial flows offer great potential for hydropower generation Total catchment area of Alaknanda River is 11040 square kilometer while the catchment area for the project is 4672 sq.km. The catchment area above Joshimath town is 4508 sq.km out of which 2896 sq.km is snow bound area. Between Joshimath and Dam Site, the catchment is drained by the following streams as shown in Figure 1.1. The detailed catchment area map of presented as Figure 1.2.

Project : Environmental Studies for Vishnugad Pipalkoti Hydro-Electric Project Page: 23 Document : 2008026/EC/Final Report Date: Nov 2009 Chapter-3 : Baseline Environment, Impacts & Mitigation Measures Revision: R4
Right Bank 1. Kalpaganga - 1 km u/s 2. Dwardhar - 1.3 km u/s 3. Vishnugad - 5 km u/s 4. Dunligad - 7 km u/s
Left Bank 1. Karmanasha - 1 km u/s 2. Animath Nala - 3 km u/s
Left Bank
Right Bank
Figure-3.7.1 Schematic Map showing various tributaries in the upstream of Dam site
3.7.3 River Flow Measurement Tributaries of Alaknanda
Historical flow data of river Alaknanda has been collected from THDC. All of the tributaries (rivulets, drains and Nallas) have been identified and location co-ordinates, closest to the confluence of the river were collected with help of a GPS machine. The regularity of flow in these tributaries were ascertained by periodic observation, supplemented by interview survey of the locals. A Discussion with Locals on flow regularity
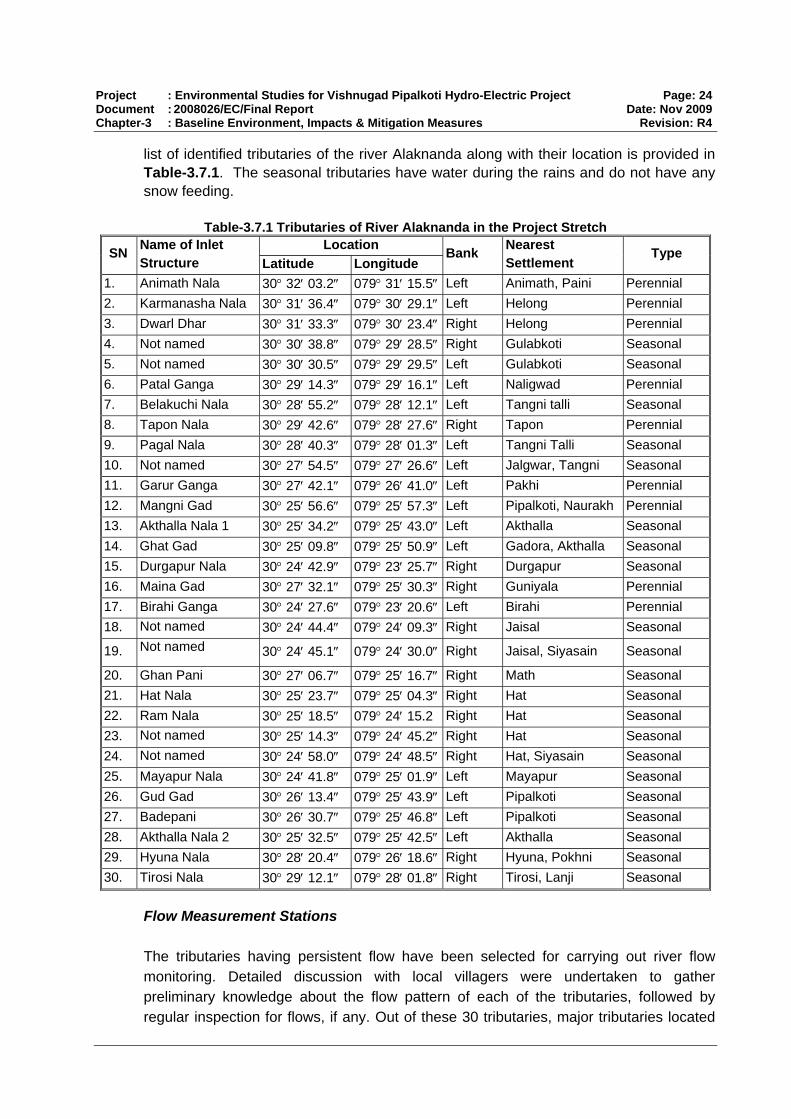
Project : Environmental Studies for Vishnugad Pipalkoti Hydro-Electric Project Page: 24 Document : 2008026/EC/Final Report Date: Nov 2009 Chapter-3 : Baseline Environment, Impacts & Mitigation Measures Revision: R4
list of identified tributaries of the river Alaknanda along with their location is provided in Table-3.7.1. The seasonal tributaries have water during the rains and do not have any snow feeding.
Table-3.7.1 Tributaries of River Alaknanda in the Project Stretch Location SN Name of Inlet
Structure Latitude Longitude Bank Nearest
Settlement Type
1. Animath Nala 30° 32′ 03.2″ 079° 31′ 15.5″ Left Animath, Paini Perennial 2. Karmanasha Nala 30° 31′ 36.4″ 079° 30′ 29.1″ Left Helong Perennial 3. Dwarl Dhar 30° 31′ 33.3″ 079° 30′ 23.4″ Right Helong Perennial 4. Not named 30° 30′ 38.8″ 079° 29′ 28.5″ Right Gulabkoti Seasonal 5. Not named 30° 30′ 30.5″ 079° 29′ 29.5″ Left Gulabkoti Seasonal 6. Patal Ganga 30° 29′ 14.3″ 079° 29′ 16.1″ Left Naligwad Perennial 7. Belakuchi Nala 30° 28′ 55.2″ 079° 28′ 12.1″ Left Tangni talli Seasonal 8. Tapon Nala 30° 29′ 42.6″ 079° 28′ 27.6″ Right Tapon Perennial 9. Pagal Nala 30° 28′ 40.3″ 079° 28′ 01.3″ Left Tangni Talli Seasonal 10. Not named 30° 27′ 54.5″ 079° 27′ 26.6″ Left Jalgwar, Tangni Seasonal 11. Garur Ganga 30° 27′ 42.1″ 079° 26′ 41.0″ Left Pakhi Perennial 12. Mangni Gad 30° 25′ 56.6″ 079° 25′ 57.3″ Left Pipalkoti, Naurakh Perennial 13. Akthalla Nala 1 30° 25′ 34.2″ 079° 25′ 43.0″ Left Akthalla Seasonal 14. Ghat Gad 30° 25′ 09.8″ 079° 25′ 50.9″ Left Gadora, Akthalla Seasonal 15. Durgapur Nala 30° 24′ 42.9″ 079° 23′ 25.7″ Right Durgapur Seasonal 16. Maina Gad 30° 27′ 32.1″ 079° 25′ 30.3″ Right Guniyala Perennial 17. Birahi Ganga 30° 24′ 27.6″ 079° 23′ 20.6″ Left Birahi Perennial 18. Not named 30° 24′ 44.4″ 079° 24′ 09.3″ Right Jaisal Seasonal
19. Not named 30° 24′ 45.1″ 079° 24′ 30.0″ Right Jaisal, Siyasain Seasonal
20. Ghan Pani 30° 27′ 06.7″ 079° 25′ 16.7″ Right Math Seasonal 21. Hat Nala 30° 25′ 23.7″ 079° 25′ 04.3″ Right Hat Seasonal 22. Ram Nala 30° 25′ 18.5″ 079° 24′ 15.2 Right Hat Seasonal 23. Not named 30° 25′ 14.3″ 079° 24′ 45.2″ Right Hat Seasonal 24. Not named 30° 24′ 58.0″ 079° 24′ 48.5″ Right Hat, Siyasain Seasonal 25. Mayapur Nala 30° 24′ 41.8″ 079° 25′ 01.9″ Left Mayapur Seasonal 26. Gud Gad 30° 26′ 13.4″ 079° 25′ 43.9″ Left Pipalkoti Seasonal 27. Badepani 30° 26′ 30.7″ 079° 25′ 46.8″ Left Pipalkoti Seasonal 28. Akthalla Nala 2 30° 25′ 32.5″ 079° 25′ 42.5″ Left Akthalla Seasonal 29. Hyuna Nala 30° 28′ 20.4″ 079° 26′ 18.6″ Right Hyuna, Pokhni Seasonal 30. Tirosi Nala 30° 29′ 12.1″ 079° 28′ 01.8″ Right Tirosi, Lanji Seasonal
Flow Measurement Stations
The tributaries having persistent flow have been selected for carrying out river flow monitoring. Detailed discussion with local villagers were undertaken to gather preliminary knowledge about the flow pattern of each of the tributaries, followed by regular inspection for flows, if any. Out of these 30 tributaries, major tributaries located

Project : Environmental Studies for Vishnugad Pipalkoti Hydro-Electric Project Page: 25 Document : 2008026/EC/Final Report Date: Nov 2009 Chapter-3 : Baseline Environment, Impacts & Mitigation Measures Revision: R4
downstream of the proposed dam location that add substantial volume of water into river Alaknanda throughout the year are: 1. Patal Ganga 2. Tapan Nala 3. Garur Ganga 4. Maina Gad 5. Birahi Location of these rivers along with other proposed features of the project is presented in Figure-3.7.3. Flow measurement was carried out for a period of one year, starting from March 2008 to February 2009 in each of these tributaries near their confluence point with river Alaknanda.
Flow Measurement Methods 5 river flow monitoring stations have been established in the study area, one on each of the tributaries mentioned above. Hydro-graphic survey was carried out in the month of March 2008 for preparation of Cross sections. Standard hydro-graphic survey methods were adopted using Total station and Stuff and depth of the river were taken at 1 m interval for all tributaries. Hydro-graphic survey was repeated in November 2008 during the beginning of lean flow period to asses any changes in the cross section of the location during maximum flow for accurate calculation of the discharge. Iron gauges marked with scale were installed at all of these stations and water levels were recorded daily. Flow velocity was measured by Current Meters (with horizontal axis) followed by regular calibration of the instruments. However, in situations like highly turbulent flows or extreme low flows, where current meter cannot be used, velocity measurements were carried out by Float Method. Both surface and submerged floats were used alternatively or simultaneously depending on the situation. Floats made out of locally available materials that work in prevailing conditions were used. Structured data sheets were used for collection of the monitored data. A sample data sheet has been provided in Annex-3.7.1.

Project : Environmental Studies for Vishnugad Pipalkoti Hydro-Electric Project Page: 26 Document : 2008026/EC/Final Report Date: Nov 2009 Chapter-3 : Baseline Environment, Impacts & Mitigation Measures Revision: R4
34
1
2
1. River Flow Measurement by Current Meter
2. Staff and Gauge for Water Level
Measurement at Flow Measurement Site 3. Hydrographic Survey for Determination of
Cross Section 4. Gauge installed at flow measurement sites
3

Project : Environmental Studies for Vishnugad Pipalkoti Hydro-Electric Project Page: 27 Document : 2008026/EC/Final Report Date: Nov 2009 Chapter-3 : Baseline Environment, Impacts & Mitigation Measures Revision: R4
3.7.4 River Flow: Alaknanda River Joshimat Station of CWC The Gauge & Discharge (G&D) Data of Alaknanda is maintained by Central Water Commission (CWC) at Joshimath, located at about 6 km upstream of the proposed dam site. To understand the changes in the river flow profile over the course of time, historical minimum flow data of River Alaknanda of past 33 years (from 1971-72 to 2003-2004), as collected from CWC Joshimath office, is provided in Table 3.7.2 and also shown graphically in Fig-3.7.4.
Table 3.7.2: Historical Minimum Flow of River Alaknanda (in m3/s) Year Q (Min.) Year Q (Min.) Year Q (Min.)
1971-72 35.99 1982-83 16.48 1993-94 19.52 1972-73 36.39 1983-84 32.11 1994-95 16.5 1973-74 37.65 1984-85 28.21 1995-96 15.76 1974-75 40.29 1985-86 35.43 1996-97 18.35 1975-76 33.07 1986-87 45.03 1997-98 31.68 1976-77 36.54 1987-88 35.64 1998-99 42.52 1977-78 31.07 1988-89 35.96 1999-2000 55.26 1978-79 38.18 1989-90 28.24 2000-01 8.66 1979-80 27.59 1990-91 30.03 2001-02 32.59 1980-81 25.59 1991-92 28.25 2002-03 51.36 1981-82 14.13 1992-93 45.91 2003-04 42.73
Minimum Discharge of Alaknanda (Joshimath)
0
10
20
30
40
50
60
1971
-72
1973
-74
1975
-76
1977
-78
1979
-80
1981
-82
1983
-84
1985
-86
1987
-88
1989
-90
1991
-92
1993
-94
1995
-96
1997
-98
1999
-2000
2001
-02
2003
-04
Figure-3.7.4
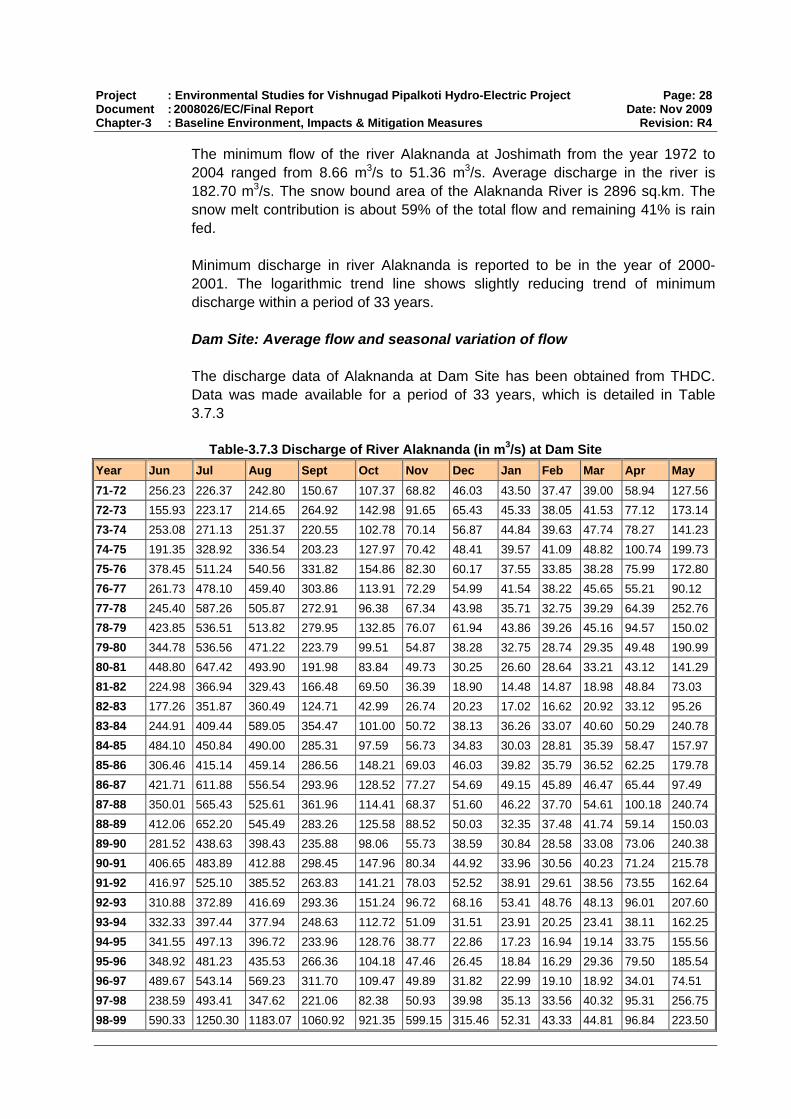
Project : Environmental Studies for Vishnugad Pipalkoti Hydro-Electric Project Page: 28 Document : 2008026/EC/Final Report Date: Nov 2009 Chapter-3 : Baseline Environment, Impacts & Mitigation Measures Revision: R4
The minimum flow of the river Alaknanda at Joshimath from the year 1972 to 2004 ranged from 8.66 m3/s to 51.36 m3/s. Average discharge in the river is 182.70 m3/s. The snow bound area of the Alaknanda River is 2896 sq.km. The snow melt contribution is about 59% of the total flow and remaining 41% is rain fed. Minimum discharge in river Alaknanda is reported to be in the year of 2000-2001. The logarithmic trend line shows slightly reducing trend of minimum discharge within a period of 33 years. Dam Site: Average flow and seasonal variation of flow The discharge data of Alaknanda at Dam Site has been obtained from THDC. Data was made available for a period of 33 years, which is detailed in Table 3.7.3
Table-3.7.3 Discharge of River Alaknanda (in m3/s) at Dam Site
Year Jun Jul Aug Sept Oct Nov Dec Jan Feb Mar Apr May 71-72 256.23 226.37 242.80 150.67 107.37 68.82 46.03 43.50 37.47 39.00 58.94 127.5672-73 155.93 223.17 214.65 264.92 142.98 91.65 65.43 45.33 38.05 41.53 77.12 173.1473-74 253.08 271.13 251.37 220.55 102.78 70.14 56.87 44.84 39.63 47.74 78.27 141.2374-75 191.35 328.92 336.54 203.23 127.97 70.42 48.41 39.57 41.09 48.82 100.74 199.7375-76 378.45 511.24 540.56 331.82 154.86 82.30 60.17 37.55 33.85 38.28 75.99 172.8076-77 261.73 478.10 459.40 303.86 113.91 72.29 54.99 41.54 38.22 45.65 55.21 90.12 77-78 245.40 587.26 505.87 272.91 96.38 67.34 43.98 35.71 32.75 39.29 64.39 252.7678-79 423.85 536.51 513.82 279.95 132.85 76.07 61.94 43.86 39.26 45.16 94.57 150.0279-80 344.78 536.56 471.22 223.79 99.51 54.87 38.28 32.75 28.74 29.35 49.48 190.9980-81 448.80 647.42 493.90 191.98 83.84 49.73 30.25 26.60 28.64 33.21 43.12 141.2981-82 224.98 366.94 329.43 166.48 69.50 36.39 18.90 14.48 14.87 18.98 48.84 73.03 82-83 177.26 351.87 360.49 124.71 42.99 26.74 20.23 17.02 16.62 20.92 33.12 95.26 83-84 244.91 409.44 589.05 354.47 101.00 50.72 38.13 36.26 33.07 40.60 50.29 240.7884-85 484.10 450.84 490.00 285.31 97.59 56.73 34.83 30.03 28.81 35.39 58.47 157.9785-86 306.46 415.14 459.14 286.56 148.21 69.03 46.03 39.82 35.79 36.52 62.25 179.7886-87 421.71 611.88 556.54 293.96 128.52 77.27 54.69 49.15 45.89 46.47 65.44 97.49 87-88 350.01 565.43 525.61 361.96 114.41 68.37 51.60 46.22 37.70 54.61 100.18 240.7488-89 412.06 652.20 545.49 283.26 125.58 88.52 50.03 32.35 37.48 41.74 59.14 150.0389-90 281.52 438.63 398.43 235.88 98.06 55.73 38.59 30.84 28.58 33.08 73.06 240.3890-91 406.65 483.89 412.88 298.45 147.96 80.34 44.92 33.96 30.56 40.23 71.24 215.7891-92 416.97 525.10 385.52 263.83 141.21 78.03 52.52 38.91 29.61 38.56 73.55 162.6492-93 310.88 372.89 416.69 293.36 151.24 96.72 68.16 53.41 48.76 48.13 96.01 207.6093-94 332.33 397.44 377.94 248.63 112.72 51.09 31.51 23.91 20.25 23.41 38.11 162.2594-95 341.55 497.13 396.72 233.96 128.76 38.77 22.86 17.23 16.94 19.14 33.75 155.5695-96 348.92 481.23 435.53 266.36 104.18 47.46 26.45 18.84 16.29 29.36 79.50 185.5496-97 489.67 543.14 569.23 311.70 109.47 49.89 31.82 22.99 19.10 18.92 34.01 74.51 97-98 238.59 493.41 347.62 221.06 82.38 50.93 39.98 35.13 33.56 40.32 95.31 256.7598-99 590.33 1250.30 1183.07 1060.92 921.35 599.15 315.46 52.31 43.33 44.81 96.84 223.50

Project : Environmental Studies for Vishnugad Pipalkoti Hydro-Electric Project Page: 29 Document : 2008026/EC/Final Report Date: Nov 2009 Chapter-3 : Baseline Environment, Impacts & Mitigation Measures Revision: R4
Year Jun Jul Aug Sept Oct Nov Dec Jan Feb Mar Apr May 99-00 342.54 449.34 391.64 253.52 102.84 54.90 61.20 56.49 56.08 56.11 97.08 296.3000-01 406.99 448.30 155.54 84.49 25.64 52.35 23.48 10.56 9.35 17.27 40.66 222.6601-02 541.95 740.97 560.08 243.58 72.35 37.50 27.29 31.61 33.51 57.20 89.04 170.1502-03 371.41 583.44 391.29 218.42 111.86 87.30 61.00 52.96 53.48 58.96 111.69 236.7803-04 398.16 446.43 537.32 434.79 197.04 103.41 75.10 56.98 55.05 47.77 59.34 90.20 04-07 NA NA NA NA NA NA NA NA NA NA NA NA 07-08 NA NA 409.15 303.10 144.30 65.56 NA NA NA NA NA NA Average 345.44 494.61 448.66 281.54 136.52 80.19 52.76 36.14 33.41 38.68 68.63 175.01
Source: THDC
The variation of monthly flow of the river Alaknanda at Dam Site during the period of 1972 to 2004 ranged from 33.41 m3/s to 494.61 m3/s. Minimum discharges in river Alaknanda is reported to be in the year of 2000-2001. The seasonal variation of the flow is provided graphically in Figure-1.5.
Fig 1.5 Seasonal Variation of Flow
0.00
100.00
200.00
300.00
400.00
500.00
June Ju
ly
Augus
t
Septem
ber
Octobe
r
Novem
ber
Decem
ber
Janu
ary
Februa
ryMarc
hApri
lMay
Peak and Lean Flow Seasons It may be observed that the river mostly has the peak discharge in the month of July while the minimum discharge is mostly in February Month. Careful analysis of discharge data from both Joshimath and dam site reveals that June to September are the peak flow months while December, January and February are the lean flow months.

Project : Environmental Studies for Vishnugad Pipalkoti Hydro-Electric Project Page: 30 Document : 2008026/EC/Final Report Date: Nov 2009 Chapter-3 : Baseline Environment, Impacts & Mitigation Measures Revision: R4
Months of Maximum Discharge
6%
64%
27%
3%
Jun Jul Aug Sept
Months of Minimum Discharge
73%
15%3%3%6%
Jan Feb Mar Nov Dec
Fig 1.6 Months of Maximum and Minimum Flow
Peak Flow Months: June, July, August and September Lean Flow Months: December, January and February, Lean Flow, Peak Flow and Average Flow
The year-wise average flow, flow in peak flow months and lean flow months is provided in Table-3.7.4 and graphically represented in Fig 1.7. It may be noted that average lean flow was found to be minimum in 2000-2001 and maximum in 1998-99.
Table-3.7.4 Average, lean and peak flow in river Alaknanda (in m3/s) at Dam Site
Year Average Flow Average Lean Flow Average Peak Flow 1971-72 117.06 42.33 219.02 1972-73 127.83 49.60 214.67 1973-74 131.47 47.12 249.03 1974-75 144.73 43.02 265.01 1975-76 201.49 43.86 440.52 1976-77 167.92 44.92 375.77 1977-78 187.00 37.48 402.86 1978-79 199.82 48.35 438.53 1979-80 175.03 33.26 394.09 1980-81 184.90 28.50 445.53 1981-82 115.24 16.09 271.96 1982-83 107.27 17.96 253.58 1983-84 182.39 35.82 399.47 1984-85 184.17 31.22 427.56 1985-86 173.73 40.54 366.82 1986-87 204.08 49.91 471.02
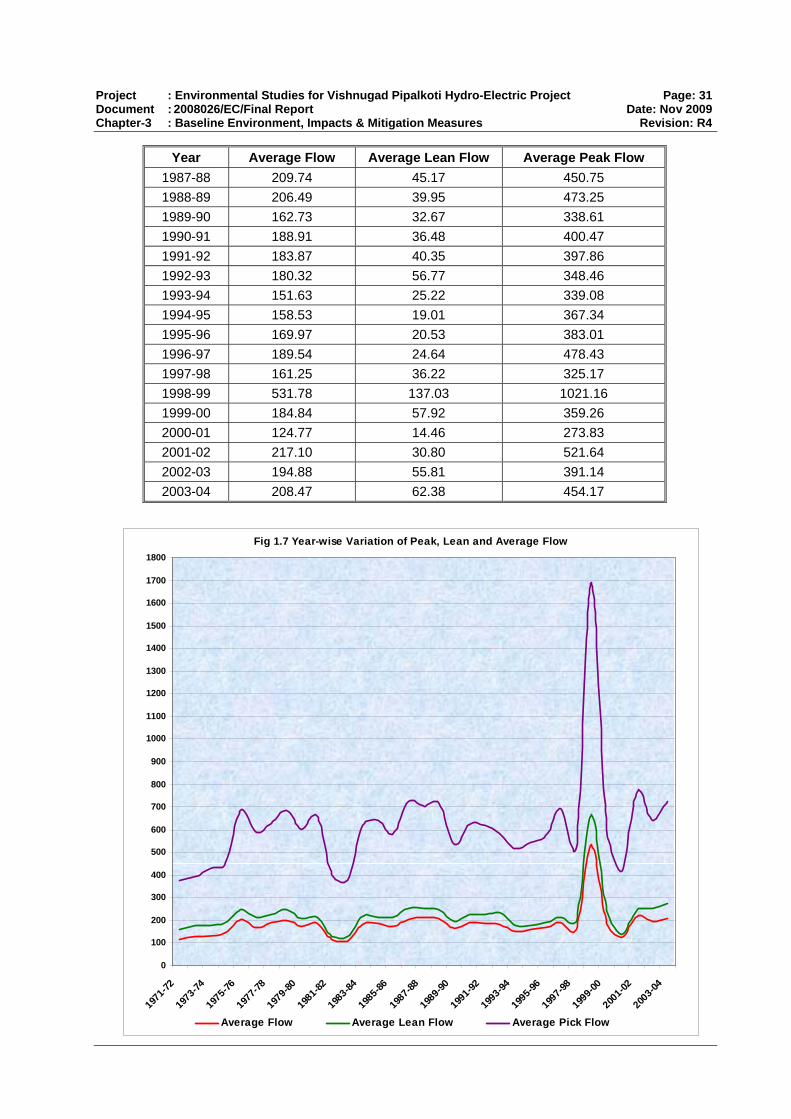
Project : Environmental Studies for Vishnugad Pipalkoti Hydro-Electric Project Page: 31 Document : 2008026/EC/Final Report Date: Nov 2009 Chapter-3 : Baseline Environment, Impacts & Mitigation Measures Revision: R4
Fig 1.7 Year-wise Variation of Peak, Lean and Average Flow
0
100
200
300
400
500
600
700
800
900
1000
1100
1200
1300
1400
1500
1600
1700
1800
1972
1973
-74
1975
-76
1977
-78
1979
-80
1981
-82
1983-8
4
1985
-86
1987
-88
1989
-90
1991
-92
1993
-94
1995
-96
1997
-98
1999
-00
2001
-02
2003
-0471
-
Average Flow Average Lean Flow Average Pick Flow
Year Average Flow Average Lean Flow Average Peak Flow 1987-88 209.74 45.17 450.75 1988-89 206.49 39.95 473.25 1989-90 162.73 32.67 338.61 1990-91 188.91 36.48 400.47 1991-92 183.87 40.35 397.86 1992-93 180.32 56.77 348.46 1993-94 151.63 25.22 339.08 1994-95 158.53 19.01 367.34 1995-96 169.97 20.53 383.01 1996-97 189.54 24.64 478.43 1997-98 161.25 36.22 325.17 1998-99 531.78 137.03 1021.16 1999-00 184.84 57.92 359.26 2000-01 124.77 14.46 273.83 2001-02 217.10 30.80 521.64 2002-03 194.88 55.81 391.14 2003-04 208.47 62.38 454.17

Project : Environmental Studies for Vishnugad Pipalkoti Hydro-Electric Project Page: 32 Document : 2008026/EC/Final Report Date: Nov 2009 Chapter-3 : Baseline Environment, Impacts & Mitigation Measures Revision: R4
3.7.5 Tributaries of Alaknanda The flow discharge for various tributaries- Patal Ganga, Garur Ganga, Maina Gad and Birahi Ganga of River Alaknanda in the Project stretch was measured for 12 months (2008-09). The flow of the tributaries for peak discharge and lean season is presented in the table below.
Table-3.7.5 Lean Season Flow of the Tributaries of Alaknanda (2008-09) (Average discharge in m3/s)
Month Patal Ganga
Garur Ganga Maina Gad
Tapan Nala
Birahi Ganga
March 5.85 0.82 12.84 1.72 6.92 April 6.13 1.17 11.79 2.07 8.51 May 4.01 0.94 19.21 2.98 17.32 June 7.83 0.91 28.48 1.87 34.15 July 16.13 1.99 50.00 4.81 55.18 August 42.46 4.96 48.02 5.86 102.49 September 34.34 3.13 28.47 4.03 60.15 October 13.91 1.29 21.25 2.19 24.65 November 3.20 0.84 7.43 1.74 11.77 December 1.20 0.34 2.94 1.24 4.63 January 0.68 0.20 1.21 1.10 2.32 February 3.27 0.51 7.026 1.08 4.62 Average Lean Flow
0.83 0.24 1.78 1.14 3.08
Maximum flow was observed in the month of August in all the tributaries. Birahi Ganga recorded the maximum discharge 102.49 m3/s. Minimum discharge was observed in the month of January and minimum flow 0.20 m3/s was observed in Garur Ganga. The average lean flow of the tributaries during lean season ranged from 0.24 3/s to 3.08 m3/s. Inlet Tributaries in River Alaknanda Among the 25 other small inlet tributaries, none of them have any flow during the non-monsoon months. Photographs were taken at 15 days interval during the month of November 08 to February 09. The list of the tributaries is given in the table 3.7.1.
3.7.6 Flow Duration Curve & Temporal Variation: Alaknanda River 10-daily discharge data of Alaknanda river at the dam site for the period 1971 to 2004 are made available by THDC. Average discharge in the river at dam site is 182.70 m3/s. Flow duration curve as shown in the Fig. 1.8 depicts that dependable flow at 50%, 75% and 90% are 88.6 m3/s, 42.5 m3/s, and 28.5 m3/s respectively. 10-daily discharge data for 33 years (1971-2004) for each month is also calculated and plotted with month in Fig. 1.9 with average, maximum and minimum values. Thus for each month, there are three discharges for day 1-10, 11-20 and 21-30. Low flow of the order of 35 m3/s occurs in the river in the month of January, February and March. and More than 25 m3/s and less than

Project : Environmental Studies for Vishnugad Pipalkoti Hydro-Electric Project Page: 33 Document : 2008026/EC/Final Report Date: Nov 2009 Chapter-3 : Baseline Environment, Impacts & Mitigation Measures Revision: R4
100 m3/s discharges are available in months November, December and April. More than 100 m3/s are available in months from May to October.
0
00
00
00
00
00
00
00
Fig. 1.8: Flow duration curve of Alaknanda River at Proposed Dam Site
0
200
400
600
800
1000
1200
1400
17-May 6-Jul 25-Aug 14-Oct 3-Dec 22-Jan 13-Mar 2-May 21-JunPeriod
Dis
char
ge (m
3/s)
Average Maximum Minimum
Fig. 1.9: Temporal variation of 10- daily (Average) discharges at Proposed dam site

Project : Environmental Studies for Vishnugad Pipalkoti Hydro-Electric Project Page: 34 Document : 2008026/EC/Final Report Date: Nov 2009 Chapter-3 : Baseline Environment, Impacts & Mitigation Measures Revision: R4
3.7.7 River Water Quality
River water quality has been monitored at 5 locations within the project stretch. Sampling has been carried out thrice during the period of one year to ascertain the water quality of the river. A list of surface water sampling stations along with the sampling period is provided in Table-3.7.6
Table-3.7.6 Surface Water Quality Monitoring Location SN Station code Co-ordinates Description
1 AA N 30° 31′ 10.6″ E 79° 29′ 38.6″
Dam site; nearest village Helong
2 BB N 30° 29′ 33.8″ E 79° 28′ 32.8″
Confluence of Patalganga and Tapan Nala with river Alaknanda; nearest village Tangni
3 CC N 30° 28′ 16.6″ E 79° 26′ 56.4″
Near the confluence of Garur Ganga with river Alaknanda; nearest village Pakhi
4 DD N 30° 25′ 13.5″ E 79° 24′ 47.1″
Power house Site; nearest village Haat
5 EE N 30° 24′ 29.7″ E 79° 23′ 15.3″
Near the opening of proposed tail race tunnel, close to the confluence of Birahi Ganga with river Alaknanda; nearest village Birahi
Sl. No. Station Sampling Period Sample Number 1 AA May 08 SW-1 2 BB May 08 SW-2 3 CC May 08 SW-3 4 DD May 08 SW-4 5 EE May 08 SW-5 6 AA October 08 SW-6 7 BB October 08 SW-7 8 CC October 08 SW-8 9 DD October 08 SW-9 10 EE October 08 SW-10 11 AA January 09 SW-11 12 BB January 09 SW-12 13 CC January 09 SW-13 14 DD January 09 SW-14 15 EE January 09 SW-15
The analysis of results show that the water quality is good with high DO above 6 for all sites and low BOD 2.3. The heavy metals were undetectable. The results are given below. The Water Quality Standards prescribed by CPCB is attached as Annex-3.11.1.
Table-3.7.7 Results of On-site Surface Water Quality Monitoring during May 08
Sample Number SN Parameter and Unit SW1 SW2 SW3 SW4 SW5
1 Temperature (°C) 17.9 18.7 18.9 20.0 20.32 Odour Unob Unob Unob Unob Unob3 Taste Normal Normal Normal Normal Normal4 Turbidity (NTU) 4 6 5 7 95 pH 7.1 7.0 7.4 7.5 7.06 Conductivity (µmhos/cm) 70 76 74 69 72

Project : Environmental Studies for Vishnugad Pipalkoti Hydro-Electric Project Page: 35 Document : 2008026/EC/Final Report Date: Nov 2009 Chapter-3 : Baseline Environment, Impacts & Mitigation Measures Revision: R4
Sample Number SN Parameter and Unit SW1 SW2 SW3 SW4 SW5
7 DO (mg/L) 7.8 7.6 8.0 7.7 8.08 BOD (3 days at 27°C) (mg/L) 1.9 1.8 2.1 1.9 2.09 COD (mg/L) 2.1 2.0 2.3 2.4 2.210 Total Coliforms (MPN/100 mL) 32 34 41 40 3911 TSS (mg/L) BDL BDL BDL BDL BDL12 TDS (mg/L) 49 54 52 49 5113 Oil and Grease (mg/L) BDL BDL BDL BDL BDL14 Free Ammonia (mg/L as NH3) BDL BDL BDL BDL BDL15 Cyanide (mg/L as CN) BDL BDL BDL BDL BDL16 Phenol (mg/L as C6H5OH) BDL BDL BDL BDL BDL17 Total Hardness (mg/L as
CaCO3) 39 41 44 47 39
18 Total Alkalinity (mg/L CaCO3) 8.5 7.9 7.5 6.9 7.219 Chloride (mg/L as Cl) 33 51 49 43 4020 Sulphate (mg/L as SO4) 19.7 14.2 19.4 27 2821 Nitrate (mg/L as NO3) 3.9 5.3 4.8 5.8 6.422 Phosphate (mg/L as PO4) 3.6 3.0 2.6 3.7 4.323 Fluoride (mg/L as F) BDL BDL BDL BDL BDL24 Sodium (mg/L as Na) 16 24 19 16 1525 Potassium (mg/L as K) 5.4 6.8 5.0 6.0 5.826 Calcium (mg/L as Ca) 7.2 6.8 7.9 8.2 7.827 Magnesium (mg/L as Mg) 5.0 5.6 5.4 4.9 5.328 Iron (mg/L as Fe) 1.3 1.4 2.1 1.3 1.629 Zinc (mg/L as Zn) BDL BDL BDL BDL BDL30 Boron (mg/L as B) BDL BDL BDL BDL BDL31 Arsenic (mg/L as As) BDL BDL BDL BDL BDL32 Mercury (mg/L as Hg) BDL BDL BDL BDL BDL33 Lead (mg/L as Pb) BDL BDL BDL BDL BDL34 Cadmium (mg/L as Cd) BDL BDL BDL BDL BDL35 Chromium (mg/L as Cr) BDL BDL BDL BDL BDL36 Selenium (mg/L as Se) BDL BDL BDL BDL BDL37 Percent Sodium (%) 10.4 23.4 17.4 20.5 18.538 Sodium Absorption Ratio 1.45 0.954 0.756 0.867 0.989Source: CES BDL- Below Detection Limit
Table-3.7.8 Results of On-site Surface Water Quality Monitoring during October 08
Sample Number SN Parameter and Unit SW6 SW7 SW8 SW9 SW10
1. Temperature (°C) 15.9 16.4 16.9 16.8 17.02. Odour Unob Unob Unob Unob Unob3. Taste Normal Normal Normal Normal Normal4. Turbidity (NTU) 3 4 6 8 75. pH 7.3 7.2 7.1 7.6 7.36. Conductivity (µmhos/cm) 72 75 72 70 697. DO (mg/L) 8.0 8.2 8.4 7.9 8.28. BOD (3 days at 27°C) (mg/L) 1.1 1.2 1.1 1.7 2.19. COD (mg/L) 2.4 2.8 2.7 2.9 2.510. Total Coliforms (MPN/100 mL) 30 25 44 37 4111. TSS (mg/L) BDL <0.1 <0.1 BDL BDL12. TDS (mg/L) 56 50 48 44 4613. Oil and Grease (mg/L) BDL BDL BDL BDL BDL

Project : Environmental Studies for Vishnugad Pipalkoti Hydro-Electric Project Page: 36 Document : 2008026/EC/Final Report Date: Nov 2009 Chapter-3 : Baseline Environment, Impacts & Mitigation Measures Revision: R4
Sample Number SN Parameter and Unit SW6 SW7 SW8 SW9 SW10
14. Free Ammonia (mg/L as NH3) BDL BDL BDL BDL BDL15. Cyanide (mg/L as CN) BDL BDL BDL BDL BDL16. Phenol (mg/L as C6H5OH) BDL BDL BDL BDL BDL17. Total Hardness (mg/L as
CaCO3) 42 37 39 40 35
18. Total Alkalinity (mg/L CaCO3) 7.3 6.9 6.7 6.0 6.419. Chloride (mg/L as Cl) 37 56 41 39 3520. Sulphate (mg/L as SO4) 21 12.3 16.2 25 2321. Nitrate (mg/L as NO3) 4.6 4.9 5.2 4.7 4.522. Phosphate (mg/L as PO4) 4.0 3.1 1.8 2.1 3.923. Fluoride (mg/L as F) 0.1 0.1 0.2 0.1 BDL24. Sodium (mg/L as Na) 12 29 21 19 1725. Potassium (mg/L as K) 3.9 7.2 5.9 6.5 6.926. Calcium (mg/L as Ca) 8.0 7.9 8.4 8.0 8.827. Magnesium (mg/L as Mg) 4.9 4.6 3.9 4.0 4.328. Iron (mg/L as Fe) 0.2 1.2 1.5 0.9 1.029. Zinc (mg/L as Zn) BDL BDL BDL BDL BDL30. Boron (mg/L as B) BDL BDL BDL BDL BDL31. Arsenic (mg/L as As) BDL BDL BDL BDL BDL32. Mercury (mg/L as Hg) BDL BDL BDL BDL BDL33. Lead (mg/L as Pb) BDL BDL BDL BDL BDL34. Cadmium (mg/L as Cd) BDL BDL BDL BDL BDL35. Chromium (mg/L as Cr) BDL BDL BDL BDL BDL36. Selenium (mg/L as Se) BDL BDL BDL BDL BDL37. Percent Sodium (%) 12.4 26.5 18 21.9 19.938. Sodium Absorption Ratio 1.31 1.23 0.567 0.675 0.879Source: CES BDL- Below Detection Limit
Table-3.7.9 Results of On-site Surface Water Quality Monitoring during January 09
Sample Number SN Parameter and Unit SW11 SW12 SW13 SW14 SW15
1 Temperature (°C) 4.5 4.9 5.0 5.0 5.22 Odour Unob Unob Unob Unob Unob3 Taste Normal Normal Normal Normal Normal4 Turbidity (NTU) 6 8 7 9 85 pH 7.4 7.3 7.2 7.3 7.56 Conductivity (µmhos/cm) 76 70 69 65 707 DO (mg/L) 6.9 7.2 7.8 7.5 7.88 BOD (3 days at 27°C) (mg/L) 1.7 2.1 1.7 2.0 2.39 COD (mg/L) 2.6 2.5 2.8 2.6 2.910 Total Coliforms (MPN/100 mL) 40 41 38 36 3511 TSS (mg/L) BDL BDL BDL BDL BDL12 TDS (mg/L) 42 50 49 43 4813 Oil and Grease (mg/L) BDL BDL BDL BDL BDL14 Free Ammonia (mg/L as NH3) BDL BDL BDL BDL BDL15 Cyanide (mg/L as CN) BDL BDL BDL BDL BDL16 Phenol (mg/L as C6H5OH) BDL BDL BDL BDL BDL17 Total Hardness (mg/L as
CaCO3) 35 38 41 40 34
18 Total Alkalinity (mg/L CaCO3) 8.1 7.7 7.2 7.1 7.019 Chloride (mg/L as Cl) 30 48 46 40 39

Project : Environmental Studies for Vishnugad Pipalkoti Hydro-Electric Project Page: 37 Document : 2008026/EC/Final Report Date: Nov 2009 Chapter-3 : Baseline Environment, Impacts & Mitigation Measures Revision: R4
Sample Number SN Parameter and Unit SW11 SW12 SW13 SW14 SW15
20 Sulphate (mg/L as SO4) 17.3 16.2 20 31 2621 Nitrate (mg/L as NO3) 4.2 3.9 4.0 4.3 3.922 Phosphate (mg/L as PO4) 3.9 3.5 3.9 4.1 3.923 Fluoride (mg/L as F) BDL BDL BDL BDL BDL24 Sodium (mg/L as Na) 13 23 18 14 2125 Potassium (mg/L as K) 5.0 5.2 4.7 5.4 5.126 Calcium (mg/L as Ca) 7.0 6.3 6.9 7.9 7.127 Magnesium (mg/L as Mg) 5.1 4.9 5.0 5.1 5.228 Iron (mg/L as Fe) 1.8 1.7 2.0 1.8 1.929 Zinc (mg/L as Zn) BDL BDL BDL BDL BDL30 Boron (mg/L as B) BDL BDL BDL BDL BDL31 Arsenic (mg/L as As) BDL BDL BDL BDL BDL32 Mercury (mg/L as Hg) BDL BDL BDL BDL BDL33 Lead (mg/L as Pb) BDL BDL BDL BDL BDL34 Cadmium (mg/L as Cd) BDL BDL BDL BDL BDL35 Chromium (mg/L as Cr) BDL BDL BDL BDL BDL36 Selenium (mg/L as Se) BDL BDL BDL BDL BDL37 Percent Sodium (%) 11.1 20.3 14.3 17.4 16.938 Sodium Absorption Ratio 0.987 0.878 0.978 1.57 1.65Source: CES BDL- Below Detection Limit
3.7.8 Sedimentation
The detailed sedimentation study in case of diversion project is neither warranted nor necessary as in the case of storage project. However, particle size analysis of silt load and studies control of entry of particles larger than the certain size are important from the point of view of turbine maintenance. It is proposed to exclude silt particles size of 0.2 mm and above from water before it enters the power house.
The sediment data available from 1987 to 2003 at Rudraprayag on Alaknanda river have been analyzed, On the analysis made, it is found that the coarse sediment is 13.47%, medium sediment is 40.03% and fine sediment is 46.6%.

RIGHT BANK LEFT BANK
FIG: 1.3 SCHEMATIC MAP SHOWING THE PROPOSED DAM & ALLIED FEATURES OF VISHNUGAD PIPALKOTI HYDROPOWER PROJECT
NOT TO SCALE
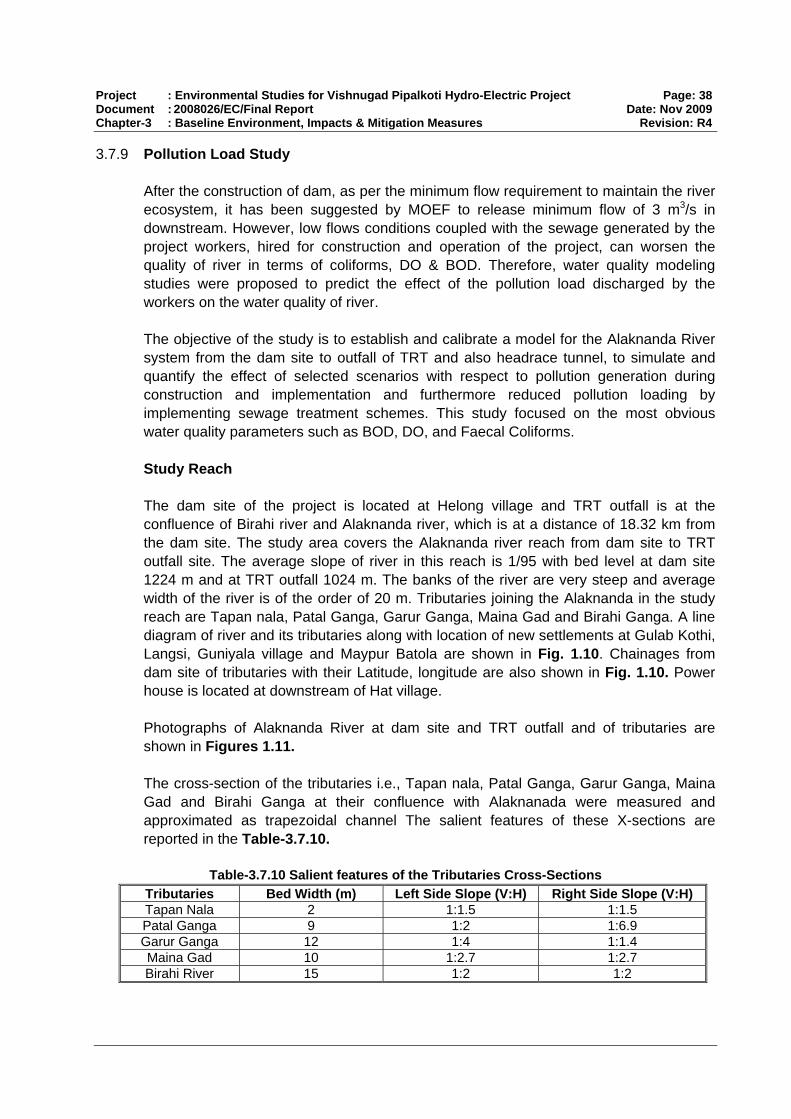
Project : Environmental Studies for Vishnugad Pipalkoti Hydro-Electric Project Page: 38 Document : 2008026/EC/Final Report Date: Nov 2009 Chapter-3 : Baseline Environment, Impacts & Mitigation Measures Revision: R4
3.7.9 Pollution Load Study After the construction of dam, as per the minimum flow requirement to maintain the river ecosystem, it has been suggested by MOEF to release minimum flow of 3 m3/s in downstream. However, low flows conditions coupled with the sewage generated by the project workers, hired for construction and operation of the project, can worsen the quality of river in terms of coliforms, DO & BOD. Therefore, water quality modeling studies were proposed to predict the effect of the pollution load discharged by the workers on the water quality of river. The objective of the study is to establish and calibrate a model for the Alaknanda River system from the dam site to outfall of TRT and also headrace tunnel, to simulate and quantify the effect of selected scenarios with respect to pollution generation during construction and implementation and furthermore reduced pollution loading by implementing sewage treatment schemes. This study focused on the most obvious water quality parameters such as BOD, DO, and Faecal Coliforms.
Study Reach
The dam site of the project is located at Helong village and TRT outfall is at the confluence of Birahi river and Alaknanda river, which is at a distance of 18.32 km from the dam site. The study area covers the Alaknanda river reach from dam site to TRT outfall site. The average slope of river in this reach is 1/95 with bed level at dam site 1224 m and at TRT outfall 1024 m. The banks of the river are very steep and average width of the river is of the order of 20 m. Tributaries joining the Alaknanda in the study reach are Tapan nala, Patal Ganga, Garur Ganga, Maina Gad and Birahi Ganga. A line diagram of river and its tributaries along with location of new settlements at Gulab Kothi, Langsi, Guniyala village and Maypur Batola are shown in Fig. 1.10. Chainages from dam site of tributaries with their Latitude, longitude are also shown in Fig. 1.10. Power house is located at downstream of Hat village. Photographs of Alaknanda River at dam site and TRT outfall and of tributaries are shown in Figures 1.11. The cross-section of the tributaries i.e., Tapan nala, Patal Ganga, Garur Ganga, Maina Gad and Birahi Ganga at their confluence with Alaknanada were measured and approximated as trapezoidal channel The salient features of these X-sections are reported in the Table-3.7.10.
Table-3.7.10 Salient features of the Tributaries Cross-Sections
Tributaries Bed Width (m) Left Side Slope (V:H) Right Side Slope (V:H) Tapan Nala 2 1:1.5 1:1.5 Patal Ganga 9 1:2 1:6.9 Garur Ganga 12 1:4 1:1.4 Maina Gad 10 1:2.7 1:2.7 Birahi River 15 1:2 1:2

Project : Environmental Studies for Vishnugad Pipalkoti Hydro-Electric Project Page: 39 Document : 2008026/EC/Final Report Date: Nov 2009 Chapter-3 : Baseline Environment, Impacts & Mitigation Measures Revision: R4
Stre
tch
A
Stre
tch
B
Stre
tch
C
Fig. 1.10: A line sketch of study reach

Project : Environmental Studies for Vishnugad Pipalkoti Hydro-Electric Project Page: 40 Document : 2008026/EC/Final Report Date: Nov 2009 Chapter-3 : Baseline Environment, Impacts & Mitigation Measures Revision: R4
The study stretch has been divided into three zones based on the available flows from various tributaries that join into river Alaknanda at varying distances from the dam site (refer Fig: 1.10) Stretch A: Dam Site to confluence of river Patal Ganga with Alaknanda Stretch B: Confluence of Patan Ganga to Confluence of Maina Gad Stretch C: Confluence of Maina Gad to TRT opening near confluence of Birahi Ganga
(a) Dam site of the project (b) Upstream view of Alaknanda at Dam site
(c) D/s view of Alaknanda at Dam site (d) Tapan Nala at its confluence with
Alaknanda
(e) Patal Ganga at its confluence with Alaknanda
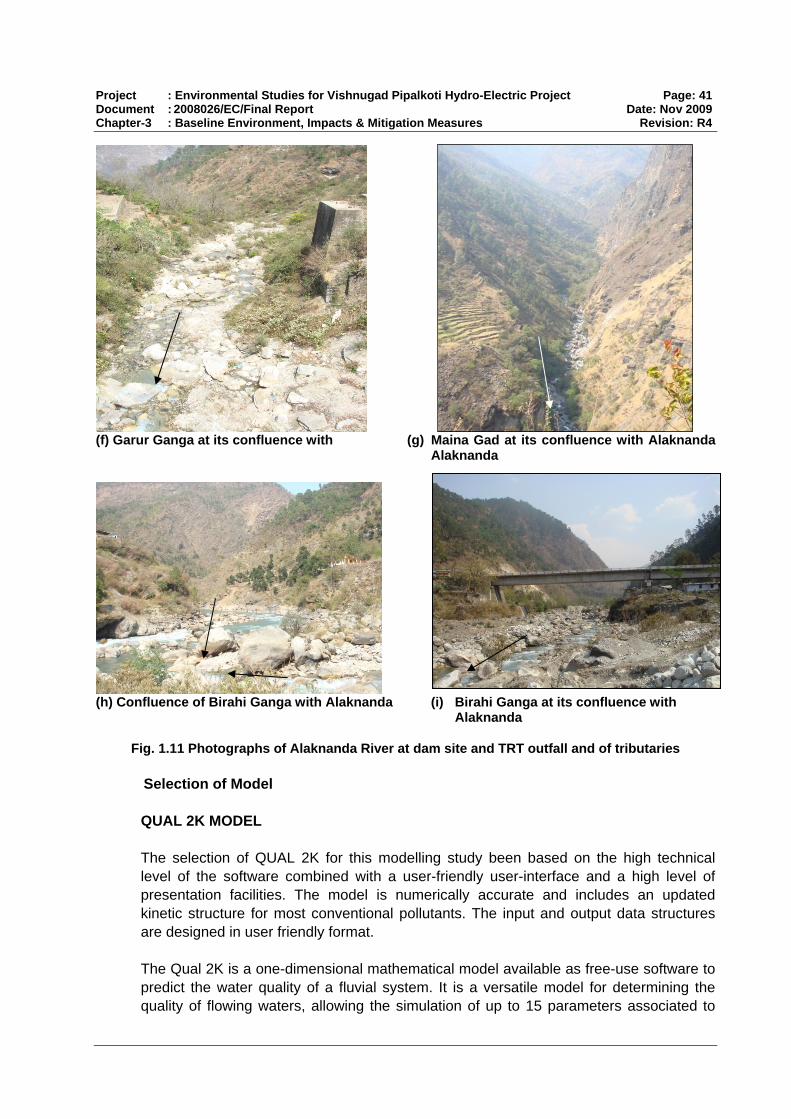
Project : Environmental Studies for Vishnugad Pipalkoti Hydro-Electric Project Page: 41 Document : 2008026/EC/Final Report Date: Nov 2009 Chapter-3 : Baseline Environment, Impacts & Mitigation Measures Revision: R4
(f) Garur Ganga at its confluence with (g) Maina Gad at its confluence with Alaknanda Alaknanda
(h) Confluence of Birahi Ganga with Alaknanda (i) Birahi Ganga at its confluence with Alaknanda
Fig. 1.11 Photographs of Alaknanda River at dam site and TRT outfall and of tributaries
Selection of Model
QUAL 2K MODEL
The selection of QUAL 2K for this modelling study been based on the high technical level of the software combined with a user-friendly user-interface and a high level of presentation facilities. The model is numerically accurate and includes an updated kinetic structure for most conventional pollutants. The input and output data structures are designed in user friendly format. The Qual 2K is a one-dimensional mathematical model available as free-use software to predict the water quality of a fluvial system. It is a versatile model for determining the quality of flowing waters, allowing the simulation of up to 15 parameters associated to

Project : Environmental Studies for Vishnugad Pipalkoti Hydro-Electric Project Page: 42 Document : 2008026/EC/Final Report Date: Nov 2009 Chapter-3 : Baseline Environment, Impacts & Mitigation Measures Revision: R4
water quality in any combination chosen by the user. The model is applicable to well mixed streams and considers the transport mechanisms – dispersion and advection – significant only along the main direction of flow (longitudinal direction). Its use extends to the presence of multiple polluting discharges, withdrawal points and tributaries flowing to the stream under study. The model is limited to simulations in periods of time for which both the flow of the stream and the discharges of effluent in the basin are constant. In this context, the model can be used in steady and dynamic states. In steady state, the model may be used to assess the impact of polluting loads (magnitude, quality and localization) on the receiving body. Dynamically, the model allows investigating both the effects of diurnal variations of the meteorological data on water quality as well as of changes in dissolved oxygen caused by algae growth and respiration. This makes the modeling system suitable for detailed analysis of monitoring data and effect of action taken to improve the condition as well as for prediction of future scenarios. These capabilities of the Qual 2K model ensure that the tool can act now and in future as a powerful tool for the water quality management for the Alaknanda River.
Hydrodynamic Modeling The hydrodynamic model was run for the computation of the water surface profile in the study reach from Chainage 0 to 18.34 km to study water quality in the Alaknanda river. QUAL 2K model, which simulate one-dimensional steady-state non-uniform flow is used for this purpose. The model simulates Alaknanda River as main stem and tributaries as point sources. There are no abstractions in the study reach except evaporation, infiltration etc. The study reach is divided into a number of segments and in each segment uniform flow is assumed and discharge is computed using continuity equation. The cross-section of the river is approximated trapezoidal in each reach. The Manning’s coefficient was estimated using Golbutsov (1969) empirical equation, which is generally used for the boulder streams: n = 0.222 S0.33 (1) in which S is the longitudinal slope of the river and the equation is valid for S varying from 0.4% to 20 %. The average slope of the study reach is 1/95, for this value of S, Manning’s n as per the above equation is 0.050. Knowing channel size, bed slope, Manning’s roughness coefficient, the depth of flow in each segment is calculated using Manning’s equation. The model was run for lean discharge equal to 60 m3/s in the river at dam site. This discharge was available in the month of February 2009. During this month, the discharges in tributaries were 1.14, 3.27, 0.51, 7.026 and 4.62 m3/s in Tapan Nala, Patal Ganga, Garur Ganga, Maina Gad and Birahi, respectively. These discharges were considered as point source in the model. The computed flow and velocity are shown in the following Figures 1.12.

Project : Environmental Studies for Vishnugad Pipalkoti Hydro-Electric Project Page: 43 Document : 2008026/EC/Final Report Date: Nov 2009 Chapter-3 : Baseline Environment, Impacts & Mitigation Measures Revision: R4
Figure 1.12: Simulated Discharge and velocity for the River
Water Quality Modeling
The WQ-model set-up uses the same boundaries and lateral inflows as described for the hydrodynamic (HD) model in previous section. Water quality parameters and discharge at dam site in Alaknanda River is taken as upstream boundary to the model. February is considered as one of the representative low flow month on the basis of available discharge data.
Water quality parameters and discharges in tributaries are considered as point source at different chainages of study reach. Water samples from all tributaries were collected in the month of February 2009 and analyzed for different Parameters.
Table-3.7.11 Existing Inflows (February 2009) in Alaknanda River (study stretch)
Point Dissolved Oxygen Slow CBOD
Pathogen Indicator Bacteria
Tributaries (Location from upstream)
Inflow mean mean mean Name Location (km) m3/s mg/L mgC/L cfu/100ml
Tapan Nala 2.69 0.50 9.50 0.00 0.00 Patal Ganga 3.80 0.68 8.90 0.00 0.00 Garur Ganga 7.23 0.20 9.30 0.00 0.00 Maina Nadi 9.48 1.21 9.00 0.00 0.00
Birahi Ganga 18.32 2.32 9.20 0.00 0.00
The water quality model is calibrated utilizing the hydrodynamic results file. A very good calibration of the WQ-model has been carried out for the month of February 2009 based on the measured levels of pollutants. As a consequence the WQ-model simulated the correct levels of pollutants that are observed in February 2009. The simulated and measured concentration of DO & BOD is illustrated in Figure 1.13 for selected station in the Alaknanda stretch. Simulations of pathogens were not conducted as the observed values were nil in all tributaries as well as in the river. As it is shown in Figure 6 that water quality is excellent in the stretch. Due to the sparse population and negligible sewage and non-point sources inflows to the river. For the

Project : Environmental Studies for Vishnugad Pipalkoti Hydro-Electric Project Page: 44 Document : 2008026/EC/Final Report Date: Nov 2009 Chapter-3 : Baseline Environment, Impacts & Mitigation Measures Revision: R4
SBOD and FBOD decay a first order decay rate of 0.23 day-1 (at 20 oC) & 0.1 day-1 have been used. Standard O'Connor-Dobbins was used for model reaeration. For simulating pathogens (future scenarios) decay rates 1.5 day-1 and settling rates 1.0 day-1 were used. The eutrophication model was not used due to high bed slope and high velocity in the river. Similarly, sediment oxygen demand is also neglected due to the pristine quality of the river. The calibration parameters are given in Table-3.7.12.
Table-3.7.12 Calibrated Parameters for Water Quality Modeling
Parameter Value Units Oxygen: Reaeration model O'Connor-Dobbins
Temp correction 1.024 Slow CBOD: Hydrolysis rate 0.23 1/d
Temp correction 1.047 Fast CBOD: Oxidation rate 0.1 1/d
Temp correction 1.047 Pathogens: Decay 1.5 1/d
Temp correction 1.07
Settling velocity 1 m/d
The results of calibration are as follows
Fig. 2.5.6: DO & BOD Calibrations of the river
Figure 1.13 Water Quality Forecast for Alaknanda River
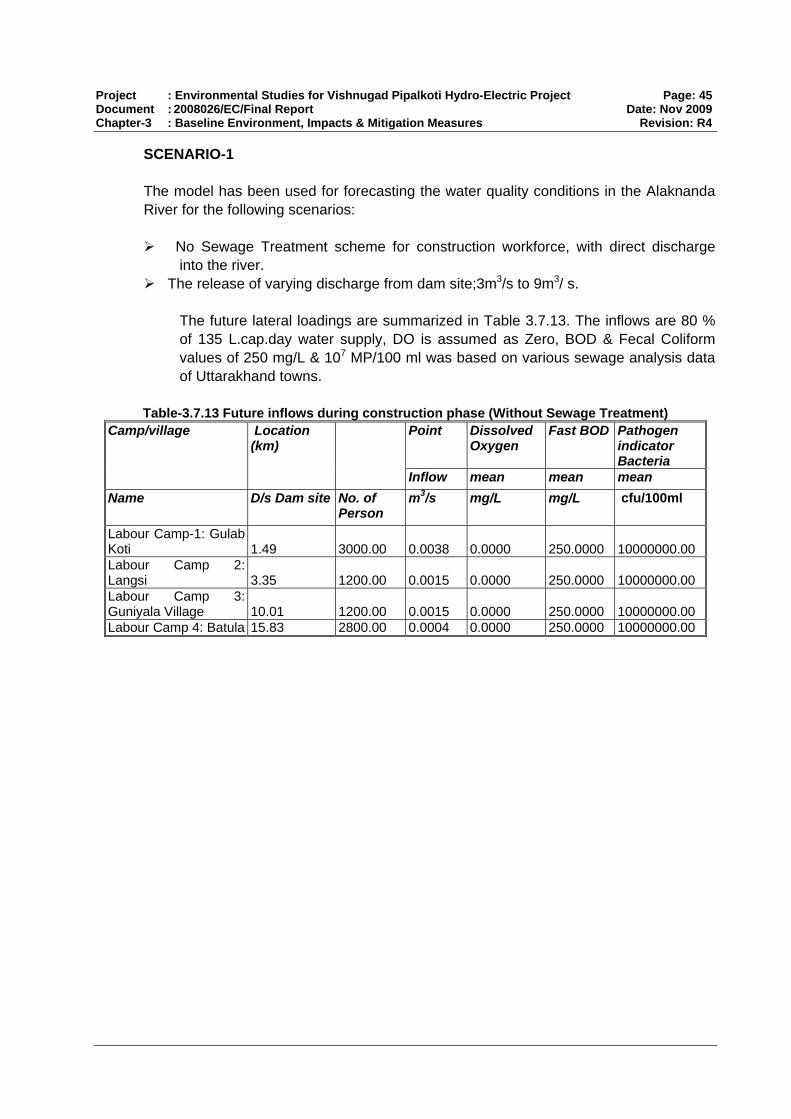
Project : Environmental Studies for Vishnugad Pipalkoti Hydro-Electric Project Page: 45 Document : 2008026/EC/Final Report Date: Nov 2009 Chapter-3 : Baseline Environment, Impacts & Mitigation Measures Revision: R4
SCENARIO-1 The model has been used for forecasting the water quality conditions in the Alaknanda River for the following scenarios:
No Sewage Treatment scheme for construction workforce, with direct discharge into the river.
The release of varying discharge from dam site;3m3/s to 9m3/ s. The future lateral loadings are summarized in Table 3.7.13. The inflows are 80 % of 135 L.cap.day water supply, DO is assumed as Zero, BOD & Fecal Coliform values of 250 mg/L & 107 MP/100 ml was based on various sewage analysis data of Uttarakhand towns.
Table-3.7.13 Future inflows during construction phase (Without Sewage Treatment)
Point Dissolved Oxygen
Fast BOD Pathogen indicator Bacteria
Camp/village
Location (km)
Inflow mean mean mean Name D/s Dam site No. of
Person m3/s mg/L mg/L cfu/100ml
Labour Camp-1: Gulab Koti 1.49 3000.00 0.0038 0.0000 250.0000 10000000.00 Labour Camp 2: Langsi 3.35 1200.00 0.0015 0.0000 250.0000 10000000.00 Labour Camp 3: Guniyala Village 10.01 1200.00 0.0015 0.0000 250.0000 10000000.00 Labour Camp 4: Batula 15.83 2800.00 0.0004 0.0000 250.0000 10000000.00
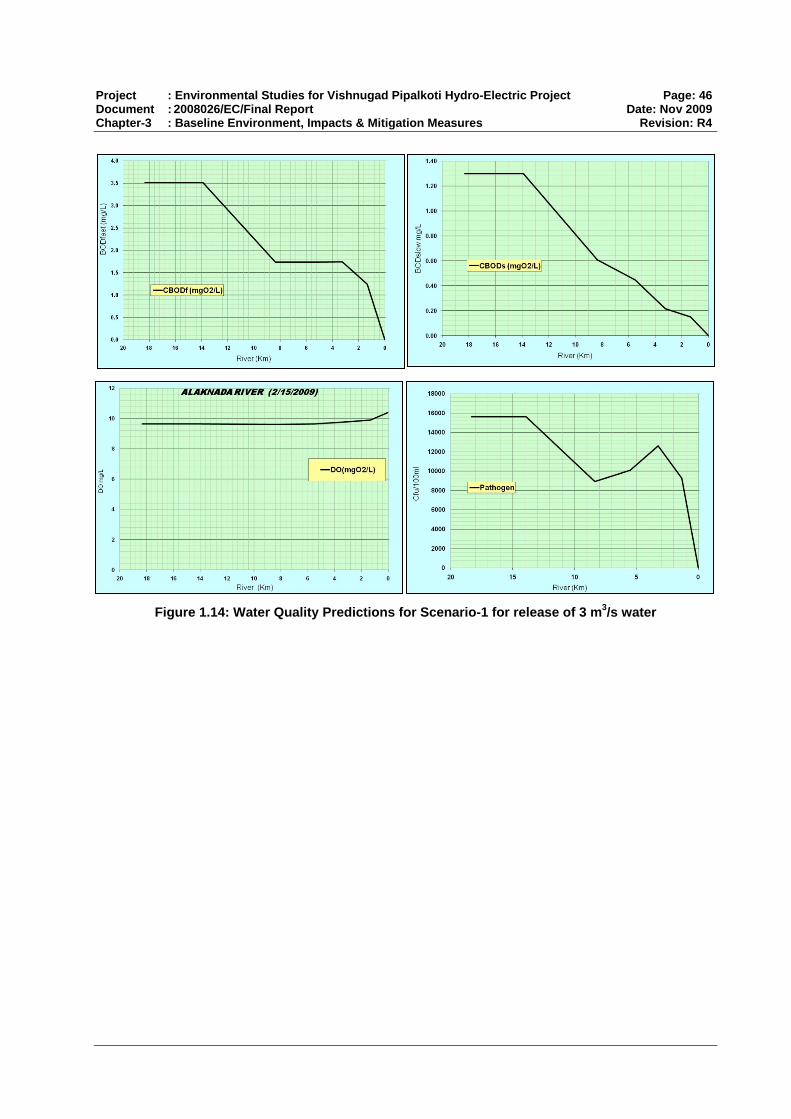
Project : Environmental Studies for Vishnugad Pipalkoti Hydro-Electric Project Page: 46 Document : 2008026/EC/Final Report Date: Nov 2009 Chapter-3 : Baseline Environment, Impacts & Mitigation Measures Revision: R4
Figure 1.14: Water Quality Predictions for Scenario-1 for release of 3 m3/s water

Project : Environmental Studies for Vishnugad Pipalkoti Hydro-Electric Project Page: 47 Document : 2008026/EC/Final Report Date: Nov 2009 Chapter-3 : Baseline Environment, Impacts & Mitigation Measures Revision: R4
Figure 1.15: Water Quality Predictions for Scenario-1 for release of 4 m3/s water

Project : Environmental Studies for Vishnugad Pipalkoti Hydro-Electric Project Page: 48 Document : 2008026/EC/Final Report Date: Nov 2009 Chapter-3 : Baseline Environment, Impacts & Mitigation Measures Revision: R4
Figure 1.16: Water Quality Predictions for Scenario-1 for release of 5 m3/s water

Project : Environmental Studies for Vishnugad Pipalkoti Hydro-Electric Project Page: 49 Document : 2008026/EC/Final Report Date: Nov 2009 Chapter-3 : Baseline Environment, Impacts & Mitigation Measures Revision: R4
Figure 1.17: Water Quality Predictions for Scenario-1 for release of 6 m3/s water

Project : Environmental Studies for Vishnugad Pipalkoti Hydro-Electric Project Page: 50 Document : 2008026/EC/Final Report Date: Nov 2009 Chapter-3 : Baseline Environment, Impacts & Mitigation Measures Revision: R4
Figure 1.18: Water Quality Predictions for Scenario-1 for release of 7 m3/s water

Project : Environmental Studies for Vishnugad Pipalkoti Hydro-Electric Project Page: 51 Document : 2008026/EC/Final Report Date: Nov 2009 Chapter-3 : Baseline Environment, Impacts & Mitigation Measures Revision: R4
Figure 1.19: Water Quality Predictions for Scenario-1 for release of 8 m3/s water

Project : Environmental Studies for Vishnugad Pipalkoti Hydro-Electric Project Page: 52 Document : 2008026/EC/Final Report Date: Nov 2009 Chapter-3 : Baseline Environment, Impacts & Mitigation Measures Revision: R4
Figure 1.20: Water Quality Predictions for Scenario-1 for release of 9 m3/s water Scenario results show that, although there would be not much change in DO concentrations, but there was a little change in BOD and severe deterioration of water quality in terms of fecal coliforms. The fast BOD would be increased to 3.5 mg/L and Slow BOD to 1.2 mg/L which results in unaesthetic conditions. High coliform concentrations in the order of 16,000 MPN/100 ml render the river water ineffective for drinking. Strong objections would be raised and this kind of situation would be totally unacceptable. Therefore, complete sewage treatment to secondary level alongwith chlorination is mandatory to discharge the treated wastewater from construction camps to the river.

Project : Environmental Studies for Vishnugad Pipalkoti Hydro-Electric Project Page: 53 Document : 2008026/EC/Final Report Date: Nov 2009 Chapter-3 : Baseline Environment, Impacts & Mitigation Measures Revision: R4
SCENARIO- 2 The model has been used for forecasting the water quality conditions in the Alaknanda River for the following scenario:
After the construction of dam site : 300 permanent technical staff working for power house directly discharge into the river near village Siyasen.
The release of varying discharge from dam site; 3 m3/s to 9 m3/s .
The future lateral loadings are summarized in Table 3.7.14. The inflows are 80 % of 135 L/cap.day water supply, DO is assumed as Zero, BOD & Fecal Coliform values of 250 mg/L & 107 MP/100 ml was based on various sewage analysis data of Uttarakhand towns.
Table-3.7.14 Future inflows during implementation phase (Without any treatment)
Camp/village Point Dissolved Oxygen
Fast BOD
Pathogen indicator Bacteria
Location (km)
Inflow mean mean mean
Name D/s Dam site
No of Person
m3/s mg/L mg/L cfu/100ml
Village Haat 1.49 300.00 0.00038 0.0000 250.0000 10,000,000.00
Figure 1.21: Water Quality Predictions for Scenario-2 for release of 3 m3/s water

Project : Environmental Studies for Vishnugad Pipalkoti Hydro-Electric Project Page: 54 Document : 2008026/EC/Final Report Date: Nov 2009 Chapter-3 : Baseline Environment, Impacts & Mitigation Measures Revision: R4
Figure 1.22: Water Quality Predictions for Scenario-2 for release of 4 m3/s water

Project : Environmental Studies for Vishnugad Pipalkoti Hydro-Electric Project Page: 55 Document : 2008026/EC/Final Report Date: Nov 2009 Chapter-3 : Baseline Environment, Impacts & Mitigation Measures Revision: R4
Figure 1.23: Water Quality Predictions for Scenario-2 for release of 5 m3/s water

Project : Environmental Studies for Vishnugad Pipalkoti Hydro-Electric Project Page: 56 Document : 2008026/EC/Final Report Date: Nov 2009 Chapter-3 : Baseline Environment, Impacts & Mitigation Measures Revision: R4
Figure 1.24: Water Quality Predictions for Scenario-2 for release of 6 m3/s water
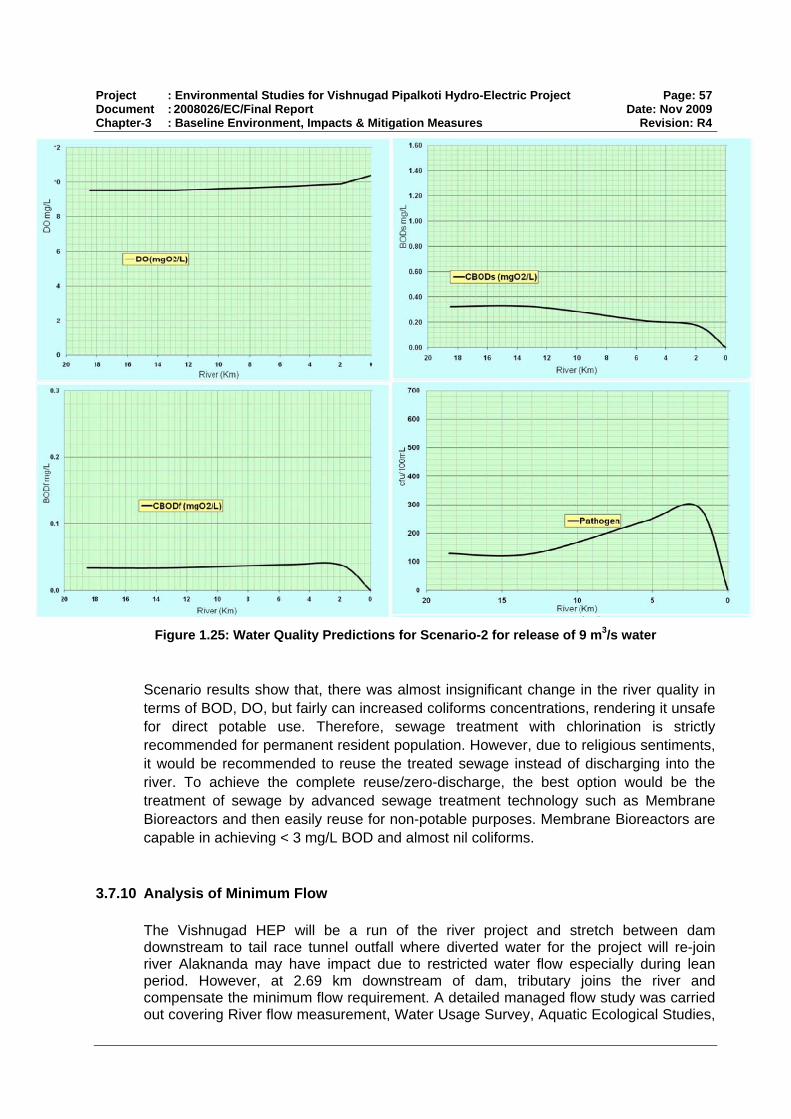
Project : Environmental Studies for Vishnugad Pipalkoti Hydro-Electric Project Page: 57 Document : 2008026/EC/Final Report Date: Nov 2009 Chapter-3 : Baseline Environment, Impacts & Mitigation Measures Revision: R4
Figure 1.25: Water Quality Predictions for Scenario-2 for release of 9 m3/s water Scenario results show that, there was almost insignificant change in the river quality in terms of BOD, DO, but fairly can increased coliforms concentrations, rendering it unsafe for direct potable use. Therefore, sewage treatment with chlorination is strictly recommended for permanent resident population. However, due to religious sentiments, it would be recommended to reuse the treated sewage instead of discharging into the river. To achieve the complete reuse/zero-discharge, the best option would be the treatment of sewage by advanced sewage treatment technology such as Membrane Bioreactors and then easily reuse for non-potable purposes. Membrane Bioreactors are capable in achieving < 3 mg/L BOD and almost nil coliforms.
3.7.10 Analysis of Minimum Flow
The Vishnugad HEP will be a run of the river project and stretch between dam downstream to tail race tunnel outfall where diverted water for the project will re-join river Alaknanda may have impact due to restricted water flow especially during lean period. However, at 2.69 km downstream of dam, tributary joins the river and compensate the minimum flow requirement. A detailed managed flow study was carried out covering River flow measurement, Water Usage Survey, Aquatic Ecological Studies,

Project : Environmental Studies for Vishnugad Pipalkoti Hydro-Electric Project Page: 58 Document : 2008026/EC/Final Report Date: Nov 2009 Chapter-3 : Baseline Environment, Impacts & Mitigation Measures Revision: R4
Pollution Load Studies and Assessment of Water Borne Diseases. The managed flow studies intend to identify the critical stretches of the river Alaknanda (within the study stretch) for flow requirements considering aquatic habitats, cultural values, water quality and waste assimilation.
Historical flow data of river Alaknanda has been collected from THDC. All of the tributaries (rivulets, drains and Nallas) have been identified and location co-ordinates, closest to the confluence of the river were collected with help of a GPS machine. The regularity of flow in these tributaries was ascertained by periodic observation, supplemented by interview survey of the locals. There are 30 of identified tributaries of the river Alaknanda along the dam to TRT out fall stretch. Out of these 9 are perennial and 21 are seasonal. The seasonal tributaries have water during the rains and do not have any snow feeding.
The regularity of flow in these tributaries was ascertained by periodic observation, supplemented by interview survey of the locals. There are 30 tributaries out of which only 5- Patal Ganga, Tapan Nala, Garur Ganga, Maina Gad and Birahi located downstream of the proposed dam location add substantial volume of water into river Alaknanda throughout the year. The minimum flow of the river Alaknanda at Joshimath from the year 1972 to 2004 ranged from 8.66 m3/s to 51.36 m3/s. Average discharge in the river is 182.70 m3/s.
The project is a run-of-river scheme utilizing the drop in river water from El 1267 to El 1027 from village Helong to village Birahi of Distt Chamoli, Uttarakhand. Taking advice from experts and based on conclusions of managed river flow study conducted under EA consolidation process of THDC, a strategy to evaluate the minimum flow aspect in the river downstream of dam after diversion has been evolved. This will greatly help in environmental management at site and also help in maintaining downstream continuity of ecological flow. The concerns emanating from diversion of water from the distributaries of Ganga rendering some of the areas waterless especially the first critical reach of 2.69 km downstream of dam, maintenance of adequate flow to meet downstream requirements has been a key aspect while finalizing the project operational strategy.
Under the project the minimum flow requirements have been developed with the ecology of the river basin, or the ‘carrying capacity’ of the rivers, in mind. It is proposed to cater the requirements for minimum flow not only through the release of committed environmental flow of 3 cumecs but also through the flushing operation. The THDC agrees to release of a committed continuous discharge from Vishnugad-Pipalkoti HEP (as per the condition of MOEF in environmental clearance) which shall be made available throughout the operation. This is estimated to be at least approx 15% of lean season discharge of river Alaknanda available during lean periods. This release of continuous committed discharge is further getting supplemented with the water from Rivulets and Streams (Patal Ganga, Garun Ganga, Maina Nadi, Ghanpani Nala, Ghat Gad and Jaisal Nala) in the intervening stretch. In addition, there shall be periodic releases from the dam owing to flushing operation also. A programme is also proposed by the THDC to established setting up a monitoring mechanism these environmental objectives and targets for the total stretch of diverted river as part of adaptive management strategy and shall be evolved alongside the construction. As such, the river shall not remain waterless at any point of time due to construction of the project.

Project : Environmental Studies for Vishnugad Pipalkoti Hydro-Electric Project Page: 59 Document : 2008026/EC/Final Report Date: Nov 2009 Chapter-3 : Baseline Environment, Impacts & Mitigation Measures Revision: R4
Conclusions and Reccomendations
1. 33 years (1971-2004) 10 daily discharge data of Alaknanda River at dam site is
analyzed. The average discharge in the river at dam site is 182.7 m3/s. Dependable flow at 50%, 75% and 90% are 88.6 m3/s, 42.5 m3/s, and 28.5 m3/s respectively. Low flow of the order of 35 m3/s occurs in the river in the month of January, February and March. Less than 100 m3/s and more than 25 m3/s discharges are available in months of November, December and April.
2. 12 months discharge data of the tributaries are measured. Birahi was found to be
the major tributary in this reach, while Garur Ganga & Tapan Nala are small tributaries. Very low discharge are available in months of Jan-Feb-March. Therefore, a representative low flow month (February 2009) was selected for water quality modeling.
3. Average width & bed slope of the river in the study reach are 20 m & 1/95
respectively. Manning roughness coefficient was found to be 0.05. The hydrodynamic model was run by using US EPA Qual 2K software for lean discharge = 60 m3/s in the river at the dam site and the discharges in Tapan Nala, Patal Ganga, Garur Ganga, Maina Gad and Birahi tributaries were 1.14, 3.27, 0.51, 7.026 and 4.62 m3/s respectively. The depth of the flow varies between 1-2 m while the velocity in the order of 2 m/s within the study stretch.
4. The water quality model was set-up to establish baseline water quality conditions in
the study reach. By calibrating the SBOD and FBOD decay of 0.23 day-1 (at 20 oC) & 0.1 day-1 , pathogens decay rates 1.5 day-1 and settling rates 1.0 day-1 and applying standard O'Connor-Dobbins reaeration equation, the WQ-model simulated the pollutant data observed in February 2009.
5. The model was simulated considering anticipated future pollution loading from labor
camps. The inflows from labor camps are based on the assumption of 80 % sewage generation by supplying 135 L/cap.day water supply. BOD, DO & Coliforms values are based on the data collection and analysis of sewage quality of various towns of Uttarakhand. Scenario 1 results shows that, although there would be not much change in DO concentrations, but there was a little change in BOD and severe deterioration of water quality in terms of fecal coliforms. The fast BOD would be increased to 3.5 mg/L and Slow BOD to 1.2 mg/L results is unaesthetic conditions and high coliform concentrations in the order of 16,000 MPN/100 ml render the river water ineffective for drinking. Strong objections would be raised and this kind of situation would be totally unacceptable. Therefore, complete sewage treatment to secondary level along with chlorination is mandatory to discharge the treated wastewater from construction camps to the river.
6. Scenario 2 was conducted to forecast the water quality conditions in the Alaknanda
River by the untreated pollution load of 300 permanent technical staff working for power house residing near the Village. Minimum 3 m3/s freshwater is assumed to be

Project : Environmental Studies for Vishnugad Pipalkoti Hydro-Electric Project Page: 60 Document : 2008026/EC/Final Report Date: Nov 2009 Chapter-3 : Baseline Environment, Impacts & Mitigation Measures Revision: R4
released from d/s of dam. Scenario results shows that, although there was almost insignificant change in the river quality in terms of BOD, DO, but can increase coliforms concentrations fairly, rendering it unsafe for direct potable use. Therefore, sewage treatment with chlorination is strictly recommended for permanent resident population. However, due to religious sentiments, it would be recommended to reuse the treated sewage instead of discharging it to the river. To achieve the zero-discharge, the best option would be the treatment of sewage by advanced sewage treatment technology such as Membrane Bioreactors and then easily reuse for non-potable purposes. Membrane bioreactors are capable in achieving < 3 mg/L BOD and almost nil coliforms.
7. THDC has agreed to maintain a minimum flow of 3 cumecs in the downstream of the
dam throughout the year with the following mitigation measures :
THDC has conceived for the construction of six numbers of 5m high concrete overflow weirs across Alaknanda river on the d/s of the dam to address the issues of water diversion. These weirs are proposed up to the location where the first major tributary Tapan Nala meets river Alaknanda. With this arrangement there would be perennial pondage of about 0.13 Mcum of water in the above stretch of the river, which shall be good enough to serve the local people to fulfill all of their water needs during non monsoon /low discharge period. Average ponding of water behind each weir would be about 21666cu.m.
In order to have regular replenishing of these ponds with fresh water, it is
estimated that a minimum 2 cumecs of river water is required to gradually re-circulate the entire pond water in 3 hours time. In case of the minimum environmental flow of 3 cumecs as indicated for VPHEP, the water stored behind the weirs shall be fully replaced by the fresh water in about 2 hours time. Therefore, there would be no chances of this water becoming stagnant and the freshness of the water shall always be ensured.

Project : Environmental Studies for Vishnugad Pipalkoti Hydro-Electric Project Page: 61 Document : 2008026/EC/Final Report Date: Nov 2009 Chapter-3 : Baseline Environment, Impacts & Mitigation Measures Revision: R4
3.7.11 Uses of Water
Due to deep gorge of Alaknanda River, the river water is neither used for agriculture nor for drinking purposes. The natural springs and streams are the sources of water for people living in the area for consumption, livestock as well as irrigation purposes. The drinking water sources in the area is shown in the table below
Table 3.7.15 Drinking water sources in the area Location SN Name of
Village Type of Source
N E 1. Gadi Gaun Pipeline supply from natural spring 30° 23’ 08.5” 079° 25’ 08.1” 2. Birahi Pipeline supply from natural spring 30° 24’ 30.9” 079° 23’ 20.5” 3. Koriya Pipeline supply from natural spring 30° 24’ 45.6” 079° 24’ 35.0” 4. Akthalla Pipeline supply from natural spring 30° 25’ 34.8” 079° 25’ 46.0” 5. Ratoli Pipeline supply from natural spring 30° 25’ 20.3” 079° 26’ 04.0” 6. Pakhi Pipeline supply from natural spring 30° 27’ 43.1” 079° 26’ 41.5” 7. Siyasain Pipeline supply from natural spring 30° 24’ 54.7” 079° 24’ 19.3” 8. Jainsal Pipeline supply from natural spring 30° 25’ 08.1” 079° 24’ 15.5” 9. Haat Pipeline supply from natural spring 30° 25’ 18.2” 079° 24’ 53.0” 10. Langsi Pipeline supply from natural spring 30° 29′ 25.8″ 079°28′ 51.1″ 11. Patalganga Pipeline supply from natural spring 30° 29′ 11.2″ 079°29′ 10.3″ 12. Durgapur Pipeline supply from natural spring 30° 24’ 39.4” 079° 23’ 12.7” 13. Dwing Pipeline supply from natural spring 30° 29’ 17.1” 079° 27’ 44.5” 14. Tanduli Pipeline supply from natural spring 30° 26’ 28.8” 079° 25’ 38.8” 15. Helong Pipeline supply from natural spring 30° 31’ 23.8” 079° 30’ 05.5” 16. Belakuchi Tube well 30° 28’ 50.8” 079° 28’ 12.2” 17. Pipalkoti Tube well 30° 26’ 25.2” 079° 25’ 48.0” 18. Pipalkoti Tube well 30° 25’ 57.8” 079° 25’ 55.9” 19. Gadora Tube well 30° 25’ 65.7” 079° 25’ 39.6” 20. Mayapur Tube well 30° 24’ 48.8” 079° 25’ 04.2” 21. Kodiya Tube well 30° 24’ 46.7” 079° 24’ 26.9” 22. Birahi Tube well 30° 24’ 33.3” 079° 23’ 20.4” 23. Chinka Tube well 30° 24’ 44.2” 079° 21’ 55.6”
The project area falls in pilgrim route to Badrinath, there is influx of tourist in the area during summer season for 6 months. During the tourist season the water demand goes up to meet the requirement of the tourist. The drinking water sources in the area is shown in the figure below

Project : Environmental Studies for Vishnugad Pipalkoti Hydro-Electric Project Page: 62 Document : 2008026/EC/Final Report Date: Nov 2009 Chapter-3 : Baseline Environment, Impacts & Mitigation Measures Revision: R4
GadoraPipalkoti
Birahi Kodiya
Pipeline supply from natural spring (Naurakh) Pipeline supply from natural spring (Agthalla)

Project : Environmental Studies for Vishnugad Pipalkoti Hydro-Electric Project Page: 63 Document : 2008026/EC/Final Report Date: Nov 2009 Chapter-3 : Baseline Environment, Impacts & Mitigation Measures Revision: R4
3.7.12 River Bed Utilization Survey
The water of the Alaknanda is not used for irrigation, agriculture is depended on rain and there is no organized irrigation system in the area. Canals & gulls are the major sources of irrigation in the district, only 15% of the land of the district is irrigated. There are no industries in the area and hence there is no industrial water demand. The construction of the project will not have any impact on drinking water and irrigation system of the project area as the water of Alaknanda River is not utilized for the same. There are only two places where the slope of embankment of Alaknanda is low and people have utilized these two places. One is in the confluence point of Birahi Ganga and river Alaknanda and another is at Kshetralpal which is two kilometer downstream of project end point. The details of the river bed utilization are presented below.
1. Confluence point of Birahi Ganga and Alaknanda River
Name of the Place : Birahi Position : Left Bank of Alaknanda Location : N30° 24′ 32.4″ E 079° 23′ 14.3″ Type of Utilization : Hot Mix Plant
2. Kshetralpal
Name of the Place : Kshetralpal Position : Left Bank of Alaknanda Location : N30° 24′ 41.2″ E 079° 22′ 26.4 ″ Type of Utilization : Stone Crusher Plant
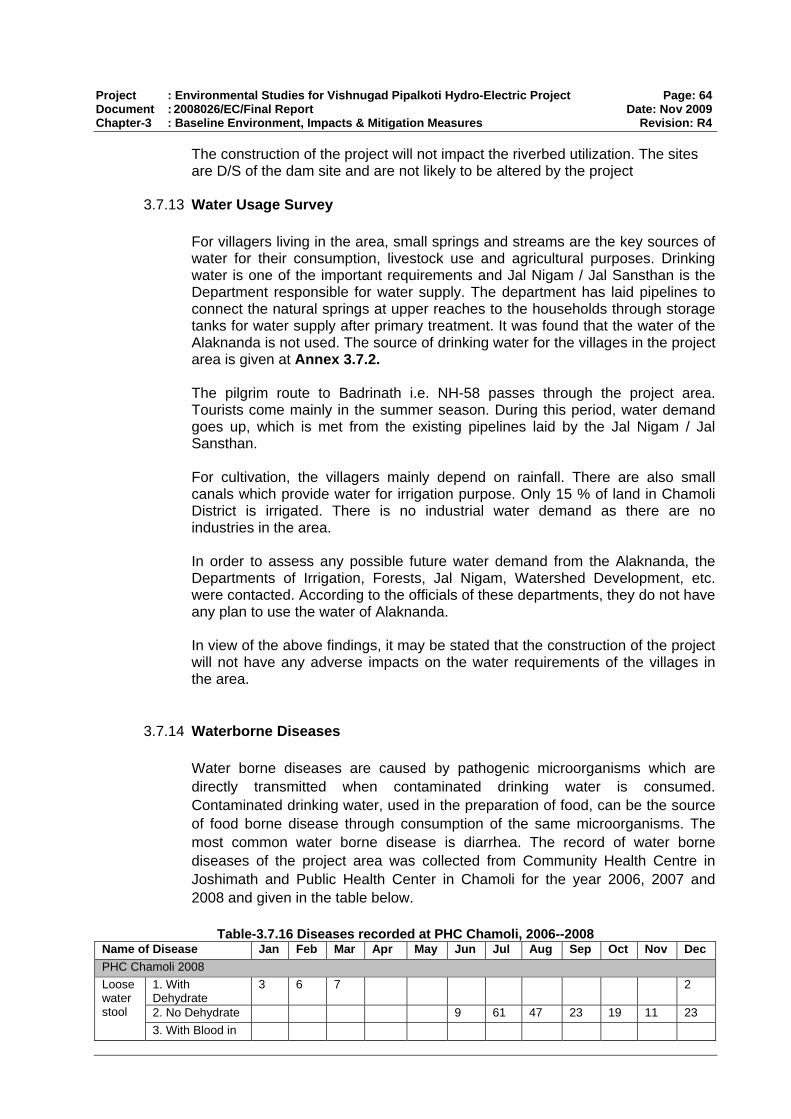
Project : Environmental Studies for Vishnugad Pipalkoti Hydro-Electric Project Page: 64 Document : 2008026/EC/Final Report Date: Nov 2009 Chapter-3 : Baseline Environment, Impacts & Mitigation Measures Revision: R4
The construction of the project will not impact the riverbed utilization. The sites are D/S of the dam site and are not likely to be altered by the project
3.7.13 Water Usage Survey For villagers living in the area, small springs and streams are the key sources of water for their consumption, livestock use and agricultural purposes. Drinking water is one of the important requirements and Jal Nigam / Jal Sansthan is the Department responsible for water supply. The department has laid pipelines to connect the natural springs at upper reaches to the households through storage tanks for water supply after primary treatment. It was found that the water of the Alaknanda is not used. The source of drinking water for the villages in the project area is given at Annex 3.7.2. The pilgrim route to Badrinath i.e. NH-58 passes through the project area. Tourists come mainly in the summer season. During this period, water demand goes up, which is met from the existing pipelines laid by the Jal Nigam / Jal Sansthan. For cultivation, the villagers mainly depend on rainfall. There are also small canals which provide water for irrigation purpose. Only 15 % of land in Chamoli District is irrigated. There is no industrial water demand as there are no industries in the area. In order to assess any possible future water demand from the Alaknanda, the Departments of Irrigation, Forests, Jal Nigam, Watershed Development, etc. were contacted. According to the officials of these departments, they do not have any plan to use the water of Alaknanda. In view of the above findings, it may be stated that the construction of the project will not have any adverse impacts on the water requirements of the villages in the area.
3.7.14 Waterborne Diseases Water borne diseases are caused by pathogenic microorganisms which are directly transmitted when contaminated drinking water is consumed. Contaminated drinking water, used in the preparation of food, can be the source of food borne disease through consumption of the same microorganisms. The most common water borne disease is diarrhea. The record of water borne diseases of the project area was collected from Community Health Centre in Joshimath and Public Health Center in Chamoli for the year 2006, 2007 and 2008 and given in the table below.
Table-3.7.16 Diseases recorded at PHC Chamoli, 2006--2008 Name of Disease Jan Feb Mar Apr May Jun Jul Aug Sep Oct Nov Dec PHC Chamoli 2008
1. With Dehydrate
3 6 7 2
2. No Dehydrate 9 61 47 23 19 11 23
Loose water stool
3. With Blood in

Project : Environmental Studies for Vishnugad Pipalkoti Hydro-Electric Project Page: 65 Document : 2008026/EC/Final Report Date: Nov 2009 Chapter-3 : Baseline Environment, Impacts & Mitigation Measures Revision: R4
Name of Disease Jan Feb Mar Apr May Jun Jul Aug Sep Oct Nov Dec Jaundice Unusual Symptom Death & Hospitalization
Fever 20 18 16 40 45 20 160 109 140 68 38 100 Cough with/without fever 8 10 20 4 12 3 55 90 Total 31 34 43 44 57 32 221 156 163 87 104 215 PHC Chamoli 2007
1. With Dehydrate
18 40 10 8 49 55 53 1 11 21
2. No Dehydrate 10 36 5 12 65 69 87 5 4 22
Loose water stool
3. With Blood in 2 15 1 Jaundice Unusual Symptom Death & Hospitalization
Fever 6 12 10 34 38 12 154 100 138 60 36 97 Cough with/without fever 5 7 15 2 11 1 50 89 Total 14 25 32 36 49 22 215 147 161 79 97 211 PHC Chamoli 2006
1. With Dehydrate
7 8 5 9 5 6 12 12 12 15 18 18
2. No Dehydrate 12 15 14 12 25 26 23 14 15 25 8 10
Loose water stool
3. With Blood in Jaundice Unusual Symptom Death & Hospitalization
Fever 93 16 106 78 64 90 122 190 210 38 28 42 Cough with/without fever 27 25 10 5 15 2 8 10 15 18 25 10 Total 139 64 135 104 109 126 168 227 254 96 79 80
Table-3.7.17 Diseases recorded in CHC Joshimath, 2006-2008 Name of Disease Jan Feb Mar Apr May Jun Jul Aug Sep Oct Nov Dec CHC Joshimath 2008
1. With Dehydrate
18 40 10 8 49 55 53 1 11 21
2. No Dehydrate 10 36 5 12 65 69 87 5 4 22
Loose water stool
3. With Blood in 2 15 1 Jaundice Unusual Symptom Death & Hospitalization
Fever 30 19 80 88 55 34 66 99 133 20 116 56 Cough with/without fever 30 15 119 35 16 73 111 169 55 70 37 Total 70 34 80 245 95 62 204 294 390 80 190 115 CHC Joshimath 2007
1. With Dehydrate
3 6 7 2
2. No Dehydrate 9 61 47 23 19 11 23
Loose water stool
3. With Blood in Jaundice Unsual Symptom Death & Hospitalization
Fever 25 18 67 86 50 30 64 99 127 14 112 50 Cough with/without fever 11 5 115 30 11 66 102 169 45 93 29 Total 39 29 74 201 80 89 191 248 319 78 216 104
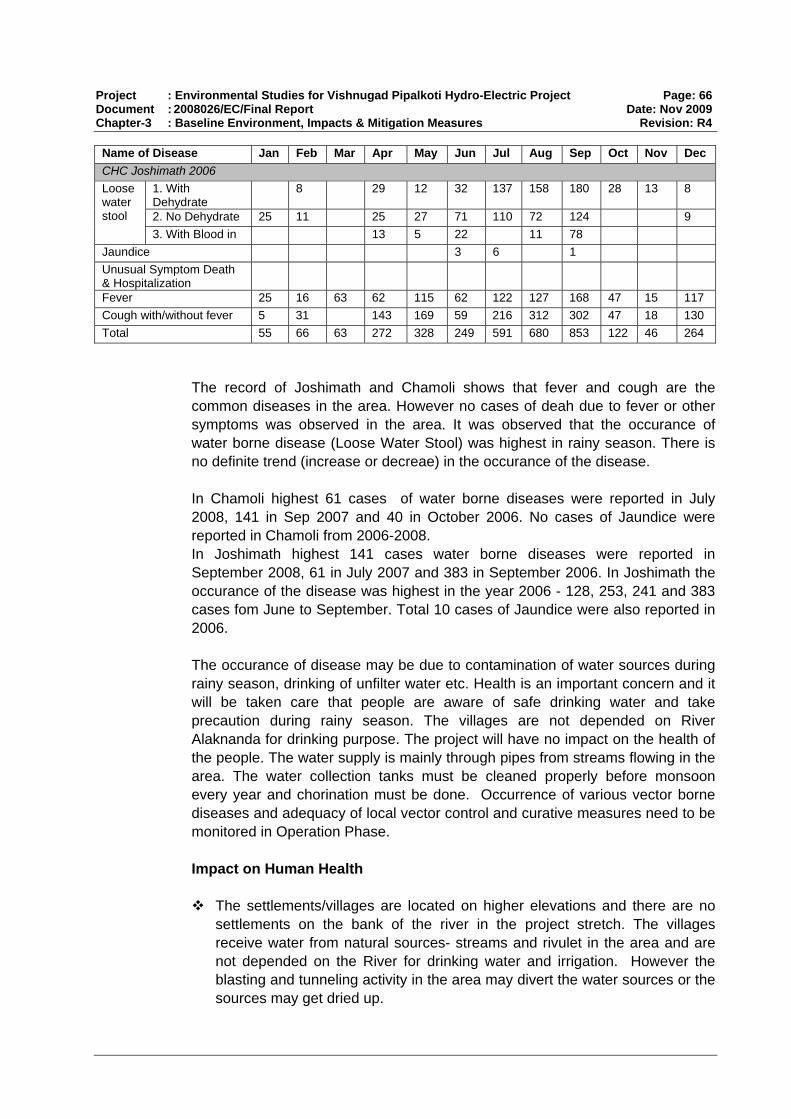
Project : Environmental Studies for Vishnugad Pipalkoti Hydro-Electric Project Page: 66 Document : 2008026/EC/Final Report Date: Nov 2009 Chapter-3 : Baseline Environment, Impacts & Mitigation Measures Revision: R4
Name of Disease Jan Feb Mar Apr May Jun Jul Aug Sep Oct Nov Dec CHC Joshimath 2006
1. With Dehydrate
8 29 12 32 137 158 180 28 13 8
2. No Dehydrate 25 11 25 27 71 110 72 124 9
Loose water stool
3. With Blood in 13 5 22 11 78 Jaundice 3 6 1 Unusual Symptom Death & Hospitalization
Fever 25 16 63 62 115 62 122 127 168 47 15 117 Cough with/without fever 5 31 143 169 59 216 312 302 47 18 130 Total 55 66 63 272 328 249 591 680 853 122 46 264
The record of Joshimath and Chamoli shows that fever and cough are the common diseases in the area. However no cases of deah due to fever or other symptoms was observed in the area. It was observed that the occurance of water borne disease (Loose Water Stool) was highest in rainy season. There is no definite trend (increase or decreae) in the occurance of the disease. In Chamoli highest 61 cases of water borne diseases were reported in July 2008, 141 in Sep 2007 and 40 in October 2006. No cases of Jaundice were reported in Chamoli from 2006-2008. In Joshimath highest 141 cases water borne diseases were reported in September 2008, 61 in July 2007 and 383 in September 2006. In Joshimath the occurance of the disease was highest in the year 2006 - 128, 253, 241 and 383 cases fom June to September. Total 10 cases of Jaundice were also reported in 2006. The occurance of disease may be due to contamination of water sources during rainy season, drinking of unfilter water etc. Health is an important concern and it will be taken care that people are aware of safe drinking water and take precaution during rainy season. The villages are not depended on River Alaknanda for drinking purpose. The project will have no impact on the health of the people. The water supply is mainly through pipes from streams flowing in the area. The water collection tanks must be cleaned properly before monsoon every year and chorination must be done. Occurrence of various vector borne diseases and adequacy of local vector control and curative measures need to be monitored in Operation Phase. Impact on Human Health
The settlements/villages are located on higher elevations and there are no settlements on the bank of the river in the project stretch. The villages receive water from natural sources- streams and rivulet in the area and are not depended on the River for drinking water and irrigation. However the blasting and tunneling activity in the area may divert the water sources or the sources may get dried up.

Project : Environmental Studies for Vishnugad Pipalkoti Hydro-Electric Project Page: 67 Document : 2008026/EC/Final Report Date: Nov 2009 Chapter-3 : Baseline Environment, Impacts & Mitigation Measures Revision: R4
The influx of labours in the area will change the population density of the area and increase floating population during construction phase, this may result in a change in health scenario. The additional sewage generated may cause contamination of the river water.
Possibility of transmission of contagious diseases. HIV/ AIDS may also spread in the area due to large labour population.
In construction phase the water quality is likely to be affected due to extraction of construction material by increasing the turbidity levels.
The increase in water fringe area provides suitable habitats for the growth of
vectors of various diseases and they are likely to increase the incidence of water-related diseases.
During operation phase water quality is likely to affect due to
Disruption of hydraulic regime. The river stretch downstream of the dam site upto the confluence point of tail race discharge will have reduced flow. The total length of the affected stretch of the river will be about 17 km.
Effluent from project colony. Sedimentation & siltation risks Impacts on D.O. due to increased residence time in reservoir
Mitigation Measures
The water quality of the river Alaknanda requires to be maintained to desired
standard for river as specified by Uttarakhand State Pollution Control Board. In case the natural sources get dried up alternative sources may be explored or the river water can be utilized.
For maintaining community health program may be framed such as Augment existing health program Health education for local project workers and community Vaccination programs - meningitis, tuberculosis tetanus etc.
Specific HIV/ AIDS prevention activities may be carried such as HIV/STD/ AIDS awareness centres Peer education program within workers Technical and material support for STD clinic. Integration of HIV/ AIDS into thematic projects (eg. emergency training) Voluntary counseling and testing Medical aid policies for workers There is need to be meaningful consultation with local communities so
that management measures are culturally appropriate locally and have community support
Discharge of waste from construction/ labour camp into water bodies must be strictly prohibited. Adequate drainage system to dispose storm water drainage from the labour colonies should be provided. Labour camps will be located at least at least 200m away from water bodies and settlements.
Malaria control measures which aim at destroying the habitat and interrupting the life cycle of mosquitoes by mechanical or biological or chemical means

Project : Environmental Studies for Vishnugad Pipalkoti Hydro-Electric Project Page: 68 Document : 2008026/EC/Final Report Date: Nov 2009 Chapter-3 : Baseline Environment, Impacts & Mitigation Measures Revision: R4
need to be implemented. The anti-malarial operations can be coordinated by various Primary Health Centers (PHC) in the nearby villages and Hospital at District Headquarters in association with the project proponents
Silt fencing may be provided near water bodies to avoid spillage of construction material
Water quality monitoring will be conducted during construction phase In operation phase proper waste and water management plan must be
prepared for the colony area. Discharge of waste directly into the water body must be strictly prohibited. Management for public health is provided in Chapter4-EMP, Section 4.14
and 4.17.8.
3.7.15 Downstream Hazards The downstream hazards which may occur due to failure of the dam are flooding of the river bank and triggering of landslide. The downstream hazards are assessed for worst case scenario when the Dam gets washed away. The water spread and depth of water at various level is as given below Table-3.7.18 Water depth and spread downstream of dam in the event of Dam
Break Distance from
dam(km) Max. elevation above MSL (m)
River bed level (m) Water depth (m)
Water Spread width (m)
3.7 1200 1223.44 23.44 86.1 10.2 1080 1104.39 24.39 114.8 11.5 1050 1071.96 21.96 72.0 15.8 1030 1060.57 30.57 110.7 18.4 1010 1044.20 34.20 172.2 20.0 1000 1038.33 38.33 229.6 Source: Dam Break Analysis Report, VPHEP The water will flow with force eroding the banks and causing damage to life and property located at the elevation given in the table. Most of the villages are located at higher elevations and there are no villages located close to the bank of the river Alaknanda. The villages which are located at lower elevation and may suffer some lose of property and life are identified and given below. The villages may not be impacted directly but may be impacted in terms of loss of access route and agricultural land.
Table-3.7.19 List of Villages whict will be affected in case of Dam Failure
S.No
Name of Village
River Bank
Latitude (N) Longitude(E) Elevation (m)
Approx. Distance from the
Dam
Loss
1. Tapon R 30° 29’ 43.2” 079° 28’ 25.4″ 1280 3 Access route
2. Langsi L 30° 29′ 25.8″ 079° 28′ 57.1″ 1345 3 Access route
3. Tirosi R 30° 29’ 15.5 “ 079° 28’ 02.2” 1126 6 Access route

Project : Environmental Studies for Vishnugad Pipalkoti Hydro-Electric Project Page: 69 Document : 2008026/EC/Final Report Date: Nov 2009 Chapter-3 : Baseline Environment, Impacts & Mitigation Measures Revision: R4
S.No
Name of Village
River Bank
Latitude (N) Longitude(E) Elevation (m)
Approx. Distance from the
Dam
Loss
4. Hyuna R 30° 28’ 23.4” 079° 26’ 20.7” 1117 8 Access route
5. Guniyala R 30° 27’ 32.1 “ 079° 25’ 30.3” 1213 10 Access route, Agricultural land,
Structures 6. Tenduli R 30° 26’ 34.5” 079° 25’ 30.1” 1220 12 Access route,
Agricultural land7. Pipalkoti L 30° 26’ 04.8 “ 079° 25’ 41.6” 1259 13 Agricultural land
8. Haat R 30° 25’ 18.8” 079° 24’ 53.7″ 1075 15 Access route, Agricultural land
9. Siyasain R 30° 24′ 58.7″ 079° 24′ 29.8″ 1069 16 Access route, Agricultural land
10. Batula L 30° 24’ 47.5 “ 079° 25’ 00.5” 1160 16 Agricultural land
11. Durgapur R 30° 24’ 38.6” 079° 23’ 14.2″ 1063 20 Access route
12. Birahi L 30° 24′ 31.8″ 079° 25′ 46.3″ 1071 20 Agricultural land
13. Bowala R 30˚ 24’ 45” 079˚ 22’ 38” 1083 22 Access route,
14. Chhinka R 30˚ 24’ 54” 079˚ 22’ 0” 1041 23 Access route, Agricultural land
Source: CES, Survey, 2008 Landslide hazard zonation study, carried out by the DPR Consultants for the Vishnugad-Pipalkoti Hydroelectric Project, considered the geo-environmental aspects such as, lithology, slope morphometry, structure, relative relief, land use and land cover and hydro geological conditions, which are the major factors determining the stability of slope. An area of 124.34 sq. km (excluding river and water bodies) was considered for the landslide hazard zone study. Five categories of hazard zones were identified. These are termed as very low, low, moderate, high and very high hazard zones. The percentage-wise categorization of the study area is as follows: • Very Low Hazard - 3.02 % of the study area • Low Hazard - 35.53 % of the study area • Moderate Hazard - 29.65 % of the study area • High Hazard - 24.87 % of the study area • Very High Hazard - 6.93 % of the study area Very high hazard zones are located along the valley of riverbed in the Patal Ganga and Birahi Ganga area where old landslide and rock debris are located; and also along the escarpment of Karmanasa river. High hazard zones are more

Project : Environmental Studies for Vishnugad Pipalkoti Hydro-Electric Project Page: 70 Document : 2008026/EC/Final Report Date: Nov 2009 Chapter-3 : Baseline Environment, Impacts & Mitigation Measures Revision: R4
common on the left bank of Alaknanda around Tangni, north-east side of Helong, around Batula and south-west side of Dwing area. Moderate hazard zones are present in the north of Dungri, around Kiruli, Gadora and Baimru area. Low and very low hazard zones are mainly restricted to cultivated fields, alpine zone and areas with gentle slope with good vegetative cover. The dam and surge shaft area falls under low hazard zones, whereas, TRT outfall area falls under moderate hazard zone. The study mentions that some major landslides occur along the road section of the project area, particularly during monsoon period, disrupting communication systems, and, many a time paralyze the life in the area. These are Helong landslide, Dam Axis landslides, Gulalskoti landslide, Langsi landslide, Patal Ganga debris slide, Patal Ganga rock slide, Tangri landslide, Pakhi landslide and Pipalkoti landslide. As these landslides affect the road section, adverse impact on the downstream river flow is not generally expected. Mitigation Measures
Formulate and implement an Emergency Action Plan to minimize the probable loss of life and damage to property in the event of failure of dam
An effective communication system and a downstream warning system are essential for the success of an emergency preparedness plan.
Evacuation plan may be formulated, this must include
Demarcation / prioritization of areas to be evacuated Notification procedures and evacuation instructions Safe routes, transport and traffic control Safe areas/ shelters
The Evacuation team may be comprised of the District Collector, Superintendent Police / Nominated Police Officer, Chief Medical Officer, Sarpanch of identified Villages and Project in charge of VPHEP
Establish an effective Dam Safety Surveillance and monitoring programme
Rapid analysis and interpretation of instrumentation and observation data
Periodic inspection and safety reviews/evaluation.
A regular maintenance program that includes mowing, inspection and repair of minor problems
THDC will prepare a map of the area showing danger level. No construction work may be planned in the danger area by the govt. authorities / private owners. Signboard showing no construction zone may be placed in the area. The Pipalkoti, Pakhi, Tangri, Patal Ganga, Langsi, Gulabkoti and Helong landslides are observed along the road section, fall on the left side of the river.

Project : Environmental Studies for Vishnugad Pipalkoti Hydro-Electric Project Page: 71 Document : 2008026/EC/Final Report Date: Nov 2009 Chapter-3 : Baseline Environment, Impacts & Mitigation Measures Revision: R4
Most of the project activities desiltation chamber, Head Race Tunnel, Power House and Tail Race Tunnel are located in the right bank of the river. On right bank the important landslides are dam axes landslide, 1 km downstream of dam axes, Tapon and Dwing landslides. Occurrence of land slide due to road cutting may take place on either side. Since the dam and surge shaft area come under the low hazardous zone while the TRT outfall area come under the moderate hazardous zone the triggering of landslide due to project activities is likely to be insignificant or moderate
The very low hazard and low hazard zones are considered safe for development schemes. The moderate hazard zones may contain some local vulnerable zones of instability, which could be controlled with appropriate slope measures. Wherever required check dams spurs and vegetative measures must be.
Green belt development program may be undertaken, vegetation tends to reduce surface water runoff and thus reduce the potential for erosion thus enhancing stability of slope. The barren and sparsely vegetated areas show faster erosion and greater instability.

Project : Environmental Studies for Vishnugad Pipalkoti Hydro-Electric Project Page: 72 Document : 2008026/EC/Final Report Date: Nov 2009 Chapter-3 : Baseline Environment, Impacts & Mitigation Measures Revision: R4
3.8 AQUATIC ECOLOGY An in-depth aquatic ecological study was carried out in the project area. Primary data on various components of aquatic ecology were collected through intensive survey of area, aquatic sampling, consultation with local communities and fishery experts. Review of secondary data was also made for confirming the primary data.
3.8.1 Secondary Data Review
Few scattered reports on the aquatic ecology of the project area (VPHEP) are available especially in terms of fish diversity. (Menon, 1962; Badola and Singh, 1981, Singh, et al. 1987, 1993; Sharma 1984; Singh and Sharma, 1998, Sharma et.al 2005, 2007 and 2008). On the basis of secondary data available, every component of aquatic ecology was verified through extensive survey, experimental fishing and consultation with local inhabitants and casual fishermen. No commercial fishing is available in the entire stretch of Alaknanda River. However few people from the local inhabitants used to operate cast net or fishing lines, hanging loops in the tributaries of Alaknanda. Fishing is very common throughout the year in the Birahi River which seems to be most favorite habitat for coldwater fish.
3.8.2 Primary Survey The primary survey consisted of sampling at six sites (S0, S1, S2, S3, S4 and S5) identified in the stretch of the project area, sampling site (S0) was located in the upstream of the dam site at the confluence of river Alaknanda and Dhauliganga at Vishnuprayag, four sampling sites were located between the dam construction site and the power house construction site while the sixth sampling site (S5) was selected downstream of the site of powerhouse on the river Birahi near its confluence with the river Alaknanda. The sampling was conducted during the period from November 2008 to May 2009. Sampling Site S0 (Confluence of Alaknanda and Dhauliganga River):
Sampling stretch below the confluence point Confluence point of Alaknanda & Dhauliganga

Project : Environmental Studies for Vishnugad Pipalkoti Hydro-Electric Project Page: 73 Document : 2008026/EC/Final Report Date: Nov 2009 Chapter-3 : Baseline Environment, Impacts & Mitigation Measures Revision: R4
The sampling site (S0) was selected upstream of the proposed Dam site (latitude 30º33' 47.9'' N and longitude 079º34' 34.0'') near the confluence of Alaknanda and Dhauligana in a stretch of 200 meters between the stretch of Vishnuprayag and Joshimath. This site is about 5 km upstream of the proposed dam site. Dhauliganga, a snow-fed river, meets the left bank of the river Alaknanda at Vishnuprayag. The Dhauliganga River course was north-east direction and has very good water discharge. The stretch was represented by mostly big boulders. Bottom substrates included big and small boulders, pebbles and gravels. Riparian vegetation cover was found in patches on left bank and was sparse on right bank of the river. Sampling Site S1 (Dam Construction Site):
Location of the dam site (S1)
The sampling site was selected near the site of dam construction (longitude 30031’09”N longitude 79029’40.3’) at Alaknanda river in a stretch of 100 meter. This site was located between the very hard rocks. The bottom substrate included big boulders, stones, pebbles with sand and rich in gravels. The left bank was open up to approximately 30 meters and no riparian vegetation was found in this stretch. After 30m downstream sparse vegetation was noticed. Few rapids and pools were also noticed in this stretch. Juveniles of Schizothorax species were also caught from a pool at the site. The river was
flowing in North-South direction at this site. The samples of fish, microbiota and benthic invertebrates were also collected from this site during the survey
Collection of the samples from the site for dam construction
Sampling of plankton population from the site for dam construction

Project : Environmental Studies for Vishnugad Pipalkoti Hydro-Electric Project Page: 74 Document : 2008026/EC/Final Report Date: Nov 2009 Chapter-3 : Baseline Environment, Impacts & Mitigation Measures Revision: R4
Sampling Site S2 (Patal Ganga):
Sampling of Macrozoobenthos from Patalganga
The sampling site (S2) was selected on the Patalganga (1,372m above m.s.l; latitude 30029’14.3”N longitude 79029’16.1”E), a snow-fed tributary of the river Alaknanda in a stretch of 100 m after the preliminary observation of the site. This site was represented by big and small boulders. The bottom substrata comprised of small cobbles, pebbles, sand and gravels. The stream has considerable water discharge. The river course was north-south. There was sparse riparian vegetation along the stream course. The representative samples of microbiota, macroinvertebrates and fish were collected from the area. Sampling Site S3 (Garur Ganga): The sampling site (S3) was selected on Garur Ganga, a spring-fed tributary of Alaknanda river near village Pakhi (1319 m. above m.s.l.; latitude 30027’42.1”N longitude79026’41”). The bottom substrates were dominated by big boulders. However, big and small cobbles were also found at the bottom of the river. Riparian vegetation cover was found to be good along the stream bank. A good water discharge was noticed. The periphyton, plankton and macrozoobenthos were abundantly available at the site.
Collection of plankton from Garur Ganga Macrozoobenths collected from the site
Sampling Site S4
(Power House Construction Site): The sampling site (S4) was selected downstream on Alaknanda river (1,056 m

Project : Environmental Studies for Vishnugad Pipalkoti Hydro-Electric Project Page: 75 Document : 2008026/EC/Final Report Date: Nov 2009 Chapter-3 : Baseline Environment, Impacts & Mitigation Measures Revision: R4
above m.s.l; latitude 30025’ 08.3” N and longitude 79024’47.8”E) near the village Haat, where the construction of the power house is proposed. The bottom substrates included the medium to small cobbles, pebbles and sand. The river course was South-North. The left bank was open up to 100 m dominated by big and small boulders. Right bank was characterized by hard rocks and boulders. No riparian vegetation was found near the river course in the stretch of 100 m. Different aquatic organisms were collected at this site. Approximately 700 m away on the right side, a muck deposition site, was available.
Sampling of microbiota near the Powerhouse site
Sampling of macrozoobenthos near the site of powerhouse
Sampling Site S5 (Birahi River): The sampling site (S5) was selected on the Birahi river (1,028 m above m.s.l.; latitude 30024’28.1”N and longitude 79023’20.8E), a tributary of the river Alaknanda, downstream the powerhouse construction site near village Birahi. The bottom substrates were dominated by big boulders, stones, pebbles, gravels and sand. Anthropogenic disturbance like extraction of building material (stones, gravel, sand, etc.) was noticed at this site. However the site has sufficient water discharge for supporting aquatic life. Common fishing activities were also noticed at this site.
Collection of macrozoobenthos from Birahi river Juvenile fishes collected from the Birahi River

Project : Environmental Studies for Vishnugad Pipalkoti Hydro-Electric Project Page: 76 Document : 2008026/EC/Final Report Date: Nov 2009 Chapter-3 : Baseline Environment, Impacts & Mitigation Measures Revision: R4
The prominent marks of scrapping of periphyton on the boulders by bottom feeder herbivorous fish were also noticed at this site. Different biological parameters were also collected from this site. The riparian vegetation cover was considerable in the stretch. Aquatic biodiversity was also rich in Birahi River.
3.8.3 Methodology Of all the six sampling sites (S0, S1, S2, S3, S4 and S5) identified in the entire stretch of the project area, four sampling sites were located between the dam construction site and the power house construction site; while the fifth sampling site (S5) was selected downstream the powerhouse construction site on the river Birahi near its confluence with the river Alaknanda. Site S0 was located above dam site at the confluence of River Alaknanada and Dauliganga, the extreme point of reach of the fish for ensuring the presence of migratory fish-Mahseer. These sites were selected, keeping in view the various points like the area to be adversely affected by the project activities submergence; area directly draining into reservoir; area between the submergence and the power house, construction activities on the flora and fauna of the region. Various parameters of aquatic ecology at each of the outfall of the tributaries were studied. The data were collected on the availability of fish and fish habitat. Extensive consultation and discussion was done with the residents, consumers and the local fishermen of the nearby villages in addition to sampling of fish from each site. The information about the migratory fish was also collected. The microbiota (periphyton, zooplankton and phytoplankton) and the benthic invertebrates were also collected from each sampling site within the study stretch. The aquatic ecological analyses of the study stretch including all the major tributaries in the stretch were made following the methods outlined in Wetzel and Likens (1991) and APHA (1998). Periphytons were collected using a timed scrapping technique following Ward (1974) with the help of a sharp knife for each replicated sample. The upper surfaces of at least cobble sized rock were scrapped using a five-minute period. For enumeration of plankton population, bulk water samples were collected in polythene jars. For obtaining, plankton from water samples 10 litre bulk water was filtered through 50µm net and was centrifuged at 1500 rpm for 10-minute period. The sediment of the centrifuge tube was made to concentrate and was used for enumeration of plankton population. A plankton chamber of 0.5 ml capacity was used for counting of plankton under the inverted compound microscope. The total number of planktons present in a litre of water sample was calculated using the following formula:
dcentrifuge water of Volume x econcentratsediment of Volume1000 x 0.5aliquot x ml 0.5in plankters ofNumber )l (ind.plankton ofNumber 1- =
Macrozoobenthos colonizing the substrate were collected with the help of Surber Sampler (0.50mm mesh net) and by hand picking with the help of forceps and

Project : Environmental Studies for Vishnugad Pipalkoti Hydro-Electric Project Page: 77 Document : 2008026/EC/Final Report Date: Nov 2009 Chapter-3 : Baseline Environment, Impacts & Mitigation Measures Revision: R4
brush from stones. Quantitative estimation of macrozoobenthos was based on numerical counting (ind.m-2). The surface area of the stones of the sampled area was estimated using the following formula:
S= n/3(LW+LH+WH)
Where, L= length; W = width; H = height of each stone to the nearest of 0.5 cm. The species diversity index (Shannon-Weiner Index) of general diversity ( H ) was computed using the following formula:
∑−
⎟⎠⎞
⎜⎝⎛
⎟⎠⎞
⎜⎝⎛−=
s
i Nni
NniH
12log
Where, H = Shannon-Weiner index of diversity; ni = total number of individuals of the species and N= total number of individuals of all species. Mean density of the fish species was estimated through experimental fishing (TSSN method) in the Alaknanda River in the project stretch.
3.8.4 Results and Analysis
The data on aquatic life (periphytons, phytoplanktons, zooplanktons, macrozoobenthos and fish) has been presented in Annex 3.8.1. Periphyton: Periphytons are the microscopic aquatic plants found on the periphery of the stones or rocks at the bottom of the river/stream. They constitute the major food of herbivorous and omnivorous fishes. 18 species of 3 families were found to occur in the project site. Family Bacillariophyceae constituted the major group (10 taxa) among periphyton. Five species from Chlorophyceae and three from Mixophyceae also showed their presence at the sampling sites. The Shannon Weiner diversity index was found to be 3.64 at S1(Dam site), 3.78 at S2 (Patalganga), 3.94 at S3 (Garur Ganga), 3.72 at S4 (Power House site) and 3.75 at S5 (Birahi river) .
Table-3.8.1 Periphyton dwelling in the Project Stretch
S.No Periphyton Family 1. Tabellaria fenestris Bacillariophyceae 2. Fragillaria inflata “ 3. Meridion circulare “ 4. Nitzschia sp. “ 5. Navicula radiosa “ 6. Cymbella cistula “ 7. Synedra ulna “ 8. Gomphonema sp. “ 9. Denticula sp. “ 10. Diatoma vulgaris “ 11. Ulothrix zonata Chlorophyceae 12. Zygnema sp. “

Project : Environmental Studies for Vishnugad Pipalkoti Hydro-Electric Project Page: 78 Document : 2008026/EC/Final Report Date: Nov 2009 Chapter-3 : Baseline Environment, Impacts & Mitigation Measures Revision: R4
S.No Periphyton Family 13. Cladophora sp. “ 14. Closterium leibleinii “ 15. Spirogyra sp. “ 16. Anabaena sp. Myxophyceae 17. Phormidium sp. “ 18. Oscillatoria tenuis “
Source: Survey carried out by CES
Phytoplankton: Phytoplanktons are the microscopic plants floating on the surface of water. 10 species from 3 families of phytoplankton were found to occur in the Alaknanda River and its tributaries in the project stretch. Bacillariophyceae dominated the phytoplankton present in the area. The diversity index was found to be 2.84 at S1 (Dam site), 2.73 at S2 (Patalganga), 2.85 at S3 (Garur Ganga), 2.75 at S4 (Power House site) and 2.82 at S5 (Birahi river)
Table-3.8.2 Phytoplankton dwelling the sites in Project Stretch S. No Phytoplankton Family
1. Diatoma elongata Bacillariophyceae 2. Tabellaria fenestris “ 3. Fragillaria inflata “ 4. Nitzschia sp. “ 5. Cymbella cistula “ 6. Navicula radiosa “ 7. Ulothrix zonata Chlorophyceae 8. Spirogyra sp. “ 9. Anabaena sp. Myxophyceae 10. Oscillatoria tenuis “
Source: Survey carried out by CES
Zooplankton: The zooplanktons are the aquatic microscopic animals floating at the surface of water. Zooplanktons were represented by the taxa of Cladocera, Copepoda and Rotifera. Cladocera was represented by two species; however the Copepoda was represented by only one species. Rotifera was represented by one species. Cyclops sp. and Keratella sp. were abundant. The species diversity index (Shannon-Weiner) of zooplankton was found to be 2.26 at S1(Dam site), 2.17 at S2 (Patalganga), 2.23 at S3 (Garur Ganga), 2.20 at S4 (Power House site) and 2.30 at S5 (Birahi river) .
Table-3.8.3 Zooplankton found in the Project Stretch S. No. Zooplankton Taxa
1. Daphnia sp. Cladocera 2. Ceriodaphnia sp. “ 3. Cyclops sp. Copepoda 4. Keratella sp. Rotifera 5. Asplanchna sp. “
Source: Survey carried out by CES

Project : Environmental Studies for Vishnugad Pipalkoti Hydro-Electric Project Page: 79 Document : 2008026/EC/Final Report Date: Nov 2009 Chapter-3 : Baseline Environment, Impacts & Mitigation Measures Revision: R4
Macrozoobenthos: Bottom dwelling aquatic macrozoobenthos were represented by 22 taxa from 5 orders. Shannon-Weiner diversity index was found to be highest (3.98) for Birahi River. Baetis sp. and Heptagenia sp. were the most frequent and abundant species among macrozoobenthos in Birahi River. The diversity index recorded for other sites were 3.47 at S1 (Dam site), 3.74 at S2 (Patalganga), 3.97 at S3 (Garur Ganga) and 3.48 at S4 (Power House site).
Table-3.8.4 Macrozoobenthos dwelling the river in the Project Stretch
S. No. Macrozoobenthos Order
1. Baetis niger Ephemeroptera 2. Baetis rhodoni “ 3. Caenis sp. “ 4. Centroptilum sp. “ 5. Ephemerella ignita “ 6. Heptagenia sulphurea “ 7. Ironodes sp. “ 8. Leptophlebia sp. “ 9. Psephenus sp. “ 10. Glossosoma sp. Trichoptera 11. Hydropsyche fulvipes “ 12. Leptocella sp. “ 13. Limnephilous sp. “ 14. Philopotamus montanus “ 15. Rhyacophila sp. “ 16. Antocha saxicola Diptera 17. Atherix sp. “ 18. Chironomus sp. “ 19. Simulium sp. “ 20. Perla sp. Plecoptera 21. Isogenus sp. “ 22. Corydalus sp. Neuroptera
Source: Survey carried out by CES
Fish: An extensive survey and experimental fishing at all the sampling sites (S0 -S5) was conducted. A detailed list of fish species, their local name and conservation status recommended by National Bureau of Fish Genetic Resources- NBFGR (2003) is presented below.
Experimental fishing in the project area

Project : Environmental Studies for Vishnugad Pipalkoti Hydro-Electric Project Page: 80 Document : 2008026/EC/Final Report Date: Nov 2009 Chapter-3 : Baseline Environment, Impacts & Mitigation Measures Revision: R4
Table-3.8.5 Fish dwelling in Alaknanda River and its tributaries in the project stretch S.No. Zoological Name Local Name Conservation
Status (NBFGR) 1. Schizothorax richardsonii Gray Maseen Abundant 2. Schizothoraichthys progastus McClelland Chongu Vulnerable 3. Tor tor Hamilton Dansulu Endangered 4. Tor putitora Hamilton Dansulu Endangered 5. Crossocheilus latius latius Hamilton Sunhera Lower Risk 6. Garra gotyla gotyla Gray Gondal Abundant 7. Garra lamta Hamilton Gondal Lower Risk 8. Barilius bendelisis Hamilton Fulra Abundant 9. Barilius bola Hamilton Fulra Abundant
10. Barilius vagra Hamilton Fulra Abundant 11. Barilius barna Hamilton Fulra Abundant 12. Puntius sophore Hamilton Fulra Lower Risk 13. Puntius chilinoides McClelland Fulra Lower Risk 14. Glyptothorax pectinopterus McClelland Nau Abundant 15. Glyptothorax madraspatanum Day Nau Lower Risk 16. Pseudecheneis sulcatus McClelland Mungria Vulnerable 17. Noemacheilus montanus McClelland Gadiyal Abundant 18. Noemacheilus bevani Gunther Gadiyal Abundant 19. Noemacheilus multifasciatus Day Gadiyal Abundant 20. Noemacheilus zonatus McClelland Gadiyal Abundant
Source: Secondary Data review and Sampling in the Project stretch from Nov 2008 – May 2009 On the basis of primary data and review of secondary data, it was revealed that the two important species of Mahseer (Tor tor and Tor putitora) are present in the Alaknanda River downstream the dam site of VPHEP. These species are endangered and migratory in nature. However the species of Mahseer could not reach upto the damsite. Therefore the dam of VPHEP will not create obstruction to Mahseer. The other species Schizothoraichthys progastus and Pseudecheneis sulcatus are vulnerable in their ecological status which have their presence in the project area. Rest of the species are abundantly available and there is no problem of their survival.
Fish samples caught from the S0 site

Project : Environmental Studies for Vishnugad Pipalkoti Hydro-Electric Project Page: 81 Document : 2008026/EC/Final Report Date: Nov 2009 Chapter-3 : Baseline Environment, Impacts & Mitigation Measures Revision: R4
An extensive survey and experimental fishing at all the sampling sites (S0 -S5) revealed that the all the two species of Mahseer (Tor tor and Tor putitora) were not present at the sampling site above the dam site S0 and near the dam site S1 and just downstream to dam site S2. However the species of Schizothorax were present at these sites. These are not migratory in nature. However most of the fish species have shown their presence in rest of the sampling sites close to the Birahi River (S3, - S5). Therefore the endangered fish is not moving in the upper stretch of the project area. Therefore these fish species can be managed downstream through construction of hatchery or manipulating the way of the fish into the favorite habitat of Birahi River.
Experimental fishing in Alaknanda
It was confirmed through a rigorous exercise of experimental fishing that the Mahseer (Tor tor and Tor putitora) was not present at all at S0 (Confluence of Alaknanda & Dhauliganga), S1 (Dam site) and S2 (Patalganga). However, the secondary data and the local inhabitants reported that the Mahseer was noticed near Joshimath few years back. Now, there is no presence in any form (juvenile or adult) near the vicinity of Joshimath, submergence area and in vicinity of dam sites upstream and downstream. The quantitative estimation of two major fish components (Mahseer and Snow trout) has been presented in the Table 3.8.6 & 3.8.7. Data on the mean density (g.m-3) of Mahseer revealed that it was not at all present at S0, S1 & S2. However it fluctuated from 0.287 ± 0.065 to 0.492 ± 0.217 g.m-3. Maximum density was recorded at S5 (Birahi river). Table-3.8.6 Mean Density (g.m-3) of Mahseer (Tor tor ,Tor putitora) at different sampling sites (S0, - S5) estimated through experimental fishing (TSSN) method in the Alaknanda river in the stretch of VPHEP
S.No. Sampling Site Density (g.m-3)
x ± S.D
1 S0 Absent
2 S1 Absent
3 S2 Absent
4 S3 0.287 ± 0.065
5 S4 0.333 ± 0.122
6 S5 0.492 ± 0.287
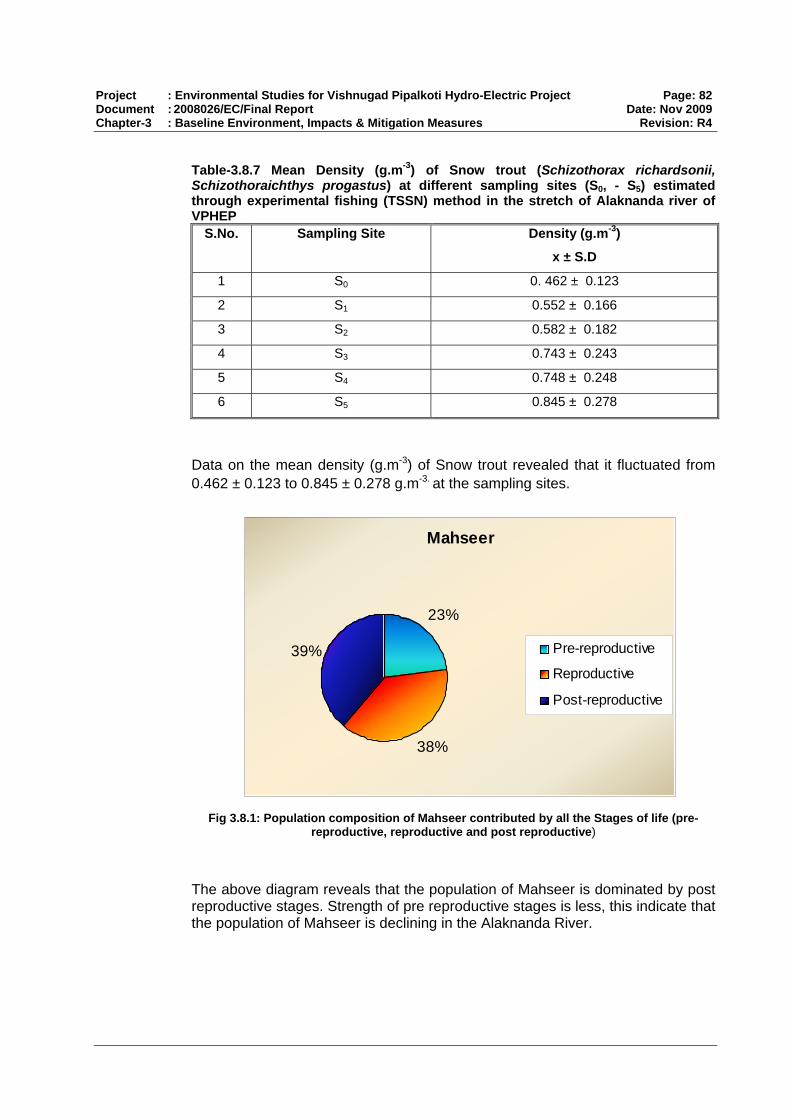
Project : Environmental Studies for Vishnugad Pipalkoti Hydro-Electric Project Page: 82 Document : 2008026/EC/Final Report Date: Nov 2009 Chapter-3 : Baseline Environment, Impacts & Mitigation Measures Revision: R4
Table-3.8.7 Mean Density (g.m-3) of Snow trout (Schizothorax richardsonii, Schizothoraichthys progastus) at different sampling sites (S0, - S5) estimated through experimental fishing (TSSN) method in the stretch of Alaknanda river of VPHEP
S.No. Sampling Site Density (g.m-3)
x ± S.D
1 S0 0. 462 ± 0.123
2 S1 0.552 ± 0.166
3 S2 0.582 ± 0.182
4 S3 0.743 ± 0.243
5 S4 0.748 ± 0.248
6 S5 0.845 ± 0.278
Data on the mean density (g.m-3) of Snow trout revealed that it fluctuated from 0.462 ± 0.123 to 0.845 ± 0.278 g.m-3. at the sampling sites.
Mahseer
23%
38%
39% Pre-reproductive
Reproductive
Post-reproductive
Fig 3.8.1: Population composition of Mahseer contributed by all the Stages of life (pre-
reproductive, reproductive and post reproductive)
The above diagram reveals that the population of Mahseer is dominated by post reproductive stages. Strength of pre reproductive stages is less, this indicate that the population of Mahseer is declining in the Alaknanda River.

Project : Environmental Studies for Vishnugad Pipalkoti Hydro-Electric Project Page: 83 Document : 2008026/EC/Final Report Date: Nov 2009 Chapter-3 : Baseline Environment, Impacts & Mitigation Measures Revision: R4
Snow trout
72%
18%
10%
Pre-reproductive
Reproductive
Post-reproductive
Fig 3.8.2: Population composition of Snow trout contributed by all the Stages of life (pre-
reproductive, reproductive and post reproductive)
The population of Snow trout is dominated by pre-reproductive stages (juveniles). Strength of post reproductive stages is less, this indicate that the population of Snow trout is expanding in the Alaknanda River. Habitat diversity of the aquatic ecosystem was rich in terms of presence of rapids, riffles and pools in the Alaknanda river and its interconnected tributaries.
Pool having juveniles of fish in Alaknanda
Confluence of Birahi River with Alaknanda River
3.8.5 Migration Route and the Period of Migration of Mahseer in the Alaknanda River The two species of Mahseer (Tor tor and Tor putitora) reported from the project area are endangered and migratory in nature. A sincere attempt has been made
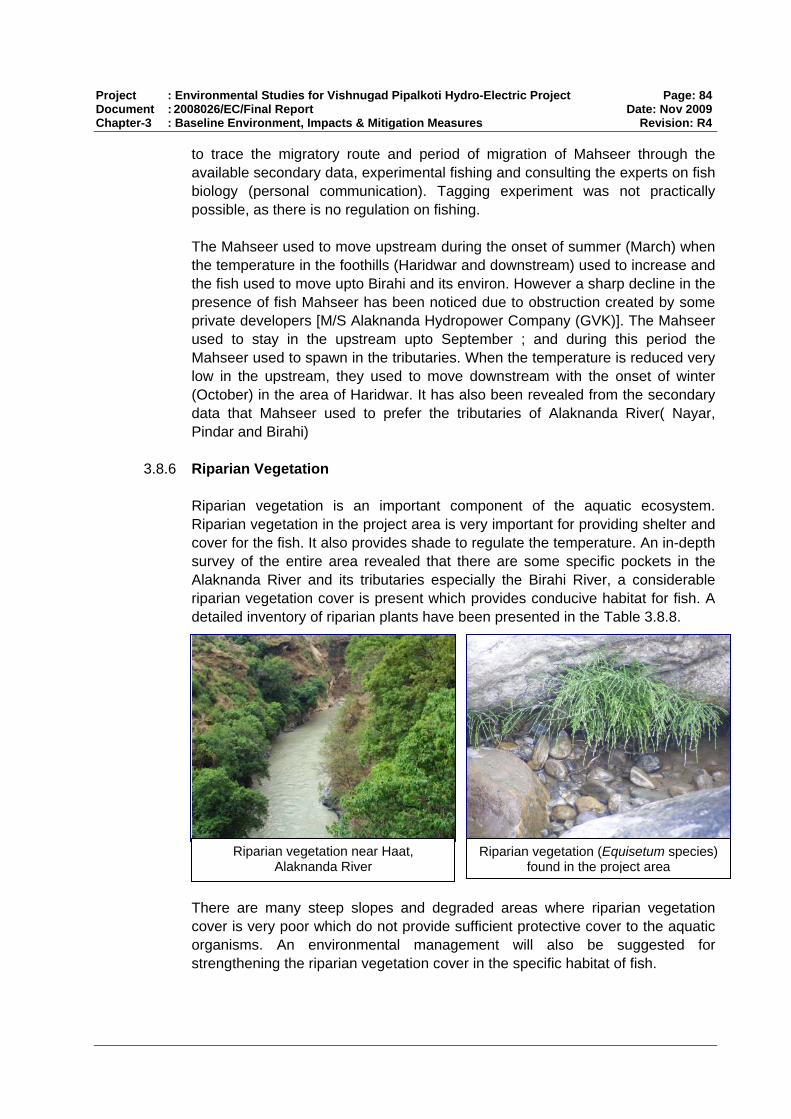
Project : Environmental Studies for Vishnugad Pipalkoti Hydro-Electric Project Page: 84 Document : 2008026/EC/Final Report Date: Nov 2009 Chapter-3 : Baseline Environment, Impacts & Mitigation Measures Revision: R4
to trace the migratory route and period of migration of Mahseer through the available secondary data, experimental fishing and consulting the experts on fish biology (personal communication). Tagging experiment was not practically possible, as there is no regulation on fishing. The Mahseer used to move upstream during the onset of summer (March) when the temperature in the foothills (Haridwar and downstream) used to increase and the fish used to move upto Birahi and its environ. However a sharp decline in the presence of fish Mahseer has been noticed due to obstruction created by some private developers [M/S Alaknanda Hydropower Company (GVK)]. The Mahseer used to stay in the upstream upto September ; and during this period the Mahseer used to spawn in the tributaries. When the temperature is reduced very low in the upstream, they used to move downstream with the onset of winter (October) in the area of Haridwar. It has also been revealed from the secondary data that Mahseer used to prefer the tributaries of Alaknanda River( Nayar, Pindar and Birahi)
3.8.6 Riparian Vegetation Riparian vegetation is an important component of the aquatic ecosystem. Riparian vegetation in the project area is very important for providing shelter and cover for the fish. It also provides shade to regulate the temperature. An in-depth survey of the entire area revealed that there are some specific pockets in the Alaknanda River and its tributaries especially the Birahi River, a considerable riparian vegetation cover is present which provides conducive habitat for fish. A detailed inventory of riparian plants have been presented in the Table 3.8.8.
Riparian vegetation near Haat, Alaknanda River
Riparian vegetation (Equisetum species) found in the project area
There are many steep slopes and degraded areas where riparian vegetation cover is very poor which do not provide sufficient protective cover to the aquatic organisms. An environmental management will also be suggested for strengthening the riparian vegetation cover in the specific habitat of fish.

Project : Environmental Studies for Vishnugad Pipalkoti Hydro-Electric Project Page: 85 Document : 2008026/EC/Final Report Date: Nov 2009 Chapter-3 : Baseline Environment, Impacts & Mitigation Measures Revision: R4
Viola canescens and Acorus calamus were assigned the status of rare riparian plant species. These two rare species were noticed only from the catchment of Patalganga. The other riparian species were common in nature.
Table 3.8.8: Riparian vegetation reported along the Alaknanda River and its Tributaries in the Project Stretch
S. No. Name Common name Conservation status1. Ageratum conzoides Goatweed/ Gunriya Common 2. Anagallis arvensis Red pimpernel Common 3. Phyla nudiflora - Common 4. Ranunculus scleratus Celery-leaved buttercup Common 5. Rumex hastatus Bhilmora Common 6. Artemisia capillaris Pati Common 7. Stephania elegans Gindalu Common 8. Urtica parviflora Kandali Common 9. Drymaria cordata - Common 10. Bistorta vaccinifolia - Common 11. Polygonum chinense Jangli palak Common 12. Viola canescens Vanfsa Rare 13. Nasturtium officinalis - Common 14. Potentilla sundarica Bajradanti Common 15. Acorus calamus Vacha Rare 16. Cyperus rotundus Coco-grass/ Muthanga Common 17. Cyperus iria Sedge/ Murya Common 18. Phragmites kakara Reed / Naal Common 19. Stellaria media Chick Weed Common 20. Saccharum arundinaceum Munja Common 21. Cirsium arvense Creeping Thistle Common 22. Eclipta prostrata False Daisy Common 23. Mazus pumilus Japanese Mazus Common 24. Aeginetia indica Aankuri , Bankuri Common 25. Sorghum miliaceum - Common 26. Eupatorium adenophorum Basinga Common 27. Equisetum sp. Horsetail Common
Source: Survey carried out by CES
3.8.7 Assessment of Impact on Aquatic Ecology & Mitigation Measures The study stretch between the dam construction site and the powerhouse construction site is rich in biodiversity. The aquatic ecology of this region will be affected by the dam construction activities mainly at the dam site and the site of powerhouse. Other areas are not likely to be affected severely Impact on Aquatic Ecology Construction Phase During the construction phase the water of the river will be not stored and the natural flow of the river will be available throughout the stretch. However, the

Project : Environmental Studies for Vishnugad Pipalkoti Hydro-Electric Project Page: 86 Document : 2008026/EC/Final Report Date: Nov 2009 Chapter-3 : Baseline Environment, Impacts & Mitigation Measures Revision: R4
area near the dam site will be affected due the construction activities. The construction activities also involve large scale extraction of different types of construction material from the river bed including boulders, stones, gravel, sand, etc. Extraction of gravel and sand causes considerable damage to fish stocks and other aquatic life by destabilizing the sub-stratum, increasing the turbidity of water, silting of the channel bottom and modifying the flow which in turn may result in erosion of the river channel. These alterations are likely to upset the composition of aquatic organisms and the stability of the ecosystem. The material at the river sub-stratum like stones and pebbles provide anchor and home to the invertebrates which remain attached in a fast flowing stream. Huge quantity of debris will be generated. The debris sites are located close to river and may flow down the river during heavy rain. During the fish spawning season, the fertilized eggs are laid amidst the gravel so that the eggs are not washed away in fast flowing stream. The eggs of almost all the species are sticky in nature, which provide additional safety. The turbidity in excess of brought by suspended solids chokes the gills of young fish and adversely affects the development of fish eggs and the juveniles of the fish. Temporary and permanent residential structures will be constructed in the project area to accommodate labour and staff engaged in the project. This would result in generation of domestic waste water which is likely to be discharged into the river and degrade the water quality. Mitigation measures
The dam construction will block the local movement of the species Schizothorax (Snow trout). However tributaries like Patalganga and Birahi Ganga may provide habitat to the population of these species in the area. Scientific management of the existing stock needs to be adopted for Conservation of the species. The stocking program can be done annually by the Forest Department GoUK /Directorate of Cold Water Fisheries (DCFR), ICAR, Bhimtal.
Fish management program will be undertaken by THDC Ltd. in consultation
with Forest Department GoUK / Directorate of Cold Water Fisheries (DCFR), ICAR, Bhimtal. In this regard THDC has already consulted the DCFR, ICAR, Bhimtal. The Senior Scientist from DCFR Bhimtal have already visited the project site for identification of suitable site for establishment of Snow Trout hatchery for fulfillment of fishery action plan towards restoration of aquatic ecosystem. The MoU for implementation of Fishery Action Plan is under process.
The sampling site S0 at Vishnuprayag was selected in the Alaknanda river
above the dam construction site for verifying the presence of Mahseer in the area. But, Mahseer was not found to occur in the Alaknanda River in the

Project : Environmental Studies for Vishnugad Pipalkoti Hydro-Electric Project Page: 87 Document : 2008026/EC/Final Report Date: Nov 2009 Chapter-3 : Baseline Environment, Impacts & Mitigation Measures Revision: R4
project stretch in upstream (S0, S1) and downstream (S2) of dam site during the period (Nov -2008-May 2009). It indicates that migratory fish Mahseer does not reach above the dam construction site. The representation of migratory fishes is very poor (4-6%). Therefore, a lot of effort and time is required for accurate quantitative estimation of these fishes in the area. It is suggested that a fish assessment study should be continued in construction phase. The Mahseer hatchery already constructed at Tehri can be used for propagation of Mahseer.
The muck disposal plan should be implemented properly in the project area
as the sites are close to the river Alaknanda and possibilities of sliding of muck into the river should be avoided. The retaining walls should be constructed before disposal of muck at the site.
The dust generated from stone crushers / other activities should be
subsidized with the water sprinklers.
Due to perennial nature of river Alaknanda, it maintains sufficient flow through out the year. The available flow is sufficient to dilute the sewage and no adverse impact on water quality is anticipated. However, the sewage generated from various labour camps must be treated before discharging into river Alaknanda or nearby surface water body.
Operation Phase
Significant changes will occur in the riverine ecology, the river transforms from a fast-flowing water system to a quiescent lacustrine environment. Such modification will adversely affect biotic life of the river. The biotic communities, which, however, for varied reasons related to feeding and reproductive characteristics cannot acclimatize to the changed environment, may disappear in the early years.
The initial stretch of the project from Dam site to Tapan nala (approx 3km)
will be the critical stretch due to low water availability. The low flow in the river will affect the habitats which are located along the shallow banks. The flow in the downstream stretch of dam would be reduced considerably, will leave areas dry and the river water will remain in the centre of the river channel.
The dam will hinder the local movement of the fish.
During the lean period, segment of river between dam site and tail race at
certain places may retain some water in shallow pools subjecting the fish to prey by birds and human beings. Such situations will result in indiscriminate fishing.

Project : Environmental Studies for Vishnugad Pipalkoti Hydro-Electric Project Page: 88 Document : 2008026/EC/Final Report Date: Nov 2009 Chapter-3 : Baseline Environment, Impacts & Mitigation Measures Revision: R4
Mitigation measures
Tributaries like Patal Ganga, Garur Ganga and Birahi are perennial streams
and have sufficient water discharge in addition to rich aquatic biodiversity, which may be able to support the aquatic biodiversity by providing suitable breeding, spawning and feeding grounds to the most of the fishes found in the Alaknanda river.
Birahi River has many small pools which may serve as the spawning
grounds for fish. However, the location, presence, size shape may alter over time due to continuous change in the river morphology as a result of frequent flash floods in Himalayan rivers. The presence of young ones in the Birahi river confirms the movement of fish in the area.
Mahseer is a migratory fish and comes in the Akaknanda and its tributaries in
search of feeding and breeding grounds. In the event that Mahseer do in fact appear in the project area, efforts for complete diversion of route of Mahseer towards Birahi River may be made for effective management of Mahseer and other vulnerable fishes in the region. The Birahi is the most favorable habitat for Mahseer It provides suitable conditions for the survival of its young ones. The catchment of Birahi river can be improved by plantation along the bank. The anthropogenic activity like extraction of sand, pebbles, gravels and stones and fishing activity in the river should be completely banned. Efforts for complete diversion of route of Mahseer towards Birahi river may be made for effective management of Mahseer and other vulnerable fishes in the region.
It will be mandatory for the project authorities to maintain the minimum flow
for the survival and propagation of invertebrates and fish. In order to avoid the possible loss of aquatic life, a minimum flow of 3 cumecs shall always be released from the dam. Desired flow will be maintained downstream of the dam for survival of aquatic life. In the downstream of dam site, seasonal and perennial tributaries such as Tapon Gad, Patal Ganga, Garur Ganga, Maina Gad and Birahi ganga having good discharge, meet the Alaknanda river. The water from these streams will add to the flow of the river. However, during lean period, extra release besides 3 cumecs from the Dam needs to be explored.
Ban on fishing should be enforced in the affected stretch of river during lean
season and critical period of spawning season (September/October and March/April).
It is recommended to treat the sewage generated from the colony area
before discharging into the river. Discharge of untreated sewage into the river must be strictly prohibited.

Project : Environmental Studies for Vishnugad Pipalkoti Hydro-Electric Project Page: 89 Document : 2008026/EC/Final Report Date: Nov 2009 Chapter-3 : Baseline Environment, Impacts & Mitigation Measures Revision: R4
Since there are series of dams in the area, a detailed aquatic study is required in the Alaknanda river for understanding the cumulative impact on fisheries / aquatic life due to various Hydro Power Projects. Coordination among all the developers is required to maintain the aquatic life in the area.
The environmental measure for fish management is given in Chapter 4-
EMP, Section 4.7.

Project : Environmental Studies for Vishnugad Pipalkoti Hydro-Electric Project Page:90 Document : 2008026/EC/Final Report Date: Nov 2009 Chapter-3 : Baseline Environment, Impacts & Mitigation Measures Revision: R4
3.9 TERRESTRIAL BIODIVERSITY
Biodiversity encompasses the variety of all life on earth. India is one of the 12-mega diverse countries of the world. The diversity of physical features and climatic conditions in India has resulted in diverse ecological habitats like forests, grasslands, wetlands, coastal and marine ecosystems and desert ecosystems which harbors and sustain massive components of bio-diversity. Bio-geographically, India is situated at the tri-junction of three realms the Afro-tropical, the Indo-Malayan and the Paleo-Arctic realms. Because of its unique proximity to all three realms, India possesses a unique assemblage of characteristic elements of biodiversity from each of them. Exuberant
3.9.1 Background
The floral diversity of India is represented by 47,000 species of flowering and non-flowering plants which is about 12% of the world’s flora. The faunal diversity is comprised of a total number of 90,000 animal species (Annual Report, 2007-08, National Biodiversity Authority). The forests in India can be divided into 16 major groups comprising 221 types of forests.
The state of Uttarakhand can be broadly divided into four topographical regions as: Plains of Haridwar, Udhamsingh Nagar, Dehradun district, Bhabar & Tarai area of Dehradun and Nainital, Middle Himalayan region, Higher Himalayas and Trans Himalayas. The plains of the state are endowed with rich & fertile soils while the hills are characterized by undulating & rugged topography with varied climate, soil texture, limited land for cultivation, predominance of scattered and marginal land holdings, terrace farming and higher units cost of infrastructure development. The major land cover of the state is under forests followed by agriculture. As terrain and topography of the state is largely hilly with large areas under snow cover and steep slopes, a substantial portion of land cover is not accessible for agriculture
3.9.2 Biodiversity Assessment Methodology
The objective of ecological survey is to collect the baseline terrestrial biodiversity status regarding flora and fauna in the Project Influence Area, (7 Km surrounding the project site), Project Immediate Affected Area (500 m on both sides along the project sites) and Project Affected Area Terrestrial Ecosystem The terrestrial eco-system of the study area is dominated by forest on hills, foothills and river valley. The details of assessment techniques used are discussed below
i Flora Assessment
To characterize the vegetation under the project area study was carried out by using Standard Quadrat Method and Random Sampling approach was followed. Quadrat size of 10 x10m used for tree species and 5x5m was used for shrub species. For grasses and herbs 1×1m quadrats were used. The properties of vegetation with reference to species composition and functional attributes are expressed on species basis. The specific formats used to collect information regarding flora & fauna of the project / study area (Annexure - 3.9.1). The details of forest studies are discussed in details below

Project : Environmental Studies for Vishnugad Pipalkoti Hydro-Electric Project Page:91 Document : 2008026/EC/Final Report Date: Nov 2009 Chapter-3 : Baseline Environment, Impacts & Mitigation Measures Revision: R4
Assessment Techniques
The density measurements reflect as to how many individuals were present, the dominance measurements denote which species is largest in terms of its presence and the frequency measurements indicate how widely species is distributed among the same plots Importance value is a reasonable measure to assess the overall significance of a species since it takes into account several properties of the species in the vegetation. Importance value index will be calculated as per Curtes & Mc Intosh (1950). The following parameters will assessed from the field data measurements.
Number of species A
(i) Density = Area sampled Number of plots in which species A occurs
(ii) Frequency = Total no. of plots sampled
Total cover or basal area of species A (iii) Dominance = Area sampled Density of species A (iv) Relative density = X 100 Total density of all species Frequency value for species A (v) Relative frequency = X 100 Total of all frequency values for all Species Dominance for species A (vi) Relative dominance = X 100 Total Dominance of all species
(vii) Importance value Index = (relative density + relative dominance+ relative frequency)
Shannon – Wiener Index
The number of species and number of individuals in a community is measure of species diversity which depends on stability of the habitat. Vegetation of the study area was assess by determining Shannon – Wiener diversity index (1963)
H = -Σ (ni / n) logIn (ni / n)
ni = Number of individuals of each species in the sample
n = Total number of individuals

Project : Environmental Studies for Vishnugad Pipalkoti Hydro-Electric Project Page:92 Document : 2008026/EC/Final Report Date: Nov 2009 Chapter-3 : Baseline Environment, Impacts & Mitigation Measures Revision: R4
ii Fauna Assessment
The fauna assessment technique followed during study varied with type of animal present. The domestic animals were listed based on direct observation during field survey. The list of wild life was obtained from Kedarnath Forest Division Gopeshwar and Badrinath Forest Division Gopeshwar, as well as onsite observations (direct/ indirect method). On the basis of onsite observations as well as forest department records a checklist of fauna was prepared. Birds were identified with the help of a binocular.
iii Public Consultation
The public consultation was conducted during survey of the project/ study area to know about various aspects of forest studies. Information about uses of various plant species by local people as well as sighting of any wildlife species, uses, poaching etc. were obtained.
3.9.3 Biodiversity of Uttarakhand State
The forests vegetation of the Uttarakhand ranges from tropical dry deciduous forests in the foothills to alpine meadows above timberline. The enriched biodiversity of the state is reflected through its state symbols. Forests diversity is the main source of livelihood of the people of Uttarakhand. Biodiversity is used variously for fodder, fuel wood, timber, leaf litter for crop manure, construction, industrial raw material and several non timber forests produce.
State Symbols State Tree: Rhododendron arboreum (Burans)
State flower: Saussures obvallata (Brahm Kamal)
State animal: Moschus chrysogaster (Musk Deer)
State Bird: Lophophorus impejanus ( Monal)
Forests
The state Uttarakhand is covered with rich forests. The recorded forest area of the state is 34, 662 Sq.Km which constitute 64.79 % of its geographic area of the state. 8 out of 16 forests types existing in India are found in Uttarakhand. Natural Flora
Remarkable variation in altitude and forests types resulted in diversity of flora recorded through out the state. The floristic diversity of the Uttarakhand state is represented by a total number of 4,048 species belonging to 1,198 genera and 192 families. The angiosperm is comprised of 4,000 species while gymnosperm of 48 species. It is estimated that nearly 116 species are endemic to the state. The state harbours 161 rare and threatened species as per the IUCN guidelines. More than 350 species of plants are threatened and endangered in all forested area of the state. Most of these threatended plant species occur on the hills and are over exploited for medicinal, aromatic or commercial values.

Project : Environmental Studies for Vishnugad Pipalkoti Hydro-Electric Project Page:93 Document : 2008026/EC/Final Report Date: Nov 2009 Chapter-3 : Baseline Environment, Impacts & Mitigation Measures Revision: R4
Dense Forest in Kedarnath Forest Dense Forest in Nainital Region Primary and tertiary forests are located at higher altitudes. These forests are dense and thick lower story is also present in Oak forest. The Forest near habitats and lower elevations are secondary and are disturbed due to human activities and frequent fire. Agriculture is the main source of livelihood of the people of the state, more than 75% are engaged either in agriculture or its allied practices. Cultivation in the state is done mainly in the narrow patches of terraced fields on hilly slopes. The principle crops are wheat, rice, millets, barley, pulses and oil seeds. The state has proved to be suitable for growing different types of temperate, sub-tropical and tropical fruits. Temperate fruits such as apple, pear, peach, plum, apricot, cherry and walnut are grown in the places of 1000 – 3000 m altitude. Other fruits grown in the state are citrus, mango, guava, papaya and strawberry. Among vegetables potato is the most important cash crop. Natural Fauna
The variation in altitude, forests types and vegetation leads to the variation in faunal diversity of the state. Faunal diversity of the state is represented by a total number of 2,248 species of which 1045 are invertebrates and 843 vertebrates. The state is a home for many species of pisces (124), amphibian (19), reptelia (69), aves (521) and mammals (102). The richness of fauna is distinctly higher in forests zone especially in the broad-leaf wet forests. Sambar, Dear, Wild Boar in the sub-tropical foot hills ; Musk dear, Serow, Thar, Koklas and Monal Pheasants in the temperate and sub-alpine region and in alpine region are Bharal, Snow Leopard, Brown Bear and Snow Cock are some of the significant wildlife of the state.
Musk Deer
The domestic animals are represented by common livestock. Livestock rearing along with agriculture is the main occupation of people. Sheep & goats are reared in high altitudinal region. Pasture lands are usually above 2000 m while in winter they move down ward to river valleys or low-lying areas. Cows are reared in the middle and low

Project : Environmental Studies for Vishnugad Pipalkoti Hydro-Electric Project Page:94 Document : 2008026/EC/Final Report Date: Nov 2009 Chapter-3 : Baseline Environment, Impacts & Mitigation Measures Revision: R4
altitudinal regions and are the major source of milk. Buffaloes are major source of milk & milk products. Goat, sheep, horse, mule, donkey and pony are used for transportation of goods.
THREATS TO BIODIVERSITY OF UTTARAKHAND
Uttarakhand has rural population of 74.33%. The total number of inhabited villages, including forest villages, is 15,761 (Census 2001). The rural population is primarily dependant on agriculture based economy for livelihood. Rural population depends largely on forest for their day-to-day demands of life such as fuel, fodder, grazing, timber etc. In view of this, demand of timber, fuel, fodder, medicinal plants or non timber forest produces is borne only by a few choice species, the major threat to their continued survival.
BIODIVERSITY DEGRADATION
NATURAL CAUSES ANTHROPOGENIC CAUSES
Forest Fire
Adverse climatic Conditions
Pathogens
Invasion by Weeds
Construction activities- roads, hydropower, etc
Illegal Poaching
Horticultural Encroachment
Grazing Pressure
Expansion of Agriculture Land
Fig: Existing Threats to Forest
Biodiversity in the state is under tremendous pressure due to various social issues related to agriculture, horticulture and construction activities. The area under Horticulture is 181,745 ha. Important horticultures crops of the state are Apple, Apricot, Walnut, Guava, Pomegranate, Peach, Litchi and Mango. The increase area is derived either from agriculture land or forest clearance and thus associated with loss of forest and thereby biodiversity. In the hills the major crops grown include wheat, paddy, madua, ramdana and potato whereas in the plains the major crops are wheat, paddy, pulses and sugarcane

Project : Environmental Studies for Vishnugad Pipalkoti Hydro-Electric Project Page:95 Document : 2008026/EC/Final Report Date: Nov 2009 Chapter-3 : Baseline Environment, Impacts & Mitigation Measures Revision: R4
History of Deforestation
Although Uttarakhand is a small state within India, there are ranges of altitude, climate and geology that contribute rich and diversified flora of the state. At present 46.93 percent is under tree cover out of which 45.70 percent is under forest cover and 1.23 percent is under tree cover in small patches of trees in farms, homesteads, urban areas or along roads, canals bunds etc. Forest Survey of India (FSI) an organization of Ministry of Environment and Forests (Government of India) is engaged in generating information and database on forest cover and forest resources in the country. The status of forest covers in Uttarakhand since 2001 is presented below:
Table 3.9.1: Assessment of Forest Cover of Uttarakhand
Year of Assessment Area Under Forest Cover (Km2) 2001 23,938 2003 24,460 2005 24,442
Source: State of Forest Report 2005 The forest cover has increased from year 2001 to 2005. Only in district Haridwar, Nainital and Uddhamsingh Nagar a decrease in forest cover was observed. The loss in forests cover in Haridwar district is attributed to the rehabilitation of the Gujjars and the Tehri dam outsees. In districts Nainital and Uddhamsingh Nagar athe loss is due to the rotational felling of Eucalyptus & Poplar plantation by State Forest Department.
Change of Forests Cover in Uttarakhand
Source. State of Forests Report 2005, FSI
Year Dense Forest (Sq. Km)
Mod. Dense
Open Forest (Sq. Km)
Total Forest (Sq. Km)
2003 4,002 14,409 6, 049 24,460
2005 4,002 14,396 6, 044 24,442
Change in Forest cover
0.00 -13 -5 - 18
0
5,000
10,000
15,000
20,000
25,000
2001 2003 2005
Dense Forest sq.km Open Forest sq. km
Fig: Change in Forests Cover of Uttarakhand

Project : Environmental Studies for Vishnugad Pipalkoti Hydro-Electric Project Page:96 Document : 2008026/EC/Final Report Date: Nov 2009 Chapter-3 : Baseline Environment, Impacts & Mitigation Measures Revision: R4
The large scale block plantation schemes undertaken by forest department have resulted in an overall increase of forest cover from year 2001-08. The plantation carried out by Forest Dept in last ten years under departmental plantation, natural regeneration and extensive tree plantation programme is given below.
Table 3.9.2: Plantation carried by Forest Department in Uttarakhand S.No Year No. of Plants in Lakh
1 1997-98 85 2 1998-99 98.03 3 1999-2000 94.15 4 2000 -01 61.54 5 2001 -02 88.88 6 2002 -03 108.77 7 2003 -04 145.70 8 2004 -05 154.66 9 2005 -06 260.06 10 2006 -07 255.06
Total 1351.80 Source .www.uttarakhandforest.org
The tables given below illustrate the plantation carried in Badrinath and Kedarnath Forest Division.
Table 3.9.3: Plantation Carried in Kedarnath Forest Division
S.No. Year Total No. 1 2000-01(Chamoli dt) 92700 2 2000-01(Rudraprayag dt) 217,592 3 2001-02 45,100 4 2002-03 60,500 5 2004-05 49,500 6 2005-06 77,000 7 2006-07 55,000 8 2007-08 (Chamoli dt) 355,5176 9 2007-08 (Rudraprayag dt) 70,090
Source: Kedarnath Wildlife Division, Gopeshwar, 2008
Table 3.9.4 : Plantation Carried in Badrinath Forest Division
S.No. Year Total No. 1 2000-01 112.370 3 2001-02 118,000 4 2002-03 120,000 5 2003-04 240,000 6 2004-05 820,000 7 2005-06 324,000 8 2007-08 Chamoli range 1040,000 9 2007-08 Nandprayag range 98,000 10 2007-08 W. Pinder range 60,000 11 2007-08 C Pinder range 60,000 12 2007-08 E Pinder range 392,000
Source: Badrinath Forest Division, Gopeshwar, 2008
Project : Environmental Studies for Vishnugad Pipalkoti Hydro-Electric Project Page:97 Document : 2008026/EC/Final Report Date: Nov 2009 Chapter-3 : Baseline Environment, Impacts & Mitigation Measures Revision: R4
BIODIVERSITY CONSERVATION INITIATIVES TAKEN BY GOI & GOUA
In order to protect rich biodiversity of country which plays significant role in livelihood & cultural sustenance of the country, Government of India, under Ministry of Environment & Forests (MoEF) constituted National Biodiversity Strategy & Action Plan (NBSAP) a, firm step towards addressing the various issues related to the use, status and conservation needs of biodiversity in the country. Under this initiative, it has been envisaged to produce a series of planning documents dealing with various facts related to the conservation of National Biodiversity. The biodiversity of India has been globally ranked amongst the 12-megadiversity countries and two of its bio-geographic provinces. These are all government initiatives and approximately 5% of the country’s surface area has been successfully declared as legally protected areas. In order to conserve the rich biodiversity of the State the Government of Uttarakhand constituted State Biodiversity Board in 2006.
(a) Legislative Approach
Uttarakhand has also adopted the National Forest Policy (1980) that seeks to integrate biodiversity conservation and sustainable use by local people. A complete ban on hunting (1982) and green felling (1984) has been imposed in the state. A number of legislation having a bearing on biodiversity conservation in the state have been enacted in the state. Some of these are as below Indian Forest Act 1927.
Wildlife (Protection), Act 1972,
Forest Conservation Act, 1980
Environmental Protection Act, 1986
Water (Prevention & control of Pollution) Act 1974
Air (Prevention & control of pollution) Act, 1981
Bio- diversity Act, 2002
Bio- diversity Rule, 2004
(b) Management Level Approach
At management level, conservation of biodiversity now forms an integral part of Forest working plan, Management plans for the National Park and Wildlife sanctuaries lay special emphasis on conservation of biodiversity. Some of the important schemes implemented by the Govt. are (i) Van Panchayats
(ii) Joint Forest Management
(ii) Eco-development in and around protected areas
(iii) Development of Minor Forest Produces
(iv) Bamboo and Fibre Development Board
(v) Ecotourism
(vi) Clean Development Mechanism (CDM) Cell

Project : Environmental Studies for Vishnugad Pipalkoti Hydro-Electric Project Page:98 Document : 2008026/EC/Final Report Date: Nov 2009 Chapter-3 : Baseline Environment, Impacts & Mitigation Measures Revision: R4
(vii) Establishment of Biosphere Reserve, National parks, Wildlife Sanctuaries
( c ) Conservation of Medicinal Plants
The National Medicinal Plant Board was set up on 24th November 2000 with the objectives for co-ordination of all matters relating to medicinal plants, including drawing up policies and strategies for conservation, proper harvesting, cost-effective cultivation, research and development, processing, marketing of raw material in order to protect, sustain and develop this sector. National Medicinal Plants Board has set up a Task Force on High Altitude Medicinal Plants to deal with the following issues:
Survey, Inventorisation and documentation of medicinal plants resources
Identification of critical gaps in R&D and recommend projects & institutions to bridge such gaps
Developing institutional linkages
Capacity building and awareness
Involvement of Civil Society of Organisations working in the field and leverage their strengths
Identify regulatory problems in promoting conservation and cultivation and recommend appropriate amendments to the existing Acts/ Regulations
Developing market linkages and value addition
Developing strategy to promote in-situ/ex-situ conservation
The government of Uttarakhand has set up a State Medicinal Plant Board (SMPB) in the lines of National Medicinal Plants Board for coordination of various activities and technical inputs to various programmes. Some of the medicinal plants found in Uttarakhand are given in the table below
Table 3.9.5: Medicinal Plants of Uttarakhand
Common Name Scientific Name Uses
Dhaula Woodfordia fruiticosa Stomachic, in cough
Daya Calicarpa macrocephala Anti helmantic
Reetha Sapundus mukurossi Emetic, epilepsy & as fish poison
Calendula Calendula arvensis In herbal cosmetics
Safed musli Chlorophytum borivilianum Roots as tonic
Kali musli Curcilago orchides Root as tonic
Babchi Psoralea corylifolia Antilecuodermal properties
Tagar/Samyo Valeriana wallichii Oil nerve stimulent
Bach Acorus calamus Anti- bronchial,cough
Kapoor tulsi Ocimum kilimandscharicum In fever,cough & cold, insecticidal
Saunf Foeniculum vulgare Stomchic ,Carminative
Tejpat Cinnamomum tamala As condiments
Upania jhar Chenopodium ambrosioides Insecticidal and repellent properties

Project : Environmental Studies for Vishnugad Pipalkoti Hydro-Electric Project Page:99 Document : 2008026/EC/Final Report Date: Nov 2009 Chapter-3 : Baseline Environment, Impacts & Mitigation Measures Revision: R4
Common Name Scientific Name Uses
Pati Artemisia nilagarica Insect repellent, anthelmintic
Dhungar Allium ascalonium Carminative, gastric properties
Genda Tagetes errecta Insect repellent properties
Geranium Pelargonium graviolense Perfumery value
Ban ajwain Thymus serpyllum Germicidal, in burns
Lahsun jangli Allium ampeloprasum In rheumalism
Citronella grass Cymbopogon winterianus Perfumery value
Lemon Grass Cymbopogon citratus Perfumery value, fungicidal properties
Kali tulsi Ocimum basilicum In fever,cough & cold
Pati Artemisia maritema Insecticidal properties, anthelmintic
Jambo/faran Allium tuberosum In cold, carminetive
Ashwagandha Withania somnifera Tonic,adaptogenic
Ghritkumari Aloe barbadensis Anti asthamatic,skin diseases
Visnasa Ammi majus Anti leucoderma
Digitalis Digitalis purpurea In heart diseases
Kuth Saussurea lappa Asthma,carminative
Bajardanti Potentila fulgens Anti tooth ache
Vashaka Adhatoda vasica Antibronchitis & cough
Satvar Asparagus officinails Tonic,antidysentry
Pivsokha Leucas lanata In boils & eczema
Pashar bhed Bergenia ligulata In dissolving kidney stones, anti diarrohea
In recent times natural environment of this region has been effected due to population pressure, changes in the weather pattern, irregular and overexploitation of herbs from their natural habitat which has resulted in the depletion of many high value medicinal herbs to the stage of extinction
Factors responsible for depletion of Medicinal plants
I. Over and indiscriminate exploitation of medicinal plants from its natural resources
II. Shrinking of natural homes of these herbs
III. Lack of agro technology and commercial scale cultivation.
IV. Illegal trading.
V. Excessive grazing.
VI. Improper and unscientific methods of collection.
VII. Forest fire etc.
VIII. No assured marketing.

Project : Environmental Studies for Vishnugad Pipalkoti Hydro-Electric Project Page:100 Document : 2008026/EC/Final Report Date: Nov 2009 Chapter-3 : Baseline Environment, Impacts & Mitigation Measures Revision: R4
The raw plants parts are being collected by “Jila Sahkari Bheraj Sangh "working in each district of the state. They are collecting herbal plants through unskilled and unqualified labors, but due to lack of knowledge of their proper method of collection and over exploitation (destructive collection) many economically important and highly demanded medicinal plants are overexploited and are under endangered stage. Herbal Research and Development Institute (HRDI) is set up in Gopeshwar in 1992 to check the illegal trade in herbs by scientifically encouraging their cultivation in central Himalayas. The measures suggested for conservation of medicinal plants is given in the box below.
Measures to be taken to Conserve Medicinal Plants
I. Development of Agro- technology of highly demanded medicinal plants and their large scale cultivation.
II. Ban on endangered medicinal plants should be materialized by district administration
III. The laborers and other persons engaged in collection of crude medicinal plants should be trained for scientific method of collection.
IV. Medicinal plants rich areas should be protected as natural reserve sanctuaries
V. Forest should be protected from fire.
VI. People should be motivated for the conservation of medicinal plants
The benefits that are associated with the conservation of these medicinal herbs can be elaborated as follows:
Employment opportunities for the rural youth.
Boosting the industrial sector of the State. Overall economic benefits to the state.
3.9.4 Biodiversity of Alaknanda River Basin
The Alaknanda River is the major tributary of the river Ganga. The Alaknanda originates at a height of 3641 meters below Balakun peak 16 km upstream from Badrinath form the two glaciers of Bhagirath Kharak and Satopanth. The total catchment of the river Alaknanda upto dam site is 4672 km2. The Alaknanda valley is U –shaped in the initial stretches: a typical feature of glacial valleys. Saraswati river joins the Alaknanda at 9 Km downstream from Mana. Khilrawan Ganga joins it below the Badrinath Shrine and Bhuynder Ganga below Hanuman Chatti. Downstream small tributaries- Helong, Garud, Patal and Birahiganga join the Alaknanda between Joshimath and Chamoli. The rivers of Chamoli district generally flow with great force in steep and narrow channels often resulting in excessive erosion and collapse of the banks. Alaknanda River forms five major confluences given below. i. With Dhauliganga river at Vishnuprayag,
ii. With Nandakini river at Nandprayag,
iii. With Pindar river at Karanprayag,
iv. With Mandakini river at Rudraprayag
v. With Bhagirathi river at Devprayag.

Project : Environmental Studies for Vishnugad Pipalkoti Hydro-Electric Project Page:101 Document : 2008026/EC/Final Report Date: Nov 2009 Chapter-3 : Baseline Environment, Impacts & Mitigation Measures Revision: R4
Confluence of River Alaknanda & River Pindar at Karanprayag
View of River Alaknanda
Forest & Natural Flora
The unique geographical location climate and topography along with latitudinal variation of the area has endowed the Alaknanda basin with highly luxuriant and diverse flora. Depending upon the altitude and floristic combination Botanical survey of India, Dehradun identified 800 species of plant as a result of survey conducted in the area during past 4 years by P.K. Hajra and B. Balodi. The following major forest types have been identified:
i. Himalayan Sub tropical Pine (between 900 – 2000m)
ii. Temperate Forest (between 2000-2800).
iii. Sub alpine Forest (between 2800-3800m).
iv. Alpines land (above tree line between 3800-4500m).
v. Alpine meadows (above tree line in above 3800-4500m).
Out of the total forest cover of the Alaknanda Basin above 47% area is under dense forest ( 74% crown cover) followed by 35% not open cover (10-40% crown cover) and 17% under less than 10% crown cover.
(I) Himalayan Sub tropical Pine
This forest type occurs between 900m to 200m and is described in the section under Project Influence Area, Project Immediate Affected Area and Project Affected Area
(II) Temperate Forest Temperate Forest occurs between 2000-2800m and are of two types - Deciduous forests and Evergreen Forest
Deciduous forests include deciduous broad leaved species. The common tree species are Acer cappadocium, Juglans regia, Corylus jacquemontii, Celtis australis, Populus regia, Alnoides and Meliosma dilleniaefolia. Shrubs such as Rubus, Desmodium
Project : Environmental Studies for Vishnugad Pipalkoti Hydro-Electric Project Page:102 Document : 2008026/EC/Final Report Date: Nov 2009 Chapter-3 : Baseline Environment, Impacts & Mitigation Measures Revision: R4
elegans, Viburnum cortinifolium, Deutzia staminea and Arundinaria falcata are common in the middle layer
Evergreen forests which are found along with the deciduous forests are dominated by the Coniferous trees. Picea smithiana, Pinus wallichiana and Quercus floribunda are dominant species and middle canopy is dominated by Sarcococca saligna, Rosa moschata and Arundinaria falcata.
(III) Sub Alpine Forest Sub Alpine Forest occur between 2800-3800m and are of two types (a) deciduous forests which are distributed in Dudh Ganga, Lata Kharak, Sainikarak, Himtoli, Dibrughetta, Deodi Trishul nullah, Ramni, Bagnidhar, and Bhujgara. Acer acuminatum, Prunus comuta, Salix disperma, Populus ciliata and Sorbus foliolosa are the dominant tree species of the forest and supported by shrubs such as Rubes glaciale, Sarcococca saligna, Salix denticulate, Desmodium elegans, Viburnum cortinifolium, Rosa sericea, Lonicera werbiama, Rhododendron campanulatum, Syrina emodi, Sorbus foliolosa, Crotoneaster affine and Ailanthus nepalensis
Evergreen forest occurs in the same localities. These are dominated by Abies pindrow, Abies spectabilis, Pinus wallichiana and Taxus baccata. The other associates are Betula utilis, Prunus cornuta, and Acer acuminatum.
The middle layer is dominated by Salix elegans, Rosa macrophylla, Rosa serica, Lonicera augustifolia, Sorbus foliolosa, Berberis aristara, Inula cuspidata and Rubes himalayensis.
(IV) Alpine Scrubland
Above treeline, between 3800 and 4500m scrubs namely Rhododendron anthopogon, Rhododendron lepidotum, Rhododendron campanulatum, Juniperus indica, Juniperus recurva, Cotoneaster microphylla, Cotoneaster integrifolius, Berberis umbellate, Cassiope fastigiate, Salix karelinll, Salix hylematica, Salix calyculata, Salix lindleyana, Lonicera spinosa and Lonicera obovata are found growing luxuriantly and forms peculiar associations. The common associations are:-
(a) Rhododendron – Crotoneaster association includes species such as Rhododendron lepidotum, R. anthopogon, Cotoneaster microphylla and C. integrifolius.
(b) Piptanthus – Crotoneaster-Rhododendron association includes species such as Cotoneaster microphylla, Piptanthus nepalensis and Rhododendron lepidotum.
(c) Salix – Rhododendron association includes species such as Salix karelinii, S. hylematica, S. lindleyana and Rhododendron anthopogon.
(d) Juniperus – Lonicera association includes species such as Juniperus indica, J. recurva, Lonicera spinosa and L. obovata.
(e) Rhododendron – Cassiope association: species are Rhododendron anthopogon and Cassiope fastigiata.
(v) Alpine Meadows
Alpine meadows are mainly dominated by herbaceous species. Few scrubs such as Juniperus indica, Nicera obovata, Rhododendron anthopogon, Cassiope fastigiata, Salix hylematica and S. Rindleyana are found in the meadows.

Project : Environmental Studies for Vishnugad Pipalkoti Hydro-Electric Project Page:103 Document : 2008026/EC/Final Report Date: Nov 2009 Chapter-3 : Baseline Environment, Impacts & Mitigation Measures Revision: R4
The herbaceous species of the meadows are Tanacetum tomentosum, Iris kumaonensis, Nomocharis oxypetala, Artemisia maritime, Allium wallichii, A humile, A. stracheyi, Leontopodium himalayanum, Dactylorhiza hatagirea, Geranium wallichianum, Cortia depressa, Anaphalis contorta, A. busua, Sibbaldia purpurea, Rhodiola bupleuroides, Potentilla astrosanguinea, P. argyrophylla, Thymus linearis, Polygonum affix, Anemone rupicola, A. obtusiloba, Danthonia cachemiriana, Carex nubigena, C. nivalis, Pedicularis hoffmeisteri, P. bicornuta, Thalictrum alpinum, Lloydia serotina, L. longiscapa, Jurinea himalaica, Gentiana argentea, G.carinata, Geum roylei, Bupleurum candollei, Taraxacum officinale.
Natural Fauna
The Alaknanda Basin has a wide variety of mammals & birds. An account of 17 known rare & endangered of mammals is given by Sathya Kumar (1993) who added 3 more species to the earlier record of Tak & Lamba (1985) and Lamba (1987). The important mammals are Snow Leopard (Panther uncia) (Dang 1967), Kachan 1978, Kandan (1982), Himalayan black bear (Selenarctos thibetanus), Himalayan brown bear (Ursus aretos) Himalayan Musk deer (Moschus chrysogaster), Bharal (Psueudois nayaur) Himalayan Tahr (Hemitragus jemlahicus).
Monal Pheasant
Some of the important high altitude birds formed in the reserve are Monal pheasant (Lophophorus impejenus) Snow cock (Tetroaogallus himalayensis), Koklas pheasant (Pucrasia macrolopha), Chukor (Alectoris gricea), Snow partirift (Lerwa perwa), Kaleej Pheasant (Lophura lencomelanos) and snow ridge (Columba lanconota) (Recd 1979, Tak and Kumar 1983).
3.9.5 NANDA DEVI BIOSPHERE RESERVE (NDBR)
Nanda Devi Biosphere Reserve (30° 05'-31° 02'N Latitude, 79()12'-80019'E Longitude) is located in the northern part of west Himalaya and comprises of parts of Chamoli district in Garhwal, Bageshwar and Pithoragarh districts in Kumaun in the Uttarakhand State. It has a large altitudinal range (1,800-7,817 m msl). It belongs to Himalayan Highland Biogeographic Zonation of India and among the World Heritage Sites.
The Area Statement Initially in 1988 the notified area under NDBR was 2,236.74 km2 with 624.62 km2 as core zone with no human interference except research and patrolling and rest as buffer zone. On 07-02-2000 GOI extended the total area of NDBR from existing 2,236.74 km2 to 5,860.69 km2 and core area has been extended to 712.12 km2 by adding the Valley of Flower National park as the second core zone. The core zone consist of Nanda Devi National Park area and area of Valley of Flowers National Park
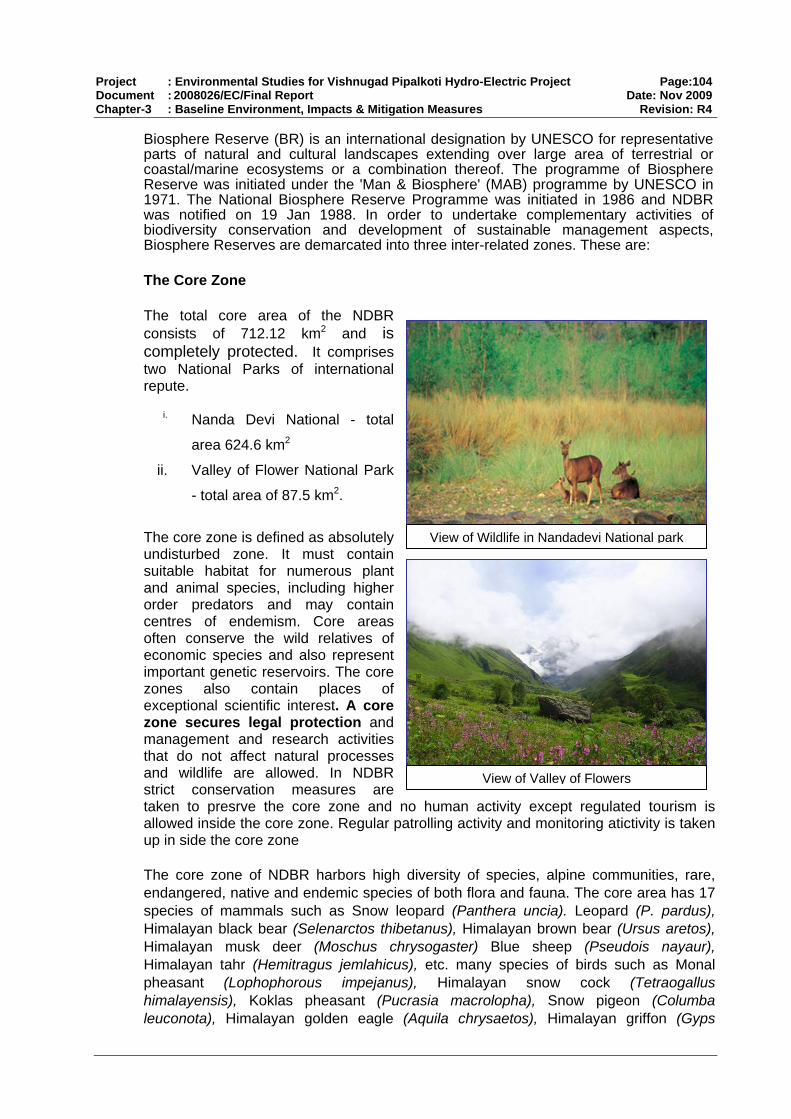
Project : Environmental Studies for Vishnugad Pipalkoti Hydro-Electric Project Page:104 Document : 2008026/EC/Final Report Date: Nov 2009 Chapter-3 : Baseline Environment, Impacts & Mitigation Measures Revision: R4
Biosphere Reserve (BR) is an international designation by UNESCO for representative parts of natural and cultural landscapes extending over large area of terrestrial or coastal/marine ecosystems or a combination thereof. The programme of Biosphere Reserve was initiated under the 'Man & Biosphere' (MAB) programme by UNESCO in 1971. The National Biosphere Reserve Programme was initiated in 1986 and NDBR was notified on 19 Jan 1988. In order to undertake complementary activities of biodiversity conservation and development of sustainable management aspects, Biosphere Reserves are demarcated into three inter-related zones. These are:
The Core Zone
The total core area of the NDBR consists of 712.12 km2 and is completely protected. It comprises two National Parks of international repute.
i. Nanda Devi National - total
area 624.6 km2
ii. Valley of Flower National Park
- total area of 87.5 km2.
The core zone is defined as absolutely undisturbed zone. It must contain suitable habitat for numerous plant and animal species, including higher order predators and may contain centres of endemism. Core areas often conserve the wild relatives of economic species and also represent important genetic reservoirs. The core zones also contain places of exceptional scientific interest. A core zone secures legal protection and management and research activities that do not affect natural processes and wildlife are allowed. In NDBR strict conservation measures are taken to presrve the core zone and no human activity except regulated tourism is allowed inside the core zone. Regular patrolling activity and monitoring atictivity is taken up in side the core zone The core zone of NDBR harbors high diversity of species, alpine communities, rare, endangered, native and endemic species of both flora and fauna. The core area has 17 species of mammals such as Snow leopard (Panthera uncia). Leopard (P. pardus), Himalayan black bear (Selenarctos thibetanus), Himalayan brown bear (Ursus aretos), Himalayan musk deer (Moschus chrysogaster) Blue sheep (Pseudois nayaur), Himalayan tahr (Hemitragus jemlahicus), etc. many species of birds such as Monal pheasant (Lophophorous impejanus), Himalayan snow cock (Tetraogallus himalayensis), Koklas pheasant (Pucrasia macrolopha), Snow pigeon (Columba leuconota), Himalayan golden eagle (Aquila chrysaetos), Himalayan griffon (Gyps
View of Valley of Flowers
View of Wildlife in Nandadevi National park

Project : Environmental Studies for Vishnugad Pipalkoti Hydro-Electric Project Page:105 Document : 2008026/EC/Final Report Date: Nov 2009 Chapter-3 : Baseline Environment, Impacts & Mitigation Measures Revision: R4
himalayensis), Lammergeier (Gypaetus barbatus), etc. (Tak 1997) and 19 species of butterflies such as Common yellow swallowtail (Papilio machaon). Common blue apollo (Parnassius hardwickei), Bath white (Pontia daplidice), Painted lady (Cynthia cardui), etc. (Baindur 1993). In Nanda Devi National Park about 493 species of plants (Balodi 1993; Samant 1993) and from Valley of Flowers 521 species of plants have been recorded (Kala et al. 1998). The Valley of Flowers National Park has an area of 87.50 km2. About 63.58 km2 area is estimated to be under perpetual snow and glaciers based on Satellite Imagery. The forest area of the Park is about 5.29 km and the alpine meadows covers 18.63 km2 area. Based on the altitude, aspect and climatic conditions the vegetation of the Park is divisible into three broad climatic zones viz., sub-alpine, lower alpine and higher alpine (Kala et al. 1998). Nanda Devi National Park, covers 624.6 km2area, of which 65 km area is under forests, 20 km area under grasslands, 36 km area under wasteland and 504 km2 area is under snow/glaciers. The forest density i.e., closed (>40% crown cover) covers 62 km2 area while degraded (<10% crown cover) covers 3 km2 area (Sahai & Kimothi 1994). The changes in the vegetation cover from 1981-1991 indicated that forest resources of the reserve are well conserved or rather improved during the eighties. During this period, even 12 km2 area under the open forest category has improved to closed forest category.
The Buffer Zone
The buffer zone adjoins or surrounds the core zone. In this Zone, uses and activities are managed in ways that protect the core zone. These uses and activities include restoration, demonstration sites for enhancing value addition to the resources, limited recreation, tourism, fishing and grazing, which are permitted to reduce its effect on core zone. Research and educational activities are to be encouraged. Human activities, if natural within Biosphere reserve, are likely to be permitted to continue if these do not adversely affect the ecological diversity. In the NDBR the whole buffer zone has mainly three types of lands. Vegetation in the buffer zone comprises of temperate, subalpine and alpine types.' It supports over 800 species of plants including fungi, lichens and bryophytes and 520 species of fauna. Over 23 forest communities and over 62 alpine communities have been recorded from the buffer zone of the reserve. Two hundred twenty four species of plants in Pindari area and 193 species in Lata-Tolma-Malari area are used by the native communities for various purposes (Samant 1993,1999; Samant et al. 2000,2001; Bisht etal. 1994; Tewarietal. 1994; Hajra& Balodi 1995;Negi &Gadgil 1996). The buffer zone supports 29 species of mammals (Sathyakumar 1993; Tak 1997; Kala et al. 1998). The important species are Goral (Nemorhaedus goral), Indian crested porcupine (Hystrix indica), Yellow bellied weasel (Mustela kathiah), etc., 229 species of birds such as Indian whitebacked vulture (Gyps bengalensis), Egyptian vulture (Neophron percnopterus), Peregrine falcon (Falco peregrinus), Chukor partridge (Alectoris chukor). White crested Kaleej Pheasant (Lophura leucomelanos), Himalayan red bellied Blue Magpie (Urocissa erythrorhyncha) and Yellow bellied blue magpie (U. flavirostris..
The land cover/land use in buffer zone of old reserve is 1,612 km2 in which 15 km2 is under built up and agriculture, 432 km2 is under forests, 82 km2 is under grassland, 111 km2 is under wasteland, and 972 km2 is under snow/glacier covered area. The forest density (closed with >40% crown cover) covers 172 km" area, forest density (open with
Project : Environmental Studies for Vishnugad Pipalkoti Hydro-Electric Project Page:106 Document : 2008026/EC/Final Report Date: Nov 2009 Chapter-3 : Baseline Environment, Impacts & Mitigation Measures Revision: R4
10-40% • crown cover) covers 176 km2 area and degraded (<10% crown cover) covers 84 km2 area (Fig. 4) (Sahai & Kimothi 1994).
Forty seven (47) villages are located in buffer zone of the reserve. The villagers are totally dependent on the forests for fuel, fodder, medicinal and wild edible plants and various other purposes. The livestock grazing is common in the grasslands, meadows and forests of the zone. The main economic activities of the buffer zone are cultivation of medicinal plants, horticultural and agricultural crops, Sheep Farming, bee keeping and eco-tourism.
The Forest Panchayat Land.
Under buffer zone 57.92 km2 land is under Forest Panchayat. These areas are under the direct control of Village Panchyat Committee and are looked after by them under the supervision and guidance of the Divisional Forest Officer. However all the Panchyats land suffer from soil erosion, inadequate forest cover, lack of regeneration and increasing biotic pressure. As such the villagers dependence on the nearby Civil forest land has been increasing and requires management intervention.
Civil Forest Land
The major chunk of the buffer comprises of the civil forest lands and the total area of such land is 4,595.10 km2. The administrative control of these areas lies with the revenue department but the civil forest being protected forest lands the provisions of Indian Forest Act applies in these areas. These areas suffer from maximum forest cover degradation over the years and maximum soil erosion. These areas are also the areas of free grazing and subject to fire incidences. The Reserve Forest Area.
The buffer zone of the NDBR has 490.17 km2 of Reserve Forest areas. The Reserve Forest Areas are totally owned and managed by the Forest Department of Uttarakhand. These areas are also subject to human pressure and biotic intervention since almost all the areas are situated in close proximity with the villages.
The Transition zone
The Transition Zone is the outermost part of a Biosphere Reserve. This is usually not delimited one and is a zone of cooperation where conservation, knowledge and management skills are applied and uses are managed in harmony with the purpose of the Biosphere Reserve. This includes settlements, crop lands, managed forests and area for intensive recreation, and other economic uses characteristic of the region. Under this efforts are made to set up a harmonius and mutually benefiting mechanism where both forest and the people who's livelyhood is based on the use of forest, may live in perfect peace and harmony. Nanda Devi Basin has a distinctive microclimate. Conditions are generally dry with low annual precipitation, but there is heavy rainfall during the monsoon from late June to August. The basin is usually snow-bound for six months between October and March, the snow accumulating deeper and at lower altitudes on the southern than on the northern side of the valley.
The transition zone surrounding the buffer zone covers 546.34 km2 area and inhabited by 52 villages. The inhabitants belong to schedule tribes, schedule castes, Brahmins
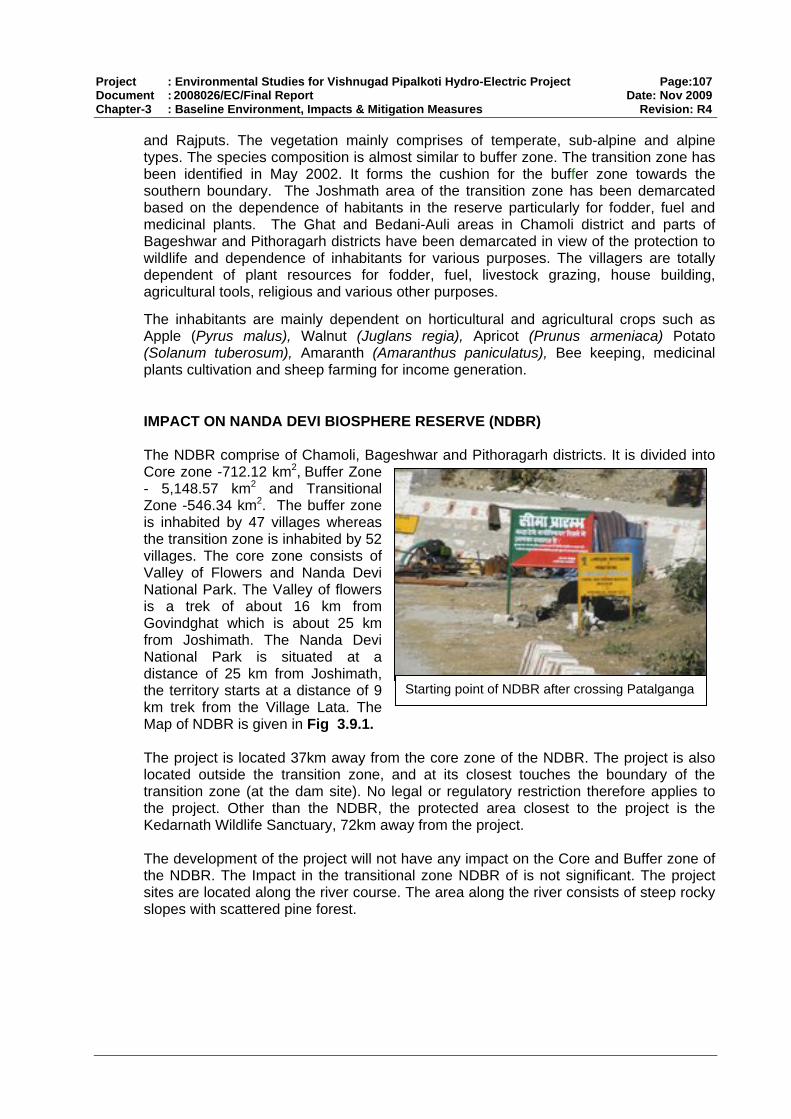
Project : Environmental Studies for Vishnugad Pipalkoti Hydro-Electric Project Page:107 Document : 2008026/EC/Final Report Date: Nov 2009 Chapter-3 : Baseline Environment, Impacts & Mitigation Measures Revision: R4
and Rajputs. The vegetation mainly comprises of temperate, sub-alpine and alpine types. The species composition is almost similar to buffer zone. The transition zone has been identified in May 2002. It forms the cushion for the buffer zone towards the southern boundary. The Joshmath area of the transition zone has been demarcated based on the dependence of habitants in the reserve particularly for fodder, fuel and medicinal plants. The Ghat and Bedani-Auli areas in Chamoli district and parts of Bageshwar and Pithoragarh districts have been demarcated in view of the protection to wildlife and dependence of inhabitants for various purposes. The villagers are totally dependent of plant resources for fodder, fuel, livestock grazing, house building, agricultural tools, religious and various other purposes.
The inhabitants are mainly dependent on horticultural and agricultural crops such as Apple (Pyrus malus), Walnut (Juglans regia), Apricot (Prunus armeniaca) Potato (Solanum tuberosum), Amaranth (Amaranthus paniculatus), Bee keeping, medicinal plants cultivation and sheep farming for income generation.
IMPACT ON NANDA DEVI BIOSPHERE RESERVE (NDBR)
The NDBR comprise of Chamoli, Bageshwar and Pithoragarh districts. It is divided into Core zone -712.12 km2, Buffer Zone - 5,148.57 km2 and Transitional Zone -546.34 km2. The buffer zone is inhabited by 47 villages whereas the transition zone is inhabited by 52 villages. The core zone consists of Valley of Flowers and Nanda Devi National Park. The Valley of flowers is a trek of about 16 km from Govindghat which is about 25 km from Joshimath. The Nanda Devi National Park is situated at a distance of 25 km from Joshimath, the territory starts at a distance of 9 km trek from the Village Lata. The Map of NDBR is given in Fig 3.9.1. The project is located 37km away from the core zone of the NDBR. The project is also located outside the transition zone, and at its closest touches the boundary of the transition zone (at the dam site). No legal or regulatory restriction therefore applies to the project. Other than the NDBR, the protected area closest to the project is the Kedarnath Wildlife Sanctuary, 72km away from the project. The development of the project will not have any impact on the Core and Buffer zone of the NDBR. The Impact in the transitional zone NDBR of is not significant. The project sites are located along the river course. The area along the river consists of steep rocky slopes with scattered pine forest.
Starting point of NDBR after crossing Patalganga

Project : Environmental Studies for Vishnugad Pipalkoti Hydro-Electric Project Page:108 Document : 2008026/EC/Final Report Date: Nov 2009 Chapter-3 : Baseline Environment, Impacts & Mitigation Measures Revision: R4
Proposed Dam Site
Fig 3.9.1: Zones of Nanda Devi Biosphere Reserve
ough there is no direct impact of the project on the protected areas, the EA essed the potential of indirect impacts on the transition and buffer zones of the BR, and dete
Proposed Dam site
AlthassND rmined that such impacts are not significant, during construction or
theimpacti
operation. Nevertheless, interventions to enhance the quality and the management of buffer zone, are provided even if the project’s impacts are not significant. The acts which are likely to occur on transitional zone of NDBR due to the project vities are:

Project : Environmental Studies for Vishnugad Pipalkoti Hydro-Electric Project Page:109 Document : 2008026/EC/Final Report Date: Nov 2009 Chapter-3 : Baseline Environment, Impacts & Mitigation Measures Revision: R4
The construction work is likely to increase the noise level in the area however the impact will be intermittent and temporary and localized.
The air quality is l ikely to be affected due to generation of dust and fugitive emission.
construction of underground tunnel which is not
itat is taking in the zone
ent plan and Afforestation Plan will be undertaken which is
T p Core zone of the NDBR, The core zone consists of V evi National Park. The Valley of flowers is a trek of a at which is about 25 km from Joshimath. The Nanda Devi ance of 25 km from Joshimath. Joshimath to the Dam site. As per the guidelines and p o anagement and Research inp
ct any legal
The machineries, vehicles and equipments use in construction shall strictly confirm to P quipment machinery used in construction shall be fitted by exhaust silencers. Blasting shall be carried out as per the statutory laws, re l quisition, transport, storage, handling and use of e o
Plants, machinery and equipment shall be handled so as to minimize generation of du . minimize dust generation by using regular w r
Compensation must be given to vanpanchayat for the land and standing crop. Fruit btr plementation of
The impact will be temporary and limited to construction phase.
Cutting of trees and clearing of land. No rare/endangered and threatened species located in the area. The Dam site consists of panchayat forest areas which consist of plantation. The project entails likely to affect the top flora and fauna.
No impact on fauna of the area as no fragmentation of haband there is no dense forest in this zone. Hence no habitat issue occurring in the area.
Influx of labour population is likely to occur which may impart pressure on the local resources of the area.
The overall impact of the project will be positive on the NDBR, under the project Catchment Area Treatmlikely to enhance the existing environmental status of the area.
Following mitigation measures are suggested to minimize/compensate the impact on the NDBR area.
he roject area does not fall inalley of Flowers and Nanda Dbout 16 km from Govindgh
National Park is situated at a distwn is approx 12 km upstream from rof rmae of MoEF for Protection, Development, M Biosphere Reserves in India (Oct 2007) only the core zone secure legal
rotection and management and must be kept free of human pressure. The project does not fall in core zone of NDBR hence does not attraobligation.
C CB standard. All vehicles e
gu ation and rules pertaining to acxpl sives.
st All earth work shall be protected toate sprinklers.
earing trees may be compensated including cost of fruit yield of 5 years. Cutting of ees should be strictly prohibited outside construction site. Timely im
Compensatory Afforestation plan.
Wildlife monitoring must be established in association with Forest Dept. in the project area and hunting/poaching must be strictly banned.
Labours must be provided fuel-kerosene/LPG by contractor. No felling of trees must be done by labour for fuel and shelter. Labour camps must be located away from forest area. Local people must be given preference for skilled and unskilled jobs in the project.

Project : Environmental Studies for Vishnugad Pipalkoti Hydro-Electric Project Page:110 Document : 2008026/EC/Final Report Date: Nov 2009 Chapter-3 : Baseline Environment, Impacts & Mitigation Measures Revision: R4
Awareness program must be undertaken by THDC on environmental importance and natural resources.
rvation Engineering Work such as
T oil & Moisture Conservation Engineering Work Rs 215,40,000/- (source : CAT plan by Forest Dept)
dget of Rs.61,50,000/- is proposed in NDBR region under C T is Rs.4,39,80,500/- under CAT plan The manag e P, Section 4.5. The Ma g st Department and takes care of the env n the area. The Man and Biosphere (MAB) program e ince 1988. The management plan of NDBR is discussed below.
Manag e here Reserve
The implementation of CAT plan and Afforestation plan is likely to enhance the resources and environment of the area. The CAT plan covers Joshimath region and Pipalkoti region. The Joshimath region covered under the plan is part of NDBR Transitional Zone, the interventions proposed in CAT plan under NDBR include:
orestry Work F
Afforestation work- 50ha
Densification – 100 ha
Medicinal plant plantation – 50 ha
Assisted natural regeneration in the area 300 ha
The budget provided to NDBR for the Forestry activities is Rs 80,80,500/- (source : CAT plan by Forest Dept)
oil & Moisture ConseS
Vegetative check dams- 250 No.
Gully Plugging – 1500 No.
Stone check dams - 500 No.
Crate wire check dams -500 No.
Spurs –200 No.
Water percolation tanks – 500 No.
he budget provided to NDBR for the S
For management of Wildlife a buA Plan. The total Budget for NDBR
em nt of CAT plan is provided in Chapter 4-EMna ement plan of NDBR is prepared by the Foreiro mental and social concerns ofm is operational in the Niti and Johar valley of NDBR s
em nt Plan of Nanda Devi Biosp
Managemefor managing natural resources of the area in a sustainable manner. To reduce
of NDBR by local inhabitants the need of local people is also roach is followed to involve people in conser io Strict c eserve the core zone and no human activity except regulated tourism is allowed inside the core zone. Regular patrolling activity and monitoring activity is taken up in side the core zone
mainly rest of man management. Under this
nt Plan of Nanda Devi Biosphere Reserve is prepared by Forest Department
dependency on natural resources addressed and participatory app
vat n of the area.
onservation measures are taken to pr
Management of buffer & transition zone is

Project : Environmental Studies for Vishnugad Pipalkoti Hydro-Electric Project Page:111 Document : 2008026/EC/Final Report Date: Nov 2009 Chapter-3 : Baseline Environment, Impacts & Mitigation Measures Revision: R4
efforts mutually benefiting mechanism where both forest a livelihood is based on the use of forest, may live in perfect peace Following i. Eco-development Activity
iii. Rehabilitation of Habitats
f Forest Nurseries
ation of medicinal plants in unused agricultural fields
consist of activities such as
Building and Awareness
• Exposure visit of the staff
v
Maintenance of wireless seta and communication systems • Setting up of high gain repeater station • Construction of anti poaching huts for the staff of NDBR posted at far flung
areas.
viii. Research , Documentation and Monitoring
are made to set up a harmonious andnd the people whose
and harmony.
activities are undertaken as part of management plan of NDBR:
• Distribution of Fruit Plants • Solar lights • Gas Connection • Purchase & distribution of locally produced raw wool
ii. Value Addition Activity
• and Management Grassland improvement
• Maintenance o• Maintenance of Medicinal Plant Nurseries • Advance soil work in degraded forest lands • Soil Conservation works • Propog
iv. Ecotourism
• Development of Trek Routes • Development of community based NDNP Eco Tourism zone CBT planning,
Capacity building, Training
v. Social Welfare Activities
• This • Drinking water facility • Immunization of domestic cattle • Support for rural School
vi. Capacity
• Education programme in school
• Capacity building and training programme• Capacity building and training programme of the villagers of buffer and
transitional zone for income generating progammes from agriculture, horticulture, livestock management and medicinal/ aromatic plants.
ii. Protection and Communication System
•
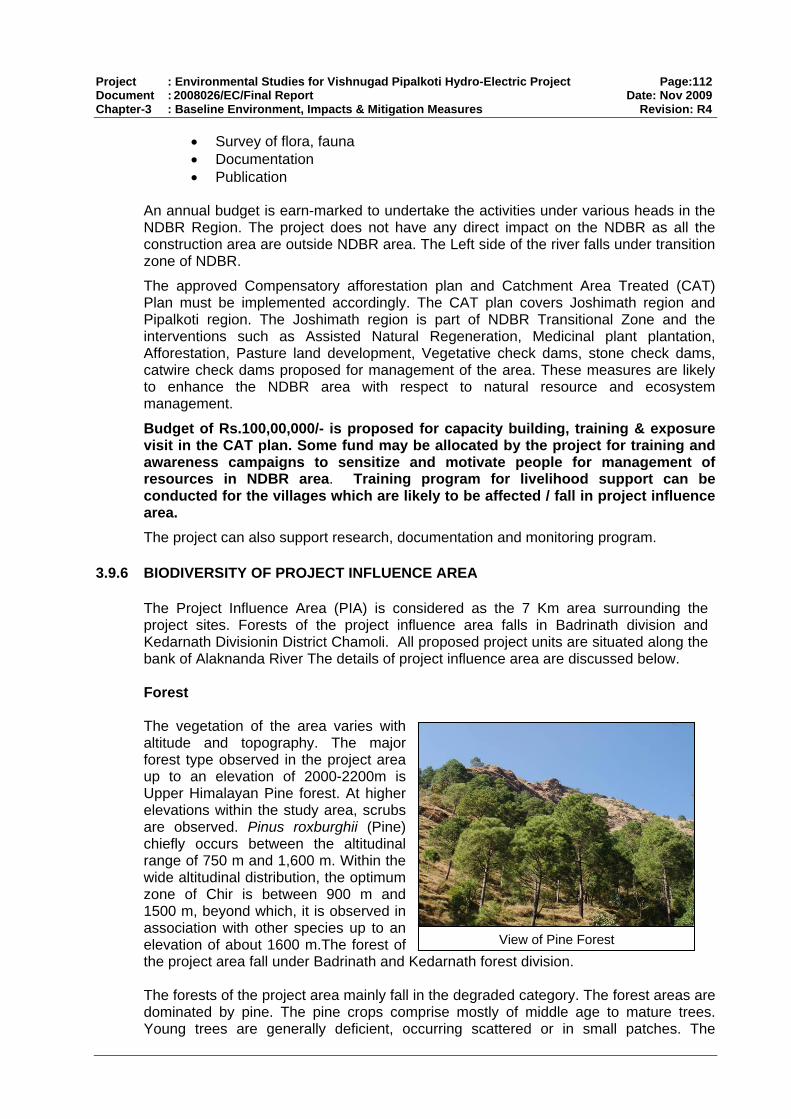
Project : Environmental Studies for Vishnugad Pipalkoti Hydro-Electric Project Page:112 Document : 2008026/EC/Final Report Date: Nov 2009 Chapter-3 : Baseline Environment, Impacts & Mitigation Measures Revision: R4
• Survey of flora, fauna • Documentation • Publication
An annual budget is earn-marked to undeNDBR Region. The project does not havconstruction area are outside NDBR area. zone of NDBR.
The approved Compensatory afforestatioPlan must be implemented accordingly. TPipalkoti region. The Joshimath region interventions such as Assisted NaturaAfforestation, Pasture land development,catwire check dams proposed for management of the area. These
enhance the NDBR area with respect to natural resource a
rtake the activities under various heads in the e any direct impact on the NDBR as all the The Left side of the river falls under transition
n plan and Catchment Area Treated (CAT) he CAT plan covers Joshimath region and
is part of NDBR Transitional Zone and the l Regeneration, Medicinal plant plantation, Vegetative check dams, stone check dams,
measures are likely nd ecosystem
ly to be affected / fall in project influence rea.
3.9.6
he Project Influence Area (PIA) is considered as the 7 Km area surrounding the roject sites. Forests of the project influence area falls in Badrinath division and edarnath Divisionin District Chamoli. All proposed project units are situated along the ank of Alaknanda River The details of project influence area are discussed below.
orest
he vegetation of the area varies with ltitude and topography. The major rest type observed in the project area
p to an elevation of 2000-2200m is pper Himalayan Pine forest. At higher levations within the study area, scrubs re observed. Pinus roxburghii (Pine) hiefly occurs between the altitudinal nge of 750 m and 1,600 m. Within the ide altitudinal distribution, the optimum one of Chir is between 900 m and
out 1600 m.The forest of drinath and Kedarnath forest division.
e ly fall in the degraded category. The forest areas are dominated by pine. The pine crops comprise mostly of middle age to mature trees. Young trees are generally deficient, occurring scattered or in small patches. The
tomanagement.
Budget of Rs.100,00,000/- is proposed for capacity building, training & exposure visit in the CAT plan. Some fund may be allocated by the project for training and awareness campaigns to sensitize and motivate people for management of resources in NDBR area. Training program for livelihood support can be conducted for the villages which are likeaThe project can also support research, documentation and monitoring program.
BIODIVERSITY OF PROJECT INFLUENCE AREA
TpKb F TafouUeacrawz1500 m, beyond which, it is observed in association with other species up to an elevation of ab View of Pine Forest the project area fall under Ba Th forests of the project area main

Project : Environmental Studies for Vishnugad Pipalkoti Hydro-Electric Project Page:113 Document : 2008026/EC/Final Report Date: Nov 2009 Chapter-3 : Baseline Environment, Impacts & Mitigation Measures Revision: R4
degeneration stage occur scattered in the Chir zone in patches where the trees are ither destroyed or are unable to develop owing to excessively dry and shallow soil.
d Pine forests are generally pure. No other e are only scattered trees representing a ergrowth.
the areas near habitation felling of trees is done for fuel, fodder and construction. The rests are open and poor in regeneration. The factors contributing to the degradation of e forest are
Annual fire in the area. Grazing and browsing Felling for fuel, fodder and pole Natural factors – dry rocky and steep slopes.
ccurrence of annual fire is one of reason r degradation of the Forest. Inflammable
ondition prevails during hot weather. The hir forests are highly inflammable and e dry leaves burns quickly and the fire
preads fast. Burning encourages Chir to pread upward in Oak. At higher elevation egraded Oak forests are encroached pon by pine. Oak Forests are not flammable but suffer from fire spreading
ts
pass through the forest during their up and down migration with the Bhotias. Besides the regularly. Grazing affect the forest through
and trampling,
eOpen shrub formations occupy the ground. Formation of plant story such as top, midground flora is absent in the pine forest. species reaches the top canopy and thersecond storey and similar discontinuous und
dle and lower is absent. Middle story an
I
Degraded Forest areas, devoid of trees. Degraded Forest Areas
Infoth
O
View of grazing
focCthssduinup from Chir forests. Green leaves of Oak catch fire and burn out quickly.
Large herds of cattle, sheeps and goa
nearby habitants cattle graze the forest areahysical injury to the plants in seedling and sapling stages by browsing p
this also makes the soil hard.

Project : Environmental Studies for Vishnugad Pipalkoti Hydro-Electric Project Page:114 Document : 2008026/EC/Final Report Date: Nov 2009 Chapter-3 : Baseline Environment, Impacts & Mitigation Measures Revision: R4
The forests are also subjected to biotic pressure. Most of the species near habitation are
ristics in the project area are Himalayan Moist emperate Forest and Himalayan Dry Temperate Forest
i) Alder forests
Upper West Himalayan temperate forests are generally found in depressions and ravines as found at Bargaon, Helong and Selong. Important species in this category are Quercus dilata, Quercus incana, Toona ciliata, Ficus palmata, Ficus auriculata, Punica gratanum and a few bamboo species. At lower elevations, Alnus borders the river-courses extending down into the subtropical zone. Rumex hastatus is the predominant ground vegetation.
heavily lopped and hacked for winter fodder, manure, fuel and is also cut for timber for use in building and agriculture implements. Natural factor such as dry rocks and steep slope are also the cause of poor forest cover. The hot exposed southern slopes consist of shallow soil; the soil does not support forest, Pine forests are replaced by scrubs.
Agriculture fields along settlements on Left
he major vegetation characteTT
Himalayan Moist Temperate forests
This forest type can be divided in two types (i) Upper West Himalayan temperate forests
(i
View of Forest in Valley View of Pine Forest
side of Alaknanda along NH-58 View of settlements on Right side of Alaknanda

Project : Environmental Studies for Vishnugad Pipalkoti Hydro-Electric Project Page:115 Document : 2008026/EC/Final Report Date: Nov 2009 Chapter-3 : Baseline Environment, Impacts & Mitigation Measures Revision: R4
Alder forests are found as pure forest of 20-30 m high. It is mostly observed as a strip of varying width along stream sides, spreading out to larger areas on landslips. The vegetation is of deciduous type. Himalayan Dry Temperate Forests
sonifers pred
ved trees are of poorer height and occurring either scattered among the conifers or pure patches rophytic shrubs a nly observed which ver but more o e a great deal osed.
udinal variations markedly influence species distribution hysiognomically study area ized as trees,
a recorded during survey is Table ies were reco 6 trees, 39 shrubs, 40 herbs, 5 climbers, 7
rn, 1 epiphy 1fungi. The climax and dominant species of of the forests ir (Pinus roxbu Ban Oak (Quercus
.9.6: Flora Record er the Project In a (7km)
Mo t project area bed canopy only on favourable sites.
longs to this type of forest. It is bas n open formation with ically aominate in the area. Broadlocally close
leaC
forming more or less . Xe re commoform a continuous co ften leav of the soil exp
Natural Flora The climatic and altit the type of in various zones. P flora of the can be categorshrubs, her3.9.6
bs and grasses the list of Flor. Total 154 spec
given in red, 5
grasses, 3 bamboo, 2 fe te and foresincana
ts are species ).
are Ch rghii) and
Table 3 ed und fluence Are
View of Forest areas, dominated by shrubs
S. No. Scientific name Local name Family
Trees
1. Aegle marmelos Bel Rutaceae
2. Aesculus indica Pangar Sapindaceae
3. Albizzia lebbek andir Siris, Bh Leguminosae
4. Alnus nepalensis Utis Betulaceae
5. Bauhinia variegata Kachnar Leguminosae
6. Boehmeria regulosa Genthi Urticaceae
7. Bombax ceiba Semal Bombaceae

Project : Environmental Studies for Vishnugad Pipalkoti Hydro-Electric Project Page:116 Document : 2008026/EC/Final Report Date: Nov 2009 Chapter-3 : Baseline Environment, Impacts & Mitigation Measures Revision: R4
S. No. Scientific name Local name Family
8. Callistemon citrinus brush Bottle Myrtaceae
9. Cedrela toona Toon Meliaceae
10. Cedrus deodara aar Devd Coniferae
11. Celtis australis Kharak Ulmaceae
12. Cinnamomum tamala ni Dalchi Luraceae
13. Citrus limon Nimu Rutaceae
14. Citrus sp Malta Rutaceae
15. Cupressus torulosa Surai Cupressaceae
16. Dalbergia sissoo Shisham Fabaceae
17. Delonix regia Gulmohar ceae Caesalpinia
18. Emblica officinalis eae Amla Euphorbiac
19. Eucalyptus globulus Safeda Myrtaceae
20. Ficus auriculata Timal Moraceae
21. Ficus bengalensis d Barga Moraceae
22. Ficus palmata Bedu Moraceae
23. Ficus religiosa Pipal Moraceae
24. Grevillea robusta oak Silver Proteaceae
25. Grewia oppositifolia Biul Tiliaceae
26. Jacaranda mimosifolia Jacrada Bignoniaceae
27. Juglans regia Akhrot Juglandaceae
28. Lannea coromandelica ae Jhingan Anacardiace
29. Lannea grandis Jinghini Anacardiaceae
30. Litsea umbrosa Shuru Lauraceae
31. Mallotus philippinenisis eae Ruin Euphorbiac
32. Mangifera indica eae Aam Anacardiac
33. Melia azedarach Dhenk Meliaceae
34. Morus alba Tut Moraceae
35. Musa paradisiaca Kela Musaceae
36. Myrica esculenta Kafal Myricaceae
37. Phoenix humilis Khajoor Palmae
38. Pinus roxburghii Chil Pinaceae
39. Populus ciliata Poplar Salicaceae
40. Prunus armeniaca Chuli Rosaceae
41. Prunus communis Aloocha Rosaceae
42. Prunus persica Aroo Rosaceae
43. Prunus puddum Phaja Rosaceae
44. Punica granatum Aanar Punicaceae

Project : Environmental Studies for Vishnugad Pipalkoti Hydro-Electric Project Page:117 Document : 2008026/EC/Final Report Date: Nov 2009 Chapter-3 : Baseline Environment, Impacts & Mitigation Measures Revision: R4
S. No. Scientific name Local name Family
45. Pyrus malus Seb Rosaceae
46. Pyrus pashia Mehal Rosaceae
47. Quercus incana Ban Fagaceae
48. Quercus dilata Moru Fagaceae
49. Quercus semicarpifolia Oak Kharsu Fagaceae
50. Robinia pseudoacacia Pahari kikar Fabaceae
51. Rhododendron arboreum Burans Ericaceae
52. Salix tetrasperma ins Gadhba Salicaceae
53. Sapindus mukorossi Ritha Sapindaceae
54. Sapium insigne Khinna Euphorbiaceae
55. Syzygium cumini Jamun Myrtaceae
56. Toona serrata Kakuru Meliaceae
Shrubs
57. Adhatoda vasica Basinga Acanthaceae
58. Agave americana Rambans Agavaceae
59. Artemesia vulgaris h Kubas Compositae
60. Berberis aristata Karmshal, Kashmoi Berberidaceae
61. Calotropis gigantea eae Aak Asclepiadac
62. Cannabis sativa Bhang Cannabaceae
63. Carissa spinarum Karonada Apocynaceae
64. Colebrookea oppositifolia Bindu Lamiaceae
65. Coriaria nepalensis Makhoi Coriariaceae
66. Cotoneaster acuminata Ruinish Rosaceae
67. Datura stromonium Datura Solanaceae
68. Debregeasia hypoleuca Sihanru Urticaceae
69. Desmodium tiliaefolium Martoi Leguminosae
70. Erythrina suberosa Dhaul Leguminosae
71. Eupatorium adenophorum bansa Kala Asteraceae
72. Euphorbia royleana Shuru Euphorbiaceae
73. Hypericum oblongifolium Phiunli Hypericaceae
74. Jasminum humile Shunjai Oleaceae
75. Jatropha curcas Arand Euphorbiaceae
76. Lantana camara Lantana ae Verbinace
77. Murraya koenigii Kath Neem Rutaceae
78. Opuntia dillenii Nagphani Cactaceae
79. Opuntia monocantha Nagphani Cactaceae
80. Plectranthus coesta ri Chichi Lamiaceae

Project : Environmental Studies for Vishnugad Pipalkoti Hydro-Electric Project Page:118 Document : 2008026/EC/Final Report Date: Nov 2009 Chapter-3 : Baseline Environment, Impacts & Mitigation Measures Revision: R4
S. No. Scientific name Local name Family
81. Princepia utilis Bhekal Rosaceae
82. Pyracantha crenulata u Ghingar Rosaceae
83. Rhus parviflora Tung Anacardiaceae
84. Ricinus communis Arandi Euphorbiaceae
85. Rosa brunonii Kunja Rosaceae
86. Rubus ellipticus Hinsar Rosaceae
87. Rubus niveus Kala Hinsalu Rosaceae
88. Rumex hastatus Bhilmora Polygonaceae
89. Sarcococca saligna ceae Tiliari Euphorbia
90. Solanum surattense Kateli Solanaceae
91. Urtica parviflora Kandali Urticaceae
92. Vitex negundo Shimalu Verbenaceae
93. Woodfordia floribunda Dhaula Lythraceae
94. Zanthoxylum alatum Timbur Rutaceae
95. Ziziphus mauritiana Ber Rhamnaceae
Herbs
96. Achyranthes aspera Aghada, Puthkanda Amaranthaceae
97. Ageratum conzoides Gunriya Asteraceae
98. Argemone mexicana Prickly poppy eae Papaverac
99. Arisaema flavum Meen Araceae
100. Artemisia capillaris Pati Compositae
101. Artemisia vulgaris Kunjha Asteraceae
102. Bergenia ligulata Silphara Saxifragaceae
103. Bidens bipinnata Kuru Asteraceae
104. Cassia tora Chakunda ae Caesalpinace
105. Centella asiatica Brahmi Apiaceae
106. Cestrum verutum Kanjalu Solanaceae
107. Asparagus racemosa Sahansarpali Liliaceae
108. Bauhinia vahlii Malo Leguminosae
109. Chenopodium album Bathwa Chenopodiaceae
110. Chromolaena odorata Triva gandha Asteraceae
111. Clematis montana Kauniabali Ranunculaceae
112. Colocasia affinis Pindalu Araceae
113. Datura suaveolens Datura Solanaceae
114. Echinops echinatus Gokhru Compositae
115. Erigeron bellidioides ed Horse we Compositae
116. Euphorbia hirta Dudhi Euphorbiaceae
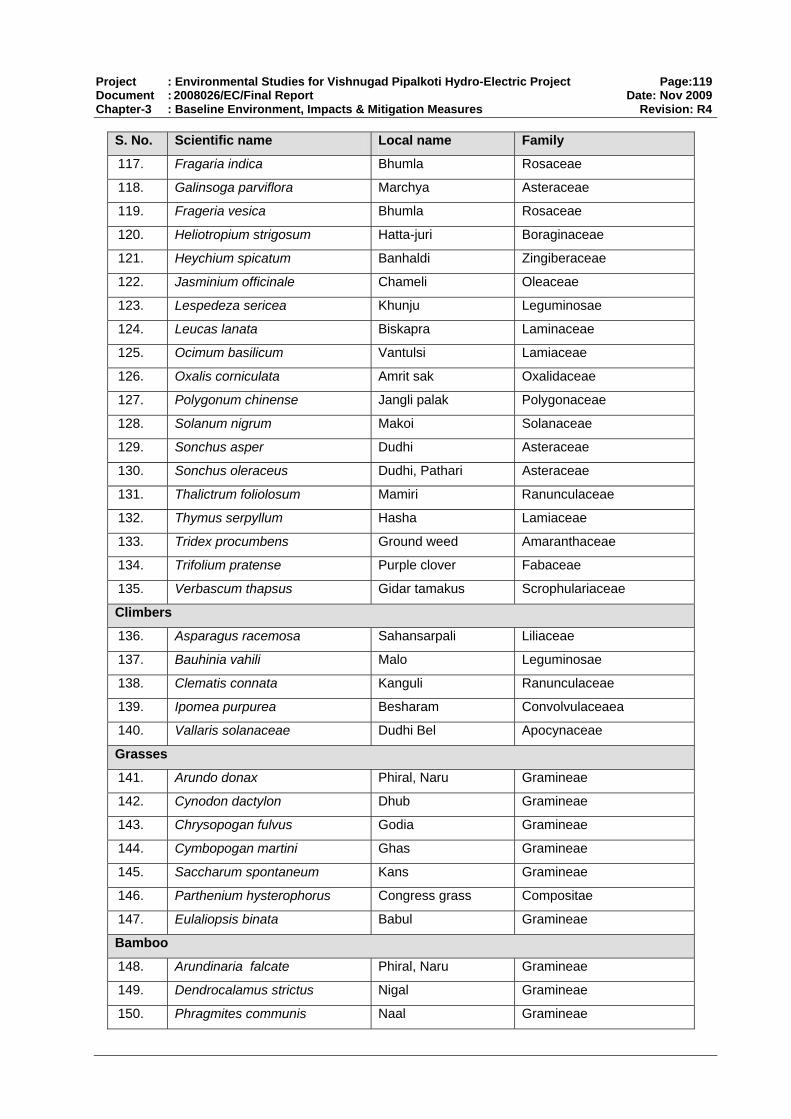
Project : Environmental Studies for Vishnugad Pipalkoti Hydro-Electric Project Page:119 Document : 2008026/EC/Final Report Date: Nov 2009 Chapter-3 : Baseline Environment, Impacts & Mitigation Measures Revision: R4
S. No. Scientific name Local name Family
117. Fragaria indica Bhumla Rosaceae
118. Galinsoga parviflora Marchya Asteraceae
119. Frageria vesica Bhumla Rosaceae
120. Heliotropium strigosum ri e Hatta-ju Boraginacea
121. Heychium spicatum Banhaldi e Zingiberacea
122. Jasminium officinale Chameli Oleaceae
123. Lespedeza sericea Khunju e Leguminosa
124. Leucas lanata Biskapra Laminaceae
125. Ocimum basilicum Vantulsi Lamiaceae
126. Oxalis corniculata Amrit sak Oxalidaceae
127. Polygonum chinense e Jangli palak Polygonacea
128. Solanum nigrum Makoi Solanaceae
129. Sonchus asper Dudhi Asteraceae
130. Sonchus oleraceus Dudhi, Pathari Asteraceae
131. Thalictrum foliolosum i ae Mamir Ranunculace
132. Thymus serpyllum Hasha Lamiaceae
133. Tridex procumbens Ground weed Amaranthaceae
134. Trifolium pratense over Purple cl Fabaceae
135. Verbascum thapsus Gidar tamakus Scrophulariaceae
Climbers
136. ali Liliaceae Asparagus racemosa Sahansarp
137. Bauhinia vahili Malo Leguminosae
138. Clematis connata Kanguli Ranunculaceae
139. Ipomea purpurea Besharam Convolvulaceaea
140. Vallaris solanaceae Dudhi Bel Apocynaceae
Grasses
141. Arundo donax Phiral, Naru Gramineae
142. Cynodon dactylon Dhub Gramineae
143. Chrysopogan fulvus Godia Gramineae
144. Cymbopogan martini Ghas Gramineae
145. eum Kans Gramineae Saccharum spontan
146. Parthenium hysterophorus Congress grass Compositae
147. Eulaliopsis binata Babul Gramineae
Bamboo
148. Arundinaria falcate Phiral, Naru Gramineae
149. Dendro e calamus strictus Nigal Graminea
150. ites communis Naal Gramineae Phragm

Project : Environmental Studies for Vishnugad Pipalkoti Hydro-Electric Project Page:120 Document : 2008026/EC/Final Report Date: Nov 2009 Chapter-3 : Baseline Environment, Impacts & Mitigation Measures Revision: R4
S. No. Scientific name Local name Family
Ferns
151. Pteris sp Fer eae n Pteridac
152. Adiantum sp Fer eae n Pteridac
Epiphyte
153. Vanda roxburghii Badang Orchidaceae
Fungi
154. Morchella esculata Mushroom Helvellaceae
Ecological Features features with referen r h re en or
istrib term e of fore is given
able: 3.9.7 al Ma
Source: Field Survey CES (I) Pvt. Ltd April –July, 2008
The ecological ce to thei abitat, natu i.e. evergredeciduous, and their d ution in s of altitud the major st species in details below
Features ofT : Ecologic jor Species
Name of Species Ecology S. No Scientific Local Habitat Nature Distribution
(m)
1. lebbek iris ills eciduous 00 – 1300 Albizzia S H D 3
2. Alnus nepalensis Utis HillSlopes Deciduous 1500 – 2700
3. Bombax ceiba Semal Hill slopes Deciduous 300 – 1500
4. Cedrus deodara 0 Deodar High forest Evergreen 1800 – 300
5. Cinnamomum tamala Tejpat Hill slopes Evergreen 450 - 2100
6. Cupressus torulosa Surai Hill slopes Evergreen 1800 – 3600
7. Forest Deciduous 300 – 1500 Bauhinia variegata Kachnar
8. Celtis australis Kharik Slopes Evergreen 1800 –3000
9. Dalbergia sissoo Shisham Hill slopes Deciduous 300 – 1500
10. Deciduous 200 - 1400 Ficus palmata Bedu Hill slopes
11. Mallotus philippinenisis Ruin orest Evergreen 300 – 1200 F
12. Pinus roxburghii 300 – 1500 Chir Forest Deciduous
13. op cid 36 Populus ciliata P lar Forest De uous 200 – 00
Prunus armeniaca (Chuli) Galinsoga parviflora (Marchya) Berberis aristata (Kashmoi)

Project : Environmental Studies for Vishnugad Pipalkoti Hydro-Electric Project Page:121 Document : 2008026/EC/Final Report Date: Nov 2009 Chapter-3 : Baseline Environment, Impacts & Mitigation Measures Revision: R4
Name of Species Ecology S. No Scientific Local Habitat Nature Distribution
(m)
14. Quercus semicarpif KharsuOak
Fo Evergre 800olia rest en 2100 – 3
15. Rododendron arbor rans Fo Evergr 1800 – 4300eum B rest een
Shrubs
16. Berberis aristata Kilmor Hill slopes Decidu s 800 a ou 1500 - 1
17. Boehmeria platyphy Khagra Hill slopes Decidu s 00 lla ou 800 - 27
18. Debregeasia hypol Syanru Hill slopes Evergre 000euca en 1000 - 2
19. Opuntia dellenii agph Hill slopes Sacculrnt N ani 0 – 1800
20. Rumex hastatus Almora Hill slopes Evergr 400 een 1000 - 2
21. Rubus ellipticus Hisar Hills & slops Decidu s 800 - 2700 ou
Herbs
22. Artemisia cappillaris Pati Floor Fors. Evergr 00 een 600 - 24
23. Cannabis sativa Bhang Floor Fors Annual herb 200 - 2700
24. Cassia tora haku Hills & slops Seasonal 500 C nda 450 -1
25. Oxalis corniculata Bhilmora Floor Fors Perrineal 0 -2800 Source: Data collected during field survey
he people from surrounding villages depend on forest for various purposes the Table l people. The major uses of trees
Community
Community Use of Natural Flora
Tgiven below depict various uses of trees by locafalling under the project area are as given below:
Table 3.9.8: Uses of Major species by
Name of Tree Local Shade Food Fodder Fuel Timber Manure
Albiz + + + - zia lebbek Siris _ -
Alnus + - + + nepalensis Utis _ -
Bauh + + - + inia variegata Kachnar _ +
Bombax ceiba Semal _ - - + + +
Cedrus deodara - Deodar - - - + +
Cinnamomum tamala Tejpat + - + - +
C s au Kharik + elti stralis _ + - + +
Dalbergia sissoo Shisham + - + - + -
Mallotus p - hilippinenisis Ruin - - + + +
Morus alba Tut - - + + - +
Pinus roxburghii Chir + + - + + +
P us c Poplar + - opl iliata - - + +
P s pa Mehal yru shia - - + + - +
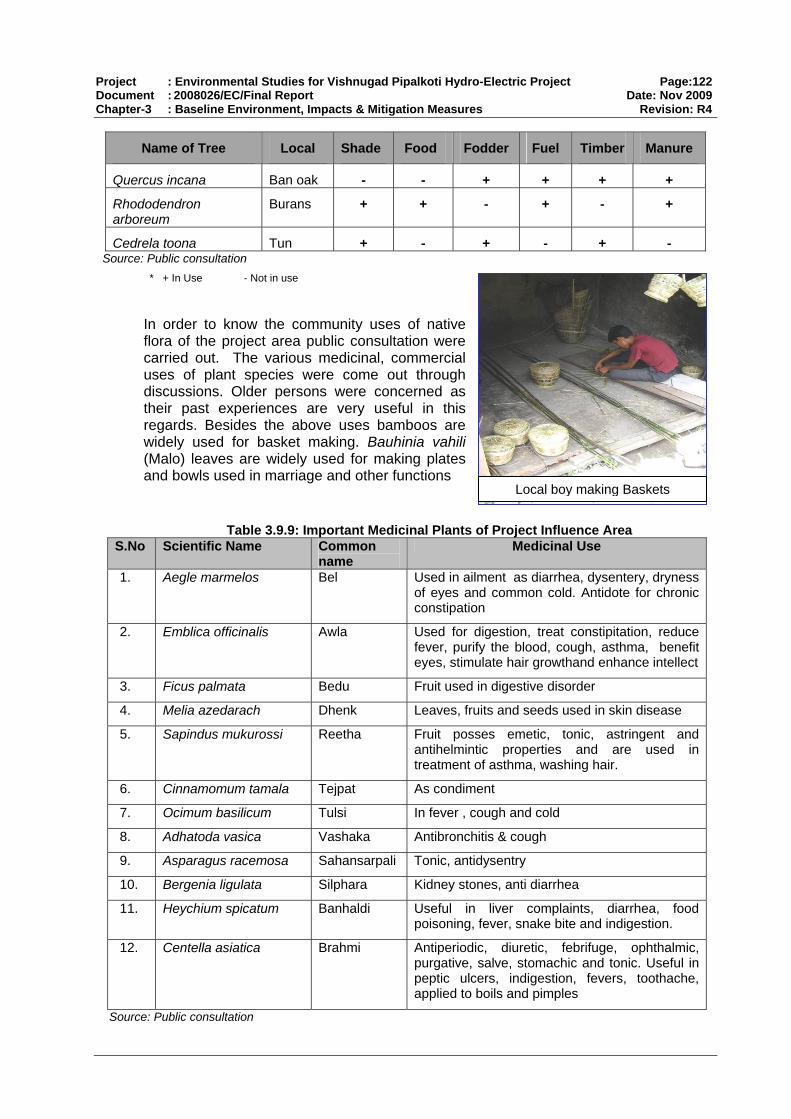
Project : Environmental Studies for Vishnugad Pipalkoti Hydro-Electric Project Page:122 Document : 2008026/EC/Final Report Date: Nov 2009 Chapter-3 : Baseline Environment, Impacts & Mitigation Measures Revision: R4
Name of Tree Local Shade Food Fodder Fuel Timber Manure
Quercus oak incana Ban - - + + + +
Rhododendron arboreu
Burans + + m
+ - + -
C rela un + + - ed toona T - + - So : Pu
* in use
In he com ses oflo a p ultaticarried out. l, comuses of pla s were come out throughdis person concetheir past experiences are very usefuregards. Besides the above uses bambwidely used for basket making. Bauhinia vah
widely used for making plates
urce blic consultation + In Use - Not
order to know t munity u f native ra of the project are
The various medicinaublic cons on were
mercial nt specie
cussions. Older
rned as l in this oos are
ili
s were
Local boy making Baskets
(Malo) leaves areand bowls used in marriage and other functions
Table 3.9.9: Important Medicinal Plants of Project Influence Area S.No Scientific Name Common
name Medicinal Use
1. Bel Used in ailment as diarrhea, dysentery, dryness of eyes and common cold. Antidote for chronic constipation
Aegle marmelos
2. Emblica officinalis Awla Used for digestion, treat constipitation, reduce fever, purify the blood, cough, asthma, benefit eyes, stimulate hair growthand enhance intellect
3. Ficus palmata Bedu Fruit used in digestive disorder
4. Melia azedarach Dhenk Leaves, fruits and seeds used in skin disease
5. Reetha Fruit posses emetic, tonic, astringent and antihelmintic properties and are used in treatment of asthma, washing hair.
Sapindus mukurossi
6. Cinnamomum tamala Tejpat As condiment
7. Ocimum basilicum Tulsi In fever , cough and cold
8. Adhatoda vasica Vashaka Antibronchitis & cough
9. antidysentry Asparagus racemosa Sahansarpali Tonic,
10. Bergenia ligulata ea Silphara Kidney stones, anti diarrh
11. H m s haldi Useful in diarrhea, food poisoning, fe ke bite and indigestion.
eychiu picatum Ban liver complaints,ver, sna
12. Centella asi Antiperiodic, ic, febrifuge, ophthalmic, purgative, s achic and tonic. Useful in peptic ulce n, fevers, toothache, applied to bo
atica Brahmi diuretalve, stomrs, indigestioils and pimples
Source: Publi onsultac c tion

Project : Environmental Studies for Vishnugad Pipalkoti Hydro-Electric Project Page:123 Document : 2008026/EC/Final Report Date: Nov 2009 Chapter-3 : Baseline Environment, Impacts & Mitigation Measures Revision: R4
Fauna of the Project Influence Area
The fauna of the study area is represented by reptiles, bird nd animals. The variation in altitude, climate, topography, forests type and forest cover leads to variation in animals the fa acterized as domestic nd wild life. The details are d ssed
(I) ome ls The l pop arily dependant on agricu economy for livelihood almo very d and is engaged in a , horticulture, and animal husbandry. Every family rears livestock for their day to day requirements for agriculture purposes and for cash income. The live stock is mainly dependant upon the natural resources, ma nce. Local people and donkeys for carry their hilly areas. Other buffalo, cow, ox, goat and sheep. (II) ildli The wildlife of the Project Influence Area is given in e below. Most of the wildlife are present a ation in the forest area and are not found near the river course. Steep slopes do not allow the mammals to use river water. The water of springs / tributaries is sufficient f
ble 3.9.10: Wildlife of Project Influence Area
s a
una can be char animals aiscu below
D stic Anima
rura ulation is prim lture basedst e family owns lan griculture
inly forest for sustena use horses, mule ing luggage/material in domestic animals are
W fe
the tablt higher elev
or these wild animals.
TaS.No Scientific name Common name
1 Canis aureus Jackal
2 Capricornis sumataensis Serow
3 Cervus unicolor Sambar
4 Martes flavigula Himalayan Marten
5 Moschus chrysogaster Deer Himalayan Musk
6 Muntiacus muntjak Barking Deer
7 Nemorhaedus goral Goral
8 Panthera pardus Leopard
9 Pressbytis entellus Common Langur
10 Sus scrofa Wild Boar
11 Ursus aretos Brown bear
12 Vulpes montana Red Fox
Reptiles
13 Hemidactylus frenatus Asian house Gecko
14 Varanus bengalensis Common Indian Lizard
15 Trimeresurus albolabris Green Pit Viper
16 Gloydius himalayanus Himalayan Pit Viper
17 Naja naja Cobra
Amphibians
18 Bufo himalayanus Toad

Project : Environmental Studies for Vishnugad Pipalkoti Hydro-Electric Project Page:124 Document : 2008026/EC/Final Report Date: Nov 2009 Chapter-3 : Baseline Environment, Impacts & Mitigation Measures Revision: R4
S.No Scientific name Common name 19 Rana sp. Frog
Birds
20 Acridotheres tristis Indian Myna
21 Alectoris chukar huk idg C or Patr e
22 corax Com n ravenCorvus mo
23 ssa flavirostris Yellow build Magpie Ci
24 rvus splende Hous row Co ns e C
25 urus adsimi lack go Dicr lis B Dron
26 ndrocopos hi ensi d er De malay s Woo peck
27 xcubito Grey Shrike Lanius e r
28 us migrans Pariah Kite Milv
29 acilla maderatensis Large ied wagtail Mot p
30 sser domesti Hous parrowPa cus e S
31 sser montanu Eura ree Sparrow Pa s sian T
32 otus caf ed d Bulbul Pycnon er R vente
33 nonotus leucogenys White Cheeked Bulbul Pyc
34 Indian Robin Saxicoloides fulicatus
35 ychus saul gp n Cops aris Ma ie Robi
36 ptopelia orie ott Stre ntalis Sp ed dove
37 s caudatus Com bbler Turdoide mon ba
38 rdus merula Blackbird Tu
Source: Pub ultation & Fo tm
The census data of Badrinath Forest Division and Kedarnath Sanctury in Kedarnath Forest Division given below
Table 3.9.11: Wildlife Cen o isio
lic Cons rest Depar ent
sus Data of Badrinath F rest Div n
S.No Species 1993 1999 2001 2003 2005 2008
1 Leapord 27 26 2 36 6 7 4
2 Bear 61 93 - 68 82 162
3 Jadav 39 71 - - 38 -
4 Kakad 113 237 - 147 194 567
5 Goral 132 384 - 341 364 369
6 Musk Deer 14 26 - - 18 3
7 Bharal - - - 26 4 -
8 Serow - 38 - 2 4 -
9 Deer - - - - 8 -
10 Chital - - - - 3 -

Project : Environmental Studies for Vishnugad Pipalkoti Hydro-Electric Project Page:125 Document : 2008026/EC/Final Report Date: Nov 2009 Chapter-3 : Baseline Environment, Impacts & Mitigation Measures Revision: R4
S.No Species 1993 1999 2001 2003 2005 2008
11 Wild Boar 248 134 - 522 179 164
12 Rabbit 12 08 - - - -
13 Fox - 14 - - 20 -
14 Monkey 3,103 2,147 3,878 4,102 - -
15 Langur 4,369 1,939 3,428 2,271 - -
16 Sambar - - - - - 40
17 Thar - - - - - 2
Total 8,118 5,117 8,226 7,645 24 1,184 Source: Badrinath Forest Division, Gopeshwar, 2008
Table 3.9.12 Census Data of Wildlife of Kedarnath Wildlife Sanctuary S.No Wildlife 1997 1999 2001 2003 2005 2008
1 Leopard 121 178 185 149 165 129
2 Musk Deer 0 0 61 63 37 67
3 Himalayan Thar 0 0 376 353 230 470
4 Serow 0 0 4 27 35 38
5 Wild Boar 0 0 755 776 832 942
6 Goral 0 0 606 810 695 762
7 Bear 0 0 128 162 132 94
8 Kakad 0 0 299 314 384 261
9 Sambar 0 0 262 181 173 138
10 Monkey 0 0 2,459 3,919 0 0
11 Langur 0 0 3,746 3,230 0 0
12 Porcupine 0 0 1 40 0 38
13 Marten 0 0 29 28 0 0
14 Jackal 0 0 0 31 0 0
Source: Kedarnath Wildlife Sanctuary, Gopeshwar, 2008
he wildlife data does not reflect any consistency it may be due to the difficulty in ounting the wildlife residing in the mountainous terrain. In Badrinath Forest division no. f wild boar has gone up. In Kedarnath wildlife sanctuary also wild boar shows highest
tion of Leopard is fluctuating and does not show any trend.
birds recorded during the survey were Shrike and White Cheek Bulbul.
3.9.7 E AFFECTED AREA
A) is comprised of 500m on both sides of project s, foothills and National Highways -58 and major
, Langsi, Helong, Tangni Jaisal, Mat, Tenduli,
Tcono. The popula
Birds were identified with binox. The common Myna, Magpai, Pigeon, Black Drongo, Grey
BIODIVERSITY OF PROJECT IMMEDIAT
The Project Immediate Affected Area (PIAsites. The main features are steep hill slopetown Pipalkoti and villages Haat, Pakhi

Project : Environmental Studies for Vishnugad Pipalkoti Hydro-Electric Project Page:126 Document : 2008026/EC/Final Report Date: Nov 2009 Chapter-3 : Baseline Environment, Impacts & Mitigation Measures Revision: R4
Guniyala, Dwing etc. The entire area interrupted by agricultural or horticultural activitieThe detail of forest types, Natural Flora and Fauna is discussed in detail below.
s.
rop. These slopes are e/ moderate forest. There
d area expect near Main
(I) malayan Chir Pine Forest Sub- group 9/C1 b
de between 750 - m to 2000m elevatio rghii (Chir) ure and gregarious form. The crop is irr ature trees
he top height of the chir crops ranges from 20 -45 m
roxburghii dendron - Lyoni
isia -Desm ctranthus
Forest Types
The Akaknanda valley has characteristic physiography. From Dam site to Pipalkoti the river passes through George shaped valley with steep slopes with rock outcdevoid of densare scattered pine trees in patches along the slopes without under cover. Habitation / villages are located on flat terrain or on gentle slope on both sides of the river. The lands near the villages are used by the habitants for cultivation and grazing of animals. No dense forest located in project affecte
a Adit.
View of Alaknanda Valley, Steep slopes with out forest cover
ScattereNo u
d open pine trees along the slope. nder story and middle story
View of Tapon Village in PIAA
Hi This type is most valley .
widely distributed, occupying the lower slope in the It occurs at altitu
Alaknanda river n. Pinus roxbu
occurs remarkably in p egular and mfew and widely scattered. T
Major Associates : Pinus – Rhodo - Abizzia
Minor Associates
: Woodfordia - Berberis - Rubus Artem odium – Ple

Project : Environmental Studies for Vishnugad Pipalkoti Hydro-Electric Project Page:127 Document : 2008026/EC/Final Report Date: Nov 2009 Chapter-3 : Baseline Environment, Impacts & Mitigation Measures Revision: R4
(ii) DS-I Him ical Scrub:
e patches where the over ed or has been unab
shallow soils. Th occurs up to 1500 m. This type is due to erence of grazing and burning. Debregeasia - Rhus - Woodfordia
- Cotonea rinsepia
fected area is represented by natural ue planta rried out along g NH-58 of
Cedrela too calyptus globulus azedarach by species were observed during survey. for trees follow 20
r grasses, 3 cli 2 pteridophytees an te. The detail n below.
.9.13: Flora o mediate Affecte
alayan Sub trop 9/ C1/DS1
This degradwood ha
ation stage occurs scatts either been destroy
red in the chir zone in perhaps le to develop owing to
excessively dry and is typeheavy biMajor As
otic interfsociates:
Minor Associates: Berberis ster- P
Natural Flora
The natural flora of the immediate af flora along theslopes, foothills, the aven tion ca the existinJacaranda mimosifolia, na, Eu & Melia Forests DepThe max
artment. A total number of 96imum number of 40 species accounted
planted by 26 for shrubs,
for herbs, 4 species fo mbers d 1 epiphyof flora recorded is give
Table 3 f Project Im d Area
S. No. Scientific name Local name Family
Trees
1. Aegle marmelos Bel Rutaceae
2. Aesculus indica Pangar Sapindaceae
3. Albizzia lebbek Siris Leguminosae
4. Alnus nepalensis Utis Betulaceae
5. Bauhinia variegata ar Kachn Leguminosae
6. Bombax ceiba Semal Malvaceae
7. Callistemon citrinus brush Bottle Myrtaceae
8. Cedrela toona Toon Meliaceae
9. Celtis australis Kharak Ulmaceae
10. Cinnamomum tamala ni Dalchi Luraceae
11. Citrus limon Nimu Rutaceae
12. Citrus sp Malta Rutaceae
13. Cupressus torulosa Surai Cupressaceae
14. Dalbergia sissoo Shisham Fabaceae
15. Delonix regia Gulmohar ceae Caesalpinia
16. Emblica officinalis eae Amla Euphorbiac
17. Eucalyptus globulus Safeda Myrtaceae
18. Ficus auriculata Timal Moraceae
19. Ficus bengalensis Bargad Moraceae
20. Ficus palmata Bedu Moraceae
21. Ficus religiosa Pipal Moraceae
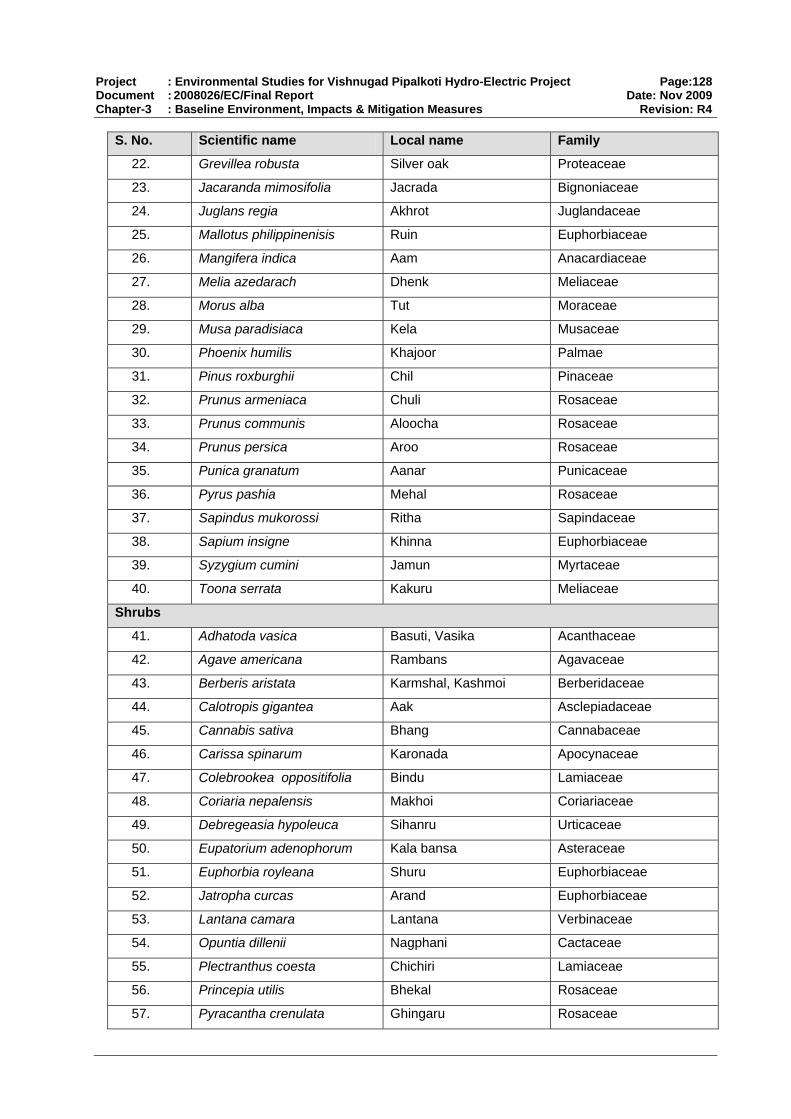
Project : Environmental Studies for Vishnugad Pipalkoti Hydro-Electric Project Page:128 Document : 2008026/EC/Final Report Date: Nov 2009 Chapter-3 : Baseline Environment, Impacts & Mitigation Measures Revision: R4
S. No. Scientific name Local name Family
22. Grevillea robusta k Silver oa Proteaceae
23. Jacaranda mimosifolia Jacrada Bignoniaceae
24. Juglans regia Akhrot Juglandaceae
25. Mallotus philippinenisis e Ruin Euphorbiacea
26. Mangifera indica Aam Anacardiaceae
27. Melia azedarach Dhenk Meliaceae
28. Morus alba Tut Moraceae
29. Musa paradisiaca Kela Musaceae
30. Phoenix humilis Khajoor Palmae
31. Pinus roxburghii Chil Pinaceae
32. Prunus armeniaca Chuli Rosaceae
33. Prunus communis Aloocha Rosaceae
34. Prunus persica Aroo Rosaceae
35. Punica granatum Aanar Punicaceae
36. Pyrus pashia Mehal Rosaceae
37. Sapindus mukorossi Ritha Sapindaceae
38. Sapium insigne eae Khinna Euphorbiac
39. Syzygium cumini Jamun Myrtaceae
40. Toona serrata Kakuru Meliaceae
Shrubs
41. Adhatoda vasica Basuti, Vasika ae Acanthace
42. Agave americana Rambans Agavaceae
43. Berberis aristata Karmshal, Kashmoi Berberidaceae
44. Calotropis gigantea Aak Asclepiadaceae
45. Cannabis sativa Bhang Cannabaceae
46. Carissa spinarum Karonada e Apocynacea
47. Colebrookea oppositifolia Bindu Lamiaceae
48. Coriaria nepalensis Makhoi Coriariaceae
49. Debregeasia hypoleuca ru Sihan Urticaceae
50. Eupatorium adenophorum bansa Kala Asteraceae
51. Euphorbia royleana Shuru Euphorbiaceae
52. Jatropha curcas Arand Euphorbiaceae
53. Lantana camara Lantana Verbinaceae
54. Opuntia dillenii Nagphani Cactaceae
55. Plectranthus coesta i Chichir Lamiaceae
56. Princepia utilis Bhekal Rosaceae
57. Pyracantha crenulata Ghingaru Rosaceae

Project : Environmental Studies for Vishnugad Pipalkoti Hydro-Electric Project Page:129 Document : 2008026/EC/Final Report Date: Nov 2009 Chapter-3 : Baseline Environment, Impacts & Mitigation Measures Revision: R4
S. No. Scientific name Local name Family
58. Ricinus communis Arandi Euphorbiaceae
59. Rosa brunonii Kunja Rosaceae
60. Rubus ellipticus Hinsar Rosaceae
61. Rubus niveus Kala Hinsalu Rosaceae
62. Rumex hastatus Bhilmora Polygonaceae
63. Urtica parviflora Kandali Urticaceae
64. Woodfordia floribunda Dhaula Lythraceae
65. Zanthoxylum alatum Timbur Rutaceae
66. Ziziphus mauritiana Ber Rhamnaceae
Herbs
67. Achyranthes aspera Aghada, Puthkanda Amaranthaceae
68. Argemone mexicana poppy e Prickly Papaveracea
69. Artemisia capillaris Pati Asteraceae
70. Artemisia vulgaris Pati Asteraceae
71. Bergenia ligulata Silphara Saxifragaceae
72. Bidens bipinnata Kuru Asteraceae
73. Calatropis procera eae Aak Asclepiadac
74. Cassia tora Chakunda eae Caesalpinac
75. Cestrum verutum Kanjalu Solanaceae
76. Chenopodium album Bathwa Chenopodiaceae
77. Datura suaveolens Datura Solanaceae
78. Euphorbia hirta Dudhi Euphorbiaceae
79. Fragaria indica Bhumla Rosaceae
80. Galinsoga parviflora Marchya Asteraceae
81. Heychium spicatum Banhaldi Zingiberaceae
82. Oxalis corniculata Amrit sak Oxalidaceae
83. Polygonum chinense Jangli palak Polygonaceae
84. Sonchus asper Dudhi Asteraceae
85. Thalictrum foliolosum Mamiri Ranunculaceae
86. Tridex procumbens Ground weed Amaranthaceae
Climbers
87. Bauhinia vahlii Malo Leguminosae
88. Clematis connata Kanguli Ranunculaceae
89. Ipomea purpurea Besharam Convolvulaceaea
Ferns
90. Pteris sp Fern Pteridaceae
91. Adiantum sp Fern Pteridaceae

Project : Environmental Studies for Vishnugad Pipalkoti Hydro-Electric Project Page:130 Document : 2008026/EC/Final Report Date: Nov 2009 Chapter-3 : Baseline Environment, Impacts & Mitigation Measures Revision: R4
S. No. Scientific name Local name Family
Epiphyte
92. Vanda roxburghii Badang Orchidaceae
Grasses
93. Apluda mutica Tachula Gramineae
94. Cynodon dactylon Dhub Gramineae
95. Chrysopogan fulvus Godia Gramineae
96. Parthenium hysterophorus Congress grass Compositae
Source
3.9.8 CT AFFE EA
rea (PAA) is comprised of, land acquired for establishment of A total of 141.55 hectares (ha) of land the d infrastructure and other activities under VPHEP. Of the total
9 ha (includes 23.13 ha land for underground works) is forest land o PWD and shall be transferred to project. The private land of
acquired for the pr
ed and categorized for their ecolo stics. The ed area is represented by 87 species. Physio-gnomically
categorized as trees, shrubs, he es, climbers, yphytes. Th dominated b ting maximum
followed by 26 species of shrubs, 3 grasses, 2 species of pteridophytes and one species of epiphyte.
corded at site are Eupatorium adenophoru (Kala bansa), a) Prinsepia ikul), Colebro tifolia (Bindu)
ar) Euphorbia royleana (Shuru), Berb (Kashmoi), d Zanthoxylum alatum (Timru) ytes were Adian sp and Drypteris on grass
tica (Tachula nodon dactylon (D
nd in the project affected area are common in occurance and ly throughout the n. None of the spec
ned category.
: Field survey CES, April-July, 2008
BIODIVERSITY OF PROJE CTED AR The Project Affected Avarious project units. is required to createnecessary facilities anland required, 100.3and 9.539 ha belongs t31.621 ha shall be oject. Natural Flora The species were identifi gical characteriflora of prvegetatio
oject affectn has been rbs grass
pteridophytes and epiph e trees y contribunumber climbers
of 34 species , 4 species of
18 species of herbs ,
The common shrubs re mAdhatoda vasica (Basing utilis (Bha okea opposiRubus ellipticus (His eris aristata Rubus nrepresen
iveus (Kala Hinsal) anted by ferns such as
. The pteridophsp. The commtum
species were Apluda mu ), Cya hub).
All the floral species fouare founendangered and threate
d abundant regio ies belonged to the rare,
Musa par Rubus ellipticu Bauh adisiaca (Kela) s (Hinsar) inia vahlii (Malo)

Project : Environmental Studies for Vishnugad Pipalkoti Hydro-Electric Project Page:131 Document : 2008026/EC/Final Report Date: Nov 2009 Chapter-3 : Baseline Environment, Impacts & Mitigation Measures Revision: R4
Table 3.9.14: Flora of Project Affected Areas S. No. Scientific name Local name Family
Trees
1. Aegle marmelos Bel Rutaceae
2. Albizzia lebbek Bhandir, Siris Leguminosae
3. Alnus nepalensis Utis Betulaceae
4. Bauhinia variegate ar Kachn Leguminosae
5. Bombax ceiba Semal Malvaceae
6. Cedrela toona Toon Meliaceae
7. Celtis australis Kharak Ulmaceae
8. Citrus limon Nimu Rutaceae
9. Citrus sp Malta Rutaceae
10. Cupressus torulosa ae Surai Cupressace
11. Dalbergia sissoo Shisham Fabaceae
12. Emblica officinalis Amla Euphorbiaceae
13. Ficus auriculata Timal Moraceae
14. Ficus bengalensis Bargad Moraceae
15. Ficus palmate Bedu Moraceae
16. Ficus religiosa Pipal Moraceae
17. Grevillea robusta Silver oak Proteaceae
18. Juglans regia Akhrot Juglandaceae
19. Mallotus philippinenisis e Ruin Euphorbiacea
20. Mangifera indica Aam Anacardiaceae
21. Melia azedarach Dhenk Meliaceae
22. Morus alba Tut Moraceae
23. Musa paradisiacal Kela Musaceae
24. Phoenix humilis Khajoor Palmae
25. Pinus roxburghii Chil Pinaceae
26. Prunus armeniaca Chuli Rosaceae
27. Prunus communis Aloocha Rosaceae
28. Prunus persica Aroo Rosaceae
29. Punica granatum Aanar Punicaceae
30. Pyrus pashia Mehal Rosaceae
31. Sapindus mukorossi Ritha Sapindaceae
32. Sapium insigne eae Khinna Euphorbiac
33. Syzygium cumini Jamun Myrtaceae
34. Toona serrata Kakuru Meliaceae
Shrubs

Project : Environmental Studies for Vishnugad Pipalkoti Hydro-Electric Project Page:132 Document : 2008026/EC/Final Report Date: Nov 2009 Chapter-3 : Baseline Environment, Impacts & Mitigation Measures Revision: R4
S. No. Scientific name Local name Family
35. Adhatoda vasica Basinga ae Acanthace
36. Agave Americana Rambans Agavaceae
37. Berberis aristata Karmshal, Kashmoi Berberidaceae
38. Calotropis gigantea Aak Asclepiadaceae
39. Cannabis sativa Bhang Cannabaceae
40. Carissa spinarum Karonada e Apocynacea
41. Colebrookea oppositifolia Bindu Lamiaceae
42. Coriaria nepalensis Makhoi Coriariaceae
43. Debregeasia hypoleuca Sihanru Urticaceae
44. Eupatorium adenophorum sa Kala ban Asteraceae
45. Euphorbia royleana Shuru Euphorbiaceae
46. Jatropha curcas Arand Euphorbiaceae
47. Lantana camara Lantana Verbinaceae
48. Opuntia dillenii Nagphani Cactaceae
49. Plectranthus coesta Chichiri Lamiaceae
50. Princepia utilis Bhekal Rosaceae
51. Pyracantha crenulata Ghingaru Rosaceae
52. Ricinus communis Arandi Euphorbiaceae
53. Rosa brunonii Kunja Rosaceae
54. Rubus ellipticus Hinsar Rosaceae
55. Rubus niveus Kala Hinsalu Rosaceae
56. Rumex hastatus Bhilmora Polygonaceae
57. Urtica parviflora Kandali Urticaceae
58. Woodfordia floribunda Dhaula Lythraceae
59. Zanthoxylum alatum Timbur Rutaceae
60. Ziziphus mauritiana Ber Rhamnaceae
Herbs
61. Achyranthes aspera , Puthkanda eae Aghada Amaranthac
62. Argemone mexicana Prickly poppy e Papaveracea
63. Artemisia capillaris Pati Asteraceae
64. Bidens bipinnata Kuru Asteraceae
65. Bergenia ligulata ra Silpha Saxiferaceaa
66. Cassia tora Chakunda ae Caesalpinace
67. Cestrum verutum Kanjalu Solanaceae
68. Chenopodium album Bathwa Chenopodiaceae
69. Datura suaveolens Datura Solanaceae
70. Euphorbia hirta Dudhi Euphorbiaceae
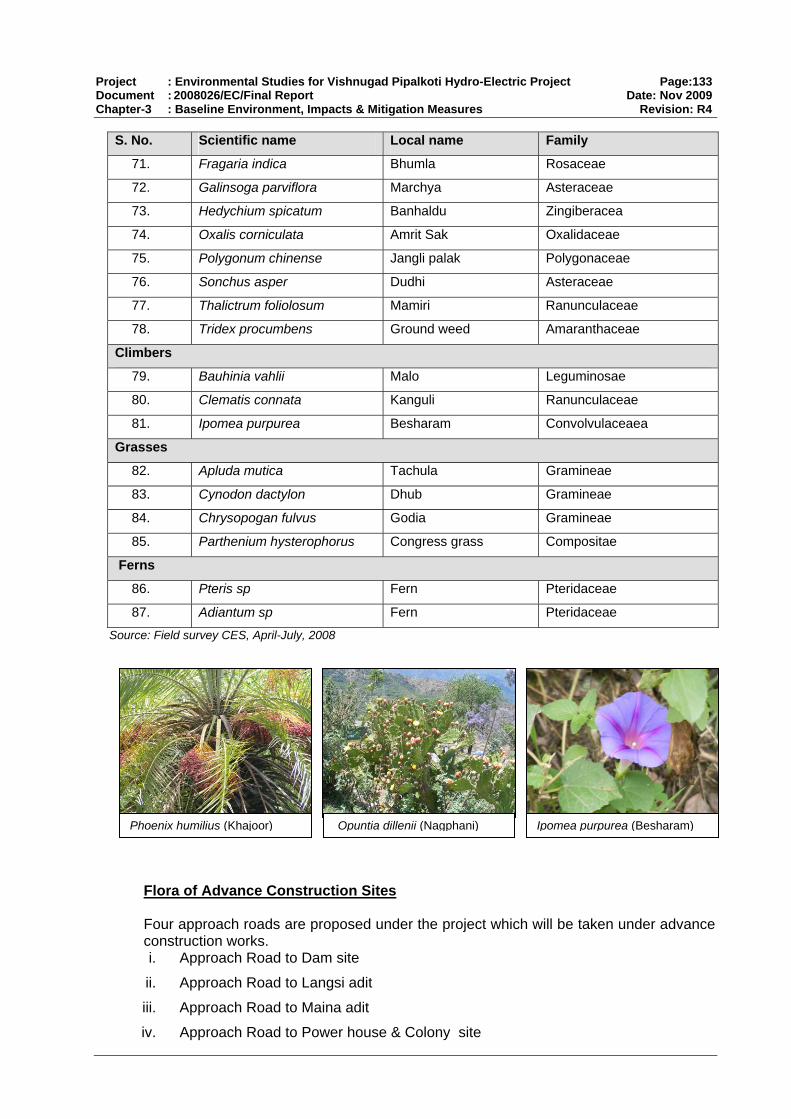
Project : Environmental Studies for Vishnugad Pipalkoti Hydro-Electric Project Page:133 Document : 2008026/EC/Final Report Date: Nov 2009 Chapter-3 : Baseline Environment, Impacts & Mitigation Measures Revision: R4
S. No. Scientific name Local name Family
71. Fragaria indica Bhumla Rosaceae
72. Galinsoga parviflora Marchya Asteraceae
73. Hedychium spicatum Banhaldu Zingiberacea
74. Oxalis corniculata Amrit Sak Oxalidaceae
75. Polygonum chinense Jangli palak Polygonaceae
76. Sonchus asper Dudhi Asteraceae
77 miri Ranunculaceae . Thalictrum foliolosum Ma
78. Tridex procumbens Ground weed Amaranthaceae
Climbers
79. Malo Leguminosae Bauhinia vahlii
80 Kanguli Ranunculaceae . Clematis connata
8 Besharam Convolvulaceaea 1. Ipomea purpurea
Gra sses
82 ula Gramineae . Apluda mutica Tach
83. Cynodon dactylon Dhub Gramineae
84. Chrysopogan fulvus Godia Gramineae
85. Parthenium hysterophorus Congress grass Compositae
Ferns
86. Pteris sp Fern Pteridaceae
87. Adiantum sp Fern Pteridaceae
Sourc
ructi es
e: Field survey CES, April-July, 2008
O IpPhoenix humilius (Khajoor) dillenii (Nagphani) omea purpurea (Besharam)puntia
Flora of Advance Const on Sit
re prop nder th hich w n under advance
Dam s
ngsi adit
Approach Road to Maina adit
iv. Approach Road to Power house & Colony site
Four approach roads a osed u e project w ill be takeconstruction works. i. Approach Road to ite
ii. Approach Road to La
iii.

Project : Environmental Studies for Vishnugad Pipalkoti Hydro-Electric Project Page:134 Document : 2008026/EC/Final Report Date: Nov 2009 Chapter-3 : Baseline Environment, Impacts & Mitigation Measures Revision: R4
i Approach Road to Da
am s div NH-58 ong The site p rou rea dy is based on lora o ea is tree of re o out o ecie , 12 s, 9 ber terid e rec om cies
Pinus roxbu (Alnus nepalensis), Albizzia lebbek), rulosa), Bakel ( The sents the of the s ecolog s a ed
Red List. All the e c c
.1 f Ap Da
m Site
The approach road to D ite will be erted from near Hel village. approach road to dam asses th gh the forest a . The stuextensiveTotal 3
field survey. F6 plant species we
f the arbserved
dominated byf which 10 sp
species s of trees
Forest Trees. of shrub
of herbs 2 grass 1 clim and 2 p ophytes wer orded. D inant specompriSurai (
se of Pine (Cupressus to
rghii), Utis Princepia utilis)
Bhandir (Berberis aristata). and Kilmora (
table given below pre Flora area and it ical statu s per the RData Book of India by Nayar and specie
Shastry and (1987-90) and IUCN ommon in os found at the site ar currence.
Table 3.9 5: Flora o proach Road to m Site
Ecological Status S.No Botanical Name Local Name
Family IUCN RDB
Trees
1. Albizzia lebbek Bhandir ae Leguminos Common Common
2. Alnus nepalensis Utis Betulaceae Common Common
3. Bauhinia variegata Kuiral ae Caesalpinace Common Common
4. Cedrela toona Tun Meliaceae Common Common
5. Celtis australis Kharik Ulmaceae Common Common
6. Cupressus torulosa ae Surai Cupressace Common Common
7. Ficus palmata Bedu Moraceae Common Common
8. Grevillea robusta Silver Oak Proteaceae Common Common
9. Melia azedarach Dhenkan Meliaceae Common Common
10. Pinus roxburghii Chir Pinaceae Common Common
Shrubs
11. Agave americana s Agavaceae Common Common Ramban
12. Berberis aristata Kilmora Berberidaceae Common Common
13. Cannabis sativa Bhang Cannabaceae Common Common
14. Coriaria nepalensis Makhoi Coriariaceae Common Common
15. Eupatorium Kala bansa Asteraceae Common Common adenophorum
16. Princepia utilis Bekal Rosaceae Common Common
17. Pyracantha crenulata aroo Ghing Rosaceae Common Common
18. Rubus ellipticus lu Hinsa Rosaceae Common Common
19. Rumex hastatus Almora Polygonaceae Common Common
20. Urtica parviflora Kandali Urticaceae Common Common
21 Rhamnaceae Common Common . Ziziphus mauritiana Ber
22. Zanthoxylum alatum Timru Rutaceae Common Common
Herbs
23. Artemisia capillaris Pati Compositae Common Common

Project : Environmental Studies for Vishnugad Pipalkoti Hydro-Electric Project Page:135 Document : 2008026/EC/Final Report Date: Nov 2009 Chapter-3 : Baseline Environment, Impacts & Mitigation Measures Revision: R4
Ecological Status S.No Botanical Name Local Name
Family IUCN RDB
24. Bidens bipinnata Kuru Asteraceae Common Common
25. Cestrum verutum Kanjalu Solanaceae Common Common
26. Fragaria indica Bhumla Rosaceae Common Common
27. Galinsoga parviflora Marchya Asteraceae Common Common
28. Oxalis corniculata Bhilmora Oxalidaceae Common Common
29. Parthenium hysterophorus
Gajar ghas Asteraceae Common Common
30. Sonchus as Common per Dudhi Asteraceae Common
31. Tridex procumbens und d
thaceae mon Growee
Amaran Common Com
Grasses
32. Chrysopogan fulvus e Godia Graminea Common Common
33. Eulaliopsis binata e Babula Graminea Common Common
Climbers
34. Cryptolepsis buchananii hi Ascle aceae Dud piad Common Common
Pteridophytes
35. Adiantum sp Fern Adiantaceae Common Common
36. Dryopteris Fern Dryopteridaceae Common Common
Source: Field surv
ii
Lan nd ge. section o from s int on NH-58 to
st of old road route th whi doned now. The y flo 70 an oad was d from Pakhi to
side after crossing Alaknanda it crosses Tapon stream which is three times in
gnmen ses through agricultural fields side of the river.
cies are ed out 7 are tr hrubs , 2 and 2 phytes species were recorded. Fruit t
nus persica), Dalim (Punica granatum), Banana (Musa paradisiaca), Akrot n (C on) were observed near Tapon and Dwing villages species found are common and present abundantly in the area.
Table 3.9 ora of Ap d to Langsi Adit
ey CES, April-July, 2008
Approach Road to Langsi Adit
The Approach road to gsi adit starts from NH -58 and crosses River Alaknanda aendsAlakn
near Dwing villaanda river consi
The f the road to Badrina
tarting poch is aban
Road was washed b od in 19 d new r constructeLangvulnerable to flood. The Bridge on Tapon stream was wa
si Village. On right shed away
2004. The road alin t pas on both
Totagrass
l 44 plant spe, 2 climbers
recordpterido
of which 1 ees, 13 s , 8 herbsrees of Aru
(Pru(Juglans regia), Lemo itrus limon agricultural land. All
.16: Fl proach Roa
Ecological Status S.No Botanical Name Local Name
Family IUCN RDB
Trees
1. Boehmeria regulosa Genthi Urticaceae Common Common
2. Cedrela toona Tun Meliaceae Common Common
3. Citrus limon Nimu Rutaceae Common Common

Project : Environmental Studies for Vishnugad Pipalkoti Hydro-Electric Project Page:136 Document : 2008026/EC/Final Report Date: Nov 2009 Chapter-3 : Baseline Environment, Impacts & Mitigation Measures Revision: R4
Ecological Status S.No Botanical Name Local Name
Family IUCN RDB
4. Citrus sp Malta Rutaceae Common Common
5. Cupressus torulosa Surai Cupressaceae Common Common
6. Emblica officinalis eae Amla Euphorbiac Common Common
7. Ficus auriculata Timal Moraceae Common Common
8. Ficus palmata Bedu Moraceae Common Common
9. Grevillea robusta Silver Oak Proteaceae Common Common
10. Juglans regia Akrot Juglandaceae Common Common
11. Melia azedarach Dhenkan Meliaceae Common Common
12. Musa paradisiaca Kela Musaceae Common Common
13. Phoenix humilius Khajoor Palmae Common Common
14. Pinus roxburghii Chir Pinaceae Common Common
15. Prunus persica Aru Rosaceae Common Common
16. Punica granatum Dalim Punicaceae Common Common
17. Pyrus pashia Mehal Rosaceae Common Common
Shrubs
18. Berberis aristata Kilmora ae Berberidace Common Common
19. Cannabis sativa e Bhang Cannabacea Common Common
20. Coleoppo
brookea sitifolia
Bindu Lamiaceae Common Common
21. Coriaria nepalensis Makhoi Coriariaceae Common Common
22. Debregeasia hypoleuca
Sihanru Urticaceae Common Common
23. Eupatorium
Kala bansa Asteraceae Common Common adenophorum
24. Euphorbia royleana Shuru Euphorbiaceae Common Common
25. Princepia utilis Bekal Rosaceae Common Common
26. Pyracantha crenulata Ghingaroo Rosaceae Common Common
27. Rubus ellipticus Hinsalu Rosaceae Common Common
28. insalu Rosaceae Common Common Rubus niveus Kala H
29. Rumex hastatus Almora Polygonaceae Common Common
30. Urtica parviflora Kandali Urticaceae Common Common
Herbs
31. Artemisia capillaris Pati Compositae Common Common
32. Common Bidens bipinnata Kuru Asteraceae Common
33. Cestrum verutum Kanjalu Solanaceae Common Common
34. Galinsoga parviflora Marchya Asteraceae Common Common
35. Oxalis corniculata Bhilmora Oxalidaceae Common Common
36. Parthenium hysterophorus
Gajar ghas Asteraceae Common Common

Project : Environmental Studies for Vishnugad Pipalkoti Hydro-Electric Project Page:137 Document : 2008026/EC/Final Report Date: Nov 2009 Chapter-3 : Baseline Environment, Impacts & Mitigation Measures Revision: R4
Ecological Status S.No Botanical Name Local Name
Family IUCN RDB
37. Dudhi Asteraceae Common Common Sonchus asper
38. Tridex procum Common bens Ground weed Amaranthaceae Common
Grasses
39. Chrysopogan fulvus Gramineae on on Godia Comm Comm
40. Cynadon dactylon Dhub Gramineae Common Common
Climbers
41. Bauhinia vahlii Malo Leguminosae Common Common
42. Ipomea purpurea Besharam Convovulaceae Common Common
Pteridophytes
43. Adiantum sp Fern Adiantaceae Common Common
44. Dryopteris Fern Dryopteridaceae Common Common
S
iii ina Adit
to Maina Adit starts from NH-58 near Pipalkoti. The r es ar lage Maina nduli, Maath and
side of river is sparse wit tered bushes. urring a mmon in nd ly throughout the
e crossing ome pla s observed. The te e forest, and thor .
rest after Guniyala vil e road s the Maina Adit (Silpara),
nhaldi) and Thalictrum foliolosum (Mamiri) are reported in the forest area e s l in catego r IUC st. s a on in aya and in
1000 00 m. ar on c nd ed ed Data Book of Indian F l 51 p
the area f which 5 shru rbs, 3 grasses, 3
Table 3.9.17 to Maina Ad
ource: Field survey CES, April-July, 2008
Approach Road to Ma
The approach road oad crossriver Alaknanda. There e three vil enroute to Adit -TeGuniyala village. Vegetation on Left All th
h some scat abundante species occ
On the righre co nature and fou
valley. flora
t sidof the area constitu
after of Pin
the river sfruit trees,
ntation wany shrubs
Thersite.
e is a dense foThree herb species
lages as th approacheHedychium spicatum Bergenia ligulata
(Banear Maina adit, thes pecies fal vulnerable ry as pe N Red liHowealtitu
ver these speciedinal range from
re commm to 30
India in Himal These species
n region e in comm
are foundategory a
does not fall in threaten list of R lora. Tota lant species wereclimber and 2 fern.
observed in out o 16 trees, 1 bs, 12 he
: Flora of Approach Road it
Ecological Status S.No Botanical Name Local Family Name IUCN RDB
Trees
1. Albizzia lebbek r Bhandi Leguminosae Common Common
2. Alnus nepalensis Utis Betulaceae Common Common
3. Bauhinia purpurea Kuiral Leguminosae Common Common
4. Boehmeria regulosa Genthi Urticaceae Common Common
5. Cedrela toona Tun Meliaceae Common Common
6. Celtis australis Kharik Ulmaceae Common Common

Project : Environmental Studies for Vishnugad Pipalkoti Hydro-Electric Project Page:138 Document : 2008026/EC/Final Report Date: Nov 2009 Chapter-3 : Baseline Environment, Impacts & Mitigation Measures Revision: R4
Ecological Status S.No Botanical Name Local Name
Family IUCN RDB
7. Cinnamomum tamala Dalchini Luraceae Common Common
8. Cupressus torulosa Surai Cupressaceae Common Common
9. Emblica officinalis Amla Common Common Euphorbiaceae
10. Ficus auriculata Timal Moraceae Common Common
11. Ficus palmata Bedu Moraceae Common Common
12. Grevillea robusta Silver oak Proteaceae Common Common
13. Mallotus philippinenisis
Ruin Euphorbiaceae Common Common
14. Pinus roxburghii Chir Pinaceae Common Common
15. Prunus communis Alu bukhara Rosaceae Common Common
16. Toona serrata Kakuru Meliaceae Common Common
Shrubs
17. Agave americana Rambans Agavaceae Common Common
18. Berberis aristata e Kilmora Berberidacea Common Common
19. Cannabis sativa Bhang Cannabaceae Common Common
20. Colebrookea oppositifolia
Bindu Lamiaceae Common Common
21. Coriaria nepalensis Makhoi Coriariaceae Common Common
22. Debregeasia hypoleuca
Sihanru Urticaceae Common Common
23. Eupatorium adenophorum
Kala bansa Asteraceae Common Common
24. Princepia utilis Bekal Rosaceae Common Common
25. Pyracantha crenulata Ghingaroo Rosaceae Common Common
26. Rubus ellipticus Hinsalu Rosaceae Common Common
27. Rubus niveus Kala Hinsalu Rosaceae Common Common
28. Rumex hastatus Almora Polygonaceae Common Common
29. Urtica parviflora li Kanda Urticaceae Common Common
30. Woodfordia floribunda
Dhaula Lythraceae Common Common
31. Ziziphus mauritiana Ber Rhamnaceae Common Common
Herbs
32. Artemisia capillaris Pati Compositae Common Common
33. Kuru Asteraceae Common Common Bidens bipinnata
34. Bergenia ligulata Silphara Saxifragaceae Vulnerable Common
35. Cestrum verutum Kanjalu Solanaceae Common Common
36. Galinsoga parviflora Marchya Asteraceae Common Common
37. Hedychium spicatum Banhaldi Zingiberaceae Vulnerable Common
38. Oxalis corniculata Bhilmora Oxalidaceae Common Common
39. hysterophorus
Parthenium Gajar ghas Asteraceae Common Common
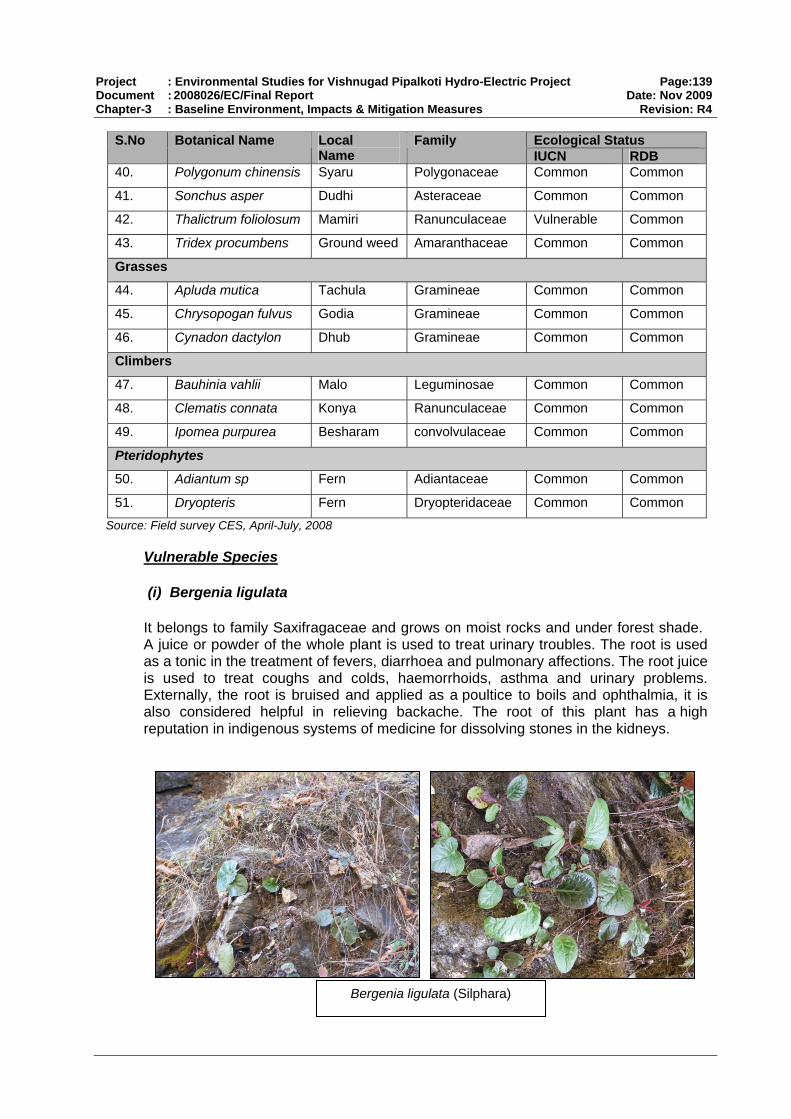
Project : Environmental Studies for Vishnugad Pipalkoti Hydro-Electric Project Page:139 Document : 2008026/EC/Final Report Date: Nov 2009 Chapter-3 : Baseline Environment, Impacts & Mitigation Measures Revision: R4
Ecological Status S.No Botanical Name Local Name
Family IUCN RDB
40. Polygonum chinensis Syaru Polygonaceae Common Common
41. Sonchus asper Dudhi Asteraceae Common Common
42. Thalictrum foliolosum Mamiri Ranunculaceae Vulnerable Common
43. Tridex procumbens Ground weed Amaranthaceae Common Common
Grasses
44. Apluda mutica Tachula Gramineae Common Common
45. Chrysopogan fulvus Godia Gramineae Common Common
46. Cynadon dactylon Dhub Gramineae Common Common
Climbers
47. Bauhinia vahlii Malo Leguminosae Common Common
48. Clematis connata Konya Ranunculaceae Common Common
49. Ipomea purpurea Besharam convolvulaceae Common Common
Pteridophytes
50. Adiantum sp Fern Adiantaceae Common Common
51. ridaceae Common Common Dryopteris Fern Dryopte
Source: Field survey CES, April-July, 2008
Vulnerable Species
(i) Bergenia ligulata
It belongs to family Saxifragaceae and grows on moist rocks and under forest shade. A juice or powder of the whole plant is used to treat urinary troubles. The root is used as a tonic in the treatment of fevers, diarrhoea and pulmonary affections. The root juice
used to treat coughs and colds, haemorrhoids, asthma and urinary problems. Externally, the root is bruised and applied as a poultice to boils and ophthalmia, it is
lso considered helpful in relieving backache. The root of this plant has a high reputation in indigenous systems of medicine for dissolving stones in the kidneys.
is
a
Bergenia ligulata (Silphara)

Project : Environmental Studies for Vishnugad Pipalkoti Hydro-Electric Project Page:140 Document : 2008026/EC/Final Report Date: Nov 2009 Chapter-3 : Baseline Environment, Impacts & Mitigation Measures Revision: R4
Propagation : By seeds. Seed, sown as soon as it is ripe in late spring is liable to germinate better than stored seed. When they are large enough to handle, prick the seedlings out into individual pots and grow them in light shade in the greenhouse for at least their first winter. Plant them out into their permanent positions in late spring or
xpected frosts
poisoning. It is also used in treating fever, snake bite and indigestion.
Propogation : By rhizomes. Best sown as soon as it is ripe in a warm greenhouse at 18°c. Prick out the seedlings into individual pots when they are large enough to handle and grow them on for at least their first winter in the greenhouse. Plant out in late spring after the last expected frosts. Dig up the clump and divide it with a sharp spade
owing shoot. Larger clumps can be , but it is best to pot up the smaller
refers light (sandy), medium (loamy) and heavy (clay) soils and requires well-drained soil. The root is antiperiodic, diuretic, febrifuge, ophthalmic, purgative, for atonic dyspepsia and is also useful in treating peptic ulcers, indig e,
ae r con ence af s leaves is pplied to boils and pimpl
Seed - best sown as soon as it is ripe in the autumn in a cold m re large enough to handle, prick the seedlings out into individual
early summer, after the last e
(ii) Hedychium spicatum
It belongs to Zingiberaceae family. It is found near forest clearings and shrubberies. The plant prefers light (sandy), medium (loamy) and heavy (clay) soils. The plant prefersacid, neutral and basic (alkaline) soils. It cannot grow in the shade. It requires moist soil. The rhizome is considered as stomachic, carminative, stimulant and useful for liver complaints, diarrhea and food
Hedychium spicatum (Banhaldi)
or knife, making sure that each division has a grplanted out direct into their permanent positionsdivisions and grow them on in a greenhouse until they are established. Plant them out in the summer or late in the following spring
(iii) Thalictrum foliolosum
It is a herbaceous plant and belongs to Ranunculaceae family.It is found in Forests and shrubberies. The plant p
salve, stomachic and tonic. It is considered to be a good remedy estion, fevers, toothach
. The juice of the ha
morrhoids and fo valesces
ter acute disease
Propogation : By seeds.fra e. When they a

Project : Environmental Studies for Vishnugad Pipalkoti Hydro-Electric Project Page:141 Document : 2008026/EC/Final Report Date: Nov 2009 Chapter-3 : Baseline Environment, Impacts & Mitigation Measures Revision: R4
pots and plant them out summe ed can a outdoor eedbed in spring. Plant them into their permanent position llowing spring
iv owe & Colo
to powerhouse and colony starts from NH-58 near Pipalkoti and site. The Road
ses through agricultural and barren area. Some part of the old foot route to ank er is p is in peop t to
plant species were observed in the area out of which 16 are rbs, , 2 c 2 fern ll the species are
e.
: Flora of Approach u y Site
in the r. The se lso be sown in ans s the fo
Approach Road to P rhouse ny Site
Thecrosses rive
approach roadr Alaknanda and ends near Haat village at the Power house
traverBadrinath on Right b of the riv resent which used by le of Haacommunicate. Total 49 trees, 19 shrubs, 8 he 2 grasses limber and species. Acommon in occurrenc
Table 3.9.18 Road to Powerho se & Colon
Ecological Status
Thalictrum foliolosum (mamiri)
S.No
Botanical Name Local Name
Family
IUCN RDB
Trees
1. Aegle marmelos Bel Rutaceae Common Common
2. Bahunia variegata Kwiryal Leguminosae Common Common
3. Bombax ceiba Semal Malvaceae Common Common
4. Cedrela toona Tun Meliaceae Common Common
5. Citrus limon Nimu Rutaceae Common Common
6. Ficus auriculata Timla Moraceae Common Common
7. Ficus palmata Bedu Moraceae Common Common
8. Ficus religiosa Pipal Moraceae Common Common
9. Mangifera indica Aam Anacardiaceae Common Common
10. Melia azedarach Dhenkan Meliaceae Common Common
11. Phoenix humilius Khajoor Palmae Common Common
12. Pinus roxburghii Chir Pinaceae Common Common
13. Prunus persica Adu Rosaceae Common Common

Project : Environmental Studies for Vishnugad Pipalkoti Hydro-Electric Project Page:142 Document : 2008026/EC/Final Report Date: Nov 2009 Chapter-3 : Baseline Environment, Impacts & Mitigation Measures Revision: R4
Ecological Status S.No
Botanical Name Local Name
Family
IUCN RDB
14. Punica granatum Danim Punicaceae Common Common
15. Sapindus mukurossi Ritha Sapindaceae Common Common
16. Sapium insigne Khinna e Euphorbiacea Common Common
Shrubs
17. Adhatoda vasica Basinga Acanthaceae Common Common
18. Agave americana Rambans Agavaceae Common Common
19. Berberis aristata e Kilmora Berberidacea Common Common
20. Cannabis sativa Bhang Cannabaceae Common Common
21. Calotropis gigantea Aak Asclepiadaceae Common Common
22. Coopp
lebrookea ositifolia
Bindu Lamiaceae Common Common
23. Debregeasia hypoleuca
Siyaru Urticaceae Common Common
24. Eupatorium adenophorum
ansa Kala b Asteraceae Common Common
25. Euphorbia royleana Sullu Euphorbiaceae Common Common
26. Jatropha curcas Arand Euphorbiaceae Common Common
27. Lantana camara Kuri Verbeaceae Common Common
28. Opuntia dillenii ani Nagph Cactaceae Common Common
29. Princepia utilis Bekal Rosaceae Common Common
30. Pyracantha crenulata Ghingaroo Rosaceae Common Common
31. Rosa brunonii Kunj Rosaceae Common Common
3 Rosaceae Common Common 2. Rubus ellipticus Hinsalu
33. Rubus niveus Kala Hinsalu Rosaceae Common Common
34. Urtica parviflora Kandali Urticaceae Common Common
35. Ziziphus mauritiana Ber Rhamnaceae Common Common
Herbs
3 mon 6. Argemone mexicana Satyanasi Papaveraceae Common Com
37. Artemisia capillaris Pati Compositae Common Common
38. Cassia tora Chakunda Caesalpinaceae Common Common
39. Cestrum verutum Kanjalu Solanaceae Common Common
40. Oxalis corniculata Bhilmora Oxalidaceae Common Common
41. Parthenium hysterophorus
Gajar ghas Asteraceae Common Common
42. Polygonum chinensis Syaru Polygonaceae Common Common
43. Tridex procumbens Ground weed Amaranthaceae Common Common
Grasses
44. Apluda mutica Tachula Gramineae Common Common
45. Cynadon dactylon Dhub Gramineae Common Common

Project : Environmental Studies for Vishnugad Pipalkoti Hydro-Electric Project Page:143 Document : 2008026/EC/Final Report Date: Nov 2009 Chapter-3 : Baseline Environment, Impacts & Mitigation Measures Revision: R4
Ecological Status S.No
Botanical Name Local Name
Family
IUCN RDB
Climbers
46. Bauhinia vahlii Malo Leguminosae Common Common
47. Ipomea purpurea Besharam Convolvulaceae Common Common
Pteridophytes
48. Adiantum sp Fern Adiantaceae Common Common
49. Dryopteris Fern Dryopteridaceae Common Common
Source: Field survey CES, Ap
ntitative Assessme t of Flo portan e and sity inde flora o ject a
conduc po e Val ex (IV resse minan ess of an cie n are reas D ty Ind express
cies in an a he domin by con ng ma um num followed by pec f shr 16 spe of he
species of pt
f the dam s rep ted b ntation lnus lensis (Utis), ata (Guiriyal), Cup s toru palm (Bedu) s
ciliatenophorum ica lora are dominant s. Am grass
dactylon lis culata a minan is rep ted /F ra ich sho at mo f the s
Table 3.9.19: men lora of Dam Site
ril-July, 2008
Qua n raAssessment of Im ce Valu Index Diver x of f Pro ffectedareas has beenecological succ
ted. Imy spe
rtancs in a
ue Inda whe
I) expiversi
s doex
ce andes the
variety of spe rea. T trees ated tributi xim ber of34 species 26 s ies o ubs, cies rbs , 3 climbers, 4species of grasses, 2 eridophytes and one species of epiphyte.
The flora o ite is resen y pla of A nepaBauhinia varieg ressu losa (Surai) Ficus ata , Pinuroxburghii (Chir) and ToonaEupatorium ad
e (Toon) bparvif
y Forest Department. Among shrubs , Urt specie ong es and
herbs Cynodon , Oxa corni and Fragaria indica re do t. Thedistribution patternare random (.025-.05) and contagio
resen by Aus (> 0.05) in distributio
tio wh ws thn.
st o pecies
Assess t of F
Name R.Frequency
R.Density R.Abundance
A/F Density / (ha)
IVI
Trees
Pinus roxburghii 21.74 26.36 9.76 0.03 143 57.85
View of Quadrat study at Dam site View of Quadrat study at Co ite lony s

Project : Environmental Studies for Vishnugad Pipalkoti Hydro-Electric Project Page:144 Document : 2008026/EC/Final Report Date: Nov 2009 Chapter-3 : Baseline Environment, Impacts & Mitigation Measures Revision: R4
Name R.Frequency
R.Density R.Abundance
A/F Density / (ha)
IVI
Trees
Bauhinia variegata 8.70 5.27 4.88 0.04 29 18.85
Phoenix humilis 4.35 2.64 4.88 0.07 14 11.86
Cedrela toona 8.70 8.12 7.50 0.05 43 24.31
Alnus nepalensis 8.70 8.12 7.50 0.05 43 24.31
Albizzia lebbek 8.70 5.41 5.00 0.04 29 19.11
Cupressus torulosa 8.70 16.23 15.00 0.11 86 39.93
Dalbergia sissoo 4.35 2.71 5.00 0.07 14 12.05
Melia azedarach 4.35 5.41 10.00 0.14 29 19.76
Ficus palmata 4.35 5.41 10.00 0.14 29 19.76
Boehmeria regulosa 4.35 5.41 10.00 0.14 29 19.76
Pyrus pashia 4.35 2.71 5.00 0.07 14 12.05
Celtis australis 8.70 5.41 5.00 0.04 29 19.11
Shrubs
Colebrookea op 25.79 positifolia 10.71 7.90 7.17 0.05 343
Eupatorium adenophoru 5 .50 m 17.86 25.02 13.63 0.0 1086 56
Urtica parviflora 10.71 11.85 0.07 14 33.32 10.76 5
Princepia utilis 7.14 3.95 5.38 0.05 171 16.47
Ricinus communis 3.57 57 1.32 3.59 0.07 8.47
Berberis aristata 7.14 171 3.95 5.38 0.05 16.47
Plectranthus coesta .57 171 3 3.95 10.76 0.21 18.28
Pyracantha crenulata 7.14 114 2.63 3.59 0.04 13.36
Cannabis sativa 10.71 13.17 571 11.96 0.08 35.84
Rosa brunonii 14.29 11.85 514 8.07 0.04 34.21
Rumex hastatus 7.14 14.48 629 19.73 0.19 41.35
Herbs
Oxalis corniculata 13.35 18.87 14286 23.26 0.18 55.48
Ipomaea purpurea 13.35 7143 9.44 11.63 0.09 34.41
Tridex procumbens 13.35 15.10 11429 18.60 0.14 47.05
Euphorbia hirta 20.03 5714 7.55 6.20 0.03 33.78
Fragaria indica 20.03 22.65 17143 18.60 0.09 61.28
Cynodon dactylon 20.03 26.42 20000 21.71 0.11 68.15
portance Value
a olony s mprise ntatio op rren areas. The hii. Other important species Cedr
ressus sa and s palm The inan rub spe re Eupatorium adenophorum, Colebrookea oppositifolia, Plectranthus coesta and Rumex
Note: IVI: Im Index
The Power housearea is dominated by
nd cPinus roxburg
ite co of pla n and en bacomprise of ela
toona, Cup torulo Ficu ata. dom t sh cies a

Project : Environmental Studies for Vishnugad Pipalkoti Hydro-Electric Project Page:145 Document : 2008026/EC/Final Report Date: Nov 2009 Chapter-3 : Baseline Environment, Impacts & Mitigation Measures Revision: R4
hastatus. Parthenium hysterophorus is dominant grass species occurring in the area. The distribution pattern is represented by A/F ratio which shows that most of the
are random -.05) a tagiou 5) in ibut
Table 3 ss f Flora werh Co Site
species (.025 nd con s (> 0.0 distr ion.
.9.20: Asse ment o of Po ouse & lony
Name R.Frequency
R.Density R.Abundance
A/F Density (ha)
IVI
Trees
Ficus auriculata 3.85 4.54 8.63 0.14 29 17.02
Mangifera indica 7.69 4.54 4.32 0.04 29 16.55
Cedrela toona 11.54 13.63 8.63 0.05 86 33.80
Phoenix humilis 3.85 2.27 4.32 0.07 14 10.43
Melia azedarach 7.69 9.08 8.63 0.07 57 25.41
Syzygium cumini 3.85 2.27 4.32 0.07 14 10.43
Bauhinia variegata 7.69 6.81 6.47 0.05 43 20.98
Pinus roxburghii 11.54 24.98 15.83 0.09 157 52.35
Ficus religiosa 3.85 2.27 4.32 0.07 14 10.43
Sapium insigne 7.69 2.27 2.16 0.02 14 12.12
Dalbergia sissoo 3.85 54 63 .14 9 .02 4. 8. 0 2 17
Sapindus mukorossi 3.85 2.27 4.32 0.07 14 10.43
Cupressus torulosa 7.69 6.81 6.47 0.05 43 20.98
Ficus palmata 7.69 9.08 8.63 0.07 57 25.41
Morus alba 7.69 4.54 4.32 0.04 29 16.55
Shrubs
Zizyphus mauritiana 3.33 2.60 4.27 0.14 114 10.20
Jatropha curcas 3.33 2.60 4.27 0.14 114 10.20
Eupatorium adenophorum
6.67 14.29 11.74 0.28 914 32.70
Urtica parviflora 6.67 10.39 8.54 0.14 457 25.60
Cannabis sativa 10.00 12.99 7.12 0.16 1143 30.10
Coleoppo
brookea sitifolia
10.00 6.49 3.56 0.04 286 20.05
Princepia utilis 3.33 1.30 2.14 0.07 57 6.77
Rubus ellipticus 6.67 5.19 4.27 0.07 229 16.13
Berb 1.30 2.14 0.07 57 6.77 eris aristata 3.33
Opuntia dillenii 16.13 6.67 5.19 4.27 0.07 229
Lantana camara 35 286 20.50 3.33 6.49 10.68 0.
Euphorbia royleana 6.67 6.49 5.34 0.09 286 18.50
Adhatoda vasica 3.33 6.49 10.68 0.35 286 20.50

Project : Environmental Studies for Vishnugad Pipalkoti Hydro-Electric Project Page:146 Document : 2008026/EC/Final Report Date: Nov 2009 Chapter-3 : Baseline Environment, Impacts & Mitigation Measures Revision: R4
Name R.Frequency
R.Density R.Abundance
A/F Density (ha)
IVI
Rumex hastatus 6.67 11.69 9.61 0.19 629 27.96
Rubus niveus 10.00 0.04 286 6.49 3.56 20.05
Plectranthus coesta 0.09 629 10.00 14.29 7.83 32.12
Grasses & Herbs
Argemone mexicana 0.05 1.35 3.19 0.07 1429 4.60
Artemisia capillaris 0.07 5710.11 5.41 6.38 4 11.90
Cestrum verutum 0.05 4280.11 4.05 4.79 6 8.95
Oxalis corniculata 6 0.18 1420.11 13.52 15.9 86 29.58
Parthenium hysterophorus
0.21 29.73 17.56 0.10 31429 47.50
Polygonum chinensis 0.05 4.05 9.58 0.21 428 3.68 6 1
Tridex procumbens 0.11 0.14 11410.81 12.77 29 23.68
Apluda mutica 0.11 13.52 15.96 0.18 14286 29.58
Cynadon dactylon 0.16 17.57 13.83 0.10 18571 31.56
The adit area near dwing is open barren land dominated by shrubs. Eupatorium adenophorum is predominant species followed by Urtica parviflora and Cannabis Sativa. Parthenium hysterophorus is most frequently occurring grass species followed by Tridex procumbens and Cestrum verutum. The distribution pattern is represented by A/F ratio which shows that most of the species are random (.025-.05) and contagious (> 0.05) in distribution.
Table 3.9.21: Assessment of Flora of Dwing Langsi Site
Name R.Frequency R.Density R.Abundance A/F Density (ha)
IVI
Trees & Shrubs
Pinus roxburghii 18.18 17.65 13.04 0.03 300 48.87
Berberis aristata 18.18 11.76 8.70 0.02 200 38.64
Cannabis sativa 20.00 20.00 13.64 0.03 300 53.64
Pyrus pashia 10.00 6.67 9.09 0.04 100 25.76
Debregeasia hypoleuca
10.00 6.67 9.09 0.04 100 25.76
Eupatorium adenophorum
10.00 26.67 36.36 0.16 400 73.03
Urtica parviflora 20.00 20.00 13.64 0.03 300 53.64
Ficus palmata 10.00 6.67 9.09 0.04 100 25.76
Euphorbia royleana 20.00 13.33 9.09 0.02 200 42.42
Herbs & Grasses
Artemisia capillaris 9.09 13.79 30.37 0.16 10000 53.26
Tridex procumbens 27.27 20.69 15.19 0.03 15000 63.15

Project : Environmental Studies for Vishnugad Pipalkoti Hydro-Electric Project Page:147 Document : 2008026/EC/Final Report Date: Nov 2009 Chapter-3 : Baseline Environment, Impacts & Mitigation Measures Revision: R4
Name R.Frequency R.Density R.Abundance A/F Density (ha)
IVI
Cestrum verutum 18.18 10.34 11.39 0.03 7500 39.92
Parthenium hysterophorus
27.27 48.28 35.43 0.06 35000 110.98
Bidens bipinnata 18.18 6.90 7.59 0.02 5000 32.67
Table 3.9.22: Assessment of Flora of Gulab Koti
Scientific Name R.Frequency
R.Density R.Abundance
A/F Density (ha)
IVI
Trees & Shrubs
Pinus roxburghii 21.05 22.86 11.01 0.03 640 54.92
Melia azedarach 5.26 2.86 5.50 0.05 80 13.62
Ficus palmata 10.53 11.43 11.01 0.05 320 32.96
Zizyphus mauritiana 10.53 5.71 5.50 0.03 160 21.74
Colebrookea oppositifolia
15.79 22.86 14.68 0.04 640 53.32
Berberis aristata 10.53 8.57 8.26 0.04 240 27.35
Cannabis sativa 5.26 11.43 22.01 0.20 320 38.71
Rubus niveus 5.26 2.86 5.50 0.05 80 13.62
Rumex hastatus 5.26 5.71 11.01 0.10 160 21.98
Princepia utilis 10.53 5.71 5.50 0.03 160 21.74
Grasses & Herbs
Tridex procumbens 30.00 22.22 19.36 0.03 12000 71.58
Oxalis corniculata 20.00 18.52 24.20 0.06 10000 62.72
Artemisia capillaris 20.00 11.11 14.52 0.04 6000 45.63
Parthenium hysterophorus
30.00 48.15 41.95 0.07 26000 120.10
The Flora of Gulabkoti adit site is represented by open Pine forest. Shrub species dominant in the area are Colebrookea oppositifolia, Cannabis sativa and Berberis aristata. Few herb species are present at the site Tridex procumbens, Oxalis corniculata and Artemisia capillaris. Parthenium hysterophorus is the dominant grass species.
The Quarry site is represented by open barren area dominated by common shrubs such as Colebrookea oppositifolia and Euphorbia royleana.
Table 3.9.23: Assessment of Flora of Quarry Site Birahi
Name R.Frequency R.Density R.Abundance A/F Density (ha)
IVI
Trees & Shrubs
Bombax ceiba 4.55 3.13 5.77 0.06 67 13.44

Project : Environmental Studies for Vishnugad Pipalkoti Hydro-Electric Project Page:148 Document : 2008026/EC/Final Report Date: Nov 2009 Chapter-3 : Baseline Environment, Impacts & Mitigation Measures Revision: R4
Name R.Frequency R.Density R.Abundance A/F Density (ha)
IVI
Pinus roxburghii 13.64 18.76 11.54 0.04 400 43.94
Jacarandu mimosifolia
4.55 6.25 11.54 0.12 133 22.34
Urtica parviflora 13.64 12.51 7.69 0.03 267 33.84
Melia azedarach 4.55 3.13 5.77 0.06 67 13.44
Princepia utilis 9.09 6.25 5.77 0.03 133 21.12
Berberis aristata 4.55 3.13 5.77 0.06 67 13.44
Cupressus torulosa 9.09 9.38 8.66 0.05 200 27.13
Colebrookea oppositifolia
13.64 18.76 11.54 0.04 400 43.94
Sapium insigne 4.55 3.13 5.77 0.06 67 13.44
Eupatorium adenophorum
4.55 3.13 5.77 0.06 67 13.44
Agave americana 4.55 3.13 5.77 0.06 67 13.44
Euphorbia royleana 9.09 9.38 8.66 0.05 200 27.13
Herbs & Grasses
Argemone mexicana 11.11 5.72 14.11 0.12 3333 30.94
Parthenium hysterophorus
33.33 51.46 42.34 0.12 30000 127.13
Oxalis corniculata 22.22 20.01 24.70 0.11 11667 66.93
Cynodon dactylon 33.33 22.87 18.82 0.05 13333 75.02
The quarry site at Patalganga is near the stream Patalganga. It is open barren land with few scattered shrubs mostly of Eupatorium adenophorum.
Table 3.9.24: Assessment of Flora of Quarry Site Patalganga
Name R.Frequency R.Density R.Abundance
A/F Density (ha)
IVI
Trees & Shrubs
Urtica parviflora 18.18 9.68 12.00 0.04 240 39.86
Eupatorium adenophorum
45.45 64.52 32.00 0.04 1600 141.97
Princepia utilis 18.18 6.45 8.00 0.03 160 32.63
Berberis aristata 9.09 6.45 16.00 0.10 160 31.54
Cannabis sativa 9.09 12.90 32.00 0.20 320 53.99
Grasses & Herbs
Argemone mexicana 50.00 46.15 26.67 0.03 12000 122.82
Parthenium hysterophorus
33.33 23.08 20.00 0.04 6000 76.41
Cynodon dactylon 16.67 30.77 53.33 0.20 8000 100.77
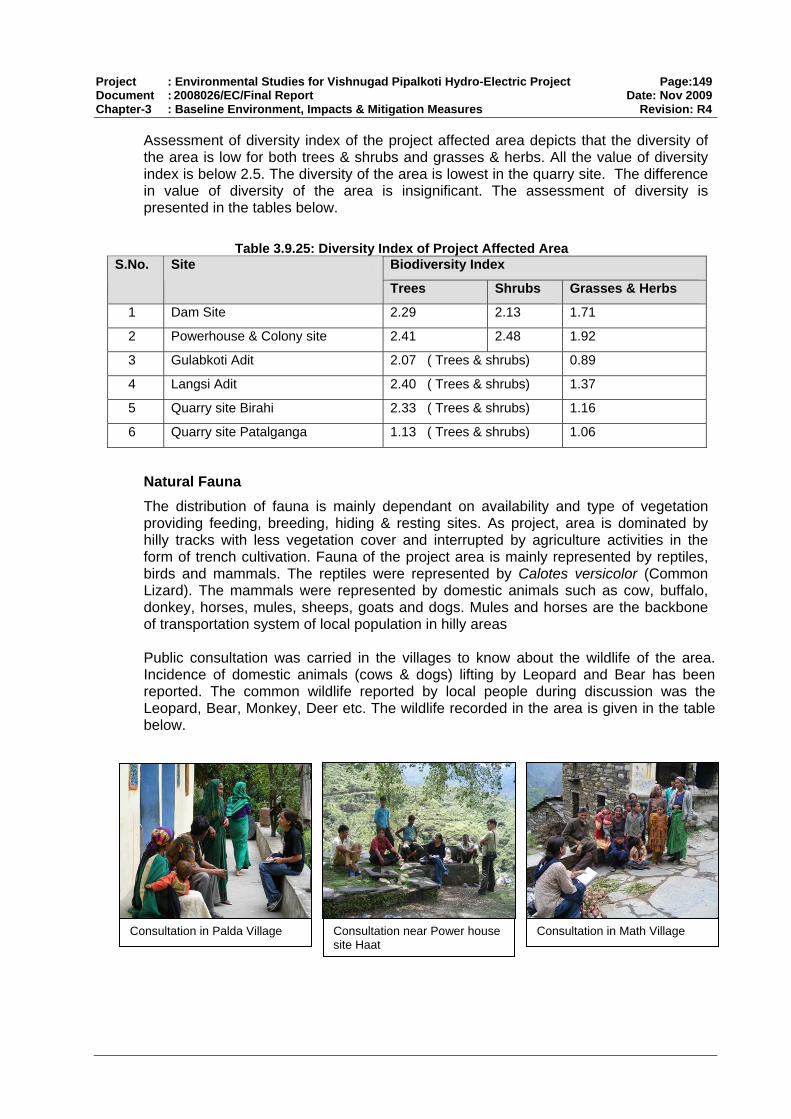
Project : Environmental Studies for Vishnugad Pipalkoti Hydro-Electric Project Page:149 Document : 2008026/EC/Final Report Date: Nov 2009 Chapter-3 : Baseline Environment, Impacts & Mitigation Measures Revision: R4
Assessment of diversity index of the project affected area depicts that the diversity of the area is low for both trees & shrubs and grasses & herbs. All the value of diversity index is below 2.5. The diversity of the area is lowest in the quarry site. The difference in value of diversity of the area is insignificant. The assessment of diversity is presented in the tables below.
Table 3.9.25: Diversity Index of Project Affected Area
Biodiversity Index S.No. Site
Trees Shrubs Grasses & Herbs
1 Dam Site 2.29 2.13 1.71
2 Powerhouse & Colony site 2.41 2.48 1.92
3 Gulabkoti Adit 2.07 ( Trees & shrubs) 0.89
4 Langsi Adit 2.40 ( Trees & shrubs) 1.37
5 Quarry site Birahi 2.33 ( Trees & shrubs) 1.16
6 Quarry site Patalganga 1.13 ( Trees & shrubs) 1.06
Natural Fauna The distribution of fauna is mainly dependant on availability and type of vegetation providing feeding, breeding, hiding & resting sites. As project, area is dominated by hilly tracks with less vegetation cover and interrupted by agriculture activities in the form of trench cultivation. Fauna of the project area is mainly represented by reptiles, birds and mammals. The reptiles were represented by Calotes versicolor (Common Lizard). The mammals were represented by domestic animals such as cow, buffalo, donkey, horses, mules, sheeps, goats and dogs. Mules and horses are the backbone of transportation system of local population in hilly areas Public consultation was carried in the villages to know about the wildlife of the area. Incidence of domestic animals (cows & dogs) lifting by Leopard and Bear has been reported. The common wildlife reported by local people during discussion was the Leopard, Bear, Monkey, Deer etc. The wildlife recorded in the area is given in the table below.
Consultation in Palda Village Consultation in Math Village Consultation near Power house
site Haat

Project : Environmental Studies for Vishnugad Pipalkoti Hydro-Electric Project Page:150 Document : 2008026/EC/Final Report Date: Nov 2009 Chapter-3 : Baseline Environment, Impacts & Mitigation Measures Revision: R4
Table 3.9.26: Wildlife of Project Affected Area Status Scientific Name Common
Name Family
IWPA 1972 IUCN Panthera pardus Leopard Felidae Sch I NT
Ursus aretos Brown Bear Ursidae Sch I LR/lc
Macaca mulatta Monkey Cercopithecidae Sch II LR/nt
Mus booduga Field mouse Muridae Sch V LR/lc
Caprolagus hispidus Hispid Hare Cervidae - -
Canis aureus Siyar Canidae Sch II LC
Muntiacus muntjak Kakad Cercopithecidae Sch III LR/lc
Vulpes bengalensis Fox Canidae Sch II LC
Suncus murinus Chuchunder Soricidae - LC
Presbytis entellus Langur Cercopithecidae Sch II LR/lc
Sus scrofa Wild Boar Suidae Sch III LR/lc
Lepus nigrocolis Khargosh Leporidae - -
Reptiles
Varanus bengalensis Monitor Lizard Varanidae Sch I LC
Calotes sp Common Lizard - - -
Amphibians
Bufo himalayanus Toad - - -
V: Vulnerable LC: Least Concern LR/lc or LC: Least Concern NT: Near Threatened
As per IUCN Red List most of the wildlife fall in “LC“ least concern category and only one species fall in vulnerable category. As per wildlife Protection Act (1972) three species Panthera pardus, Ursus aretos and Varanus bengalensis fall in schedule I category and three species fall in schedule II category. Two species fall in schedule III and one in schedule V. Schedule I species are the species which are most critical and require appropriate protection measures.
Birds were identified with binox. The common birds recorded during the survey were Myna, Magpai, Pigeon, Black Drongo, Grey Shrike and White Cheek Bulbul. The list of birds found in the area is given below. None of the birds fall in threatened category in the project area.
White cheeked Bulbul Yellow Billed MagpaiHouse Sparrow

Project : Environmental Studies for Vishnugad Pipalkoti Hydro-Electric Project Page:151 Document : 2008026/EC/Final Report Date: Nov 2009 Chapter-3 : Baseline Environment, Impacts & Mitigation Measures Revision: R4
Table 3.9.27: Birds of Project Site Status Scientific Name Common Name Family IWPA 1972 IUCN
Acridotheres tristis Indian Myna Sturnidae Sch IV LC
Alectoris chukar Chukor Patridge Phasianidae Sch IV LC
Corvus corax Common raven Carvidae Sch IV LC
Cissa flavirostris Yellow build blue Magpie
Corvidae Sch IV -
Corvus splendens House Crow Carvidae Sch IV LC
Dicrurus adsimilis Black Drongo Dieruridae Sch IV LC
Dendrocopos himalayensis Woodpecker Picidae Sch IV LC
Lanius excubitor Grey Shrike Campehagidae Sch IV LC
Milvus migrans Pariah Kite Accipitridae - LC
Motacilla madaraspatensis Large pied wagtail Motacillidae Sch IV LC
Passer domesticus House Sparrow Passeridae - LC
Passer montanus Eurasian Tree Sparrow Passeridae - LC
Pycnonotus cafer Red vented Bulbul Pycnonotidae Sch IV LC
Pycnonotus leucogenys White Cheeked Bulbul Pycnonotidae Sch IV LC
Saxicoloides fulicatus Indian Robin Muscicapidae Sch IV LC
Copsychus saularis Magpie Robin Muscicapidae Sch IV LC
Streptopelia orientalis Spotted dove Columbidae Sch IV LC
Turdoides caudatus Common babbler Muscicapidae Sch IV LC
Turdus merula Blackbird Turadinae Sch IV LC
Source: Observation & consultation
A comparative status of forests and natural resources in the project area is summarized below
Table 3.9.28: Comparative Status of Natural Resources in the Project Area Parameters Uttarakhand Alaknanda
Basin PIA PIAA PAA
Forests Type 8 5 3 1 1 Flora (total trees, shrubs, climbers, grasses, ferns etc.)
4048 800 154 96 87
Flora : Diversity Index - - - 0.89 – 2.41 0.89 – 2.41 National Parks 6 2 0 0 0 Sanctuaries 6 1 0 0 0 Biosphere Reserve* 1 1 1 1 1 Threatened / Protected fauna (no. of species)
22 15 5** 3*** 3***
Other Fauna 2248 - 33 32 32 Source: CES, Survey & Consultation * The project area lies in the transitional zone of NDBR ** Varanus bengalensis, Panthera Pardus, Capricornis sumataensis Moschus chrysogaster, Ursus aretos (as per Indian Wildlife Protection Act 1972) *** Panthera Pardus, Ursus aretos, Varanus bengalensis (as per Indian Wildlife Protection Act 1992)

Project : Environmental Studies for Vishnugad Pipalkoti Hydro-Electric Project Page:152 Document : 2008026/EC/Final Report Date: Nov 2009 Chapter-3 : Baseline Environment, Impacts & Mitigation Measures Revision: R4
3.9.9 IMPACTS ON FLORA
Impacts of various project activities are directly related to project affected area. The baseline terrestrial biodiversity status of the project affected area revealed that, two forests types i.e. Himalayan Chir Pine Forest, Himalayan Subtropical Scrub and Subtropical Euphorbia Scrub. The flora of the project affected area is dominated by Pinus roxburghii (Pine) and Cedrela toona (Tun) plantation. Common tree species observed during the survey were Bauhinia variegata (Kachnar), Melia azedarach (Dhenk), Ficus palmata (Bedu), Sapium insigne (Khinna), Phoenix humilis (Khajoor) and Mallotus philippinensis (Kamela),) Shrubs such as Berberis aristata (Kashmoi), Eupatorium adenophorum (Kala bansa) Euphorbia royleana (Shuru), Princepia utilis (Bhekal) Zanthoxylum alatum (Timru) and Rubus ellipticus (Hinsar) etc The dominant weeds recorded were Colebrookea oppositifolia (Bindu), Calotropis gigantea (Aak), Lantana camera (Lantana) Urtica parviflora (Kandali) and Rumex hastatus (Bhilmora) etc. Parthenium hysterophorus (Congress grass) was also widely found. Direct Impacts Direct impacts of project activities on flora of the project-affected area are due to acquisition of forests land, tree felling and clearing of land for providing various project units. Details are discussed below .
(I) Acquisition of Forests Land Potential negative direct impact of hydroelectric project is considered to be loss of flora/ forests due to construction of dam/ reservoir. The total land requirement of the project is 141.55 ha out of which 100.39 ha (includes 23.13ha land for underground works) is forestland.
(ii) Tree Felling The direct impact on flora is attributed to loss of trees, which are required to be cleared for establishment of various project units. Total 6153 trees are to be felled/ cleared. Out of the total trees, 4672 trees are in private land and balance 1481 trees are in Govt/ Forest Land. Tree cutting report revealed that most of the trees are planted in the area by Forest Dept. and Van Panchayat. The major species to be affected are Melia azedarach, Albizzia lebbek, Cedrela toona, Pinus roxburghii, Alnus nepalensis, Bauhinia variegata, Mallotus philippinensis and Cupressus torulosa. The species reported are commonly distributed throughout the project immediate influence area and project influence area.The Girth class of major species is given in the table below. It was observed that most of the trees fall in > 30 cm girth size and only 3 trees of Cedrela toona were recorded in >90 cm girth size.
Table 3.9.29: Girth size of Major Tree Species Trees > 30cm 30- 60 cm 60-90 cm > 90 cm
Albizzia lebbek 19 6 2 -
Cedrela toona 42 23 1 3

Project : Environmental Studies for Vishnugad Pipalkoti Hydro-Electric Project Page:153 Document : 2008026/EC/Final Report Date: Nov 2009 Chapter-3 : Baseline Environment, Impacts & Mitigation Measures Revision: R4
Trees > 30cm 30- 60 cm 60-90 cm > 90 cm Pinus roxburghii 419 60 18 -
Bauhinia variegata 6 - - -
Mallotus philippinensis 160 8 1 -
Melia azedarach 57 26 - -
Alnus nepalensis 102 3 - -
Cupressus torulosa 189 - -
Others 588 95 12 - Source: Tree Cutting Report, Vishnugad Hydroelectric Project
The project is not likely to affect the structure composition, of existing forest types, forest cover or distribution characteristics of flora. Therefore, adverse impacts on terrestrial biodiversity due to proposed tree felling is not at all expected.
(III) Clearing of Project Land
Direct impact on flora is also attributed to loss of flora due to clearing for forests land for providing various facilities such as provision of approach road, job facilities, construction of adits, power house, excavation for quarry and dumping areas etc. The detailed site specific investigation has been carried out to establish terrestrial biodiversity status it revealed that, dominant shrubs were Berberis aristata (Kashmoi), Eupatorium adenophorum (Kala bansa) Euphorbia royleana (Shuru), Princepia utilis (Bhekal) Zanthoxylum alatum(Timru), Colebrookea oppositifolia (Bindu), Cannabis sativa (Bhang), Agave americana (Rambans), Euphorbia royleana (Shuru), Opuntia dilenii (Nagpani), Rubus ellipticus (Hinsar), Lantana camara (Lantana), Rumex hastatus(Bhilmora) etc. The common tree species observed were Pinus roxburghii (Pine), Cedrela toona (Tun) Bauhinia variegata (Kachnar), Melia azedarach (Dhenk), Ficus palmata (Bedu), Sapium insigne (Khinna), Phoenix humilis (Khajoor) and Mangifera India (Aam) etc. These species are widely distributed throughout the project immediate influence area as well as project influence area. Three herbaceous species Bergenia ligulata (Silpara), Hedychium spicatum (Banhaldi) and Thalictrum foliolosum (Mamiri) reported in the advance construction site fall under vulnerable category as per IUCN categorization. These species are common in Himalaya and are available in 1000m to 3000m. The species should be conserved and developed in separate herbal garden. THDC should undertake development of Herbal garden at suitable place in consultation with Forest Department. Besides the three species other species of medicinal value may be also encouraged. The flora of the project area is very sparsely distributed showing low diversity index, which varied between 0. 8 to 2.28 indicative of degraded forestland. Thus, it revealed that loss of flora due to clearing of trees for various project activities will not have any direct significant impacts on flora of the region in terms of total forest cover, loss of ecologically significant species, change in structure, composition and distribution pattern of flora and there by any adverse significant impacts on existing terrestrial biodiversity status of the forest area in particular and flora of Alaknanda Basin or Uttarakhand in general. As direct impacts of project activities are confirmed to project affected areas only hence, any direct impacts on project immediate influence area and project influence area are not expected.

Project : Environmental Studies for Vishnugad Pipalkoti Hydro-Electric Project Page:154 Document : 2008026/EC/Final Report Date: Nov 2009 Chapter-3 : Baseline Environment, Impacts & Mitigation Measures Revision: R4
In order to compensate the loss of forests land acquired for establishing various project units, loss due to tree felling as well as due to land clearing the approved Compensatory Afforestation Plan may be implemented by State Forest Department. The Compensatory Afforestation may be carried out as per the Forests (Conservation) Act 1980.
Indirect & Cumulative Impacts
Indirect impacts of project activities on flora are expected to be limited to project immediate influence area and to some extent to project influence area. Indirect impacts will be due to various construction activities such as generation of dust due to earthwork, excavation, transportation of construction materials (sand aggregate, cement etc), quarry, crusher & blasting operations, air pollution due to movement of construction vehicles, equipments and machineries, influx of labour population and pollution generated through provision of labour camps established temporarily at construction sites etc. These impacts will be short term and limited to construction period only.
The existing terrestrial biodiversity status of the project immediate influence area revealed the, natural flora is interrupted by human settlements and intensive agricultural & horticultural activities, heavy lopping & browsing activities, continuous traffic on existing NH-58 etc. The flora is dominated by trees due to avenue plantation.
The dominant trees of avenue plantation along existing NH-58 are Cedrela toona (Tun) Bombax ceiba (Semal), Eucalyptus globules (Safeda) Erithrina indica (Pangar), Mallotus philippinensis (Kamela), Melia azedarach (Baken), Pinus roxburghii (Chir), Robinia pseudoacacia (Pahari kikar) etc. Common shrubs were represented by Adhatoda vasica (Vasaka), Colebrookea oppositifolia (Bindu) Calotropics gigantea (Aak), Euphorbia royleana (Shuru), Rubus ellipticus (Hinsar) Cannabis sativa (Bhang), Debregeasia hypoleuca (Sihanru), Urtica parviflora (Kandali), Rumex hastatus (Bhilmora) etc. The indirect impacts due to various project activities are discussed in details below.
(I) Generation of Dust
The dust is primary air pollutant in the form of Suspended Particulate Matter generated due to various project activities such as earthworks, general transportation, loading/unloading/ transportation of construction material, blasting, crusher & quarry operation etc.
Long-term exposure of dust primarily affects vegetation by interfering the matter exchange between plants and atmosphere. The exchange of gaseous components is an important for various vital physiological processes such as photosynthesis, respiration & evapo-transpiration etc leading to various morphological effects such as chlorosis, necrosis, discoloration and ultimately reduction in primary productivity.
As the avenue plantation along the existing NH-58 is well grown (which will be used for transportation) and will helpful in filtering out dust and impact due to dust during transportation will minimize. The vegetation in project immediate influence area is dominated by thorny shrub hence, impact will be insignificant. As indirect impact due to dust will be restricted during construction period only hence long terms impacts are not expected. However to mitigate adverse impact due to dust suggested mitigation measures may be followed.
Project : Environmental Studies for Vishnugad Pipalkoti Hydro-Electric Project Page:155 Document : 2008026/EC/Final Report Date: Nov 2009 Chapter-3 : Baseline Environment, Impacts & Mitigation Measures Revision: R4
(II) Generation of Noise
The noise will be generated due to various construction activities such as movement of construction vehicles machineries and equipments, working force as well as blasting. Blasting is a common practice of tunneling activity. It is short-lived phenomenon i.e. duration generally less than 0.5 seconds. There are no direct impacts of blasting activity on vegetation as vegetation attenuates sound by absorption. The blasting will be carried out by controlled blasting techniques hence any adverse impacts on vegetation are not expected.
(III) Temporary Labour Camp
The hydroelectric projects are labour intensive hence, large number of labours are expected to influx the area during construction phase. The important project activity-affecting flora surrounding the project influence area is due to establishment of laborer camps. The major threat to surrounding flora is through collection of fuel wood by labour for cooking purposes and thereby loss of trees. Hence, to mitigate this impact on flora necessary alternate arrangement should be done for fuel such as provision of LPG, Kerosene etc. It should be ascertained that no open fire should be allowed in labor camps as it may lead to fire to surrounding forest leading to loss of forest. The solid wastes generated in the form of garbage and effluent due to sewage should be properly collected and suitably disposed so as to avoid any impact on surrounding flora.
(IV) Generation of Debris & Muck
Huge amount of construction spoils/ muck is expected to be generated from various constructions it may adversely affect the surrounding forest areas leading to loss of flora. Hence, necessary steps to be taken to mitigate impact by suitable disposal at identified dumping areas. It revealed that dumping areas are either devoid of vegetation or showed few weedy shrubs. Hence, any adverse impacts on flora are not expected as these shrubs are widely distributed in project immediate influence area as well as project influence area. To mitigate this loss of shrubs approved Muck Disposal Plan should be strictly implemented. As such no significant vegetation was recorded at proposed quarry site, however to avoid impacts due to quarry operations on surrounding quarry site necessary dust suppression measures should be implemented. After completion the quarry operation area should be reclaimed.
(V) Soil Erosion
The soil erosion due to natural and anthropogenic activities cause major threat to survival of vegetation. The Alaknanda River flows in narrow deep channels with steep hills rising on either side in the project area. The hills are very steep with poor or no ve getation cover. Due to poor vegetation cover the rate of soil erosion is high. Different forms of erosion such as sheet erosion, gully erosion, riverbank erosion are quite prevalent throughout the project affected/immediate influence and project influence area. Common anthropogenic factors leading to erosion are over gazing, collection of trees for fuel, fodder, timber and road construction. The project activities accelerating soil erosion will be quite significant during construction phase such excavation work, tunneling/blasting, construction of temporary and permanent road in project area to move vehicle/machinery/equipments and working force (Labour). The land acquired for the project had to be cleared to make way for various project components clearing of vegetation accelerates erosion process in addition to above-mentioned activities.

Project : Environmental Studies for Vishnugad Pipalkoti Hydro-Electric Project Page:156 Document : 2008026/EC/Final Report Date: Nov 2009 Chapter-3 : Baseline Environment, Impacts & Mitigation Measures Revision: R4
The excavated material is generally loose, unstable and keeps rolling down and thereby affecting natural drainage channels of the river deteriorate water quality as well as accelerate sedimentation & soil erosion. As dumping area are located closed to river Alaknanda and chances of rolling down of muck/ loose material leading to blockage in river flow or contamination of water due to silting are more. In order to avoid this retaining wall varying from of 2 – 7 m height is proposed along the bank of the river at all Muck Disposal Areas. In order to control the soil erosion the approved Catchments Area Treatment Plan should be strictly implemented.
Induced Impacts
The induced impacts largely concentrated on project influence area owing to dependency of local people on forests. These impacts are discussed specially in light of various human activities affecting forest such as new migrant labour, associated development, and induced commercial developments The forests of the influence area are interrupted with various settlements along with agricultural, horticultural, animal husbandry practices. Local villagers are fully dependent on forests for their day-to-day requirements including fodder, fuel, timber grazing etc. All these activities adversity affect the forests and it is under pressure due to increasing human population and their activities. Besides this, lopping of trees for fodder manure and bed preparation for cattle sheds, heavy grazing and forest fire have thinned out the forest to varying degree, destroy all undergrowth and reduced shrubby ground cover.. The induced impacts are discussed below in details.
(I) Migrant Labour
The induced impact associated with migrant labor are loss of vegetation/flora for provision of facilities such as accommodation, provision of road for transportation, provision of waste disposal such as solid waste/garbage and effluents generated through sewage, provision of commercial complexes to meet their day to day requirements and provision of parking facilities etc. Moreover large scale migration of labour/ employees during operation phase is not expected as working staff will be limited to skilled workers & trained officials of THDC. Therefore loss of forest land, loss of flora, pollutions generated via sewage & garbage & thereby adverse impacts on surrounding flora is not at all envisaged.
(II) Associated Developments
Development of Vishnugad Hydro-electric project is likely to trigger associated development in several sectors such as transportation, automobile, commercial sectors such as daily needs, agriculture related developments such as vegetable, fruit, grain, fertilizer, pesticides, irrigation, electric appliances, which is likely to provide employment opportunities for local people and help to increase their social & economic status. All these development need space/land. The land is to be cleared before establishment of any facility. Loss of flora attributed to clearing of land for development & thereby any adverse impacts are not envisaged.
(III) Induced Commercial Development
As such the project area is located in interior areas away from the township in hilly area hence, large-scale commercial development is not expected. All commercial facilities are available at Pipalkoti and Chamoli that are near from proposed powerhouse and

Project : Environmental Studies for Vishnugad Pipalkoti Hydro-Electric Project Page:157 Document : 2008026/EC/Final Report Date: Nov 2009 Chapter-3 : Baseline Environment, Impacts & Mitigation Measures Revision: R4
colony area therefore additional commercial development is also not envisaged. Hence any adverse impacts on flora of the either project influence area or project immediate influence area due to induced commercial development is not expected.
3.9.10 Impacts on Fauna
The major factor affecting the distribution of animals in entire area is found to be forest types, altitudinal variation, interference of human activities and forest cover. Impacts on fauna are categorized as direct, indirect, cumulative and induced impacts and are discussed below.
Direct Impact
Direct impacts of project activities are restricted to project influence area. The presence of fauna is directly related to type of flora present. Himalayan Chir Pine Forest Himalayan Subtropical Scrub and Subtropical Euphorbia Scrub, which are sparsely distributed along hill slopes, foothills and Alaknanda river valley, represent Flora of project-affected area. The forest patches present in the project affected area is mostly plantation carried out by state forest department and Village panchatyat. Most of the hill slopes are very steep and almost without any vegetation or with thin vegetation dominated by pine which is already discussed in details on vegetation impacts. The baseline faunal biodiversity status of project affected area revealed that common representation of reptiles was Calotes versicolor (Common Lizard). The common birds recorded were Acridotheres tristis (Indian Myna), Corvus splendens (House Crow), Dandroatta vagabunda (Treepie), Lanius excubitor (Grey Shrike), Milvus migrans (Pariah Kite), Pycnonotus leucogenys (White Cheeked Bulbul), Turdoides caudatus (Common babbler), Sexicoloides fulicata (Indian Robin), Turdus merula (Blackbird) etc. showing typical agrarian bird community as area is marked by intensive agricultural & horticultural activities. The mammals were represented by domestic animals. As the agricultural & horticultural activities dominated the project area the domestic animals of local importance were mainly observed such as Cow, Buffalo, Ox of agricultural importance, Horses, Mules and Donkeys used for carrying loads in hilly areas and common pet animal such as Dogs & Cats. Presence of wildlife has been reported by the local inhabitants during public consultation. The wildlife reported by local people during discussion were Leopard, Bear, Wild Boar, Monkey, Deer etc. As per IUCN Red List most of the wildlife fall in “LC“ least concern category and only one species Ursus aretos (Brown bear) fall in vulnerable category. As per wildlife Protection Act (1972) two species Panthera pardus (Leopard) and Ursus aretos (Brown Bear) and Vulpes bengalensis (Fox) fall in schedule I category and three species Macaca mulatta (Monkey), Canis aureus (Siyar), and Presbytis entellus (Langur) fall in schedule II category. Two species Muntiacus muntjak (Kakad) and Sus scrofa (Wild Boar) fall in schedule III category. Schedule I species are the species which are most critical and require appropriate protection measures The wildlife inhabits the forest areas mostly at higher elevations away from settlement. However they roam and hunt in the area. The project affected area is mostly open/plantation area with settlements, the wildlife move in the area during nighttime. The project activities are likely to disturb the normal peace of the wildlife and they are likely to move in other areas.

Project : Environmental Studies for Vishnugad Pipalkoti Hydro-Electric Project Page:158 Document : 2008026/EC/Final Report Date: Nov 2009 Chapter-3 : Baseline Environment, Impacts & Mitigation Measures Revision: R4
Indirect & Cumulative Impacts
Indirect and cumulative impacts are associated with various construction activities such as clearing of vegetation for establishment of various project units, movement of vehicles, construction equipments & machineries etc, interferences due to influx of labours as well as temporary establishment of labour camps, blasting operations etc. The major direct impact of and hydro -electric project is primarily through construction of reservoir and submergence of forest leading to loss of habitat for wildlife. The proposed dam site is just below the NH-58 near Helong. The area is plantation site of Van panchayat and is not habitat to wildlife. Hence it is not likely to cause any impact on wildlife. The loss of 100.39 ha (includes 23.13 ha land for underground works) of forest land for various project unit will also not adversity affect the fauna as similar habitat is present throughout the project immediate influenced area as well as project influence area. Therefore impact due to loss of habitat for birds, reptiles and mammals of the project area is not expected. The blasting activity is short term activity and impact is lest up to 0.5 sec. Due to noise generated during blasting may lead to short time driving way of birds & animals in surrounding areas. As the controlled blasting technique will be followed hence any long-term adverse impacts are not engaged. Impacts on surrounding fauna due to movement of vehicles, machinery, equipments and work force may slightly interfere in animal movements. As most of the domestic animals Cows, buffaloes, goats sheeps, donkies & horses are guided & controlled by the owners /caretakers and hence any causality in terms of killing or accident are not expected. However proper maintenance of vehicle and controlling speed during driving may avoid impact totally. As no wildlife reside in project-affected areas which is open area with intermittent settlements any adverse impacts on wildlife is ruled out.
Induced Impacts
The induced impacts are considered to be due to establishment of propose hydroelectric project, migration of labours/employees, induced commercial developmental activities on surrounding fauna. As project affected area and project immediate are is mainly represented by common domestic animals, which are protected by their owners, hence any adverse impacts are not envisaged. However the project influence are 7 km surrounding the proposed project varies forest types as well as wildlife is reported hence induced impacts are discussed with reference to forests & wildlife reported from project influence area.
The variation in altitude leads to variation in forest types and associated changes in wildlife. Important wild animals are reported at higher altitude such as Himalayan Black bear (Selenarctor thibetenus) reported at 1800 to 2500mt altitude, Musk deer (Moschus moschiferus) is reported from 2900-4000 meters. Rhus Macaque (Macaca mulata) from 1200-2400m while Langur (Presbytes entellus) from 1800-2800 meters. Hence, any adverse impacts due to induced developmental activities on wildlife are not expected. However, in order to improve forest cover & wild habitat suggested recommendations to be strictly implemented as per approved Compensatory Afforestation Plan and Catchment Area Treatment Plan.

Project : Environmental Studies for Vishnugad Pipalkoti Hydro-Electric Project Page:159 Document : 2008026/EC/Final Report Date: Nov 2009 Chapter-3 : Baseline Environment, Impacts & Mitigation Measures Revision: R4
Mitigation Measures
The terrestrial biodiversity of project affected area and project immediate influence area is represented by low floral & faunal diversity. The forests of the area are represented by Pine forests and Euphorbia Scrub and Himalayan Subtropical Scrub. Weedy shrubs with some scattered tree species dominate the area. Direct impacts of project activity on flora are considered to be due to acquisition of forestland for establishment of various project units, loss of trees due to felling and clearing
The impact due to tree felling will be insignificant as the tree species are commonly available thought project immediate influence area and project influence area. As a result there will no change in community composition and structure of forest due to tree felling.
The loss due to clearing is also not expected as weedy shrubs, which are widely distributed, dominate project area. The loss of forestland and trees felled will be compensated by implementation of approved Compensatory Afforestation Plan not only this but it will also increase forest cover area of the surrounding region. Thus, it revealed that no significant adverse impacts on terrestrial biodiversity due to proposed Vishnugad Hydro-electric project is envisaged
Table 3.9.30: Assessment of Impacts and Mitigation Measures
S. No
Project Phase Activities Impacts Mitigation Measures
(i) Acquisition of Forest Land
Loss of Forests land is 100.39 ha (includes 23.13 ha land for underground works).
Obtain Forest clearance from MoEF
Strict implementation of approved Compensatory Afforestation Plan in accordance with Forest (conservation) Act 1980 and Uttarakhand Forest Policy. Carry out compensatory afforestation in 201 ha area.
Strict compliance of MoEF stipulated condition for Forest clearance.
1. Construction Phase
(II) Felling of Trees
The clearing of project sites for construction requires felling of trees, a total number of 6153 trees are be felled. The trees consist of plantation in forest land and vanpanchayat land. All the species are commonly distributed throughout the project immediate influence as well as project influence area hence, the impact will be insignificant
Compensatory Afforestation should be carried to compensate the loss of trees. Double no. of trees 12,306 trees may be planted in lieu of trees felled.
Compensation should be given as per R &R policy.
Compensation for fruit bearing trees should be compensated as per R & R Policy.
Under Road construction Trees falling outside the ROW should not be felled.

Project : Environmental Studies for Vishnugad Pipalkoti Hydro-Electric Project Page:160 Document : 2008026/EC/Final Report Date: Nov 2009 Chapter-3 : Baseline Environment, Impacts & Mitigation Measures Revision: R4
S. No
Project Phase Activities Impacts Mitigation Measures
(iii)Clearing of Project sites for construction activity
The project site is dominated by Plantation species and weedy shrubs which are commonly distributed throughout the area. 3 vulnerable species were observed in the project sites.
Compensatory Afforestation will carried under the Degraded Forest Area Development scheme hence there will be increase in the forest cover
The vulnerable species Bergenia ligulata (silpara), Hedychium spicatum (Banhaldi) and Thalictrum foliolosum (Mamiri) found in the area should be developed in separate herbal garden.
THDC should undertake development of Herbal garden at suitable place in consultation with forest department and propagation of the species must be taken. Besides the three species other species of medicinal value may be also encouraged.
Construction Phase -
Impact on Fauna The wildlife is likely to be disturbed during construction phase due to various activities.
The construction activity is likely to affect the movement of the animal
Increase in noise may affect the feeding, breeding and movement of wildlife near forest area. Felling of trees is likely to affect the avifauna.
Fragmentation of the habitat is not envisaged as the road construction and other construction works does not divide any habitat area.
Poaching should be strictly banned in the Forest area. It may be ensured by the Contractor that no hunting is practiced at the site by any of the worker and that all site personnel are aware of the location, value and sensitivity of the wildlife resources
The project area is located in the transitional zone of Nanda Devi Biosphere reserve. Movement of wildlife is reported in the area therefore monitoring unit should be established in the project sites in consultation with Forest Department.
Plantation of tree species which are major sources of fodder for wildlife in consultation with forest department in degraded and open areas.
Awareness program on Environment and Wildlife Conservation should be provided to the work force.

Project : Environmental Studies for Vishnugad Pipalkoti Hydro-Electric Project Page:161 Document : 2008026/EC/Final Report Date: Nov 2009 Chapter-3 : Baseline Environment, Impacts & Mitigation Measures Revision: R4
S. No
Project Phase Activities Impacts Mitigation Measures
Forest Act and Wildlife Act may be strictly adhered to.
(i) Generation of dust by movement of vehicles and construction work, crusher operation
This may cause increase in SPM and RPM level in the area. Dust is also likely to settle on the surrounding flora. The impact shall be temporary, localized and reversible. No significant impact on Project Influence Area and Alaknanda Basin.
All vehicles delivering materials to the site should be covered to avoid spillage of materials.
All exiting approach road used by vehicles should be kept clean and clear of dust
The roads surfaces should be host or watered using necessary equipments.
Plants, machinery and equipment should be handled so as to minimize generation of dust.
All earth work should be protected to minimize dust generation.
All crusher used in construction should confirm to relative dust emission devises
(ii) Generation of Noise
The noise level of the construction site is likely to increase due to various activities, which may cause disturbance to the fauna in the area. However this impact would be insignificant as the increase in noise shall be intermittent and temporary No significant impact on fauna of Project Influence Area and Alaknanda Basin
The machineries, vehicles and equipments use in construction should strictly confirm to CPCB standard.
All vehicles equipment machinery used in construction should be fitted by exhaust silencers.
Equipments should be maintained regularly and soundproof gadgets should be used.
Blasting should be carried out as per the statutory laws, regulation and rules pertaining to acquisition, transport, storage, handling and use of explosives
(iii) Movement of Labour force and Technical Staff
The labour force and technical staff may poach on occasionally invaded wildlife in the area. No significant impact on Project Influence Area and Alaknanda Basin
The contractor should arrange alternative source of energy such as Kerosene or LPG
The Wildlife conservation Act should be strictly adhered.
Environmental awareness training should be provided to the Contractor and workers.
(iv) Quarry Extraction of rocks and The extraction of material
Project : Environmental Studies for Vishnugad Pipalkoti Hydro-Electric Project Page:162 Document : 2008026/EC/Final Report Date: Nov 2009 Chapter-3 : Baseline Environment, Impacts & Mitigation Measures Revision: R4
S. No
Project Phase Activities Impacts Mitigation Measures
activities sand shall be done for the construction work from quarry sites. No significant impact on Project Influence Area and Alaknanda Basin.
should be done from the identified quarry site only.
The quarry area should be reclaimed back. The pits formed should be backfilled by construction waste and site should be stabilized.
The topsoil (150mm) from all areas should be preserved in stockpiles.
Stockpile should be utilized for redevelopment of quarry areas.
Grasses and shrub species should be planted.
(v) Soil Erosion
The construction activities may lead to the erosion of soil in catchments area of Alaknanda Basin.
Strict implementation of approved Catchment Area Treatment Plan for control of soil erosion.
Work may be restricted in rainy season.
(vi)Muck Disposal The muck produced by the construction work shall be disposed at the dumping sites The disposal of muck shall destroy the flora at the sites. However the sites identified for muck disposal are open barren areas.
The muck should be disposed at the identified sites only.
Before disposal of muck retaining walls should be constructed at the edges to retain the muck as the sites area just above the river Alaknanda
(II) Influx of labour
Requirement of living places, hotels, filling stations, service stations and extra workers will arise. This will provide job opportunity to the local skilled and unskilled population.
Cutting of trees should be strictly prohibited in the area for other construction work.
Forest clearance should be obtained if there is any requirement for cutting trees.
3. Construction Phase
(III) Induced Commercial
development
Development in Pipalkoti town and nearby places is likely to take place and land price may increase.
Any new colonies developed in area should have provision for plantation in the colony area.
As, Pipalkoti & Chamoli are well equipped with the

Project : Environmental Studies for Vishnugad Pipalkoti Hydro-Electric Project Page:163 Document : 2008026/EC/Final Report Date: Nov 2009 Chapter-3 : Baseline Environment, Impacts & Mitigation Measures Revision: R4
S. No
Project Phase Activities Impacts Mitigation Measures
New commercial development and adverse impacts are not envisaged The impact on Alaknanda. Basin will be insignificant
commercial development which are very near from proposed sites hence any new Commercial development not envisaged
4.
Operation Phase
(i) Loss of flora
In operation phase no tree felling is anticipated. Compensatory afforestation and avenue plantation is likely to increase the greenery in the area. Hence the impact will be positive during operation phase.
Proper protection measures should be taken for the plantation work carried under the project. Van Panchayats should be involved in afforestation activity and monitoring of the plantation work.
Fencing of plantation area should be done.
Watchman should be employed to take care of plantation for minimum 3 years.
(ii) Loss of fauna
Loss of fauna is not anticipated during operation phase as the wildlife is found in the upper reaches of hills far away from project area. No impact on fauna of Project Influence Area and Alaknanda Basin during operation phase.
No impact is envisaged on fauna during operation phase.
Wildlife conservation program should be supported by the project
(iii) Biodiversity No significant impact is envisaged on biodiversity in Project Influence Area and Alaknanda Basin
Awareness programs should be held for the stakeholders to develop concern for conservation of biodiversity in the area.
The Biodiversity Management Plan is provided in detail in Chapter 4-EMP, Section 4.4.
Project : Environmental Studies for Vishnugad Pipalkoti Hydro-Electric Project Page: 164 Document : 2008026/EC/Final Report Date: Nov 2009 Chapter-3 : Baseline Environment, Impacts & Mitigation Measures Revision: R4
3.10 ARCHAEOLOGICAL SURVEY The Archaeological study comprise of survey of Project area surrounding 7 km of the project sites. On the basis of village to village Survey (Exploration), 63 villages have been prepared in Joshimath tehsil, Distt. Chamoli. These villages falls under the area of Vishnugarh-Pipalkoti Hydro Electric Dam project area, covering an area of 7 km from river Alaknanda covering the stretch length of 28 km. from Chinka village to 3 Km upstream towards Joshimath from Helong Dam site in district Chamoli tehsil Joshimath.
3.10.1 HISTORICAL BACKGROUND
The archaeological researches in India since independence have brought forth a rich data of our cultural heritage. The extensive explorations and assiduous excavations undertaken throughout the country have succeeded in unearthing a plethora of new evidences. In the same way, regional studies in archaeology have also contributed in discovering India’s past in no lesser terms. However, the region of the Garhwal-Himalaya has comparatively been less studied. Relatively speaking, not much work of an independent geographical unit has been done on the archaeology of this region. In 1882 E.T. Atkinson had given us a compendium of historical account of this region in his famous Himalayan Gazetteer. His work was followed by Powell Price, Prayag Dayal, Gairola, Goetz, Sircar, Kala and Chhabra, through their valuable articles on history, epigraphy, numismatics etc. Then there were other scholars like Rahul Sankrityayan, H. K. Raturi, S.P. Dabral, Ram Rahul, who also produced valuable historical works of the region. But notable work encompassing almost all aspects was brought out by K.P. Nautiyal in 1969 in an integrated form of the study of Kumaon and Garhwal-Himalaya. (a) Pre-History The prehistory past of the Garhwal-Himalaya is not known with certainty. The reasons are two fold, firstly, topographically it was a most difficult region and secondly, the extreme climatic cycles made it more inhospitable for the early man. Further more, the recurrence of the tectonic fluctuations resulting physiographic changes along with frequent landslides all around in the valleys and mountains disturbed the entire sequence everywhere an obliterated totally all evidence of the past. It has been generally believed that due to those successive phases of folding coupled with the constant rising o the Himalayan Mountains the region remained more or less complicated geologically as the Himalayan mountains are the only living mountains in the world and are moving 1cm. per annum towards North. This unstable situation, disturbing the topography for time and again, particularly of the central Himalayan Garhwal and thus changing the ecological setting frequently made the area more inhospitable for the existence of early man. Hence, no serious attempts to search to Paleolithic implements were made in the past, whereas the rest of the greater part of the western Himalaya had undisputedly proved the existence of early men.

Project : Environmental Studies for Vishnugad Pipalkoti Hydro-Electric Project Page: 165 Document : 2008026/EC/Final Report Date: Nov 2009 Chapter-3 : Baseline Environment, Impacts & Mitigation Measures Revision: R4
The first discovery of prime significance, at least in context to the whole of the central and western Himalaya, was made by De Terra and Patterson in 1939 in the valley of Sohan or Soan. This expedition not only discovered a new Paleolithic culture designated as the Soan Culture in the north-western part of the Indo Pakistan sub-continent but also presented for the first time a comprehensive an integrated study of the geology of the region. Later on this was followed by Sankalia, in the early seventies, exploring for Paleolithic implements from Pahalgam in Kashmir. After him Joshi also successfully explored the river liddar and the Sind valley and reported the discovery of palaeolithic implements. Similarly in the sub-Himalayan region of Himanchal Pradesh, Olaf. H. Prufer,B.B Lal, R.V. Joshi, Y.D. Sharma, D. Sen and G.C Mohapatra also brought to light lithic industries. The entire area of the central Himalayan Uttarakhand comprising the region of Kumaon and Garhwal, as studied earlier structurally and tectonically. Theobald had for the first time, studied the lakes of Kumaon in the last quarter of the 19th century. The lakes of Nainital etc. were described as of glacial orgin dammed by moraines. Auden had also undertaken some investigations in the area and had remarked that during the Pleistocene period the Gangotri glacier descended below Gangotri as far as Jakla. He had further added that the outermost Pleistocene moraines reached as far as 7050 to 6550ft. (2170-2015m). Heim and Gansser under the auspices of the Swiss Expedition n 1936, made the first significant geological observation about the Pleistocene glaciations in the central Himalayan Garhwal and Kumaon,. They also studied particularly, the Pleistocene lake deposits of the Higher Himalayan region. They made a special reference to the lake deposits of the Alaknanda river and observed that the deposits are of the later Pleistocene and are coeval with those of the famous Karewas of the Kashmir Valley. i Paleolithic Tools Exploration for stone age artifacts were conducted at Srinagar and Dang in the Alaknanda Valley as for back as 1977,when a few flacks resembling the pebble tools were picked up from terrace 1(at village Dang).Exploration in 1980-81 however, brought to light a sizable collection of Paleolithic implements. The artifacts range from the pebble tools to the middle Paleolithic implement found from the river terrace. ii Prehistoric Art Prehistoric art is yet one more significant aspect generally associated with the Prehistoric cultures. The discovery of prehistoric art in central Himalayan region furnishes a new evidence for it. The evidence of rock shelters having paintings, come from the Alakananda Valley of the central Himalayan region. A Rock shelter depicting painting was discovered by Nautiyal at Kimni in Karnaprayag-Gwaldam road in Chamoli district. The other Rock shelter is at Dungri village on the Chamoli-Badrinath road in Chamoli District. The cave is about 2 km away from Chhinka on the high Mountain to wards Chamoli.

Project : Environmental Studies for Vishnugad Pipalkoti Hydro-Electric Project Page: 166 Document : 2008026/EC/Final Report Date: Nov 2009 Chapter-3 : Baseline Environment, Impacts & Mitigation Measures Revision: R4
(b) Proto-History The prehistoric period is marked by the growth of urbanization and the advent of copper and Iron Ages in India. This period includes Indus Civilization, Copper Hoards, Ochre Coloured Pottery (OCP), Painted Grey Ware (PGW) etc. down to the sixth century BC. Painted Grey Ware Culture: In the later phase of the proto history in the Alakananda Valley, the people who occupied the region were using painted Grey Ware as their principal pottery. The P.G.W. culture is associated with some branch of Aryan group or with the Mahabharata story as suggested by Prof. B.B. Lal, Grahawal provides ample testimony, for in the great epic and other Puranic literature that the region was very much known to the people of Aryavarta and the holiness of the river Alakananda has been greatly extolled in relation to the Tirtha Yatra (religious pilgrimage) or in some other context. This leads to believe that the P.G.W. and its associated Ware were the household utensils of the people who lived here and were not imported here in such a remote place as some archaeologist might to think after this discovery at Thapli (P.G.W. culture site) was made, which is far from the Gangetic plain.
3.10.2 HISTORICAL ARCHAEOLOGY The invasion of northern India by Alexander the great in 326 BC is an important landmark in the history of early India. But recently archaeological discoveries in the country have provided new historical material in the form of coins, pottery, inscriptions, sculptures, terracotta and other antiquities, which in turn, have given additional data for the reconstruction of history from the 6th century B.C. onwards. This period of early history, based on archaeological finds in termed as ‘historical archaeology’. The 6th century B.C. witnessed a cultural renaissance, giving birth to new ideas and traditions. However, the study of the cultural evolution in the Garhwal Himalaya region has not yet become an established fact of history. Therefore, archaeological discoveries in recent years through exploration and excavations are gradually bringing forth new evidences for the formulation of cultural background of this area. The recent discoveries brought out in this valley and elsewhere in the Garhwal-Himalayas, indicate that the area was serving as a meeting ground of various cultural waves flowing from different directions. The new material evidence has proved that this was a pivotal region and so almost every traveler from Fa-hien in the 4th -5th century AD to Heiun-tsang in the 7th century AD had visited either its heartland or places of peripheral zone. This also happened in the case of emerging civilizations which directly affected the already existing milieu. The study of the cultural remains of various explorations and excavations will prove the veracity of the foregoing observations.

Project : Environmental Studies for Vishnugad Pipalkoti Hydro-Electric Project Page: 167 Document : 2008026/EC/Final Report Date: Nov 2009 Chapter-3 : Baseline Environment, Impacts & Mitigation Measures Revision: R4
3.10.3 EXPLORED AND EXCAVATED ARCHAEOLOGICAL SITES IN THE REGION
a) Ranihat: It is an excavated site Ranihat (30o 12’N, 78o 47’E) is a small village about nine kilometers from the town of Srinagar on Srinagar-Badiyaragarh road. The cultural sequence of this site is as follows:
Period-I : circa 600 to 400 BC Painted Grey Ware Culture (PGW) Period-II A : circa 400 to 200 BC Mauryan Period-II B : circa 200 BC to AD 20 Sunga-Kushana Period-III : circa 800 to AD 1200 Sultanate
b) Thapli: It is an excavated site Thapli (30o 12’ N & 78o 47’ E) is a small village
about thirteen kilometers from the town of Srinagar on Srinagar - Badiyaragarh road. It is a single culture site of Painted Grey Ware (PGW) and is placed around 1100 BC to 800 BC.
c) Mana: The site, situated 3 km beyond Badrinath, is a big village of tribal
Marchhas. A few sherds of fine plain grey ware and fine red ware can be placed in pre-Christian era. The rest of the finds from Mana are assignable to the post-Gupta period.
d) Tapoban: The site is situated about 15 km from Joshimath on the Malari
road on the left bank of Dauliganga. It has several temples and the ancient pottery is scattered all around the fields. The pottery is assigned to the post-Gupta period, to which period also the temples of the site belong.
e) Rein: The site is situated about 18 km from Joshimath on Joshimath-Malari
road on the left bank of Dhauliganga. This site is ascribed to the post-Gupta period.
f) Subhaien: The site is situated at a height of 7000ft about 23 km from
Joshimath on Joshimath-Malari road on the left bank of Dhauliganga. This site is assigned to the post-Gupta period.
g) Gopeshwar: This site is situated 10 km west of Chamoli. This site is
assigned to the post-Gupta period. h) Simli: This site is situated 8 km from Karnaprayag on the Karnaprayag-
Ranikhet highway. This site is assigned to the post-Gupta period. i) Chandpurgarhi: This site is situated 11 km from Karnaprayag on the
Karnaprayag-Ranikhet highway. This site is assigned from about 4th century onwards and continued so up to the early medieval period.
j) Adibadri: Like Chandpurgarhi, Adibadri is also a significant ancient site,
yielding red ware of the post-Gupta period and early medieval period.
Project : Environmental Studies for Vishnugad Pipalkoti Hydro-Electric Project Page: 168 Document : 2008026/EC/Final Report Date: Nov 2009 Chapter-3 : Baseline Environment, Impacts & Mitigation Measures Revision: R4
k) Kameda: The site is situated 2 km east of the town of Gaucher on the left bank of Alaknanda. This site is assigned to the Sunga-Kushana period.
l) Ratura: This site is situated on the left bank of Alaknanda, 7 km from
Rudraprayag on the Badrinath highway. This site is assigned to pre-Christian era and post-Gupta period.
m) Ufalda: This site is situated 4 km south of Srinagar town on the left bank of
Alaknanda. This site is assigned to the post-Gupta period. n) Dhandri: This site is situated 8 km south of Srinagar town. This site is
assigned to c. 4th -5th century AD. o) Naithana: This site is situated around 6 km of Ranihat on the right bank of
Alaknanda. This site is assigned to the post-Gupta period. p) Supana: This site is situated around 7 km north of Ranihat on the right bank
of Alaknanda. This site is assigned to the early historical period. 3.10.4 Exploration Results
Out of the 63 villages surveyed 10 villages contains archaeological / heritage remains. Besides archaeological remains such as cultural properties, sites, folklores, legends, buildings almost all 63 villages have preserved their paleontological, natural religious and sacred heritage in a very ritualistic and traditional manner. Villages containing archaeological / heritage remains were identified are given in table below.
Table-3.10.1 Typological Distribution of Archaeological remains
Type of Archaeological Remains Number of villages Included in the list
Total
Pre-historic Rock-shelter 1 1 Megalithic Site 1 1 Historical Site 2 2 Temples (Historical) 5 5 Structural remains of Heritage Buildings 2 2
3.10.5 Comprehensive Description of Archaeological Evidence
The details of the village wise exploration/survey containing archaeological / heritage remains are detailed below
Name of the Village: DUNGRI
Location: N 30o25’30.97” E 79 o22’ 11.74” ± 11 m Site No.: 63 (Sixty three) Altitude: 1572 mts. above MSL Approach: One can reach to this village from Chhinka village ie. (Site
Project : Environmental Studies for Vishnugad Pipalkoti Hydro-Electric Project Page: 169 Document : 2008026/EC/Final Report Date: Nov 2009 Chapter-3 : Baseline Environment, Impacts & Mitigation Measures Revision: R4
No.62) one can reach Chhinka village after crossing iron suspension bridge over Alaknanda river from the Chamoli-Bidrinath highway towards Birahe village from Chamoli, Chhinka village is on the right bank side of Alaknanda river. The cave/rock shelter is about 2 km uphill walk from Chhinka village on a high mountain.
Name of the villager contacted for gathering information:
Navin Singh. He belongs to Bhutia tribe
No. of families: There are 30 families. But in this village people of all caste live together
Population of village: Approx 160 persons Area of the village: Approx 11/2 sq.km. Plants & trees they worship or the sacred flora:
Pipal, Surai, Banyan, mango tree leaves, bel-patri,bhoj-patri, tulsi, deodar, tejpath
Sacred animal/fauna: They worship cow Pet animals: Dog, horse, goat, ox, mule Rituals: They perform all rituals on the banks of Alaknanda,
including the cremation of the dead one Economy/occupation: Agriculture and service Handicraft: Basket making, knitting, weaving etc. Folk Art (Performing): Ramilila and Pandav Nritya, Pitr Puja Archaeological remains: It is a pre-historic rock-shelter site. The rock-shelter is
about 10 mts high and the paintings are drawn on huge, flat rock (4 x 6 mts) overlooking the deep valley towards the north-east. The paintings have been done in deep red ocher showing a hoard of animals. A few motifs represent human and animal forms. The human figures are generally shown with raised hands showing them in action of driving the animals. The position of legs indicates movement. Though no other supporting evidence regarding their period is available, yet they add to the significance of the prehistoric cultural remains in the Vishnugarh-Pipalkoti Hydro Electric Dam project area in Alaknanda valley.
Remarks: Viewing the potentiality of the site, a planned and intensive exploration is suggested in the hilly tracts in and around Dungri village. The rock shelter is also suggested for conservation, preservation and excavation in the cave besides Palaeo-environmental & physical anthropological studies of this village

Project : Environmental Studies for Vishnugad Pipalkoti Hydro-Electric Project Page: 170 Document : 2008026/EC/Final Report Date: Nov 2009 Chapter-3 : Baseline Environment, Impacts & Mitigation Measures Revision: R4
Pre-historic Rock Painting on the Wall of a Cave at Dungri Village
Aerial view of Dungri Village
Name of the Village: AMARPUR
Location: N. 30◦25’11.5’’ E. 79◦26’15.6’’ ± 8 m Site No.: 20 (Twenty) Altitude: 1353 m above MSL Approach: One can reach to this village from main road after 11/2 km
downward walk from Pipalkoti towards Gadora village. It is about 1 km trekking up along a small nulla/drain towards Retoli village which is about 500 mts. uphill from Amarpur village.
Name of the villager contacted for gathering information:
Narendra Singh. He belongs to Bhutia tribe.
No. of families: There are 24 families (all are Bhutia tribe ) in the village, they are native of Malari village near Nitti pass
Population of village: Approx 150 persons Area of the village: Approx 1 sq.km Plants & trees they worship or the sacred flora:
Pipal, Surai, Banyan, mango tree leaves, bel-patri,bhoj-patri, tulsi,
Sacred animal/fauna: They worship cow Pet animals: Dog, cat , horse, goat, buffalo, ox, mule Rituals: They perform all rituals related with their life at Malari
village near Dronagiri, except, the cremation of the dead one, which is performed on the banks of Alaknanda.
Economy/occupation: Agriculture, service , labour Handicraft: Basket making, knitting, weaving etc. Folk Art (Performing): Ramilila and Pandav Nritya, Pitr Puja (Fathers pray) for
well being of the family Archaeological remains: It is a Megalithic burial site consisting the types:
a) Menhirs. b) Crain circles. c) Rectangular Crain burials. d) Location of the site: N. 30◦ 25’13.1’’ E 079◦ 26’
08.5’’
It can be dated between 1000 B.C to 600 B.C. It is also reported that (In early days when villagers used to plough

Project : Environmental Studies for Vishnugad Pipalkoti Hydro-Electric Project Page: 171 Document : 2008026/EC/Final Report Date: Nov 2009 Chapter-3 : Baseline Environment, Impacts & Mitigation Measures Revision: R4
their fields, some Iron objects and potsherds used to unearth).
Remarks: Viewing the potentiality of the site, a planned and intensive exploration is suggested in the hilly tracts in and around Amarpur. The present site is also suggested for excavation and palaeo-environmental studies
View of the archaeological site at
Amarpur village
Rectangular crain megalithc burials on plan at Amarpur village
Menhir Megalithc Burial at Amarpur village
Burials on plan at Amarpur village
Name of the Village: SIRKOT-1 AND SIRKOT-2 (this village has two units)
Location: N-30◦ 24’ 37.3’’ E-79◦ 24’ 41.3’’ ± 5 m N-30◦ 24’ 27.1’’ E-79◦ 24’ 36.0’’ ± 5 m
Site No.: 4 & 5 (Four and Five) Altitude: 1307 and 1311 m above MSL Approach: One can reach to this village from Birahe village via

Project : Environmental Studies for Vishnugad Pipalkoti Hydro-Electric Project Page: 172 Document : 2008026/EC/Final Report Date: Nov 2009 Chapter-3 : Baseline Environment, Impacts & Mitigation Measures Revision: R4
Khuria village, on foot from Khuria village Sirkot village is about 1 km uphill passing through the agriculture fields.
Name of the villager contacted for gathering information:
Narvotam Malasi. He belongs to Brahmin clan.
No. of families: There are 35 families in this village all are Brahmins (Sait & Malasi)
Population of village: Approx- 500 persons Area of the village: This village is divided into two units i.e. Sirkot -1 & Sirkot-
2. The approx. area is about 11/2 Sq. km Plants & trees they worship or the sacred flora:
Pipal, Mango tree leaves and Tulsi.
Sacred animal/fauna: Cow Pet animals: Dog, horse, goat, buffalo and ox Rituals: All rituals and sacrifices related to Samskar etc.are
performed at the confluence (Sangam) of Birahi -Alakananda river
Economy/occupation: Agriculture, service Handicraft: Knitting, weaving etc. Folk Art (Performing): Pandav Nirtya , Bhomial Devta Archaeological remains: It is a historical period site consisting of red ware pot
sherds (mid and rim part) and a stone pounder. These findings are from about 2-3 feets below the present working level of the field. Location of the site: N - 30◦24’35.8’’ & 79◦24’36.2’’
It can be dated from 800 to 1000 A.D. (During the ploughing the field once a 50 cm thick wall was encountered and the stones were reused).
Remarks: Keeping in view the frequency of the potsherds and the potentiality of the site, a planned and intensive exploration is suggested in the tracts around Sirkot village. The present site is also suggested for excavation and ethno-archaeological studies.
Archaeological Site at Sirkot Village General view of Sirkot village

Project : Environmental Studies for Vishnugad Pipalkoti Hydro-Electric Project Page: 173 Document : 2008026/EC/Final Report Date: Nov 2009 Chapter-3 : Baseline Environment, Impacts & Mitigation Measures Revision: R4
Archaeological find (pounder) Sirkot village
Archaeological find (pottery) from Sirkot village
Name of the Village: MAHARGAON (also known as KYONTHA)
Location: N - 30◦ 24’ 35.5’’ & E - 79◦ 25’ 24.6’’ ± 6m Site No.: 8 (Eight) Altitude: 1364 mts above MSL Approach: One can reach mahargoan/village on foot which is 1 km
uphill from Mayapur village. Mayapur village is 7 km from Pipalkoti village down on main Badrinath-Chamoli road towards Birahe village.
Name of the villager contacted for gathering information:
Narender Singh Negi – (Teacher). He belongs to Rajput clan
No. of families: There are 30-35 families in this village Population of village: 150 – 175 persons Area of the village: Approximately 1 sq. km Plants & trees they worship or the sacred flora:
Pipal, Bel, Bar, Mango tree leaves, Tulsi, Banyan tree
Sacred animal/fauna: Cow, Lion, Snake Pet animals: Dog, cat , horse, goat, buffalo, ox, mule Rituals: Disposal of the dead/cremation is performed on the bank
of Alaknanda river and post cremation rituals are performed at Badrinath, on the occasion of Savan Ke Somvar, Karwachauth etc a holy dip / bath is performed on the bank of Alaknanda river
Economy/occupation: 40% of the villagers are in services and rest 60% are doing agriculture and animal husbandry. It is because the youths are migrating from hill to plains for jobs etc.
Handicraft: Knitting, weaving etc. Folk Art (Performing): Pandav Nitya is done to overcome the village problems
from natural catastrophes .Bagdwal Nirtya is performedin the memory of a warriors who defends the village and Ramlilla during Navratra.
Archaeological remains: It is a historical period site consisting of red ware potsherds as observed and collected during surface study of the agriculture fields. These were identical with those which were met with from the agriculture fields at Sirkot. It

Project : Environmental Studies for Vishnugad Pipalkoti Hydro-Electric Project Page: 174 Document : 2008026/EC/Final Report Date: Nov 2009 Chapter-3 : Baseline Environment, Impacts & Mitigation Measures Revision: R4
can be dated from 800 A.D. to 1000 A.D. Location of the Site: N-30◦ 24’ 37.1″ & E-79◦ 25’ 33.8″, ±9
Remarks: On the basis of the frequency of the potsherds , a planned and intensive exploration is suggested in the tracts in and around Mahargaon. The present site is also suggested for excavation
Archaeological find (pottery) from Mahargoan village
View of Mahargoan Village
Name of the Village: HAAT Location: N - 30◦ 25’ 18.8’’ & E - 79◦ 24’ 53.7’’± 8 m Site No.: 56 (Fifty Six) Altitude: 1075 m above MSL Approach: One can reach this village from any one of the two iron
suspension bridges crossing Alakhnanda river on foot by 1 km walk from Batula village, which is 7 km from Pipalkoti village down on main Badrinath-Chamoli road towards Birahe village.
Name of the villager contacted for gathering information:
Ayodhya Prasad Khanduri (Army ex-serviceman). He belongs to Brahmin clan. But in this village people of all caste live together.
No. of families: There are about 200 families in this village Population of village: 800 – 850 people Area of the village: The village is about 1 sq. km in area Plants & trees they worship or the sacred flora:
Pipal, Banyan, mango tree leaves, bel-patri, bhoj-patri, tulsi
Sacred animal/fauna: Cow Pet animals: Dog, cat , horse, goat, buffalo, ox, mule Rituals: Though there are 7 temples in this village dedicated to
Shiva, Hanuman, Kali, Chamunda, Lakshmi Narayan, Bhomial etc. But all rituals related to Sanskars are performed on the banks of Alakananda river
Economy/occupation: Agriculture, service, labour, animal husbandry Handicraft: Knitting, weaving etc. Folk Art (Performing): Ramlila, Pandav Nritya and Bagdwal Nirtya.

Project : Environmental Studies for Vishnugad Pipalkoti Hydro-Electric Project Page: 175 Document : 2008026/EC/Final Report Date: Nov 2009 Chapter-3 : Baseline Environment, Impacts & Mitigation Measures Revision: R4
Archaeological remains: a) The temple can be dated to 9-10th century A.D. This temple has gone under many structural alterations & additions, but the garbhgrih/ sanctum sanctorum is in its insitu position, partly buried. Since this temple is not in the list of protected monuments of Central and State department of archaeology. Being in neglect for along time, the idols of the Lakshmi-Narayan has been stolen away in place of the original sculpture/idol a modern cemented un proportionate figure has been placed with in the original well carved stone frame depicting Dasa avtarimages, five on the either vertical pillars of the frame. Some Shikhar members such as amlkas are lying scattered in the complex. There is no priest in this temple. b) This heritage building lies on the way from Haat village to Seasain village. These are the remains and abandoned structures of Haat (Bazar) and transit camps of the pilgrimagers, who used to halt at this place en route to Badrinath from Chamoli and vice-versa in early times. It can be dated to 1800 A.D. (The name of this village Haat has been derived or adopted from this area where in early days (Historical period) the market and rest houses used to serve the pilgrimagers/yatris i.e. (Haat means market). According to Gazetteer, this was also the centre of iron mining/smelting.
Remarks: For the runnied and abandoned bazaar and rest house i.e. heritage buildings. As these heritage structures are in a bad state of conservation and preservation, it is suggested for their proper documentation, conservation and preservation. (the local people are robbing the stones and other structural members of these Heritage Buildings for reusing it in their modern structures).

Project : Environmental Studies for Vishnugad Pipalkoti Hydro-Electric Project Page: 176 Document : 2008026/EC/Final Report Date: Nov 2009 Chapter-3 : Baseline Environment, Impacts & Mitigation Measures Revision: R4
View of Laxmi Narayan Temple View of Haat Village
Inscription on the stone door frame
Shikhar members such as amlkas are lying in the complex of the temple at Haat village
Covered Idol in the garbhgrih and the uncover one shows that the original stone idol has been replaced with this cemented one, but the original frame depicting Dasa avtar in panel five on either side are original.

Project : Environmental Studies for Vishnugad Pipalkoti Hydro-Electric Project Page: 177 Document : 2008026/EC/Final Report Date: Nov 2009 Chapter-3 : Baseline Environment, Impacts & Mitigation Measures Revision: R4
Remains of abandoned double storied guest house (Heritage building) on Haat- Siyasain ancient route
Abandoned shops (Heritage buildings) Siyasain ancient Route to Badrinath
Name of the Village: DARMI Location: N - 30◦ 28’ 37.2’’ & E - 79◦ 23’14.2’’± 9 m Site No.: 34 (Thirty Four) Altitude: 1557 mts above MSL Approach: One can reach this village on foot. It is 3 km. uphill
distance from Patal Ganga bridge (just before Alaknanda-Patal Ganga confluence) via. Naulli village (old name Kawna village). Darmi village is 2 km uphill walk from Naulli village
Name of the villager contacted for gathering information:
Avtar Lal (carpenter). and in this village people of all castes live together
No. of families: There are about 30 families in this village Population of village: Approx. 200 persons Area of the village: It is a small village covering an area of about 200 meters
in radius Plants & trees they worship or the sacred flora:
Pipal, Deodar, Tulsi, Bhojpatri
Sacred animal/fauna: cow and ox Pet animals: Dog, cat, horse, goat, buffalo, ox, mule, sheep, hen Rituals: Though in this village there are three temples which are
as follows, but all rituals are performed in the village or at Badrinath except cremation of the dead one, which is performed on the banks of Patal Ganga: a) Hanuman Mandir – It is modern temple. b) Kshtrapal Mandir - It is old but not historical. c) Narsimha Mandir - It is a historical temple almost identical to that of at Haat village
Economy/occupation: The village has agriculture based economy Handicraft: Weaving, knitting and basket making Folk Art (Performing): Pandav Nritya, Ramlila, Krishanlila Archaeological remains: In this village the temple of Narsimha is an archaeological
monument, partly renovated by the villagers on receiving funds from Badrinath shrine board. The plinth stone

Project : Environmental Studies for Vishnugad Pipalkoti Hydro-Electric Project Page: 178 Document : 2008026/EC/Final Report Date: Nov 2009 Chapter-3 : Baseline Environment, Impacts & Mitigation Measures Revision: R4
members of the garbhgrih / sanctum sanctorum is intact and original, where as the part of Shikhar and Mukha mandapa is renovated/altered recently. The architecture of this temple is similar to that of Lakshminaryana temple at Haat . This temple may also be assigned to 9-10th
century A.D . Mr Dimri is the priest of this temple. This temple is not in the list of protected monuments of Central and State Archaeology Department.
Remarks: This area requires extensive exploration to ascertain the historicity and antiquity of this remote village. The monument needs proper documentation, conservation and chemical preservation for posterity.
Garbhgrih and Renovated Mukha mandapa of the Temple at Darmi village
View of the Darmi village
Name of the Village: GULABKOTI Location: N- 30◦ 30’ 15.8’’& E-79◦ 29’31.8’’± 37 m Site No.: 38 (Thirty Eight) Altitude: 507 m above MSL Approach: One can reach this village on foot from Langsi village
market on the main Badrinath-Chamoli road. Langsi is 2 km. uphill distance from Patal Ganga bridge towards Joshimath and Gulabkoti is about 11/2 km. uphill walk from Langsi village market
Name of the villager contacted for gathering information:
Harish Rawat, he belongs to Rajput clan and in this village people of all castes live together.
No. of families: There are about 96 families in this village Population of village: Approx. 450-500 persons Area of the village: It is a small village covering an area of 1 sq.km Plants & trees they worship or the sacred flora:
Pipal, Banyan, mango tree leaves, bel-patri, bhoj-patri, tulsi, etc.
Sacred animal/fauna: Cow Pet animals: Dog, cat , horse, goat, buffalo, ox, mule Rituals: Though in this village there are three temples which
are as follows, but rituals like mundan sanskar are performed at Badrinath or at Haridwar except cremation of dead ones (dha sanaskar)is performed

Project : Environmental Studies for Vishnugad Pipalkoti Hydro-Electric Project Page: 179 Document : 2008026/EC/Final Report Date: Nov 2009 Chapter-3 : Baseline Environment, Impacts & Mitigation Measures Revision: R4
on the banks of Alaknanda. Rest of the rituals are performed in the temple of the village. a) Bhomial Mandir - It is modern temple. b) Kshtrapal Mandir - It is modern temple. c) Lakshmi Narain Mandir - It is a historical temple almost identical to that of Vasudeva temple at Joshimath and Pandukeshwar temple at Pandukeshwar village
Economy/occupation: Agriculture, service, labour Handicraft: Weaving and knitting Folk Art (Performing): Pandav Nritya and Ramlila Archaeological remains: In this village there is a living temple of Lakshmi
Narain made up of made up of local dressed stones in dry masonry , the temple is intact and bears old paintings on the inner walls of the mukha mandapa presently camouflaged by a lime white wash. On the either side of the main entrance door there is an inscription engraved in devanagri script. The wooden doors are also original and no structural addition and alterations to the temple architecture has been made. Except a coat of white wash on the inner and outer face of the mukha mandapa for a fresh look has been given in the recent past. The plinth stone members of the garbhgrih / centum centorum is intact and original, having decorative carvings motifs in panels on the adhisthan mouldings, where as on the top of Shikhar an original wooden canopy is installed to probably protect it from snow. This temple is similar to that of Vasudeva temple at Joshimath and Pandukeshwar temple at Pandukeshwar village. But much smaller in size, in comparison to Gopinath temple at Gopeshwar. This village was also falls on the ancient route to Badrinath like that of Haat and Pipalkoti village. In 1905 during Britsh India regime a dak bungalow was also constructed for the stay of pilgrimagers of higher status. The temple is datable to 9th – 10th century A.D.
Remarks: Keeping in view the potentiality of the site and its significance a planned and intensive archaeological study of this area is suggested. The present site is also proposed for scientific clearance, documentation, conservation and chemical preservation. i.e. removal of moss, algae, vegetation growth on the Shikhar part and removal of the white wash coat from the monument. It is urgently required that the inscription engraved in devanagri script may be translated / read. Since this monument is not in the list of protected monuments of Central and State Archaeology Department. Since, the main idol of Lakshminarian has already been stolen away in the recent past, therefore, the temple should be handed over to the gram sabha

Project : Environmental Studies for Vishnugad Pipalkoti Hydro-Electric Project Page: 180 Document : 2008026/EC/Final Report Date: Nov 2009 Chapter-3 : Baseline Environment, Impacts & Mitigation Measures Revision: R4
or panchyat pradhan for its long life / posterity.
rbhgrih
Backside of Temple View of Temple Interior view of Garbhgrih
Carved moldings on the plinth of the Garbhgrih
Engraved Inscription on the either side of main entrance door frame
Name of the Village: TANGNI MALLI Location: N- 30◦ 28’ 36.7’’& E-79◦ 28’19.6’’± 10 mts.Site No. 32 (Thirty Two) Altitude: 1547 mts above MSL Approach: One can reach this village by car, bus etc. upto Tangni Talli
village which is 4 km. downwards from Patal Ganga bridge towards Garud ganga/Pipalkoti on the left side of the main Badrinath-Chamoli highway towards Pipalkoti. From Tangni Talli village one has to walk 1km uphill to reach Tangni Malli village.
Name of the villager contacted

Project : Environmental Studies for Vishnugad Pipalkoti Hydro-Electric Project Page: 181 Document : 2008026/EC/Final Report Date: Nov 2009 Chapter-3 : Baseline Environment, Impacts & Mitigation Measures Revision: R4
for gathering information: Rajendra Singh Chauhan, he belongs to Rajput clan. In this village people of all castes live together. .
No. of Families: There are about 80 families in this village. Population of village: About 240-250 people Area of the village: It is a small village covering an area of 1 sq.km. Plants & trees they worship or the sacred flora: Pipal, Surai, Banyan, mango tree leaves, bel-patri, bhoj-
patri, tulsi,deodar. Sacred animal/fauna: They worship cow. Pet animals: Dog, cat , horse, goat, buffalo, ox, mule. Rituals: There is only one temple in this village dedicated to
Bhomial. All rituals are performed on the bank of Patal Ganga river including crimination of the dead.
Economy/occupation: Agriculture, animal husbandry and labour. Handicraft: Basket making and weaving. Folk Art (Performing): Pandav Nritya and Ramlila. Archaeological remains: In one of the house in this village remains of Heritage
building is present in form of profusely carved and decorated wooden balcony of Rajput art tradition. This master piece of local art is a very rare master piece, it can be dated to 10th century A.D
Remarks: It is proposed that after proper documentation and chemical treatment, it must be removed and displayed in a museum before it is lost or decomposed due to rapid modern construction in this village.
General view of the Tangni Malli village
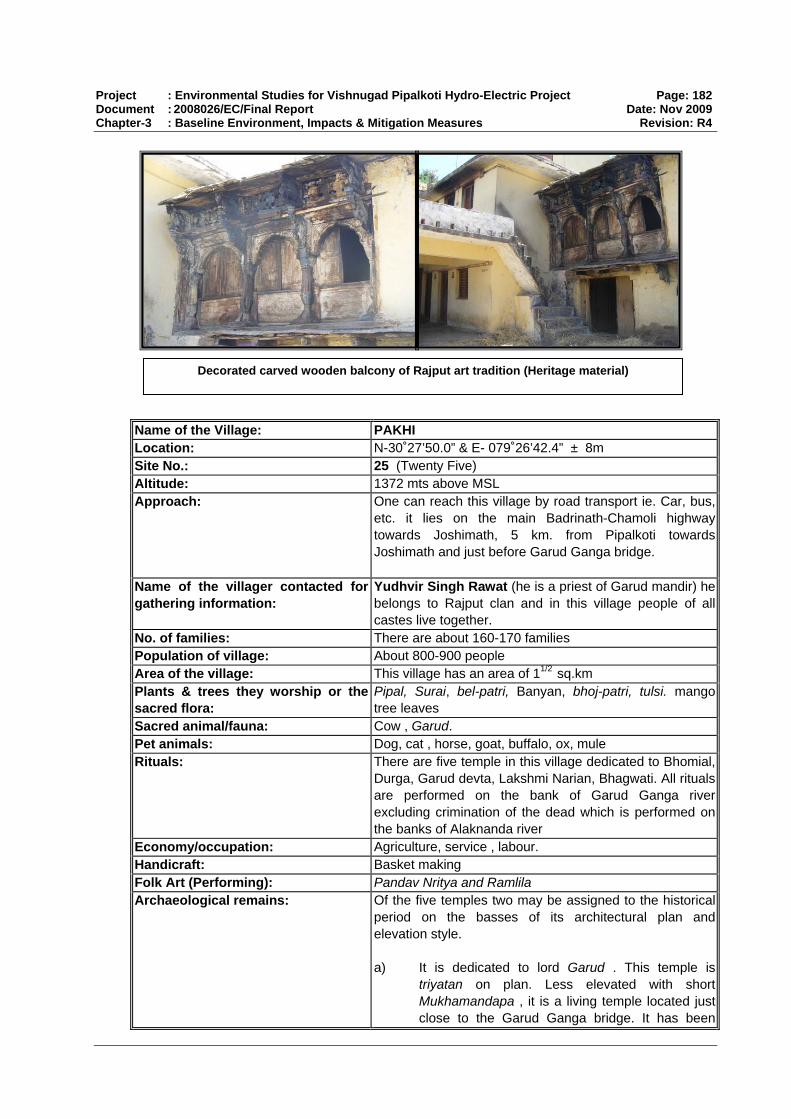
Project : Environmental Studies for Vishnugad Pipalkoti Hydro-Electric Project Page: 182 Document : 2008026/EC/Final Report Date: Nov 2009 Chapter-3 : Baseline Environment, Impacts & Mitigation Measures Revision: R4
Decorated carved wooden balcony of Rajput art tradition (Heritage material)
Name of the Village: PAKHI Location: N-30˚27’50.0” & E- 079˚26’42.4” ± 8m Site No.: 25 (Twenty Five) Altitude: 1372 mts above MSL Approach: One can reach this village by road transport ie. Car, bus,
etc. it lies on the main Badrinath-Chamoli highway towards Joshimath, 5 km. from Pipalkoti towards Joshimath and just before Garud Ganga bridge.
Name of the villager contacted for gathering information:
Yudhvir Singh Rawat (he is a priest of Garud mandir) he belongs to Rajput clan and in this village people of all castes live together.
No. of families: There are about 160-170 families Population of village: About 800-900 people Area of the village: This village has an area of 11/2 sq.km Plants & trees they worship or the sacred flora:
Pipal, Surai, bel-patri, Banyan, bhoj-patri, tulsi. mango tree leaves
Sacred animal/fauna: Cow , Garud. Pet animals: Dog, cat , horse, goat, buffalo, ox, mule Rituals: There are five temple in this village dedicated to Bhomial,
Durga, Garud devta, Lakshmi Narian, Bhagwati. All rituals are performed on the bank of Garud Ganga river excluding crimination of the dead which is performed on the banks of Alaknanda river
Economy/occupation: Agriculture, service , labour. Handicraft: Basket making Folk Art (Performing): Pandav Nritya and Ramlila Archaeological remains: Of the five temples two may be assigned to the historical
period on the basses of its architectural plan and elevation style. a) It is dedicated to lord Garud . This temple is
triyatan on plan. Less elevated with short Mukhamandapa , it is a living temple located just close to the Garud Ganga bridge. It has been

Project : Environmental Studies for Vishnugad Pipalkoti Hydro-Electric Project Page: 183 Document : 2008026/EC/Final Report Date: Nov 2009 Chapter-3 : Baseline Environment, Impacts & Mitigation Measures Revision: R4
totally renovated with cement plaster and white washed , it can be dated to 16th century A.D.
b) It is dedicated to Godess Durga . This temple is
triyatan on plan. Less elevated with short Mukhamandapa , it is a living temple located in the heart of the village. It has been totally renovated with cement plaster and white washed, it can be dated to 16th – 17th century A.D.
Remarks: As the antiquity of these temples is concern, it is ofhistorical importance, these are living temples run and maintained by local authorities, these monuments has to be listed and registered with district registering officer ie. R/O or with the gram sabha.
View of the Pakhi village
Durga temple at Pakhi village Garud temple at Pakhi village
.

Project : Environmental Studies for Vishnugad Pipalkoti Hydro-Electric Project Page: 184 Document : 2008026/EC/Final Report Date: Nov 2009 Chapter-3 : Baseline Environment, Impacts & Mitigation Measures Revision: R4
3.10.6 Impacts and Mitigation Measures
a. Eight villages located in the Project Influence Area have archaeological sites. These locations and archeological findings are given below.
Dungri- Pre-historic rock-shelter site Amarpur- Megalithic burial site consisting the types Sirkot I and II- Pottery Mahargaon- Pottery Darmi- Narsimha Temple Gulabkoti-Lakshmi Narain Temple Tangni Malli -Heritage building Pakhi- Garud Temple & Godess Durga Temple
Amarpur, Sirkot, Mahargaon, Darmi Gulabkoti, Tangni Malli and Paki villages are located on the left side of the river Alaknanda, Dungri village is located on right side of the river. The project sites - the HRT, Adits, Power house and Colony area are located on the right bank of the River. The villages on left side of the river are located above the National Highway (NH-58) at higher elevation. The distance of the archeological sites from the river is given below.
Table 3.10.2: Distance of Archaeological locations from river Alaknanda S.No Archaeological Site Location from
river Alaknanda Distance from river Alaknanda, MSL of location & River
1 Pre-historic rock-shelter, Dungri
Right Hand Side 2 km, 1572 m above MSL, River level approx. 1034 m MSL
2. Megalithic burial site Amarpur
Left Hand Side 2 km, 1353 m above MSL, River level approx.1050 m MSL
3. Pottery site, Sirkot-1 & Sirkot-2
Left Hand Side 1 km & 0.5 km, 1307 and 1311 m above MSL,
River level approx. 1050m MSL 4. Pottery site,
Mahargaon Left Hand Side 1.5 km, 1364 m above MSL,
River level approx. 1050 m MSL 5. Narsimha Temple,
Darmi Left Hand Side 2.3 km, 1557 m above MSL,
River level approx. 1245 m MSL 6. Lakshmi Narain
Temple, Gulabkoti Left Hand Side 1 km, 1507 m above MSL,
River level approx. 1245 m MSL 7. Heritage building,
Tangni Malli. Left Hand Side 1.1 km, 1547 m above MSL,
River level approx. 1245 m MSL
8. Garud Temple and Goddess Durga Temple, Pakhi
Left Hand Side 0.5 km, 1372 m above MSL, River level approx. 1234 m MSL
The project facilities such as establishment of various projects units - diversion dam, Intake structures, underground sedimentation chambers, Silt flushing tunnel, Head Race Tunnel (HRT) along the right bank of the Alaknanda river,
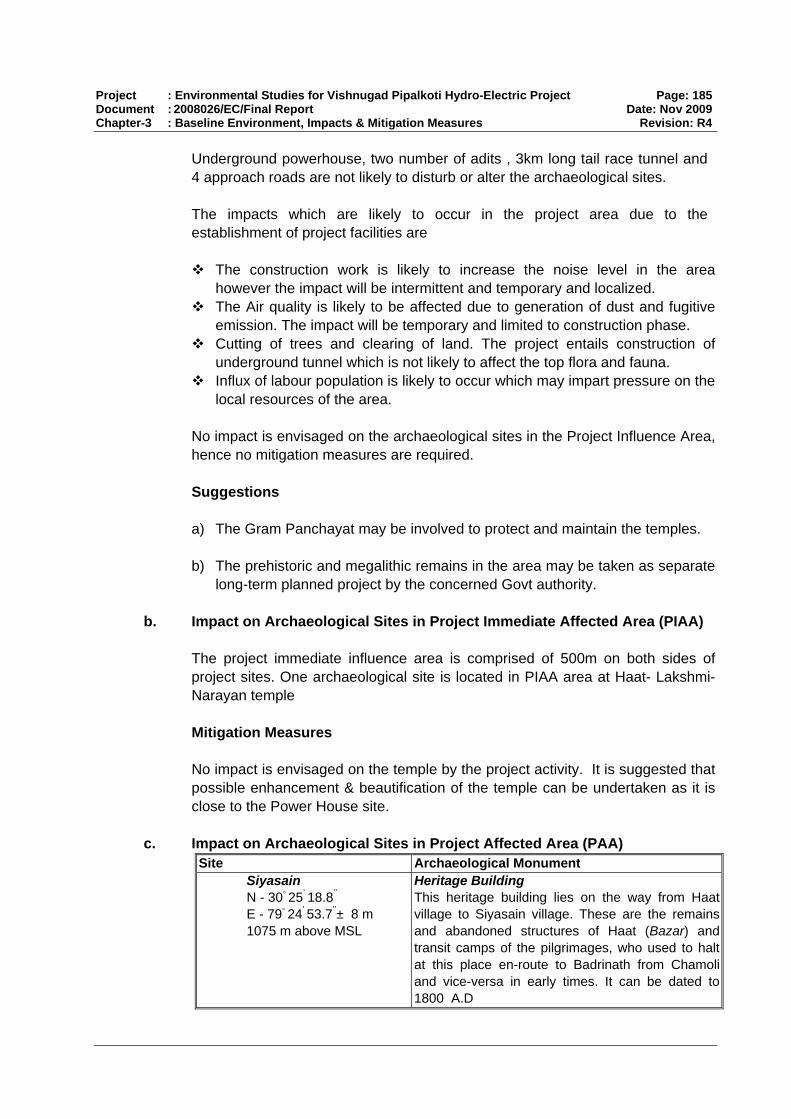
Project : Environmental Studies for Vishnugad Pipalkoti Hydro-Electric Project Page: 185 Document : 2008026/EC/Final Report Date: Nov 2009 Chapter-3 : Baseline Environment, Impacts & Mitigation Measures Revision: R4
Underground powerhouse, two number of adits , 3km long tail race tunnel and 4 approach roads are not likely to disturb or alter the archaeological sites. The impacts which are likely to occur in the project area due to the establishment of project facilities are
The construction work is likely to increase the noise level in the area however the impact will be intermittent and temporary and localized.
The Air quality is likely to be affected due to generation of dust and fugitive emission. The impact will be temporary and limited to construction phase.
Cutting of trees and clearing of land. The project entails construction of underground tunnel which is not likely to affect the top flora and fauna.
Influx of labour population is likely to occur which may impart pressure on the local resources of the area.
No impact is envisaged on the archaeological sites in the Project Influence Area, hence no mitigation measures are required. Suggestions a) The Gram Panchayat may be involved to protect and maintain the temples. b) The prehistoric and megalithic remains in the area may be taken as separate
long-term planned project by the concerned Govt authority.
b. Impact on Archaeological Sites in Project Immediate Affected Area (PIAA) The project immediate influence area is comprised of 500m on both sides of project sites. One archaeological site is located in PIAA area at Haat- Lakshmi-Narayan temple Mitigation Measures No impact is envisaged on the temple by the project activity. It is suggested that possible enhancement & beautification of the temple can be undertaken as it is close to the Power House site.
c. Impact on Archaeological Sites in Project Affected Area (PAA) Site Archaeological Monument
Siyasain N - 30◦ 25’ 18.8’’
E - 79◦ 24’ 53.7’’± 8 m 1075 m above MSL
Heritage Building This heritage building lies on the way from Haatvillage to Siyasain village. These are the remains and abandoned structures of Haat (Bazar) and transit camps of the pilgrimages, who used to halt at this place en-route to Badrinath from Chamoli and vice-versa in early times. It can be dated to 1800 A.D

Project : Environmental Studies for Vishnugad Pipalkoti Hydro-Electric Project Page: 186 Document : 2008026/EC/Final Report Date: Nov 2009 Chapter-3 : Baseline Environment, Impacts & Mitigation Measures Revision: R4
Mitigation Measures These heritage structures are in a bad state of conservation and preservation, it is suggested for their proper documentation, conservation and preservation. Major portions of the heritage building are in a very dilapidated and poor condition, which makes them impossible to be restored or preserved. This is the reason why the local people are using the stones and other structural members of these Heritage Buildings for their modern structures, which have fallen apart. Therefore it is suggested to conserve and preserve those portions of the structural members of the Heritage Building which can be restored and preserved and for which the exact age can also be ascertained. The available ancient route in the said region starts after crossing iron suspension bridge over Alaknanda River from the Chamoli-Badrinath National Highway (NH- 58), 5 km towards Birahe village from Chamoli. Chhinka village is on the right side of Alaknanda River. The total length of this path (ancient route) from Chhinka village to Pipalkoti is about eight and a half kilometer (8.5 km). It is walking distance along the Alaknanda through non-motorable path, passing through Bowala, Durgapur, Siyasain village (passing through the ruined and abandoned bazaar and rest house etc, i.e. heritage building complex) via Haat village, from here one have to cross iron suspension bridge over Alaknanda river to reach the left bank side of the Alaknanda so to reach Pipalkoti village and further towards Badrinath (refer Map 2). It is suggested that the temples falling in the villages on the Right Hand Side of river Alaknanda may be considered for enhancement and beautification. The villages on RHS are Tirosi, Tapon, Dwing, Kimana, Palla, Lanji, Pokhani, Hyuna, Guniyala, Biamaru, Surenda, Kanda, Bedumath, Bajani, Math Jharetha, Haat, Siyasain, Jaisal, Durgapur, Kunj, Bowala and Chhinka. An Archeological museum may be opened in the project area for display of Archaeological findings, if any in the area, in consultation with Archaeological Survey of India. Archaeological Chance Find Procedure:
Sites and properties that are buried or not identified by the survey undertaken by THDC may be discovered during project implementation, especially in the course of construction or excavation. Such unanticipated discoveries of remains of an archaeological and/or historical nature are termed archaeological chance finds. Most often they are concentrations of pottery, worked stone, and human and animal bones, without commercial value, but of significance to archaeologists, historians, anthropologists, and paleontologists.

Project : Environmental Studies for Vishnugad Pipalkoti Hydro-Electric Project Page: 187 Document : 2008026/EC/Final Report Date: Nov 2009 Chapter-3 : Baseline Environment, Impacts & Mitigation Measures Revision: R4
The following archaeological chance find procedures are adopted in project design and construction contracts: • The responsibility for preservation, maintenance and assessment of
historical and cultural monuments rests with the Department of Archaeology, State Govt., and in specific cases, with the Archaeological Survey of India.
• Whenever chance finds of cultural or historical artifacts (moveable and immovable) are made the Department of Archaeology of the state Government, the Archaeological Survey of India will be informed. Should the continuation of work endanger the historical and cultural artifacts, the project work will be suspended until a solution is found for the preservation of these artifacts, or advice from the Archaeological Survey of India is obtained.
• Contractors, employees of the contractors and all project employees will be responsible for informing the Project Director immediately after discovery of the chance find, without any judgment on their own on the value of the chance find. The Project head will be responsible to inform the Department of Archaeology of the State Government, and the Archaeological Survey of India, local Office, within 48 hours of such discovery.
• The Project Head will request for a representative of the State Department of Archaeology, Government of Uttrakhand, and/or the Archaeological Survey of India, local Office in Uttarakhand to make a site inspection.
• Project Head will order cessation of work in the vicinity of the chance find until the visit of a representative (usually required within 48-72 hours of notification); and follow the advice by the State Department of Archaeology, and/or the Archaeological Survey of India on possible salvage or excavation (usually required within 48-72 hours of notification).
• Failure to report a chance find within the 48 hours of discovery, is a punishable offence under the relevant Indian legislation. Similarly, (intentional) damage to a historical or cultural artifact is a punishable offence.
THDC will also seek the support of the Archaeological Survey of India, local Office to periodically inspect the sites of construction, excavation and muck disposal to detect any chance finds.
Eco-view points Two following eco-view points have been identified which can be developed as tourist view point in the Project area or otherwise THDC may explore any other view points in the project area. From these points tourist/ locals can enjoy the exceptionally beautiful scenery of the area. 1. Near Pakhi
2. Agthala village

Project : Environmental Studies for Vishnugad Pipalkoti Hydro-Electric Project Page: 188 Document : 2008026/EC/Final Report Date: Nov 2009 Chapter-3 : Baseline Environment, Impacts & Mitigation Measures Revision: R4
A tentative budget of Rs.25,00,000/- (Rupees Twenty Five Lakhs) is proposed for Archaeological management . 1. For structural Conservation, Preservation and Restoration of Archaeological
sites tentative budget of Rs 10,00,000/- (Rupees Ten lakhs) is suggested.
2. For opening of Archaeological museum a tentative budget of Rs.15,00,000/- (Rupees Fifteen lakhs) is suggested

Project : Environmental Studies for Vishnugad Pipalkoti Hydro-Electric Project Page: 189 Document : 2008026/EC/Final Report Date: Nov 2009 Chapter-3 : Baseline Environment, Impacts & Mitigation Measures Revision: R4
3.11 IMPACTS GENERATED BY CONSTRUCTION ACTIVITIES
The impacts generated by construction activities are given below 3.11.1 Ambient Air Quality
There are no industries in or along the project area hence any source of atmospheric air pollution is not expected. The study area represents rural environment. The sources of air pollution in the region are vehicular traffic, dust arising from unpaved village roads and domestic fuel burning. Ambient Air Quality of the study area The baseline status of the ambient air quality has been established through a scientifically designed ambient air quality monitoring network. Five Ambient Air Quality Monitoring (AAQM) locations were selected within the study area. AQ1 CES Site Office Pipalkoti
AQ2 Helong
AQ3 Pakhi
AQ4 Haat
AQ5 Pipalkoti
Ambient air quality monitoring was undertaken in the pre and post monsoon season in the year 2008. Monitoring established that air quality parameters conform to the National Ambient Air Quality Standards for residential and rural areas. Air Quality monitoring was done at five sites. The baseline data of ambient air environment is generated for the mentioned parameters as given below:
Suspended Particulate Matter (SPM)
Respirable Particulate Matter (RPM)
Sulphur dioxide (SO2)
Oxides of Nitrogen (NOx).
The Air Quality Standards prescribed by CPCB is attached as Annex 3.11.1 .The summary of Air quality monitoring is given in Table below.
Table-3.11.1 Summary of ambient Air Quality Monitoring (Unit : µg/m3)
Station Average Maximum Minimum Pre-monsoon season RPM CES Site Office Pipalkoti 30 32 20 Helong 31 35 28 Pakhi 31.2 33 28 Hat 31.1 34 27 Pipalkoti 31.5 35 30

Project : Environmental Studies for Vishnugad Pipalkoti Hydro-Electric Project Page: 190 Document : 2008026/EC/Final Report Date: Nov 2009 Chapter-3 : Baseline Environment, Impacts & Mitigation Measures Revision: R4
Station Average Maximum Minimum SPM CES Site Office Pipalkoti 140 142 135 Helong 133 137 128 Pakhi 160 164 155 Hat 135 139 131 Pipalkoti 136 140 131 NOX CES Site Office Pipalkoti 8.7 9.9 8.1 Helong 8.8 9.5 7.8 Pakhi 9.4 10.3 9.1 Hat 9.3 9.9 9.1 Pipalkoti 8.2 9.4 7.2 SO2 CES Site Office Pipalkoti 7.0 8.2 6.2 Helong 7.8 8.4 6.9 Pakhi 6.0 7.1 5.1 Hat 6.8 7.5 6.1 Pipalkoti 6.5 7.1 6.1 Post-monsoon season RPM CES Site Office Pipalkoti 22.5 26 20 Helong 24 26 22 Pakhi 32.25 34 30 Hat 23.8 26 21 Pipalkoti 23.1 26 21 SPM CES Site Office Pipalkoti 130 134 127 Helong 126 130 123 Pakhi 154.8 158 152 Hat 128 132 122 Pipalkoti 132 135 130 NOX CES Site Office Pipalkoti 8.2 8.9 8.1 Helong 8.6 9.5 8.1 Pakhi 9.4 9.7 9.2 Hat 9.2 9.5 9.1 Pipalkoti 8.3 8.9 8.1 SO2 CES Site Office Pipalkoti 6.6 7.3 6.2 Helong 7.2 7.5 7.1 Pakhi 6.3 6.5 6.1 Hat 6.2 6.5 6.1 Pipalkoti 7.0 7.5 6.2 Source: CES Impacts Impacts on ambient are quality is anticipated only during project construction phase. Air pollution is likely to occur during project construction phase which may cause increase in SPM and RPM level in the area. The major sources of air pollution during construction phase are:
Pollution due to fuel combustion from various construction equipment.

Project : Environmental Studies for Vishnugad Pipalkoti Hydro-Electric Project Page: 191 Document : 2008026/EC/Final Report Date: Nov 2009 Chapter-3 : Baseline Environment, Impacts & Mitigation Measures Revision: R4
Fugitive emissions from crushers.
Impacts due to vehicular movement.
Generation of dust due to clearing of land and construction activity
The impact shall be temporary, localised and reversible. No significant impact on Project Influence Area and Alaknanda Basin. Mitigation Measures
Adequate dust suppression measures such as regular water sprinkling on construction sites, haul & unpaved roads particularly and near settlement may be undertaken to control fugitive dust
Plantation activity may be undertaken at the construction sites
Workers may be provided with mask to prevent breathing problems
Trucks carrying soil, sand and stone may be duly covered to avoid spilling.
Low emission construction equipment, vehicles and generator sets may be used
Air quality monitoring may be conducted at construction sites.
Impact and Mitigation Operation Phase Operation Phase
During operation phase no impact on air quality due to the project
The air quality of the area is likely to improve due to the plantation along the road, colony area , compensatory afforestation .
Mitigation Measures
Plantation may be maintained and green belt development may be
undertaken near settlements. The Air Quality monitoring plan is provided in Chapter 4-EMP, Section
4.16.3 3.11.2 Ambient Noise Level
Noise level monitoring was done at 5 locations NQ1 Dam Site- Residential area
NQ2 Dwing Village- Residential area
NQ3 Pipalkoti- Commercial area
NQ4 Haat Village- Residential area
NQ5 Birahi- Residential area
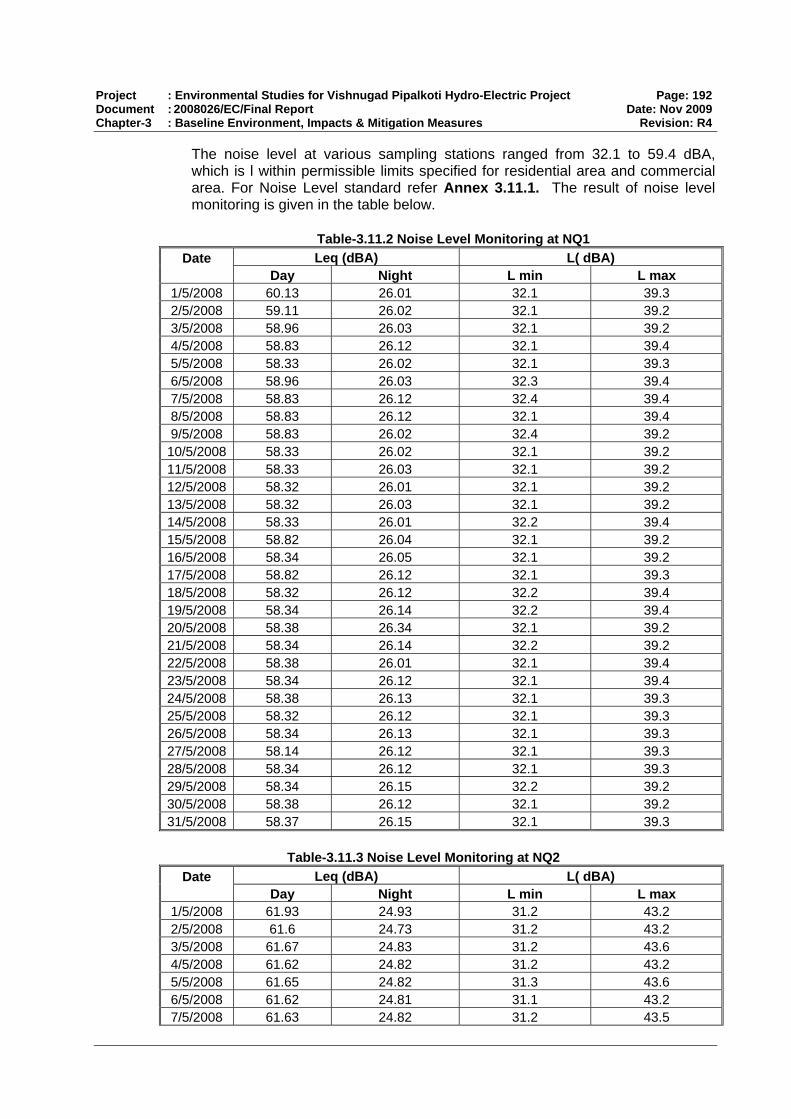
Project : Environmental Studies for Vishnugad Pipalkoti Hydro-Electric Project Page: 192 Document : 2008026/EC/Final Report Date: Nov 2009 Chapter-3 : Baseline Environment, Impacts & Mitigation Measures Revision: R4
The noise level at various sampling stations ranged from 32.1 to 59.4 dBA, which is l within permissible limits specified for residential area and commercial area. For Noise Level standard refer Annex 3.11.1. The result of noise level monitoring is given in the table below.
Table-3.11.2 Noise Level Monitoring at NQ1 Leq (dBA) L( dBA) Date
Day Night L min L max 1/5/2008 60.13 26.01 32.1 39.3 2/5/2008 59.11 26.02 32.1 39.2 3/5/2008 58.96 26.03 32.1 39.2 4/5/2008 58.83 26.12 32.1 39.4 5/5/2008 58.33 26.02 32.1 39.3 6/5/2008 58.96 26.03 32.3 39.4 7/5/2008 58.83 26.12 32.4 39.4 8/5/2008 58.83 26.12 32.1 39.4 9/5/2008 58.83 26.02 32.4 39.2 10/5/2008 58.33 26.02 32.1 39.2 11/5/2008 58.33 26.03 32.1 39.2 12/5/2008 58.32 26.01 32.1 39.2 13/5/2008 58.32 26.03 32.1 39.2 14/5/2008 58.33 26.01 32.2 39.4 15/5/2008 58.82 26.04 32.1 39.2 16/5/2008 58.34 26.05 32.1 39.2 17/5/2008 58.82 26.12 32.1 39.3 18/5/2008 58.32 26.12 32.2 39.4 19/5/2008 58.34 26.14 32.2 39.4 20/5/2008 58.38 26.34 32.1 39.2 21/5/2008 58.34 26.14 32.2 39.2 22/5/2008 58.38 26.01 32.1 39.4 23/5/2008 58.34 26.12 32.1 39.4 24/5/2008 58.38 26.13 32.1 39.3 25/5/2008 58.32 26.12 32.1 39.3 26/5/2008 58.34 26.13 32.1 39.3 27/5/2008 58.14 26.12 32.1 39.3 28/5/2008 58.34 26.12 32.1 39.3 29/5/2008 58.34 26.15 32.2 39.2 30/5/2008 58.38 26.12 32.1 39.2 31/5/2008 58.37 26.15 32.1 39.3
Table-3.11.3 Noise Level Monitoring at NQ2
Leq (dBA) L( dBA) Date Day Night L min L max
1/5/2008 61.93 24.93 31.2 43.2 2/5/2008 61.6 24.73 31.2 43.2 3/5/2008 61.67 24.83 31.2 43.6 4/5/2008 61.62 24.82 31.2 43.2 5/5/2008 61.65 24.82 31.3 43.6 6/5/2008 61.62 24.81 31.1 43.2 7/5/2008 61.63 24.82 31.2 43.5

Project : Environmental Studies for Vishnugad Pipalkoti Hydro-Electric Project Page: 193 Document : 2008026/EC/Final Report Date: Nov 2009 Chapter-3 : Baseline Environment, Impacts & Mitigation Measures Revision: R4
Leq (dBA) L( dBA) Date Day Night L min L max
8/5/2008 61.63 24.86 31.2 43.6 9/5/2008 61.62 24.89 31.2 43.6 10/5/2008 61.65 24.84 31.1 43.6 11/5/2008 61.65 24.75 31.2 43.6 12/5/2008 61.64 24.78 31.2 43.5 13/5/2008 61.64 24.82 31.2 43.6 14/5/2008 61.65 24.89 31.3 43.6 15/5/2008 61.67 24.85 31.2 43.6 16/5/2008 61.67 24.82 31.2 43.6 17/5/2008 61.65 24.87 31.2 43.6 18/5/2008 61.85 24.82 31.3 43.6 19/5/2008 61.82 24.86 31.2 43.6 20/5/2008 61.74 24.84 31.2 43.6 21/5/2008 61.74 24.85 31.1 43.6 22/5/2008 61.54 24.86 31.1 43.6 23/5/2008 61.58 24.84 31.2 43.6 24/5/2008 61.59 24.86 31.1 43.6 25/5/2008 61.57 24.86 31.2 43.6 26/5/2008 61.54 24.86 31.2 43.6 27/5/2008 61.54 24.78 31.2 43.6 28/5/2008 61.58 24.75 31.2 43.6 29/5/2008 61.64 24.75 31.2 43.6 30/5/2008 61.67 24.71 31.3 43.6 31/5/2008 61.82 24.76 31.2 43.6
Table-3.11.4 Noise Level Monitoring at NQ3
Leq (dBA) L( dBA) Date Day Night L min L max
1/5/2008 87.47 37.81 48.2 59.4 2/5/2008 87.92 37.62 47.5 58.6 3/5/2008 87.48 37.61 47.5 58.6 4/5/2008 87.45 37.62 47.2 58.4 5/5/2008 87.42 37.64 47.5 58.6 6/5/2008 87.85 37.64 47.5 58.4 7/5/2008 87.42 37.63 47.5 58.6 8/5/2008 87.42 37.52 47.5 58.4 9/5/2008 87.25 37.54 47.2 58.4 10/5/2008 87.14 37.52 47.2 58.6 11/5/2008 87.47 37.54 47.2 58.6 12/5/2008 87.43 37.52 47.2 58.4 13/5/2008 87.42 37.54 47.2 58.4 14/5/2008 87.38 37.56 47.2 58.6 15/5/2008 87.34 37.58 47.2 58.6 16/5/2008 87.36 37.52 47.2 58.4 17/5/2008 87.35 37.54 47.2 58.4 18/5/2008 87.36 37.56 47.2 58.6 19/5/2008 87.35 37.54 47.2 58.6 20/5/2008 87.38 37.54 47.2 58.4

Project : Environmental Studies for Vishnugad Pipalkoti Hydro-Electric Project Page: 194 Document : 2008026/EC/Final Report Date: Nov 2009 Chapter-3 : Baseline Environment, Impacts & Mitigation Measures Revision: R4
Leq (dBA) L( dBA) Date Day Night L min L max
21/5/2008 87.39 37.53 47.2 58.4 22/5/2008 87.34 37.56 47.2 58.4 23/5/2008 87.34 37.59 47.2 58.6 24/5/2008 87.34 37.54 47.2 58.6 25/5/2008 87.65 37.58 47.2 58.6 26/5/2008 87.48 37.54 47.2 58.34 27/5/2008 87.49 37.56 47.2 58.4 28/5/2008 87.48 37.54 47.2 58.6 29/5/2008 87.48 37.54 47.2 58.6 30/5/2008 87.49 37.12 47.2 58.6 31/5/2008 87.92 37.53 47.2 58.4
Table-3.11.5 Noise Level Monitoring at NQ4
Leq (dBA) L( dBA) Date Day Night L min L max
1/5/2008 66.75 30.38 38.4 43.2 2/5/2008 66.75 30.19 38.4 43.2 3/5/2008 66.74 30.13 38.4 43.2 4/5/2008 66.72 30.38 38.4 43.2 5/5/2008 66.71 30.34 38.4 43.2 6/5/2008 66.73 30.35 38.4 43.2 7/5/2008 66.75 30.15 38.4 43.2 8/5/2008 66.72 30.38 38.4 43.2 9/5/2008 66.78 30.38 38.4 43.2 10/5/2008 66.79 30.29 38.4 43.2 11/5/2008 66.74 30.38 38.4 43.2 12/5/2008 66.72 30.29 38.4 43.2 13/5/2008 66.68 30.38 38.4 43.2 14/5/2008 66.64 30.35 38.4 43.2 15/5/2008 66.68 30.34 38.4 43.2 16/5/2008 66.69 30.35 38.4 43.2 17/5/2008 66.75 30.38 38.4 43.2 18/5/2008 66.72 30.36 38.4 43.2 19/5/2008 66.72 30.34 38.4 43.2 20/5/2008 66.72 30.35 38.4 43.2 21/5/2008 66.73 30.36 38.4 43.2 22/5/2008 66.75 30.35 38.4 43.2 23/5/2008 66.79 30.36 38.4 43.2 24/5/2008 66.78 30.34 38.6 43.2 25/5/2008 66.72 30.39 38.4 43.2 26/5/2008 66.72 30.38 38.4 43.2 27/5/2008 66.72 30.37 38.4 43.2 28/5/2008 66.84 30.38 38.5 43.2 29/5/2008 66.82 30.39 38.4 43.2 30/5/2008 66.83 30.35 38.4 43.2 31/5/2008 66.84 30.34 38.4 43.2

Project : Environmental Studies for Vishnugad Pipalkoti Hydro-Electric Project Page: 195 Document : 2008026/EC/Final Report Date: Nov 2009 Chapter-3 : Baseline Environment, Impacts & Mitigation Measures Revision: R4
Table-3.11.6 Noise Level Monitoring at NQ5 Leq (dBA) L( dBA) Date
Day Night L min L max 1/5/2008 69.15 29.51 36.2 45.6 2/5/2008 68.88 29.52 36.2 45.6 3/5/2008 68.67 29.32 36.2 45.6 4/5/2008 68.93 29.22 36.2 45.6 5/5/2008 68.67 29.35 36.2 45.3 6/5/2008 68.54 29.34 36.2 45.6 7/5/2008 69.54 29.35 36.2 45.6 8/5/2008 68.34 29.35 36.2 45.6 9/5/2008 69.65 29.36 36.2 45.6 10/5/2008 68.64 29.34 36.2 45.6 11/5/2008 69.54 29.31 36.2 45.6 12/5/2008 68.68 29.31 36.2 45.6 13/5/2008 69.67 29.34 36.5 45.6 14/5/2008 68.69 29.34 36.2 45.6 15/5/2008 68.64 29.34 36.2 45.6 16/5/2008 68.62 29.35 36.2 45.3 17/5/2008 69.64 29.35 36.4 45.6 18/5/2008 68.39 29.68 36.2 45.6 19/5/2008 69.64 29.35 36.2 45.6 20/5/2008 69.59 29.54 36.2 45.6 21/5/2008 69.58 29.56 36.2 45.6 22/5/2008 68.54 29.56 36.2 45.3 23/5/2008 68.52 29.65 36.2 45.6 24/5/2008 68.52 29.25 36.4 45.6 25/5/2008 68.57 29.35 36.2 45.6 26/5/2008 68.52 29.35 36.2 45.6 27/5/2008 68.53 29.24 36.2 45.4 28/5/2008 68.52 29.26 36.4 45.6 29/5/2008 68.54 29.25 36.2 45.6 30/5/2008 68.57 29.23 36.4 45.4 31/5/2008 68.54 29.23 36.2 45.6
Impact
The noise level of the project area is likely to increase due to various
activities. Increased noise level is anticipated only during project construction phase, due to operation of various equipment, increased vehicular movement and blasting, etc.
There are quite a few settlements close to the project sites, e-g Dam and power house sites.
The increased noise level due to blasting could scare away wildlife from the area. It has been observed during construction phase of similar projects, that wildlife migrates from such areas and returns after the cessation of construction activities.
However this impact would be insignificant as the increase in noise shall be intermittent and temporary

Project : Environmental Studies for Vishnugad Pipalkoti Hydro-Electric Project Page: 196 Document : 2008026/EC/Final Report Date: Nov 2009 Chapter-3 : Baseline Environment, Impacts & Mitigation Measures Revision: R4
Mitigation
Modern technologies producing low noise may be used during construction.
Construction equipment’s and vehicles must be in good working condition, properly lubricated and maintained to keep noise within permissible limit.
Near settlements construction may be conducted during day time and noise producing activity may be prohibited during night hours.
Temporary noise barriers may be installed at settlements, if required.
Plantation may be carried at the work site.
Head phones, ear plugs to be provided to the workers at construction site.
Blasting shall be carried out as per the statutory laws, regulation and rules pertaining to acquisition, transport, storage, handling and use of explosives
Noise level monitoring must conducted during construction phase.
Operation Phase
During operation phase no significant impact on noise
Mitigation Measures
Plantation must be maintained by the project.
The Noise Monitoring plan is provided in Chapter 4-EMP, Section 4.16.4 3.11.3 Construction Camp
During construction phase Construction / Labour Camp will be located along the project area. Large numbers of labor population is likely to influx in the project area. The project construction is likely to last for a period of about 5 years. The peak labour strength likely to be employed during project construction phase is about 2,000 workers and 600 technical staff. The establishment of labour camps is likely to affect environment through improper waste (Solid & Garbage /Sewage) disposal, negative impacts on public health unfriendly use of community resources, poaching of wildlife by labors, and leaving dirty and waste material after shifting from one site to another site. Laborers may cut trees for cooking purpose. The impact of the camps
The construction camp require suitable land near project sites
Construction of camp is likely to require clearing of vegetation in the area
The camps will generate waste which is likely to pollute the land and water in the area
The labours are likely to cut trees for fuel and building huts
Possibility of wildlife hunting by the labours

Project : Environmental Studies for Vishnugad Pipalkoti Hydro-Electric Project Page: 197 Document : 2008026/EC/Final Report Date: Nov 2009 Chapter-3 : Baseline Environment, Impacts & Mitigation Measures Revision: R4
Mitigation Measures To mitigate due to construction camp following mitigation measures are suggested
Construction of camps should be located outside forest
Construction of camps should be located at least 500 meters away from habitation
Adequate supply of fuel in the form of kerosene or LPG may be provided to construction labours to avoid felling of trees for cooking and other household activities. A common community kitchen can be also established. No open fires may be allowed in camps.
Adequate sanitary facilities may be provided within every camp. The place must be cleaned daily and kept in strict sanitary condition. Separate latrine must be provided for women. Adequate supply of water must be provided. Adequate facilities for treatment of sewage generated from labour camps may be commissioned
Reference to the illegally cutting trees, hunting and other prohibited activities in community areas to be included in the contract document
Periodic health check ups may be conducted. These activities may be provided in consultation with State Public Health Department. Awareness program on communicable diseases.
At every Camp first aid facility may be provided, ambulance must be provided to take injured or ill person to the nearest hospital
During construction labours/ workers may be hired from local communities also or other part of the villages as far as possible to avoid social conflict in the construction camp and thereby minimizing resources conflict.
It should be ensured by the construction contractor that area of the construction camp be cleared of the debris and other wastes deposited on completion of construction. The land should be restored back to its original form and condition as it was prior to the establishment of the construction camps
The Construction Camp management is provided in Chapter 4-EMP, Section 4.13.
3.11.4 Human Health Public health is an important aspect in water resources and hydro power project. Since the pool of water created by reservoir will be potential sources of vector borne and water borne diseases. There is possibility of Transmission of diseases by immigrant labour population The project are comes under Dasoli block of district Chamoli. There are about 6 PHCs, 3 CHCS, Additional 5 PHCs and 23 SADs in district Chamoli for Allopathic treatment. Apart from this there are 7 (seven) Ayurvedic and one

Project : Environmental Studies for Vishnugad Pipalkoti Hydro-Electric Project Page: 198 Document : 2008026/EC/Final Report Date: Nov 2009 Chapter-3 : Baseline Environment, Impacts & Mitigation Measures Revision: R4
Homeopathy clinics in this area. Following measures are suggested to prevent/ mitigate impact on human health Mitigation Measures
For maintaining community health, program may be framed such as Augment existing health program
Health education for local project workers and community
Vaccination programs - meningitis, tuberculosis tetanus etc.
Specific HIV/ AIDS prevention activities may be carried such as HIV/STD/ AIDS awareness centres
Peer education program within workers
Technical and material support for STD clinic.
Integration of HIV/ AIDS into thematic projects (eg. emergency training)
Voluntary counseling and testing
Medical aid policies for workers
There is need to be meaningful consultation with local communities so that management measures are culturally appropriate locally and have community support
Safety goggles, helmets, earplugs and masks etc. must be provided to the workers.
All workers employed on mixing of asphaltic material, cement, lime mortars, concrete etc. may be provided with protective footwear and protective goggles. Workers involved in welding work may be provided with welder’s protective eye shields.
No men below age of 18 years or women should not be employed on the work of painting with products containing lead in any form. Face mask may be supplied to for use to the workers when paint is applied in the form of spray or a surface having lead paint dry rubbed and scrapped.
Measures must be taken to prevent fire, flood etc.
Necessary steps must be taken to prompt first aid treatment of all injuries likely to sustain during the course of work.
Filling up of borrow pits and cleaning of the site.
On completion of the works all the temporary structures must be cleared away, all rubbish disposed, excreta and disposal pits or trenches filled in and effectively sealed off and the whole of the site left clean and tidy.
The Public Health Delivery System provided in Chapter 4-EMP, Section 4.14
3.11.5 Employment and Training Activities All the construction workers should be provided training to handle potential occupational hazards which include the following:

Project : Environmental Studies for Vishnugad Pipalkoti Hydro-Electric Project Page: 199 Document : 2008026/EC/Final Report Date: Nov 2009 Chapter-3 : Baseline Environment, Impacts & Mitigation Measures Revision: R4
Environmental Awareness program
Engineering controls, work practices and protective equipment
Handling of raw and processed material
Emergency response Employment opportunity if any, recruitment at the level of workmen
(Including technical & ministerial) required to be done will be done first from the land oustees & in case of non availability of suitable candidate among the land oustees, the recruitment will be done from other residents of Uttarakhand state
Detail Training program for THDC , Project staff and contractor is provided in
Chapter 4-EMP, Section 4.18
3.12 SOCIO ECONOMIC STUDY The project affected villages fall under two blocks of Chamoli District namely Dasholi Block (Chamoli Tehsil) and Joshimath Block (Joshimath Tehsil). The socio-economic and demographic features of the project area are presented at the block level and district level.
Table-3.12.1 Demographic features of project District Block S. No Item
Dasholi Joshimath Chamoli District
1 Area (Sq Km) 851 3883 80302 Households 7705 5402 773813 Total Population 36826 24869 3703594 Total Male Population 18219 13120 1837455 Total Female Population 18607 11749 1866146 Total SC Population 9106 3700 675397 Total ST Population 1966 4428 104848 Population Density (Per Sq Km) 46.32 6.84 45.859 % of SC/ST Tot total Population 30.07 32.68 20.90
Source: District Statistical Hand book, 2006
Table-3.12.2 Work Participation in project District Block S No Item
Dasholi Joshimath Chamoli District
1 Main Workers 6303 7535 969002 Cultivators 3225 4202 587733 Agricultural Labour 10 33 4924 HH Industry/Artisans 538 580 24345 Others 2530 2720 352016 Marginal Workers 10116 4407 678297 Total Workers 16419 11942 1647298 % of Main workers to total population 17.12 30.30 25.189 % of Cultivators/Ag. labour to main 51.32 56.2 61.16

Project : Environmental Studies for Vishnugad Pipalkoti Hydro-Electric Project Page: 200 Document : 2008026/EC/Final Report Date: Nov 2009 Chapter-3 : Baseline Environment, Impacts & Mitigation Measures Revision: R4
Block S No Item Dasholi Joshimath
Chamoli District
workers 10 % of artisans to main workers 8.54 7.70 2.59
Source: SIA Report by CMSR Hyderabad The land holding pattern for the people of the project District is presented Table below As per the records for year 2000-2001 a majority of them are marginal farmers owning less than 0.5 ha of land (47.83%).
Table-3.12.3 Land Holding Pattern for the project District
Joshi Mutt Block Dasholi Block Chamoli DistrictS. No Land holding (Ha) No. of
Persons% No. of
Persons% No. of
Persons %
1 <0.5 1975 47.94 2023 42.64 18503 47.832 0.5 to 1 747 18.13 1040 21.92 7896 20.413 1 to 2 807 19.59 1001 21.10 7607 19.664 2 to 4 462 11.21 585 12.33 3848 9.955 4 to 10 127 3.08 95 2.00 810 2.096 >=10 2 0.05 --- --- 19 0.05 Total 4120 100.00 4744 100.00 38683 100.00Source: District Statistical handbook, 2006 Socio Economic Impact The project involves acquisition of public (government and forest land) and private land from titleholders located in the area. The acquisition of land and consequent displacement will have potential impacts on the social, economic, cultural and environmental attributes of the affected population with specific impacts on their productive assets, sources of income, habitat, community structure, social relations, cultural identity, traditional authority and also their potential for mutual help. There are 19 project-affected villages located in Chamoli and Joshimath Tehsils of Chamoli district. The private land acquisition is involved in 7 villages,- Haat, Jaisaal, Batula, Naurakh, Tenduli Chak Haat, Guniyala and Gulabkoti. Table below gives the names of the total affected villages.
Table 3.12.4: List of Project Affected Villages S. No Name of the Project
affected Village Block/Tehsil Project component
1 Haat Dasholi/Chamoli Power House 2 Jaisaal Dasholi/Chamoli Colony Area 3 Batula Dasholi/Chamoli Approach road 4 Naurakh Dasholi/Chamoli Approach road 5 Tenduli Chak Haat Dasholi/Chamoli Approach road 6 Guniyala Dasholi/Chamoli Approach road 7 Math Jadetha Dasholi/Chamoli Approach road 8 Baula (Durgapur) Dasholi/Chamoli Outlet for TRT

Project : Environmental Studies for Vishnugad Pipalkoti Hydro-Electric Project Page: 201 Document : 2008026/EC/Final Report Date: Nov 2009 Chapter-3 : Baseline Environment, Impacts & Mitigation Measures Revision: R4
S. No Name of the Project affected Village
Block/Tehsil Project component
9 Gadi Dasholi/Chamoli Quarry area 10 Gulabkoti Joshimath Dumping area 11 Langsi Joshimath Approach road 12 Tapoan Joshimath Approach road 13 Dwing Joshimath Approach road and Adit 14 Nauligwad Joshimath Quarry area 15 Palla Joshimath Dam area 16 Helong Joshimath Dam site and reservoir area 17 Paini Joshimath Reservoir area 18 Thaing Joshimath Reservoir area 19 Salna Joshimath Reservoir area
Source: Source: RAP, VPHEP, THDC Private land acquisition from 542 titleholders or land owners located in 7 villages. 31.621 ha private land is required for the project.
Table-3.12.5 Detail of Land owners Affected
Land owners affected S. No Name of the Village THs NTHs Total
1 Haat 271 06 276 2 Jaisaal* 77 0 77 3 Batula 73 8 81 4 Tenduli Chak Haat 4 0 4 5 Naurakh 49 0 49 6 Guniyala 22 0 22 7. Gulabkoti 46 0 46 8. Langsi 0 46 46
Total 542 60 602 Source: RAP, VPHEP, THDC Note: THs-Title Holders, NTHs- Non Title Holders
60 numbers of non-titleholders are also affected due to the Government land
acquisition. There are 139 private structures will be affected under the project. 31 community properties will be affected by the project
Table-3.12.6 Details of Structures Affected under the Project
Private Structures
Usage of the structure Type of Structure S. No Name of the Village
Res Comm
Res+ Comm
Others# Total Pucca Semi
Pucca Kutcha Total
Common property
resources%
1 Haat 91 0 3 22 116* 63 53 116 31 2 Jaisal 5 0 1 7 13 4 7 2 13 0 3 Batula 3 1 1 3 8 3 1 4 8 0 4 Naurakh 0 0 0 0 0 0 0 0 0 0
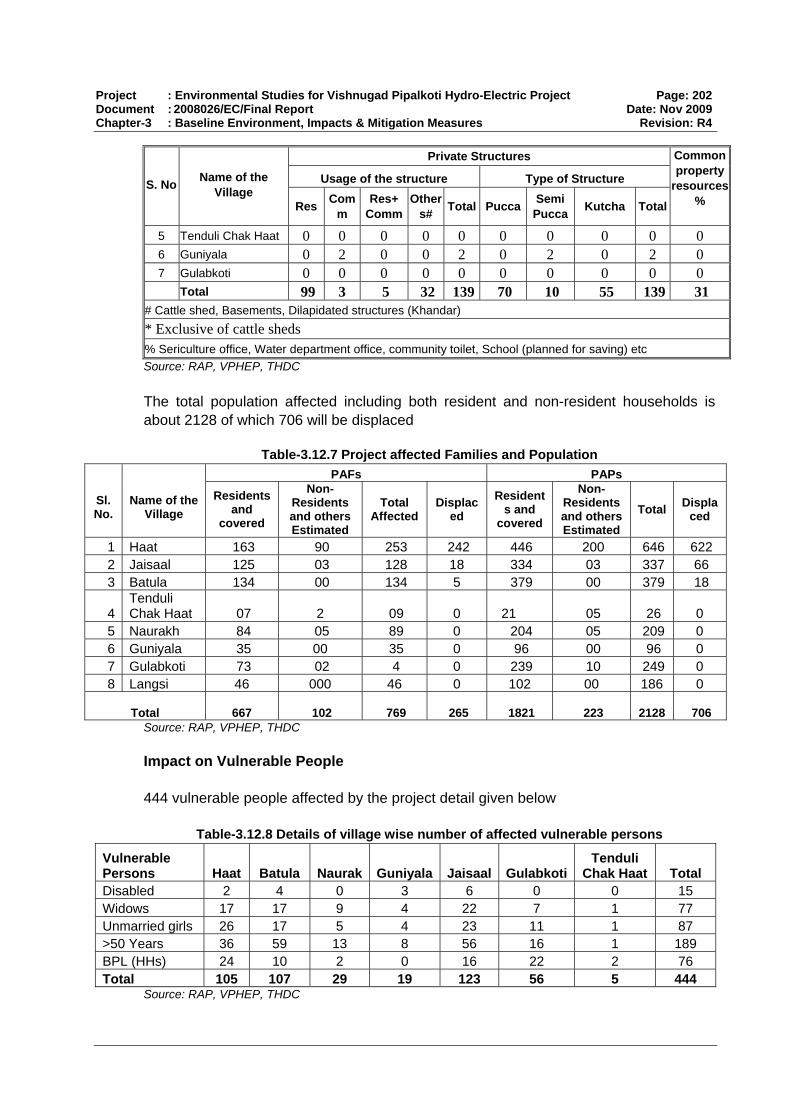
Project : Environmental Studies for Vishnugad Pipalkoti Hydro-Electric Project Page: 202 Document : 2008026/EC/Final Report Date: Nov 2009 Chapter-3 : Baseline Environment, Impacts & Mitigation Measures Revision: R4
Private Structures
Usage of the structure Type of Structure S. No Name of the Village
Res Comm
Res+ Comm
Others# Total Pucca Semi
Pucca Kutcha Total
Common property
resources%
5 Tenduli Chak Haat 0 0 0 0 0 0 0 0 0 0 6 Guniyala 0 2 0 0 2 0 2 0 2 0 7 Gulabkoti 0 0 0 0 0 0 0 0 0 0 Total 99 3 5 32 139 70 10 55 139 31
# Cattle shed, Basements, Dilapidated structures (Khandar) * Exclusive of cattle sheds % Sericulture office, Water department office, community toilet, School (planned for saving) etc Source: RAP, VPHEP, THDC The total population affected including both resident and non-resident households is about 2128 of which 706 will be displaced
Table-3.12.7 Project affected Families and Population
PAFs PAPs
Sl. No.
Name of the
Village Residents
and covered
Non-Residents and others Estimated
Total Affected
Displaced
Residents and
covered
Non-Residents and others Estimated
Total Displaced
1 Haat 163 90 253 242 446 200 646 622 2 Jaisaal 125 03 128 18 334 03 337 66 3 Batula 134 00 134 5 379 00 379 18
4 Tenduli Chak Haat 07 2 09 0 21 05 26 0
5 Naurakh 84 05 89 0 204 05 209 0 6 Guniyala 35 00 35 0 96 00 96 0 7 Gulabkoti 73 02 4 0 239 10 249 0 8 Langsi 46 000 46 0 102 00 186 0
Total 667 102 769 265 1821 223
2128 706 Source: RAP, VPHEP, THDC Impact on Vulnerable People 444 vulnerable people affected by the project detail given below
Table-3.12.8 Details of village wise number of affected vulnerable persons
Vulnerable Persons Haat Batula Naurak Guniyala Jaisaal Gulabkoti
Tenduli Chak Haat Total
Disabled 2 4 0 3 6 0 0 15 Widows 17 17 9 4 22 7 1 77 Unmarried girls 26 17 5 4 23 11 1 87 >50 Years 36 59 13 8 56 16 1 189 BPL (HHs) 24 10 2 0 16 22 2 76 Total 105 107 29 19 123 56 5 444
Source: RAP, VPHEP, THDC

Project : Environmental Studies for Vishnugad Pipalkoti Hydro-Electric Project Page: 203 Document : 2008026/EC/Final Report Date: Nov 2009 Chapter-3 : Baseline Environment, Impacts & Mitigation Measures Revision: R4
Loss of Income from Vanpanchayat and Grazing Land
An assessment of loss of income for the affected villages from acquisition of Grazing land and Vanpanchyat Land used for grazing, collection of fodder and fuel wood and collection of timber. The usage and collection of fodder and fuel wood is done by all the villagers mostly daily. For timber purpose it used on a rotation basis depending upon the necessity and requirements with the prior permission from concerned authorities. Table presents the details of loss of income per household as per the 25% dependency on the affected area. As per the analysis on an average each household will lose about Rs 2841 per annum on loss of the acquired grazing land.
Table-3.12.9 Loss of income due to Grazing/Vanpanchayat land Loss of income as per loss of area S.
No Name of the Village
No of HHs in Village
Affected Area (Ha) Affected
Area (Naali)
Loss of Fodder from affected area (no of Bhoj)
Loss of income (135 per Bhoj as per area) (Rs)
25% dependency to total available area (Rs)
Loss per Household per annum(Rs)
1 Haat 85 4.331 216.55 19056 2572614 643154 7567 2 Batula 159 0.502 25.1 2209 298188 74547 469 3 Naurakh 212 2.098 104.9 9231 1246212 311553 1470 4 Tenduli Chak Haat 4 0.119 5.95 524 70686 17672 4418 5 Jaisaal 45 0.000 0 0 0 0 - 6 Guniyala 29 1.737 86.85 7643 1031778 257945 8895 7 Math Jadetha 103 1.253 62.65 5513 744282 186071 1807 8 Baula (Durgapur) 37 2.351 117.55 10344 1396494 349124 9436 9 Gadi 75 1.851 92.55 8144 1099494 274874 3665 10 Tapoan 25 2.475 123.75 10890 1470150 367538 14702 11 Dwing 28 1.900 95 8360 1128600 282150 10077 12 Gulabkoti 75 0.747 37.35 3287 443718 110930 1479 13 Paini 85 1.186 59.3 5218 704484 176121 2072 14 Helong 112 0.000 0 0 0 0 0 Total 1074 20.550 1027.5 90420 12206700 3051675 2841
Source: RAP, VPHEP, THDC
Accessibility and availability of remaining land As regards the availability and accessibility of the remaining area under the respective Vanpanchayats of the affected villages except for village Haat for the rest other village the accessibility and availability is easy. In case of Haat village the locals will have to climb the hill for collecting the fodder and may have to spend an additional 2 hours for the same. In case of Batula also their will be temporary inconvenience in accessibility of the grazing land.
Mitigation Measures: Site selection for construction of infrastructure and other facilities were done in such as manner which involved minimal land acquisition of private land. Mitigation measures suggested to minimize the adverse impacts of the project are given below:

Project : Environmental Studies for Vishnugad Pipalkoti Hydro-Electric Project Page: 204 Document : 2008026/EC/Final Report Date: Nov 2009 Chapter-3 : Baseline Environment, Impacts & Mitigation Measures Revision: R4
THDC has developed Resettlement and Rehabilitation Policy. The R&R Policy is
based on The National Rehabilitation and Resettlement Policy (NRRP), 2007 and experience gained over the years. The policy recognizes the need to support restoration of livelihoods of adversely affected people and lays down norms for rehabilitating the affected people and broadly outlines an approach and institutional framework to achieve its objectives. The benefits/compensation is given in the table below
For affected family whose house is being acquired -Self Resettlement Grant @ 5 times of the basic compensation payable for house excluding solatium and interest under LA Act with a minimum of Rs.50,000 and maximum of Rs100,000 or In Resettlement Colony developed by THDC, will be provided a plot of 250 sq.m in rural areas and 150 sq.m in urban areas a fixed Resettlement Grant of Rs 25,000 will be given and shifting grant of Rs. 20000.
For agricultural land acquisition - Land for Land of equivalent area or a maximum of one Ha of irrigated land or two Ha of un-irrigated / cultivable wasteland subject to availability of Government land in the district or Rehabilitation Grant as per category of PAF @ 500-1000 days of Minimum Agricultural Wage
Irrespective of type of land allotted all affected families will get Rs.10,000 per acre towards land development charges
One-time financial assistance of Rs.15,000 for cattle shed construction One –time financial assistance of Rs.25,000 for shops One-time financial assistance @ of 25 days of MAW for one year as subsistence
allowance Financial assistance of 500 days of MAW to ST affected family. Employment opportunity if any, 100% recruitment at the level of Workmen
(Including technical & ministerial) required to be done will be done first from the land oustees & in case of non availability of suitable candidate among the land oustees, the recruitment will be done from other residents of Uttarakhand state
Skill up-gradation through various training schemes and scholarship and / or reimbursement of tuition fees to a affected families and their dependents not more than one per family for promoting educational and technical training to enable such persons to take on suitable job
Restoration of common property resources - affected common properties such as cremation, grazing lands, roads, water supply lines etc will be augmented and remedial measures will be taken.
Replacement/access to equivalent amenities/services and creating new services As part of the periphery development augmenting of basic minimum facilities and
infrastructure facilities will be provided based on local requirement such as:
Internal approach roads with proper drainage. Safe drinking water Tree plantation including fruit trees. Community Halls/ Panchayat Ghar. Primary education facilities. Primary health facilities. Street lighting.

Project : Environmental Studies for Vishnugad Pipalkoti Hydro-Electric Project Page: 205 Document : 2008026/EC/Final Report Date: Nov 2009 Chapter-3 : Baseline Environment, Impacts & Mitigation Measures Revision: R4
Public cremation ground
The project infrastructure locations are planned in such a way that the existing approach roads are used and laying of new approach roads is kept bare minimum to avoid land acquisition and 100 days MAN will be paid to each House hold.
To mitigate impact from Vanpanchayat Land consultations held with the concerned Forest Officials for the project areas.
Forest Department in co-ordination with the local Vanpanchayats can undertake fodder and tree plantation in the vacant area available in respective Vanpanchayat of the affected village.
Vanpanchayat Committee also demanded that the total amount allocated for these purpose should be used only for the said purpose in the affected village and not used for any other purpose nor any deduction in the amounts allocated for this purpose.
As per the Draft R&R Policy of the project to mitigate the impacts a special provision by way of income restoration training is made for vulnerable families affected due to acquisition of Vanpanchayat Land.
A separate Social Impact Assessment Study is undertaken which provides detail information on Social Impact and Mitigation Measures. A R&R policy is framed by THDC for VPHEP to provide grants & other benefits in the project area. A Rehabilitation Action Plan (RAP) has been prepared by THDC.
Benefits from the Project
The construction phase will last for about 5 years. Those who would migrate to this area are likely to come from various parts of the country mainly having different cultural, ethnic and social backgrounds. Due to longer residence of this population in one place, a new culture, having a distinct socio-economic similarity would develop which will have its own entity. As per the Hydro Policy 2008 of GoI, the following gains would be available:
Twelve percent of the power generated at VPHEP will be provided free of cost to the home state of Uttarakhand.
Power produced will be distributed as per Power Purchase Agreement
The rest of the power will be available to the Northern Grid and shall be distributed
among beneficiaries as per the PPA already signed
An additional 1 percent free power from the project will be earmarked for a Local Area Development Fund. This amount will be provided on a sustained and continued basis over the life of the project.
100 units of electricity per month will be provided free to each Affected Family
Households, for a period of 10 years from the date of commissioning of the project.

Public Consultation Annex- 3.1.1
Public Consultation for VPHEP
Place: Haat Village
Near Power House Site
Date:12 June 2008
Participants:
Subodh Mamgain - Farmer Rajiv Kumar – Student
Suraj - Student
Issues Discussed:
Awareness about the VPHEP project
Flora of the area, Use of plants in the area
Wildlife found in the area
Dependency on Forest Stakeholder’s Response:
They were aware of the VPHEP and the location of Power House site
Forest was dominated by Pine trees and shrubs were dominant in open areas
Common trees used are Kwiryal, Tun, Siris, Pipal, Khajoor and Bel. Friut trees
like Peach, guava, banana and pomegranate are grown. Tulsi used in fever, cough
and cold. Bel used in used in ailment as diarrhea, dysentery, dryness of eyes and
common cold
Occurrence of wild life Leaopard, Boar , Bear, Porcupine Monkey, Mangoos in
Forest area
Incident of lifting of Cattle by Leapord occurs in the area. 6 Years back a girl was
also killed by leopard near Haat Village. This year 2 dogs were taken by Leopard
1 of 11

Public Consultation Annex- 3.1.1
Public Consultation for VPHEP
Place: Haat Village
Date:12 June 2008
Participants:
Rajender Hatwal – Student Chakardhar Hatwal- Farmer Biharilal Chauhan- Farmer Makeshwari Devi - Farmer
Issues Discussed:
Awareness about the VPHEP project Flora of the area, Dependency on Forest, Crop cultivated Wildlife found in the area, Fishing activity
Source of Water, Water Quality
Stakeholder’s Response:
They were aware of the VPHEP and the location of Power House site. Local
people should be given Jobs and contracts by THDC.
Forest was dominated by Pine trees and shrubs were dominant in open areas.
Dependent on Forest for Grass, Awla Juice (fruit) Kuiral Pickle, Pine for cattle
bedding, for making agricultural tools & doors and windows and manure for
fields. about 60-70ha Vanpanchayat land of Haat village planted by villagers
Paddy, Wheat, Madwa, Dal and Soyabean are cultivated. Bedu Fruit used in
digestive disorder
Occurrence of wild life Leaopard, Boar, Bear, Deer and Monkey in Forest area.
Magpai and Maina are common bird. No illegal poaching in the area. Fishing is
done in Birahi river.
Natural source of water near village is drying, suspected may be due to blasting.
Water Quality is good
2 of 11

Public Consultation Annex- 3.1.1
Public Consultation for VPHEP
Place: Siyasain
Date: 12June 2008
Participants:
Maya Ram Purohit Ansuya Prasad
Issues Discussed:
Awareness about the VPHEP project
Flora of the area, Dependency on Forest
Wildlife found in the area
Source of Water and Water Quality
Stakeholder’s Response:
Aware of the VPHEP project. Opinion was that displaced people should not be
settled in Siyasain and proper compensation provided for land.
Shrubs such as Bichu gas , Basinga are common in the area. Aam, Denk, Tut are
commonly used. Plantation Awla, Shisam, Tun , Ritha , Pine etc done by van
Panchayat
Wildife such as Bear , Boar , Kakad , Leopard are present in the forest area
Natural stream is source of drinking water not dependent on Alaknanda river for water supply. Water Quality is good
3 of 11

Public Consultation Annex- 3.1.1
Public Consultation for VPHEP
Place: Palda Village
Date:13 June 2008
Participants:
Issues Discussed:
Awareness about the VPHEP project
Flora of the area, Dependency on Forest
Wildlife found in the area, Fishing activity
Source of Water and Water Quality
Stakeholder’s Response:
They were not aware of the VPHEP. Their land was affected due to road construction by PWD and feared more loss of land due to the project
Forest was dominated by Pine and Ban, Moru in upper reaches. Dependent on Forest for Grass. Most houses use LPG cylinder for cooking. Orange, banana, apricot and peach are grown. Dependent on forest for making agricultural tools and doors and windows. Tulsi used in cough and cold
Occurrence of Bear and Leaopard in Forest area. Not aware of Fishing in the area. Natural source of water near village. Not dependent on Alaknanda for irrigation
and drinking. Water Quality is good.
4 of 11

Public Consultation Annex- 3.1.1
Public Consultation for VPHEP
Place: Math Village
Date:15 June 2008
Participants:
Hayat Singh – Farmer Prema Devi – Farmer Suchita Devi – Farmer Rudra Devi – Farmer Janki Devi – Farmer
Issues Discussed:
Awareness about the VPHEP project
Flora of the area, Dependency on Forest, Crop
Wildlife found in the area, Fishing activity
Source of Water
Stakeholder’s Response:
They were aware of the VPHEP and were fearing loss of land and adverse affect of project on the village and were not in favour of project
Forest was dominated by Pine trees and shrubs Banj forest in Upper reaches. Depended on forest for Grass, Fuel, Fodder, Forest area increased due to plantation by Van Panchayat. Dependent on forest for making agricultural tools, cots and doors & windows and manure for fields. Silphara used in Kidney stones, anti diarrhea. Dhenk leaves, fruits and seeds used in skin disease.
Wheat, Onion, haldi, Potato, Orange etc are cultivated Occurrence of wild life Leaopard, Boar, Bear, Deer, Porcupine and Monkey in
Forest area. Bulbul, Drongo and Maina are common bird. Leopard kills cow in the area.
One stream flowing in the village. Not dependent on Alaknanda for irrigation and drinking.
5 of 11
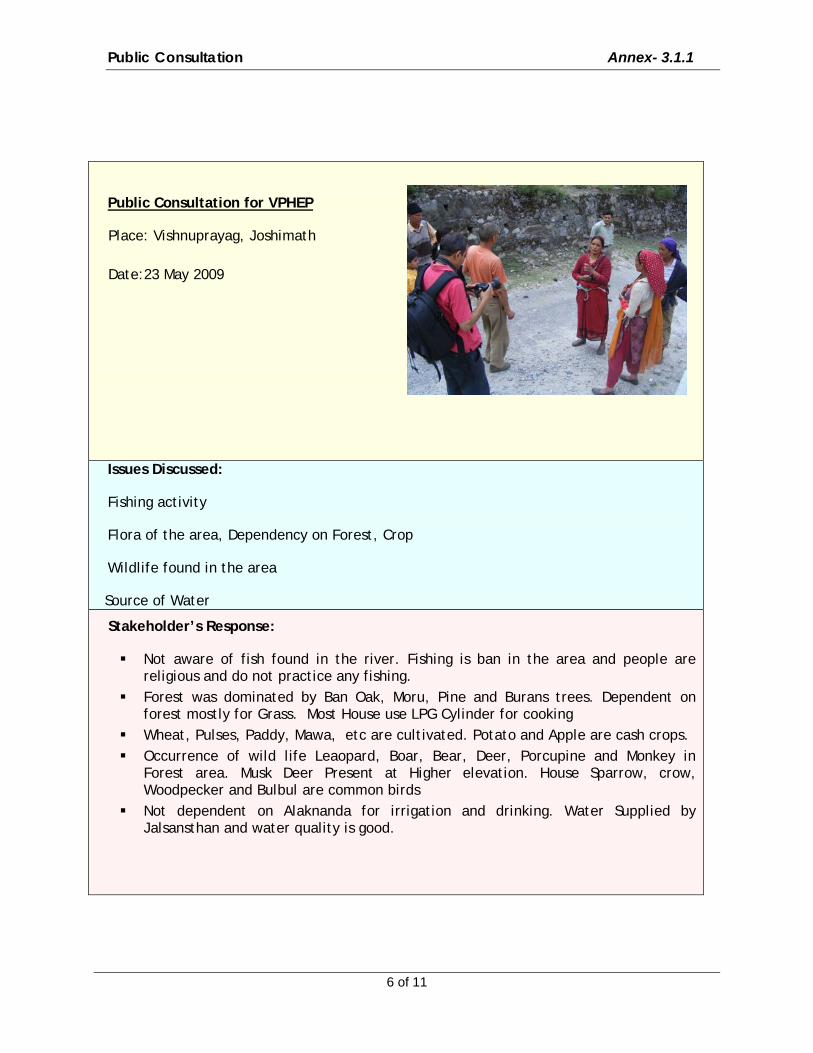
Public Consultation Annex- 3.1.1
Public Consultation for VPHEP
Place: Vishnuprayag, Joshimath
Date:23 May 2009
Issues Discussed:
Fishing activity
Flora of the area, Dependency on Forest, Crop
Wildlife found in the area
Source of Water
Stakeholder’s Response:
Not aware of fish found in the river. Fishing is ban in the area and people are religious and do not practice any fishing.
Forest was dominated by Ban Oak, Moru, Pine and Burans trees. Dependent on forest mostly for Grass. Most House use LPG Cylinder for cooking
Wheat, Pulses, Paddy, Mawa, etc are cultivated. Potato and Apple are cash crops. Occurrence of wild life Leaopard, Boar, Bear, Deer, Porcupine and Monkey in
Forest area. Musk Deer Present at Higher elevation. House Sparrow, crow, Woodpecker and Bulbul are common birds
Not dependent on Alaknanda for irrigation and drinking. Water Supplied by Jalsansthan and water quality is good.
6 of 11

Public Consultation Annex- 3.1.1
Public Consultation for VPHEP
Place: Birahi Village
Date: 08 Nov 2008
Issues Discussed:
• Drinking water source • Availability of flora and fauna • Dependency on forest • Fishing activities • Water quality • Usages of Alaknanda River
Stakeholder’s Response:
• Water quality is good and there is no problem in availability of drinking water • Water comes from stream • No usages of Alaknanda River • Local people catches fishes from Birahi river • Good forest cover in this area • People use wooden peace for fueling, making agricultural tools, furniture and doors
and windows and manure for fields. Dhenk leaves and seeds used in skin disease. • Dependent on forest for grass, fodder and fuel
7 of 11

Public Consultation Annex- 3.1.1
Public Consultation for VPHEP
Place: Gulabkoti Village
Date: 10 Nov 2008
Issues Discussed:
• Drinking water source • Availability of flora and fauna • Dependency on forest • Fishing activities • Water quality • Water Usages of Alaknanda River
Stakeholder’s Response:
• Water quality is good and there is no problem in availability of drinking water • No usages of Alaknanda River for Drinking and irrigation purpose. • No fishing practiced in this area • Good forest cover in this area, Dominated by Pine Forest. • People use wooden peace for fueling, making agricultural tools, furniture and doors
and windows
8 of 11

Public Consultation Annex- 3.1.1
Public Consultation for VPHEP
Place: Guniyala Village
Date: 13 Nov 2008
Issues Discussed:
• Drinking water source • Availability of flora and fauna • Dependency on forest and plants • Fishing activities • Water quality • Water Usages of Alaknanda River
Stakeholder’s Response:
• Water quality is good and there is no problem in availability of drinking water • No usages of Alaknanda River for Drinking and Irrigation • Few Local people catches fishes from Maina river occasionally. • Good forest cover in this area, Tejpath (spices) trees found in the forest • People use wooden peace for fueling, making doors and window frames &
agricultural tools and cattle sheds and manure for field. Banhaldi Useful in liver complaints, diarrhea, food poisoning, fever, snake bite and indigestion. Brahmi Useful in peptic ulcers, indigestion, fevers, toothache, applied to boils and pimples
• Wild animals found in this area like tiger, bear, deer, monkey etc. • Orange, lemon are very common trees this area
9 of 11

Public Consultation Annex- 3.1.1
Public Consultation for VPHEP
Place: Naurakh Village
Date: 20 Nov 2008
Issues Discussed:
• Drinking water source • Availability of flora and fauna • Dependency on forest • Fishing activities • Water quality • Water Usages of Alaknanda River
Stakeholder’s Response:
• Water quality is good and there is no problem in availability of drinking water • No usages of Alaknanda River • No fishing in this area • Good forest cover in this area • People use wooden peace for fueling • Dependent on forest for grass, fodder and fuel. Reetha used in treatment of asthma,
washing hair. • Banana, Mango, Guava are common trees in this area
10 of 11

Public Consultation Annex- 3.1.1
Public Consultation for VPHEP
Place: Pakhi Village
Date: 25 Nov 2008
Issues Discussed:
• Drinking water source • Availability of flora and fauna • Dependency on forest • Fishing activities • Water quality • Water Usages of Alaknanda River
Stakeholder’s Response:
• Water quality is good and there is no problem in availability of drinking water • No usages of Alaknanda River for drinking and irrigation. • No fishing activities at this area • Good forest covers in the higher elevation. Important trees are Banj, Moru, Tun, Pine
and Denk. Awla and other fruit juice prepared. Vashaka is Antibronchitis & cough • People use wooden peace for fueling, making doors and window frames. Some house
have LPG cylinder for cooking. Basket making is also practiced by some lower caste people.
• Walnut, orange, lemon, banana, peach are grown in this area. Wheat and pulses are important crop.
11 of 11

Project : Environmental Studies for Vishnugad Pipalkoti Hydro-Electric Project Page:1 of 23 Document : 2008026/EC/Final Report Date: Nov 2009 Annex-3.4.1 : Meteorological Data Revision: R4
Annex-3.4.1
Meteorological Data of the Study Area
(Based on On-site Monitoring)
Date DD/MM/YYYY
Time HH:MM
Air Temperature (°C)
RH %
Wind Speed (mtrs/sec)
Wind Direction (°)
Rainfall (mm)
16/11/ 2008 16:02 18.21 43.39 4.05 23 0
16/11/ 2008 17:02 16.23 50.01 7.05 343 0
16/11/ 2008 17:46 15.09 45.6 1.65 290 0
16/11/ 2008 18:46 14.21 48.05 3.3 225 0
16/11/ 2008 19:46 12.21 43.71 3.15 239 0
16/11/ 2008 20:46 13.02 74.35 3 273 0
16/11/ 2008 21:46 12.65 50.23 4.95 276 0
16/11/ 2008 22:46 11.09 38.63 4.05 126 0
16/11/ 2008 23:46 15.28 38.03 3.15 217 0
17/11/ 2008 0:46 17.53 36.25 3.3 232 0
17/11/ 2008 1:46 18 35.84 3.15 226 0
17/11/ 2008 2:46 19.2 35.05 2.7 226 0
17/11/ 2008 3:46 12.53 40.15 3 233 0
17/11/ 2008 4:46 13.56 41.75 3.45 250 0
17/11/ 2008 5:46 14.84 49.66 2.85 230 0
17/11/ 2008 6:46 13.04 55.38 2.85 240 0
17/11/ 2008 7:46 11.39 56.8 1.95 226 0
17/11/ 2008 8:46 11.12 58.62 1.8 226 0
17/11/ 2008 9:46 13.34 56.12 1.65 46 0
17/11/ 2008 10:46 14.82 54.39 2.85 69 0
17/11/ 2008 11:46 16.44 45.68 3.45 81 0
17/11/ 2008 12:46 18.12 49.89 5.1 55 0
17/11/ 2008 13:46 18.73 38.65 5.1 74 0
17/11/ 2008 14:46 19.46 28.72 7.2 324 0
17/11/ 2008 15:46 21.35 27.51 6.75 345 0
17/11/ 2008 16:46 19.12 29.59 5.7 0 0
17/11/ 2008 17:46 17.23 32.46 3.45 237 0
17/11/ 2008 18:46 15.5 34.04 3.15 231 0
17/11/ 2008 19:46 14.98 46.15 3.6 237 0
17/11/ 2008 20:46 13.7 45.12 3.45 264 0
17/11/ 2008 21:46 13.02 45.69 2.4 202 0
17/11/ 2008 22:46 12.22 51.75 3 228 0
17/11/ 2008 23:46 11.96 52.65 3 230 0
18/11/ 2008 0:46 8.36 53.55 0 213 0
18/11/ 2008 1:46 9.12 52.26 0 28 0
18/11/ 2008 2:46 8.91 50.54 0 232 0
18/11/ 2008 3:46 6.91 48.43 0 236 0
18/11/ 2008 4:46 6.72 52.65 0 156 0
18/11/ 2008 5:46 5.95 49.64 0 227 0
18/11/ 2008 6:46 5.23 52.61 0 239 0
18/11/ 2008 7:46 5.34 56.92 0 244 0
18/11/ 2008 8:46 5.68 58.17 0 216 0
18/11/ 2008 9:46 6.13 46.82 0 216 0
18/11/ 2008 10:46 9.56 41.1 0 54 0
18/11/ 2008 11:46 12.13 37.26 0 0 0

Project : Environmental Studies for Vishnugad Pipalkoti Hydro-Electric Project Page:2 of 23 Document : 2008026/EC/Final Report Date: Nov 2009 Annex-3.4.1 : Meteorological Data Revision: R4
Date DD/MM/YYYY
Time HH:MM
Air Temperature (°C)
RH %
Wind Speed (mtrs/sec)
Wind Direction (°)
Rainfall (mm)
18/11/ 2008 12:46 13.59 32.98 0 61 0
18/11/ 2008 13:46 15.64 32.14 0 86 0
18/11/ 2008 14:46 19.25 32.64 0 121 0
18/11/ 2008 15:46 19.16 33.57 4.65 145 0
18/11/ 2008 16:46 16.92 37.77 6.15 281 0
18/11/ 2008 17:46 15.33 44.15 5.55 318 0
18/11/ 2008 18:46 13.24 46.13 6.75 284 0
18/11/ 2008 19:46 10.95 48.11 0 216 0
18/11/ 2008 20:46 10.24 46.15 0.15 237 0
18/11/ 2008 21:46 10.6 44.64 0.15 236 0
18/11/ 2008 22:46 9.5 37.84 0 226 0
18/11/ 2008 23:46 8.14 39.71 0.45 212 0
19/11/ 2008 0:46 9.23 42.12 6 271 0
19/11/ 2008 1:46 8.4 61.32 3.45 229 0
19/11/ 2008 2:46 7.69 56.32 2.55 235 0
19/11/ 2008 3:46 7.9 62.68 3 225 0
19/11/ 2008 4:46 8.96 65.21 2.55 234 0
19/11/ 2008 5:46 6.89 54.21 2.85 223 0
19/11/ 2008 6:46 6.32 59.21 2.4 229 0
19/11/ 2008 7:46 6.35 70.12 2.25 215 0
19/11/ 2008 8:46 6.05 62.12 2.4 286 0
19/11/ 2008 9:46 7.96 60.09 2.1 54 0
19/11/ 2008 10:46 11.99 54.34 2.7 38 0
19/11/ 2008 11:46 13.12 48.01 3.3 62 0
19/11/ 2008 12:46 14.32 40.23 5.1 59 0
19/11/ 2008 13:46 16.4 41.5 6.3 0 0
19/11/ 2008 14:46 18.91 37.15 6.15 17 0
19/11/ 2008 15:46 17.65 34.9 6.9 42 0
19/11/ 2008 16:46 16.8 37.88 6.3 287 0
19/11/ 2008 17:46 15.22 40.12 6 245 0
19/11/ 2008 18:46 13.54 42.13 3.3 128 0
19/11/ 2008 19:46 11.68 48.56 2.4 262 0
19/11/ 2008 20:46 12.54 51.49 2.7 236 0
19/11/ 2008 21:46 10.89 52.13 3.15 233 0
19/11/ 2008 22:46 10.64 55.12 3 223 0
19/11/ 2008 23:46 9.62 59.09 2.85 215 0
20/11/ 2008 0:46 11.65 57.17 3 241 0
20/11/ 2008 1:46 10.9 55.28 2.1 227 0
20/11/ 2008 2:46 14.56 58.5 1.5 227 0
20/11/ 2008 3:46 13.26 63.92 0 227 0
20/11/ 2008 4:46 11.56 63.91 1.8 255 0
20/11/ 2008 5:46 9.5 64.38 2.25 9 0
20/11/ 2008 6:46 8.15 66.24 5.85 258 0
20/11/ 2008 7:46 8.4 66.53 5.1 281 0.2
20/11/ 2008 8:46 8.36 67.82 2.4 23 1.6
20/11/ 2008 9:46 9.98 65.73 1.5 300 1.4
20/11/ 2008 10:46 13.54 54.39 0 14 0.8
20/11/ 2008 11:46 15.5 44.53 3.6 354 1.2
20/11/ 2008 12:46 18.16 42.77 4.35 68 1.8

Project : Environmental Studies for Vishnugad Pipalkoti Hydro-Electric Project Page:3 of 23 Document : 2008026/EC/Final Report Date: Nov 2009 Annex-3.4.1 : Meteorological Data Revision: R4
Date DD/MM/YYYY
Time HH:MM
Air Temperature (°C)
RH %
Wind Speed (mtrs/sec)
Wind Direction (°)
Rainfall (mm)
20/11/ 2008 13:46 20.12 39.55 2.55 330 0.2
20/11/ 2008 14:46 20.26 28.72 3.45 116 0
20/11/ 2008 15:46 21.63 27.51 2.55 61 0
20/11/ 2008 16:46 20.23 29.59 2.25 61 0
20/11/ 2008 17:46 18.54 32.72 0 61 0
20/11/ 2008 18:46 16.14 37.4 0 61 0
20/11/ 2008 19:46 14.12 45.62 0 61 0
20/11/ 2008 20:46 14.98 47.74 2.7 130 0
20/11/ 2008 21:46 14.32 49.73 0.3 128 0
20/11/ 2008 22:46 15.16 51.75 0.15 48 0
20/11/ 2008 23:46 13.75 53.76 4.05 241 4.2
21/11/ 2008 0:46 13.65 56.07 6.15 0 0.2
21/11/ 2008 1:46 12.25 56.7 8.7 289 0
21/11/ 2008 2:46 11.16 58.5 7.05 120 0
21/11/ 2008 3:46 10.36 63.92 8.1 235 0
21/11/ 2008 4:46 9.65 63.91 6.9 290 0
21/11/ 2008 5:46 9.15 64.38 7.35 285 0
21/11/ 2008 6:46 8.77 66.24 11.1 355 0
21/11/ 2008 7:46 10.12 66.53 7.5 287 0
21/11/ 2008 8:46 11.23 67.82 7.05 150 0
21/11/ 2008 9:46 13.45 65.73 3.6 54 0
21/11/ 2008 10:46 13.98 54.39 0.9 54 0
21/11/ 2008 11:46 15.12 44.53 3.3 78 0
21/11/ 2008 12:46 17.56 42.77 3.9 60 0
21/11/ 2008 13:46 19.23 39.55 4.65 17 0
21/11/ 2008 14:46 19.98 28.72 4.5 28 0
21/11/ 2008 15:46 20.13 28.06 2.85 18 0
21/11/ 2008 16:46 18.45 30.01 3.3 72 0
21/11/ 2008 17:46 16.63 32.72 0.6 237 0
21/11/ 2008 18:46 15.46 37.4 0 228 0
21/11/ 2008 19:46 14.5 45.62 3.45 234 0
21/11/ 2008 20:46 13.21 47.74 4.05 315 0
21/11/ 2008 21:46 11.68 49.73 6 146 0
21/11/ 2008 22:46 13.58 51.75 3.15 25 0
21/11/ 2008 23:46 13.22 53.76 9 252 0
22/11/ 2008 0:46 10.23 56.07 8.85 279 0
22/11/ 2008 1:46 9.56 56.7 7.2 300 0
22/11/ 2008 2:46 7.92 54.2 0.45 225 0
22/11/ 2008 3:46 7.05 54.02 2.55 236 0
22/11/ 2008 4:46 6.84 55.75 1.95 231 0
22/11/ 2008 5:46 5.13 60.87 0.15 232 0
22/11/ 2008 6:46 5.81 59.7 2.4 223 0
22/11/ 2008 7:46 6.78 57.89 0.15 236 0
22/11/ 2008 8:46 6.89 57.16 0 240 0
22/11/ 2008 9:46 9.06 54.33 0.3 85 0
22/11/ 2008 10:46 11.09 46.62 3.3 53 0
22/11/ 2008 11:46 13.56 39.22 2.85 84 0
22/11/ 2008 12:46 15.82 38.79 3.6 68 0
22/11/ 2008 13:46 17.26 32.32 4.65 54 0

Project : Environmental Studies for Vishnugad Pipalkoti Hydro-Electric Project Page:4 of 23 Document : 2008026/EC/Final Report Date: Nov 2009 Annex-3.4.1 : Meteorological Data Revision: R4
Date DD/MM/YYYY
Time HH:MM
Air Temperature (°C)
RH %
Wind Speed (mtrs/sec)
Wind Direction (°)
Rainfall (mm)
22/11/ 2008 14:46 18.12 33.02 4.8 61 0
22/11/ 2008 15:46 19.56 32.35 4.35 72 0
22/11/ 2008 16:46 18.21 37.08 3.3 78 0
22/11/ 2008 17:46 14.56 44.84 2.85 230 0
22/11/ 2008 18:46 13.96 43.08 2.85 205 0
22/11/ 2008 19:46 12.75 43.71 3.3 234 0
22/11/ 2008 20:46 12.64 46.33 3.3 227 0
22/11/ 2008 21:46 13.69 37.09 6.6 330 0
22/11/ 2008 22:46 11.54 44.57 7.95 281 0
22/11/ 2008 23:46 12.65 43.23 7.5 242 0
23/11/ 2008 0:46 11.32 39.61 5.4 55 0
23/11/ 2008 1:46 9.84 45.02 3.15 233 0
23/11/ 2008 2:46 9.23 45.12 0.3 246 0
23/11/ 2008 3:46 8.25 45.78 0.9 240 0
23/11/ 2008 4:46 9.34 46.77 2.85 230 0
23/11/ 2008 5:46 7.58 52.65 0.6 231 0
23/11/ 2008 6:46 8.25 49.64 0.6 226 0
23/11/ 2008 7:46 7.75 53.01 0.6 241 0
23/11/ 2008 8:46 7.14 56.92 0.3 254 0
23/11/ 2008 9:46 10.53 58.17 1.05 56 0
23/11/ 2008 10:46 13.65 46.82 2.7 33 0
23/11/ 2008 11:46 15.58 42.35 2.85 73 0
23/11/ 2008 12:46 17.24 37.26 4.95 4 0
23/11/ 2008 13:46 18.12 34.98 5.85 45 0
23/11/ 2008 14:46 19.65 32.14 6.45 9 0
23/11/ 2008 15:46 20.13 33.77 6 23 0
23/11/ 2008 16:46 19.17 33.57 5.4 98 0
23/11/ 2008 17:46 16.38 37.67 0 233 0
23/11/ 2008 18:46 15.82 44.15 6 277 0
23/11/ 2008 19:46 14.61 46.13 3.15 226 0
23/11/ 2008 20:46 15.36 48.11 3 168 0
23/11/ 2008 21:46 15.2 46.15 0.75 223 0
23/11/ 2008 22:46 14.61 44.64 2.55 220 0
23/11/ 2008 23:46 13.65 37.84 0.45 230 0
24/11/ 2008 0:46 17.32 39.71 0.15 266 0
24/11/ 2008 1:46 18.21 42.12 2.25 224 0
24/11/ 2008 2:46 16.6 61.32 0 228 0
24/11/ 2008 3:46 14.25 56.32 2.7 239 0
24/11/ 2008 4:46 13.54 62.68 0.15 220 0
24/11/ 2008 5:46 14.84 65.45 1.8 222 0
24/11/ 2008 6:46 13.54 64.23 2.25 233 0
24/11/ 2008 7:46 11.39 64.96 0.45 213 0
24/11/ 2008 8:46 11.15 62.19 0 242 0
24/11/ 2008 9:46 14.31 59.75 0 281 0
24/11/ 2008 10:46 13.25 53.68 0.15 77 0
24/11/ 2008 11:46 16.44 49.84 0.6 356 0
24/11/ 2008 12:46 18.23 50.88 3.75 45 0
24/11/ 2008 13:46 19.65 47.58 6 47 0
24/11/ 2008 14:46 19.84 46.04 5.7 51 0

Project : Environmental Studies for Vishnugad Pipalkoti Hydro-Electric Project Page:5 of 23 Document : 2008026/EC/Final Report Date: Nov 2009 Annex-3.4.1 : Meteorological Data Revision: R4
Date DD/MM/YYYY
Time HH:MM
Air Temperature (°C)
RH %
Wind Speed (mtrs/sec)
Wind Direction (°)
Rainfall (mm)
24/11/ 2008 15:46 21.65 45.71 6.45 63 0
24/11/ 2008 16:46 19.25 47.71 5.1 300 0
24/11/ 2008 17:46 17.34 52.57 0 211 0
24/11/ 2008 18:46 15.25 59.03 0 220 0
24/11/ 2008 19:46 14.98 56.63 0 233 0
24/11/ 2008 20:46 13.65 58.79 0 261 0
24/11/ 2008 21:46 13.05 58.69 0 313 0
24/11/ 2008 22:46 12.32 54.5 0 237 0
24/11/ 2008 23:46 11.54 53.28 0 243 0
25/11/ 2008 0:46 15.32 52.57 0 233 0
25/11/ 2008 1:46 14.25 62.66 0 231 0
25/11/ 2008 2:46 13.56 63.19 0 234 0
25/11/ 2008 3:46 13.05 62.8 0 238 0
25/11/ 2008 4:46 13.69 65.45 0 234 0
25/11/ 2008 5:46 14.12 65.52 0 246 0
25/11/ 2008 6:46 13 59.21 0 234 0
25/11/ 2008 7:46 13.46 59.02 0 226 0
25/11/ 2008 8:46 12.97 62.12 0 223 0
25/11/ 2008 9:46 14.26 60.09 1.5 109 0
25/11/ 2008 10:46 11.36 54.34 0 32 0
25/11/ 2008 11:46 12.32 48.01 0 30 0
25/11/ 2008 12:46 13.97 40.23 4.8 79 0
25/11/ 2008 13:46 14.29 41.5 4.35 0 0
25/11/ 2008 14:46 15.67 38.45 4.8 40 0
25/11/ 2008 15:46 14.56 35.55 3.9 12 0
25/11/ 2008 16:46 13.68 37.89 3.6 306 0
25/11/ 2008 17:46 15.22 41.22 2.1 241 0
25/11/ 2008 18:46 15.68 42.13 2.1 13 0
25/11/ 2008 19:46 16.54 48.56 0 263 0
25/11/ 2008 20:46 16.5 51.15 0 233 0
25/11/ 2008 21:46 15.98 52.13 0 225 0
25/11/ 2008 22:46 16.54 55.12 0 254 0
25/11/ 2008 23:46 14.38 59.09 0 225 0
26/11/ 2008 0:46 13.32 57.17 0 235 0
26/11/ 2008 1:46 12.6 55.28 0 228 0
26/11/ 2008 2:46 12.31 58.5 0 231 0
26/11/ 2008 3:46 11.9 63.92 0 235 0
26/11/ 2008 4:46 11.62 63.91 1.5 233 0
26/11/ 2008 5:46 13.65 64.38 0 235 0
26/11/ 2008 6:46 13.21 66.24 0 241 0
26/11/ 2008 7:46 14.05 64.96 0 230 0
26/11/ 2008 8:46 12.65 73.23 0 235 0
26/11/ 2008 9:46 15.32 59.75 0 31 0
26/11/ 2008 10:46 16.54 53.68 0.75 3 0
26/11/ 2008 11:46 18.39 49.84 1.8 61 0
26/11/ 2008 12:46 19.12 50.88 5.25 20 0
26/11/ 2008 13:46 20.59 47.23 4.05 21 0
26/11/ 2008 14:46 21.45 46.04 5.7 49 0
26/11/ 2008 15:46 21.19 45.71 6 358 0

Project : Environmental Studies for Vishnugad Pipalkoti Hydro-Electric Project Page:6 of 23 Document : 2008026/EC/Final Report Date: Nov 2009 Annex-3.4.1 : Meteorological Data Revision: R4
Date DD/MM/YYYY
Time HH:MM
Air Temperature (°C)
RH %
Wind Speed (mtrs/sec)
Wind Direction (°)
Rainfall (mm)
26/11/ 2008 16:46 20.64 47.71 2.85 332 0
26/11/ 2008 17:46 18.92 52.57 0 249 0
26/11/ 2008 18:46 17.14 59.03 0 236 0
26/11/ 2008 19:46 16.54 56.63 0.3 247 0
26/11/ 2008 20:46 14.2 58.79 4.65 63 0
26/11/ 2008 21:46 13.65 58.69 4.5 306 0
26/11/ 2008 22:46 14.23 54.5 0.75 237 0
26/11/ 2008 23:46 14.58 53.28 1.5 237 0
27/11/ 2008 0:46 13.21 52.57 0 227 0
27/11/ 2008 1:46 13.9 62.66 0 229 0
27/11/ 2008 2:46 12.35 63.19 0 240 0
27/11/ 2008 3:46 12.23 62.8 0 234 0
27/11/ 2008 4:46 11.25 65.45 0 234 0
27/11/ 2008 5:46 11.98 65.52 0 225 0
27/11/ 2008 6:46 12.14 68.08 0 234 0
27/11/ 2008 7:46 12.76 53.88 0 235 0
27/11/ 2008 8:46 13.65 48.22 0 223 0
27/11/ 2008 9:46 18.56 39.48 0 233 0
27/11/ 2008 10:46 18.21 36.41 0 72 0
27/11/ 2008 11:46 20.21 38.84 0 61 0
27/11/ 2008 12:46 20.69 34.22 0.15 48 0
27/11/ 2008 13:46 21.34 36.53 0.9 80 0
27/11/ 2008 14:46 20.36 34.95 4.95 17 0
27/11/ 2008 15:46 21.03 30.45 5.7 3 0
27/11/ 2008 16:46 20.12 32.98 1.8 315 0
27/11/ 2008 17:46 19.28 45.65 0 234 0
27/11/ 2008 18:46 19.83 48.72 0.15 245 0
27/11/ 2008 19:46 19.32 43.71 0 267 0
27/11/ 2008 20:46 18.26 47.15 0 290 0
27/11/ 2008 21:46 17.04 50.41 0.15 234 0
27/11/ 2008 22:46 18.21 38.63 0.6 153 0
27/11/ 2008 23:46 17.5 37.67 6.45 140 0
28/11/ 2008 0:46 13.33 36.25 0 249 0
28/11/ 2008 1:46 12.84 35.84 0 244 0
28/11/ 2008 2:46 12.89 35.22 0 222 0
28/11/ 2008 3:46 10.9 40.15 0 227 0
28/11/ 2008 4:46 9.89 41.75 0 243 0
28/11/ 2008 5:46 8.07 49.66 2.25 144 0
28/11/ 2008 6:46 7.08 55.35 0 225 0
28/11/ 2008 7:46 6.95 56.23 0 224 0
28/11/ 2008 8:46 6.5 58.62 0 231 0
28/11/ 2008 9:46 7.53 56.12 0 105 0
28/11/ 2008 10:46 11.82 43.06 0 304 0
28/11/ 2008 11:46 13.86 39.39 2.7 30 0
28/11/ 2008 12:46 15.6 35.5 4.05 47 0
28/11/ 2008 13:46 17.15 35.18 4.05 74 0
28/11/ 2008 14:46 18.09 34.89 5.4 84 0
28/11/ 2008 15:46 18.88 33.15 3.9 333 0
28/11/ 2008 16:46 18.12 35.2 3.9 55 0

Project : Environmental Studies for Vishnugad Pipalkoti Hydro-Electric Project Page:7 of 23 Document : 2008026/EC/Final Report Date: Nov 2009 Annex-3.4.1 : Meteorological Data Revision: R4
Date DD/MM/YYYY
Time HH:MM
Air Temperature (°C)
RH %
Wind Speed (mtrs/sec)
Wind Direction (°)
Rainfall (mm)
28/11/ 2008 17:46 14.78 47.74 0.15 234 0
28/11/ 2008 18:46 13.47 48.36 0 184 0
28/11/ 2008 19:46 12.53 49.82 0 215 0
28/11/ 2008 20:46 12.86 47.12 0 242 0
28/11/ 2008 21:46 10.78 53.36 0 234 0
28/11/ 2008 22:46 10.4 54.36 0 257 0
28/11/ 2008 23:46 9.23 56.89 0 228 0
29/11/ 2008 0:46 8.14 60.03 0 242 0
29/11/ 2008 1:46 8.56 61.58 0 231 0
29/11/ 2008 2:46 7.89 60.66 0 234 0
29/11/ 2008 3:46 9.08 62.95 0 211 0
29/11/ 2008 4:46 7.76 61.03 0 242 0
29/11/ 2008 5:46 6.89 64.51 0 253 0
29/11/ 2008 6:46 6.31 65.54 0 225 0
29/11/ 2008 7:46 7.12 65.64 4.35 236 0
29/11/ 2008 8:46 7.98 64.26 2.1 239 0
29/11/ 2008 9:46 7.03 60.99 0.6 358 0
29/11/ 2008 10:46 10.26 58.99 0.9 0 0
29/11/ 2008 11:46 12.26 56.12 1.35 28 0
29/11/ 2008 12:46 14.32 52.34 2.7 6 0
29/11/ 2008 13:46 16.24 48.19 5.85 285 0
29/11/ 2008 14:46 17.24 45.25 5.55 17 0
29/11/ 2008 15:46 17.98 40.34 5.55 285 0
29/11/ 2008 16:46 16.8 40.25 1.5 89 0
29/11/ 2008 17:46 15.22 38.29 0.3 224 0
29/11/ 2008 18:46 12.92 34.04 0.75 225 0
29/11/ 2008 19:46 11.7 46.15 1.2 226 0
29/11/ 2008 20:46 10.23 45.12 0.3 224 0
29/11/ 2008 21:46 10.05 45.69 0 229 0
29/11/ 2008 22:46 9.62 51.75 0 232 0
29/11/ 2008 23:46 9.21 52.65 0 198 0
30/11/ 2008 0:46 8.21 53.55 0 235 0
30/11/ 2008 1:46 9.56 52.26 0 231 0
30/11/ 2008 2:46 7.8 50.54 0 233 0
30/11/ 2008 3:46 6.23 48.43 0 236 0
30/11/ 2008 4:46 7.89 52.65 0 238 0
30/11/ 2008 5:46 6.59 49.64 0 235 0
30/11/ 2008 6:46 6.98 52.61 0 240 0
30/11/ 2008 7:46 5.36 56.92 0 233 0
30/11/ 2008 8:46 5.48 58.17 0 233 0
30/11/ 2008 9:05 7.41 46.82 0 236 0
30/11/ 2008 10:05 11.23 42.55 0 305 0
30/11/ 2008 11:05 12.65 37.26 2.85 55 0
30/11/ 2008 12:05 14.25 32.98 4.65 12 0
30/11/ 2008 13:05 16.2 32.14 7.05 0 0
30/11/ 2008 14:05 17.05 32.64 6.15 15 0
30/11/ 2008 15:05 17.98 33.57 7.5 4 0
30/11/ 2008 16:05 15.64 37.77 5.85 0 0
30/11/ 2008 17:05 15.93 44.15 2.1 266 0

Project : Environmental Studies for Vishnugad Pipalkoti Hydro-Electric Project Page:8 of 23 Document : 2008026/EC/Final Report Date: Nov 2009 Annex-3.4.1 : Meteorological Data Revision: R4
Date DD/MM/YYYY
Time HH:MM
Air Temperature (°C)
RH %
Wind Speed (mtrs/sec)
Wind Direction (°)
Rainfall (mm)
30/11/ 2008 18:05 14.56 46.13 0.15 230 0
30/11/ 2008 19:05 13.25 48.11 0 228 0
30/11/ 2008 20:05 11.26 46.15 0 233 0
30/11/ 2008 21:05 10.23 44.64 0 233 0
30/11/ 2008 22:05 9.56 37.84 0 237 0
30/11/ 2008 23:05 9.98 39.71 0 213 0
1/12/2008 0:05 8.96 42.12 0 231 0
1/12/2008 1:05 8.25 61.32 0 231 0
1/12/2008 2:05 7.12 56.32 0 231 0
1/12/2008 3:05 7.69 62.68 0 249 0
1/12/2008 4:05 8.23 65.21 0 0 0
1/12/2008 5:05 6.52 54.21 0 232 0
1/12/2008 6:05 7.02 59.21 0 236 0
1/12/2008 7:05 6.29 70.12 0 233 0
1/12/2008 8:05 6.04 62.12 0 233 0
1/12/2008 9:05 7.21 60.09 0 105 0
1/12/2008 10:05 11.23 54.34 0 105 0
1/12/2008 11:05 12.36 48.01 0 74 0
1/12/2008 12:05 14.23 40.23 0 36 0
1/12/2008 13:05 15.74 41.36 0 65 0
1/12/2008 14:05 17.12 37.15 0.15 47 0
1/12/2008 15:05 18.36 36.76 4.65 359 0
1/12/2008 16:05 17.91 37.88 0 245 0
1/12/2008 17:05 14.95 40.12 0 286 0
1/12/2008 18:05 13.76 42.13 0 235 0
1/12/2008 19:05 10.26 48.56 0 249 0
1/12/2008 20:05 9.23 51.49 0 233 0
1/12/2008 21:05 10.26 52.13 0 244 0
1/12/2008 22:05 9.02 55.12 0 220 0
1/12/2008 23:05 10.23 59.09 0 226 0
2/12/2008 0:05 9.12 57.17 0 223 0
2/12/2008 1:05 10.23 55.28 0 178 0
2/12/2008 2:05 7.82 58.5 0 242 0
2/12/2008 3:05 7.12 63.92 0 203 0
2/12/2008 4:05 7.09 63.91 0 236 0
2/12/2008 5:05 6.54 64.38 0 233 0
2/12/2008 6:05 5.95 66.24 0 236 0
2/12/2008 7:05 5.09 66.53 0 236 0
2/12/2008 8:05 6.21 67.82 0 237 0
2/12/2008 9:05 8.23 71.23 0 7 0
2/12/2008 10:05 10.26 75.89 0 28 0
2/12/2008 11:05 13.2 75.79 0 6 0
2/12/2008 12:05 15.64 70.65 0 351 0
2/12/2008 13:05 16.32 53.34 4.2 339 0
2/12/2008 14:05 18.54 52.01 6.3 11 0
2/12/2008 15:05 19.4 52.35 6.9 359 0
2/12/2008 16:05 18.17 47.79 4.95 0 0
2/12/2008 17:05 14.02 46.42 4.05 285 0
2/12/2008 18:05 13.65 48.13 0 230 0

Project : Environmental Studies for Vishnugad Pipalkoti Hydro-Electric Project Page:9 of 23 Document : 2008026/EC/Final Report Date: Nov 2009 Annex-3.4.1 : Meteorological Data Revision: R4
Date DD/MM/YYYY
Time HH:MM
Air Temperature (°C)
RH %
Wind Speed (mtrs/sec)
Wind Direction (°)
Rainfall (mm)
2/12/2008 19:05 11.28 53.71 0 238 0
2/12/2008 20:05 11.32 58.66 0 229 0
2/12/2008 21:05 10.95 65.26 0 231 0
2/12/2008 22:05 9.35 68.91 0 241 0
2/12/2008 23:05 9.78 71.85 0 244 0
3/12/2008 0:05 8.52 73.62 0 232 0
3/12/2008 1:05 7.61 74.72 0 236 0
3/12/2008 2:05 6.83 75.18 0 234 0
3/12/2008 3:05 5.26 76.93 0 218 0
3/12/2008 4:05 7.23 79.25 0 235 0
3/12/2008 5:05 5.66 79.37 0 231 0
3/12/2008 6:05 5.63 77.73 0 228 0
3/12/2008 7:05 5.92 79.25 0 233 0
3/12/2008 8:05 6.32 80.41 0 206 0
3/12/2008 9:05 6.95 79.42 0 235 0
3/12/2008 10:05 9.64 80.38 0 85 0
3/12/2008 11:05 10.26 70.69 0 61 0
3/12/2008 12:05 14.23 56.64 0 60 0
3/12/2008 13:05 12.32 52.76 4.65 50 0
3/12/2008 14:05 17.21 51.7 6.6 359 0
3/12/2008 15:05 17.98 50.41 6.45 36 0
3/12/2008 16:05 18.23 46.38 5.1 359 0
3/12/2008 17:05 15.16 45.93 0.45 254 0
3/12/2008 18:05 14.61 46.24 0 238 0
3/12/2008 19:05 12.13 50.8 0 243 0
3/12/2008 20:05 8.36 59.08 0 229 0
3/12/2008 21:05 10.4 63.03 0 244 0
3/12/2008 22:05 9.09 64.83 0.15 234 0
3/12/2008 23:05 8.98 60.99 0 235 0
4/12/2008 0:05 8.08 62.35 0 252 0
4/12/2008 1:05 8.65 65.69 0 309 0
4/12/2008 2:05 6.56 68.23 0 226 0
4/12/2008 3:05 7.89 71.53 0 230 0
4/12/2008 4:05 7.23 74.57 0 231 0
4/12/2008 5:05 6.98 73.07 3.15 143 0
4/12/2008 6:05 7.02 74.91 0.15 234 0
4/12/2008 7:05 6.15 72.79 0.3 260 0
4/12/2008 8:05 5.81 76.81 0 220 0
4/12/2008 9:05 7.23 76.03 0 229 0
4/12/2008 10:05 10.23 76.71 1.65 19 0
4/12/2008 11:05 11.56 74.77 4.65 0 0
4/12/2008 12:05 13.25 59.25 3 66 0
4/12/2008 13:05 15.68 51.8 3.75 90 0
4/12/2008 14:05 17.72 49.1 5.7 31 0
4/12/2008 15:05 18.25 47.18 6 6 0
4/12/2008 16:05 17.46 41.19 4.65 339 0
4/12/2008 17:05 15.64 38.73 0 221 0
4/12/2008 18:05 13.25 43.07 0 227 0
4/12/2008 19:05 12.72 42.8 0 233 0

Project : Environmental Studies for Vishnugad Pipalkoti Hydro-Electric Project Page:10 of 23 Document : 2008026/EC/Final Report Date: Nov 2009 Annex-3.4.1 : Meteorological Data Revision: R4
Date DD/MM/YYYY
Time HH:MM
Air Temperature (°C)
RH %
Wind Speed (mtrs/sec)
Wind Direction (°)
Rainfall (mm)
4/12/2008 20:05 11.26 42.5 0 236 0
4/12/2008 21:05 10.23 50.87 0 241 0
4/12/2008 22:05 9.06 57.24 0 231 0
4/12/2008 23:05 9.45 59.36 0 226 0
5/12/2008 0:05 8.09 62 0 223 0
5/12/2008 1:05 7.26 61.89 0 194 0
5/12/2008 2:05 8.21 63.59 0 244 0
5/12/2008 3:05 7.45 65.46 0 237 0
5/12/2008 4:05 6.84 68.78 0 230 0
5/12/2008 5:05 7.58 70.66 0 234 0
5/12/2008 6:05 6.26 68.24 0 227 0
5/12/2008 7:05 5.99 73.93 0 228 0
5/12/2008 8:05 6.35 73.46 0 243 0
5/12/2008 9:05 7.45 74.98 0 253 0
5/12/2008 10:05 10.23 72.73 0 109 0
5/12/2008 11:05 11.25 73.19 0.15 359 0
5/12/2008 12:05 13.65 62.33 3.3 359 0
5/12/2008 13:05 15.21 52.58 5.1 0 0
5/12/2008 14:05 16.54 48.67 6.9 16 0
5/12/2008 15:05 17.89 45.78 6 274 0
5/12/2008 16:05 17.54 37.39 4.05 25 0
5/12/2008 17:05 16.24 38.51 0 252 0
5/12/2008 18:05 15.45 41.89 0 230 0
5/12/2008 19:05 11.23 44.44 0 230 0
5/12/2008 20:05 10.23 52.12 0 241 0
5/12/2008 21:05 9.63 56.93 0 227 0
5/12/2008 22:05 8.21 59.27 0 249 0
5/12/2008 23:05 8.78 58.98 0 223 0
6/12/2008 0:05 7.9 60.62 0 230 0
6/12/2008 1:05 7.24 62.03 0 242 0
6/12/2008 2:05 7.54 60.82 0 228 0
6/12/2008 3:05 6.4 62.06 0 219 0
6/12/2008 4:05 6.98 64.29 0 296 0
6/12/2008 5:05 6.12 62.68 3.3 235 0
6/12/2008 6:05 5.18 65.81 0 215 0
6/12/2008 7:05 5.64 68.03 0 235 0
6/12/2008 8:05 4.23 68.99 0 241 0
6/12/2008 9:05 4.98 72.32 0 241 0
6/12/2008 10:05 7.89 67.82 0 93 0
6/12/2008 11:05 9.35 65.73 0 35 0
6/12/2008 12:05 8.26 54.39 0.3 64 0
6/12/2008 13:05 14.56 45.33 3 20 0
6/12/2008 14:05 13.65 43.28 0.15 42 0
6/12/2008 15:05 18.94 39.55 2.1 313 0
6/12/2008 16:05 17.58 35.56 0.3 74 0
6/12/2008 17:05 16.32 30.78 0 305 0
6/12/2008 18:05 12.74 29.59 0 226 0
6/12/2008 19:05 10.23 32.72 2.85 217 0
6/12/2008 20:05 9.36 37.4 5.4 271 0

Project : Environmental Studies for Vishnugad Pipalkoti Hydro-Electric Project Page:11 of 23 Document : 2008026/EC/Final Report Date: Nov 2009 Annex-3.4.1 : Meteorological Data Revision: R4
Date DD/MM/YYYY
Time HH:MM
Air Temperature (°C)
RH %
Wind Speed (mtrs/sec)
Wind Direction (°)
Rainfall (mm)
6/12/2008 21:05 9.98 45.62 0 230 0
6/12/2008 22:05 9.32 47.74 0 242 0
6/12/2008 23:05 9.09 49.73 0 230 0
7/12/2008 0:05 16.23 51.75 0 235 0
7/12/2008 1:05 17.12 53.76 3.45 237 0
7/12/2008 2:05 18 56.07 0 233 0
7/12/2008 3:05 12.35 56.7 0 237 0
7/12/2008 4:05 12.39 58.5 0 229 0
7/12/2008 5:05 14.58 63.92 0 244 0
7/12/2008 6:05 13.56 63.91 0 239 0
7/12/2008 7:05 11.28 64.38 0 242 0
7/12/2008 8:05 13.03 60.56 0 235 0
7/12/2008 9:05 13.34 62.25 0 235 0
7/12/2008 10:05 14.25 56.78 0 7 0
7/12/2008 11:05 15.32 55.89 0 75 0
7/12/2008 12:05 17.09 54.39 0 43 0
7/12/2008 13:05 18.73 48.98 7.5 39 0
7/12/2008 14:05 19.46 42.77 6.9 6 0
7/12/2008 15:05 20.32 39.55 7.05 55 0
7/12/2008 16:05 19.12 32.76 0.15 58 0
7/12/2008 17:05 18.25 32.45 1.5 243 0
7/12/2008 18:05 16.32 30.01 0 231 0
7/12/2008 19:05 15.24 32.72 0 248 0
7/12/2008 20:05 10.23 37.4 0 232 0
7/12/2008 21:05 13.02 45.62 0 247 0
7/12/2008 22:05 9.89 47.74 0 246 0
7/12/2008 23:05 9.23 49.73 0 95 0
8/12/2008 0:05 8.36 51.75 0 112 0
8/12/2008 1:05 9.16 53.76 0 97 0
8/12/2008 2:05 8.96 56.07 4.5 202 0
8/12/2008 3:05 7.56 56.7 8.7 77 0
8/12/2008 4:05 6.23 54.2 19.8 117 0
8/12/2008 5:05 6.96 54.02 16.35 297 0
8/12/2008 6:05 5.68 55.75 20.4 351 0
8/12/2008 7:05 5.12 60.87 14.1 265 0
8/12/2008 8:05 5.91 59.7 8.55 118 0
8/12/2008 9:05 6.09 57.89 4.5 339 0
8/12/2008 10:05 9.65 57.16 8.7 333 0
8/12/2008 11:05 11.25 54.33 6.3 339 0
8/12/2008 12:05 13.21 46.62 9 328 0
8/12/2008 13:05 11.24 39.22 6.9 316 0
8/12/2008 14:05 16.28 38.79 7.5 359 0
8/12/2008 15:05 19.16 32.32 7.2 348 0
8/12/2008 16:05 18.94 33.02 6 325 0
8/12/2008 17:05 19.65 32.35 4.5 290 0
8/12/2008 18:05 14.56 37.08 3.3 342 0
8/12/2008 19:05 11.02 44.84 0 243 0
8/12/2008 20:05 11.23 43.08 0 232 0
8/12/2008 21:05 9.65 43.71 0 221 0

Project : Environmental Studies for Vishnugad Pipalkoti Hydro-Electric Project Page:12 of 23 Document : 2008026/EC/Final Report Date: Nov 2009 Annex-3.4.1 : Meteorological Data Revision: R4
Date DD/MM/YYYY
Time HH:MM
Air Temperature (°C)
RH %
Wind Speed (mtrs/sec)
Wind Direction (°)
Rainfall (mm)
8/12/2008 22:05 9.05 46.33 0 245 0
8/12/2008 23:05 8.49 37.09 0 230 0
9/12/2008 0:05 9.32 44.57 0 231 0
9/12/2008 1:05 8.04 47.44 0 231 0
9/12/2008 2:05 7.89 51.08 0 235 0
9/12/2008 3:05 7.45 54.99 0 219 0
9/12/2008 4:05 8.21 55.75 0 219 0
9/12/2008 5:05 6.23 60.87 0 225 0
9/12/2008 6:05 6.85 59.7 0 232 0
9/12/2008 7:05 6.09 56.68 0 232 0
9/12/2008 8:05 7.45 57.16 0 232 0
9/12/2008 9:05 7.96 53.28 0 232 0
9/12/2008 10:05 10.23 46.62 0 121 0
9/12/2008 11:05 11.65 39.22 0 90 0
9/12/2008 12:05 13.25 37.45 0 49 0
9/12/2008 13:05 16.09 32.32 0 9 0
9/12/2008 14:05 17.24 33.02 2.25 31 0
9/12/2008 15:05 19.56 32.35 4.95 29 0
9/12/2008 16:05 18.54 37.08 4.95 290 0
9/12/2008 17:05 15.22 44.84 0.3 279 0
9/12/2008 18:05 12.32 43.08 0.15 236 0
9/12/2008 19:05 11.68 43.71 0 233 0
9/12/2008 20:05 10.23 46.33 0 231 0
9/12/2008 21:05 9.65 37.09 0 211 0
9/12/2008 22:05 9.06 44.57 0 243 0
9/12/2008 23:05 8.92 42.37 0 246 0
10/12/2008 0:05 10.56 39.61 0 127 0
10/12/2008 1:05 10.9 45.02 0 224 0
10/12/2008 2:05 12.32 45.12 0.15 234 0
10/12/2008 3:05 10.25 45.78 0 217 0
10/12/2008 4:05 9.26 45.92 0 236 0
10/12/2008 5:05 9.58 49.14 0 238 0
10/12/2008 6:05 8.15 52.93 0.15 267 0
10/12/2008 7:05 8.08 50.25 0 230 0
10/12/2008 8:05 8.36 56.55 0 230 0
10/12/2008 9:05 9.98 52.45 0 229 0
10/12/2008 10:05 13.65 39.83 0 95 0
10/12/2008 11:05 15.5 37.69 0 4 0
10/12/2008 12:05 16.35 34.56 3.6 41 0
10/12/2008 13:05 19.54 35.05 5.25 63 0
10/12/2008 14:05 20.26 31.24 7.65 5 0
10/12/2008 15:05 21.63 32.04 6.6 345 0
10/12/2008 16:05 20.36 38.31 5.55 317 0
10/12/2008 17:05 18.54 40.94 6.6 268 0
10/12/2008 18:05 16.14 41.99 0 213 0
10/12/2008 19:05 15.64 44.06 0 234 0
10/12/2008 20:05 10.23 46.27 0 226 0
10/12/2008 21:05 9.45 43.09 0 230 0
10/12/2008 22:05 9.39 43.09 0.3 228 0

Project : Environmental Studies for Vishnugad Pipalkoti Hydro-Electric Project Page:13 of 23 Document : 2008026/EC/Final Report Date: Nov 2009 Annex-3.4.1 : Meteorological Data Revision: R4
Date DD/MM/YYYY
Time HH:MM
Air Temperature (°C)
RH %
Wind Speed (mtrs/sec)
Wind Direction (°)
Rainfall (mm)
10/12/2008 23:05 9.08 49.75 0 233 0
11/12/2008 0:05 12.36 56.07 0 232 0
11/12/2008 1:05 12.08 55.46 3 94 0
11/12/2008 2:05 11.23 55.89 0.9 279 0
11/12/2008 3:05 10.36 61.55 1.8 233 0
11/12/2008 4:05 9.23 63.46 0 233 0
11/12/2008 5:05 9.45 59.55 0 180 0
11/12/2008 6:05 10.23 64.73 6.6 194 0
11/12/2008 7:05 11.23 64.98 0 311 0
11/12/2008 8:05 13.65 69.01 0 233 0
11/12/2008 9:05 15.64 65.44 0 239 0
11/12/2008 10:05 12.01 61.23 0 112 0
11/12/2008 11:05 16.62 55.78 0 324 0
11/12/2008 12:05 18.24 48.01 0.15 95 0
11/12/2008 13:05 19.24 40.23 3.45 22 0
11/12/2008 14:05 20.14 41.5 5.4 0 0
11/12/2008 15:05 21.42 38.45 6.45 301 0
11/12/2008 16:05 20.25 35.55 6.9 281 0
11/12/2008 17:05 14.23 37.89 6.3 290 0
11/12/2008 18:05 15.06 40.78 5.25 318 0
11/12/2008 19:05 12.32 42.13 0 228 0
11/12/2008 20:05 12.89 48.56 0 230 0
11/12/2008 21:05 10.25 51.15 0 240 0
11/12/2008 22:05 10.36 52.13 0 230 0
11/12/2008 23:05 9.58 55.12 0 273 0
12/12/2008 0:05 8.23 58.67 0 235 0
12/12/2008 1:05 8.56 57.17 0 231 0
12/12/2008 2:05 9.36 55.28 0 228 0
12/12/2008 3:05 7.5 60.31 0 222 0
12/12/2008 4:05 6.54 63.92 0 231 0
12/12/2008 5:05 6.21 63.91 0 244 0
12/12/2008 6:05 5.45 64.38 0 209 0
12/12/2008 7:05 5.89 66.24 0 230 0
12/12/2008 8:05 5.09 64.96 0 236 0
12/12/2008 9:05 9.06 66.89 0 236 0
12/12/2008 10:05 10.64 59.75 0 96 0
12/12/2008 11:05 13.56 53.68 0 37 0
12/12/2008 12:05 12.36 49.84 2.4 86 0
12/12/2008 13:05 17.26 50.88 1.35 56 0
12/12/2008 14:05 17.98 47.23 3.9 46 0
12/12/2008 15:05 19.56 46.04 6.3 0 0
12/12/2008 16:05 16.54 45.71 5.1 358 0
12/12/2008 17:05 14.56 47.71 3.45 322 0
12/12/2008 18:05 13.21 52.57 0.15 235 0
12/12/2008 19:05 12.56 59.03 0 235 0
12/12/2008 20:05 9.65 56.63 0 238 0
12/12/2008 21:05 10.23 58.79 0 234 0
12/12/2008 22:05 9.05 58.69 0 276 0
12/12/2008 23:05 9.32 54.55 0 225 0

Project : Environmental Studies for Vishnugad Pipalkoti Hydro-Electric Project Page:14 of 23 Document : 2008026/EC/Final Report Date: Nov 2009 Annex-3.4.1 : Meteorological Data Revision: R4
Date DD/MM/YYYY
Time HH:MM
Air Temperature (°C)
RH %
Wind Speed (mtrs/sec)
Wind Direction (°)
Rainfall (mm)
13/12/ 2008 0:05 10.23 53.28 1.8 249 0
13/12/ 2008 1:05 8.25 52.57 1.8 217 0
13/12/ 2008 2:05 8.54 62.66 0 234 0
13/12/ 2008 3:05 9.65 63.19 0 226 0
13/12/ 2008 4:05 9.34 62.8 0.15 226 0
13/12/ 2008 5:05 8.23 65.45 2.1 230 0
13/12/ 2008 6:05 10.09 65.52 0 231 0
13/12/ 2008 7:05 7.45 68.08 0.45 30 0
13/12/ 2008 8:05 8.25 53.88 8.55 273 0
13/12/ 2008 9:05 11.23 48.22 10.35 317 0
13/12/ 2008 10:05 10.25 39.48 0.15 228 0
13/12/ 2008 11:05 14.25 37.54 0 56 0
13/12/ 2008 12:05 17.24 36.77 0.6 41 0
13/12/ 2008 13:05 18.12 33.78 0.15 55 0
13/12/ 2008 14:05 17.89 32.09 5.85 3 0
13/12/ 2008 15:05 19.65 33.89 7.35 356 0
13/12/ 2008 15:15 19.54 35.55 2.85 296 0
13/12/ 2008 16:15 17.45 37.56 4.05 22 0
13/12/ 2008 17:15 12.02 51.56 0.75 229 0
13/12/ 2008 18:15 14.65 53.68 0 223 0
13/12/ 2008 19:15 10.26 51.8 0 279 0
13/12/ 2008 20:15 9.65 50.98 0 217 0
13/12/ 2008 21:15 9.08 51.18 0 233 0
13/12/ 2008 22:15 7.56 54.77 0 220 0
13/12/ 2008 23:15 9.14 51.99 0 250 0
14/12/ 2008 0:15 8.61 51.37 0.6 293 0
14/12/ 2008 1:15 11.68 46.76 6.15 240 0
14/12/ 2008 2:15 7.82 50.54 4.35 233 0
14/12/ 2008 3:15 7.58 48.43 0.45 229 0
14/12/ 2008 4:15 6.8 52.65 0 268 0
14/12/ 2008 5:15 6.84 49.64 0 228 0
14/12/ 2008 6:15 5.94 52.61 0 230 0
14/12/ 2008 7:15 5.38 56.92 0 230 0
14/12/ 2008 8:15 5.13 58.17 0 230 0
14/12/ 2008 9:15 9.01 46.82 0 240 0
14/12/ 2008 10:15 11.58 41.1 0 13 0
14/12/ 2008 11:15 14.05 37.26 0 45 0
14/12/ 2008 12:15 15.83 32.98 0.6 50 0
14/12/ 2008 13:15 16.84 32.14 1.2 44 0
14/12/ 2008 14:15 18.62 32.64 6 0 0
14/12/ 2008 15:15 19.4 33.57 6.6 44 0
14/12/ 2008 16:15 18.17 37.77 5.55 72 0
14/12/ 2008 17:15 14.61 44.15 0 221 0
14/12/ 2008 18:15 13 46.13 0 218 0
14/12/ 2008 19:15 11.77 48.11 0 209 0
14/12/ 2008 20:15 11.65 46.15 0 222 0
14/12/ 2008 21:15 10.95 44.64 3.3 243 0
14/12/ 2008 22:15 12.27 37.84 5.25 219 0
14/12/ 2008 23:15 11.64 39.71 7.65 25 0

Project : Environmental Studies for Vishnugad Pipalkoti Hydro-Electric Project Page:15 of 23 Document : 2008026/EC/Final Report Date: Nov 2009 Annex-3.4.1 : Meteorological Data Revision: R4
Date DD/MM/YYYY
Time HH:MM
Air Temperature (°C)
RH %
Wind Speed (mtrs/sec)
Wind Direction (°)
Rainfall (mm)
15/12/ 2008 0:15 9.84 44.26 7.05 37 0
15/12/ 2008 1:15 9 47.44 4.5 106 0
15/12/ 2008 2:15 7.39 51.08 0 256 0
15/12/ 2008 3:15 7.02 53.99 0 259 0
15/12/ 2008 4:15 6.8 55.75 0.45 278 0
15/12/ 2008 5:15 5.69 60.87 1.8 234 0
15/12/ 2008 6:15 5.24 59.7 0 220 0
15/12/ 2008 7:15 5.66 56.68 0 117 0
15/12/ 2008 8:15 5.96 57.16 1.05 225 0
15/12/ 2008 9:15 9.06 52.28 0 101 0
15/12/ 2008 10:15 11.09 46.62 0 20 0
15/12/ 2008 11:15 13.2 39.22 0 66 0
15/12/ 2008 12:15 15.24 36 0.6 79 0
15/12/ 2008 13:15 17.3 32.32 6.15 0 0
15/12/ 2008 14:15 18.96 33.02 5.1 86 0
15/12/ 2008 15:15 19.23 32.35 4.65 80 0
15/12/ 2008 16:15 18.26 37.08 0.45 98 0
15/12/ 2008 17:15 14.7 44.84 0 234 0
15/12/ 2008 18:02 13.96 43.08 0 233 0
15/12/ 2008 19:02 12.75 43.71 0 297 0
15/12/ 2008 20:02 12.09 46.33 0.75 16 0
15/12/ 2008 21:02 13.69 37.09 6.9 16 0
15/12/ 2008 22:02 11.38 44.57 1.5 0 0
15/12/ 2008 23:02 10.8 43 0 182 0
16/12/ 2008 0:02 11.32 39.61 0 196 0
16/12/ 2008 1:02 9.57 45.02 0 236 0
16/12/ 2008 2:02 9.64 45.12 0 217 0
16/12/ 2008 3:02 8.88 45.78 0 183 0
16/12/ 2008 4:02 9.01 45.92 0 231 0
16/12/ 2008 5:02 7.88 49.14 0 225 0
16/12/ 2008 6:02 7.34 52.93 0 246 0
16/12/ 2008 7:02 7.75 50.25 0 232 0
16/12/ 2008 8:02 7.14 56.55 0 81 0
16/12/ 2008 9:02 9.2 52.45 1.35 230 0
16/12/ 2008 10:02 13.44 39.83 0 112 0
16/12/ 2008 11:02 15.42 37.69 0 51 0
16/12/ 2008 12:02 17.6 32.9 1.35 5 0
16/12/ 2008 13:02 18.02 35.05 6.75 12 0
16/12/ 2008 14:02 19.59 31.24 8.55 31 0
16/12/ 2008 15:02 20.43 32.04 6.3 9 0
16/12/ 2008 16:02 18.16 38.31 4.95 81 0
16/12/ 2008 17:02 16.38 40.94 0 288 0
16/12/ 2008 18:02 15.82 41.99 0 137 0
16/12/ 2008 19:02 14.61 44.06 1.8 233 0
16/12/ 2008 20:02 14.15 46.27 0.9 250 0
16/12/ 2008 21:02 15.2 43.09 5.1 13 0
16/12/ 2008 22:02 14.61 43.09 1.5 229 0
16/12/ 2008 23:02 13.36 49.75 4.5 319 0
17/12/ 2008 0:02 18.65 30.92 13.65 79 0

Project : Environmental Studies for Vishnugad Pipalkoti Hydro-Electric Project Page:16 of 23 Document : 2008026/EC/Final Report Date: Nov 2009 Annex-3.4.1 : Meteorological Data Revision: R4
Date DD/MM/YYYY
Time HH:MM
Air Temperature (°C)
RH %
Wind Speed (mtrs/sec)
Wind Direction (°)
Rainfall (mm)
17/12/ 2008 1:02 19 30.88 12.6 147 0
17/12/ 2008 2:02 19.06 31.23 12.3 118 0
17/12/ 2008 3:02 13.65 47.82 11.7 129 0
17/12/ 2008 4:02 13.56 47.55 0.15 241 0
17/12/ 2008 5:02 14.84 43.02 3.6 289 0
17/12/ 2008 6:02 13.04 49.45 2.7 239 0
17/12/ 2008 7:02 11.39 56.79 0.15 12 0
17/12/ 2008 8:02 11.12 57.78 0 241 0
17/12/ 2008 9:02 13.34 49.84 0 231 0
17/12/ 2008 10:02 14.82 47.27 3.75 84 0
17/12/ 2008 11:02 16.44 42.78 1.5 31 0
17/12/ 2008 12:02 18.12 40.44 0 29 0
17/12/ 2008 13:02 19.36 37.93 3.15 60 0
17/12/ 2008 14:02 19.46 39.58 0 23 0
17/12/ 2008 15:02 21.35 38.2 4.8 87 0
17/12/ 2008 16:02 19.12 40.08 5.4 327 0
17/12/ 2008 17:02 17.23 44.69 2.55 297 0
17/12/ 2008 18:02 15.5 49.87 0 259 0
17/12/ 2008 19:02 14.98 52.13 0 272 0
17/12/ 2008 20:02 13.7 51.15 0 243 0
17/12/ 2008 21:02 13.02 52.71 0 220 0
17/12/ 2008 22:02 12.22 53.96 0 226 0
17/12/ 2008 23:02 11.81 54.29 0 235 0
18/12/ 2008 0:02 11.31 55.3 0 232 0
18/12/ 2008 1:02 10.68 56.89 0.15 237 0
18/12/ 2008 2:02 14.36 40.16 9.6 245 0
18/12/ 2008 3:02 14.08 39.94 8.4 89 0
18/12/ 2008 4:02 10.12 53.69 8.85 245 0
18/12/ 2008 5:02 9.5 55.83 0 229 0
18/12/ 2008 6:02 8.39 61.06 0 236 0
18/12/ 2008 7:02 8 62.13 0 259 0
18/12/ 2008 8:02 8.36 61.06 0 228 0
18/12/ 2008 9:02 9.84 58.19 0 291 0
18/12/ 2008 10:02 13.6 50.92 0 36 0
18/12/ 2008 11:02 15.51 45.09 0 81 0
18/12/ 2008 12:02 18.16 36.83 0 61 0
18/12/ 2008 13:02 20.12 36.82 4.65 61 0
18/12/ 2008 14:02 20.11 35.15 5.25 0 0
18/12/ 2008 15:02 21.1 35.04 7.2 5 0
18/12/ 2008 16:02 20.58 36.46 5.7 18 0
18/12/ 2008 17:02 17.58 46.15 3.6 183 0
18/12/ 2008 18:02 16.16 45.75 0 230 0
18/12/ 2008 19:02 14.98 49.87 0 268 0
18/12/ 2008 20:02 14.72 49.11 7.5 0 0
18/12/ 2008 21:02 14.2 46.91 0 228 0
18/12/ 2008 22:02 15.16 44.35 0 62 0
18/12/ 2008 23:02 13.75 47.39 0 348 0
19/12/ 2008 0:02 13.6 47.84 0 233 0
19/12/ 2008 1:02 13.72 48.14 3.3 121 0

Project : Environmental Studies for Vishnugad Pipalkoti Hydro-Electric Project Page:17 of 23 Document : 2008026/EC/Final Report Date: Nov 2009 Annex-3.4.1 : Meteorological Data Revision: R4
Date DD/MM/YYYY
Time HH:MM
Air Temperature (°C)
RH %
Wind Speed (mtrs/sec)
Wind Direction (°)
Rainfall (mm)
19/12/ 2008 2:02 12.25 52.03 0 185 0
19/12/ 2008 3:02 12.22 55.04 0 236 0
19/12/ 2008 4:02 12.14 56.49 0 265 0
19/12/ 2008 5:02 12.41 55.22 0 55 0
19/12/ 2008 6:02 12.14 54.58 4.35 242 0
19/12/ 2008 7:02 12.76 52.37 0 233 0
19/12/ 2008 8:02 13.7 50.1 0 132 0
19/12/ 2008 9:02 21.86 33.28 19.05 124 0
19/12/ 2008 10:02 21.44 35.99 22.65 175 0
19/12/ 2008 11:02 21.1 37.93 17.1 34 0
19/12/ 2008 12:02 20.62 41.57 20.55 279 0
19/12/ 2008 13:02 20.38 43.75 18.75 153 0
19/12/ 2008 14:02 20.52 43.08 16.8 304 0
19/12/ 2008 15:02 20 44.72 18.3 250 0
19/12/ 2008 16:02 19.72 46.05 11.85 297 0
19/12/ 2008 17:02 20.63 43.35 17.1 135 0
19/12/ 2008 18:02 19.83 46.45 14.55 318 0
19/12/ 2008 19:02 19.32 48.47 12.15 314 0
19/12/ 2008 20:02 18.23 54.18 21.45 83 0
19/12/ 2008 21:02 17.74 56.49 16.05 306 0
19/12/ 2008 22:02 18.78 51.53 19.35 347 0
19/12/ 2008 23:02 17.86 54.83 19.05 190 0
20/12/ 2008 0:02 16.09 64.54 10.2 260 0
20/12/ 2008 1:02 14.8 73.03 8.7 189 0
20/12/ 2008 2:02 13.34 83.3 7.8 261 0.8
20/12/ 2008 3:02 13.04 86.14 9.15 219 0.4
20/12/ 2008 4:02 13.94 79.08 11.4 62 0
20/12/ 2008 5:02 13.54 81.07 9.45 176 0
20/12/ 2008 6:02 13.31 81.88 11.1 329 0.4
20/12/ 2008 7:02 13.46 80.73 9.75 205 0
20/12/ 2008 8:02 12.97 83.31 7.8 181 0
20/12/ 2008 9:02 12.44 87.81 9.75 238 0.8
20/12/ 2008 10:02 12.62 87.25 9 308 1
20/12/ 2008 11:02 13.32 82.2 8.55 279 0.2
20/12/ 2008 12:02 13.97 77.82 9.3 207 0
20/12/ 2008 13:02 14.29 76.75 7.65 303 0
20/12/ 2008 14:02 14.72 70.24 9.15 356 0
20/12/ 2008 15:02 14.65 72.57 6.9 222 0
20/12/ 2008 16:02 14.99 70.97 7.2 275 0
20/12/ 2008 17:02 15.22 69.32 11.4 178 0
20/12/ 2008 18:02 15.3 68.78 8.55 252 0
20/12/ 2008 19:02 15.74 66.21 10.95 276 0
20/12/ 2008 20:02 15.4 65.11 9.9 294 0
20/12/ 2008 21:02 15.46 64.43 10.5 207 0
20/12/ 2008 22:02 15.15 62.4 7.95 234 0
20/12/ 2008 23:02 14.38 65.92 2.25 100 0
21/12/ 2008 0:02 13.22 74.69 0.75 233 0
21/12/ 2008 1:02 12.58 79.19 0 258 0
21/12/ 2008 2:02 12.24 80.04 0.15 272 0

Project : Environmental Studies for Vishnugad Pipalkoti Hydro-Electric Project Page:18 of 23 Document : 2008026/EC/Final Report Date: Nov 2009 Annex-3.4.1 : Meteorological Data Revision: R4
Date DD/MM/YYYY
Time HH:MM
Air Temperature (°C)
RH %
Wind Speed (mtrs/sec)
Wind Direction (°)
Rainfall (mm)
21/12/ 2008 3:02 11.84 82.69 0 248 0
21/12/ 2008 4:02 11.59 84.71 0 213 0
21/12/ 2008 5:02 12.06 80.79 0 261 0
21/12/ 2008 6:02 14.12 67.02 0 160 0
21/12/ 2008 7:02 14.05 64.96 4.5 291 0
21/12/ 2008 8:02 12.29 74.11 7.35 239 0
21/12/ 2008 9:02 15.12 59.75 0.6 281 0
21/12/ 2008 10:02 16.9 53.68 7.5 106 0
21/12/ 2008 11:02 18.16 49.84 6.9 225 0
21/12/ 2008 12:02 19.12 50.88 1.2 63 0
21/12/ 2008 13:02 20.59 47.58 0 76 0
21/12/ 2008 14:02 21.26 46.04 1.05 10 0
21/12/ 2008 15:02 21.19 45.71 1.5 319 0
21/12/ 2008 16:02 20.87 47.71 4.65 5 0
21/12/ 2008 17:02 18.66 52.57 0 60 0
21/12/ 2008 18:02 16.52 59.03 0 210 0
21/12/ 2008 19:02 15.44 56.63 0 229 0
21/12/ 2008 20:02 14.61 58.79 0 237 0
21/12/ 2008 21:02 13.8 58.69 0 267 0
21/12/ 2008 22:02 14.5 54.5 6.45 328 0
21/12/ 2008 23:02 14.48 53.28 7.35 206 0
22/12/ 2008 0:02 14.18 52.57 8.4 230 0
22/12/ 2008 1:02 11.72 62.66 6.3 288 0
22/12/ 2008 2:02 11.16 63.19 0 272 0
22/12/ 2008 3:02 10.68 62.8 0 225 0
22/12/ 2008 4:02 9.69 65.45 0 208 0
22/12/ 2008 5:02 9.15 65.52 0 232 0
22/12/ 2008 6:02 8.66 68.08 0 232 0
22/12/ 2008 7:02 10.64 53.88 0 173 0
22/12/ 2008 8:02 11.7 48.22 6.15 192 0
22/12/ 2008 9:02 13.46 39.48 5.7 241 0
22/12/ 2008 10:02 16.3 36.41 0 88 0
22/12/ 2008 11:02 17.52 38.84 0 41 0
22/12/ 2008 12:02 18.54 34.22 0 68 0
22/12/ 2008 13:02 19.23 36.53 0 81 0
22/12/ 2008 14:02 20.13 34.95 0.15 51 0
22/12/ 2008 15:02 21.42 30.45 0 2 0
22/12/ 2008 16:02 20.1 32.98 0 327 0
22/12/ 2008 17:02 16.63 45.65 0 122 0
22/12/ 2008 18:02 15.1 48.72 0 288 0
22/12/ 2008 19:02 14.4 43.71 0 219 0
22/12/ 2008 20:02 13.12 47.15 0 232 0
22/12/ 2008 21:02 11.86 50.41 0 222 0
22/12/ 2008 22:02 13.58 38.63 4.5 252 0
22/12/ 2008 23:02 13.22 37.67 5.55 232 0
23/12/ 2008 0:02 13.33 36.25 0.15 280 0
23/12/ 2008 1:02 12.84 35.84 7.5 222 0
23/12/ 2008 2:02 12.89 34.7 10.35 139 0
23/12/ 2008 3:02 10.9 40.15 7.65 116 0

Project : Environmental Studies for Vishnugad Pipalkoti Hydro-Electric Project Page:19 of 23 Document : 2008026/EC/Final Report Date: Nov 2009 Annex-3.4.1 : Meteorological Data Revision: R4
Date DD/MM/YYYY
Time HH:MM
Air Temperature (°C)
RH %
Wind Speed (mtrs/sec)
Wind Direction (°)
Rainfall (mm)
23/12/ 2008 4:02 9.89 41.75 0.15 258 0
23/12/ 2008 5:02 8.07 49.66 0.45 264 0
23/12/ 2008 6:02 7.08 55.35 0 223 0
23/12/ 2008 7:02 6.95 56.23 0 244 0
23/12/ 2008 8:02 6.5 58.62 0 263 0
23/12/ 2008 9:02 7.53 56.12 0 274 0
23/12/ 2008 10:02 11.82 43.06 0 66 0
23/12/ 2008 11:02 13.86 39.39 0 81 0
23/12/ 2008 12:02 15.6 35.5 0 85 0
23/12/ 2008 13:02 17.15 35.18 0 76 0
23/12/ 2008 14:02 18.09 34.89 0.3 39 0
23/12/ 2008 15:02 18.88 33.15 4.35 0 0
23/12/ 2008 16:02 18.12 35.2 0.6 332 0
23/12/ 2008 17:02 14.78 47.74 0 316 0
23/12/ 2008 18:02 13.47 48.36 0 275 0
23/12/ 2008 19:02 12.53 49.82 0 240 0
23/12/ 2008 20:02 12.86 47.12 0 117 0
23/12/ 2008 21:02 10.78 53.36 0 239 0
23/12/ 2008 22:02 10.4 54.3 0 104 0
23/12/ 2008 23:02 9.45 57 0 182 0
24/12/ 2008 0:02 8.72 60.03 0 191 0
24/12/ 2008 1:02 8.09 61.58 0 227 0
24/12/ 2008 2:02 7.85 60.66 0 231 0
24/12/ 2008 3:02 7.04 62.8 0 236 0
24/12/ 2008 4:02 7.14 61.03 0 230 0
24/12/ 2008 5:02 6.34 64.51 0 220 0
24/12/ 2008 6:02 5.86 65.54 0 233 0
24/12/ 2008 7:02 5.68 65.64 0 233 0
24/12/ 2008 8:02 5.95 65.2 0 233 0
24/12/ 2008 9:02 7.38 61.77 0 233 0
24/12/ 2008 10:02 11.19 51.73 0 16 0
24/12/ 2008 11:02 13.22 42.35 0 352 0
24/12/ 2008 12:02 14.4 40.95 0 93 0
24/12/ 2008 13:02 16.53 38.94 0 53 0
24/12/ 2008 14:02 17.69 37.76 0.45 0 0
24/12/ 2008 15:02 18.02 41.09 5.4 0 0
24/12/ 2008 16:02 17.52 42.84 6.3 350 0
24/12/ 2008 17:02 15.93 46.11 7.95 290 0
24/12/ 2008 18:02 14.68 49.64 6 274 0
24/12/ 2008 19:02 12.52 57.05 0.6 169 0
24/12/ 2008 20:02 11.5 61.63 0 234 0
24/12/ 2008 21:02 10.62 64.84 0 235 0
24/12/ 2008 22:02 9.83 68.21 0.15 197 0
24/12/ 2008 23:02 9.56 68.22 0 277 0
25/12/ 2008 0:02 8.61 71.74 0 204 0
25/12/ 2008 1:02 7.92 74.42 0 242 0
25/12/ 2008 2:02 7.34 76.62 0 227 0
25/12/ 2008 3:02 7.04 77.99 0 216 0
25/12/ 2008 4:02 7.05 76.83 0 235 0
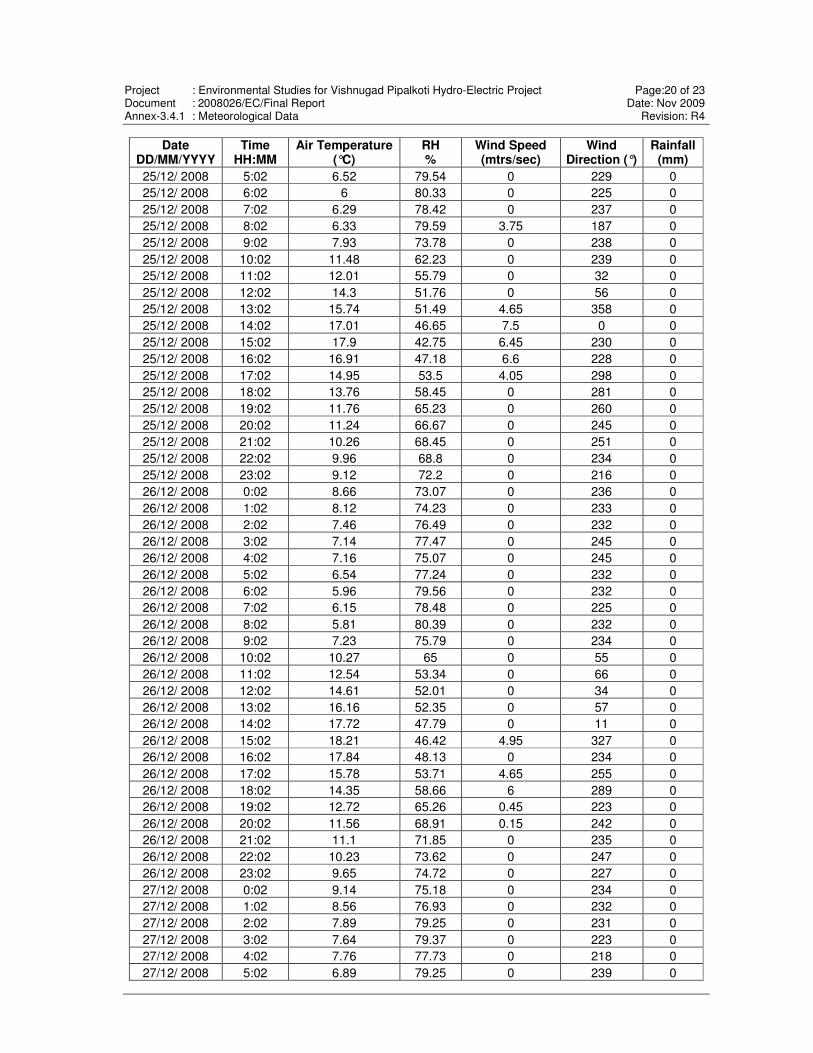
Project : Environmental Studies for Vishnugad Pipalkoti Hydro-Electric Project Page:20 of 23 Document : 2008026/EC/Final Report Date: Nov 2009 Annex-3.4.1 : Meteorological Data Revision: R4
Date DD/MM/YYYY
Time HH:MM
Air Temperature (°C)
RH %
Wind Speed (mtrs/sec)
Wind Direction (°)
Rainfall (mm)
25/12/ 2008 5:02 6.52 79.54 0 229 0
25/12/ 2008 6:02 6 80.33 0 225 0
25/12/ 2008 7:02 6.29 78.42 0 237 0
25/12/ 2008 8:02 6.33 79.59 3.75 187 0
25/12/ 2008 9:02 7.93 73.78 0 238 0
25/12/ 2008 10:02 11.48 62.23 0 239 0
25/12/ 2008 11:02 12.01 55.79 0 32 0
25/12/ 2008 12:02 14.3 51.76 0 56 0
25/12/ 2008 13:02 15.74 51.49 4.65 358 0
25/12/ 2008 14:02 17.01 46.65 7.5 0 0
25/12/ 2008 15:02 17.9 42.75 6.45 230 0
25/12/ 2008 16:02 16.91 47.18 6.6 228 0
25/12/ 2008 17:02 14.95 53.5 4.05 298 0
25/12/ 2008 18:02 13.76 58.45 0 281 0
25/12/ 2008 19:02 11.76 65.23 0 260 0
25/12/ 2008 20:02 11.24 66.67 0 245 0
25/12/ 2008 21:02 10.26 68.45 0 251 0
25/12/ 2008 22:02 9.96 68.8 0 234 0
25/12/ 2008 23:02 9.12 72.2 0 216 0
26/12/ 2008 0:02 8.66 73.07 0 236 0
26/12/ 2008 1:02 8.12 74.23 0 233 0
26/12/ 2008 2:02 7.46 76.49 0 232 0
26/12/ 2008 3:02 7.14 77.47 0 245 0
26/12/ 2008 4:02 7.16 75.07 0 245 0
26/12/ 2008 5:02 6.54 77.24 0 232 0
26/12/ 2008 6:02 5.96 79.56 0 232 0
26/12/ 2008 7:02 6.15 78.48 0 225 0
26/12/ 2008 8:02 5.81 80.39 0 232 0
26/12/ 2008 9:02 7.23 75.79 0 234 0
26/12/ 2008 10:02 10.27 65 0 55 0
26/12/ 2008 11:02 12.54 53.34 0 66 0
26/12/ 2008 12:02 14.61 52.01 0 34 0
26/12/ 2008 13:02 16.16 52.35 0 57 0
26/12/ 2008 14:02 17.72 47.79 0 11 0
26/12/ 2008 15:02 18.21 46.42 4.95 327 0
26/12/ 2008 16:02 17.84 48.13 0 234 0
26/12/ 2008 17:02 15.78 53.71 4.65 255 0
26/12/ 2008 18:02 14.35 58.66 6 289 0
26/12/ 2008 19:02 12.72 65.26 0.45 223 0
26/12/ 2008 20:02 11.56 68.91 0.15 242 0
26/12/ 2008 21:02 11.1 71.85 0 235 0
26/12/ 2008 22:02 10.23 73.62 0 247 0
26/12/ 2008 23:02 9.65 74.72 0 227 0
27/12/ 2008 0:02 9.14 75.18 0 234 0
27/12/ 2008 1:02 8.56 76.93 0 232 0
27/12/ 2008 2:02 7.89 79.25 0 231 0
27/12/ 2008 3:02 7.64 79.37 0 223 0
27/12/ 2008 4:02 7.76 77.73 0 218 0
27/12/ 2008 5:02 6.89 79.25 0 239 0

Project : Environmental Studies for Vishnugad Pipalkoti Hydro-Electric Project Page:21 of 23 Document : 2008026/EC/Final Report Date: Nov 2009 Annex-3.4.1 : Meteorological Data Revision: R4
Date DD/MM/YYYY
Time HH:MM
Air Temperature (°C)
RH %
Wind Speed (mtrs/sec)
Wind Direction (°)
Rainfall (mm)
27/12/ 2008 6:02 6.32 80.41 0 226 0
27/12/ 2008 7:02 6.33 79.42 0 237 0
27/12/ 2008 8:02 6.01 80.38 0 227 0
27/12/ 2008 9:02 7.96 70.69 0 228 0
27/12/ 2008 10:02 11.99 56.64 0 252 0
27/12/ 2008 11:02 12.26 52.76 0 30 0
27/12/ 2008 12:02 14.32 51.7 0 60 0
27/12/ 2008 13:02 16 50.41 0 28 0
27/12/ 2008 14:02 18.17 46.38 4.8 358 0
27/12/ 2008 15:02 17.65 45.93 5.4 359 0
27/12/ 2008 16:02 16.8 46.24 6.45 286 0
27/12/ 2008 17:02 15.22 50.8 6.6 277 0
27/12/ 2008 18:02 12.92 59.08 0 245 0
27/12/ 2008 19:02 11.7 63.03 0 235 0
27/12/ 2008 20:02 10.88 64.83 0.75 236 0
27/12/ 2008 21:02 10.89 60.99 2.7 125 0
27/12/ 2008 22:02 10.53 62.35 0.9 229 0
27/12/ 2008 23:02 9.65 65.69 0 236 0
28/12/ 2008 0:02 8.92 68.23 0 260 0
28/12/ 2008 1:02 7.98 71.53 0.45 224 0
28/12/ 2008 2:02 7.44 74.57 1.95 210 0
28/12/ 2008 3:02 7.37 73.07 0 231 0
28/12/ 2008 4:02 7.11 74.91 0.9 234 0
28/12/ 2008 5:02 7.25 72.79 0 232 0
28/12/ 2008 6:02 6.26 76.81 0 149 0
28/12/ 2008 7:02 5.88 76.03 0.6 219 0
28/12/ 2008 8:02 6.02 76.71 0 230 0
28/12/ 2008 9:02 7.18 74.77 0 240 0
28/12/ 2008 10:02 11.38 59.25 0.15 228 0
28/12/ 2008 11:02 12.39 51.8 0.15 85 0
28/12/ 2008 12:02 13.64 49.1 0 94 0
28/12/ 2008 13:02 15.88 47.18 5.55 35 0
28/12/ 2008 14:02 17.14 41.19 5.55 359 0
28/12/ 2008 15:02 18.35 38.73 5.85 327 0
28/12/ 2008 16:02 17.25 43.07 6.15 321 0
28/12/ 2008 17:02 15.44 42.8 6.75 265 0
28/12/ 2008 18:02 14.28 42.5 4.2 241 0
28/12/ 2008 19:02 11.66 50.87 0 257 0
28/12/ 2008 20:02 10.28 57.24 0 242 0
28/12/ 2008 21:02 9.53 59.36 0 239 0
28/12/ 2008 22:02 8.92 62 0 188 0
28/12/ 2008 23:02 8.62 61.89 0 252 0
29/12/ 2008 0:02 7.88 63.59 0 227 0
29/12/ 2008 1:02 7.54 65.46 0 231 0
29/12/ 2008 2:02 6.54 68.78 0 231 0
29/12/ 2008 3:02 6.43 70.66 0 234 0
29/12/ 2008 4:02 6.48 68.24 0 228 0
29/12/ 2008 5:02 5.56 73.93 0 244 0
29/12/ 2008 6:02 5.21 73.46 0 229 0

Project : Environmental Studies for Vishnugad Pipalkoti Hydro-Electric Project Page:22 of 23 Document : 2008026/EC/Final Report Date: Nov 2009 Annex-3.4.1 : Meteorological Data Revision: R4
Date DD/MM/YYYY
Time HH:MM
Air Temperature (°C)
RH %
Wind Speed (mtrs/sec)
Wind Direction (°)
Rainfall (mm)
29/12/ 2008 7:02 4.88 74.98 0 223 0
29/12/ 2008 8:02 5.25 72.73 0 241 0
29/12/ 2008 9:02 5.89 73.19 0 151 0
29/12/ 2008 10:02 8.71 62.33 0 232 0
29/12/ 2008 11:02 11.19 52.58 0 32 0
29/12/ 2008 12:02 13.72 48.67 2.1 25 0
29/12/ 2008 13:02 15.12 45.78 3.3 75 0
29/12/ 2008 14:02 17.07 37.39 6.15 18 0
29/12/ 2008 15:02 17.16 38.51 6.6 17 0
29/12/ 2008 16:02 16.34 41.89 6 315 0
29/12/ 2008 17:02 14.87 44.44 3.9 334 0
29/12/ 2008 18:02 12.74 52.12 0 233 0
29/12/ 2008 19:02 11.14 56.93 0 232 0
29/12/ 2008 20:02 10.42 59.27 0 230 0
29/12/ 2008 21:02 10.02 58.98 0 231 0
29/12/ 2008 22:02 9.15 60.62 0 226 0
29/12/ 2008 23:02 8.42 62.03 0 229 0
30/12/ 2008 0:02 8.3 60.82 0 240 0
30/12/ 2008 1:02 7.62 62.06 0 236 0
30/12/ 2008 2:02 6.83 64.29 0 235 0
30/12/ 2008 3:02 6.81 62.68 0 233 0
30/12/ 2008 4:02 6.02 65.81 0 221 0
30/12/ 2008 5:02 5.66 68.03 0 225 0
30/12/ 2008 6:02 5.4 68.99 0 232 0
30/12/ 2008 7:02 4.62 72.32 0 236 0
30/12/ 2008 8:02 4.71 72.16 0 234 0
30/12/ 2008 9:02 6.12 68.01 0 202 0
30/12/ 2008 10:02 10.06 54.34 0 202 0
30/12/ 2008 11:02 11.72 48.01 0 72 0
30/12/ 2008 12:02 14.23 41.2 0 31 0
30/12/ 2008 13:02 15.78 41.5 3.15 39 0
30/12/ 2008 14:02 17.82 38.27 1.2 324 0
30/12/ 2008 15:02 18.57 34.9 3.75 44 0
30/12/ 2008 16:02 17.22 37.88 0.15 15 0
30/12/ 2008 17:02 15.16 38.53 0 329 0
30/12/ 2008 18:02 14.61 39.2 0 276 0
30/12/ 2008 19:02 12.13 48.56 0 221 0
30/12/ 2008 20:02 10.83 51.49 0 238 0
30/12/ 2008 21:02 10.4 52.13 0 235 0
30/12/ 2008 22:02 9.89 54.58 0 224 0
30/12/ 2008 23:02 9.6 54.33 0 232 0
31/12/ 2008 0:02 9.3 53.54 0 233 0
31/12/ 2008 1:02 8.79 55.28 0 28 0
31/12/ 2008 2:02 7.91 58.5 0 232 0
31/12/ 2008 3:02 6.91 63.92 0 236 0
31/12/ 2008 4:02 6.72 63.91 0 156 0
31/12/ 2008 5:02 5.95 64.38 0 227 0
31/12/ 2008 6:02 5.52 66.24 0 239 0
31/12/ 2008 7:02 5.21 66.53 0 244 0

Project : Environmental Studies for Vishnugad Pipalkoti Hydro-Electric Project Page:23 of 23 Document : 2008026/EC/Final Report Date: Nov 2009 Annex-3.4.1 : Meteorological Data Revision: R4
Date DD/MM/YYYY
Time HH:MM
Air Temperature (°C)
RH %
Wind Speed (mtrs/sec)
Wind Direction (°)
Rainfall (mm)
31/12/ 2008 8:02 5.1 67.82 0 216 0
31/12/ 2008 9:02 6.48 65.73 0 216 0
31/12/ 2008 10:02 9.39 54.39 0 54 0
31/12/ 2008 11:02 12.12 44.53 0 0 0
31/12/ 2008 12:02 13.23 42.77 0 61 0
31/12/ 2008 13:02 15.4 39.55 0 86 0
31/12/ 2008 14:02 18.24 28.72 0 121 0
31/12/ 2008 15:02 18.08 27.51 4.65 145 0
31/12/ 2008 16:02 16.92 29.59 6.15 281 0
31/12/ 2008 17:02 15.22 32.72 5.55 318 0
31/12/ 2008 18:02 13.52 37.4 6.75 284 0
31/12/ 2008 19:02 10.95 45.62 0 216 0
31/12/ 2008 20:02 10.11 47.74 0.15 237 0
31/12/ 2008 21:02 9.31 49.73 0.15 236 0
31/12/ 2008 22:02 8.54 51.75 0 226 0
31/12/ 2008 23:02 8.14 53.76 0.45 212 0
1/1/2009 0:02 7.4 56.07 0 223 0
1/1/2009 1:02 6.97 56.7 0 235 0
1/1/2009 2:02 7.48 54.2 0 1 0
1/1/2009 3:02 6.36 61.51 0.45 7 0
1/1/2009 4:02 6 62.46 0 295 0
1/1/2009 5:02 5.72 59.55 0 226 0
1/1/2009 6:02 4.66 64.73 0 227 0
1/1/2009 7:02 4.42 64.98 1.05 223 0
1/1/2009 8:02 3.84 69.01 0.3 226 0
1/1/2009 9:02 5.14 65.44 0 226 0

Annex-3.7.1
Annex-3.7.1
FORMAT FOR RIVER FLOW MEASUREMENT Float Timing (Sec)*
Date Time RFM Station Gauge Reading
(cm)
Current Meter
Reading (sec)
Float 1 Float 2 Float 3
March 1, 08 Dam Site
Patal Ganga
Garur Ganga
Mainagad
Power House Site
Birahi
March 2, 08
* Time taken by the float to traverse a distance of 50 m.
Page 1

Annex 3.7.2
Sources of Drinking Water
SL Name of Villages
River Bank
Elevation (m)
Name of Panchayat
Name of Block
Name of Tehsil Drinking water Comes
1 Garigaon R 1277 Birahi Dasoli Chamoli Water comes from Janeu Kanom ,Distance village is 2 Km
2 Birahi L 1071 Birahi Dasoli Chamoli Water comes from Shera Pani ,Distance village is appx. 2 km
3 Kauriya L 1200 Koriya Dasoli Chamoli Water comes 100 m above village
4 Sirkot L 1307 Batula Dasoli Chamoli Water comes from 500 m above village
5 Sirkot-2 L 1311 Birahi Dasoli Chamoli Water comes from 500 m above village
6 Digoli L 1375 Mayapur Dasoli Chamoli Water comes from 1 km above village
7 Luhan L 1413 Luhan Dasoli Chamoli Water comes from 500 m above village
8 Kyontha L 1364 Luhan Dasoli Chamoli Water comes from 2.5 km above village
9 Gadora L 1324 Gadora Dasoli Chamoli Water comes 3 km above village
10 Gadi L 1306 Pipalkoti Dasoli Chamoli Water comes from Samma nala, Distance from village appx. 500 m
11 Akthalla L 1307 Pipalkoti Dasoli Chamoli Water comes from Samma nala,Distance from village appx. 500 m
12 Retoli L 1419 Ratoli Dasoli Chamoli Water comes 500 m above village
13 Nargoli L 1407 Ratoli Dasoli Chamoli Water comes from 300 m above village
14 Amarpur L 1220 Gadora Dasoli Chamoli Water comes from 100 m above village
15 Bheerd L 1450 Gadora Dasoli Chamoli Water comes from 200 m above village
16 Chantoli L 1290 Kiroli Dasoli Chamoli Water comes from 1.5 km above village
17 Kiroli-1 L 1331 Kiroli Dasoli Chamoli Water comes from 200 m above village
18 Kiroli-2 L 1359 Kiroli Dasoli Chamoli Water comes from 200 m above village
19 Kunri L 1320 Kiroli Dasoli Chamoli water comes from 2 km above village
20 Raancoat L 1308 Kiroli Dasoli Chamoli Water comes from 500 m above village
Page 1 of 5

Annex 3.7.2
SL Name of Villages
River Bank
Elevation (m)
Name of Panchayat
Name of Block
Name of Tehsil Drinking water Comes
21 Dhan Gwar L 1467 Pakhi Joshimath Joshimath Water comes from 6 km above
village
22 Jal Gwar L 1645 Pakhi Joshimath Joshimath Water comes from Chatna, distance village is 3 km
23 Pakhi L 1372 Pakhi Joshimath Joshimath Water comes from Garurganga River
24 Siyasen R 1069 Jaensal Dasoli Chamoli Water comes from Nagra,Distance village is 1.5 km
25 Jaisal R 1255 Jaensal Dasoli Chamoli Water comes from Nagra,Distance village is 1.5 km
26 Hat R 1075 Haat Dasoli Chamoli Comes of water is Thani which is appx. 1 km above village
27 Tangni Talli L 1470 Tangni Dasoli Chamoli
water comes from 50 m above village (little water fall) & also through pipeline which is 6 km above village
28 Tangni Malli L 1547 Tangni
malli Dasoli Chamoli water comes from 200 m above village (little water fall) & also through pipeline which is 6 km above village
29 Langsi L 1345 Langsi Dasoli Chamoli water comes from 2 km above village
30 Palada L 1299 Langsi Joshimath Joshimath Water comes from 3 km above village
31 Gulab Koti L 1507 Gulabkoti Joshimath Joshimath
Water comes from 100mt above village
32 Patalganga L 1451 Ganai Joshimath Joshimath
Water comes from 8 km above village
33 Noligolat L 1451 Ganai Joshimath Joshimath Water comes from 8 km above village
Page 2 of 5

Annex 3.7.2
SL Name of Villages
River Bank
Elevation (m)
Name of Panchayat
Name of Block
Name of Tehsil Drinking water Comes
34 Kona L 1451 Ganai Joshimath Joshimath Water comes from 5 km above village
35 Darmi L 1557 Ganai Joshimath Joshimath Water comes from 7 km above village
36 Durgapur R 1063 Bowla Dasoli Chamoli Water comes from 5 km above village
37 Tapon R 1280 Dweeng Joshimath Joshimath Water comes from Kolgad (Kimana) , Distance from villlage 6 km
38 Dweeng R 1550 Dweeng Joshimath Joshimath Water comes from Kolgad (Kimana) Distance village is 6km
39 Pokhani R 1471 Lanji Joshimath Joshimath
Hyuna nala
40 Lanji R 1376 Lanji Joshimath Joshimath
Hyuna nala
41 Hyuna R 1117 Lanji Joshimath Joshimath
Hyuna nala
42 Tanduli R 1220 Bemru Dasoli Chamoli Water comes from Pipalkoti through pipeline
43 Maath R 1479 Bemru Dasoli Chamoli Ganpani nala
44 Helong L 1507 Helong Joshimath Joshimath Karmanasha Nala
45 Pipalkoti L 1259 Naurakh Dasoli Chamoli Water comes from 200 meter above village
46 Batula L 1160 Mayapur Dasoli Chamoli Water comes from 1 km above village
Page 3 of 5

Annex 3.7.2
SL Name of Villages
River Bank
Elevation (m)
Name of Panchayat
Name of Block
Name of Tehsil Drinking water Comes
47 Kamyar L 1406 Kamyar Dasoli Chamoli Water comes from 500 m above village
48 Pagnau L 1510 Pagnau Joshimath Joshimath water comes from 2 KM above village
49 Mayapur L 1240 Batula Dasoli Chamoli water comes from 1 km above village
50 Naurakh L 1310 Naurakh Dasoli Chamoli water comes from 200 meter above village
51 Seun R 1447 Seun Dasoli Chamoli Water comes from 500 meter above village
52 Dharagi L 1550 Pakhi Joshimath Joshimath Water comes from 500 meter above village
53 Premnagar L 1529 Pakhi Joshimath Joshimath Water comes from Garurganga
River
54 Naulli/ Kawna L 1451 Ganai Joshimath Joshimath
Water comes 8 km above village
55 Ganai Talli L 1802 Ganai Joshimath Joshimath Water comes from 8 km above
village
56 Ganai Malli L 1879 Ganai Joshimath Joshimath Water comes from 8 km above
village
57 Tirosi R 1126 Lanji Joshimath Joshimath Water comes from Kolgad (Kimana),Distance village 8 KM
58 Kimana R 2438 Kimana Joshimath Joshimath water comes from 2 km above village
59 Palla R 2471 Palla Joshimath Joshimath water comes from 2 km above village
Page 4 of 5

Annex 3.7.2
SL Name of Villages
River Bank
Elevation (m)
Name of Panchayat
Name of Block
Name of Tehsil Drinking water Comes
60 Guniyala R 1213 Baimru Dasoli Chamoli Water comes from Ludaun Gadera,Distance village is 5 km
61 Baimaru R 1588 Baimru Dasoli Chamoli Water comes from Chanmoga, Distance village is 4 km
62 Surenda R 1545 Baimru Dasoli Chamoli Ganpani nala
63 Kanda R 1875 Baimru Dasoli Chamoli Ganpani nala
64 Bedumathal R 1739 Baimru Dasoli Chamoli Ganpani nala
65 Bajni R 1739 Baimru Dasoli Chamoli Ganpani nala
66 Jharita R 1680 Baimru Dasoli Chamoli Ganpani nala
Page 5 of 5

Project : Environmental Studies for Vishnugad Pipalkoti Hydro-Electric Project Page:1 of 11 Document : 2008026/EC/Final Report Date: Nov 2009 Annex-3.8.1 : Aquatic Ecology Revision: R4
Annex-3.8.1
Table-1 Fish dwelling in the Alaknanda River in the stretch of VPHEP S.No. Zoological Name Conservation Status
1. Schizothorax richardsonii Gray Abundant 2. Schizothoraichthys progastus McClelland Vulnerable 3. Tor tor Hamilton Endangered 4. Tor putitora Hamilton Endangered 5. Crossocheilus latius latius Hamilton Lower Risk 6. Garra gotyla gotyla Gray Abundant 7. Garra lamta Hamilton Lower Risk 8. Barilius bendelisis Hamilton Abundant 9. Barilius bola Hamilton Abundant 10. Barilius vagra Hamilton Abundant 11. Barilius barna Hamilton Abundant 12. Puntius sophore Hamilton Lower Risk 13. Puntius chilinoides McClelland Lower Risk 14. Glyptothorax pectinopterus McClelland Abundant 15. Glyptothorax madraspatanum Day Lower Risk 16. Pseudecheneis sulcatus McClelland Vulnerable 17. Noemacheilus montanus McClelland Abundant 18. Noemacheilus bevani Gunther Abundant 19. Noemacheilus multifasciatus Day Abundant 20. Noemacheilus zonatus McClelland Abundant
Table-2 Diversity, Frequency, Density (ind.m-2), Abundance and Diversity Index of
Periphyton in Alaknanda River at Sampling site S1 of VPHEP Periphyton
Frequency (%)
Density (ind.m-2)
Abundance
Diversity index (Shannon-Weiner)
Bacillariophyceae Tabellaria fenestris 80 240 12 0.368 Fragillaria inflata 80 230 11.5 0.359 Meridion circulare 60 50 0.133 Nitzschia sp. 60 210 14 0.342 Navicula radiosa 80 310 15.5 0.417 Cymbella cistula 60 240 16 0.368 Synedra ulna 60 45 3 0.123 Gomphonema sp. 80 225 11.25 0.355 Denticula sp. 40 15 1.5 0.053 Diatoma vulgaris 60 100 6.67 0.216 Chlorophyceae Ulothrix zonata 60 40 2.67 0.113 Zygnema sp. 40 25 2.5 0.079 Cladophora sp. 60 45 3 0.123 Closterium leibleinii 80 30 1.5 0.091 Spirogyra sp. 60 80 5.33 0.186 Myxophyceae Anabaena sp. 60 35 2.33 0.102 Phormidium sp. 80 50 2.5 0.133 Oscillatoria tenuis 40 25 2.5 0.079
Total 1995 H = 3.643

Project : Environmental Studies for Vishnugad Pipalkoti Hydro-Electric Project Page:2 of 11 Document : 2008026/EC/Final Report Date: Nov 2009 Annex-3.8.1 : Aquatic Ecology Revision: R4
Table-3 Diversity, Frequency, Density (ind. l-1), Abundance and Diversity Index of Phytoplankton in Alaknanda River at Sampling site S1 of VPHEP
Phytoplankton
Frequency (%)
Density (ind. l-1)
Abundance
Diversity index (Shannon-Weiner)
Bacillariophyceae Tabellaria fenestris 60 2.8 4.7 0.420 Fragillaria inflata 80 4.4 5.5 0.498 Nitzschia sp. 60 2 3.3 0.354 Gomphonema sp. 60 1.4 2.3 0.289 Chlorophyceae Ulothrix zonata 80 1.4 1.8 0.289 Spirogyra sp. 60 3.2 5.3 0.445 Myxophyceae Anabaena sp. 60 35 2.33 0.102 Oscillatoria tenuis 40 1 2.5 0.233
Total 17.8 H = 2.840
Table-4 Diversity, Frequency, Density (ind. l-1), Abundance and Diversity Index of Zooplankton in Alaknanda River at Sampling site S1 of VPHEP
Zooplankton
Frequency (%)
Density (ind. l-1)
Abundance
Diversity index (Shannon-Weiner)
Cladocera Daphnia sp. 40 2.2 5.5 0.449 Ceriodaphnia sp. 60 1.8 3 0.411
Copepoda Cyclops sp. 60 3.4 5.67 0.516
Rotifera Keratella sp. 40 1.6 4 0.388 Asplanchna sp. 40 3 7.5 0.500
Total 12 H = 2.262
Table-5 Diversity, Frequency, Density (ind.m-2), Abundance and Diversity Index of Macrozoo Benthos in Alaknanda River at Sampling site S1 of VPHEP
Macrozoobenthos
Frequency (%)
Density (ind.m-2)
Abundance
Diversity index (Shannon-Weiner)
Ephemeroptera Baetis niger 80 235 11.75 0.403 Baetis rhodoni 60 115 7.67 0.270 Caenis horaria 60 135 9 0.298 Centroptilum luteolum 60 65 4.33 0.186 Ephemerella ignita 60 65 4.33 0.186 Heptagenia sulphurea 100 415 16.6 0.503 Trichoptera Brachycentrus sp. 80 150 7.5 0.317 Glossosoma sp. 80 90 4.5 0.231 Hydropsyche fulvipes 60 75 5 0.205 Leptocella sp. 40 35 3.5 0.119 Philopotamus montanus 60 40 2.67 0.132 Diptera

Project : Environmental Studies for Vishnugad Pipalkoti Hydro-Electric Project Page:3 of 11 Document : 2008026/EC/Final Report Date: Nov 2009 Annex-3.8.1 : Aquatic Ecology Revision: R4
Macrozoobenthos
Frequency (%)
Density (ind.m-2)
Abundance
Diversity index (Shannon-Weiner)
Antocha sp. 60 70 4.67 0.195 Chironomus sp. 40 25 2.5 0.092 Tendipes tentans 60 60 4 0.176 Coleoptera Amphizoa sp. 40 50 5 0.155
Total 1625 H = 3.469
Table-6 Inventory of Fish Dwelling in the Patalganga (S2), a Tributary of the River Alaknanda in the stretch of VPHEP
S.No. Zoological Name Conservation Status 1. Schizothorax richardsonii Gray Abundant 2. Schizothoraichthys progastus McClelland Vulnerable 5. Crossocheilus latius latius Hamilton Lower Risk 6. Garra gotyla gotyla Gray Abundant 7. Barilius bendelisis Hamilton Abundant 8. B. bola Hamilton Abundant 9. B. barila Hamilton Abundant
10. B. barna Hamilton Abundant 11. Puntius sophore Hamilton Lower Risk 12. Puntius chilinoides McClelland Lower Risk 13. Glyptothorax pectinopterus McClelland Abundant 14. Glyptothorax madraspatanum Day Lower Risk 15. Pseudecheneis sulcatus McClelland Vulnerable 16. Noemacheilus montanus McClelland Abundant 17. Noemacheilus multifasciatus Day Abundant
Table-7 Diversity, Frequency, Density (ind.m-2), Abundance and Diversity Index of Periphyton in Alaknanda River at Sampling site S2 of VPHEP
Periphyton
Frequency (%)
Density (ind.m-2)
Abundance
Diversity index (Shannon-Weiner)
Bacillariophyceae Tabellaria fenestris 80 260 13 0.363 Fragillaria inflate 80 245 12.25 0.352 Meridion circulare 60 60 - 0.141 Nitzschia sp. 60 225 15 0.336 Navicula radiosa 80 315 15.75 0.401 Cymbella cistula 60 230 15.33 0.340 Synedra ulna 60 65 4.33 0.150 Gomphonema sp. 80 170 8.5 0.285 Denticula sp. 40 30 3 0.084 Diatoma vulgaris 60 90 6 0.188 Chlorophyceae Ulothrix zonata 60 70 4.67 0.158 Zygnema sp. 60 45 3 0.114 Cladophora sp. 60 45 3 0.114 Closterium leibleinii 80 40 2 0.104 Spirogyra sp. 60 110 7.33 0.215
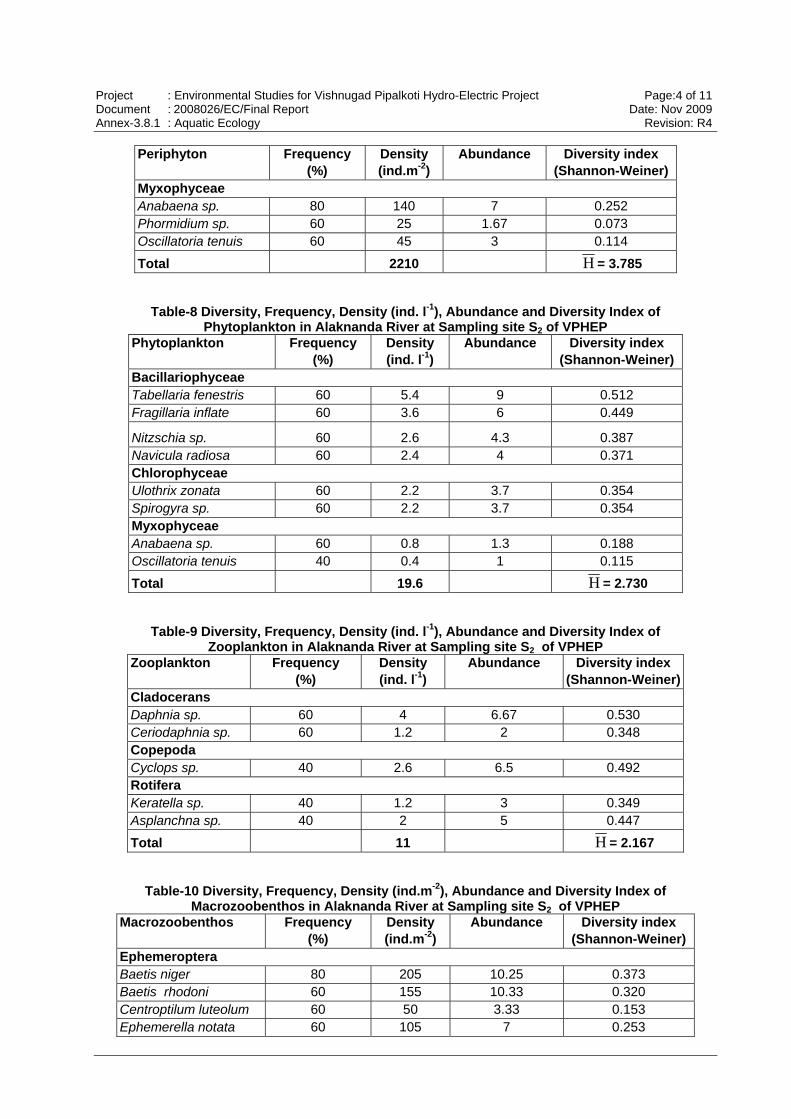
Project : Environmental Studies for Vishnugad Pipalkoti Hydro-Electric Project Page:4 of 11 Document : 2008026/EC/Final Report Date: Nov 2009 Annex-3.8.1 : Aquatic Ecology Revision: R4
Periphyton
Frequency (%)
Density (ind.m-2)
Abundance
Diversity index (Shannon-Weiner)
Myxophyceae Anabaena sp. 80 140 7 0.252 Phormidium sp. 60 25 1.67 0.073 Oscillatoria tenuis 60 45 3 0.114
Total 2210 H = 3.785
Table-8 Diversity, Frequency, Density (ind. l-1), Abundance and Diversity Index of Phytoplankton in Alaknanda River at Sampling site S2 of VPHEP
Phytoplankton
Frequency (%)
Density (ind. l-1)
Abundance
Diversity index (Shannon-Weiner)
Bacillariophyceae Tabellaria fenestris 60 5.4 9 0.512 Fragillaria inflate 60 3.6 6 0.449
Nitzschia sp. 60 2.6 4.3 0.387 Navicula radiosa 60 2.4 4 0.371 Chlorophyceae Ulothrix zonata 60 2.2 3.7 0.354 Spirogyra sp. 60 2.2 3.7 0.354 Myxophyceae Anabaena sp. 60 0.8 1.3 0.188 Oscillatoria tenuis 40 0.4 1 0.115
Total 19.6 H = 2.730
Table-9 Diversity, Frequency, Density (ind. l-1), Abundance and Diversity Index of Zooplankton in Alaknanda River at Sampling site S2 of VPHEP
Zooplankton
Frequency (%)
Density (ind. l-1)
Abundance
Diversity index (Shannon-Weiner)
Cladocerans Daphnia sp. 60 4 6.67 0.530 Ceriodaphnia sp. 60 1.2 2 0.348 Copepoda Cyclops sp. 40 2.6 6.5 0.492 Rotifera Keratella sp. 40 1.2 3 0.349 Asplanchna sp. 40 2 5 0.447
Total 11 H = 2.167
Table-10 Diversity, Frequency, Density (ind.m-2), Abundance and Diversity Index of Macrozoobenthos in Alaknanda River at Sampling site S2 of VPHEP
Macrozoobenthos
Frequency (%)
Density (ind.m-2)
Abundance
Diversity index (Shannon-Weiner)
Ephemeroptera Baetis niger 80 205 10.25 0.373 Baetis rhodoni 60 155 10.33 0.320 Centroptilum luteolum 60 50 3.33 0.153 Ephemerella notata 60 105 7 0.253

Project : Environmental Studies for Vishnugad Pipalkoti Hydro-Electric Project Page:5 of 11 Document : 2008026/EC/Final Report Date: Nov 2009 Annex-3.8.1 : Aquatic Ecology Revision: R4
Macrozoobenthos
Frequency (%)
Density (ind.m-2)
Abundance
Diversity index (Shannon-Weiner)
Heptagenia sulphurea 100 250 10 0.412 Trichoptera Brachycentrus sp. 80 180 9 0.348 Ecnomus sp. 40 30 3 0.105 Glossosoma sp. 80 55 2.75 0.163 Hydropsyche fulvipes 60 55 3.67 0.163 Leptocella sp. 60 40 2.67 0.130 Limnephilous sp. 60 220 14.67 0.387 Philopotamus montanus 60 70 4.67 0.193 Diptera Antocha saxicola 40 40 4 0.130 Atherix sp. 60 45 3 0.141 Chironomus sp. 60 45 3 0.141 Simulium sp. Tendipes tentans 60 45 3 0.141 Coleoptera Amphizoa leconte 60 65 4.33 0.183
Total 1655 H = 3.737
Table-11 Inventory of Fish Dwelling in the Garur Ganga, Tributary of the River Alaknanda in the stretch of VPHEP
S.No. Zoological Name Conservation Status 1. Barilius bendelisis Hamilton Abundant 2. B. bola Hamilton Abundant 3. B. barila Hamilton Abundant 4. B. vagra Hamilton Abundant 5. B. barna Hamilton Abundant 6 Noemacheilus montanus McClelland Abundant 7. Noemacheilus rupicola McClelland Abundant 8. Noemacheilus savona Hamilton Abundant 9. Noemacheilus multifasciatus Day Abundant 10. Noemacheilus zonatus McClelland Abundant
Table-12 Diversity, Frequency, Density (ind.m-2), Abundance and Diversity Index of Periphyton in Alaknanda River at Sampling site S3 of VPHEP
Periphyton
Frequency (%)
Density (ind.m-2)
Abundance
Diversity index (Shannon-Weiner)
Bacillariophyceae Tabellaria fenestris 80 300 15 0.394 Fragillaria inflata 60 190 12.67 0.307 Meridion sp. 60 70 4.67 0.160 Nitzschia sp. 60 190 12.67 0.307 Navicula radiosa 80 195 9.75 0.312 Cymbella cistula 60 180 12 0.298 Synedra sp. 60 70 4.67 0.160 Gomphonema sp. 60 190 12.67 0.307 Denticula sp. 60 55 3.67 0.134

Project : Environmental Studies for Vishnugad Pipalkoti Hydro-Electric Project Page:6 of 11 Document : 2008026/EC/Final Report Date: Nov 2009 Annex-3.8.1 : Aquatic Ecology Revision: R4
Periphyton
Frequency (%)
Density (ind.m-2)
Abundance
Diversity index (Shannon-Weiner)
Diatoma vulgaris 60 85 5.67 0.183 Chlorophyceae Ulothrix zonata 60 110 7.33 0.218 Zygnema sp. 40 45 4.5 0.116 Cladophora sp. 60 65 4.33 0.151 Closterium leibleinii 60 50 3.33 0.125 Spirogyra sp. 60 155 10.33 0.272 Myxophyceae Anabaena sp. 60 100 6.67 0.204 Phormidium sp. 60 70 4.67 0.160 Oscillatoria tenuis 60 55 3.67 0.133
Grand Total 2175 H = 3.939
Table-13 Diversity, Frequency, Density (ind. l-1), Abundance and Diversity Index of Phytoplankton in Alaknanda River at Sampling site S3 of VPHEP
Phytoplankton
Frequency (%)
Density (ind. l-1)
Abundance
Diversity index (Shannon-Weiner)
Bacillariophyceae Tabellaria fenestris 60 2.4 4 0.340 Nitzschia sp. 80 5.8 7.3 0.501 Cymbella cistula 60 2.4 4 0.340 Navicula radiosa 60 4 6.7 0.439 Gomphonema sp. 80 3.2 4 0.396 Chlorophyceae Ulothrix zonata 40 1.6 4 0.268 Spirogyra sp. 60 2.4 4 0.340 Myxophyceae Oscillatoria tenuis 40 1.2 3 0.222
Total 23 H = 2.846
Table-14 Diversity, Frequency, Density (ind. l-1), Abundance and Diversity Index of Zooplankton in Alaknanda River at Sampling site S3 of VPHEP
Zooplankton
Frequency (%)
Density (ind. l-1)
Abundance
Diversity index (Shannon-Weiner)
Cladocerans Daphnia sp. 60 2.2 3.67 0.481 Ceriodaphnia sp. 60 1.8 3 0.445 Copepods Cyclops sp. 60 3.2 5.33 0.526 Rotifera Keratella sp. 40 1 2.5 0.332 Asplanchna sp. 60 1.8 3 0.445
Total 10 H = 2.229

Project : Environmental Studies for Vishnugad Pipalkoti Hydro-Electric Project Page:7 of 11 Document : 2008026/EC/Final Report Date: Nov 2009 Annex-3.8.1 : Aquatic Ecology Revision: R4
Table-15 Diversity, Frequency, Density (ind.m-2), Abundance and Diversity Index of Macrozoobenthos in Alaknanda River at Sampling site S3 of VPHEP
Macrozoobenthos
Frequency (%)
Density (ind.m-2)
Abundance
Diversity index (Shannon-Weiner)
Ephemeroptera Baetis niger 100 300 12 0.403 Baetis rhodoni 80 170 8.5 0.295 Centroptilum sp. 60 50 3.33 0.129 Ephemerella notata 60 105 7 0.217 Heptagenia sp. 100 250 10 0.367 Ironodes sp. 80 160 8 0.285 Trichoptera Brachycentrus sp. 100 220 8.8 0.343 Ecnomus sp. 40 30 3 0.088 Glossosoma sp. 80 80 4 0.181 Hydropsyche fulvipes. 80 160 8 0.285 Leptocella sp. 60 40 2.67 0.110 Limnephilous sp. 80 75 3.75 0.173 Philopotamus sp. 60 40 2.67 0.110 Diptera Antocha saxicola 40 40 4 0.110 Atherix sp. 80 90 4.5 0.196 Chironomus sp. 60 40 2.67 0.110 Simulium sp. 60 85 5.67 0.189 Tendipes tentans 60 45 3 0.120 Plecoptera Perla sp. 60 55 3.67 0.139 Isogenus sp. 60 45 3 0.120
Total 2080 H = 3.967
Table-16 Diversity, Frequency, Density (ind.m-2), Abundance and Diversity Index of Periphyton in Alaknanda River at Sampling site S4 of VPHEP
Periphyton
Frequency (%)
Density (ind.m-2)
Abundance
Diversity index (Shannon-Weiner)
Bacillariophyceae Tabellaria fenestris 60 240 16 0.370 Fragillaria inflata 80 245 12.25 0.374 Nitzschia sp. 60 225 15 0.358 Navicula radiosa 80 185 9.25 0.320 Chaetomorpha sp. 40 40 4 0.114 Cymbella cistula 60 220 14.67 0.353 Gomphonema sp. 60 160 10.67 0.294 Diatoma vulgaris 60 60 4 0.153 Chlorophyceae Ulothrix zonata 60 110 7.33 0.232 Zygnema sp. 40 40 4 0.114 Cladophora sp. 60 40 2.67 0.114 Closterium sp. 60 80 5.33 0.188 Spirogyra sp. 60 135 9 0.265 Myxophyceae Anabaena sp. 60 85 5.67 0.196

Project : Environmental Studies for Vishnugad Pipalkoti Hydro-Electric Project Page:8 of 11 Document : 2008026/EC/Final Report Date: Nov 2009 Annex-3.8.1 : Aquatic Ecology Revision: R4
Periphyton
Frequency (%)
Density (ind.m-2)
Abundance
Diversity index (Shannon-Weiner)
Phormidium sp. 60 55 3.67 0.144 Oscillatoria tenuis 60 50 3.33 0.135
Total 1970 H = 3.724
Table-17 Diversity, Frequency, Density (ind. l-1), Abundance and Diversity Index of Phytoplankton in Alaknanda River at Sampling site S4 of VPHEP
Phytoplankton
Frequency (%)
Density (ind. l-1)
Abundance
Diversity index (Shannon-Weiner)
Bacillariophyceae Tabellaria fenestris 60 3.2 5.3 0.415 Fragillaria inflata 80 3.6 4.5 0.438 Nitzschia sp. 60 2.4 4 0.359 Navicula radiosa 60 4.6 7.7 0.481 Chlorophyceae Ulothrix zonata 40 2.4 6 0.359 Cladophora sp. 60 2.8 4.7 0.389 Spirogyra sp. 60 1.8 3 0.306
Total 20.8 H = 2.749
Table-18 Diversity, Frequency, Density (ind. l-1), Abundance and Diversity Index of Zooplankton in Alaknanda River at Sampling site S4 of VPHEP
Zooplankton
Frequency (%)
Density (ind. l-1)
Abundance
Diversity index (Shannon-Weiner)
Cladocera Daphnia sp. 40 1.2 3 0.388 Ceriodaphnia sp. 60 1.6 2.67 0.443 Copepoda Cyclops sp. 60 3 5 0.528 Rotifera Keratella sp. 40 1.4 3.5 0.418 Asplanchna sp. 60 1.8 3 0.427
Total 9 H = 2.204
Table-19 Diversity, Frequency, Density (ind.m-2), Abundance and Diversity Index of Macrozoobenthos in Alaknanda River at Sampling site S4 of VPHEP
Macrozoobenthos
Frequency (%)
Density (ind.m-2)
Abundance
Diversity index (Shannon-Weiner)
Ephemeroptera Baetis niger 80 170 8.5 0.415 Baetis rhodoni 40 60 6 0.228 Centroptilum sp. 60 55 3.67 0.215 Ephemerella notata 80 80 4 0.273 Heptagenia sulphurea 80 235 11.75 0.474 Trichoptera Brachycentrus sp. 60 50 3.33 0.201 Glossosoma sp. 60 50 3.33 0.201 Hydropsyche fulvipes 60 75 5 0.263

Project : Environmental Studies for Vishnugad Pipalkoti Hydro-Electric Project Page:9 of 11 Document : 2008026/EC/Final Report Date: Nov 2009 Annex-3.8.1 : Aquatic Ecology Revision: R4
Macrozoobenthos
Frequency (%)
Density (ind.m-2)
Abundance
Diversity index (Shannon-Weiner)
Leptocella sp. 60 30 2 0.141 Philopotamus montanus 60 40 2.67 0.173 Diptera Antocha saxicola 40 65 6.5 0.240 Chironomus sp. 60 140 9.33 0.377 Tendipes tentans 80 35 1.75 0.157 Coleoptera Amphizoa leconte 60 25 1.67 0.123 Hemiptera Water bug 60 50 3.33 0.201
Total 1110 H = 3.481
Table-20 Fish Ewelling in the Birahi River, a Tributary of the River Alaknanda downstream VPHEP
S.No. Zoological Name Conservation Status 1. Schizothorax richardsonii Gray Abundant 2. Schizothoraichthys progastus McClelland Vulnerable 3. Tor tor Hamilton Endangered 4. Tor putitora Hamilton Endangered 5. Crossocheilus latius latius Hamilton Lower Risk 6. Garra gotyla gotyla Gray Abundant 7. Garra lamta Hamilton Lower Risk 8. Barilius bendelisis Hamilton Abundant 9. B. bola Hamilton Abundant 10. B. barila Hamilton Abundant 11. B. vagra Hamilton Abundant 12. B. barna Hamilton Abundant 13. Glyptothorax pectinopterus McClelland Abundant 14. Glyptothorax madraspatanum Day Lower Risk 15. Pseudecheneis sulcatus McClelland Vulnerable 16. Noemacheilus montanus McClelland Abundant 17. Noemacheilus multifasciatus Day Abundant 18. Noemacheilus zonatus McClelland Abundant
Table-21 Diversity, Frequency, Density (ind.m-2), Abundance and Diversity Index of Periphyton in Alaknanda River at Sampling site S5 of VPHEP
Periphyton
Frequency (%)
Density (ind.m-2)
Abundance
Diversity index (Shannon-Weiner)
Bacillariophyceae Tabellaria fenestris 80 255 12.75 0.371 Fragillaria inflate 60 190 12.67 0.315 Nitzschia sp. 80 340 17 0.427 Navicula radiosa 60 170 11.33 0.295 Chaetomorpha sp. 60 95 6.33 0.203 Cymbella cistula 60 145 9.67 0.268 Gomphonema sp. 80 235 11.75 0.355 Denticula sp. 60 45 3 0.120
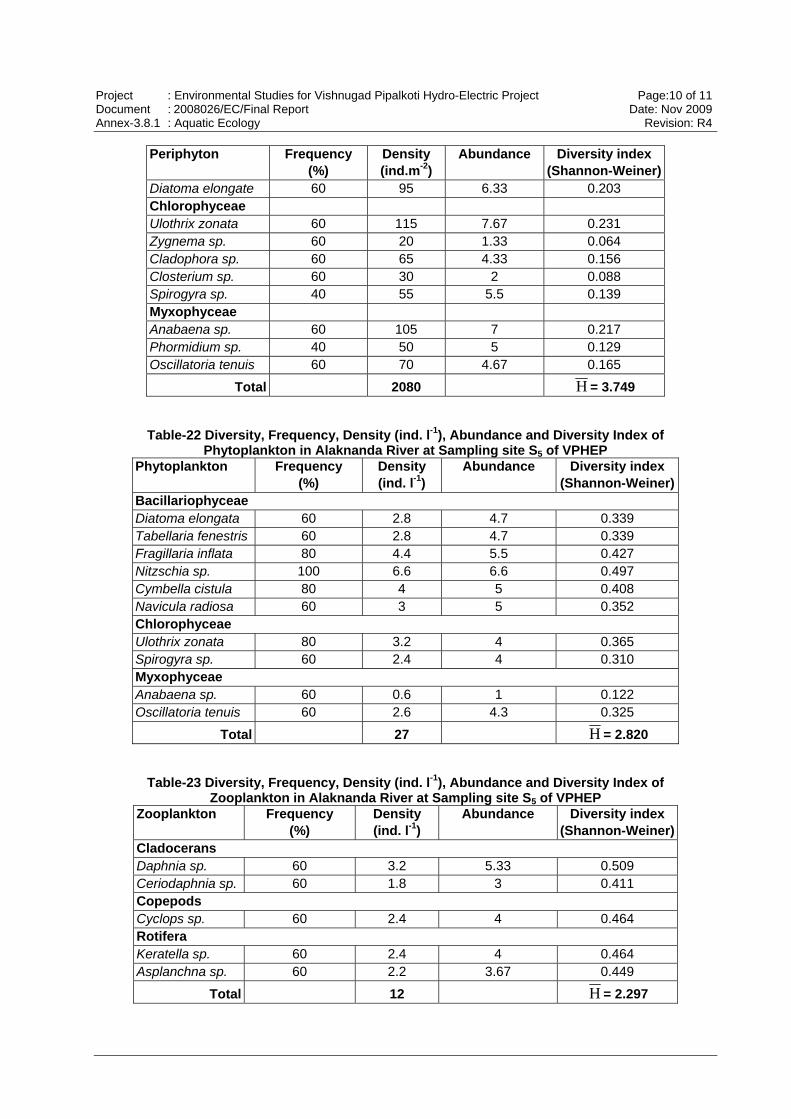
Project : Environmental Studies for Vishnugad Pipalkoti Hydro-Electric Project Page:10 of 11 Document : 2008026/EC/Final Report Date: Nov 2009 Annex-3.8.1 : Aquatic Ecology Revision: R4
Periphyton
Frequency (%)
Density (ind.m-2)
Abundance
Diversity index (Shannon-Weiner)
Diatoma elongate 60 95 6.33 0.203 Chlorophyceae Ulothrix zonata 60 115 7.67 0.231 Zygnema sp. 60 20 1.33 0.064 Cladophora sp. 60 65 4.33 0.156 Closterium sp. 60 30 2 0.088 Spirogyra sp. 40 55 5.5 0.139 Myxophyceae Anabaena sp. 60 105 7 0.217 Phormidium sp. 40 50 5 0.129 Oscillatoria tenuis 60 70 4.67 0.165
Total 2080 H = 3.749
Table-22 Diversity, Frequency, Density (ind. l-1), Abundance and Diversity Index of Phytoplankton in Alaknanda River at Sampling site S5 of VPHEP
Phytoplankton
Frequency (%)
Density (ind. l-1)
Abundance
Diversity index (Shannon-Weiner)
Bacillariophyceae Diatoma elongata 60 2.8 4.7 0.339 Tabellaria fenestris 60 2.8 4.7 0.339 Fragillaria inflata 80 4.4 5.5 0.427 Nitzschia sp. 100 6.6 6.6 0.497 Cymbella cistula 80 4 5 0.408 Navicula radiosa 60 3 5 0.352 Chlorophyceae Ulothrix zonata 80 3.2 4 0.365 Spirogyra sp. 60 2.4 4 0.310 Myxophyceae Anabaena sp. 60 0.6 1 0.122 Oscillatoria tenuis 60 2.6 4.3 0.325
Total 27 H = 2.820
Table-23 Diversity, Frequency, Density (ind. l-1), Abundance and Diversity Index of Zooplankton in Alaknanda River at Sampling site S5 of VPHEP
Zooplankton
Frequency (%)
Density (ind. l-1)
Abundance
Diversity index (Shannon-Weiner)
Cladocerans Daphnia sp. 60 3.2 5.33 0.509 Ceriodaphnia sp. 60 1.8 3 0.411 Copepods Cyclops sp. 60 2.4 4 0.464 Rotifera Keratella sp. 60 2.4 4 0.464 Asplanchna sp. 60 2.2 3.67 0.449
Total 12 H = 2.297

Project : Environmental Studies for Vishnugad Pipalkoti Hydro-Electric Project Page:11 of 11 Document : 2008026/EC/Final Report Date: Nov 2009 Annex-3.8.1 : Aquatic Ecology Revision: R4
Table-24 Diversity, Frequency, Density (ind.m-2), Abundance and diversity Index of Macrozoobenthos in Alaknanda River at Sampling site S5 of VPHEP
Macrozoobenthos
Frequency (%)
Density (ind.m-2)
Abundance
Diversity index (Shannon-Weiner)
Ephemeroptera Baetis niger 100 205 8.2 0.385 Baetis rhodoni 80 95 4.75 0.246 Caenis sp. 60 45 3 0.148 Centroptilum sp. 60 40 2.67 0.136 Ephemerella ignita 80 105 5.25 0.262 Heptagenia sulphurea 100 200 8 0.380 Ironodes sp. 80 105 5.25 0.262 Leptophlebia sp. 80 90 4.5 0.237 Psephenus sp. 40 25 2.5 0.096 Trichoptera Glossosoma sp. 80 75 3.75 0.211 Hydropsyche fulvipes 80 110 5.5 0.270 Leptocella sp. 60 40 2.67 0.136 Limnephilous sp. 60 90 6 0.237 Philopotamus montanus 60 20 1.33 0.081 Rhyacophila sp. 60 50 3.33 0.159 Diptera Antocha saxicola 60 40 2.67 0.136 Atherix sp. 60 40 2.67 0.136 Chironomus sp. 60 40 2.67 0.136 Simulium sp. 60 40 2.67 0.136 Plecoptera Perla sp. 80 30 1.5 0.110 Isogenus sp. 40 20 2 0.081 Neuroptera
Corydalus sp. 80 55 2.75 0.170
Total 1560 H = 3.976

Project : Environmental Studies for Vishnugad Pipalkoti Hydro-Electric Project Page:1 of 8 Document : 2008026/EC/Final Report Date: Nov 2009 Annex-3.9.1 : Format for Terrestrial Biodiversity Assessment Revision: R4
Annex-3.9.1
Format for Flora Assessment
Date: Sheet No: Forest Compartment: Site Details: Site Approachable/ Not Approachable: Village: Roads: 1.1 Physical Features:
(a) Geography : (b) Geology & Soil: (c) Climate : (d) Water source : (e) Forest Reserved/ Unreserved:
1.2 Plant Communities SPS (Major Associations)
1.3 Plant Communities Dominant SPS

Project : Environmental Studies for Vishnugad Pipalkoti Hydro-Electric Project Page:2 of 8 Document : 2008026/EC/Final Report Date: Nov 2009 Annex-3.9.1 : Format for Terrestrial Biodiversity Assessment Revision: R4
Format for Ecological Features of Vegetation
Name of Species Ecology S. No.
Scientific Common Habit Habitat Nature Distribution

Project : Environmental Studies for Vishnugad Pipalkoti Hydro-Electric Project Page:3 of 8 Document : 2008026/EC/Final Report Date: Nov 2009 Annex-3.9.1 : Format for Terrestrial Biodiversity Assessment Revision: R4
Format for Major Uses of Trees
Name of Tree Fencing Ornamental Avenue
Planting Fodder Fuel Timber Fruit

Project : Environmental Studies for Vishnugad Pipalkoti Hydro-Electric Project Page:4 of 8 Document : 2008026/EC/Final Report Date: Nov 2009 Annex-3.9.1 : Format for Terrestrial Biodiversity Assessment Revision: R4
Format for Medicinal Plants
Name of Species S.
No. Scientific Local
Chemical Property
Part of Plant Use
Use against Disease
Collection Period

Project : Environmental Studies for Vishnugad Pipalkoti Hydro-Electric Project Page:5 of 8 Document : 2008026/EC/Final Report Date: Nov 2009 Annex-3.9.1 : Format for Terrestrial Biodiversity Assessment Revision: R4
Format for Phenology of Major Species of Forest
Name of Species S.
No. Scientific Local
Colour of Flower
Flowering period
Mode of Pollination

Project : Environmental Studies for Vishnugad Pipalkoti Hydro-Electric Project Page:6 of 8 Document : 2008026/EC/Final Report Date: Nov 2009 Annex-3.9.1 : Format for Terrestrial Biodiversity Assessment Revision: R4
Structure of Forest
Name of Species S.
No. Scientific Common
Density
Tree/100
sqm
Relative
Density
(%)
Relative
Frequency
(%)
Relative
Abundance
(%)
Importance
Value
Index (%)

Project : Environmental Studies for Vishnugad Pipalkoti Hydro-Electric Project Page:7 of 8 Document : 2008026/EC/Final Report Date: Nov 2009 Annex-3.9.1 : Format for Terrestrial Biodiversity Assessment Revision: R4
Format for Fauna Assessment
Date: Sheet No: 1.1 Forest Compartment: Natural /Reserved/ Protected 1.2 Site Details: 1.3 Village: Roads: 1.4 Physical Features : Major/ Minor Habitats
1.5 Animal Communities :
Direct : Sighting / Observation
Indirect : Claw mark, Dropping, Calls, Hiding sites, Horns, Feathers any other records
1.6 Discussions with local peoples/ institutions regarding occurrence of wild animals in the
area 1.7 Any record of Endangered, Rare, Endemic or Threatened Wildlife 1.8 Any records of wildlife hunting, trade, poaching in the area 1.9 Hunting of animal by people for medicine, food, trophy, or trade 1.10 Animals of Local Interest / Sacred Species/ Method of Protection followed by local
people

Project : Environmental Studies for Vishnugad Pipalkoti Hydro-Electric Project Page:8 of 8 Document : 2008026/EC/Final Report Date: Nov 2009 Annex-3.9.1 : Format for Terrestrial Biodiversity Assessment Revision: R4
Format for Fauna Study
Name of Species S.
No. Scientific Local
Mammals Reptiles Birds

Project : Environmental Studies for Vishnugad Pipalkoti Hydro-Electric Project Page:1 of 5 Document : 2008026/EC/Draft Consolidated EA Report Date: Nov 2009 Annex-3.11.1 : Relevant Indian Standards Revision: R4
Annex-3.11.1 RELEVANT INDIAN STANDARDS
Table-1 Tolerance Limits for Inland Surface Waters (as per IS:2296)
SN Parameter and Unit Class-A Class-B Class-C Class-D Class-E1. Colour (Hazen Units) 10 300 300 - -2. Odour Unobject - - - -3. Taste Tasteless - - - -4. pH (max) (min:6.5) 8.5 8.5 8.5 8.5 8.55. Conductivity (25oC) (µmhos/cm) - - - 1000 22506. DO (mg/L)(min) 6 5 4 4 -7. BOD (3 days at 27oC) (mg/L) 2 3 3 - -8. Total Coliforms (MPN/100 mL) 50 500 5000 - -9. TDS (mg/L) 500 - 1500 - 210010. Oil and Grease (mg/L) - - 0.1 0.1 -11. Mineral Oil (mg/L) 0.01 - - - -12. Free Carbon Dioxide (mg/L CO2) - - - 6 -13. Free Ammonia (mg/L as N) - - - 1.2 -14. Cyanide (mg/L as CN) 0.05 0.05 0.05 - -15. Phenol (mg/L C6H5OH) 0.002 0.005 0.005 - -16. Total Hardness (mg/L as CaCO3) 300 - - - -17. Chloride (mg/L as Cl) 250 - 600 - 60018. Sulphate (mg/L as SO4) 400 - 400 - 100019. Nitrate (mg/L as NO3) 20 - 50 - -20. Fluoride (mg/L as F) 1.5 1.5 1.5 - -21. Calcium (mg/L as Ca) 80 - - - -22. Magnesium (mg/L as Mg) 24.4 - - - -23. Copper (mg/L as Cu) 1.5 - 1.5 - -24. Iron (mg/L as Fe) 0.3 - 50 - -25. Manganese (mg/L as Mn) 0.5 - - - -26. Zinc (mg/L as Zn) 15 - 15 - -27. Boron (mg/L as B) - - - - 228. Barium (mg/L as Ba) 1 - - - -29. Silver (mg/L as Ag) 0.05 - - - -30. Arsenic (mg/L as As) 0.05 0.2 0.2 - -31. Mercury (mg/L as Hg) 0.001 - - - -32. Lead (mg/L as Pb) 0.1 - 0.1 - -33. Cadmium (mg/L as Cd) 0.01 - 0.01 - -34. Chromium (VI) (mg/L as Cr) 0.05 0.05 0.05 - -35. Selenium (mg/L as Se) 0.01 - 0.05 - -36. Anionic Detergents (mg/L MBAS) 0.2 1 1 - -37. PAH (mg/L) 0.2 - - - -38. Pesticides (µg/L) Absent - - - -39. Insecticides (mg/L) - - Absent - -40. Alpha Emitters (10-6µc/mL) 0.001 0.001 0.001 0.001 0.00141. Beta Emitters (10-6µc/mL) 0.01 0.01 0.01 0.01 0.0142. Percent Sodium (%) - - - - 6043. Sodium Absorption Ratio - - - - 26
Class-A: Drinking water source without conventional treatment but after disinfection. Class-B: Outdoor bathing. Class-C: Drinking water source with conventional treatment followed by disinfection. Class-D: Fish culture and wild life propagation. Class-E: Irrigation, industrial cooling and controlled waste disposal.

Project : Environmental Studies for Vishnugad Pipalkoti Hydro-Electric Project Page:2 of 5 Document : 2008026/EC/Draft Consolidated EA Report Date: Nov 2009 Annex-3.11.1 : Relevant Indian Standards Revision: R4
Table-2 Drinking Water Quality Standards (as per IS:10500) Sl. No.
Parameter and Unit Desirable Limit Permissible Limitin Absence of
Alternate Source1. Colour (Hazen units) 5 252. Odour Unobjectionable -3. Taste Agreeable -4. Turbidity (NTU) 5 105. pH 5-8.5 No relaxation6. Total Coliforms (MPN/100 mL) nil -7. Pathogenic Organisms or Virus nil -8. TDS (mg/L) 500 20009. Mineral Oil (mg/L) 0.01 0.0310. Free Residual Chlorine (mg/L) 0.2 -11. Cyanide (mg/L as CN) 0.05 No relaxation12. Phenol (mg/L C6H5OH) 0.001 0.00213. Total Hardness (mg/L as CaCO3) 300 60014. Total Alkalinity (mg/L as CaCO3) 200 60015. Chloride (mg/L as Cl) 250 100016. Sulphate (mg/L as SO4) 200 40017. Nitrate (mg/L as NO3) 45 10018. Fluoride (mg/L as F) 1 1.519. Calcium (mg/L as Ca) 75 20020. Magnesium (mg/L as Mg) 30 10021. Copper (mg/L as Cu) 0.05 1.522. Iron (mg/L as Fe) 0.3 123. Manganese (mg/L as Mn) 0.1 0.324. Zinc (mg/L as Zn) 5 1525. Boron (mg/L as B) 1 526. Aluminium (mg/L as AL) 0.03 0.227. Arsenic (mg/L as As) 0.05 No relaxation28. Mercury (mg/L as Hg) 0.001 No relaxation29. Lead (mg/L as Pb) 0.05 No relaxation30. Cadmium (mg/L as Cd) 0.01 No relaxation31. Chromium (VI) (mg/L as Cr) 0.05 No relaxation32. Selenium (mg/L as Se) 0.01 No relaxation33. Anionic Detergents (mg/L MBAS) 0.2 134. PAH (mg/L) nil -35. Pesticides (µg/L) Absent 0.00136. Alpha Emitters (10-6µc/mL) nil 0.000137. Beta Emitters (10-6µc/mL) nil 0.001

Project : Environmental Studies for Vishnugad Pipalkoti Hydro-Electric Project Page:3 of 5 Document : 2008026/EC/Draft Consolidated EA Report Date: Nov 2009 Annex-3.11.1 : Relevant Indian Standards Revision: R4
Table-3 General Standards for Discharge of Effluents [as per Environment (Protection) Rules, 1986]
Sl. No.
Parameter and Unit Inland Surface
Water
PublicSewers
Land for Irrigation
MarineCoastal
Water1. Temperature (oC) # - - #2. Colour and Odour $ - $ $3. pH 5.5-9.0 5.5-9.0 5.5-9.0 5.5-9.04. BOD (3 days at 27oC) (mg/L) 30 350 100 1005. COD (mg/L) 250 - - 2506. Bio-assey (% 96-hrs Survival) @ @ @ @7. TSS (mg/L) 100 600 200 100*8. SS Particlesize(pass IS
Sieve) 850 - - &
9. Oil and Grease (mg/L) 10 20 10 2010. Total Residual Chlorine
(mg/L) 1 - - 1
11. Nitrate Nitrogen (mg/L as N) 10 - - 2012. Ammonia Nitrogen (mg/L N) 50 50 - 5013. Kjeldahl Nitrogen (mg/L as N) 100 - - 10014. Free Ammonia (mg/L as N) 5 - - 515. Cyanide (mg/L as CN) 0.2 2 0.2 0.216. Phenol (mg/L C6H5OH) 1 5 - 517. Fluoride (mg/L as F) 2 15 - 1518. Sulphide (mg/L as S) 2 - - 519. Dissolved Phosphate (mg/L
P) 5 - - -
20. Copper (mg/L as Cu) 3 3 - 321. Iron (mg/L as Fe) 3 3 - 322. Manganese (mg/L as Mn) 2 2 - 223. Zinc (mg/L as Zn) 5 15 - 1524. Nickel (mg/L as Ni) 3 3 - 525. Vanadium (mg/L as V) 0.2 0.2 - 0.226. Arsenic (mg/L as As) 0.2 0.2 0.2 0.227. Mercury (mg/L as Hg) 0.01 0.01 - 0.0128. Lead (mg/L as Pb) 0.1 1 - 129. Cadmium (mg/L as Cd) 2 1 - 230. Chromium (VI) (mg/L as Cr) 0.1 2 - 131. Chromium (Total) (mg/L as
Cr) 2 2 - 2
32. Selenium (mg/L as Se) 0.05 0.05 - 0.0533. Alpha Emitters (10-6µc/mL) 0.1 0.1 0.01 0.134. Beta Emitters (10-6µc/mL) 1 1 0.1 1
# Shall not exceed 5oC above the receiving water temperature. $ All efforts should be made to remove colour and unpleasant odour as far as practicable. @ 90% survival of fish after 96 hours in 100% effluent. * For cooling water effluent 10% above TSS of influent. & (a) Floatable solids 3 mm, (b) Settleable solids 850 micron.

Project : Environmental Studies for Vishnugad Pipalkoti Hydro-Electric Project Page:4 of 5 Document : 2008026/EC/Draft Consolidated EA Report Date: Nov 2009 Annex-3.11.1 : Relevant Indian Standards Revision: R4
Table-4 General Emission Standards [as per Environment (Protection) Rules, 1986]
I. Concentration Based Standards
SN Parameter Standard (mg/Nm3)1. Particulate Matter (PM) 1502. Total Fluoride 253. Asbestos Fibres: 4 nos/cc, Dust: 2 mg/Nm3
4. Mercury 0.25. Chlorine 156. Hydrochloric acid vapour and mist 357. Sulphuric acid mist 508. Carbon Monoxide 1% max (v/v)9. Lead 10
II. Equipment Based Standards
(For dispersal of sulphur dioxide, minimum stack height limit is accordingly prescribed below) Power Generation Capacity (MW)
Steam Generation Capacity (T/h)
Coal Consumption (MT/day)
Minimum Stack Height Limit (m)
≥ 500 275≥ 200/210 and < 500 220< 200/210 H = 14 Q0.3
< 2 < 8.5 9 2 to 5 8.5 to 21 12 5 to 10 21 to 42 15 10 to 15 42 to 64 18 15 to 20 64 to 84 21 20 to 25 84 to 105 24 25 to 30 105 to 126 27 > 30 > 126 30 or using H = 14
Q0.3
Note: H = Physical height of the stack in metre, Q = Emission rate of SO2 in kg/hr
Table-5 National Ambient Air Quality Standards [as per Environment (Protection) Rules, 1986]
Concentration (µg/m3) in Ambient Air Pollutant Time Weighted Average
Industrial Area
Residential, Rural and Other Areas
Sensitive Area
Annual* 80 60 15Sulphur Dioxide (SO2) 24 Hours** 120 80 30Annual* 80 60 15Oxides of Nitrogen (as NO2) 24 Hours** 120 80 30Annual* 360 140 70Suspended Particulate Matter
(SPM) 24 Hours** 500 200 100Annual* 120 60 50Respirable Particulate Matter
(RPM) (size less than 10 µm) 24 Hours** 150 100 75Annual* 1 0.75 0.5Lead (Pb) 24 Hours** 1.5 1 0.75Annual* 100 100 100Ammonia
24 Hours** 400 400 4008 Hours** 5000 2000 1000Carbon Monoxide (CO) 1 Hour 10000 4000 2000
* Annual arithmetic mean of minimum 104 measurements in a year taken twice a week 24-hourly at uniform interval.

Project : Environmental Studies for Vishnugad Pipalkoti Hydro-Electric Project Page:5 of 5 Document : 2008026/EC/Draft Consolidated EA Report Date: Nov 2009 Annex-3.11.1 : Relevant Indian Standards Revision: R4
** 24-hourly/8-hourly values should be met 98% of the time in a year. However, 2% of the time, it may exceed but not on two consecutive days.
Table-6 Ambient Air Quality Standards in respect of Noise [as per Noise Pollution (Regulation and Control) Rules, 2000]
Limits in dB(A) Leq* Area Code
Category of Area Day Time Night Time
A Industrial Area 75 70 B Commercial Area 65 55 C Residential Area 55 45 D Silence Zone 50 40
Notes: 1. Day time shall mean from 6.00 a.m. to 10.00 p.m. 2. Night time shall mean from 10.00 p.m. to 6.00 a.m. 3. Silence zone is defined as an area comprising not less than 100 metres around hospitals,
educational institutions and courts. The silence zones are zones which are declared as such by the competent authority.
4. Mixed categories of areas may be declared as one of the four above mentioned categories by the competent authority.
* dB(A) Leq denotes the time weighted average of the level of sound in decibels on scale A which is relatable to human hearing.
Table-7 Permissible Exposure Levels of Impulse or Impact Noise for Work Zone Area
[as per Model Rules of Factories Act, 1948] Peak Sound Pressure Level in dB Permitted Number of Impulses or
Impacts/day140 100 135 315 130 1,000 125 3,160 120 10,000
Notes: 1. No exposure in excess of 140 dB peak sound pressure level is permitted. 2. For any peak sound pressure level falling in between any figure and the next higher or lower
figure as indicated in column 1, the permitted number of impulses or impacts per day is to be determined by extrapolation on a proportionate basis.
Table-8 Permissible Exposure in Case of Continuous Noise for Work Zone Area
[as per Model Rules of Factories Act, 1948] Total Time of Exposure (continuous or a number of
short term exposures) per day, in hr Permissible Sound Pressure
Level in dB(A)
8 90 6 92 4 95 3 97 2 100 1 102
1&1/2 105 1/2 107 1/4 110 1/8 115
Notes: 1. No exposure in excess of 115 dB(A) is to be permitted. 2. For any period of exposure falling in between any figure and the next higher or lower figure
as indicated in column 1, the permissible sound pressure level is to be determined by extrapolation on a proportionate basis.