
Fast graphical simulations of spills and plumes for application to the great lakes
Upload
khangminh22Category
view
3download
0
GREAT LAKES INSTITUTE OF MANAGEMENT
11th NASMEI CONFERENCE 2017
An International Marketing Conference

Marketing of financial services: Understanding low-income segment
for mobile banking services
Renu Aggarwal & Monica Rose
Fortune Institute of International Business, Delhi & YMCA University, Faridabad.
Inclusive growth is major challenge prevailing in India and is receiving ample attention from the
RBI, government and the banking sector to enable proper financial access to all sections of society.
But the fact is there is humungous gap in aspirational dream and the present state of realities
concerning the wide coverage and financial usage that is vital for inclusive growth. Also there are
variations in behaviors and attitude of people belonging to low income groups towards the use of
these financial services. So there is necessity to understand various kinds of requirements of
financial services by poor to be able to serve them better especially for the telecommunication
providers and financial institutions. The present study explores the behavior of low income
segment towards financial services offered and potential of innovative technology mobile banking
in facilitation of financial services to the poor. Apart from offering huge cost advantages to banks,
mobile banking provides wider reach and flexibility in availing services and suitable procedures
to deal with risks. These may propel the efforts of marketers, financial providers through direct or
indirect means in achieving better market coverage and reach to the poor bringing them in to
mainstream financial system and supporting in poverty alleviation and inclusive growth (Bansal,
2014).
Key Words: Marketing, Financial services, Low income segment, mobile banking
Understanding low segment and need for financial services
Financial inclusion is the fraction of people and businesses that use financial services (World
Bank, 2014). In 2013, the Governor of RBI (Reserve Bank of India) Raghuram Rajan on taking
office charge specified an urgent need for fast, broad based and diversified inclusive growth to
fight poverty. Admitting to the financial services accessibility issues to poor, rural and small and
medium industries he acknowledged financial inclusion as the major pillar for a uniform and
sustainable growth (Rajan 2013). The financial exclusive or unbanked low segment people
include those individuals who not have access to financial services such as having a formal bank
account and therefore the reliance on loan facility for their livelihood is extremely restricted. They
dwell on cash economy, sustain on savings and may conduct remote payments, and these
limitations can deter their economic prospects. It is estimated that such impediments may be
moderately tackled if financial services are accessible through the mobile phones (Medhi, et al.,
2009). The differential use of accounts worldwide can be explained through the variability in level
of income and different user characteristics (World Bank, 2014). India is a vast country with
varying demographics and economic landscapes that pose a big challenge to promote financial
inclusion (Myrold, A., 2014). The poor people have low and unsteady income often arriving in

small and mostly irregular manner. They can be a farmer with small holdings having seasonal
income or daily wage worker or labor without definite employment. If for some reason a crisis
situation arises then it can simply devastate their earnings, like a grave sickness or death of family
member, or natural disasters like floods and droughts. The goal of finance therefore is to support
the poor in maintaining a household and have a planned approach towards investments to ascertain
proper housing, education, or improved production in the light of unpredictable income and
random disrupting events. In other words it can be stated that more a household is poor, greater is
the need for financial mechanisms to necessitate managing their lives (Dermish, et al., 2011). The
segmentation of poor people in India comprises basically of four groups which are urban and rural
households, and urban and rural micro, small, and medium-sized enterprises. Among the rural
families most of them are involved in agriculture and other associated activities. The Migrated and
cyclical workers swing between farming and urban labor while MSMEs are also significant rural
actors. In urban regions, individuals in lower income households, also comprising migrant people,
are involved as daily wage workers at low rates and in MSMEs operations (Myrold, A., 2014).
India seeks inclusive growth to lift a big section of its population out of poverty. The mainstream
financial institutions are making various possible efforts but the challenge still remains keeping a
big proportion of society away from financial access and blurring a possibility of uplifting their
standards of living. Hence a clear understanding is essential into the behavior of these low income
unbanked segment of individuals and their approach towards financial services and money
management not only for the government but banks and marketers to design and market financial
services accordingly.
It has been substantiated in prior recent researches that low-income households do manage and
save their earnings in some or the other forms, nevertheless with smaller amounts. Survey by the
National Council of Applied Economic Research and Max New York Life Inc. (Shukla 2007 cited
Nandhi (2012)) , offers deep understanding into the saving behavior of households in India with
facts indicative of over 81 percent of the households save portion of their incomes. Also they prefer
to keep money at home in cash form rather in banks. Most interesting fact highlighted in survey
was that poor households save up to 40 percent of the their annual income in spite of being in debt
(Nandhi , 2012). So clearly there are more underlying reasons relting to lack of accessibility, cost,
financial literacy that may pose possible hindrances for the low income group people to be part of
mainstream financial banking. In recent past the growth in telecommunication sector and
particularly the penetration mobile phones have generated an opportunistic environment to
eliminate the barriers of financial inclusion (Mishra, V., & Bisht, S. S., 2013). Where the financial
providers are challenged to provide profitable services using the traditional channels to rural
population, mobile banking services can be visualized as a branchless banking channel providing
cost effective services to low-income customers (Dass & Pal, 2010). The extensive mobile
penetration in India is anticipated to surpass 80 percent in next 4 years with the urban mobile tele
density having crossed 100 percent mark in 2009 expected to reach 125 percent by 2015 and rural
mobile density to increase more than three times the current level of 20 percent to reach
approximately 63 percent by 2015. The major factors for such growth include decrease in tariffs,
low priced handsets, supportive regulatory environment, growing income and change in consumer
behavior (TRAI, 2012-13). Such developments in mobile telephony provide a distinctive leverage
for the country to fight the challenges of financial inclusion and instigate economic growth. The
marketers have a vast potential market to capture that lays untouched so far. By harnessing this
promiscuous mobile coverage the un-banked and under-banked segments of the country can be
financial included (http://www.rbi.org.in). Also the reachability to poor and underprivileged

might be challenge to banks but most of this population is having or using mobile phones .In fact
the research have validated that there are more people with mobile phones in India than with the
bank accounts. So this instrument can be a powerful resource to connect with people and realize
use of financial instruments by them.
Mobile banking as a tool to access financial service
United Nations (2009) report highlighted the impact of mobile banking in Africa where slight
decline in poverty rates were observed as compared to rest of the world. The decline was from 52
percent to 25.7 from 1981 to 2005 of the individuals surviving in extreme poverty. Similar impact
of mobile banking has been witnessed in countries like Zimbabwe where hyperinflation caused
collapse in currency. Using mobile banking the confidence in financial services was built again by
financially including people in a system that works with USD. Kenya is one of the top model of
successful implementations and successful disbursements of the promises of this innovative
technology in terms of cost savings, convenience, anytime anywhere accessibility and money
transfers
The potential of mobile banking technology and its contribution in economic and social
development is an area less explored and can be of great significance to identify the viability of
these ubiquitous services on lives of people especially falling in the low income, less literate group.
Vong et al. (2012) in his study in rural Cambodia pondered on the microenterprise behavior in
rural and remote areas and provided evidences that mobile money services are acquiring market
acceptance when used in mundane business life in rural Cambodia. Hence the use of financial
services is vastly growing thereby enhancing the lives of low income segment of the population.
Moreover this financial access to digital money has influenced people’s livings in unprecedented
manner. Dass and Pal (2010) study in Western Kenya revealed that the mandate for the core
financial services alongside adversities faced by the rural unbanked while availing these services
using existent delivery channels are notably the key drivers for adoption. MPesa, the mobile
banking service provided by Safaricom in Kenya has exemplified how the people at the bottom of
pyramid can increase their savings and improve their livelihood and lifestyle by using money
deposit and transfer services through telecom led model of mobile banking. The adversities
identified by Dass and Pal (2010) that prevent people from banking channels comprised of lack
of access, high interest rates for loans, fraud across the levels, intricate processes and
dissatisfactory service quality through banks within the section of lower social and lower financial
category of population. Vong et al. (2012) study suggested that branchless banking services has
humungous potential to progress the small business supply chain processes with respect to low
operating costs, bigger profit margin and greater market access prospects. The institution of mobile
payment facility for money transfers in sub-Saharan African renders exclusive opportunity to
quantify the influence of this service on migration patterns, transfer flows and welfare
consequences (Aker and Mbiti,2010). Medhi et al. (2009) examined disparities across
developing countries primarily across India, Kenya, the Philippines and South Africa studying
adoption and use of existing m-banking services by low-literate, low-income individuals and
conceived factors accountable for the same and identified household type, services adopted, pace
of uptake, frequency of usage, and ease of use as the major determinants of mobile banking
adoption. Porteous, D. (2006) on the floppy m-banking adoption patterns in developing countries
suggested the need for innovative models that offer transformational banking access to a safer,

appropriate and cost effective financial access to the unbanked rather than simply providing just
another convenient channel for those who are already banked.
Low-income segment and Mobile banking Services
Low-income people are the best managers in money management. There primary concern is how
keep up with daily bread and to save for rainy day as well. Since there is no fixed source, time and
amount of payment the chief characteristics of money received is in forms of either small incomes,
unpredictable incomes and from unsuitable informal financial service. Mobile banking intends to
eliminate the dependence of poor on this unsuitable informal financial service since it incurs huge
disadvantages and many negatives for the poor and also creates a vicious circle of informal
dependence. The major part of financial excluded segment in India is more dependent on informal
channels for credits which are perceived to be more convenient and user friendly than the formal
channels (Bansal, S. (2014). They prefer depending on these channels rather than staying hungry.
The major expectation of this section from any financial service provider is that it provides services
that are:
Reliable and flexible
Provides lending for miscellaneous purposes rather than only business of investment
purpose
Provides emergency loans
Can offer borrowings against savings
Research Objective
Inspired by the lack of research on low-income segment of India to provide financial services, this
study seeks to investigate m-banking services and it is potential for the low segment group in India.
Research Significance
The implication of present study lies in its uniqueness in associating mobile banking services with
multifaceted poverty. The disbursements of financial offerings using mobile phones has not been
as successful worldwide , therefore there is need to clearly understand the relationship between
financial services, mobile banking and aspects of low segment financial issues , along with a
familiarity about reactions of low income people to different schemes of the service. The mobile
money environment comprises of various players, including banks, telecommunication providers,
agents etc. It is crucial to identify whether mobile banking is a potential powerful tool for financial
inclusion and in what manner. The study would provide insights to the policy makers in the mobile
money network to consider the research findings for enhancement of the effectiveness of
marketing mobile banking as an instrument of financial inclusion.
Research Questions
Understanding the behavior of low income segment people towards money management
Understanding the financial troubles low-income people face. In what manner the
financial services simplify such troubles?

Understanding the main objective of low-income people for using financial services? Are
they achievable using mobile banking?
How the marketers can tap this demand-supply gap to target the potent markets for
mobile banking

Upstream Social Security Marketing: Current Exploration and
Future Directions
Saunak Bhattacharyya & Mrinalini Pandey
Indian Institute of Technology (ISM) Dhanbad
Introduction
In the last few decades, the economic growth in India has resulted urban centric settlements (Socio
Economic and Caste Census, 2011). This has caused inequality among rural and urban lifestyle
and job opportunities. These events have rippling effects on the bottom of the pyramid (Agarwal,
2016). The lower and middle class citizens in India are devoid of basic financial facilities and lack
in livelihood empowerment (Harriss, 2007). Global agencies and social scientists have pointed out
that poverty eradication in India can happen with deeper penetration of social security programs
(Jütting, 2002). In a diverse nation like India, policy outreach is marred with topographical
challenges, difference in cultures, beliefs, religion, and language (Bhattacharyya, 2016).
Therefore, it is wise to be strategic in the approach to social security program development and
delivery than trying to implement behavioral change to millions of people (Gordon, 2013).
Upstream interventions are more relevant to protective social security schemes like livelihood and
financial inclusions unlike health and education – as it requires specific capabilities and
disciplinary behavior by the citizens. Upstream marketing interventions make more sense from a
reach and awareness point of view (Deshpande and Lee, 2013).
Keywords: Social Marketing, Public Sector Marketing, Development Studies, Not For Profit
Marketing
Propositions or hypothesis
Upstream structural changes are most impactful when dealing with complex social behavior
changes (Cornell and Randall, 2011) as it gives downstream target audience the ability and option
to act as required (Irvin and Stansbury, 2004). This research aims to answer how to bridge gap
between customer (citizen) expectations (from the schemes) and service delivery (by government
and its officials)? Which are the upstream social security marketing interventions that are relevant
and impactful? How do we engage upstream stakeholders in a better manner? What are the kind
of rewards that works as an encouragement with government officials? Lastly, how can new age
technology be used by the government to drive enrollment to the schemes?
Research methodology
In line with the subject, a multi-disciplinary literature review was done. To explore the value and
identify service gaps, interviews were conducted among 190 citizens from 3 different states. Semi
structured interviews were conducted with equal gender representation among respondents in the
age group 25 to 40 years. The discussion centered on government livelihood & financial inclusion
schemes – their awareness levels, enrollment process, perceptions on the schemes and services
melted out in the offices. Given the learning from the citizen interviews, the researchers conducted
10 detailed interviews with government officials. The discussion was targeted to uncover ways of
value delivery, stakeholder orientations, and better public engagements. The researchers also learnt
promotional best practices from the projects of ‘civil service day’ awardees in social security
scheme category. Lastly, learnings from one of the researcher’s real life project execution, on
citizen advocacy among rural women entrepreneurs were helpful.
Results and discussion
Stakeholder orientation and behavior is the key to success in upstream social marketing.
Government officials’ treatment melted out to the citizens, ranked the top most reason for staying
away from government schemes. To address this inhibiter ‘reassurance’ in citizen minds are vital.
Conversation with the ‘babus’ (Government officials in India) reveals such steps like making
grievances cells more evident and accessible, developing local citizen advocacy and re-
engineering the document intensive workflow.
The surveys reveal communication gaps in the aim of the social security schemes, benefits out of
it and associated roles and responsibilities between legislatures, departmental secretaries, officials
and grass-root associates. New age ICT enabled media can bring efficiency and consistency in the
internal communications in and among the departments. Engagements and personal reward to the
social programs varies from a senior executive to junior official. The research does a deep dive on
this aspect and found non-monetary recognitions to be impactful too. Moreover, recognition stories
in correct internal platforms or media beyond office corridor empowers citizens. To an extent, it
helps to curb corruption in developing countries like India – the finding is in line with previous
literature (Mather, 2009).
Social security scheme implementations must be social. This research calls for collaborative
upstream marketing of these social programs. The researchers discuss several ways on how to
bring together all stakeholders such as public departments, NGO, legal bodies, universities, women
and child right commissions, labor associations, media houses and above all empowered citizens.
These not-for-profit groups are critical for creating a snowball campaign and spreading awareness
in all corners. Taking a unique yet result oriented approach, the research talks about how these
partnerships could be measurable and rewarding. Lobbies and communities should be grouped
with having common interests and easily distinguished for interventions. In fact, upstream
marketing on the benefits can go a long way to bury the ideological and political clashes related to
social program implementation.
Mobile technology interventions can address the communication barrier and help bridge the
capability void of citizens. Aadhar or UIDIA information can help in creating centralised mobile
databases and help in segmentation. From real life project execution experiences, the researchers
discuss how WhatsApp and other learning or communication apps can serve as an empowering
platform. The research states several ways on how IT enabled new age media can bring citizens
closer to the government by quick redressal of grievances and customised promotions.

Implications
This research makes both academic and practical benefactions by devising a marketing plan for
upstream stakeholders. Academically it is one of the initial and few contribution to the upstream
social marketing literature. The research brings out insights in the most critical areas of social
security scheme promotions – the officials, inter departments, processes, and technology. The
finding would have been more interesting and revealing if more number of government officials
and public offices – from more number of states could have been covered.
References
Agarwal, N. (2016). Inequality in India: what's the real story? [Online] World Economic
Forum, available at, https://www.weforum.org/agenda/2016/10/inequality-in-india-oxfam-
explainer [accessed 6 June 2017]
Bhattacharyya, S. (2016). “India’s Long Term Sustainable Growth: Answering by Ushering
Marketing Innovations to the Social Security Schemes”, in Islam, K.M.B, and Raushan A,
(co-Ed), Public Policy Agenda, Bloomsbury, London, pp. 1-17
Corner, A. and Randall, A., (2011). Selling climate change? The limitations of social
marketing as a strategy for climate change public engagement. Global Environmental
Change, 21(3), pp.1005-1014
Deshpande, S. and Lee, N.R., (2013). Social marketing in India. SAGE Publications India
Gordon, R. (2013). Unlocking the potential of upstream social marketing. European Journal
of Marketing, 47(9), 1525-1547.
Irvin, R.A. and Stansbury, J., (2004). Citizen participation in decision-making: is it worth the
effort? Public administration review, 64(1), pp.55-65
Jutting, J. (2002). Social security systems in low-income countries: Concepts, constraints and
the need for cooperation. [Online] Center for Development Research, University of Bonn
Harriss, J. (2007). Antinomies of empowerment: observations on civil society, politics and
urban governance in India. Economic and Political Weekly, 2716-2724.
Mather, S. (2009). Transcript of "A new way to fight corruption". [online] Ted.com.
Available at:
https://www.ted.com/talks/shaffi_mather_a_new_way_to_fight_corruption/transcript?langua
ge=en [accessed 4 June 2017]

An empiric analysis of factors influencing Mutual fund investors
and risk averse behaviour in western Maharashtra
Nitin C Mali & Ashok Kurtkoti
Shivaji University, Kolhapur & MITSOB, Pune
Abstract:
Mutual fund investment specifically in India and particularly in western Maharashtra is very
challenging aspect. This paper aims to study various factors influencing the investor’s choice of
mutual fund, criteria for selecting particular scheme, previous performance of Mutual fund asset
Management Company and services provided by them. Similarly Investor education and
awareness. To have the competitive advantage proactive steps taken by the Asset management
companies would be beneficial like proper financial planning guidelines, providing information
pertaining to Net asset value, benchmark indices, analyzing purchase decision involvement of the
investors and very importantly understanding the risk averse behaviour of the investors and
adequate and reliable information about the scheme.
Understanding investor behaviour, specifically information search and Processing behaviour of
mutual fund schemes is instrumental for effective marketing. Perhaps very few researchers have
focused on investor behavioural finance. It is complex set of understanding pertaining to investor
psychology; various parameters guiding principles and risk averse capability of the investor
dynamically guide the behaviour. Mutual fund companies while promoting the products and
marketing need to consider these several influencing parameters so as to effectively cater to the
needs of the investor, which would truly win the customers and enhance customer confidence and
trust.
Risk aversion behaviour is also the key to understand the investor risk appetite behaviour in terms
of conservative or aggressive investor measuring various demographic and psychographic metrics
that play a crucial role to predict and understand the likely behaviour.
Keywords: Investment behavior; wealth maximization; risk averse; purchase decision involvement
Analysis of the reasons for sale of sexual vitality supplements along
with health hazards associated with it and steps to be taken to
govern such sale.
Aniruddha Bhowmick
ICFAI University
Abstract: Recently, it has been seen that while purchasing sexual vitality supplements, consumers
have shown different emotions, which are related to their behavioral patterns. The implicit feeling
that the consumer carries is not always necessarily expressed but gets reflected through the demand
and sale of these products. This has resulted from the probable change in the behavioral approach
and the lifestyle of the consumer, and thereby created a demand of the sexual vitality supplements
without any knowledge of potential health risk for the consumers. Consumers unknowingly have
an affinity for these products without even considering the ill effect in the long run. In this paper
the researcher has firstly attempted to establish a connection between the hidden motive and the
purchasing pattern of sexual vitality supplements and secondly tried to understand whether
governmental mechanisms can be introduced to arrest such sale.
Literature Review:
Though sexual arousal is dependent on neural (sensatory and cognitive), hormonal and genetic
factors, something more interesting to learn about what are the motivational factors that stimulate
a consumer to purchase the sexual vitality supplements. According to Tinbergen and Griskevicius
(2013)
“Modern humans are endowed with psychological mechanism that inclined them to process
information and to make decision in a way that have enabled our ancestors to survive, thrive and
replicate – this leads to intertwined relationship between cognition, motivation and behavior,
which are the parts of adaptive system designed to solve the problems”. Barrett & Kurzban (2006),
opines that people often have multiple motives for a behavior, even though they are not aware of
the ultimate reason for their choices. To understand the buying motivation of a consumer for
purchase of these products if a question being asked to an individual to cite the reasons of such
purchase , individual may states various reasons like health issue, satisfying partner need, just for
trial or self satisfaction etc. This may be due to psychological and physiological aspect which an
individual depicts when confronted with a stimuli which is difficult to resist.
Loe (2004) notes that: “Products like Viagra promises to restore sexual potency to the male
populace, and Prozac promises to restore consistency, focus, and contentedness to, mostly,
women’s lives. In sum, these pills and sexual vitality supplements are designed to produce potent
men and happy women… this sounds like a recipe for restoring traditional gender roles and
powerful relationships.” As per the report of ‘Infinity Research Limited’, Asia Pacific Area Circle
is to be the largest market for the sexual wellness products and is expected to account for nearly
40% of the market share till 2020. Report from Business Today (2014) reveals on an average the
overall Indian market witnesses a sale of Rs 1,000 crs to 1,500 crs annually and it is growing. As

per MaryAnn O Hara (1998), though consumers are rampantly using these products there is often
lack of accurate information about the safety and efficacy as well as contraindication from these
remedies.
Food and Drug Administration of USA has announced that all testosterone and sexual vitality supplements products must be labeled to include information about the possible increased risk of cardiovascular,
respiratory, and dermatologic problems as a result of using the drug. During an investigation led by US
FDA found that half of the men taking seldinafil molecule hadnot actually been diagnosed with the
disease hypo gonadism. In India, there is a plethora of natural and evidence based medicine to
restore and improve sexual activity, which should be governed in order to avoid medical hazards
for public health.
Research Methodology: The survey was conducted by researchers in the language, which is
understood by people and at the same time convenient to them. The structured questionnaires
consist of mainly optional lists and few open ended questions to gain qualitative feedback of the
respondents about their opinion and perception about the consumers on purchasing decision for
sexual vitality supplements . The information collected was recorded on structured forms codified
for computer analysis. The validity of collected data was reconfirmed by random data checks and
repeat interview. During pilot study researcher has observed that it is difficult to identify individual
users as it is time taking and higher cost orientation process. More over due to social stigma
consumers are unwilling to speak out about the facts asked in the questionnaires. That is why
researcher has opted to consider the pharmaceutical retailers who are selling these products and
have greater information about the consumers. The retailers are included from rural and urban
areas of Hooghly district with the objective of understanding their perception, attitude in relation
to selling and observation on the consumers buying behavior for sexual vitality supplements.
Empirical Results: After statistical analysis of the primary data it has been observed that there is
plethora of different brands of sexual vitality supplements, which are widely available in all the
pharmaceutical retails of the survey area. This include evidence based products as well as products
which neither have pharmacokinetics nor have pharmacodynamics evidence. Result shows there
is incremental growth in sale of these products majority without any prescription from medical
practitioners and most of the consumers belong to age group of 35to 55 yrs. While analyzing the
results it has also been observed that there is higher percentage of the consumers are well aware
about the brands and there are fewer scope of push sale on behalf of retailers. Health requirements
is the maximum with 45% of the customers citing that reason for purchase.
Implications and practice: Through primary and secondary data analysis have shown the rate of
growth and reasons for emergent sexual vitality supplements of different origin. This has raised
the serious issue of public health. To avoid the further detoriation of this situation appropriate steps
have to be taken to control this misuse of sexual vitality supplements at an early stage. There are
certain factors which can be governed and there are certain other factors which are difficult to
govern. The factors which can be governed are: control the usage restriction help in reducing health
hazards, information exchange and training to establish effective mechanism exchange among

various government monitoring department, mass education and awareness generation about the
health hazards associated with un scientific consumption of these products, regulations on
promotion and distribution etc. But certain other factors which will be challenging for the authority
to govern are : although the precautionary principle is used to control the pre-emptive legislative
control, the reality is that while such actions may remove harmful substances from wide spread
circulation which can be replaced by other equally unfamiliar molecule or herbal products that
may or may not share a similar risk effect but can create a different risk profile. Similarly often
the compositions of these substances are hard to identify. Along with this given the speed of
appearance, diverse branding, inconsistent batch number and frequent change in product
composition make it difficult for the government agencies to book those products under existing
law and order. Through this paper researcher has tried to understand the reasons for the sale of
sexual vitality supplements, their harmful effects through unscientific consumption and the steps
that can be adopted for governing the sale of such products.
References:
Quonglin L and Jun Qu: (2006) “Rapid and reliable determination of illegal adulteration in
herbal medicines and dietary supplements” Journal of pharmaceutical and biomedical
analysis. Volume 40, Pp 305-311.
WHO traditional medicine strategy 2002-2005
Christoper C K (2011), “Rise of herbal and traditional medicine in erectile dysfunction
management.” Science and Business Medicine Journal.
Griskevicius Vladas (2012) “How evolutionary need influence consumer behavior”.
Journal of consumer Psychology. Vol 23, Pp 372-386
West Brook Robert. “Product/ Consumption based effective and post purchase process”.
Journal of marketing. Vol 24. Pp 258-270.
Pluzinski Carol and Quallas J William (1986): “The relation between effect, cognition and
behavior”. Advance in consumer research. Vol 13. Pp 231-234.
Colly R (1961) “Defining advertising goals for measured advertising result”. New York
Association of National Advertiser.
Engel J and Blackwell R (1982). “Consumer behavior in New York”. Dryden Press.
Zajonc R B and Markus H (1982) “Affective and cognitive factors in preferences” Journal
of Consumer Research. Vol 9. Pp 123-131.
Chye Lim Huat Peter (2006) “Traditional Asian folklore medicines in sexual health”.Vol
22. Pp 241-245.
Das Goutam. (2014). “Its been pleasure”. Business today.
Christoper C. K. Ho (2011). “Rise of herbal and traditional medicine in erectile dysfunction
management”. Social Business Medicine.

“Portray of Older adults in advertising” (2006), A Cross National Review Journal of
Language and Social Psychology. Pp 264-282.
Winstock Adam and Wilkins Chris (2011). “The challenge of new psychoactive
substances”. Series of legislative reform of drug policies No. 16.
United Nation, New York (2009), Guidelines for Govt. on preventing the illegal sales of
internationally controlled substances through internet.
“Good medicine bad behavior” (1919), Office of National Drug Control Policy, Drug
division in America.
Goldstein Irwin and Castleman Michael. (1999) “The Primary Care Management of
Erectile Dysfunction”. Department of Veterans Affairs Veterans Health Administration
Publication No. 99-0014.
“Adverse Events Associated with Testosterone Administration”. N England Journal of
Medicine 2010; 363:109-122.July 8, 2010.
Virag Ronald (2013). “How your man can retain his virility”.
Paul D. Navar. (2008). “ Optimizing Testosterone Levels in Aging Men”
Available http://www.census.gov/ipc/www/usinterimproj/natprojtab02a.pdf. Accessed
April 24, 2008.
Khaw KT, Dowsett M, Folkerd E, et al. (2007) “Endogenous testosterone and mortality
due to all causes, cardiovascular disease, and cancer in men: European prospective
investigation into cancer in Norfolk (EPIC-Norfolk) Prospective Population Study.
Circulation. 4; 116(23):2694-701..
Available at: http://www.drugs.com/ppa/methyltestosterone.html. Accessed April 28,
2008.
Farrell GC, Joshua DE, Uren RF, Baird PJ, Perkins KW, Kronenberg H. (1975)
“Androgen-induced hepatoma.”. 22; 1(7904):430-2.
The extent and nature of testosterone use [news release]. Fairfield, Conn: IMS Health,
Inc; September 2006.
Miner MM, Seftel AD. (2007) “Testosterone and ageing: what have we learned since the
Institute of Medicine report and what lies ahead?” Vol: 61(4):622-32.
Jones RD, Nettleship JE, Kapoor D, Jones HT, Channer KS. (2005) “Testosterone and
atherosclerosis in aging men: purported association and clinical implications”Vol:
5(3):141-54.
Dobrzycki S, Serwatka W, Nadlewski S, et al.(2003). “An assessment of correlations
between endogenous sex hormone levels and the extensiveness of coronary heart disease
and the ejection fraction of the left ventricle in males”Vol: 50(3-4):162-9.
Hak AE, Witteman JC, de Jong FH, et al(2002 ). “Low levels of endogenous androgens
increase the risk of atherosclerosis in elderly men”: the Rotterdam study. Vol: 87(8):3632-
9.
Malkin CJ, Pugh PJ, Morris PD, et al (2004). “Testosterone replacement in hypogonadal
men with angina improves ischaemic threshold and quality of life”. Vol: 90(8):871-6.
Kang SM, Jang Y, Kim JY, et al. (2002) “ Effect of oral administration of testosterone on
brachial arterial vasoreactivity in men with coronary artery disease”.Pp;89(7):862-4.
Zou B, Sasaki H, Kumagai S.(2004) “Association between Relative Hypogonadism and
Metabolic Syndrome in Newly Diagnosed Adult Male Patients with Impaired Glucose
Tolerance or Type 2 Diabetes Mellitus”Pp2(1):39-48.
Jackson G et al, ‘Erectile dysfunction and coronary artery disease prediction: evidence
based guidance and consensus’, International Journal of Clinical Practice 2010;
64(7):848-857
Salonia A, et al, ‘Delay in seeking medical help in patience with new onset erectile
dysfunction remain high over and despite the PDE5era—an ecology study’, The journal
of Sexual Medicine (2012 Dec);3239-46
Katsiki N, Mikhailidis DP, ‘Erectile Dysfunction and Coronary Heart Disease’, 2015 July;
30(4): 416-21.
Bergman Stuart, ‘Drugs that cause erectile dysfunction’ National Institute of Diabetics
and Digestive and Kidney Disease (2015).
Loe, M. The rise of Viagra: How the little blue pill changed sex in America. New York:
New York University Press. (2004).
Hara O MaryAnn, ‘A review of 12 commonly used medicinal herbes’ Vol. 7 No. 6, Pp
523-536 (1998)

Do friends influence perceived value from a consumption experience - An
experimental investigation
Diptiman Banerji, Ramendra Singh, Prashant Mishra, Rebecca G. Adams & Rajiv Kumar
Indian Institute of Management Calcutta & University of North Carolina at Greensboro
Introduction
The present study responds to calls for research to understand customer value creation (Kumar and
Reinartz, 2016) and how social touchpoints influence value during a customer’s journey (Lemon
and Verhoef, 2016). We attempt to understand the influence of a specific social touchpoint—one’s
friends—on customer value in the context of shared consumption.
Keywords: Friendships; Customer perceived value; Customer experience; Positive affect;
Thought confidence; Re-patronage intention.
Theoretical background
Conceptualization of Friendship
Friendship is seen as a close interpersonal relationship and defined as a “voluntary interdependence
between two persons over time, which is intended to facilitate socio-emotional goals of the
participants, and may involve varying types and degrees of companionship, intimacy, affection
and mutual assistance” (Hays, 1988, p. 395). Extant research shows that individuals experience
positive affect (PA) or subjective feelings of happiness with a close friend (Adams and Taylor,
2015; Demir and Özdemir, 2010). Self-validation is another significant reward associated with
friendship; it refers to support and encouragement in maintaining one’s self-image as a competent
and worthy person.
Customer Perceived Value (CPV)
Researchers have defined CPV as “the evaluation of the service experience, i.e. the individual
judgment of the sum total of all the functional and emotional experience outcomes. Value cannot
be predefined by the service provider, but is defined by the user of a service during the user
consumption.” (Sandström et al., 2008, p. 120).
Conceptual Model and Hypothesis Development
Figure 1 shows the conceptual model envisaged through the hypothesis development process.
Friendship is operationalized through presence of a friend (vs. absence). While PA refers to
positive affect arising from friendship, TC refers to thought confidence or faith in one’s thought
process that comes from self-validation among friends. Repatronage intention (RPI) reflects a
customer’s loyalty, that is, willingness to buy from a service provider in the future. Mental
intangibility (MI) refers to the mental representation of an offering.
Figure 1. Conceptual Model

One of the ways of expressing closeness to one’s friends and family members is through shared
consumption activities, described as “consuming as play” (Holt, 1995,p.2) and this involves two
practices through which friends add value to the consumption activity: (1) communing, that is,
sharing experiences with each other, and (2) socializing, or entertaining each other. Hence, we
posit:
H1A: Perceived value of a consumption experience (CPV) will be higher for an individual
customer when accompanied by a friend, compared with undergoing the same experience alone.
H1B. Perceived value of a consumption experience (CPV) will be higher for an individual
customer when accompanied by a close friend rather than by a friend with whom he or she is less
close.
According to the ‘affect-as-information’ theory, one interprets pleasant feelings (or, PA) in an
evaluative situation—even if they are incidental, that is, affect not arising from the consumption
itself—as evidence of satisfaction with the offering (Cohen et al., 2008; Schwarz and Clore, 2003).
This interpretation of feelings happens through the ‘how-do-I-feel-about-it’ heuristic, where one
tends to check back with one’s feelings and interprets pleasant feelings in an evaluative situation
as evidence of satisfaction with the offering. We argue that PA from a positive interaction with a
friend acts as incidental affect during a consumption experience and signals satisfaction with the
experience. We hypothesize:
H2A. PA mediates the effect of friendship on CPV.
Further, there is evidence that the confidence about one’s thoughts (i.e., TC) influences the
evaluation of an offering (Petty et al., 2002). We propose that self-validation from a friend gives

rise to higher confidence about one’s choices and leads to assessments that are more favourable,
that is:
H2B. TC mediates the effect of friendship on CPV.
Next, if an offering is higher in mental intangibility or MI (i.e., it is more problematic to create a
mental picture of the offering), its evaluation becomes more difficult due to insufficient physical
elements to anchor evaluation on; therefore, consumers have to rely on other cues for evaluation
(Bakamitsos, 2006). We argue that for offerings that are higher in MI, the role of both PA and TC
as additional cues become more salient during the evaluation process. Consequently, the increase
in CPV is higher for an offering that is higher in MI as one goes from low to high PA or TC. We
posit:
H3A. The path from PA to CPV is moderated by MI, such that as PA increases, there is a higher
increase in CPV when the offering in higher in MI.
H3B. The path from TC to CPV is moderated by MI, such that as TC increases, there is a higher
increase in CPV when the offering in higher in MI.
Finally, perceived value is often viewed as a positive influence on behavioural loyalty or repeat
purchase behaviour. There is evidence that customers tend to return to consumption sites that
offer higher perceived value (Sharma et al., 2015). Hence, we hypothesize:
H4A. Re-patronage intention (RPI) for a service will be significantly different for an individual
customer when accompanied by a close friend, compared with undergoing the same experience
alone.
H4B. CPV mediates the relationship between friendship and RPI.
We test these eight hypotheses through three experimental studies. 3
Study 1A: The Influence of Presence of a Friend on CPV and RPI – Indian participants
In our first study, 167 Indian MBA students are randomly assigned to one of the cells of a 2X2
study consisting of two conditions (friendship: alone and with friend) X two service situations
(Low MI: fast food restaurant and high MI: three-star restaurant). Participants are primed in a
Qualtrics-based questionnaire; those in the “alone” condition are asked to visualise about eating
out alone while those in the “with friend” condition are asked to visualize eating out with their
very close, same gender friend and primed with a positive interaction. Results indicate that the
priming of friendship and MI is successful.
An ANCOVA analysis with three covariates (type of service situation, gender of participant, and
age group) shows that CPV is significantly more with a friend than when alone, MALONE =

65.15, SD = 8.37; MWITH_FRIEND = 70.08, SD = 6.39; F(1, 162) = 19.38, p < .01, 2p = 0.11.
Thus, H1A is supported. We also get support for H1B.
Next, a bootstrapping analysis based on 10,000 samples using Hayes’ SPSS PROCESS macro
(version 2.13.2; Model 4: Hayes, 2013) shows a significant indirect effect of friendship on CPV
(see Figure 2) through PA (a1*b1 = 0.55, 95% CI [0.07, 1.28]) (H2A), as well as through TC
(a2*b2 = 1.30, 95% CI [0.21, 2.63]) (H2B). Therefore, both H2A and H2B get support, and TC is
revealed the stronger mediating mechanism between the two.
Figure 2. Mediation paths from friendship to CPV
Further, a bootstrap analysis reveals that the index of moderated mediation for PA is significant
and has a positive sign (0.77, 95% CI [0.07, 2.03]). However, the index of moderated mediation
is not significant for TC. Therefore, we get support for H3A in this data.
Finally, A serial mediation analysis (Model 6: Hayes, 2013) based on bootstrapping shows three
significant indirect paths from condition to RPI (Figure 3), giving evidence for the effect of
condition on RPI (i.e., H4A). Each significant path is through CPV (H4B). The strongest path is:
condition → CPV → RPI (a*b = 0.43, 95% CI [0.15, 0.77]).
Figure 3. Serial mediation paths from friendship to RPI
Study 1B: The Influence of Presence of a Friend on CPV and RPI – US participants

We systematically replicate the first study with the same design (and changes like the priming
description and measurement of PA) with 176 US-based student as well as non-student participants
to establish external validity for our model. US participants are recruited online (www.prolific.ac)
in the same age group of 18-35 years. We get support for six hypotheses in this study (H1A, H1B,
H2A, H2B, H4A and H4B). H3A is not supported (the moderation of MI on the PA→CPV path)
while we get directional support (at p=.10) for H3B.
Overall, our model gets support from Study 1A and 1B.
Study 2: Boundary Condition of a Friend’s influence on CPV and RPI
Our third experiment tests a potential boundary condition of the hypothesised friend’s influence
when there is a lowering of PA. Paralleling the lowering of PA, CPV significantly reduces in the
presence of a friend as compared to the alone condition. This is consistent with our theorization,
that is, PA from friendship acts as a signaling mechanism during evaluation, and thus, lower PA
levels lead to lower CPV, that is, H2A is supported.
Further, we find that there is a significant indirect effect of friendship on RPI with a minus sign,
indicating that RPI reduces in the “with friend” condition, which agrees with reduction of PA
and CPV. Thus, we get additional support for H4A, and H4B.
References:
Adams, R.G. and Taylor, E.M. (2015), “Friendship and happiness in the third age”, in Demir, M.
(Ed.), Friendship and Happiness, Springer Science+Business Media, New York, NY, pp. 155–
170.
Bakamitsos, G.A. (2006), “A cue alone or a probe to think? The dual role of affect in product
evaluations”, Journal of Consumer Research, Vol. 33 No. 3, pp. 403–412.
Cohen, J.B., Pham, M.T. and Andrade, E.B. (2008), “The nature and role of affect in consumer
behavior”, in Haugtvedt, C.P., Herr, P. and Kardes, F. (Eds.), Handbook of Consumer
Psychology, Lawrence Erlbaum, Mahwah, NJ, pp. 297–348.
Demir, M. and Özdemir, M. (2010), “Friendship, need satisfaction and happiness”, Journal of
Happiness Studies, Vol. 11 No. 2, pp. 243–259.
Hayes, A.F. (2013), Introduction to Mediation, Moderation, and Conditional Process Analysis,
Guilford Press, New York, NY.
Hays, R.B. (1988), “Friendship”, in Duck, S. (Ed.), Handbook of Personal Relationships, John
Wiley & Sons, New York, NY, pp. 391–408.
Holt, D.B. (1995), “How consumers consume: A typology of consumption practices”, Journal of
Consumer Research, Vol. 22 No. 1, pp. 1–16.

Kumar, V. and Reinartz, W. (2016), “Creating enduring customer value”, Journal of Marketing,
Vol. 80 No. 6, pp. 36–68.
Lemon, K.N. and Verhoef, P.C. (2016), “Understanding customer experience throughout the
customer journey”, Journal of Marketing, Vol. 80 No. 6, pp. 69–96.
Petty, R.E., Briñol, P. and Tormala, Z.L. (2002), “Thought confidence as a determinant of
persuasion: The self-validation hypothesis.”, Journal of Personality and Social Psychology, Vol.
82 No. 5, pp. 722–741.
Sandström, S., Edvards son, B., Kristensson, P. and Magnusson, P.R. (2008), “Value in use
through service experience”, Managing Service Quality, Vol. 18 No. 2, pp. 112–126.
Schwarz, N. and Clore, G.L. (2003), “Mood as information: 20 years later”, Psychological
Inquiry, Vol. 14 No. 3–4, pp. 296–303.
Sharma, P., Chen, I.S.N. and Luk, S.T.K. (2015), “Tourist shoppers’ evaluation of retail service:
A study of cross border versus international out shoppers”, Journal of Hospitality & Tourism
Research, Vol. 20 No. 10, pp. 1–28.

Prototypes of power: How consumption (dis)empowers consumers
Kalyani Menon
Wilfrid Laurier University
Extended Abstract
This paper adopts a power framework to explore consumer-product power relationships occurring
through consumption experiences. Power is defined as outcome dependency and the relative
capacity to alter others' states by providing/withholding resources (Fiske 2010; Keltner et al
2003). It is central to all relationships (Fiske 2010), including consumer-product relationships
(Fournier and Alvarez 2012). Every consumption experience is based on the notion of outcome
dependency where consumers initiate consumption to acquire the resources contained in products
(defined as any market offering) to achieve a desired consumption outcome. Past research has
focused either on power as activism (Denegri-Knott et al 2006), or effects of power derived from
non-consumption situations on consumer behavior (Rucker et al 2012). This paper studies the
experiential nature of consumer-product power relationships, constructs defining these
relationships, and the specific power roles consumers occupy in such relationships. The experience
of power is multifaceted and fuzzy (Fiske 2010). A prototype approach (Shaver et al 1987) is well-
suited to capture such an experience. A prototype is a script of features defining complex, fuzzy
experiences like emotions or power. Prototype research elicits key components of the entire
experience to enable a comprehensive understanding of it.
An exploratory, multi-method approach was deemed appropriate given the under-researched
nature of the topic. Content analysis of qualitative survey data (Study 1) identified four key
constructs common to all experiences of power. These relate to the benefits and/or problem
consumption outcomes, consumer agency (i.e., how actively the consumer is engaged in shaping
the consumption outcome) and separation distress (i.e., the anticipated distress if the consumer is
required to do without the product) (Park et al 2010). These four constructs defined two prototypes
each of powerlessness and powerfulness. Study 2 collected quantitative data on these constructs
and other descriptive constructs. Cluster analysis and difference of means confirmed these
prototypes and constructs, and regression confirmed the relationship between them. The results of
the both studies are presented together.
Powerless prototypes:
Consumer-as-prisoner has low consumer agency, below average benefits, above average
problems, and benefits are not significantly more than problems. Problems could be product failure
(e.g., ".. [computer] does not have enough memory…runs very slow and there is not much on it"),
consumer compromise (e.g., ".. purchase[d] this vehicle based on fuel economy rather than the
type of car I desired based on my finances "), or consumer inadequacy (e.g., " No knowledge of
issues [about HVAC] and charges can be all over the place"). Satisfaction and utility received is
low. While this prototype has higher negative and lower positive emotions than other prototypes,
positive emotions within the prototype are higher than negative emotions. Separation distress is
low (e.g., "feel out of my element" when using a Kenmore carpet cleaner but "if it's not available,

we'd do without and suffer with allergies"). Consumers report low levels of power, and the product
itself is not seen as very powerful, albeit more powerful than the consumer. Regression shows this
prototype is predicted by increasing problems and separation distress, and decreasing consumer
agency and benefits.
Consumer-as-servant: shows high levels of consumer agency (e.g., consumer learns how to use
make-up), more benefits than problems, and high levels of separation distress (e.g., if make-up is
unavailable, consumer will become "too self-conscious to go out of the house"). It has high positive
emotions, satisfaction, and all forms of utility but consumers are concerned about their dependence
on it (e.g., "It [calculator] is useful for hardest calculation[s]…. reduces the time for calculations but it
makes the student dependent on calculator"; “But it [coffee] makes me feel powerless… [I] think
that I am who I am because of coffee. I'm almost at its mercy". The consumer feels less powerful
than, and controlled by, the product. Regression shows that this prototype is predicted by
separation distress and occurrence of problems. Though the product is more powerful than the
consumer, the consumer has above average levels of power and agency.
Powerful prototypes:
Consumer-as-master: shows extremely high levels of consumer agency and benefits, and low
levels of problems. Respondents leverage functional benefits for higher order benefits (e.g.,
"Whirlpool appliances gives "the ability to cook a good meal. I feel like I have accomplished my
goal and a sense of pride"). Separation anxiety is high (e.g., "...would GO STORE TO STORE
TIL[l] I COULD FIND SOME [Clorox bleach]". This has low negative and high positive emotions
and satisfaction. Respondents feel as powerful as the product. Regression shows that consumer
agency and benefits positively predict this prototype.
Consumer-as-partner: is a generally positive experience with average levels of consumer agency.
While satisfaction is high and beneficial outcomes outweigh problems, benefits are below and
problems are about average levels. Separation distress is very low indicating that consumers have
no problem walking away from it ("[Ford truck] really does not change me. There are similar
other products that would suffice"). Respondents believed that potential hardship without the
product could be managed ("…devise another method to arrive at the same conclusion I can with
Quicken"). Symbolic utility is much lower than instrumental and/or hedonic utility (e.g., " [road
bike gives] ability to move quickly and cover a lot of ground in a short period of time with your
own strength"). Respondents experience below average intensity of power.
Theoretical implications for the consumption relationships and consumer power literature are
discussed.

REFERENCES
Denegri-Knott, Janice, Detlev Zwick, and Jonathan Schroeder (2006), "Mapping Consumer
Power: An Integrative Framework for Marketing and Consumer Research," European Journal of
Marketing, 40(9/10), 950 – 971.
Fiske, S. T (2010), "Interpersonal Stratification: Status, Power, and Subordination," in Handbook
of Social Psychology, ed. Susan T. Fiske, Daniel T. Gilbert and Gardner Lindzey, vol. 2, Wiley,
941 – 982.
Fournier, Susan and Claudio Alvarez (2012), "Brands as Relationship Partners: Warmth,
Competence, and In-Between," Journal of Consumer Psychology, 22, 177 – 185.
Keltner, Dacher, Deborah Gruenfeld, and Cameron Anderson (2003), "Power, Approach, and
Inhibition," Psychological review, 110(2), 265-284.
Park, C. W., D. MacInnis, J. Priester, A. Eisingerich and D. Iacobucci (2010), "Brand Attachment
and Brad Attitude Strength: Conceptual and Empirical Differentiation of Two Critical Brand
Equity Drivers," Journal of Marketing, 74 – 10 17.
Rucker, Derek, Adam Galinsky and David Dubois (2012), "Power and Consumer Behavior: How
Power Shapes Who and What Consumers Value," Journal of Consumer Psychology, 22, 352 –
368.
Shaver, Phillip, Judith Schwartz, Donald Kirson, and Cary O'Connor (1987), "Emotion
Knowledge: Further Exploration of a Prototype Approach," Journal of Personality and Social
Psychology, 52(6), 1061 – 86.

Examining Consumer behaviour towards toxic chemical free
cosmetics: Applying TRA and Schwartz values
Sita Mishra
Institute of Management Technology, Ghaziabad
Extended Abstract
In recent decades, there has been a rapid growth in the cosmetic industry worldwide. Globally, it
is expected to reach $390.07 billion by 2020 (Allied Market Research report, 2015) while the Asia-
Pacific cosmetics market is expected to reach $126.8 billion by 2020. The Indian cosmetic
industry, presently around $ 6.5 billion, is having smaller portion in Asia-pacific region but it grew
almost twice as fast as that of the US and European markets in 2014. According to the
Confederation of Indian Industries (CII), the beauty and cosmetic industry is projected to grow
between 18-20 per cent per annum in the next couple of years (Economic Times report, 2015).
According to a study conducted in January 2014 by Centre for Science and Environment (CSE), a
non-profit organization in New Delhi, the cosmetics sold by popular brands across the country
contain chemicals with heavy metals like mercury, chromium and nickel in fairness creams and
lipsticks. The chemicals containing these metals are used as preservatives, synthetic colours, anti-
oxidants, etc., and they have hazardous effects on the health of the consumers.
As a result, consumers’ in many countries are switching to safer cosmetics which is free from
parabens and toxic chemicals. Therefore, cosmetics are at a very critical stage where they have to
choose to switch for safe cosmetics without chemicals and harmful metals. Consequently, the
cosmetics industry is now searching for safe products that are free of these harmful ingredients.
There is an increased awareness for the use of the safe cosmetics by consumers across globe.
Theoretical Framework
Studies related to toxic chemical cosmetics
Literature review indicates various studies which have examined the effects of such chemical
cosmetics products on human health. Marinovich et al. (2014) reported the risk arising from a
number of metals (antimony, arsenic, cadmium, cobalt, chromium, mercury, nickel, lead) that may
occur in ‘unavoidable traces’’ in raw materials and, subsequently, in personal care products.
Ayenimo et al. (2010) in their study shown presence of substantial levels of chemical metal in
some products like soap and body cream. Similarly significant amount of heavy metals were found
in facial cosmetics such as eyeliners, eye-pencils and lipsticks (Nnoromi et al., 2005).
Consumer values and attitude
Values are considered as abstract concepts but various researchers have deliberated on role of
personal values in people’s attitudes and decision making processes. Schwartz’ value system
(Schwartz, 1994; Schwartz and Sagiv, 1995) which is based on 10 values and four higher-order
value types is considered the most apposite for this current study. According to this value system,
values provide guidance to people how to act in their lives but not pertaining to any situation. Both
personal and societal values influence ones behaviour. The four higher-order values in Schwartz’

value system includes- self-enhancement versus self-transcendence and openness to change versus
conservation.
Theory of Reasoned Action
Attitude toward behaviour is referred as “an individual’s positive or negative feeling regarding
performing the target behaviour” (Fishbein and Ajzen, 1975, p. 216). Theory of Reasoned Action
(TRA) proposed by Ajzen & Fishbein (1980) is chosen as the theoretical foundation of this study
to model the connecting link between consumer values, attitudes and purchase behaviour of
consumers for toxic chemical free cosmetics. TRA suggests that a person’s behaviour is
determined by behavioural intention, which in turn is the function of two factors namely, personal
factor and social factor.
Research Methodology
Understanding consumers’ values in a cultural context is crucial because it helps in predicting the
consumers’ attitude, intention and purchase behaviour. This study attempts to investigate
consumers’ values which influence their attitude towards buying toxic chemical free cosmetics in
India. Attitude and Subjective norms influence purchase intention based on TRA model.
Framework of current study is shown on Fig 2. The study exclusively focuses on exploring answers
to the following questions:
Research Problems
1. Is there any association between consumers’ values (self enhancement, self-transcendence,
openness to change and conservation) and attitude towards buying toxic chemical free cosmetics?
2. What is the impact of attitude and subjective norm on consumers’ intention to purchase toxic
chemical free cosmetics?
3. Which values have more impact on attitude of consumers’ towards buying toxic chemical free
cosmetics?
Research Hypotheses
The research question will be answered through examining the following null hypotheses:
H01: There is no association between consumers’ values (self enhancement, self-transcendence,
openness to change and conservation) and attitude towards buying toxic chemical free cosmetics.
H02: Attitude towards toxic chemical free cosmetics are not related to purchase intention.
H03: Subjective norms towards toxic chemical free cosmetics are not related to purchase intention.

Research Framework (Fig 1)
Research Tool
A questionnaire was prepared to collect data on consumers’ buying behaviour towards toxic
chemical free cosmetics. It consisted of two broad parts; the former dealt with demographic
information of respondents and later dealt with information related to values, attitude and
willingness to purchase. A total of 196 complete responses were considered for the study. The
data collected through the online questionnaire was analysed using the SPSS 20.0 software.
Data Analysis and Discussion
The sample for this study comprised of 137 females and 59 males. 62 respondents were belonging
to age group of less than 30 while 74 and 60 were from age group of more than 30 to less than 45
years and more than 45 years categories, respectively.
Data were analysed using descriptive and regression analysis and analysis of variance.
References:
Ajzen, I., and Fishbein, M., (1980). Understanding attitude and predicting social behavior.
Englewood Cliffs, New Jersey: Prentice-Hall.
Ayenimo, J.G., Yusuf, A.M., Adekunle, A.S. & Makinde, O.W. (2010), “Heavy Metal Exposure
from Personal Care Products”. Bull Environ Contam Toxicol, 84, 8–14.
Fishbein M, Ajzen I. 1975. Belief, attitude, intention, and behaviour: an introduction to theory
and research. Addison Wesley, Reading, Mass
Marinovich M, Boraso MS, Testai E, Galli CL (2014),” Metals in cosmetics: an a posteriori safety
evaluation”. Regul Toxicol Pharmacol 69(3):416–424
Nnoromi, I.C., Igwe, J.C. & Oji-Nnorom, C.G. (2005),”Trace metal contents of facial (make-up)
cosmetics commonly used in Nigeria”, African Journal of Biotechnology, 4, 1133–1138.
Consumer Values
Self enhancement
Self-transcendence
Openness to change
Conservation
Attitude
Subjective
Norms
Purchase
Intention

Schwartz, S. H. (1994). Beyond individualism/collectivism: New cultural dimensions of values. In
U. Kim, H. C. Triandis, C. Kagitçibasi, S. C. Choi & G. Yoon (Eds.), Individualism and
Collectivism: Theory, Method and Applications (pp. 85-119). Thousand Oaks, CA: Sage.
Schwartz SH, Sagiv L. (1995),” Identifying culture-specifics in the content and structure of
values”, Journal of Cross-Cultural Psychology 26(1):92–116.
Reports:
Allied Market Research report, 2015 “World Cosmetics Market - Opportunities and Forecasts,
2014 – 2020”.
Economic Times report, 2015 “Indian Cosmetic industry: The game-changers in recruitment in
2015”
http://articles.economictimes.indiatimes.com/2015-01-08/news/57838143_1_new-talent-l-oreal-
india-employee-engagement

Emergence and manifestation of green consciousness and its
influence on green consumption behaviour
Amogh Kumbargeri
IIM Ahmedabad
Extended Abstract
Objective of this study is developing theory to explain the process of emergence and manifestation
of green consciousness and its influence on consumption behaviour. Research has established that
green consciousness is a key variable influencing the green buying behaviour but not much is
known about the nature and process of development of green consciousness. In this study we use
grounded theory approach for theory development and use in-depth interviews as a data collection
tool. We find that exposure and experience are key variables influencing the emergence of
consciousness and there are four progressive stages in which the consciousness develops and
manifests itself.
Franson and Garling (1999) have defined environmental concern (EC) as the ranging between a
specific attitude towards an environmentally relevant behaviour and more encompassing value
orientation. In their review they point out EC has been variously defined as specific attitude as
well as a broad value orientation by different authors. While defining it as a specific attitude it has
been defined in line with the theory of planned behaviour TPB (Ajzen, 1985, 1991). It states that
intention strength is the cause of behaviour and the intention in turn is shaped by attitude towards
the behaviour, subjective norms and perceived control over the behaviour. And when studied as a
value orientation Stern (1992) has identified four types of value orientation. The first being New
Environmental Paradigm (NEP) which is eco-centric way of thinking of the environment for its
own sake, second being thinking of environment for welfare of human kind, third being concerned
out of one’s own safety and the last being motivated due to religious or spiritual reasons. For this
study we are considering an all ranging combined definition provided by Franson and Garling
(1999).
The effect of environmental concern on the purchase intention and buying behaviour of green
products have been well researched but there is scant research on the process through which such
a consciousness develops or emerges in an individual. The exploration of such a process is
important to understand the different stages and influences in the development of such a concern.
There has been limited research exploring the process of emergence and manifestation of green
consciousness. From the research available four process models which attempt to map the process
are Hines Model (Hines et al., 1987), Stern and Oskamp Model (Stern & Oskamp, 1987),
Dahlstrand and Biel Model (Dahlstrand & Biel, 1997) and a synthesis of above models proposed
by Franson and Garling (1999).
Franson and Garling (1999) indicate that how people become environmentally concerned is an
important question which is not yet answered. In this paper we attempt to answer the above
question of the green consciousness emerges and how it manifests in the behaviour. The grounded
theory approach is suitable for this study as it involves theory development and a process oriented
research question (Strauss & Corbin, 1990).

Method
We used semi-structured interviews with open ended questions to facilitate appropriate data
collection which could illuminate the process and phenomenon we are investigating.
We conducted 5 in-depth interviews each lasting on an average for fifty minutes. The interview
participants were selected by the theoretical sampling approach (Strauss & Corbin, 1990). For
selection of participants we sent out a mailer to the entire batch of doctoral students at premier B-
school requesting volunteers for the study. In the mail we defined green consumption and
requested only those students who have frequently engaged in such behaviour. Thus selecting
participants who regularly engage in green consumption provides evidence of existence of green
consciousness and thus are suitable participants to study how the consciousness emerged.
Data Analysis
As the first analytical step we engaged in open coding of all the interviews. It involved line by line
or paragraph by paragraph labelling of concept or phenomenon being observed. Open codes have
been in terms of actions mostly in gerund form to stay close to data and avoiding direct jumps to
concepts (Charmaz, 2014). Once the open codes where developed next we developed categories
by grouping related open codes under one category. We developed each category in terms of its
properties and dimensionality. Next we conducted axial coding in which we develop a paradigm
model for each of the categories and develop in further in terms of sub-categories like causal
conditions, context, phenomenon, intervening conditions, action strategies and consequences
(Strauss & Corbin, 1990). Post axial coding we integrated all the categories through the process
of selective coding. It is process in which we identify a core category and systematically relate it
to other category and validate those relationships. The process of analysis was iterative we moved
back and forth between the data, emerging codes and theoretical concepts.
Theoretical Model
We find that manifestation of green consciousness is a four stage process. Each stage has its own
defining characteristics, causative conditions and influence on consumption behaviour. We find
that exposure to environmental information and personal experiences regarding the same are two
common causative conditions for each of the stage of manifestation of green consciousness.
Experience and exposure lead to initial manifestation of the consciousness. Initial manifestation
occurs in the pro environmental behaviour in day-to-day life like not using plastic bags for getting
grocery, switching off light fans when not in use, avoiding wastage of water etc. Such behaviours
have been in public discourse for long time and carry normative expectations.
Thus initial manifestation is the first stage of emergence and manifestation of green consciousness.
The initial manifestation then leads to development of Stage-I of green consciousness if continued
exposure and awareness is maintained. (See Fig 1 for the theoretical model). This is the first stage
of manifestation. The individuals in this stage are low on product commitment as well as lifestyle
commitment. Individuals might progress to stage-II of being a product lover from stage when with
continued experience and exposure coupled with specific attitude towards some component of
environment. E.g. deep concern for animals or high importance to organic food etc. such an attitude
has its source in some specific exposure or experience from some specific exposure or experience.
In stage-III individuals are experimenting with range of products and not just any specific products.
They look to buy each product with after thorough research of its environmental impact. But they

often struggle in this research because of lack of information to analyse the environmental impact.
Individuals in stage-IV of manifestation have completely moved past the green product
consumption stage. They believe all and any kind of consumption is harmful to environment.
Hence, they believe that leading a minimalistic lifestyle and minimising consumption to the extent
possible is the only way to act in a pro environmental way.
The key contribution of this study is the multi-stage manifestation of the environmental
consciousness. This finding is a very important contribution towards the research and practice of
green marketing as it provides more clarity on the nature of green consciousness. As green
consciousness has been identified as an important variable influencing the intention to buy green
products, understanding its emergence and manifestation will sharpen the focus of practice and
research. It provides most important insights to the marketers of green products to better segment
and target their markets.
References
Ajzen, I. (1991). The theory of planned behavior. Organizational behavior and human decision
processes, 50(2), 179-211.
Charmaz, K. (2014). Constructing grounded theory. Sage.
Dahlstrand, U., & Biel, A. (1997). Pro‐environmental habits: propensity levels in behavioral
change1. Journal of applied social psychology, 27(7), 588-601.
Hines, J. M., Hungerford, H. R., & Tomera, A. N. (1987). Analysis and synthesis of research on
responsible environmental behavior: A meta-analysis. The Journal of environmental
education, 18(2), 1-8.

Fransson, N., & Gärling, T. (1999). Environmental concern: Conceptual definitions, measurement
methods, and research findings. Journal of environmental psychology, 19(4), 369-382.
Strauss, A., & Corbin, J. (1990). Basics of qualitative research (Vol. 15). Newbury Park, CA: Sage.
Stern, P. C., & Oskamp, S. (1987). Managing scarce environmental resources. Handbook of
environmental psychology, 2, 1043-1088.

Green Attitude of Women and their influence on the green behavior
of the family
Selvalakshmi M & Kalpana Sai B
Thiagarajar School of Management, Madurai & Karunya School of Management, Coimbatore
Introduction
The World today faces several environmental threats such as rise in Earth’s Temperature,
Depletion of Ozone layer leading to change in the atmosphere, Soil degradation, Air and Water
Pollution, Demand for clean water and air etc. The underlying assumptions on individual needs
and wants and resource availability are seriously questioned. While responsible consumption could
be a possible solution to the problem, organizations have taken initiatives to bring about an
attitudinal change in the market place as well. The emerging green technology economy is
expected to be worth $4.2 trillion annually by 2020 (United Nations, 2014). The purpose of green
marketing is to create awareness among consumers on environmental issues and make them
understand how their green practices would help in saving the environment (Cherian & Jacob,
2012) Firms who aspire to practice responsible green marketing therefore are expected to have a
holistic approach with integrated: strategic and tactical process instead of being a mere “marketing
hype” or tactical opportunity (Polonsky, Rosenberger, 2001).
The innovation of green products has led to the evolution of a consumer segment with unique
‘LOHAS’, an acronym standing for “lifestyles of health and sustainability” (Environmental
Leader, 2009). Green products thus sell the lifestyle value of “responsibility” which is reflected by
activities such as reducing, reusing and recycling. (Catriona Sandailands, 1993).
Role of Women in green marketing:
The need to sensitize and create awareness about the importance or green consumption among
women is vital, as they tend to influence the family as a whole. This goes well with the saying
“If you educate a man you educate an individual, but if you educate a woman you educate a family
(nation) – Dr. James Emmanuel Kwegyir- Aggrey (1875 – 1927)
Though globalization might have resulted in intermingling of values across continents, consumers
purchase decisions tend to be a strong reflection of the influence of family and group values and
the consumer’s need to confirm to such social norms. (Khare, 2011; Khare, Arpita, 2015)
While gender may not have make a significant difference in green attitude amongst students (
Dubey &Malik, 2014), the importance of understanding the needs and wants of women aged 35 to
55, who are particular on careers before having kids, with active social life and in many ways
resemble their daughters than their mothers can never be under estimated. (Craig R Johnson, 2008)
With the evolving trend of women influencing purchase behavior including masculine products,
their consumption roles have also expanded with their role change (Selvalakshmi M, 2015) with
the wife gaining more influence in family decision-making process.(Michael A. Belch,
Laura A. Willis , 2002)

Women are more involved in household decisions pertaining to trivial and relatively unimportant
items such as interior decorations, food preparation, shopping for children unlike men who are in
the helm of financial affairs. (Edgell 1980; Abbot, P. and C. Wallace.1990).
The duration of marriage life, age, and men’s age of marriage have affected the women’s family
participation with duration having the most share in dependent variable changes. Mojdeh Kiani
(2012)
Educational attainment, age of the women, occupation and income were found to be positively
related to women decision-making power at household level.(Sultana AM, 2011; Zahra Rezapour,
, Hamid Ansar, (2014)
With the dramatic increase in two-wage-earner families in recent years, the topic of task sharing
has relevance for marketers of a wide range of goods and services. (Mary Lou Roberts (1981).
And while grocery shopping is one such task, the results in terms of brand choice, vary if the job
has been done by the women. (Newsweek 1979, Progressive Grocer 1980)
However, there is limited evidence that males are performing some traditionally female tasks
(Roberts and Wortzel 1979a)
Though women’s activities in keeping with their dual role in their profession and family, tend to
be more diversified than those of men, primarily women are involved in house-keeping and are in
assisting dependents like children, the elderly, the disabled and people with health problems
(European Parliament (2012)
In adolescents social influence has been the major influence of green purchasing behavior,
followed by environmental concern and self image in environmental consciousness (Kaman Lee,
2008). Studies confirm that attitudes towards environment is significantly related to the consumer
behavior towards green products (Dahm MJ, Samonte AV, Shows AR., 2009, Lockie et al,2004 )
Study reveals that women are more concerned about environmental, health and climate issues,
compared with men (Petrović, N, 2016). Bord and O’ Conor(1997) also reported that women not
only more concerned about the hazardous wastes and the consequent risks of global warming than
their male counterparts but also about the possible negative impacts of the global warming on the
health of their family members. A survey conducted by Plastics Make It Possible shows that 70
percent of households make recycling a priority, and more than two-thirds of these residents cite
that the woman of the home serves as the “recycling enforcer.” (Amanda Wills, 2009)
Research on consumption patterns in Europe shows that women on average generate fewer
greenhouse gas emissions than men, as a result of their greater reliance on public transport, lower
consumption of meat and higher levels of energy poverty, partly because of women’s lower
incomes (European Institute for Gender Equality, 2012). In a study conducted among the women
living in Iran on the factors affecting female consumers' willingness for green purchase it has been
inferred that a positive attitude toward green products influence personal self -image, social
impacts and eventually their willingness to buy green products.(Hojjat Mobrezia, Behnaz
Khoshtinat , 2015)
If environmental behavior is to be a household behavior then the life of women of the house will
be instrumental in devising the new private ecological morality (Sandialands, 1993).To promote

green behavior (Dagher, G. K., Itani, O., & Kassar, A. N. (2015) have recommended to examine
uniqueness of different segments especially females in the context of their new social roles.
Women thus tend to be the core of creating an environment oriented culture. However their ability
to eventually influence others in their family in emulating the same culture is still an area to be
explored. Also focus of the studies which deal with family as a consumption unit had been narrow
and not been thoroughly understood as a social system (Commuri et al, 2000). The study is focused
on this gap in the research.
Purpose: The purpose of this study is to examine the green attitude and behavior of women in a
family and their influence of green behavior among the other members of the family. The
conceptual frame work of the study is as follows:
Design/methodology/approach: The study is conducted among the women in household. Primary
data is collected through survey method by contacting household women who are in the age group
of 30- 50 years.
Research limitations/implications: While the study addresses the attitude and behavior of women
towards green it does not focus on any product category or brand and hence may need further
exploration for results in those areas.
Findings: The study brings out the impact of women in a family to initiate and influence the green
behavior of other members. The educational background of the women is found to be of significant
relevance and the environmental concern of the individual plays a role in the process.
Practical implications: The findings would enable the firms to understand the perceptions,
attitudes and behavior of women who are more influential in the consumption pattern of the family
as a whole. The firms can design and develop marketing strategies keeping in mind the current
psychological trends and can get a perspective on the potential future trends of the next generation.
Originality/Value : The influence of various factors such as social, personal and environment have
been studied in the Indian context. A study on green attitude and behavior with special reference
to women will add to the existing literature of the discipline.
Respondent'sAge
Educational Background
Employment Status
Environmental Attitude
Environmental Concern
Environmental Behavior
Influence of Green Behavior of the
family
Reference:
Belch, Micheal, Willis, Laura, (2002) Family decision at the turn of the century: Has the changing
structure of households impacted the family decision-making process? Journal of Consumer
Behavior; London 2.2 (Dec. 2002): 111-124
Environmental Leader (2009), “LOHAS Forum Attracts Fortune 500 Companies,” (June 22),
available at http://www.environmentalleader.com/2009/06/22/ greenforum-attracts-fortune-500-
companies
Jacob Cherian, Jolly Jacob (2012),Green Marketing: A Study of Consumers’ Attitude towards
Environment Friendly Products, Asian Social Science ISSN 1911-2017 (Print) ISSN 1911-2025
(Online), DOI: http://dx.doi.org/10.5539/ass.v8n12p117
Petrović, N.(2016), Women in Green Economy, Journal of Women’s Entrepreneurship and
Education 2016, No. 1-2, 97-110
Abbot, P. and C. Wallace. 1990. An Introduction to Sociology: Feminist Perspectives. New York
and London: Rutledge
Amanda Wills, Nov 13, 2009, 13:18 ET from Plastics Make it Possible
Bord, R. J., & O'Connor, R. E. (1997). The gender gap in environmental attitudes: the case of
perceived vulnerability to risk. Social science quarterly, 830-840.
Catriona Sandilands,1993, On” Green” Consumerism: Environmental Privatization and “ Family
Values”, Canadian Woman Studiesiles Cahiers De Fa Femme, Volume 13, Number 3
Commuri, Suraj and James W. Gentry (2000) Opportunities for Family Research in
Marketing, Academy of Marketing Science Review; Vancouver 2000:1
Craig R Johnson (2008), What do women really want? Barron’s: Dec 3, 2007: 87, 49: ABI/INFORM
Global pg 28.
Dahm MJ, Samonte AV, Shows AR.2009, Organic foods: do eco-friendly attitudes predict eco-
friendly behaviors?, J Am Coll Health. 2009 Nov-Dec; 58(3):195-202. doi:
10.1080/07448480903295292
Dubey S.K, Rajeev Kumar Malik, Attitude of Students towards Green marketing: A Case Study of
Banaras Hindi University, IPE Journal of Management, Jan- June 2014, Vol.4, No.1
Economy -The issue of mobility. Available from:
http://www.europarl.europa.eu/RegData/etudes/note/ (Newsweek 1979, Progressive Grocer 1980)
Edgell, S. R. 1980.Middle-Class Couples.London: Allen & Unwin.
European Parliament (2012)THE ROLE OF WOMEN IN THE GREEN
Hojjat Mobrezia , Behnaz Khoshtinat (2015) Investigating the factors affecting female consumers'
willingness toward green purchase based on the model of planned behavior a, Department of
management, Iran, 1st International Conference on Applied Economics and Business, ICAEB 2015

Kaman Lee( 2008), Opportunities for green marketing: young consumers., Marketing Intelligence
and Planning, Vol.26 No.6, 2008, pp 573-586
Khare, A. (2011), "Impact of Indian cultural values and lifestyles on meaning of branded products:
study on university students in India", Journal of International Consumer Marketing, Vol. 23 No. 5,
pp. 365 - 379
Khare, Arpita, (2015) Antecedents to green buying behavior: a study on consumers in an emerging
economy Marketing Intelligence & Planning; Bradford 33.3 (2015): 329-309.
Lockie, S., Lyons, K., Lawrence, G. & Grice, J. 2004. Choosing organics: a path analysis of factors
underlying the selection of organic food among Australian consumers. Appetite, 43,135-146.
Mary Lou Roberts (1981),"Women's Changing Roles -- a Consumer Behavior Perspective", in NA -
Advances in Consumer Research Volume 08, eds. Kent B. Monroe, Ann Abor, MI: Association for
Consumer Research, Pages: 590-595.
Michael Jay Polonsky and Philip J. Rosenberger III (2001), Reevaluating Green Marketing: A
Strategic Approach, Business Horizons / September-October 2001
Mojdeh Kiani (2012), How Much Are Women Involved in Decision Making in Family in Iran?,
Sociology Study ISSN 2159‐5526 , June 2012, Volume 2, Number 6, 417‐427
Roberts, Mary Lou and Wortzel, Lawrence H. (1979a) "Husbands Who Prepare Dinner: A Test of
Competing Theories of Marital Role Allocations." in Jerry L. Olsen, ed., Advances in Consumer
Research, 7, 669-671.
Selvalakshmi, M., & Ravichandran, K (2015) Factors Determining The Perceived Retail Service
Quality Among The Women Customers. Global Management Review, 9(4)
Sultana AM, Journal of Applied Sciences Research, 2011,7 (1), 18
Zahra Rezapour, Hamid Ansar, (2014), Studying the factors associated with women's participation
in family decision Making-(Case study: Northern Khorasan, Iran), European Journal of Experimental
Biology, 2014, 4(1):553-556

Brand Coolness: Structure, Measurement, and Consequences
Rajeev Batra, Caleb Warren, Sandra Maria Correia Loureiro & Richard P. Bagozzi
University of Michigan
Marketers strive to create cool brands, but the literature does not offer a blueprint for what brand
coolness means or how brands become cool. Given the ability of coolness to lead trends and
influence consumer preferences, understanding the factors that shape brand coolness is important
for marketers and academics alike. Yet the literature on coolness remains fragmented. Although
research has begun to investigate personality traits associated with cool people (Dar Nimrod et al.
2012; Horton et al. 2012; Keller and Kalmus 2012), or features of cool technologies (Bruun et al.
2016; Fitton et al. 2012; Read et al. 2011), and how specific factors such as autonomy (Warren
and Campbell 2014) and novelty (Im, Bhat, and Lee 2015) influence perceptions of coolness, the
literature has not systematically identified the characteristics differentiating cool from uncool
brands.
This research uses a mixed-methods approach to conceptualize brand coolness and identify a set
of characteristics prototypically associated with cool brands. We use a grounded theory approach
to identify the characteristics of cool brands. Because coolness is socially constructed (Connor
1995; Warren and Campbell 2014), we investigate the factors that consumers associate with brands
that they personally perceive to be cool in order to build a better understanding of the cool
prototype. Like previous research that has attempted to build an understanding of prototype
constructs like brand love (Batra et al. 2012) and heroism (Kinsella et al. 2015), we begin our
investigation with a qualitative, exploratory approach (i.e., focus groups, depth interviews, essays)
before moving towards increasingly more quantitative, confirmatory analyses (i.e., surveys and an
experiment). Through a series of studies in Europe and the USA that leverage focus groups, depth
interviews, essay writing, surveys, and experiments, we generate and validate a higher-order
structural model of brand coolness with a multi-item scale that measures ten prototypical
characteristics of cool brands: originality, authenticity, rebellion, usefulness, aesthetic appeal,
excitement, popularity, status, symbolism, and subcultural appeal. Five surveys (a) develop a set
of items to reliably measure the component characteristics of brand coolness, (b) situate brand
coolness within a nomological network of related constructs, and (c) show that brand coolness
influences important outcome variables, including consumers’ attitudes towards, satisfaction with,
and willingness-to-pay for the brand.
Finally, an experiment confirms that varying the component characteristics of brand coolness (e.g.,
by making a brand more original or higher status) influences the extent to which consumers
perceive the brand to be cool, and, consequently, the extent to which they hold a favorable attitude
towards, are willing to pay for, and intend to spread favorable word-of-mouth about the brand.
Keywords: Brands, Coolness, Attitudes, Scale Development, Structural Equation Modeling

References
Aaker, Jennifer L. (1997), "Dimensions of Brand Personality," Journal of Marketing Research,
34 (3), 347-356.
Batra, Rajeev, Aaron Ahuvia, and Richard P. Bagozzi (2012), "Brand Love," Journal of
Marketing, 76 (2), 1-16.
Belk, Russell W., Kelly Tian, and Heli Paavola (2010), "Consuming Cool: Behind the
Unemotional Mask," Research in Consumers Behavior, Vol .12, Ed. Russel W. Belk,
Emerald, 183-208.
Bird, Sara and Alan Tapp (2008), "Societal marketing and the meaning of cool," Social
Marketing Quarterly, 14, 18-29.
Connor, Marlene K. (1995), What Is Cool? Understanding Black Manhood in America, New
York: Crown Publishers.
Dar-Nimrod, Ilan, I. G. Hansen, T. Proulx, and D. R. Lehman (2012), "Coolness: An Empirical
Investigation," Journal of Individual Differences, 33, 175-185.
Eastman, Jacqueline K. and Ronald E. Goldsmith (1999), "Status Consumption in Consumer
Behavior: Scale Development and Validation," Journal of Marketing Theory & Practice, 7
(3), 41-52.
Ferguson, Shelagh (2011), "A Global Culture of Cool? Generation Y and Their Perception of
Coolness", Young Consumers: Insight and Ideas for Responsible Marketers, 12, 265-275.
Frank, Thomas (1998), The Conquest of Cool: Business Culture, Counterculture, and the Rise of
Hip Consumerism, University of Chicago Press.
Goulding, Christina (2002), Grounded Theory: A Practical Guide for Management, Business and
Market Researchers, London: Sage Publications.
Im, Subin, Subodh Bhat, and Yikuan Lee (2015), “Consumer Perceptions of Product Creativity,
Coolness, Value and Attitude,” Journal of Business Research, 68 (1), 166–72.
Heath, Joseph and Andrew Potter (2004), Nation of Rebels: Why Counterculture Became
Consumer Culture, New York: Harper Collins.
Hebdige, Dick (1979), Subculture, the Meaning of Style, London: Methuen.
Kinsella, Elaine L., Timothy D. Ritchie, and Eric R. Igou (2015), "Zeroing in on Heroes: A
Prototype Analysis of Hero Features," Journal of Personality and Social Psychology, 108
(1), 114-127.
McCracken, Grant (1988), The Long Interview. Vol. 13. Newbury Park, CA: Sage.

Nancarrow, Clive, Pamela, Nancarrow, and Julie Page (2002), "An Analysis of the Concept of
Cool and Its Marketing Implications," Journal of Consumer Behaviour, 1 (June), 311-22.
Pountain, Dick and David Robins (2000), Cool Rules: Anatomy of an Attitude, London:
Reaktion.
Rosch, Eleanor (1975), “Cognitive Representations of Semantic Categories,” Journal of
Experimental Psychology: General, 104 (3), 192–233.
Runyan, Rodney C., Mijeong Noh, and Jon Mosier (2013), “What Is Cool? Operationalizing the
Construct in an Apparel Context,” Journal of Fashion Marketing and Management, 17(3),
322–40.
Sundar, S. Shyam, Daniel J. Tamul, and Mu Wu (2014), “Capturing ‘Cool’: Measures for
Assessing Coolness of Technological Products,” International Journal of Human-Computer
Studies, 72(2), 169–80.
Warren, Caleb and Margaret C. Campbell (2014), “What Makes Things Cool? How Autonomy
Influences Perceived Coolness,” Journal of Consumer Research, 41(2), 543–63.

Cool brand1
Autonomy6
Rebellious 9
High status10
Popular11
Symbolic13
Value2
Sub culture12
Aesthetic appeal5
Useful3
Original7
Authentic8
Exciting4
y36
y35
36
35
36
1
1
34
13,1
12,1 11,1
10,1
91
61
8611 42
52
y33 y32y31
y34
31
33 32
y28
28
y29
29
y30
30
y27
27
1
1
3233
34
2829
30
y26 y25
y24
y23 23
24
2526
y22 y21
y20
y19 19
20
2122
y2y1 y3 y13y12 y14 y16y15 y17 y18y5y4 y6 y7 y9y8 y10 y11
1 2 3 4 5 6 7 19 9 10 11 12 13 14 15 16 17 18
1 1 1 1 123 5
76 9 10
11 1314 16 17
18
1
1
26 25
24
22 21
20
Figure 1. Higher-order Confirmatory Factor analysis model for cool brand items

Figure 2. Prediction of dependent variables by higher-order representation of Perceived Brand Coolness with brand personality as covariates (coefficients and R2s not in parentheses for cool sample, in parentheses for not-cool)
Useful
Exciting
Aesthetic appeal
Original
Authentic
Rebellious
High
status
Popular
Sub-culture
Symbolic
Autonomy
Value
BrandCoolness
R2 = .38 (.55)
Nomological Model using Higher-Order Brand Coolness
Dependent variables
Attitude valence
Overall brand love
Word of mouth
Willingness to pay
Delight (positive affect)
Satisfaction
Pride
Sophisticated
Competent
Rugged
Excited
Sincere
.58(.75)
.63(.78)
.36(.60)
.56(.77)
.54(.67)
Self-brand connections
R2 = .40(.59)
R2 = .52(.55)
R2 = .32(.41)
R2 = .27(.48)
R2 = .56(.66)
R2 = .51(.53)
R2 = .63(.69)
Brand personality dimensions
.61(.74)
.63(.77)
.72(.74)
.57(.64)
.52(.69)
.75(.81)
.71(.73)
.79(.83)

43
Attitude as a mediator of relevance of product attributes on
perception of blended brand names
Sunny Arora, Arti D. Kalro, Dinesh Sharma
S. P. Jain Institute of Management and Research &Indian Institute of Management, Mumbai
Introduction and Literature Review
With an immense demand of new brand names due to increase in web names and trademark-
related issues, researchers have been focusing on developing methods for creation of brand
names (Arora et al., 2015). Brand-naming researchers have been working on devising new
techniques using the concept of sound symbolism (sounds have meaning) for developing brand
names in the last few decades (Klink, 2000; Yorkston and Menon, 2004; Lowrey and Shrum,
2007). The current research trend has witnessed a focus on testing perceptions of fictitious
brand names due to sound symbolism, for example, detal/dutal (Klink, 2000), frish/frosh
(Yorkston and Menon, 2004). Various product categories such as cars and deodorants
possessing attributes like bigness and masculinity (Klink, 2000) have been chosen to study.
Arora et al. (2015) developed a brand-naming classification framework and identified blending
(forming a word from parts of two or more different words; for example, Vodafone; Voice
Data Fone) as a frequently used dimension by practitioners for brand-naming. Using this
dimension Arora et al. (2017) coined a brand-naming technique called blended brand names
[a brand name containing at least one semantic imbed and at least one non-semantic imbed; for
example, Limauto (Lim+auto; name created as experimental stimuli in their study)]. The
authors tested consumers’ perceptions of blended brand names due to sound symbolism. The
sound manipulations in tested pair of names were contrasted with high (/i/ sound in click) and
low sound frequencies (/o/ sound in clock). These sound frequencies are separately varied using
vowel sounds, consonant sounds and the combinations of vowel and consonant sounds. The
authors concluded that blended brand names, like fictitious brand names, also exhibit
differences in perception of brand names with high and low frequency sounds due to sound
symbolism. Differences in consumers’ perceptions of blended brand names due to sound
symbolism are caused most effectively by vowels, followed by combinations of vowel and
consonant sounds and the least by consonants. In another experiment conducted by the authors
in the same research article, they tested for the effect of interaction of product level
categorization and attribute abstractness on consumers’ perceptions of blended brand names.
It was observed that superordinate level of categorization (automobile) corresponded with high
level of abstractness of the product attributes (friendly), basic level (car) corresponded with
intermediate level of abstractness (small) and subordinate level of categorization (SUV) with
high level of concreteness of attributes (slow) in estimating the expected perceptions of blended
brand names due to sound symbolism. These results were visible only when the attributes were
perceived to be different in their levels of abstractness.
The two product categories selected for the study by Arora et al. (2017) were ice creams and
cars. Different levels categorization of these products were studied, viz., chocolate ice creams,
ice creams and desserts for the product category of ice creams and automobiles, cars and SUVs
for the product category of cars. The corresponding attributes chosen based on the levels of
abstractness for cars were friendly, small and slow, whereas for ice creams they were rich,
creamy and sweet. The results of their study showed significant interactions of product
categorization and attribute abstractness on consumers’ perception of blended brand names for
cars but not for ice creams. One of the reasons the authors cited for these results was that the
44
abstractness for attributes chosen for ice creams were not different from each other. The authors
did not consider the impact of the perceived relevance of these attributes on consumers’
perceptions of blended brand names. Attributes of product affect attitude towards the object
through the cognitive route (Moon et al., 1999). It has been shown in the past that attitudes
affect perceptions (Fazio and Williams, 1986).
Therefore, we hypothesize that the highly relevant perceived product attributes may affect the
attitude towards the brand name favorably which may in turn affect their brand name choice
(perception). Similarly, less relevant perceived product attributes may affect consumers’
perceptions of blended brand names unfavorably.
Keywords: Blended Brand Names, Sound Symbolism, Attitude, Perception
Research Objective
The objective of this study is to estimate the impact of attribute relevance on blended brand
names’ choice guided by sound symbolism.
Proposed Research Methodology
We intend to conduct a between-subjects experiment to study the effects of attitude as a
mediator of relevance of product attributes on consumers’ perceptions of blended brand names.
As this study in an extension of Arora et al. (2017), we intend to include the stimuli they used
for their experiments with more product categories to increase the generalizability of the
results. The product categories of mobile apps, deodorants, ice creams and cars with their three
levels of categorization and the corresponding attributes, as mentioned before, will be selected
for the study.
Expected Contribution of the Study
Theoretical
This study should enable further research in the domain of brand-naming. We have refined the
relationship of product attributes and level of categorization of product further by considering
attribute relevance in predicting differences in consumers’ perceptions of blended brand names
due to sound symbolism.
Managerial
Brand strategists will now be able to take more informed decisions in naming of a brand. They
may now not only skirt the trademark wrangling but also will have an effective and sound
foundation of consumer acceptance of the chosen brand name for their products.
References
Arora S., Kalro A. D., & Sharma D. 2015. A comprehensive framework of brand name
classification. Journal of Brand Management, 22(2): 79-116.
Arora S., Kalro A. D., & Sharma D. 2017. The effect of sound symbolism on perceptions of
blended brand names. Working Paper, FORE School of Management, New Delhi, India.
Fazio, R. H., & Williams, C. J. 1986. Attitude accessibility as a moderator of the attitude-
perception and attitude-behavior relations: An investigation of the 1984 presidential
election. Journal of personality and social psychology, 51(3): 505-514.

45
Klink, R. R. 2000. Creating brand names with meaning: The use of sound symbolism.
Marketing Letters, 11(1): 5–20.
Lowrey, T. M., & Shrum, L. J. 2007. Phonetic symbolism and brand name preference. Journal
of Consumer Research, 34(3): 406–414.
Moon, W., Florkowski, W. J., Beuchat, L. R., Resurreccion, A. V., Chinnan, M. S., Paraskova,
P., & Jordanov, J. 1999. Effects of product attributes and consumer characteristics on attitude
and behavior: The case of peanuts in a transition economy. Agribusiness, 15(3): 411-425.
Yorkston, E., & Menon, G. 2004. A sound idea: Phonetic effects of brand names on consumer
judgments. Journal of Consumer Research, 31(1): 43–51.
.
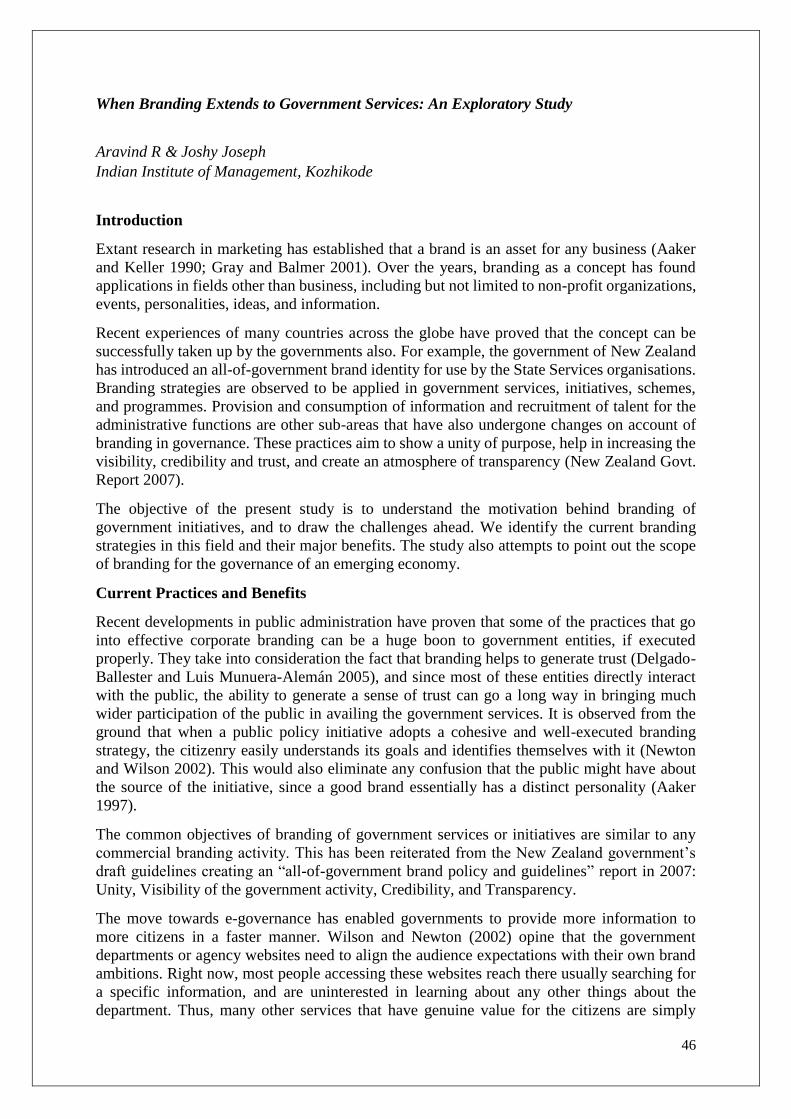
46
When Branding Extends to Government Services: An Exploratory Study
Aravind R & Joshy Joseph
Indian Institute of Management, Kozhikode
Introduction
Extant research in marketing has established that a brand is an asset for any business (Aaker
and Keller 1990; Gray and Balmer 2001). Over the years, branding as a concept has found
applications in fields other than business, including but not limited to non-profit organizations,
events, personalities, ideas, and information.
Recent experiences of many countries across the globe have proved that the concept can be
successfully taken up by the governments also. For example, the government of New Zealand
has introduced an all-of-government brand identity for use by the State Services organisations.
Branding strategies are observed to be applied in government services, initiatives, schemes,
and programmes. Provision and consumption of information and recruitment of talent for the
administrative functions are other sub-areas that have also undergone changes on account of
branding in governance. These practices aim to show a unity of purpose, help in increasing the
visibility, credibility and trust, and create an atmosphere of transparency (New Zealand Govt.
Report 2007).
The objective of the present study is to understand the motivation behind branding of
government initiatives, and to draw the challenges ahead. We identify the current branding
strategies in this field and their major benefits. The study also attempts to point out the scope
of branding for the governance of an emerging economy.
Current Practices and Benefits
Recent developments in public administration have proven that some of the practices that go
into effective corporate branding can be a huge boon to government entities, if executed
properly. They take into consideration the fact that branding helps to generate trust (Delgado-
Ballester and Luis Munuera-Alemán 2005), and since most of these entities directly interact
with the public, the ability to generate a sense of trust can go a long way in bringing much
wider participation of the public in availing the government services. It is observed from the
ground that when a public policy initiative adopts a cohesive and well-executed branding
strategy, the citizenry easily understands its goals and identifies themselves with it (Newton
and Wilson 2002). This would also eliminate any confusion that the public might have about
the source of the initiative, since a good brand essentially has a distinct personality (Aaker
1997).
The common objectives of branding of government services or initiatives are similar to any
commercial branding activity. This has been reiterated from the New Zealand government’s
draft guidelines creating an “all-of-government brand policy and guidelines” report in 2007:
Unity, Visibility of the government activity, Credibility, and Transparency.
The move towards e-governance has enabled governments to provide more information to
more citizens in a faster manner. Wilson and Newton (2002) opine that the government
departments or agency websites need to align the audience expectations with their own brand
ambitions. Right now, most people accessing these websites reach there usually searching for
a specific information, and are uninterested in learning about any other things about the
department. Thus, many other services that have genuine value for the citizens are simply

47
overlooked. Social media is an avenue which has been tapped recently for communicating
governance initiatives. This is based on the realization that the way citizens consume
information has changed beyond recognition and relying on traditional channels may not be
effective. Public policy matters used to be communicated through one-way broadcast
spectrums, but the changes in information consumption demanded new approaches. Social
media are audience-driven and multi-faceted. For any government aspiring for a brand-like
status in citizens’ minds, social media provide an effective way to communicate about their
new projects, achievements etc.
Branding government as an employer is still an afterthought at best, according to industry
experts. It is observed that private sector is far ahead of government in projecting itself as an
employer of choice (Tuutti 2012). A strong, clear brand is paramount for attracting and
retaining talent. For instance, Indian Armed Forces have been trying to promote themselves
profusely in visual media. By a clear brand message, the government or its departments can
convey the main traits unique to them, and ideally, what candidates are looking for in terms of
an opportunity. This elevator pitch is not done very well in government sector, according to
practitioners such as Cole (2012) and Sidney Fuchs (2012). They observe that the government
agencies are not leveraging on the government as an employer brand to highlight the unique
opportunities offered by them when compared those offered by the private sector (Tuutti 2012).
The lack of a clear brand can lead people into reinforce preconceived notions that may not align
with an agency’s message and it is difficult to shake off this negative perception. Industry
observers point out the NASA story as a classic example of employer brand (e.g.: Tuutti 2012).
Specifically, it has been able to tap top talent despite budget constraints and other challenges
because the agency has one of the most recognizable brands of any employer in the world.
Challenges in Implementation
Addressing the question how the branding idea helps in getting larger participation from the
public remains a big challenge. Involving them right from the formulation of the schemes and
initiatives is definitely an option. However, in a vast and diverse country like India, getting
public participation on the same platform and justifying the investment is a difficult task.
Moreover, convincing the public about spending money on an intangible aspect can be quite
tricky for government branding. Several communication consultants have expressed
apprehension on how a rather formal identity of a brand works with campaigns that are intended
to engage people (L’Etang, McKie, Snow, and Xifra 2015).
Often, implementers commit the mistake of hastily creating a brand when any new initiative is
announced, without having any coherent brand strategy. The challenge here is to achieve the
set of objectives and at the same time, be relevant to the audience inside and outside of the
organization (Antonopoulos 2012). Another issue is that it is unlikely that most people
associate the services they experience with the government initiative that has given them the
same. This indicates clear lack of brand awareness and hence, the clamour for a singular brand
image. If created, the public can place more faith on services that have understood to come
from the government. This would also help in increasing the scope of extending the brand in
future. A case in point is the Swatch Bharat Abhiyaan, a campaign by the government of
India to clean the streets, roads and infrastructure of the country. Extending this brand to other
lesser-known cleanliness initiatives would be possible only if there is sufficient brand
awareness of the parent scheme among the target group.
With regard to projecting itself as an employer brand, the challenge before governments is to
comply with the following four key components:
Relevance: The brand has to resonate with the jobseekers- it has to be relevant.
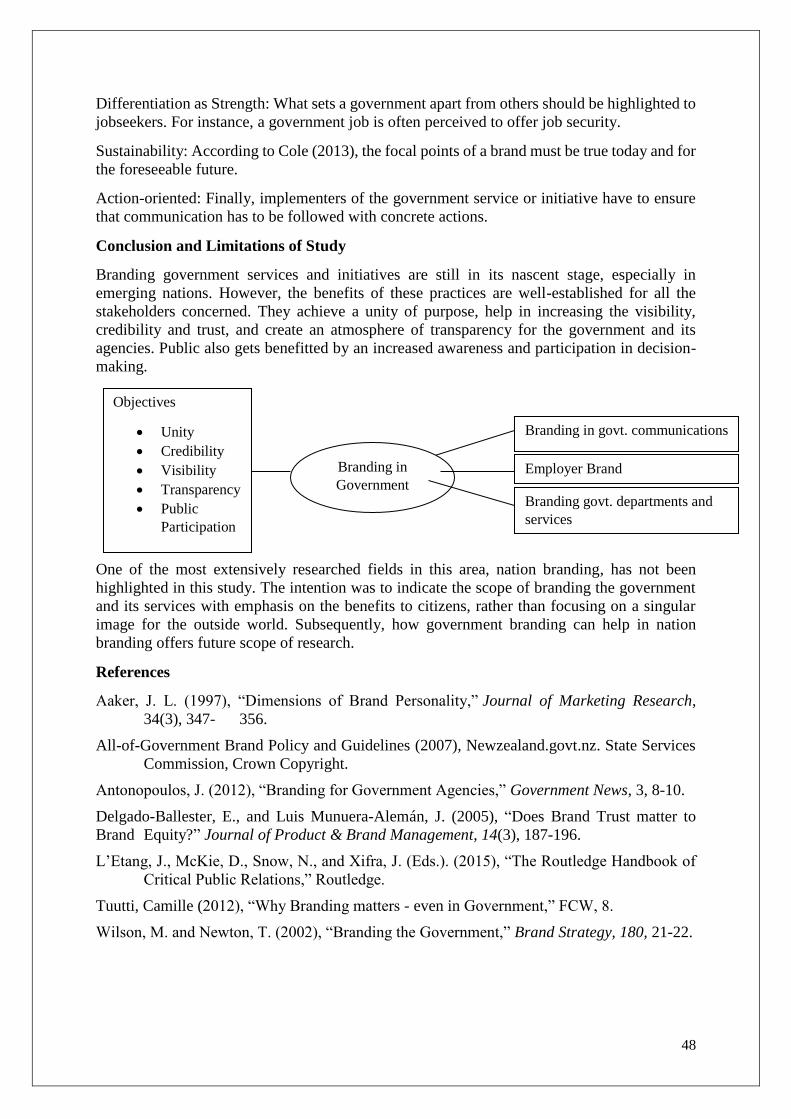
48
Differentiation as Strength: What sets a government apart from others should be highlighted to
jobseekers. For instance, a government job is often perceived to offer job security.
Sustainability: According to Cole (2013), the focal points of a brand must be true today and for
the foreseeable future.
Action-oriented: Finally, implementers of the government service or initiative have to ensure
that communication has to be followed with concrete actions.
Conclusion and Limitations of Study
Branding government services and initiatives are still in its nascent stage, especially in
emerging nations. However, the benefits of these practices are well-established for all the
stakeholders concerned. They achieve a unity of purpose, help in increasing the visibility,
credibility and trust, and create an atmosphere of transparency for the government and its
agencies. Public also gets benefitted by an increased awareness and participation in decision-
making.
One of the most extensively researched fields in this area, nation branding, has not been
highlighted in this study. The intention was to indicate the scope of branding the government
and its services with emphasis on the benefits to citizens, rather than focusing on a singular
image for the outside world. Subsequently, how government branding can help in nation
branding offers future scope of research.
References
Aaker, J. L. (1997), “Dimensions of Brand Personality,” Journal of Marketing Research,
34(3), 347- 356.
All-of-Government Brand Policy and Guidelines (2007), Newzealand.govt.nz. State Services
Commission, Crown Copyright.
Antonopoulos, J. (2012), “Branding for Government Agencies,” Government News, 3, 8-10.
Delgado-Ballester, E., and Luis Munuera-Alemán, J. (2005), “Does Brand Trust matter to
Brand Equity?” Journal of Product & Brand Management, 14(3), 187-196.
L’Etang, J., McKie, D., Snow, N., and Xifra, J. (Eds.). (2015), “The Routledge Handbook of
Critical Public Relations,” Routledge.
Tuutti, Camille (2012), “Why Branding matters - even in Government,” FCW, 8.
Wilson, M. and Newton, T. (2002), “Branding the Government,” Brand Strategy, 180, 21-22.
Branding in
Government
Branding in govt. communications
Employer Brand
Branding govt. departments and
services
Objectives
Unity
Credibility
Visibility
Transparency
Public
Participation

49
Fair or Unfair: The Persuasive Role Webcare Attributes in Handling Negative Reviews.
Tathagata Ghosh, Amar Raju G & Souvik Roy
IBS, Hyderabad
One form of electronic word of mouth (eWOM), customer-generated online reviews, is having
a particularly strong impact on how consumers obtain information, evaluate and reach purchase
decisions in relation to tourism and hospitality products and services (Browning, So, & Sparks,
2013; Hudson & Thal, 2013; Xiang & Gretzel, 2010). Many companies have started to monitor
and intervene in negative reviews, to mitigate the detrimental effects of negative online
reviews, a practice known as Webcare (Van Noort and Willemsen, 2012). The present article
seeks to explore the effects of selected webcare attributes, namely webcare level of detail and
webcare timeliness on perceived fairness. We also posit that reputation of the reviewer depicted
in the reviews would moderate the afore-mentioned relationships. Finally, the article
investigates whether perceived fairness leads to pragmatic consumer-level outcomes by
analyzing the effects of perceived fairness on satisfaction with webcare, and restaurant visit
intention. The validity of the postulations were put to scrutiny by adopting a sequential
approach whereby effects of webcare characteristics on perceived fairness in the presence of
reviewer reputation as a moderator were first examined. Following this, the effects of perceived
fairness on satisfaction with webcare, and restaurant visit intention were investigated. The
experiment used a 2 (Webcare Level of Detail: Detailed vs. General) × 2 (Webcare Timeliness:
Timely vs. Delayed) × 2 (Reviewer Reputation: High vs. Low) between-subjects design. Three
hundred and fifty four post-graduate students (212 men, 142 women; mean age=22.6 years) of
a university participated in the study. ANCOVA was used to test the effects of webcare
characteristics on consumer forgiveness. Further, OLS based regression was used to test the
effects of perceived fairness on satisfaction with webcare, and restaurant visit intention. The
study was done in the context of a fictitious restaurant brand. A significant main effect of
webcare level of detail and webcare timeliness was found on perceived fairness. Further, a
significant webcare level of detail × webcare timeliness interaction effect was also found,
thereby showing that detailed timely webcare resulted in higher perceived fairness than detailed
delayed webcare, general timely webcare, and general delayed webcare. This study contributes
to research dealing with consumers’ complaint in an online environment - a relatively new
domain called webcare. The study had several implications for academicians and managers.
This study is one of the few studies to examine characteristics of both a review and a webcare
together and investigate the impact on consumer related outcomes.
Keywords: Webcare, webcare attributes, negative online reviews, perceived fairness,
reviewer reputation.
References
Browning, V., So, K. K. F., & Sparks, B. (2013). The influence of online reviews on consumers'
attributions of service quality and control for service standards in hotels. Journal of Travel &
Tourism Marketing, 30(1-2), 23-40.
Greenberg, J. (1986). Determinants of perceived fairness of performance evaluations. Journal
of applied psychology, 71(2), 340.

50
Hudson, S., & Thal, K. (2013). The impact of social media on the consumer decision process:
Implications for tourism marketing. Journal of Travel & Tourism Marketing, 30(1-2), 156-160.
Schamari, J., & Schaefers, T. (2015). Leaving the home turf: how brands can use webcare on consumer-
generated platforms to increase positive consumer engagement. Journal of Interactive Marketing, 30,
20-33.
Van Noort, G., & Willemsen, L. M. (2012). Online damage control: The effects of proactive versus
reactive webcare interventions in consumer-generated and brand-generated platforms. Journal of
Interactive Marketing, 26(3), 131-140.
Xiang, Z., & Gretzel, U. (2010). Role of social media in online travel information
search. Tourism management, 31(2), 179-188.

51
Many Roles of Private Labels: A taxonomy of store brand strategies based on customer
preference distribution.
Raj Sethuraman
Southern Methodist University, Dallas
Modern-day store brands or private labels are brands generally owned, controlled, and
marketed exclusively by a retailer. They were introduced more than 100 years ago in some
limited items such as tea (Fitzell 1992), and they are now prevalent in over 60% of product
categories in the United States and Europe. According to the Private Label Manufacturers
Association (www.plma.com), nearly one out of four grocery products bought in U.S.
supermarkets in 2016 was a store brand, recording over $120 billion in total sales with revenue
share of 17.7% and unit share of 21.1%. Private label penetration in Europe is even higher
with shares reaching over 40% in many countries. Private labels are also beginning to take root
in developing economies such as Asia and Latin America (Sethuraman and Gielens 2014).
The traditional view of private label has generally embraced the following premises :
(i) Private labels succeed in commodity products with little scope for differentiation.
(ii) Private labels thrive in high volume categories.
(iii) In these categories, private labels are positioned as low-priced, value alternatives to
name brands or national brands.
(iv) Thus private labels are engaged in a zero-sum game with national brand competitors in
an us vs. them approach.
(v) The greater the share of private labels, the higher is the retailer profits.
While this traditional view may be prevalent in many situations, there is also ample
evidence to the contrary. For example, in a recent report on the state of private labels around
the world (Nielsen 2014), the leading market research firm Nielsen observes the following:
(i) What is a commodity product in one country may not be a commodity in another
country.
(ii) Store brands have done well in non-commodity products such as cereal and alcoholic
beverages in some countries.
(iii) Astute category management has the potential to make it a win-win situation for
national brand manufacturers and retailers rather than a win-lose situation.
(iv) While some commonalities exist, the categories where private-label market shares are
strongest vary dramatically by country.
(v) Even in the most-developed European markets, where one might expect similar
purchasing habits across countries, big differences exist in private-label and name-
brand performance for each category by country.
(vi) Sophisticated private label programs in developed countries have witnessed the
emergence of multi-tier private label strategy with introduction of more than one store
brand in a category.
(vii) Private label struggles to gain consumer trust in Asia and the Middle East, where
consumers are fiercely brand-loyal.

52
These observations contrary to the traditional view suggest that there is no “one-size
fits all” approach for global private label development. Retailers have to adopt the private label
strategy that is appropriate for the demand and supply conditions faced by them in the particular
category in that market. The purpose of this chapter is develop a taxonomy that explicates the
types of demand and supply conditions faced in the market and the feasible private label
strategies that correspond with those demand and supply conditions. In particular, we describe
15 consumer preference distributions and develop 44 types of store brand strategies based on
three criteria: (i) whether the store brand(s) deployed is standard, economy or premium or a
combination; (ii) whether the approach to competing national brand is no switching, passive
switching, or aggressive switching; and (iii) whether the goal from category perspective is no
expansion, passive expansion, or aggressive expansion. The strategies are described in Figure
1.
REFERENCES
Fitzell, P. B. (1992), Private label marketing in the 1990s: the evolution of price labels into
global brands. New York: Global Book Productions.
Nielsen Report (2014) “The State of Private Labels Around the World,” November, National
Global Private Label Report,
https://www.nielsen.com/content/dam/nielsenglobal/kr/docs/global-
report/2014/Nielsen%20Global%20Private%20Label%20Report%20November%202
014.pdf
Sethuraman, Raj and Katrijn Gielens (2014), “Determinants of Store Brand Share,” Journal of
Retailing, 90 (June), 141-153.

53
Tectonic Shift in Millennials Consumer Behaviour -Is digital payments the game changer
for Indian Marketers?
Manohara.S & Rajendra Nargundkar
BMS College of Engineering, Bangalore, IIM Indore
Abstract : India being mainly cash dominated society and most of the transactions were done
using cash. Credit Lyonnais Securities Asia (CLSA) in its report pegs the figure at 68% share
of cash based transactions next to Indonesia and Russia. Economic times (2016) indicates about
98% of all consumer payments in India use cash. The consumer had an easy access to currency
and felt the convenience of using it anywhere and everywhere which made it more popular way
for transaction across India. The study tries to focus on the current generation customers who
belong to a certain age group and are known as Millennials. The Millennials are the men and
women who are born after 1980. They seem to be impatient, impulsive and fidgety. The
popularity of a various payment service providers and the purposes of using them are portrayed
clearly. The study results provide insights if the digital transaction is going to be the new order
of consumer buying henceforth.
Key words: Millennials, digital payments, cash transactions, mobile payments
Introduction
On November 8th 2016 when the Prime Minister of India to the step of demonetising 500 and
1000 rupee notes, it brought about a significant impact on the availability of currency notes for
circulation. This shortage created a huge bandwidth for online payment using mobile phones
or digital wallets and other popular formats. According to a source from statistica the "Digital
Payments" segment total transaction value amounts to US$43,831m in 2017. When the author
was analysing the information from National Payment Corporation of India (NPCI), it showed
a short term splurge but a definitive indicator in the direction of the future of digital payments
as shown in table-1.
Table-1 All bank data (monthly) pre and post demonetization
Month &
year
ECS
(Value in billion
rupees)
NEFT
(Value in billion
rupees)
RTGS
(Value in billion
rupees)
Mobile Banking
(Value in billion
rupees)
Oct 2015 256.15 6906.88 63365.56 305.68
Oct 2016 18.59 9504.50 76473.29 1139.41
Dec 2016 14.39 11537.63 84096.48 1498.18
Source: NPCI website
The data from table-1 clearly reveals the trend of digital payments in most formats used through
the bank platforms and also shows the sudden increase of the same post the demonetization.
There is also indication that customer moved from ECS towards NEFT, RTGS and Mobile
Banking which gives them the flexibility to pay at their own convenience. The same
information is pictorially depicted in the given figure-1.
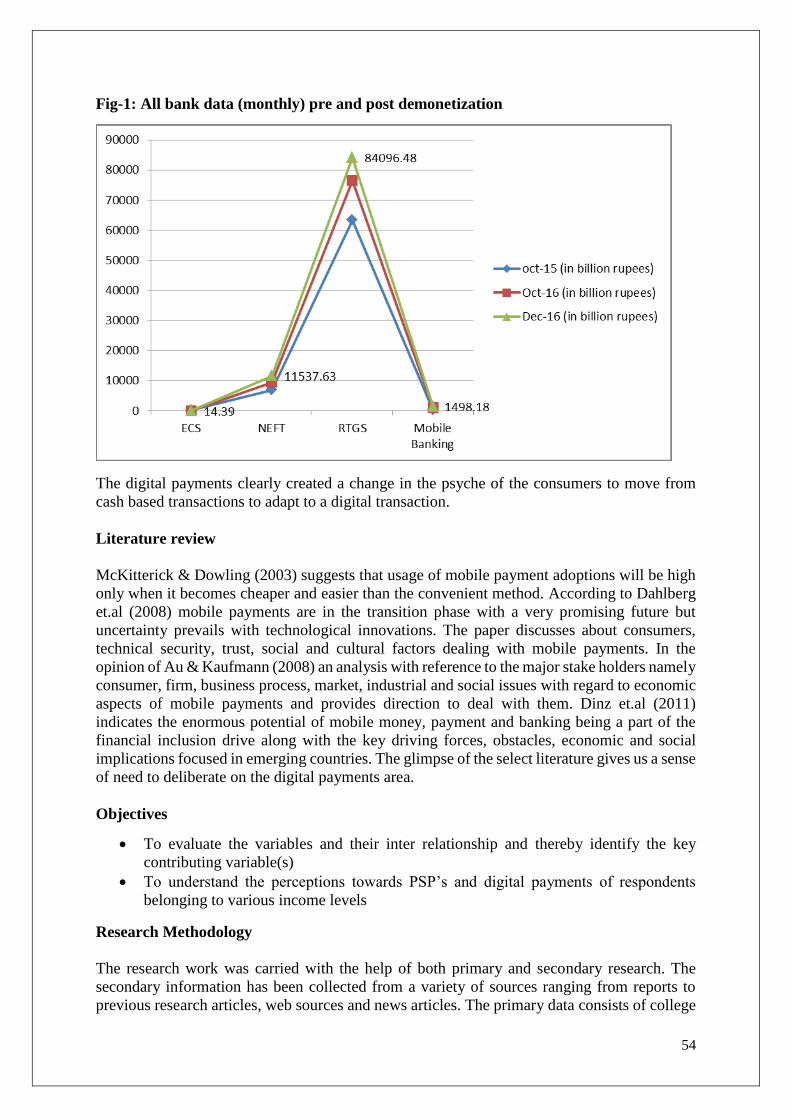
54
Fig-1: All bank data (monthly) pre and post demonetization
The digital payments clearly created a change in the psyche of the consumers to move from
cash based transactions to adapt to a digital transaction.
Literature review
McKitterick & Dowling (2003) suggests that usage of mobile payment adoptions will be high
only when it becomes cheaper and easier than the convenient method. According to Dahlberg
et.al (2008) mobile payments are in the transition phase with a very promising future but
uncertainty prevails with technological innovations. The paper discusses about consumers,
technical security, trust, social and cultural factors dealing with mobile payments. In the
opinion of Au & Kaufmann (2008) an analysis with reference to the major stake holders namely
consumer, firm, business process, market, industrial and social issues with regard to economic
aspects of mobile payments and provides direction to deal with them. Dinz et.al (2011)
indicates the enormous potential of mobile money, payment and banking being a part of the
financial inclusion drive along with the key driving forces, obstacles, economic and social
implications focused in emerging countries. The glimpse of the select literature gives us a sense
of need to deliberate on the digital payments area.
Objectives
To evaluate the variables and their inter relationship and thereby identify the key
contributing variable(s)
To understand the perceptions towards PSP’s and digital payments of respondents
belonging to various income levels
Research Methodology
The research work was carried with the help of both primary and secondary research. The
secondary information has been collected from a variety of sources ranging from reports to
previous research articles, web sources and news articles. The primary data consists of college

55
students from a particular stream/department who belong to the millennial age group. The
population size was 120 and the required sample size at a 5% confidence interval and 95%
confidence level was 92 and the researchers were able to get 90 usable respondents for the
study. The researchers used judgmental sampling and the respondents were given a structured
questionnaire and the responses were recorded and analysed.
Customer Experience- Survey results and discussions from target audience
Table-2: Mean value of the key variables
Variables N Minimum Maximum Mean Std. Deviation
Speed rating 90 1.00 5.00 3.9111 .94387
User friendliness rating 90 1.00 5.00 3.8667 .92651
Traceability rating 90 1.00 5.00 3.6111 .85715
Security rating 90 1.00 5.00 3.6111 .94446
Reach rating 90 1.00 5.00 3.9444 .92847
Convenience rating 90 1.00 5.00 4.0111 .72661
Customization rating 90 1.00 5.00 3.6444 .78341
Source: Field data
It is clearly noticed from table 2, convenience occupies the highest mean value (with a low
standard deviation) followed by reach, speed rating. Customization also has a low standard
deviation indicating the low dispersion of data which is assumed to be good.
Table-3a Regression model summary
Model R R Square Adjusted R Square
Std. Error of the
Estimate
1 .584a .341 .285 .47129
a. Predictors: (Constant), reach rating , customization rating , traceability rating , speed
rating , user friendliness rating , convenience rating , security rating
From the table 3a, R is the regression value of 0.58 which is reasonably high. The R square
value 0.341 indicates 34.1% of the total variation in the overall rating can be explained by the
independent variables.
Table-3b Results of ANOVA
ANOVAa
Model
Sum of
Squares df Mean Square F Sig.
1 Regression 9.442 7 1.349 6.073 .000b
Residual 18.214 82 .222
Total 27.656 89

56
a. Dependent Variable: overall rating
b. Predictors: (Constant), reach rating , customization rating , traceability rating , speed
rating , user friendliness rating , convenience rating , security rating
The table 3b indicates that the regression model predicts the dependent variable significantly
well. The statistical significance of the regression model shows that the p < 0.0005, which is
less than 0.05, and suggests that, overall, the regression model statistically significantly
predicts the outcome variable (i.e., it is a good fit for the data). The coefficients table 3c
provides information to predict the overall rating towards digital payments. From the table it is
very evident that customization is the key variable in contributing towards the significance of
the model despite the other variables being convenience, speed, user friendliness, traceability,
security and reach considered to be equally important independent variables
Table- 3c Results of Coefficients
Coefficientsa
Model
Unstandardized
Coefficients
Standardized
Coefficients
t Sig. B Std. Error Beta
(Constant) 1.777 .342 5.199 .000
convenience rating .084 .084 .110 1.006 .317
customization rating .174 .080 .244 2.165 .033
speed rating .030 .065 .051 .465 .643
user friendliness
rating .109 .065 .180 1.660 .101
traceability rating .054 .068 .083 .785 .435
security rating .051 .066 .087 .781 .437
reach rating .053 .066 .089 .813 .419
a. Dependent Variable: overall rating
Table 4: Descriptives
Income N Mean
Std.
Deviation
Std.
Error
95% Confidence
Interval for Mean
Minimum Maximum
Lower
Bound
Upper
Bound
< 5 lakhs 32 3.9063 .53033 .09375 3.7150 4.0975 3.00 5.00
5-10 lakhs 36 3.8333 .65465 .10911 3.6118 4.0548 1.00 5.00
>10 lakhs 22 3.9091 .42640 .09091 3.7200 4.0981 3.00 5.00
Total 90 3.8778 .55744 .05876 3.7610 3.9945 1.00 5.00
Source: Field data
From table 4 it is very clearly evident that across the income categories there is no much of
difference in the perception toward the usage of payment service providers/ digital payments.
It goes on to suggest that it has been perceived similarly by various social classes and also there
has been a general acceptance of the same.

57
Conclusion : The entire nation is witnessing the digital payments usage and growth. Most of
the parameters are affecting the customers in making his/ her life much convenient. The boost
of internet connectivity and increase in the penetration of smartphones add to the growth story.
The target audience of the research work are the Millennials who belong to a group of
respondents who would like to embrace change and have the high risk taking appetite. The
present government is determined in making Digital India a success. Digital payments once a
choice will over a period become the way of life.
References
Au, Y. A., & Kauffman, R. J. (2008). The economics of mobile payments: Understanding
stakeholder issues for an emerging financial technology application. Electronic Commerce
Research and Applications, 7(2), 141-164.
Dahlberg, T., Mallat, N., Ondrus, J., & Zmijewska, A. (2008). Past, present and future of
mobile payments research: A literature review. Electronic Commerce Research and
Applications, 7(2), 165-181.
Diniz, E. H., de Albuquerque, J. P., & Cernev, A. K. (2011). Mobile Money and Payment: a
literature review based on academic and practitioner-oriented publications (2001-2011).
McKitterick, D., & Dowling, J. (2003). State of the art review of mobile payment
technology. Retrieved September, 14(2003), 2003-24.
http://www.business-standard.com/article/economy-policy/infographic-68-of-transactions-in-
india-are-cash-based-116111400495_1.html accessed on 24/01/17
http://economictimes.indiatimes.com/slideshows/economy/what-government-plans-to-do-
with-the-old-rs-500-1000-notes/98-of-all-consumer-payments-in-india-use-
cash/slideshow/55579468.cms accessed on 24/01/17
http://ourownstartup.com/freecharge-story-a-journey-from-kunal-shah-to-snapdeal/ accessed
on 24/01/17
http://upipayments.co.in/digital-payment/ accessed on 25/01/17
https://www.bloomberg.com/news/articles/2016-11-23/cash-ban-the-best-thing-to-happen-to-
indian-digital-payments accessed on 25/01/17
http://image-src.bcg.com/BCG_COM/BCG-Google%20Digital%20Payments%202020-
July%202016_tcm21-39245.pdf accessed on 25/01/17
https://rbi.org.in/scripts/NEFTView.aspx accessed on 17/03/17

58
Drivers of Customer Engagement in Online Retail: Demand and Supply Side Analysis
Sri Ranjini, Adithya N, Sundeep Srinivasan & Sriram D
Great Lakes Institute of Management, Chennai
Introduction
The e-commerce retail in India is a growing phenomenon. With the likes of Flipkart
and Amazon growing large in size, the contribution of e-commerce to the economy is likely to
increase in future. This research involves studying customer engagement from a service
provider and the customer’s perspective in e-commerce websites. An extensive study of
existing literature was undertaken before analyzing the perception of engagement from both
perspectives. It is more than just selling a product but proposing a solution to a product by
delivering value. More than just selling products firms are using engagement as a strategy to
deliver experience.
Objectives
The research aims to establish the level of engagement and the factors that lead to
engagement both from a buyer’s perspective and a seller’s perspective. The literature review
provides an opportunity for testing effects of Customer Perceived Value, Interaction,
Experience and Participation on loyalty of consumers mediated by engagement. Empirical
research on engagement is limited and this study aims to fulfil this gap.
Research Question
From review of literature, it is evident that the customer engagement drivers are many
and process of engagement may be fairly complex. Studying the mechanism from both a
seller’s perspective and the consumers’ perspective is expected to provide substantial insights
into significant drivers and the process of engagement.
Drivers of Customer Engagement
Customer Engagement (CE) is defined as the process of involving the customers in the
interactive endeavors of the firm which is an effect of their psychological and behavioral traits.
Customer engagement is positively related to a number of brand relationship outcomes
surpassing transactional relationships and leading to behavioral manifestations such as
satisfaction, affective commitment, and loyalty (Roderick J. Brodie, 2011; Roderick J. Brodie,
2011).
Fulfilling customer needs remain the primary driver for any firm. The co-creation of
customer perceived value is important to achieve customer retention. The value addition along
with the value delivered to the customer makes a startling difference in relationship with
customers (Jenny van Doorn, 2010).
Research provides evidence of emotions associated with shopping experience. In
certain cases, they are found to be highly attached and are found giving more preference to
their possession (status and happiness) than socialization. The evaluation is done by comparing

59
the current and the future factors, represented by a typology comprising of people with
high/low arousal and positive/negative affect.
Consumers want to co-create value and interact with not just one firm but with a whole
community of service providers, professionals and other consumers as well. Customer
interaction and customer participation affects new product value creation by improving
effectiveness of the development process by enhancing information sharing and customer-
supplier co-ordination (Fang, Palmatier, & Evans, 2008). Customer participation has always
been a key focus of interest among marketers. It is an elementary aspect of services and a source
of positive outcomes for the service providers as well as the customers. Through the process
of participation, customers can contribute nifty inputs, varying in extent and level of quality
that can shape the engagement process (Doorn, et al., 2010).
The basic and primary route to customer loyalty is the level of satisfaction and the image
maintained by the firm. This model is being tested using the structural equation modelling
(Andreassen & Lindestad, 1998). When companies use a loyalty program or positively
influence the customers to a level that they overlook the negative effects of the corporates
(Bolton, Kannan and Bramlett, 2000).When a firm establishes customer loyalty, it has achieved
its ultimate goal.
Hypotheses
Based on the literature review, the following hypothesis are drawn for testing:
H1: Customer perceived value has a positive effect on customer engagement.
H2: Emotion has a positive effect on customer engagement.
H3: Interaction leads to customer engagement.
H4: Participation leads to customer engagement.
H5: Customer engagement leads to loyalty.
H6a: Customer engagement mediates the relationship between CPV and Loyalty
H6b: Customer engagement mediates the relationship between Emotion and Loyalty
H6c: Customer engagement mediates the relationship between Interaction and Loyalty
H6d: Customer engagement mediates the relationship between Participation and Loyalty
Methodology: The conceptual model was evaluated from consumer and seller perspective.
Consumers who are involved in purchasing products from popular e-commerce websites were
administered a survey questionnaire. A similarly worded questionnaire was administered in the
supplier category.
Results: Data collected was checked for reliability, convergent and discriminant validity. The
nomological framework was tested using Partial Least Squares, Structural Equation Modelling,
a correlation based approach instead of covariance based modelling, as this suits smaller
sample size and does not mandate normal distribution of data.

60
On the Consumer Side, CPV and Participation show positive and significant effects on
loyalty mediated by CE. Emotions exhibit a direct effect on loyalty and CE does not mediate
this effect. From the suppliers’ side CPV and Interaction accept CE as the mediating variable.
Emotion here also impacts Loyalty directly without the presence of CE as a mediating variable.
H1and H5 are among highly consistent set of hypothesis. They are highly significant in
both the seller and the buyer model. The H6a and H6b hypotheses are also valid for both the
models. Emotions are not as important to the customer as much as Customer Perceived Value.
The effects of interaction from buyer and participation is not seen eloquently in the
results which might be because of difficulty in the interpretation of questionnaire or heavier
distribution of weights to value over participation and interaction by both the parties. To
understand the underlying effects, laddering was performed. The results provided key insights
such as introduction of multi-lingual interface for the customers and suppliers to enhance
participation & interaction between one other.
DIAGRAMS:
Customer
Seller:

61
REFERENCES
Andreassen, T. W., & Lindestad, B. (1998). Customer loyalty and complex services: impact of
corporate image on loyalty, customer satisfaction and loyalty for customers with
varying degrees of service expertise. International journal of service industry
management , 7-23.
Van Doorne, J. , Lemon, K. N., Mittal, V., Nass, S., Pick, D., Pirner, P., & Verhoef, P. C.
(2010). Customer Engagement Behavior: Theoretical Foundations and Research.
Journal of Service Research, 253 - 266.
Fang, E., Palmatier, R. W., & Evans, K. R. (2008). Influence of customer participation on
creating and sharing of new product value. Journal of academic marketing science,
322-336.
Jenny van Doorn, e. (2010). Customer Engagement Behavior:Theoretical Foundations and
Research. Journal of Service Research, 253-266.
N.Bolton, R., Kannan, P., & D.Barmlett Implications of Loyalty Program Membership and
Service Experiences for Customer Retention and Value.
Roderick J. Brodie, L. D. (2011). Customer Engagement: Conceptual, Domain, Fundamental
Propositions, and Implications for Research. Journal of Service Research I 4(3), 252-
271.

62
What People Drive is what drives them – Consumer Behavior patterns in the Automobile
Industry?
Rachna Sharma, Prema Ramchandran & Madhavi Garikaparthy
IBS Mumbai, Indus Business School, Bengaluru & IBS Hyderabad
Introduction
There are approximately 63 automobile brands worldwide, vying for the consumers’ attention.
In an over exhausted market in the West, brands are now looking towards the east where an
open economy, developing markets and more disposable income is driving businesses.
In India, 70% of the market share is held by Maruti (47%), Hyundai (17.3) and Mahindra,
which ousted Tata Motors for the third slot, (7.5%) (TOI, Jan 28, 2016). Toyota is fast catching
up and Honda is struggling to retain its position after losing the first movers advantage. In the
face of stiff competition, attracting and retaining consumers who are brand loyal is the biggest
challenge facing the automobile sector. Additionally, the car buying decision may be one that
consumers go through multiple times in their lifetime. The critical question then is whether
consumers will make a repeat purchase of the same brand. With this scenario, it is imperative
for brands to know what drives consumers to drive what they do. How do consumers take
decisions about which car to purchase?
A car is more than just a means of transport. A car is a representation of an individuals’
personality and aspirations. It is usual to connect a particular type of car with a particular type
of person. But our perceptions about cars are mostly created by the way the car is advertised
and marketed. But the question remains whether people buy cars because they want to
consciously or unconsciously project an image or because of clear and simple factors like price,
performance, safety etc?
Marketers and car manufacturers have been interested in identifying the factors that impact a
consumers buying decision. There have been studies about how buying decisions are made and
various models of car type choicehave been developed. But they do not generally explore the
relationship between the cumulative life experiences and life station of the buyer and the
buying decision. This paper explores the relationship between the motivational drivers as
specified in Abraham Maslow’s need hierarchy theory and buying decisions of the consumer.
Review of relevant literature
Majority of the published papers on consumer choices of vehicle types focus on the vehicle
attributes, personality factors of the consumer or brand loyalty. There are very few works that
look into the relationship between vehicle type and lifestyle factors.
Axsen,J., Bailey., J. and Castro, M.A.(2015)in a study of preferences and
lifestyle heterogeneity among potential plug-in electric vehicle buyers, found that overall
preferences were similar across various lifestyle clusters.
Chang,CC et al(2015) explored the effect of the demand from consumers and the external
sources of information on buying intentions. They found that life style is a significant factor in
buying intentions.
63
Choo, S. and Mokhtarian, P. (2004) conducted a study on the impact of consumers’ travel
attitudes, personality, lifestyle and mobility on vehicle buying decisions and developed a
disaggregate choice model based on these factors. The study concluded that the independent
variables significantly impacted vehicle buying decision.
Gillingham et al (2014) studied the impact of a proposed reduction in vehicle registration taxes
and introduction of road user charges. This is an ongoing study and the results are not
conclusive.
Hess, S., Fowler, M., Adler, T. et al (2011) attempted to find the correlation between
vehicle type and fuel type choice, with data collected from California consumers.
Sigurdardottir,S.A., Kaplan,S., and Moller,M.,(2014) Studied the motivation underlying
obtaining driving license and car ownership time frame. Policy, community, institutional,
interpersonal and intra personal factors were considered. The data was collected from semi
structured interviews with 50 Danish adolescents. The study identified three groups, car
enthusiasts, car pragmatists and car skeptics and found that attitude towards cars differ across
groups.
Zhan,J. et al(2013) conducted a focus group study on how safety is a factor deciding the older
drivers’ vehicle selection criteria and ranked it among other criteria like price and comfort. Six
focus groups of older men and women drivers in the age group of 70-87 were conducted. It
was found that vehicle features that give them a sense of safety impact car buying decisions
among the older consumers.
Most of the studies have been done on consumers in America and Europe. This paper is an
attempt to find out whether there is a relationship between the unmet and met needs of the
consumer and the choice of car by the consumer in the Indian metros. The data is collected
from Mumbai and Bengaluru.
Experiment: Abraham Maslow, in his paper, “A Theory of Human Motivation”
in Psychological Review, and later in his book, Motivation and personality, stipulated that the
most basic and fundamental ‘deficiency needs’ need to be met before one can focus on meeting
higher needs like self actualization. He also said that since the brain is a very complex system,
there can be various motivations from different levels of Maslow’s hierarchy working on an
individual simultaneously. “ ... brand strategists have come to use Maslow’s model as a means
of defining and then building on needs that brand X will fulfil” (Rodgers, 2003).
It is very difficult to pinpoint exactly which factors drive a particular buying decision.
Marketers know this well and try to find theoretical constructs that will help them predict
consumer behaviour with a reasonable accuracy. According to Maslow’s theory the buying
decisions also must be aimed towards fulfilling a strong need. To fulfil each level of needs in
the Maslow’s pyramid, different acquisitions must be made. If we take a close look at what
needs are specified for each level, the type of items seen to be major consumption choices at
that level and the relationship between the driving needs and buying decisions we might reach
at a more comprehensive understanding of why a particular buying decision is made.
Henry Ford introduced Model T in 1908 with a view to making cars affordable for everyone.
In India till the eighties, cars were still largely the privilege that only the rich could afford.
With the advent of Maruti in the early eighties and the many other brands which followed suit,
cars became more and more affordable. Still, they are not yet within the reach of High school

64
students and lower middle class. Buying a car would be a decision that corresponds to the third,
fourth and fifth levels of Maslow’s hierarchy. Even at the lower levels the abundant availability
of used cars could mean that the cost of purchase which is the most important determinant is
no longer a deterrent in buying a car. Indians still consider the purchase of the first car as a sign
to the community at large that they have arrived at a certain desirable level in the society.
Unlike the physiological and security needs which needs fulfilment for everyone, the
Love/belonging needs level is more complex. While the physiological and safety needs can be
related to buying decisions about products and services like food, water, beds, security systems,
insurance, investment opportunities when it comes to the third level of love and belonging,
friendship and family are the most important and critical factors at this level and might have
considerable impact in the actions that lead to fulfilling needs at this level. Many decisions are
made at this level to feel included in a particular group. Being a part of a group is an important
aspect of this level since it provides a feeling of support and connection. A lot of buying
decisions are made with a view of being part of the ‘in’ crowd. Vehicle buying decisions are
largely influenced by this need. The way Harley Davidson riders consider themselves part of a
special group is clear from their interaction on the road, even if they do not know each other.
This is the reason why many automobile advertisements emphasize family bonding through
trips and shared driving experiences as a way to attract customers. But the major part of
consumerism is built around the next level in Maslow’s Hierarchy, the esteem needs.
This level has sense of achievement, respect from the society, confidence of having arrived etc.
as its major aspects.. A great extent of out self-esteem and self-image is expressed by the
symbols we use to express our identity. The fact that one’s personality is intensely connected
to one’s self-esteem also reinforces the drive to express this need through acquisitions. Access
to financial resources are one of the deciding factors about which level of the pyramid decide
the individual’s buying behaviour. “In general, as individuals progress through the theoretical
stages of Maslow’s hierarchy of needs, it appears that money becomes less and less important
to
Individuals” (Oleson, 2004).
If there is a positive correlation between buying decisions and Maslow’s theory, then car-
buying decisions will be aimed at either inclusion in groups or to enhance the bond with friends
and family. While most expensive, exclusive or luxury items will fit this bill, cars are an
important expression of fulfilling Esteem needs which have been considered the basis for most
of the consumer activity that shapes the market. In that case, for most car owners ideas such as
self esteem, self-belief, sense of achievement etc must be tied into the type of the car they drive.
Since belonging is also a function of self esteem, this can impact motives at that level also.
When a consumer has reached the self actualization levels, his self awareness and acceptance
should make external factors irrelevant. It will be interesting to see the choices that are made
at this level.
Methodology
The data for the study was collected in the random sampling method with a questionnaire, using
google forms. The questionnaire consisted of items, assessing respondents’ levels of need, as
per Maslow’s Hierarchy. The sample size was 57. Quantitative and qualitative analysis was
conducted to analyse the data.

65
Data was analysed using Descriptive statistics. Means were calculated to analyse the results.
The following graphs illustrate the sample demographics.
Fig 1 Breakup of sample as per Age
The sample size was 57. As is illustrated in the graph, the number of respondents in the age 20
– 30 was 21, 30 – 40 was 16, 40 – 50 was 14 and more than 50 was 6.
Fig 2 Breakup of sample as per Gender
Out of the total sample of 57, there were 42 men and 15 women.
Fig 3 Breakup of sample as per Income bracket
Age, 20-30, 21
Age, 30-40, 16
Age, 40-50, 14
Age, >50, 6
Age
20-30
30-40
40-50
>50
Gender, Men, 42
Gender, Women, 15
Gender
Men
Women

66
Of the total sample of 57, there were 33 in the income bracket of less than 10 lakhs per annum,
19 in 10 – 20 lakhs per annum, 3 in the 20 – 30 lakhs per annum and 2 in the greater than 40
lakhs per annum.
Analysis
The objective of the research was to explore what drives consumers to drive the car that they
do.
The independent variables were age, gender and annual income. The dependent variable was
motivation need, as proposed by Maslow.
The results indicate that 78% of the respondents agree that their car is a status symbol. 90% of
the respondents agree that safety features are an important feature of the car and 90% of the
respondents were willing to pay extra for safety features, such as Anti-lock Braking System
and airbags.
The following figures represent the data analyses.
Income, <10, 33
Income, 10-20lpa, 19
Income, 20-30lpa, 3 Income, 30-
40lpa, 0
Income, >40lpa, 2
Income
<10
10-20lpa
20-30lpa
30-40lpa
>40lpa

67
Fig 4 Overall Mean of Consumer Need
The results indicate that safety needs are the highest (7.11) in the sample, followed by social
needs (6.14) and esteem needs (6.04) (Refer Fig 4). Most respondents agreed that their car was
more than just a means of transport (5.22). In fact, some respondents described their cars as
“my partner”, “my dream” and “my baby”.
Maslow’s Hierarchy of Needs Model has received its fair share of criticism for its hierarchical
structure and it may be argued that car buyers would anyway be driven by higher order needs,
such as social and esteem needs.
Further analyses of the data was conducted using cross-tabulation of demographic and
motivation needs.
Average, Basic Need, 5.22
Average, Safety Need, 7.11
Average, Social Need, 6.14
Average, Esteem Need,
6.04
Overall Mean
Basic Need
Safety Need
Social Need
Esteem Need

68
Fig. 5Agewise average of Consumer Need
Across all age groups, safety features remain the most important criteria for consumer buying
behaviour, overall mean 7.11. However, for the age group 20 to 40 years, social need, mean
6.38, is higher than esteem needs, with a mean of 6.14 and 5.69; whereas for the sample 40 -
50 and above 50 years, esteem needs are more important than social needs. This may be because
the Gen Y, the millennial, is a generation which is highly influenced by peer groups, and
extremely well-connected, aided by technology and digital platforms, such as social media
networks. It is estimated that
Significantly, those above 40 years, have reached a certain status in their professional careers,
and are motivated by esteem needs.
5.05
5.565.21
55.23
6.957.13
7.43
6.837.11
6.38 6.38
5.43
6.336.146.14
5.695.93
6.83
6.04
0
1
2
3
4
5
6
7
8
20 - 30 30 - 40 40 - 50 > 50 Overall
Basic Need
Security
Social
Esteem

69
Fig. 6 Genderwise average of Consumer Needs
Similar results were found using gender as an independent variable. Security features were the
most important criteria for choice of car. However, for the males social and esteem needs were
equally important, mean 6.17; whereas for the females social needs, mean 6.07, were more
important than esteem needs, mean 5.67. This findings is supported by previous research than
women, tend to be more influenced by social needs than men.
Fig 7 Income wise average of Consumer Needs
5.21 5.27 5.23
7.196.87
7.11
6.17 6.07 6.146.175.67
6.04
0
1
2
3
4
5
6
7
8
Male Female Overall
Basic Need
Security
Social
Esteem
5.215.47
4.33 4.5
5.23
6.947.21
7.678
7.11
6.27 6.055.67 5.5
6.146.03 5.79
7 7
6.04
0
1
2
3
4
5
6
7
8
9
<10 10-20lpa 20-30lpa >40lpa Overall
Basic Need
Security
Social
Esteem

70
An analyses of data using income as a dependent variable indicated that across all income
groups, safety features was the most important
Respondents describe their car as “awesome”, “my dream” and “my pride”. One respondent
also described their car as “my partner”, indicating a strong association with cars.
Discussion
The results indicate that most consumers drive what drives them. Cars are not at the basic level
of Maslow’s’ hierarchy as simply a means of transport. As per Maslow’s’ hierarchy of needs,
the motivation behind car buying behaviour is fulfilment of social or self-esteem needs.
So far, the trends in India are looking good, and car manufacturers are upbeat about the future.
“By 2020, India will be the youngest country in the world, with 41% of its population below
20” (Thakkar, 2017). The proportion of people below the age of 29 buying cars has increased
from 22% to 27%, from 2012 to 2017 (Refer Annexure 1). According to Puneet Anand,
General Manager, Hyundai Motors India, “The rise in individual residual incomes and the
introduction of feature-rich cars that meet the aspirations of youngsters have created more first-
time buyers”. According to Mr. R. S. Kalsi, Executive Director for Sales and Marketing at
Maruti Suzuki, for this generation, “the car is an extension of their personality” and automakers
will ignore these trends at their own peril. Gen-Y buyers are looking for attractive looks, plush
and comfortable interiors, latest infotainment options such as Apple Car play, and advanced
safety features. The current research also supports this trend. This generation is also one which
prefers freedom, and does not want the hassle of investment and other cumbersome aspects of
owning a car, and automakers are competing not just with each other, but also with the Olas
and the Ubers. According to Anisha Motwani, marketing consultant and author, “substantial
customisation will be needed for the car to be genuinely able to make an impact” (Thakkar,
2017)
Limitations
The sample size is small to say with confidence that these results may be extrapolated to a
larger sample size.

71
Annexure 1 Car Buying Trends in India
Source:
http://epaperbeta.timesofindia.com/Article.aspx?eid=31818&articlexml=Millennials-
High-on-Life-Give-Car-Cos-a-22082017007006#

72
References
https://www.slideshare.net/infoDiagram/car-brands-market-map-classification
https://www.globalcarsbrands.com/
http://timesofindia.indiatimes.com/business/india-business/Top-3-auto-companies-hold-70-
market-share/articleshow/50749746.cms
https://auto.ndtv.com/news/best-car-brands-in-india-1684619
http://epaperbeta.timesofindia.com/Article.aspx?eid=31818&articlexml=Millennials-High-
on-Life-Give-Car-Cos-a-22082017007006#
https://www.fastcompany.com/3027876/millennials-dont-care-about-owning-cars-and-car-
makers-cant-figure-out-why
http://beta.latimes.com/business/autos/la-fi-hy-millennials-cars-20161223-story.html
Axsen,J., Bailey., J.and Castro, M.A.(2015). Preference and lifestyle heterogeneity among
potential plug-in electric vehicle buyers. Energy Economics, 50, 190-201. doi.org/10.1016/j.eneco.2015.05.003
Chang,CC et al(2015). A hybrid decision-making model for factors influencing the purchase
intentions of technology products: the moderating effect of lifestyle. Behaviour & Information
Technology, 34(12), 1200-1214.dx.doi.org/10.1080/0144929X.2015.1019566
Oleson, M. (2004). Exploring the relationship between money attitudes and Maslow's hierarchy
of needs. International Journal of Consumer Studies, 28(1), 83-92. doi:10.1111/j.
1470-6431.2004.00338.x
Rodgers, M. (2003). Challenging Maslow. Brand Strategy, (178), 29. Retrieved from
EBSCOhost.
Seeley, E. (1992). Human needs and consumer economics: The implications of Maslow's
theory
Of motivation for. Journal of Socio-Economics, 21(4), 303. Retrieved from EBSCOhost
Shyam Ashutosh R (2017) “Millennials High on Life Give Car Cos a Lot to Cheer About”
Economic Times, Aug 22nd 2017
Sigurdardottir,S.A., Kaplan,S., and Moller,M.,(2014). The motivation underlying adolescents׳
intended time-frame for driving licensure and car ownership: A socio-ecological approach.
Transport Policy, 36, 19-25. doi.org/10.1016/j.tranpol.2014.07.001
Thakkar, Ketan (2017) “Can Maruti and Millennilas be BFFs?” Brand Equity, Economic
Times,
January 11th, 2011
http://brandequity.economictimes.indiatimes.com/news/marketing/can-maruti-and-
millennials-be-bffs/56443929
Zhan,J. et al(2013). Older drivers' opinions of criteria that inform the cars they buy: A focus
group study. Accident Analysis & Prevention, 61, p281-287.doi: 10.1016/j.aap.2013.02.029.

73
The Role of vividness and health consciousness in threat appeals.
Nachiketas.N, Bharadhwaj.S, Arti Kalro & Piyush Sharma.
Great Lakes Institute of Management, Chennai , SJMSOM, IIT Mumbai & Curtin University,
Australia
Threat appeals have been widely used in healthcare communications to overcome troublesome
consumer beliefs and attitudes about various socio-medical issues such as smoking (Rogers
and Deckner, 1975), alcoholism (Brown and Locker, 2009), cancer screening (Prentice-Dunn
et al., 2001), eye care (Nandakumar et al., 2017), AIDS prevention (Treise and Weigold, 2001)
etc. Some of the popular models under threat appeals domain include Protection Motivation
Theory (Rogers, 1975), Extended Parallel Process Model (Witte, 1992) and Health Belief
Model (Becker, 1974). The key variables necessary to effect a successful change in consumer
attitudes are perceived severity of the existing threat, perceived susceptibility to the existing
threat, perceived self-efficacy regarding consumer’s capacity to take remedial steps and finally,
response efficacy; the perceived efficacious nature of the proposed alternative course of action
to mitigate the threat.
The common understanding is that messages that combine high threat and high efficacy work
better than most other combinations (Witte, 1992; Nandakumar et al., 2017). However, there
are several instances where threat appeals have had little to no effect. We suspect the reasons
could be that severity of the existing threat was not sufficiently heightened to trigger a state of
fear arousal which is key to initiating danger control (Witte, 1992) steps.
Health communication researchers use words, pictures, videos or a combination of these to
develop their material such as print brochures, pamphlets and posters. Therefore, it is important
that words and pictures are chosen such that not only should they be congruent to the context
of the communication but they should convey sufficient levels of threat and efficacy.
Is there a construct that can help understand the congruency and level of detailing in threat
appeals?
Is there a variable/(s) that can explain the relationship between threat and consumer attitudes
and intentions towards cataract surgery?
To carry out our investigation, Indian eye care has been chosen as the context. India is currently
the largest cataract-affected nation in the world (WHO, 2014). Several organizations are
playing a pivotal role in raising awareness about cataract and encouraging consumers to
undergo surgery. Surgery is the only cure for cataracts. Consumer apathy and poor attitudes is
the major barrier to undergoing surgery (Nandakumar et al., 2017) Therefore, it is extremely
crucial for healthcare practitioners in this domain to develop effective communication material
to overcome consumer indifference and nudge consumers to accept surgery. This study has
both theoretical and public policy implications.
Conceptual framework and hypotheses
Vividness:
Information is perceived as vivid when it has properties that can draw and hold attention, be
emotionally interesting, create excitement and form strong imagery which can influence

74
consumer decision-making (Nisbett and Ross, 1980). The persuasive appeal of vivid
information on consumer judgement and decision-making process has been researched
considerably (e.g. Borgida and Nisbett, 1977; Chaiken and Eagley, 1979; Taylor and Thomson,
1982; Kisielius and Sternthal, 1984; Wilson, Northcraft, & Neale, 1989; Block and Keller,
1997).
The ‘vividness effect’ has been studied in a variety of contexts such as product labelling (Bone
and France, 2001), consumer brand evaluation (Mitchell and Olsen, 1981), health promotion
(Rook 1986, 1987), commercial website’s design appeal (Coyle and Thorson, 2001) and health
information processing (Block and Keller, 1997; Smith and Shaffer, 2000).
Results show that when compared to pallid or abstract information, vivid information carries a
disproportionate weight, both in judgement and decision-making, especially in terms of its
ability to arouse affective properties that help in processing and retrieving of information and
more importantly in shaping consumer beliefs, attitudes and intentions (Nisbet and Ross, 1980;
Frey and Eagly, 1993). For instance, in a health intervention study on anti-smoking (Smith and
Shaffer, 2000) among college goers, information was manipulated between vivid and pallid.
Findings indicated that vivid information significantly enhanced message recall and attitudes
towards non-smoking. Myers (2014) in their study to explore consumer judgements and
evaluations about Human Papilloma Virus (HPV) found out that vividness significantly
impacted judgements and they also observe that under conditions where message quality is
high, the positive effects of vividness on judgements and evaluations are even stronger.
Kisielius and Sternthal’s (1984) study on consumer attitudes towards new product offerings
highlight the positive effect of vividness and also further explore the conditions under which
vividness effects operates, implicating that when information is favourable towards message
advocacy persuasiveness is enhanced.
Other research works also demonstrates the significant effect of vividness and message framing
on consumer attitudes towards charity donations (Chang and Lee, 2000). Vividness effects has
been studied under a variety of situations as mentioned earlier, however, in the context of
cataract-cure, its effects on consumer’s decision-making is little explored. Vividness effects
can also be examined in conjunction with elements of the EPPM, PMT model and prospect
theory. Therefore we propose:
H1: High Vividness information will drive favourable dispositions towards cataract surgery
than low vividness or pallid information
H2: High Vividness information will positively influence behavioural intentions towards
cataract surgery than low vividness or pallid information
H3: High vividness information will increase perceived severity of the threat than low
vividness condition
H4: High vividness information will increase perceived susceptibility of the threat than low
vividness condition
H5: The vividness effect on positive attitudes towards cataract surgery will be stronger under
high threat conditions (vs. low threat conditions)
H6: The vividness effect on positive intentions towards cataract surgery will be stronger under
high threat conditions (vs. low threat conditions)

75
Health consciousness:
Health consciousness measures the consumer’s approach to staying healthy (Becker, 1977). It
assesses the level of readiness and motivation to stay or improve their health standards. Not all
consumers are health aware equally. Health conscious consumers are often motivated to stay
healthy and take measures to prevent ill health by taking up healthy lifestyles (Gould, 1988;
Newsome et al., 2005). Health consciousness has been studied in the context of organic food
consumption (Grankvist and Biel, 2001; Chen 2009), calorific intake (Ellison, Lusk and Davis,
2013), social capital (Dutta-Bregman, 2004), consumption of functional foods (Landstorm et
al., 2007) and attention to health warning messages (Kaskutas and Greenfield, 1997). Chen
(2009) establishes the link between health consciousness and organic food attitudes and also
indicates that healthy lifestyle exerts mediating effects on the positive relationship between
health consciousness and attitude towards organic foods. Similarly, Kaskutas and Greenfield
(1997) found out that health consciousness was associated with stronger attention to warning
labels on alcoholic beverages. Hence:
H7: Health consciousness will enhance perceived severity of cataract information
H8: Health consciousness will enhance perceived susceptibility to cataract.
H9: Health consciousness will positively affect uptake of cataract surgery
H10: Health consciousness will positively impact intentions to uptake of cataract surgery
H 11: Health consciousness will positively moderate threat’s relationship with attitudes and
intentions to uptake of cataract surgery
Methodology and analyses:
Field experimentation followed by data analyses using structural equation modelling is
proposed.

76
What People Drive is what drives them – Consumer Behavior patterns in the Automobile
Industry?
Rachna Sharma, Prema Ramchandran & Madhavi Garikaparthy
IBS Mumbai, Indus Business School, Bengaluru & IBS Hyderabad
Introduction
There are approximately 63 automobile brands worldwide, vying for the consumers’ attention.
In an over exhausted market in the West, brands are now looking towards the east where an
open economy, developing markets and more disposable income is driving businesses.
In India, 70% of the market share is held by Maruti (47%), Hyundai (17.3) and Mahindra,
which ousted Tata Motors for the third slot, (7.5%) (TOI, Jan 28, 2016). Toyota is fast catching
up and Honda is struggling to retain its position after losing the first movers advantage. In the
face of stiff competition, attracting and retaining consumers who are brand loyal is the biggest
challenge facing the automobile sector. Additionally, the car buying decision may be one that
consumers go through multiple times in their lifetime. The critical question then is whether
consumers will make a repeat purchase of the same brand. With this scenario, it is imperative
for brands to know what drives consumers to drive what they do. How do consumers take
decisions about which car to purchase?
A car is more than just a means of transport. A car is a representation of an individuals’
personality and aspirations. It is usual to connect a particular type of car with a particular type
of person. But our perceptions about cars are mostly created by the way the car is advertised
and marketed. But the question remains, whether people buy cars because they want to
consciously or unconsciously project an image or because of clear and simple factors like price,
performance, safety etc?
Marketers and car manufacturers have been interested in identifying the factors that impact a
consumers buying decision. There have been studies about how buying decisions are made and
various models of car type choice have been developed. But they do not generally explore the
relationship between the cumulative life experiences and life station of the buyer and the
buying decision. This paper explores the relationship between the motivational drivers as
specified in Abraham Maslow’s need hierarchy theory and buying decisions of the consumer.
Review of relevant literature
Majority of the published papers on consumer choices of vehicle types focus on the vehicle
attributes, personality factors of the consumer or brand loyalty. There are very few works that
look into the relationship between vehicle type and lifestyle factors. Choo.S and Mokhtarian.P
(2004) conducted a study on the impact of consumers’ travel attitudes, personality, lifestyle
and mobility on vehicle buying decisions and developed a disaggregate choice model based on
these factors. The study concluded that the independent variables significantly impacted
vehicle buying decision.
Gillingham et al(2014) studied the impact of a proposed reduction in vehicle registration taxes
and introduction of road user charges. This is an ongoing study and the results are not
conclusive.
Hess, S., Fowler, M., Adler, T. et al(2011) attempted to find the correlation between vehicle
type and fuel type choice, with data collected from California consumers.

77
John, A., Joseph, B., and Andrea, C (2015), in a study of preferences and
lifestyle heterogeneity among potential plug-in electric vehicle buyers, found that overall
preferences were similar across various lifestyle clusters.
Most of the studies have been done on consumers in America and Europe. This paper is an
attempt to find out whether there is a relationship between the unmet and met needs of the
consumer and the choice of car by the consumer in the Indian metros. The data is collected
from Mumbai and Bengaluru.
Experiment: Abraham Maslow, in his paper, “A Theory of Human Motivation”
in Psychological Review, and later in his book, Motivation and personality, stipulated that the
most basic and fundamental ‘deficiency needs’ need to be met before one can focus on meeting
higher needs like self actualization. He also said that since the brain is a very complex system,
there can be various motivations from different levels of Maslow’s hierarchy working on an
individual simultaneously.
It is very difficult to pinpoint exactly which factors drive a particular buying decision.
Marketers know this well and try to find theoretical constructs that will help them predict
consumer behaviour with a reasonable accuracy. According to Maslow’s theory the buying
decisions also must be aimed towards fulfilling a strong need. To fulfil each level of needs in
the Maslow’s pyramid, different acquisitions must be made. If we take a close look at what
needs are specified for each level, the type of items seen to be major consumption choices at
that level and the relationship between the driving needs and buying decisions we might reach
at a more comprehensive understanding of why a particular buying decision is made.
Henry Ford introduced Model T in 1908 with a view to making cars affordable for everyone.
In India until the eighties, cars were still largely the privilege that only the rich could afford.
With the advent of Maruti in the early eighties and the many other brands which followed suit,
cars became more and more affordable. Still, they are not yet within the reach of High school
students and lower middle class. Buying a car would be a decision that corresponds to the third,
fourth and fifth levels of Maslow’s hierarchy. Even at the lower levels the abundant availability
of used cars could mean that the cost of purchase which is the most important determinant is
no longer a deterrent in buying a car. Indians still consider the purchase of the first car as a sign
to the community at large that they have arrived at a certain desirable level in the society.
Unlike the physiological and security needs which needs fulfilment for everyone, the
Love/belonging needs level is more complex. Friendship and family are to critical factors at
this level and might have considerable impact in the actions that lead to fulfilling needs at this
level. Many decisions are made at this level to feel included in a particular group. If there is a
positive correlation between buying decisions and Maslow’s theory cars then buying will be
aimed at either inclusion in groups or to enhance the bond with friends and family. Esteem
needs have been considered the basis for moist of the consumer activity that shapes the market.
In that case ,for most car owners ideas such as self esteem, self-belief, sense of achievement
etc must be tied into the type of the car they drive. Since belonging is also a function of self
esteem, this can impact motives at that level also. When a consumer has reached the self
actualization levels, his self awareness and acceptance should make external factors irrelevant.
It will be interesting to see the choices that are made at this level.
Analysis
The data for the study was collected in the random sampling method with a questionnaire. The
sample size is 33 and sample population drawn from car owners in Bengaluru. Quantitative
and qualitative analyses was conducted to analyse the data.

78
Results
The results indicate that 78% of the respondents agree that their car is a status symbol. 90% of
the respondents agree that safety features are an important feature of the car and 90% of the
respondents were willing to pay extra for safety features, such as Anti-lock Braking System
and airbags.
Respondents describe their car as “awesome”, “my dream” and “my pride”. One respondent
also described their car as “my partner”, indicating a strong association with cars.
Discussion
The results indicate that most consumers drive what drives them. Cars are not at the basic level
of Maslows’ hierarchy as simply a means of transport. As per Maslows’ hierarchy of needs,
the motivation behind car buying behaviour is at self-esteem or self-actualisation.
Limitations
The sample is limited to the city of Bengaluru. The sample size is small to say with confidence
that these results may be extrapolated to a larger sample size.
References
https://www.slideshare.net/infoDiagram/car-brands-market-map-classification
https://www.globalcarsbrands.com/
http://timesofindia.indiatimes.com/business/india-business/Top-3-auto-companies-hold-70-
market-share/articleshow/50749746.cms
https://auto.ndtv.com/news/best-car-brands-in-india-1684619

79
The Role of vividness and health consciousness in threat appeals.
Nachiketas.N, Bharadhwaj.S, Arti Kalro & Piyush Sharma.
Great Lakes Institute of Management, Chennai , SJMSOM, IIT Mumbai & Curtin University,
Australia
Threat appeals have been widely used in healthcare communications to overcome troublesome
consumer beliefs and attitudes about various socio-medical issues such as smoking (Rogers
and Deckner, 1975), alcoholism (Brown and Locker, 2009), cancer screening (Prentice-Dunn
et al., 2001), eye care (Nandakumar et al., 2017), AIDS prevention (Treise and Weigold, 2001)
etc. Some of the popular models under threat appeals domain include Protection Motivation
Theory (Rogers, 1975), Extended Parallel Process Model (Witte, 1992) and Health Belief
Model (Becker, 1974). The key variables necessary to effect a successful change in consumer
attitudes are perceived severity of the existing threat, perceived susceptibility to the existing
threat, perceived self-efficacy regarding consumer’s capacity to take remedial steps and finally,
response efficacy; the perceived efficacious nature of the proposed alternative course of action
to mitigate the threat.
The common understanding is that messages that combine high threat and high efficacy work
better than most other combinations (Witte, 1992; Nandakumar et al., 2017). However, there
are several instances where threat appeals have had little to no effect. We suspect the reasons
could be that severity of the existing threat was not sufficiently heightened to trigger a state of
fear arousal which is key to initiating danger control (Witte, 1992) steps.
Health communication researchers use words, pictures, videos or a combination of these to
develop their material such as print brochures, pamphlets and posters. Therefore, it is important
that words and pictures are chosen such that not only should they be congruent to the context
of the communication but they should convey sufficient levels of threat and efficacy.
Is there a construct that can help understand the congruency and level of detailing in threat
appeals?
Is there a variable/(s) that can explain the relationship between threat and consumer attitudes
and intentions towards cataract surgery?
To carry out our investigation, Indian eye care has been chosen as the context. India is currently
the largest cataract-affected nation in the world (WHO, 2014). Several organizations are
playing a pivotal role in raising awareness about cataract and encouraging consumers to
undergo surgery. Surgery is the only cure for cataracts. Consumer apathy and poor attitudes is
the major barrier to undergoing surgery (Nandakumar et al., 2017) Therefore, it is extremely
crucial for healthcare practitioners in this domain to develop effective communication material
to overcome consumer indifference and nudge consumers to accept surgery. This study has
both theoretical and public policy implications.
Conceptual framework and hypotheses
Vividness:

80
Information is perceived as vivid when it has properties that can draw and hold attention, be
emotionally interesting, create excitement and form strong imagery which can influence
consumer decision-making (Nisbett and Ross, 1980). The persuasive appeal of vivid
information on consumer judgement and decision-making process has been researched
considerably (e.g. Borgida and Nisbett, 1977; Chaiken and Eagley, 1979; Taylor and Thomson,
1982; Kisielius and Sternthal, 1984; Wilson, Northcraft, & Neale, 1989; Block and Keller,
1997).
The ‘vividness effect’ has been studied in a variety of contexts such as product labelling (Bone
and France, 2001), consumer brand evaluation (Mitchell and Olsen, 1981), health promotion
(Rook 1986, 1987), commercial website’s design appeal (Coyle and Thorson, 2001) and health
information processing (Block and Keller, 1997; Smith and Shaffer, 2000).
Results show that when compared to pallid or abstract information, vivid information carries a
disproportionate weight, both in judgement and decision-making, especially in terms of its
ability to arouse affective properties that help in processing and retrieving of information and
more importantly in shaping consumer beliefs, attitudes and intentions (Nisbet and Ross, 1980;
Frey and Eagly, 1993). For instance, in a health intervention study on anti-smoking (Smith and
Shaffer, 2000) among college goers, information was manipulated between vivid and pallid.
Findings indicated that vivid information significantly enhanced message recall and attitudes
towards non-smoking. Myers (2014) in their study to explore consumer judgements and
evaluations about Human Papilloma Virus (HPV) found out that vividness significantly
impacted judgements and they also observe that under conditions where message quality is
high, the positive effects of vividness on judgements and evaluations are even stronger.
Kisielius and Sternthal’s (1984) study on consumer attitudes towards new product offerings
highlight the positive effect of vividness and also further explore the conditions under which
vividness effects operates, implicating that when information is favourable towards message
advocacy persuasiveness is enhanced.
Other research works also demonstrates the significant effect of vividness and message framing
on consumer attitudes towards charity donations (Chang and Lee, 2000). Vividness effects has
been studied under a variety of situations as mentioned earlier, however, in the context of
cataract-cure, its effects on consumer’s decision-making is little explored. Vividness effects
can also be examined in conjunction with elements of the EPPM, PMT model and prospect
theory. Therefore we propose:
H1: High Vividness information will drive favourable dispositions towards cataract surgery
than low vividness or pallid information
H2: High Vividness information will positively influence behavioural intentions towards
cataract surgery than low vividness or pallid information
H3: High vividness information will increase perceived severity of the threat than low
vividness condition
H4: High vividness information will increase perceived susceptibility of the threat than low
vividness condition
H5: The vividness effect on positive attitudes towards cataract surgery will be stronger under
high threat conditions (vs. low threat conditions)

81
H6: The vividness effect on positive intentions towards cataract surgery will be stronger under
high threat conditions (vs. low threat conditions)
Health consciousness:
Health consciousness measures the consumer’s approach to staying healthy (Becker, 1977). It
assesses the level of readiness and motivation to stay or improve their health standards. Not all
consumers are health aware equally. Health conscious consumers are often motivated to stay
healthy and take measures to prevent ill health by taking up healthy lifestyles (Gould, 1988;
Newsome et al., 2005). Health consciousness has been studied in the context of organic food
consumption (Grankvist and Biel, 2001; Chen 2009), calorific intake (Ellison, Lusk and Davis,
2013), social capital (Dutta-Bregman, 2004), consumption of functional foods (Landstorm et
al., 2007) and attention to health warning messages (Kaskutas and Greenfield, 1997). Chen
(2009) establishes the link between health consciousness and organic food attitudes and also
indicates that healthy lifestyle exerts mediating effects on the positive relationship between
health consciousness and attitude towards organic foods. Similarly, Kaskutas and Greenfield
(1997) found out that health consciousness was associated with stronger attention to warning
labels on alcoholic beverages. Hence:
H7: Health consciousness will enhance perceived severity of cataract information
H8: Health consciousness will enhance perceived susceptibility to cataract.
H9: Health consciousness will positively affect uptake of cataract surgery
H10: Health consciousness will positively impact intentions to uptake of cataract surgery
H 11: Health consciousness will positively moderate threat’s relationship with attitudes and
intentions to uptake of cataract surgery
Methodology and analyses:
Field experimentation followed by data analyses using structural equation modelling is
proposed.

82
Antecedents to Channel Choice in Travel Industry: A Qualitative Study
Sahil Jasrotia, H.G Mishra, Surabhi Koul
SMVD University, Jammu, BITS Pilani
Introduction
In recent era we have witnessed more digitisation (Leeflanf et al., 2014) and emergence of
mobile channels and social media has led to a shift in omni-channel retailing from multi-
channel retailing. A trend pointed out by Chakravarthi Narasimhan is that channels are blurring.
Which means is difficult to identify pure digital or physical channel players. The current paper
studies the customer channel choice behavior in the travel industry. Travel Industry is one of
the fastest growing industry in India and with the introduction of many online players like
online travel portals which had made the trip for a tourist convenient as they can just visit the
website and choose the type of service which they desire to buy. The phenomenon of channel
choice is not new, however, the introduction of technology and more awareness among
customers has made it a daily routine for the customer to swap channels. This has led to
increased difficulties of brands involved in travel industry and also the local and regional
players who tend to be in this business since generations. Reference from one of the interviews
conducted during this research, a local ticket booking vendor says:
“People used to come very often whenever they had to book tickets and also take advices to
plan a travel. Now they don’t. The number people coming to us has decreased. They know how
to do it online now”.
This clearly indicates that the introduction of new technologies, rapidly changing customer’s
demand, variety of choice made available has changed the way customers used to choose their
channels. This in turn increases the challenge of the market travel agencies which have to
constantly adapt themselves as per customer’s demand, and provide multiple services and offer
services better than their competitors (Farag, Schwanen, Dijst and Faber, 2007). The
emergence of new tourism services and products, coupled with a rapid increase in tourism
demand, have driven the wide-scale adoption of ITs in general, and in particular, the Internet
as an electronic intermediary. In other words, the Internet serves as a new communication and
distribution channel for e-travelers and suppliers of travel services and products. This new
channel also enables tourism businesses to improve their competitiveness and performance.
Literature Review:
Indian tourism is expanding day by day and it can be seen as the way foreign tourist’s arrival
in India is increasing. Technological advances and changing consumer preferences have
expanded the range of channels that tourism suppliers are using to distribute their products and
multi-channel distribution is now common. Each channel or path to the market may appeal to
different segments, suit some products more than others, and have a simple or complex
structure. We can see customers who do most of their research using Internet but end up buying
from a travel agent. And also see customer who now completely rely on online platforms for
their travel planning. So broadly customer’s journey is divided among two channels i.e. online
as well as offline channel (Neslin and Shankar, 2009). Stern and El-Ansary (1992) argue that
marketing channels should be viewed as an orchestrated network that creates value for the user
or consumer through the generation of form, possession, time, and place utilities. Depending
upon the value the customer gains from these channels they choose the channels.
In travel industry Consumer choice decision are those decisions which a consumer take to buy
a product or service among the variety of channels that are available to him it may be offline
83
as well as online channels (Richards, 2015). The emerging multi-channel retail of brick and
mortar store and online channel has led to complexity in buying behavior of the customer and
also had led to differences in their channel choice as different channels are available to them
for purchase (Alba et al., 1997; Peterson, Balasubramanian, & Bronnenberg, 1997). Somewhat
more slowly, distribution is also being acknowledged as a key part of revenue management:
Returns can vary significantly from one channel to the next with each channel having its own
set of costs and benefits (Choi & Kimes, 2002; Pearce & Taniguchi, 2008). So, travel brands
need to carefully design the channels based on the customer involvement and preferences. The
current study is a step to understand the factors that lead to switching between the channels in
travel industry. Certain psychographic and sociodemographic factors associated with the
channel choice have also been studied.
Research Methodology:
As discussed earlier the studies in context of channel choice in travel industry as very limited.
Although plentiful of work has been conducted on distribution and role of middleman in the
travel and tourism industry, but none of these studies talk about customer’s perspective. This
study is purely qualitative in nature and a qualitative technique of data collection, which is
based predominantly on the concept of grounded theory. Grounded theory, a research
methodology primarily associated with qualitative research, was first proposed by Barney
Glaser and Anselm Strauss in 1967 (as cited in Dunne, 2011). Since the focus of the current
study is on examining the channel choice behavior of the customers, we selected our samples,
retailers as well as the customers from the Jammu province of J&K, India. Semi-structured in
depth interviews were conducted for collecting data. The interviews were conducted by the
authors. In this study, 25 unstructured interviews of the retailers (vendors) who directly were
linked with the travel services (ticket bookings, hotel bookings, vehicle bookings and
customized packages) till data saturation was attained. Data saturation means that with the
collection and analyses of additional data, no new concepts are developed and additional data
do not require changes in conditions, characteristics, or consequences of the existing categories
(Strauss & Corbin, 1990). Also 27 customers having exposure of all channels available and
have had booked tickets online and offline, were also interviewed. Simple random sampling
was used in the selection of customers. Each interview was conducted and converted into the
verbatim. The set of interviews were initially started by asking the retailers and the customers
about their consent to participate in the discussion. All the interviews were conducted in person
at the time, when they were ready to participate in the discussion. Also, to satisfy the retailer
and customer queries of discussion, the retailers were informed about the objective of the study.
These qualitative based interviews helped generate research dimensions which, in turn, lead to
a model development (Creswell, 1998).
Data Analysis:
The recorded interviews were first converted into a verbatim which, in turn, was subjected to
grounded theory based analysis (Glaser & Strauss, 1967). Three independent investigators read
the transcripts. They conducted open coding of these transcripts, which generated qualitative
statements that showed a general behavior of channel choice of customers Thereafter a round
of axial coding (Strauss & Corbin, 1998) was conducted to sort the descriptions into 67 first
order statements. The details of the emerged subthemes, concepts and the categories have been
shared in Table 1. The emerged conceptual model is given in Fig 1.

84
Fig1: Conceptual Model:
Customer Awareness
Customer Relationship
Facilities
Promotions
Urgency of Purchase
Affordability
Catchment
Family Influences
Customer Channel
Choice in travel
industry

85
S.no
First Order
Second Order
Third Order
1. “The customer who don’t know how to use internet
services are not able to use online channel”.
Technological awareness
Customer Awareness
2. “I am illiterate and don’t know how to use internet
and computer so always prefer to buy tickets through
offline channel as it is convenient to me”.
3. “Customers are aware of benefits of online channel
but are not aware of how to book tickets using online
channel”
4. “I have never purchased ticket online as I am not
aware of how to purchase online ticket”.
5. “I don’t use internet facility as I am not aware of the
websites which offer online ticketing and even
booking online seems very difficult to me”.
Service provider’s awareness
6. “Due to unawareness about online travel portals
customers do use offline channel and also they don’t
know how to book ticket online”.
7. “Customer who once have used our services often
visit us and is loyal to our company”.
Customer Loyalty
Customer Relationships
8. We know our customers, they come to us every time
they have to book tickets.
9. “Better experience ends up customer preferring us
over other competitors.
Customer Preference
10. We prefer online bookings as they are easy and
handy.
11. Online nowadays is so easy that you don’t need a
travel agent.
12. “Customer who have used our services are referring
our company to others”.
Past experience
13. My father used to book his travel from this agent, so
even I book from them
14. My experiences with this travel agent have been
good.
15. “I am using the services of a single travel agent as he
is trustworthy and even present for service at any
point of time”.
Trustworthy
16. Even during ticket unavailability, he has managed to
book tickets for us.
17. “I use the services of travel agent most often because
he is available all time”.
Availability
18. We can book online tickets at any time of the day. No
more waiting for the travel agent to book.
19. “I prefer to use services of travel agent as my agent
provide multiple services like ticketing, hotel
booking, packages etc. but in case he is not available
then I prefer to change channel and either book online
by myself or even go offline”
Services offered
20. MMT has all services handy, I prefer MMT.
21. My agent does only ticket bookings, for other
bookings I use other channels.
22. “I have come here on vacation and booked the hotel
as referred to me by one of my friend as he visited
here some time ago he told me about the various
services offered by them else I would have chosen to
book online through travel portals”.
Referrals
23. I have completely switched to online bookings, since
my friend has referred me to online websites.
24. “There are various discounts that are provided by me
to the customers that’s why they prefer to come to me
and avail services”.

86
Discounts offered
Facilities 25. I always wait for discounts online and pre book my
travel.
26. There are so many online website and now specially
apps, which offer to discounts every time.
27. “Due to multiple services offered by me customer
doesn’t have to visit different service providers to
avail services and provide detailed information on the
service”.
Detailed information
28. My travel agent always guides me and helps me book
my every travel.
29. My travel agent is experienced so he knows
30. “I buy tickets from single travel agent, his prices are
convenient and I can pay him later also.
Credit facility 31. Online also offers easy EMI’s.
32. “I buy tickets from travel agent known very well to
me as he even avail me services on credit.
33. “I can buy tickets at any price convenient to me as my
travel agent has various prices for a single type of
service and even provide me good discount and also
cancel my ticket in case of emergency”.
Ticket cancellation
34. “Promotions help us to reach to those customers who
are unaware about our services”.
Wider Reach
Promotions
35. We know we serve to a smaller segment, but online
markets are huge.
36. I am in this profession since last 15 years, I am feeling
the need of opening up my website. I can get more
customers.
37. “With the help of promotions we can provide
information to the customers about the services that
are offered by us and attract them to use our services”.
Information provider
38. “Promotions help us gain those customers who even
have not used online services by attracting them by
advertising and showing huge discounts”.
Customer Attraction
39. I was not knowing about these online booking
websites, but now they advertise a lot on TV. So I
visited their website.
40. My favorite Bollywood actor Ranbir Kapoor
endorses yatra.com so I prefer booking from
yatra.com”.
41. “In case of an unplanned trip customer usually
chooses a non-preferred channel”.
Unplanned trip
42. I usually travel unplanned, so I book my tickets online
and for rest I do it onsite.
43. “Urgency of trip effect channel choice to a great
extent as a person who is price conscious will book
channel which will be fast and reliable”.
Emergency visit
44. “Customer come to me who are in hurry and prefer to
book through those channel which they usually
don’t”.
45. “I have booked tickets through travel agents once or
twice and that too when an emergency was there and
I had to reach somewhere in a hurry”.
46. “I have switched channel on most occasions
whenever I was in an urgent need as in my profession
very trips are uncertain”.
Channel unavailability
47. “I prefer offline channel as it is price convenient but
it is time consuming and whenever I have less time I
call travel agent and book tickets from him”.

87
Urgency of Purchase 48. “I have bought an offline ticket for the first time in
my life because my mobile phone is not working and
no other ways of contact were available”.
49. “Customer prefer to choose channel which is cheap
and affordable”.
Economy pricing
Affordability
50. “Some customers want affordable and low priced
tickets and some prefer comfort so we have to provide
them tickets as per their preferences otherwise they
will choose any other channel to purchase”.
51. “I always prefer channel from where I am getting
cheap and quality services like if discounts are
offered at online travel portals then I book from there
or else if someone has referred me to someone who
will offer me discount”.
52. “I can compromise quality if I am getting services
cheaper on other channel”.
53. “I am a middle class person price matters a lot to me
and channel switching is possible when I am getting
cheaper services at other channel”.
54. “Some customers are regular visitors as their
residence is near to my office and they feel easy to
come to me for attaining my services”.
Comfort
Catchment
55. “I feel comfortable in visiting those travel agents who
are near to my office and residence”.
56. “I book from a single travel agent as he is near to my
location and book tickets whenever I need”.
Time saving
57. “Location of the travel agency matters a lot as the
persons nearby are attracted easily for rendering of
services and saves time”.
58. “Sometimes I prefer going to travel agent who is near
to my house whenever I feel internet problem or when
I am not able to book ticket at my own”.
Accessibility
59. Travel agent books my tickets on phone. I need not
got to him.
60. “Senior member make choice he/she will prefer
offline channel while younger generation will prefer
online channel”.
Generation Gap
Family Influences 61. Younger customers don’t come to us, as they prefer
online bookings.
62. My son books the tickets and even books the hotel
through his phone. I do not rely on all these things.
63. “Type of person travelling with customer also affect
channel choice if travelling alone person prefers
economical tickets and even choose offline channel
but while travelling with friends often chooses
expensive tickets to show status and prestige”.
Travel Partners
64. “While travelling with family I often choose online
channel and book hotels etc. in advance so that they
don’t get any inconvenience”.
65. “My father prefers to personally visit the store and
buy services as he think there are many hidden
charges and transaction fraud in online channel”.
Decision maker
66. “As my parents are uneducated and don’t know how
to use internet they buy offline tickets and even don’t
let me pay through online channel as they think fraud
may happen online”
67. My husband makes all the decisions, so he decides
our travel plan.

88
References:
Alba, J., Lynch, J., Weitz, B., Janiszewski, C., Lutz, R., Sawyer, A., & Wood, S. (1997).
Interactive home shopping: consumer, retailer, and manufacturer incentives to participate
in electronic marketplaces. The Journal of Marketing, 38-53.
Choi, S. and Kimes, S.E., 2002. Electronic distribution channels' effect on hotel revenue
management. The Cornell hotel and restaurant administration quarterly, 43(3), pp.23-31.
Corbin, J. and Strauss, A., 1990. Grounded theory research: Procedures, canons and
evaluative criteria. Zeitschrift für Soziologie, 19(6), pp.418-427.
Creswell, J., 1998. W. (1998). Qualitative inquiry and research design: Choosing among
five traditions, p.2.
Dunne, C., 2011. The place of the literature review in grounded theory research.
International Journal of Social Research Methodology, 14(2), pp.111-124.
Glaser, B. and Strauss, A., 1967. Grounded theory: The discovery of grounded theory.
Sociology The Journal of the British Sociological Association, 12, pp.27-49.
India tourism statistics 2015, Government of India, Ministry of Tourism Market Research
Division (23-24)
[http://www.tourism.gov.in/sites/default/files/Other/India%20Tourism%20Statistics_Engl
ish_2015%20Final.pdf as available on 05 April 2017.]
Leeflang, P.S., Verhoef, P.C., Dahlström, P. and Freundt, T., 2014. Challenges and
solutions for marketing in a digital era. European management journal, 32(1), pp.1-12.
Neslin, S. A., & Shankar, V. (2009). Key issues in multichannel customer management:
current knowledge and future directions. Journal of interactive marketing, 23(1), 70-81.
Pearce, D.G. and Taniguchi, M., 2008. Channel performance in multichannel tourism
distribution systems. Journal of Travel Research, 46(3), pp.256-267.
Peterson, R. A., Balasubramanian, S., & Bronnenberg, B. J. (1997). Exploring the
implications of the Internet for consumer marketing. Journal of the Academy of Marketing
science, 25(4), 329-346.
Richards, M. (2015). Supply Chain Implications In Regards To Consumer Behavior In
Online Retail: Site-To-Store Versus Direct Shipping (Doctoral dissertation, Texas Christian
University Fort Worth, Texas).
Stern, L.W. and El-Ansary, A.I., 1992. Consumer Behavior: An Information Processing
Perspective
Strauss, A. and Corbin, J., 1998. Basics of qualitative research techniques. Sage
publications.

89
Segmenting the Indian Domestic Tourists on the Basis of Travel Motivations
T.K. Chatterjee & Bikramjit Rishi
Institute of Management Technology, Ghaziabad
Introduction
Tourism in India is broadly classified in ‘North Indian Tourism’, ‘East Indian Tourism’, West
Indian Tourism’, and ‘South Indian Tourism’. Each part displays identifiable differences when
compared to rest of the nation. Tourism in India has come into its own as a brand—India
Tourism. There are niches developing within the tourism sector in India such as heliport
tourism, medical tourism, wellness tourism, adventure tourism, cruise tourism, and caravan
tourism. Inbound or domestic tourism is booming in contradiction to the perception around the
globe that tourism in India is still confined to traditions, India is opening up with trendy tour
packages coupled with affordable air travel deals to woo domestic tourists from all segments
of the market. It is predicted that the tourism sector’s contribution to India’s GDP will be
growing at the rate of 7.8 percent annually in the period 2013-2023. (A Brief Report on Tourism
in India, January 2015, ASA & Associates LLP) Though tourism sector is poised for a growth,
it is projected that average spending by foreign tourists traveling to India could decline sharply.
The factors driving this enormous growth in domestic tourism are the burgeoning middle class,
young population, new industries and new professionals, rise of information technology,
Government policies etc.(Chaudhary, 2015). From the preceding discussions and data it is
apparent that tourism has emerged as a growing industry in India playing a pivotal role in the
country’s economy. A review of the related studies clearly indicates the rationale for the study.
Review of Literature
In the South- East Asian perspective the study of travel motivations of the domestic tourists
has not been given much importance although the mismatch existing between the western
tourist theories and the Asian tourist theories. Domestic tourism is defined as “journeys and
visits within a person’s home country” (Singh, 2009) and the domestic tourist is understood as
“any person residing in a country who travels to a place within the country, outside his/her
usual environment for a period not exceeding 12 months” (UNTWO, 1995, p.4). Earlier
research on the domestic tourists in Asia was initiated by Richter (1989). It is thus timely to
investigate this relatively under-researched topic of domestic travel in South-east Asia (Bui &
Lee, 2011)
Western motivational theory in tourism is marked by a seminal empirical study by Dann (1977)
who introduced ‘push’ and ‘pull’ factors. He broadly identified travel motivations as
personal/social fulfillment, sightseeing, new experience, relaxation, prestige and kinship.
Cultural interest, self-improvement, leisure activities could be some other motivations (Ap and
Mok, 1996; Park and Mok, 1998; Cha and Jeong, 1998; Heung et al, 2001; Ryan and Mo,
2001). Dey & Sarma (2010) conducted a study on travel motivations and information sources
of tourists to North-East India. Through cluster analysis, they identified three segments of
tourists namely ‘Nature-loving Explorers’, ‘Nature-loving Vacationers’, and ‘Change
Seekers’. On information source behavior, study found that ‘friends/relatives/colleagues’ are a
major source of information for such tourists. Siri et al. (2012) conducted a research on
exploring Indian tourists’ motivations for visiting Bangkok. The broad objectives of this study
was to identify Indian tourists’ demographics and travel patterns apart from investigating

90
Indian tourists’ motivations to visit Bangkok. A questionnaire-based survey was conducted on
convenience sample of 300 Indian tourists. Findings of this study suggested ‘novelty seeking’
as the most dominant motivation of Indian tourists visiting Bangkok followed by ‘stress
busting/fun’, ‘achievement’ and ‘family oriented/education’. From the above discussions it
may be concluded that travel motivations of domestic travelers has been identified as an under
researched topic, and especially so, in South East Asia and especially in India. The current
study has been conducted to reduce the existing gap in research in this important area.
Research Methodology
The population of the study is all Indian domestic tourists, who have undertaken travel to
domestic destinations in the last 36 months either individually (selecting their own destinations
and planning their own trips) or participated in tours offered by tour operators with
prepackaged destinations and itinerary. The total sample of 456 respondents (for the
segmentation study) consists of both genders (female = 43%, male = 57%), is below 40 years
of age (79%), mostly single (64%), from variety of educational (Post graduate = 52%,
undergraduates and below = 48%) and occupational (self-employed = 21%, employed = 30%,
students = 41% and unemployed = 8%) categories, with mostly below Rs.50000 monthly
income (below Rs.50000 = 49%, above Rs.50000 = 26%, undisclosed = 25%).
A thorough review of market segmentation studies of tourist which used motivational variables
as a basis of segmentation (Formica and Uysal, 1998; Lieux, et al. 1994: Loker-Murphy, 1996;
Shoemaker, 2000) has been done as a primary step. The motivation variables used in these
studies are context specific and no standard travel motivation questionnaire was used to
measure these variables. Number of studies has shown the impact of cultural and regional
factors in the strength and manifestation specific needs and desires that trigger travel behavior.
Hence it was considered important to develop a travel motivation questionnaire that reflects
Indian domestic tourists’ context and cultural moorings. As a first step 156 items were collated.
The items were either taken from other relevant questionnaires or written by the investigator.
The items so generated were carefully reviewed by a team of experts. Many duplicate and
irrelevant items were discarded and thus ended up with 117 items. Item analysis has been
conducted to reduce the items. To finalize the questionnaire exploratory factor analysis (EFA)
using principle component method of factoring and varimax method of rotation was performed
on the remaining 117 items.
Table 1: Reliability and Validity Tests
Construct Cronbach
Alpha
AVE CR 1 2 3 4 5 6 7
Self-
Exploration
0.83 0.57 0.75

91
Nature
Exploration
0.90 0.76 0.90 0.13**
Society and
Culture
(SC)
0.87 0.62 0.85 0.27** -0.06
Adventure
and Sports
0.90 0.71 0.92 0.41** -0.01 0.30**
Family and
Friends
0.91 0.69 0.89 0.28** -0.01 0.38** 0.24**
Avoidance
of Routine
0.85 0.72 0.76 0.40** 0.19** 0.17** 0.20** 0.23**
Life Style 0.91 0.85 0.74 0.12** 0.22** -0.08 0.03 -0.12* 0.25**
Note: Rounded figures to two digits, *p>0.05, **p>0.01
Findings & Conclusion
Segmentation of respondents was done using k – mean clustering procedure by using SPSS.
All respondents’ travel motivation scores were subjected initially to hierarchical clustering
procedure to decide on possible number of clusters for specifying in k – mean clustering
procedure. Agglomeration coefficients of last 8 clusters formed by hierarchical clustering
procedure were examined. Ward’s method on squared Euclidean distance was used to derive
clusters. K – Mean clustering procedure was performed on all respondents’ travel motivation
scores. Number of clusters specified was 3.
Self-enhancers who are motivated by the desire for self-exploration and personal
enhancement are predominantly from mature adult ages; generally travel with non-related
co-travels; and travel for a duration of about week or 10 days.
Pleasure tourists as the label suggest travel for enjoyment and rejuvenation. They are
generally adults, travel with spouse and children but not parents, and spend a fortnight or
longer in touring.
Sensation seekers undertake tour with motive to experience sensory pleasures of enjoyment
of varied adventures and amusements. They are of all age groups, and tour with family and
undertake short duration tours of less than 10 days.
The segments do not differ in gender distribution, educational level, marital status,
occupational level, income level, number of people accompany the tour, and sources of
information for tour planning. Segments differ in age, number of days of tour and type of
accompanies.
References
Ap, J. and Mok, C. (1996) “Motivations and barriers to vacation travel in Hong Kong”
In Asia Pacific tourism association 1996 conference-quality research, quality tourism, pp.
14-18.
Bui, H.T. and Lee, J. (2011) “Vietnamese domestic tourism: an investigation of travel
motivations” Austrian Journal of South-East Asian Studies, Vol. 4, No.1, pp. 10-29.

92
Cha, S. and Jeong, D.C. (1998) “Travel motivations of Korean pleasure travelers to
Australia and New Zealand”, Pacific Tourism Review, Vol. 2, No. 2, pp.181-190.
Chaudhary, Manjula. (2015) Tourism marketing. Oxford University Press, New Delhi.
Dann, G. MS. (1977) "Anomie, ego-enhancement and tourism." Annals of tourism
research, Vol. 4, No. 4, pp. 184-194.
Dey, B. and Sarma, M.K. (2010) “Information source usage among motive-based segments
of travelers to newly emerging tourist destinations”, Tourism management, Vol. 31, No. 3,
pp.341-344.
Formica, S. and Uysal, M., (1998) “Market segmentation of an international cultural-
historical event in Italy”, Journal of travel research, Vol. 36, No. 4, pp.16-24.
Heung, V.C., Qu, H. and Chu, R. (2001) “The relationship between vacation factors and
socio-demographic and travelling characteristics: The case of Japanese leisure travelers”,
Tourism Management, Vol. 22, No. 3, pp.259-269.
Lieux, E.M., Weaver, P.A. and McCleary, K.W. (1994) “Lodging preferences of the senior
tourism market”, Annals of Tourism Research, Vol. 21, No. 4, pp.712-728.
Loker-Murphy, L. (1997) “Backpackers in Australia: A motivation-based segmentation
study”, Journal of Travel & Tourism Marketing, Vol. 5, No. 4, pp.23-45.
Park, J.M. and Mok, C. (1998) “Travel motivational factors and their relationship to
demographics: the Korean market”, Pacific Tourism Review, Vol. 2, No. 2, pp.109-120.
Richter, Linda K. The politics of tourism in Asia. University of Hawaii Press, 1989.
Ryan, C. and Mo, X. (2002) “Chinese visitors to New Zealand—Demographics and
perceptions”, Journal of Vacation Marketing, Vol. 8, No. 1, pp.13-27.
Shoemaker, S. (2000) “Segmenting the mature market: 10 years later”, Journal of Travel
Research, Vol. 39, No. 1, pp.11-26.
Singh, S. (2009). Domestic tourism: Searching for an Asian perspective. In S. Singh (Ed.),
Domestic tourism in Asia: Diversity and divergence. London, UK: Earthscan.
Siri, R., Kennon, L., Josiam, B. and Spears, D. (2012) “Exploring Indian tourists
‘motivation and perception of Bangkok”, Tourismos, Vol.7, No. 1, pp. 61 – 79.
93
The New G Kin of brand equity - Selfie Marketing
Mansurali. A & Swamynathan. R
PSG Institute of Management, Coimbatore
Introduction:
Selfies can be a powerful tool in attracting attention of socially responsible millennials to the
brands. Selfies has been used by many companies nowadays to engage and attract and trigger
the customers or at least to generate a traffic. The most successful marketing selfie campaigns
are those that have a concise yet catchy hashtag unique to the brand or issue, a clear connection
to the brand is supporting and multiple ways for users to engage. Selfie is defined as "a
photograph that one has taken of oneself, typically with a smartphone or webcam and uploaded
to a social media website. The selfie has opened up opportunities for brands to market
themselves online. They are used in advertising campaigns, social media, and promotions to
build brands when the business releases a new product or a new solution, including celebrity

94
brands, corporate brands, and personal brands. Selfies are highly effective at driving likes,
shares, and comments on a user's post, and brands can make use of this trend to increase
awareness of and engagement with their products and services among fans and followers.
Some businesses hold contests that encourage fans and followers to take photos of themselves
with particular products. Users then post the photos on Facebook, Twitter, or Instagram with a
particular hashtag, giving the business increased reach across multiple social media platforms
and they also offer discounts or rewards for users who post selfies of themselves engaging with
the business's products. Selfies can combine humor and reality for social media campaigns, in
particular when other marketing tools can’t. Selfies are a big trend right now; they are indeed
a product of the times. Done the right way it can be a method for engaging and connecting
people to the brands, while also building a more refined experience into your social media
channels. This current study aims at measuring the impact of selfie campaigns on brand equity.
Brand equity parameters such as Brand awareness, Brand Performance, Brand Imagery, Brand
Judgments, Brand Feelings and Brand Resonance are included in the study while examining
against the selfie campaign and found that resonance is been achieved by the selfie campaigns.
This study is quantitative in nature. Primary study was conducted using a structure
questionnaire. A total of 366 respondents who were part of the selfie campaign completed the
survey. The research attempted to explore whether selfie campaigns are enhancing the brand
equity.
Literature Review
Robert Cornelius was the first one to take selfie in 1839, that time it was self-photography not
the selfie, and its Jeniffer Lee should be credited for using the word selfie for the first time. In
2013, Oxford English dictionary decided the word selfie as “Word of the Year”. Companies
and brands use social media more recently than the conventional media and medium for the
promotions and branding. Selfie’s participation is more in branding and promoting the products
and brands. It is reported that around 30 percent of photos are selfies in social media and more
than one million selfies are taken every day (Locateadoc.com, 2014). The selfie postings by
public and company are said to enhance the brand equity along with the other promotional and
branding activities. Selfie-posting and other related interactions between consumers and
companies suggest effective marketing of both consumers’ self-images and company’s
products. A study by (Chang, 2014) investigate how businesses and consumers are co creating
brand value on social media by sharing photos on Instagram. The main look at how customers
presenting brand images and identify with brand personalities through selfies. Building a strong
brand, according to the Customer-Based Brand Equity Model, can be thought of in terms of a
sequential series of steps, where the first step is to ensure identification association of the brand
in customers‟ minds, secondly to establish the totality of brand meaning in the minds of
customers, thirdly to elicit the p responses to this brand identity and brand meaning and lastly
to convert brand response to create an intense, active loyalty relationship between customers
and the brand.(Keller, 2001). Marketers deploys selfie as an indicator that is young, fun and
connected and the selfie is the fact that it gestures towards “corporal sociability (Senft, 2015).
As everyone knows and it’s a news that the Selfies played an important role in Modi campaign,
with the Prime Minister candidate posting and posing pictures of himself with his party’s
electoral symbol on election day and before that, with celebrities, and with family members.
The more amateur look of Narendra Modi’s selfies, conveyed the sense of a more believable
person as a brand Modi rather than an inaccessible icon (Baishya, 2015). Consumer’s
participation in different types of events increases brand equity and that brand experience is
the most important mediator (Zarantonello, 2013). A study by (Sandhya, 2011) explored
whether selfie campaigns extends brand personality and enhance brand personality as a part of
company’s integrated marketing communication among young consumers aged in the group of

95
18-29. Companies are using social media networks to create brand equity and also explore its
challenges to draw the attention of those companies venturing into social media networks
through selfies to increase brand awareness and brand image (Alblooshi, 2015). The major part
of social media marketing is happening with the help of selfies among the online community
as pointed out by (As’ad, 2015). (Farhat, 2011) mentioned in his study that the E-WOM created
by many activities are enhancing the brand equity.
Objectives:
Primary:
To identify the selfie campaign’s role in leveraging brand equity
Secondary:
To understand the patterns and profiles of Selfies taken (Selfie- Psychology)
Methodology: The study investigates “Selfie’s role in brand equity” is a working paper and
exploratory in nature used both primary and secondary data. A survey & interview schedule
method using simple random sampling method on people who participated in selfie campaign
and selfie users was administered. A survey instrument (Questionnaire) was developed
measuring selfie campaign impacts, selfie’s relationship with brand equity and usage pattern.
The Questionnaire was administered to a sample of 366 selfie freaks representing social groups
such as students and working professionals. Results were presented using Descriptive statistics,
Correlation, Regression and infographics using SPSS and Excel.
Major Findings:
All the brand equity parameters are positively correlated with the selfie campaign.
Brand feelings tops the list and the performance measure in the way down among the
dimensions.
Brand imagery is the most influenced by selfie campaign understood with the R Square
value of 0.900.
Selfie psychology reveals that the occasions of selfie in general like hangout, get
together, the age group who participate more is 20-25, the average number of selfies as
5, the sharing platforms and the impacts like being social and independent etc..,
Conclusion
Brand promotion had always been a viral move. The awareness of a brand or the upward
movement of a brand was always associated with the exploitation of a recent trend among
youth. When a brand is perceived youthfully, the sale also gallops youthfully. ‘Selfie’ is a new
generation trend; a trend that is viewed very seriously as a personality factor; a trend that is
assessed towards an updated individual; and a trend representing young consumers. Selfie had
lead to opening up of a red carpet welcome to many complex societal phenomenon, and its
picking up fast as a tool in building brand acceptance and brand awareness. Understanding this
trend only, many MNC have started occupying the eye-space of the consumers in busy walk-
in malls and airports. This paper tries to take some baby-steps to understand the liveliness of
the ‘selfie’ marketing tool.
References:

96
Alblooshi, A. (2015). Self-Esteem Levels & Selfies: The Relationship between Self-
Esteem Levels and the Number of Selfies People Take and Post, and the Uses and
Gratifications of Taking and Posting Selfies (Doctoral dissertation, Middle Tennessee State
University).
As' ad, H. A. R., & Alhadid, A. Y. (2014). The Impact of Social Media Marketing on Brand
Equity: An Empirical Study on Mobile Service Providers in Jordan. Review of Integrative
Business and Economics Research, 3(1), 315.
Baishya, A. (2015). Selfies|# NaMo: The Political Work of the Selfie in the 2014 Indian
General Elections. International Journal of Communication, 9, 15
Chang, C. Y. (2014). Visualizing brand personality and personal branding: case analysis
on Starbucks and Nike's brand value co-creation on Instagram.
Keller, K. L. (2001). Building customer-based brand equity: A blueprint for creating strong
brands (pp. 68-72). Cambridge, MA: Marketing Science Institute.
Sandhya A. S (2016).Exploring the Influence of Selfie Phenomenon on Brand Personality,
The International Journal of Business &Management (ISSN 2321– 8916)
Senft, T. M., & Baym, N. K. (2015). Selfies introduction~ what does the selfie say?
Investigating a global phenomenon. International Journal of Communication, 9, 19.
Zarantonello, L., & Schmitt, B. H. (2013). The impact of event marketing on brand equity:
The mediating roles of brand experience and brand attitude. International Journal of
Advertising, 32(2), 255-280.
Farhat, R., & Khan, B. M. (2011). Importance of brand personality to customer loyalty: A
conceptual study. New media and mass communication, 1(1),4-10.
http://www.locateadoc.com/article/infographic-selfie-psychology-stats-and-info

97
Selfies : A dramaturgical revelation of the self
Bhupesh Manoharan & Krishanu Rakshit
Indian Institute of Management Calcutta
Abstract :
In today’s world, the process of digitization and the proliferation of social media have brought
about marked changes in consumer behaviour in both physical and electronic market places.
Recently, increased access to digital and mobile technologies have enabled consumers to
display themselves publicly on social media platforms through a distinctive cultural marker of
the current generation—“the selfie”. This research examines selfies, a self-presentation tool
and connects the phenomenon with extant literature as a potent tool for self-identity
construction.
The selfie, a self-expressive portraiture of oneself that is captured using a smart phone and
shared publicly by the individual on social media, features him/her as the focal subject in the
picture (Lim, 2016). Researchers have studied different forms of digital self-presentation such
as blogging and website design (Arsel and Bean, 2013; Schau and Gilly, 2003) where the self
is inferred through indirect means like the content posted and other non-verbal cues. Extant
research has also focussed on the various ways by which presenters promote their self like the
“megaphone effect” and “snapshot aesthetics” to attract audiences (McQuarrie et al., 2013;
Schroeder, 2013). However, selfies differ from the extant forms of digital self-presentation
where the “direct” self of the presenter is of predominant focus when compared to blogs and
websites. The social media sites allow consumers who take their selfies, the control to choose
the kind of audience they would want to share their images with. Thus, selfies provide
individuals with the ability and control to present the identity they want to showcase to the
audience. In this context, it becomes important to understand why consumers take selfies; how
consumers present their self through selfies and how they construct their identities using selfies.
Selfies are arguably the most controversial phenomena in today’s world. Academics have been
at best, divided in their opinion as far as this phenomenon is considered. Selfies have been
derided as being inappropriate, irreverent, stupid, narcissist, inward looking, and dangerous,
(Shah, 2015; Novakova, 2014). Young men and women clicking their pictures in various

98
stages of undress and posting these on social media, simply to earn ‘likes’ and adulation from
their communities has also irked many in the society. Such behavior from the point of view of
accepted social norms, of course has been ‘disturbing’, and the rise of selfies has been attributed
to the self-obsessive nature of the millennials. However, some academics have come to the
rescue of the selfie-addicts, terming this as a Do-it-Yourself (DIY) self-expression and
liberation (Shah, 2015; Nemer and Freeman, 2015). Their studies showcase selfie as a
form/medium through which marginalized individuals are expressing themselves with greater
confidence.
Extant literature suffers from a rather symptomatic view of selfies and had failed to probe
beyond the obvious. We feel that Selfies to a large extent contribute to create a sense of identity
among consumers and it is rarely an impulsive behavior, rather, a well-thought out move. The
current research involved interviewing 35 young (23-32 year old) consumers who are active
on social media and have regularly posted selfies on social media platforms. These respondents
discussed the various selfies that they had clicked over a period of time and why they were
important (and, not important) to them. The age group that was chosen was 23-32 as this group
spent more time on social media platforms and are known to be more tech savvy and sharing
pictures and other digital material to enhance their self-image.
A multi-method approach was adopted for the data collection process. Participants were
interviewed for one to two hours each using a semi-structured questionnaire. The informants
were asked to show their selfies (both posted online, or saved in their computers) and posts;
and this was followed by questions about the situation/ context in which the selfies were taken,
purpose of their selfies, what according to them these selfies communicated to the intended
audience, their motivations for posting the selfies, how and what kind of selfies they chose to
post, and so on and so forth. Follow-up questions and discussions varied by informant and
analysis iterations (McCracken, 1988; Spradley, 1979). The interviews were coded by both
researchers and the analysis was done in an iterative style, following the hermeneutic circle of
understanding (Schwandt, 1997).
The study clearly brings out that clicking selfies and sharing them over social media platforms
serves a unique purpose in individuals’ lives; consumers progress through an elaborate process
of documentation through posting pictures of them, collecting feedback and then reposting;
almost akin to an elaborate rehearsal. The process seems to create a more ‘acceptable’ form of
their own identity across specific groups of audiences. The alternating process of disapproval,
approval, disapproval leads them through phases of self-celebration and self-presentation.
Respondents are found to use selfies for documenting their life-events, akin to writing a digital
diary through images and expressions that capture their transient moods. (Ref. Heehs, 2013).
The paper shows that consumers either try to construct an ideal self, exhibit their extended self
or try to gain an affirmation of their extant self. The study also reveals how consumers’ selfies
constitute a conscious dramaturgical process of connecting with the intended audience
(Goffman, 1959). We found that self-portrayals using selfies were considered as performance
by the consumers. Social media sites allow consumers to manage the front and back stages
better (front stage: social media space, back stage: personal individual space). The presentation
of the self in the frontstage is governed by the nature of interaction and the approval consumers
receive from the others (Dominick, 1999). Individuals manage the self-presentation process
across multiple layers of audience; Goffman (1959) termed these layers as personal spaces.
Consumers present themselves to the first set (e.g. closest friends, colleagues, family members)
and seek their approval; once the actors refine the performance with the feedback, they re-enter
the frontstage to present their self to the next layer of audience; and between alternately

99
curating and presenting their selves, eventually they present an updated self to the widest
intended audience. This results in the evolution and construction of the individual’s identity.
Most informants also stated that they use Selfies to “record” important events/ moments in their
lives. Akin to Heehs (2013), selfies are a part of their digital diary, a notebook of memories.
Many stored their selfies on their desktops and laptops, or, even smartphones to re-visit them
and cherish (or, contemplate) those moments. Informants also indicated that they curate their
selfies and attempt to present a brighter, happier and likeable picture of themselves in front of
their intended audiences. While some of the respondents admitted capturing unhappy moments
as well during their “selfie-journey”, they mentioned that this was merely to capture the
moment and not for presenting to the ‘outside’. Marder, Joinson, & Shankar (2012) also point
that the nature of audience impacts the nature of posts individuals engage in so that they do not
run out of favor. Some of the respondents also pointed out that this is an evolutionary process;
they feel that in order to cater to their audience, they should be able to surpass their previous
images and do better, every time.
Another interesting aspect that emerged through few of the respondents’ comments is that,
while most of the individuals are quite active on social media, sharing of selfies is not
indiscriminate. There appears to be a ‘stronger’ sense of purpose than just compulsive behavior
that leads to sharing pictures but, is in sync with the appropriate audience.
We adopted the understanding of Goffman (1959) to understand the online-social behavior of
young individuals and we find support for the framework throughout the study. We find
evidence that there is a deeper connection between individuals and the content they post online;
while the standard narrative might dismiss it as a part of decadent culture of self-obsession, it
may not be true. We observed a conscious effort from these individuals to connect to their
‘target’ audiences and build a sense of identity.
The Selfie phenomenon has been tagged rather unfairly as a culturally degenerative practice.
We merely attempt to unearth some of the deeper connections that younger consumers have
established with this habit. However, it will be necessary to explore the evolutionary meanings
that selfies attribute to individuals; or, does it really take the control of the self-identity
development from the millennial individual and pass it on to the audience as many have
contended; which would require a longitudinal, grounded approach for tracing the evolutionary
process of identity development, especially, in the millennials’ lives.
References
Arsel, Z., & Bean, J. (2013). Taste regimes and market-mediated practice. Journal of
Consumer Research, Vol. 39 No. 5, pp. 899-917.
Dominick, J. R. (1999). Who do you think you are? Personal home pages and self-
presentation on the World Wide Web. Journalism & Mass Communication Quarterly,
76(4), 646-658.
Goffman, E. (1959), The Presentation of Self in Everyday Life, New York: Doubleday.
Heehs, P. (2013). Writing the self: diaries, memoirs, and the history of the self. Bloomsbury
Publishing USA.
Lim, W. M. (2016). Understanding the selfie phenomenon: current insights and future
research directions. European Journal of Marketing, 50(9/10).

100
Marder, B., Joinson, A., & Shankar, A., (2012), Every post you make, every pic you take, I'll
be watching you: behind social spheres on Facebook, System science (HICSS) 45th
Hawaii international conference on, IEEE (2012, January), 859–868.
McCracken, G. 1988. The long interview. Thousand Oaks, CA: Sage Publications.
McQuarrie, E. F., Miller, J., & Phillips, B. J. (2013). The megaphone effect: taste and
audience in fashion blogging. Journal of Consumer Research, Vol. 40 No. 1, pp. 136-
158.
Murray, D. C. (2015). Notes to self: the visual culture of selfies in the age of social media.
Consumption Markets and Culture, Vol. 18 No. 6, pp. 490-516.
Nemer, D., & Freeman, G. (2015). Empowering the marginalized: Rethinking selfies in the
slums of Brazil. International Journal of Communication, 9(0), 1832-1847.
Novakova, P. (2014) To be seen or not to be: Narcissistic tendencies among bloggers.
Available at: https://www.inter-disciplinary.net/critical-issues/wp
content/uploads/2014/05/novakovacelpaper.pdf (Accessed on February 26, 2017).
Schau, H. J., & Gilly, M. C. (2003). We are what we post? Self-presentation in personal web
space. Journal of consumer research, 30(3), 385-404.
Schroeder, J. E. (2013). Snapshot aesthetic and the strategic imagination. Visible Culture,
Vol. 18. Retrieved from: http://ivc.lib.rochester.edu/portfolio/snapshot-aesthetics-and-
the strategic-imagination/#sthash.KtOgCP1D.dpuf
Schwandt, T. A. (1997). Evaluation as practical hermeneutics. Evaluation, 3(1), 69-83.
Shah, N. (2015). The Selfie and the Slut. Economic & Political Weekly, 50(17), 87.
Spradley, J. (1979). The ethnographic interview. New York: Holt, Rinehart and Winston.

101
Drivers of Customer Engagement in Online Retail: Demand and Supply Side Analysis
Sri Ranjini, Adithya N, Sundeep Srinivasan & Sriram D
Great Lakes Institute of Management, Chennai
Introduction
The e-commerce retail in India is a growing phenomenon. With the likes of Flipkart
and Amazon growing large in size, the contribution of e-commerce to the economy is likely to
increase in future. This research involves studying customer engagement from a service
provider and the customer’s perspective in e-commerce websites. An extensive study of
existing literature was undertaken before analyzing the perception of engagement from both
perspectives. It is more than just selling a product but proposing a solution to a product by
delivering value. More than just selling products firms are using engagement as a strategy to
deliver experience.
Objectives
The research aims to establish the level of engagement and the factors that lead to
engagement both from a buyer’s perspective and a seller’s perspective. The literature review
provides an opportunity for testing effects of Customer Perceived Value, Interaction,
Experience and Participation on loyalty of consumers mediated by engagement. Empirical
research on engagement is limited and this study aims to fulfil this gap.
Research Question
From review of literature, it is evident that the customer engagement drivers are many
and process of engagement may be fairly complex. Studying the mechanism from both a
seller’s perspective and the consumers’ perspective is expected to provide substantial insights
into significant drivers and the process of engagement.
Drivers of Customer Engagement
Customer Engagement (CE) is defined as the process of involving the customers in the
interactive endeavors of the firm which is an effect of their psychological and behavioral traits.

102
Customer engagement is positively related to a number of brand relationship outcomes
surpassing transactional relationships and leading to behavioral manifestations such as
satisfaction, affective commitment, and loyalty (Roderick J. Brodie, 2011; Roderick J. Brodie,
2011).
Fulfilling customer needs remain the primary driver for any firm. The co-creation of
customer perceived value is important to achieve customer retention. The value addition along
with the value delivered to the customer makes a startling difference in relationship with
customers (Jenny van Doorn, 2010).
Research provides evidence of emotions associated with shopping experience. In
certain cases, they are found to be highly attached and are found giving more preference to
their possession (status and happiness) than socialization. The evaluation is done by comparing
the current and the future factors, represented by a typology comprising of people with
high/low arousal and positive/negative affect.
Consumers want to co-create value and interact with not just one firm but with a whole
community of service providers, professionals and other consumers as well. Customer
interaction and customer participation affects new product value creation by improving
effectiveness of the development process by enhancing information sharing and customer-
supplier co-ordination (Fang, Palmatier, & Evans, 2008). Customer participation has always
been a key focus of interest among marketers. It is an elementary aspect of services and a source
of positive outcomes for the service providers as well as the customers. Through the process
of participation, customers can contribute nifty inputs, varying in extent and level of quality
that can shape the engagement process (Doorn, et al., 2010).
The basic and primary route to customer loyalty is the level of satisfaction and the image
maintained by the firm. This model is being tested using the structural equation modelling
(Andreassen & Lindestad, 1998). When companies use a loyalty program or positively
influence the customers to a level that they overlook the negative effects of the corporates
(Bolton, Kannan and Bramlett, 2000).When a firm establishes customer loyalty, it has achieved
its ultimate goal.
Hypotheses
Based on the literature review, the following hypothesis are drawn for testing:
H1: Customer perceived value has a positive effect on customer engagement.
H2: Emotion has a positive effect on customer engagement.
H3: Interaction leads to customer engagement.
H4: Participation leads to customer engagement.
H5: Customer engagement leads to loyalty.
H6a: Customer engagement mediates the relationship between CPV and Loyalty
H6b: Customer engagement mediates the relationship between Emotion and Loyalty

103
H6c: Customer engagement mediates the relationship between Interaction and Loyalty
H6d: Customer engagement mediates the relationship between Participation and Loyalty
Methodology: The conceptual model was evaluated from consumer and seller perspective.
Consumers who are involved in purchasing products from popular e-commerce websites were
administered a survey questionnaire. A similarly worded questionnaire was administered in the
supplier category.
Results: Data collected was checked for reliability, convergent and discriminant validity. The
nomological framework was tested using Partial Least Squares, Structural Equation Modelling,
a correlation based approach instead of covariance based modelling, as this suits smaller
sample size and does not mandate normal distribution of data.
On the Consumer Side, CPV and Participation show positive and significant effects on
loyalty mediated by CE. Emotions exhibit a direct effect on loyalty and CE does not mediate
this effect. From the suppliers’ side CPV and Interaction accept CE as the mediating variable.
Emotion here also impacts Loyalty directly without the presence of CE as a mediating variable.
H1and H5 are among highly consistent set of hypothesis. They are highly significant in
both the seller and the buyer model. The H6a and H6b hypotheses are also valid for both the
models. Emotions are not as important to the customer as much as Customer Perceived Value.
The effects of interaction from buyer and participation is not seen eloquently in the
results which might be because of difficulty in the interpretation of questionnaire or heavier
distribution of weights to value over participation and interaction by both the parties. To
understand the underlying effects, laddering was performed. The results provided key insights
such as introduction of multi-lingual interface for the customers and suppliers to enhance
participation & interaction between one other.
DIAGRAMS:
Customer
Seller:

104
REFERENCES
Andreassen, T. W., & Lindestad, B. (1998). Customer loyalty and complex services: impact of
corporate image on loyalty, customer satisfaction and loyalty for customers with
varying degrees of service expertise. International journal of service industry
management , 7-23.
Van Doorne, J. , Lemon, K. N., Mittal, V., Nass, S., Pick, D., Pirner, P., & Verhoef, P. C.
(2010). Customer Engagement Behavior: Theoretical Foundations and Research.
Journal of Service Research, 253 - 266.
Fang, E., Palmatier, R. W., & Evans, K. R. (2008). Influence of customer participation on
creating and sharing of new product value. Journal of academic marketing science,
322-336.
Jenny van Doorn, e. (2010). Customer Engagement Behavior:Theoretical Foundations and
Research. Journal of Service Research, 253-266.
N.Bolton, R., Kannan, P., & D.Barmlett Implications of Loyalty Program Membership and
Service Experiences for Customer Retention and Value.
Roderick J. Brodie, L. D. (2011). Customer Engagement: Conceptual, Domain, Fundamental
Propositions, and Implications for Research. Journal of Service Research I 4(3), 252-
271.
Effect of WOM Credibility on consumer Purchase intention in Social networking sites
(SNSs): A study of select Facebook fan pages of online retail sites.
Kunja Sambashiva Rao & G.V.R.K Acharyulu
University of Hyderabad
Introduction:
With the expansion of internet penetration, the usage of social media has grown tremendously
over the previous decade from a personal level to the level of being a useful promoting
instrument in the realm of business. Today, many firms from various industries, including
105
online retail (e-commerce) industry proactively utilize the social media as a contrivance to
reach new and existing potential customers. Organizations have changed their marketing
strategies by using the social media as an interactive tool over the traditional promoting
practices (Amersdorffer, Bauhuber, and Oellrich, 2012). Online retail organizations utilize
social networking sites to promote their products and services while customers utilize the same
to provide feedback and in this way, both of these are utilized by the prospective customers to
make purchase decisions. The customers' point of view, social media is a secured source for
better online transactions through disintermediation. Therefore, social media plays a central
role in decision making through peer feedback and the user created content is frequently during,
before and post purchases.
The user created or produced content on social media platform is called electronic word of
mouth (eWOM) or user-generated content (UGC) (Burgess, Sellitto, Cox, & Buultjens, 2011;
Ayeh, Au, & Law, 2013). eWOM is defined as "any positive or negative statement made by a
potential, actual, or former customer about a product or a company, available to a multitude of
people and institutions via the internet" (Henning-Thurau, 2004). It is a considered as a major
important source of information for the purchase of consumer electronics in e-commerce sites.
Many studies conducted to discover its impact on the behavioral intentions or patterns and
purchase intentions (Kim, Chung, & Lee, 2011; Sparks & Browning, 2011). However, there
are very few studies dealt with the influence of the eWOM Credibility source on behavioral
intention of consumers, the trusting intentions on the brand (Casalo, Flavi an, & Guinalíu,
2011) and brand image(Yuan et al., 2016). eWOM Credibility defined as “a source or message
is a receiver-based judgment which involves both objective judgments of information quality
or accuracy as well as subjective perceptions of the source’s trustworthiness, expertise, and
attractiveness” (Metzger, 2007). Perceptions of credibility are derived from all the information
available on social media platform about the source and message (Castillo, Mendoza & Poblete,
2011). Therefore credibility will be evaluated as a summation of the level of perceived
credibility of source , perceived source expertise and perceived source trustworthiness
(Willemsen, Neijens & Bronner, 2012), as well as perceived credibility of message, perceived
message accuracy, believability and factualness (Eastin, 2001).
Trust is an important factor in the virtual environment because the absence of information
source identity, difficulty in assessing the previous consumption patterns and lack in the
prevention of online frauds (Brengman & Karimov, 2012).Trust is defined as ‘‘rationally based
expectation that technically competent performance and/or fiduciary obligation and
responsibility will be forthcoming’’. In online context consumer trust in brand or trust in sellers

106
have empirically proved as a significant factor of purchase intention (McKnight, Choudhury,
& Kacmar, 2002b).
Brand image is considered as a signaling phenomenon because high brand image ensures
quality product that can reduce consumer's uncertainty (Hazée et al., 2017). Brand image can
be defined as a " mental construct developed by the consumer on the basis of a few selected
impressions among the flood of the total impressions; it comes into being through a creative
process in which these selected impressions are elaborated, embellished, and ordered"
(Reynolds, 1965). Brand image is the brand value in the mind of the consumers (Yuan et al.,
2016). A strong brand image influences consumers to pay higher prices, which in turn provides
competitive advantages and market success to a company (Aranda et al., 2015). Customers go
through retail websites ratings, social networking sites (Facebook and twitter) content and
YouTube videos for before purchasing products, therefore SNSs grabbing attention from
academia and industry. Hence there is need to study this phenomenon in Indian context. Scant
research is found Facebook brand pages as medium of eWOM research(C. M. Cheung &
Thadani, 2010), the majority of prior studies paid attention using online blogs, virtual forums,
community of review websites as an eWOM platforms (Kozinets, De Valck, Wojnicki, &
Wilner, 2010). Very less number of studies provided empirical findings by exploring facebook
networking site on behavioral intentions. Some researchers used Facebook brand pages as
medium of eWOM research(C. M. Cheung & Thadani, 2010), the majority of prior studies paid
attention using online blogs, virtual forums, community of review websites as an eWOM
platforms (Kozinets, De Valck, Wojnicki, & Wilner, 2010). Few studies provided empirical
findings by exploring facebook networking site on behavioral intentions. Most of Recent
studies have focused on various aspects of antecedents of online reviews and its influence on
behavioral intentions of consumers. However, very few studied articulated influence of
credibility of eWOM on consumer trust in brand and brand image in the mind of consumers in
social media context (Kostyra et al., 2016). Therefore, the present study endeavors to fill the
current research gap and explore in to the effect of eWOM Credibility on Brand trust and brand
images on consumer purchase intention of consumer electronic products in India. Numerous
types of user generated reviews influence on the consumers purchase decisions (Lee and Hong,
2016). Now days it is common phenomenon to searching for online reviews before taking
decision to purchase (Zhang et al., 2014). Credibility of online reviews plays a significant role
in trust in eWOM Source; Therefore Consumers prior to acceptance usually inquire about the
credibility of online reviews (Shan, 2016). The present study takes theoretical assistance to
build the relationships between the variable such as Theory of planned behavior, Theory of

107
rezones action, Attribution theory and Trust theory. This study also examines mediation effect
of trust in brand and brand image. This study selects consumer electronics products from fan
pages e-commerce websites, because consumer electronics are most reviewed products among
various product categories.
Various studies have conducted on eWOM from the emerging countries like Iran (Jalilvand &
Samiei, 2012; Jalilvand et al., 2012) China (Fan & Miao, 2012; Wang et al., 2012), South Korea
(Doh & Hwang, 2009) and Thailand (Olapiriyakul & Kangsirikul, 2012). -However, very
limited research has been conducted on this topic in India. Therefore the main aim of the study
is to examine the influence of eWOM credibility on trust, brand image and purchase intentions
of consumer electronics on Facebook fan pages of e-commerce sites in India the study also
examines the mediating effect of Trust and brand image in between the relationship of WOM
Credibility and purchase intention
Objectives of the study:
To examine the effect of WOM Credibility on purchase intention trough trust and brand
image in Facebook fan pages of e-commerce sites in India.
To examine the mediation effect of brand trust and brand image on the effect of eWOM
Credibility on purchase intention.
To examine the mediation effect of Trust, brand image in between the relations of
eWOM Credibility and purchase intention
Figure 1: Proposed conceptual model
eWOM Credibility
Trust
Purchase intention
Brand image
H3
H1
H6
H4
H5
H2

108
Methodology:
Research approach fallowed in the current study was a cross section survey method and
quantitative approach to test the relationships of proposed constructs. The primary data was
collected from consumers of electronics and followers of three e-commerce sites (Flipkart,
Amazon, snap deal) fan pages on Facebook. The study conducted a pilot study to assess the
construct reliability and validity. The final study collected data was analyzed with the help of
structural equation modeling (SEM) technique. The study used IBM SPSS -21 and AMOS-
21software for the analysis.
Results and findings:
Pilot study was conducted by collecting 100 samples from fan pages and data was analyzed
with SPSS Software. The constructs reliability crone back’s alpha values were ranged from
0.773 to 0.954. It was more than the threshold value of 0.7 as suggested Nunally (1978). EFA
results indicates the sample adequacy test (KMO) was above 0.80 which is more than the
threshold value 0.50 as suggested by Malhotra & dash (2011). For final study survey data
collected from 393 and conducted confirmatory factor analysis using Maximum likelihood
estimation method(MLE), The Measurement model fit indices results indicated as
CMIN/DF(1.797), GFI (.951),CFI .967),AGFI(.932),TLI(0.960),RMSE(0.045). All the results
were within the threshold values. The study also conducted convergent validity and
discriminant validity for the model validation and Common method bias also estimated by
using CLF method results indicated that sample is free from common method bias. The
proposed hypothesis testing using SEM, results reveals that the relationship between eWOM
Credibility and Purchase intention was positive significant effect (β = 0.464, t=6.675, p < .001)
(H1). The relationship between eWOM Credibility and Brand image was significant (β = 0.377,
t=5.616, p < .001) (H2); eWOM Credibility on Trust in brand was found significant (β = 0.210,
t=3.449, p < .001) (H3); Trust in brand on purchase intention was significant (β = 0.167,
t=2.421, p < .001) (H4).Brand image on trust in brand(β = 0.471, t=7.177, p < .001) (H5);
Brand image on purchase intention(β = 0.167, t=2.421, p < .001)(H6). The final model was
also estimated squared multiple correlations (r²) Brand image (0.14), Trust in brand (0.34) and
overall three variable multiple correlation explains on purchase intention (0.50). ). Mediation
analysis is conducted to examine the indirect effect using bootstrapping technique Baron and
Kenny (1986).The relationship of (eWOM Credibility Trust Purchase intention) Direct
effect (.498***) indirect effect (0.127***) and the relationship of (eWOM Credibility Brand
image Purchase intention) Direct effect (0.516***) indirect effect (0.107***). The two
indirect mediating paths shown Partial media effect since all the paths found significant.
109
Implications of the Study:
Since the proposed hypothesis found significant, the proposed model is deemed to be fit. The
empirical findings of the study contributes the existing body of knowledge of the theories of
eWOM Credibility, Trust theory, attribution theories, Theory of reasoned action, theory of
planned behavior and social media literature. Considering these findings, the marketers and
manufacturers of consumer electronics can take appropriate actions towards their brands to
attract the consumers in the market. The study helps online retailers cop up with social media
fan pages and to manage user generated content (eWOM). Firms can also endeavor to
understand consumer decision making process and able to enhance consumer trusting intention
using their social media marketing strategies. Consumer electronics companies can improve
their products, redesign and firm can get consumer insights. The present study is limited to
social media fan pages of e-commerce websites, the future studies should conduct individual
consumer electronics fan pages.
References:
Amersdorffer, D., Bauhuber, F., & Oellrich, J. (2012). The economic and cultural aspects of
the social web: Implications for the tourism industry. Journal of Vacation Marketing, 18(3),
175-184.
Burgess, S., Sellitto, C., Cox, C., & Buultjens, J. (2011). Trust perceptions of online travel
information by different content creators: Some social and legal implications. Information
Systems Frontiers, 13(2), 221-235.
Hennig-Thurau, T., Gwinner, K. P., Walsh, G., & Gremler, D. D. (2004). Electronic word-of-
mouth via consumer-opinion platforms: what motivates consumers to articulate themselves on
the internet? Journal of interactive marketing, 18(1), 38-52.
Metzger, M. J. (2007). Making sense of credibility on the Web: Models for evaluating online
information and recommendations for future research. Journal of the Association for
Information Science and Technology, 58(13), 2078-2091.
McKnight, D. H., Choudhury, V., & Kacmar, C. (2002). Developing and validating trust
measures for e-commerce: An integrative typology. Information systems research, 13(3), 334-
359.

110
Reynolds, W. H. (1965). The role of the consumer in image building. California management
review, 7(3), 69-76.
Kozinets, R. V., De Valck, K., Wojnicki, A. C., & Wilner, S. J. (2010). Networked narratives:
Understanding word-of-mouth marketing in online communities. Journal of marketing, 74(2),
71-89.etc
Facebook as a Medium for Consumer Advocacy: An Investigation using Uses &
Gratifications (U&G) Perspective
Jayasimha K.R
Indian Institute of Management, Indore
Abstract:
Consumer advocacy is a unique form of NWOM, in which consumers share dissatisfactory
service experiences with a preventive focus. It is a goal-oriented behavior. Uses &
Gratifications paradigm argues that goal orientation of the audience dictates the choice & use
of the medium. Therefore, expectations from the medium will result in differential ways of
engagement with the medium, which in turn results in gratifications. The current study
investigates the choice and use of Facebook for consumer advocacy. Study 1 (n=112) uses
vignettes to identify expectations driving the choice of the medium. Study 2 (116) and study 3
(n=120) use experience sampling to validate the dimensions. We find that media
characteristics, community response, organizational response and medium to complain are the

111
dimensions influencing the choice and use of Facebook for consumer advocacy. Theoretical &
practical implications are discussed.
Key Words: Consumer Advocacy, Facebook, Uses & Gratifications, Social Networking sites,
Media.
Understanding third party customers justice perceptions and behavioral reactions to
service failure and recovery
Niharika Gupta & Harsh V. Verma
University of Delhi
Abstract:
Service failures are common and are often witnessed by other customers. Customers’ justice
perceptions not only depend upon their own experience, but also depend upon how fairly others
are treated. Research in social psychology suggests that people in similar
settings/circumstances expect and deserve similar treatment and people often react emotionally
and behaviourally when they observe others being treated unfairly. This results in negative
evaluation of fairness in such situations. The perceptions of how fairly others are treated is
referred to as third party justice perception. Most of research on third party justice is conducted
in the organizational setting. In the service literature, the concept of third party justice has not
been explored much. Most of the prior research in the service domain focuses on effects of

112
service failure and recovery attempts on focal customer. Very little is known about how service
failure and firm’s service recovery attempts impact the observing customer’s reactions and
behavior. Also from the marketing point of view, it is very important for the service provider
to understand the service environment and to build service recovery strategies which not only
satisfies the focal customers but also have a positive impact on the observing customers. For
this, an extensive research is required in the services domain which focuses on the third party
justice perception in the context of different service settings. Therefore, we propose a
theoretical model to study and examine third party customer’s justice perceptions and
behavioral intentions following a service recovery.
Keywords: Service Failures, Service Recovery, Third Party Customers, Perceived Justice
References
Adams, J. S. (1963). Towards an understanding of inequity. The Journal of Abnormal and
Social Psychology, 67(5), 422.
Adams, J. S. (1965). Inequity in social exchange. Advances in Experimental Social
Psychology, 2, 267-299.
Albrecht, K. (2016). Understanding the effects of the presence of others in the service
environment: A literature review. Journal of Business Market Management, 9(1), 541-563.
Bies, R. J., & Moag, J. S. (1986). Interactional justice: Communication criteria of fairness.
Research on Negotiation in Organizations, 1(1), 43-55.
Blader, S. L., Wiesenfeld, B. M., Fortin, M., & Wheeler-Smith, S. L. (2013). Fairness lies in
the heart of the beholder: How the social emotions of third parties influence reactions to
injustice. Organizational Behavior and Human Decision Processes, 121(1), 62-80.
Blodgett, J. G., Hill, D. J., & Tax, S. S. (1997). The effects of distributive, procedural, and
interactional justice on post complaint behavior. Journal of Retailing, 73(2), 185-210.
Bonifield, C., & Cole, C. A. (2008). Better him than me: social comparison theory and service
recovery. Journal of the Academy of Marketing Science, 36(4), 565-577.
Casidy, R., & Shin, H. (2015). The effects of harm directions and service recovery strategies
on customer forgiveness and negative word-of-mouth intentions. Journal of Retailing and
Consumer Services, 27, 103-112.
Chebat, J. C., & Slusarczyk, W. (2005). How emotions mediate the effects of perceived justice
on loyalty in service recovery situations: an empirical study. Journal of Business
Research, 58(5), 664-673.
Colquitt, J. A. (2004). Does the justice of the one interact with the justice of the many?
Reactions to procedural justice in teams. Journal of Applied Psychology, 89(4), 633-646.
Cropanzano, R., Goldman, B., & Folger, R. (2003). Deontic justice: The role of moral
principles in workplace fairness. Journal of Organizational Behavior, 24(8), 1019-1024.

113
De Cremer, D., & Van Hiel, A. (2006). Effects of another person’s fair treatment on one’s own
emotions and behaviors: The moderating role of how much the other cares for
you. Organizational Behavior and Human Decision Processes, 100(2), 231-249.
Folger, R., & Cropanzano, R. (2001). Fairness theory: Justice as accountability. Advances in
Organizational Justice, 1, 1-55.
Folger, R., Cropanzano, R., & Goldman, B. (2005). What is the relationship between justice
and morality? Handbook of Organizational Justice, 215-245.
Gelbrich, K., & Roschk, H. (2011). A Meta-Analysis of Organizational Complaint Handling
and Customer Responses. Journal of Service Research, 14(1), 24-43.
Goodwin, C., & Ross, I. (1992). Consumer responses to service failures: influence of
procedural and interactional fairness perceptions. Journal of Business research, 25(2), 149-
163.
Hoffman, K. D., Kelley, S. W., & Rotalsky, H. M. (1995). Tracking service failures and
employee recovery efforts. Journal of Services Marketing, 9(2), 49-61.
Kray, L. J., & Lind, E. A. (2002). The injustices of others: Social reports and the integration of
others' experiences in organizational justice judgments. Organizational behavior and human
decision processes, 89(1), 906-924.
Kim, N. & Lee, M. (2012). Other customers in a service encounter: examining the effect in a
restaurant setting. Journal of Services Marketing, 26(1), 27-40
Lind, E. A., & Tyler, T. R. (1988). The social psychology of procedural justice. New York:
Plenum Press.
Ludwig, N. L., Ludwig, N. L., Barnes, D. C., Barnes, D. C., Gouthier, M., & Gouthier, M.
(2017). Observing delightful experiences of other customers: the double-edged sword of
jealousy and joy. Journal of Service Theory and Practice, 27(1), 145-163.
Mattila, A. S. (2001a). The effectiveness of service recovery in a multi-industry setting. Journal
of Services Marketing, 15(7), 583-596.
Mattila, A. S. (2004). The impact of service failures on customer loyalty: The moderating role
of affective commitment. International Journal of Service Industry Management, 15(2), 134-
149.
Mattila, A., Hanks, L., & Wang, C. (2014). Others service experiences: emotions, perceived
justice, and behavior. European Journal of Marketing, 48(3/4), 552-571.
McColl-Kennedy, J. R., & Sparks, B. A. (2003). Application of fairness theory to service
failures and service recovery. Journal of Service Research, 5(3), 251-266.
Mitchell, M. S., Vogel, R. M., & Folger, R. (2015). Third parties’ reactions to the abusive
supervision of coworkers. Journal of Applied Psychology, 100(4), 1040.
O'reilly, J., & Aquino, K. (2011). A model of third parties' morally motivated responses to
mistreatment in organizations. Academy of Management Review, 36(3), 526-543.

114
O’Reilly, J., Aquino, K., & Skarlicki, D. (2016). The lives of others: Third parties’ responses to
others’ injustice. Journal of Applied Psychology, 101(2), 171.
Río-Lanza, A. B., Vázquez-Casielles, R., & Díaz-Martín, A. M. (2009). Satisfaction with
service recovery: Perceived justice and emotional responses. Journal of Business
Research, 62(8), 775-781.
Schoefer, K., & Diamantopoulos, A. (2008). The role of emotions in translating perceptions of
(in) justice into post complaint behavioral responses. Journal of Service Research, 11(1), 91-
103.
Skarlicki, D. P., Ellard, J. H., & Kelln, B. R. (1998). Third-party perceptions of a layoff:
Procedural, derogation, and retributive aspects of justice. Journal of Applied Psychology, 83(1),
119-127.
Skarlicki, D. P., & Kulik, C. T. (2004). Third-party reactions to employee (mis) treatment: A
justice perspective. Research in Organizational Behavior, 26, 183-229.
Skarlicki, D. P., & Rupp, D. E. (2010). Dual processing and organizational justice: the role of
rational versus experiential processing in third-party reactions to workplace
mistreatment. Journal of Applied Psychology, 95(5), 944-952.
Skarlicki, D. P., O’Reilly, J., & Kulik, C. T. (2015). The third-party perspective of (in)
justice. Oxford handbook of justice in work organizations, 235-255.
Smith, A. K., Bolton, R. N., & Wagner, J. (1999). A model of customer satisfaction with service
encounters involving failure and recovery. Journal of Marketing Research, 356-372.
Spencer, S., & Rupp, D. E. (2009). Angry, guilty, and conflicted: injustice toward coworkers
heightens emotional labor through cognitive and emotional mechanisms. Journal of Applied
Psychology, 94(2), 429.
Tax, S. S., Brown, S. W., & Chandrashekaran, M. (1998). Customer evaluations of service
complaint experiences: implications for relationship marketing. The Journal of Marketing, 60-
76.
Tombs, A. G., & McColl‐Kennedy, J. R. (2013). Third party customers infecting other
customers for better or for worse. Psychology & Marketing, 30(3), 277-292.
Umphress, E. E., Simmons, A. L., Folger, R., Ren, R., & Bobocel, R. (2013). Observer reactions
to interpersonal injustice: The roles of perpetrator intent and victim perception. Journal of
Organizational Behavior, 34(3), 327-349.
Van den Bos, K., & Lind, E. A. (2001). The psychology of own versus others’ treatment: Self-
oriented and other-oriented effects on perceptions of procedural justice. Personality and Social
Psychology Bulletin, 27(10), 1324-1333.
Van Vaerenbergh, Y., Vermeir, I., & Larivière, B. (2013). Service recovery's impact on
customer’s next-in-line. Managing service quality, 23(6), 495-512.
Wan, L. C., Chan, E. K., & Su, L. (2011). When will customers care about service failures that
happened to strangers? The role of personal similarity and regulatory focus and its implication
on service evaluation. International Journal of Hospitality Management, 30(1), 213-220.

115
Frontline Employees Job Satisfaction and Intentions to Stay with the Star Hotels: A Serial
Mediation Model
U. Madhan Rajan, Jayanth Jacob & Murugan Pattusamy
Anna University; Australian Council for Educational Research India, New Delhi
Introduction
Service industry requires significant contribution from Front-line employees in delivering
service and also in building a long-term relationship with customers. Today’s globalized
economy, rise of the service industry, and fast changing organizational structure, have replaced
the long-term relationship between employer and employees with short-term transactional
relationship (Maden, 2014). Bitner, Booms, and Mohr (1994) and Hee Yoon, Beatty, and Suh
(2001) studied employee attitudes, behavior and their intention towards customers, all of which
determine customer perceived service quality and satisfaction. Employee retention is a very
important task that involves considerable cost to companies, and is required for effective
service to customers and enhancing competitiveness (Alexandrov, Babakus, & Yavas, 2007;
Frank, Finnegan, & Taylor, 2004; Hendrie, 2004). Past literature shows the existence of
significant relationships among the satisfaction levels of the employees and their commitment
towards the organization, their recovery performance and their intention to stay in the
organization (Boshoff & Allen, 2000; Rod, Ashill, & Carruthers, 2008; Yavas, Karatepe, Avci,

116
& Tekinkus, 2003). To the best of our knowledge in Indian context less evidence is existed to
understand the relationship among job satisfaction, service recovery performance,
organizational commitment and frontline employees (FLE’s) intentions to stay. In the present
study we tried to understand how job satisfaction is related to FLE’s intentions to stay through
service recovery performance first and then organizational commitment. This is the first study
to understand these relationships in serial mediation and Indian context.
Theory and Hypothesis development
According to the social exchange theory, the rules of reciprocity states that an exchange always
needs a bidirectional transaction i.e. something must be given in exchange of something
offered. Witt and Wilson (1990) have identified the strengthening of the relationship by the
exchange ideology between job satisfaction and commitment. This ideology further
strengthens the effects between equal opportunity and attitudes and indirectly influences
employee intention to stay through his/her sensitivity towards organizational politics
(Andrews, Witt, & Michele Kacmar, 2003).
The conservation of resources (COR) theory provides useful directions in developing
relationships stating that individuals strive to gain, retain, preserve and foster resources that are
objects, personal characteristics, conditions and energies (Hobfoll, 1989). When the employees
feel that they have been provided with adequate resources from the organization, their
satisfaction level increases, which in turn, enhances their recovery performance. This enhanced
recovery performance and job satisfaction ultimately leads to positive influence on their
intentions to stay.
From past literature (Bendall-Lyon & Powers, 2001; De Ruyter & Wetzels, 2000), it is seen
that when service failures occur, the FLE’s performance in dealing with this service failure, i.e.
Service Recovery Performance (SRP), is a key strategic issue. It is surprising to see scant
research exploring SRP and its importance from the managerial perspective. Understanding
SRP is crucial because successfully solving a service failure leads to improved loyalty more
than satisfying the customer the first time around (Lorenzoni & Lewis, 2004; Magnini, Ford,
Markowski, & Honeycutt Jr, 2007; White & Yanamandram, 2007).
Recent advancement on mediation analysis has led to its extension to the concept of moderated
mediation/ mediated moderation and serial mediations of multi-stage from the concept of
simple mediational models (Pattusamy & Jacob, 2016). Hayes (2013) and van Jaarsveld,
Walker, and Skarlicki (2010)stated that when two different mediators influence the relationship
between the independent variable and dependent variable through mediation, it is said to be
serial mediation. In this work, a serial mediational relationship between job satisfaction and
intention to stay with the organization was established through SRP and organizational
commitment.
Many empirical studies have proven that organizational commitment and SRP are significant
mediators in enhancing the relationship between job satisfaction and intention to stay
(Alexandrov et al., 2007; Ashill, Rod, & Carruthers, 2008; Karatepe, 2006). Alexandrov et al.
(2007) and other studies in the field accept that retention of committed and satisfied FLEs is of
foremost importance to business success.
Based on the above-mentioned theoretical understanding we expect the following hypotheses:

117
H1: There is positive relationship between frontline employees job satisfaction and their
intention to stay with the organization.
H2: The relationship between job satisfaction and intention to stay is mediated by service
recovery performance.
H3: The relationship between job satisfaction and intention to stay is mediated by
organizational commitment.
H4: Job satisfaction is related to intention to stay through the mediating effects of service
recovery performance with organizational commitment.
Methods
The structured questionnaire was administered to 350 frontline employees, with the help of HR
managers of different star hotels in Chennai. Data was collected using purposive sampling from
FLE’s who work in different departments and have direct interaction with customers. Human
Resource Managers were asked to brief them about this survey and encourage all FLE’s to
participate. Confidentiality was assured to ensure anonymous response during working hours.
Surveyed FLEs delivered services such as food and beverage service, food production (who
serve in live counters), accommodation and housekeeping services and spent a large portion of
their work time interacting with customers. Employees were given enough time to respond to
the survey and, in the end, 278 useable questionnaires were collected, with a response rate of
approximately 70%. 85% the respondents were male, 15% were female. Almost half of the
respondents (49.5%) were diploma holders, 32% of them were undergraduates, 12.5% had only
school education and 6% were postgraduates. This profile represents the overall composition
of FLE’s of Star Hotels in Chennai city chosen for the study.
Measures
While designing the questionnaire, reference to relevant literature on the services industry was
made. FLE’s intention to stay in the organization was measured using the 5-item scale used by
Mrayyan (2008) scale to study the intention to stay of nurses. This was slightly modified to
suit the Hotel FLE scenario. Three dimensions using the 3-item and 9-item scales respectively
used by Back, Lee, and Abbott (2011) measured Job satisfaction and organizational
commitment in this study. Service Recovery Performance was measured by 5 items from
Boshoff and Allen (2000). Respondents were asked to respond using a 7-point Likert scale
ranging from 7 = strongly agree to 1 = strongly disagree and 7 = completely satisfied to 1 =
completely dissatisfied (Given in Appendix). Measuring SRP through self-reporting is
justified, because the individuals themselves (Bitner et al., 1994; Schneider & Bowen, 1995;
Tax, Brown, & Chandrashekaran, 1998) better do evaluating performance and perceptions of
the FLE’s interactions with customers.
Data Analysis
In the present study, the proposed structural model was tested using Partial least Square
Structural Equation Modelling (PLS-SEM). This technique is variance-based structural
equation modelling (Hair, Black, Babin, Anderson, & Tatham, 2006), capable of assessing the
reliability and validity of the constructs proposed in the theoretical model (outer model) and
the estimation of path coefficients between the theoretical relationships (inner model). PLS-
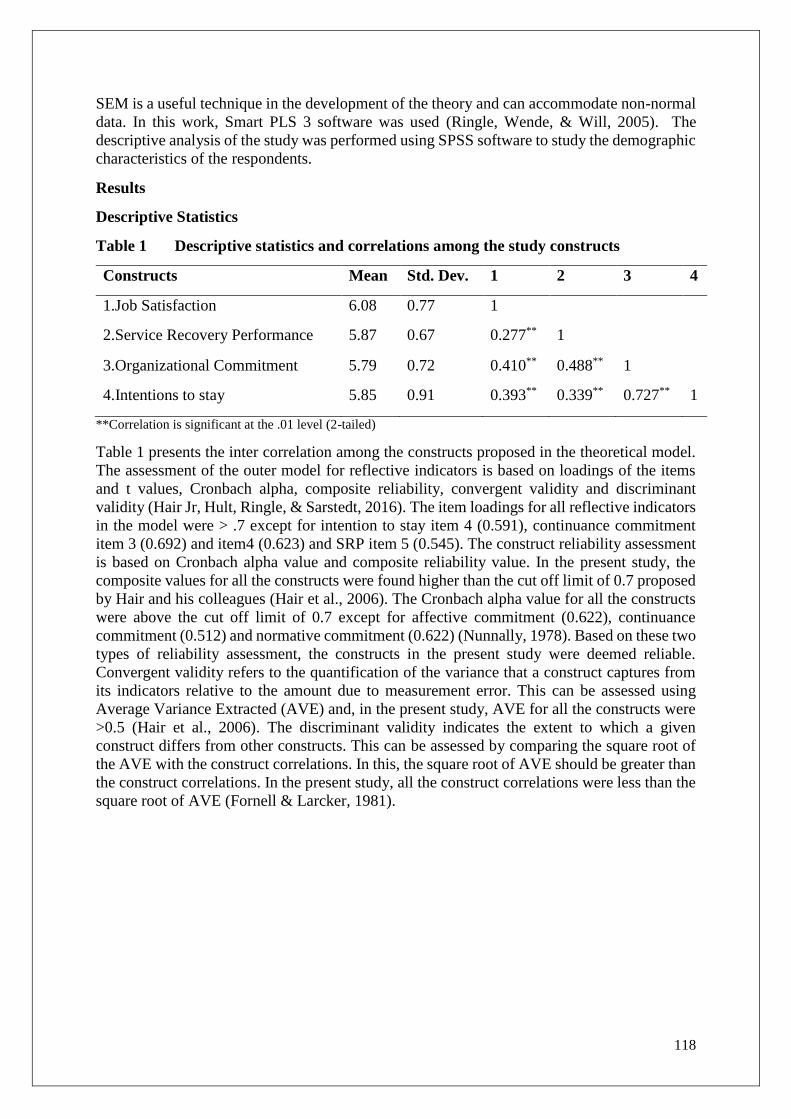
118
SEM is a useful technique in the development of the theory and can accommodate non-normal
data. In this work, Smart PLS 3 software was used (Ringle, Wende, & Will, 2005). The
descriptive analysis of the study was performed using SPSS software to study the demographic
characteristics of the respondents.
Results
Descriptive Statistics
Table 1 Descriptive statistics and correlations among the study constructs
Constructs Mean Std. Dev. 1 2 3 4
1.Job Satisfaction 6.08 0.77 1
2.Service Recovery Performance 5.87 0.67 0.277** 1
3.Organizational Commitment 5.79 0.72 0.410** 0.488** 1
4.Intentions to stay 5.85 0.91 0.393** 0.339** 0.727** 1
**Correlation is significant at the .01 level (2-tailed)
Table 1 presents the inter correlation among the constructs proposed in the theoretical model.
The assessment of the outer model for reflective indicators is based on loadings of the items
and t values, Cronbach alpha, composite reliability, convergent validity and discriminant
validity (Hair Jr, Hult, Ringle, & Sarstedt, 2016). The item loadings for all reflective indicators
in the model were > .7 except for intention to stay item 4 (0.591), continuance commitment
item 3 (0.692) and item4 (0.623) and SRP item 5 (0.545). The construct reliability assessment
is based on Cronbach alpha value and composite reliability value. In the present study, the
composite values for all the constructs were found higher than the cut off limit of 0.7 proposed
by Hair and his colleagues (Hair et al., 2006). The Cronbach alpha value for all the constructs
were above the cut off limit of 0.7 except for affective commitment (0.622), continuance
commitment (0.512) and normative commitment (0.622) (Nunnally, 1978). Based on these two
types of reliability assessment, the constructs in the present study were deemed reliable.
Convergent validity refers to the quantification of the variance that a construct captures from
its indicators relative to the amount due to measurement error. This can be assessed using
Average Variance Extracted (AVE) and, in the present study, AVE for all the constructs were
>0.5 (Hair et al., 2006). The discriminant validity indicates the extent to which a given
construct differs from other constructs. This can be assessed by comparing the square root of
the AVE with the construct correlations. In this, the square root of AVE should be greater than
the construct correlations. In the present study, all the construct correlations were less than the
square root of AVE (Fornell & Larcker, 1981).

119
Figure 1
Structural path estimates
In the proposed theoretical model, the relationship between job satisfaction and intention to
stay was significant and, therefore, H1 was supported. The relationships between job
satisfaction and SRP and organisational commitment were also significant. Similarly, the
relationships between SRP and organisation commitment and organisational commitment on
intention to stay were significant.
Job
Satisfaction
Intention to
stay
Job
Satisfaction
SRP
Intention
to stay
Org.
Commitment
β = 0.42**
r2= 0.18
r2= 0.27 r
2= 0.07
r2= 0.55
β = 0.32**
β = 0.27** β = -0.005ns β = 0.33**
β = 0.12*
β = 0.68**
Note: ** - p<0.001, * - p<0.05, ns - Non significant

120
The mediational hypothesis was tested on the basis of the analytical approach propounded by
Preacher and Hayes (2008) and Taylor, MacKinnon, and Tein (2007). Table 2 presents the
results of the three mediational hypothesis results. In H2 the researcher proposed that the
relationship between job satisfaction and intention to stay is mediated by SRP. For this
relationship, the percentile bootstrap confidence interval included zero between its lower bound
limit and upper bound limit. This hypothesis was not supported. In H3, the relationship between
job satisfaction and intention to stay was proposed to be mediated by organisational
commitment. For this hypothesis, the researcher found significant indirect effect because the
indirect effect confidence interval did not include zero between its lower bound limit and upper
bound limit. Finally, in H4, it was proposed that the relationship between job satisfaction and
intention to stay is serially mediated by SRP at stage 1 and organisational commitment at stage
2. The researcher found the indirect effect for this hypothesis as also being significant and the
confidence interval obtained did not include zero between its lower bound limit and upper
bound limit. Thus, H4 was supported and the influence of job satisfaction on the intention to
stay through SRP and organisational commitment was proven. The relationship between job
satisfaction and intention to stay was significant in the serial mediation model. So a partial
mediation was found to exist.
The R2 for the overall outcome variable was considerably high. 55% of the variance was
explained by job satisfaction, SRP and organisational commitment on intention to stay.
Similarly 27 % of the variance was explained by SRP and job satisfaction on organisational
commitment. Job satisfaction explained only 7 % of the variance in SRP. The predictive
relevance of the model was assessed by Q2 value. In the present study, Q2 value was greater
than zero for all the dependent variables. Thus, the present model had high predictive relevance.
Table 2
Serial Mediation Analysis Test Result
Indirect Paths Indirect effect LLCI ULCI Decision
JS->SRP->ITS -.001 -.036 .023 Not Supported
JS->Org.Com->ITS .225 .141 .327 Supported
JS->SRP->Org.Com->ITS .061 .029 .100
Supported Note: LLCI-Lower Limit Confidence Interval, ULCL-Upper Limit Confidence Limit. Indirect effects were tested
using the bootstrapping procedure with 5000 bootstrap samples. SRP-Service Recovery Performance, ITS-
Intention to Stay, Org. Com- Organizational Commitment, JS- Job Satisfaction, NC- Normative Commitment,
AC- Affective Commitment, CC-Continuance Commitment.
Discussion
The present study adds to the existing literature by testing a serial mediational model of SRP
and organizational commitment over the relationship of job satisfaction and intentions to stay.
The study investigated the critical antecedents for intention to stay, such as job satisfaction,
SRP and organizational commitment and perception of the FLEs in the hotel industry. Since
the interaction between the customer and the employee is high, this interaction would directly
affect the quality of service provided by the organization. One interesting result found in this
study was that all direct effects are significant except the relationship between SRP and
intentions to stay. This study also throws light on the old debate which has been in existence
for decades on the relationship among job satisfaction and service recovery performance. Some
researchers have believed that performance causes employee satisfaction while others have

121
believed the reverse – that employee satisfaction results in better performance s (MacKenzie,
Podsakoff, & Ahearne, 1998; Podsakoff & Williams, 1986). This study showed that both may
be true, considering the type of performance is used. The results present study is consistent
with the observations in several non-service oriented employees settings with a commercial
bent (Ashill et al., 2008; Babakus, Yavas, Karatepe, & Avci, 2003; Boshoff & Allen, 2000).
At the same time, SRP influences intention to stay when it is mediated by organizational
commitment. In terms of the impact of the job satisfaction over intention to stay, the results
suggested that the indirect effect of job satisfaction over intention to stay through SRP and
organizational commitment is much stronger (at least 3 times) than the direct effect.
Despite several studies that have found a significant influence for job satisfaction on
intention to stay, to the best of researcher’s knowledge, this is the first study that examines the
serial mediation of SRP and organizational commitment in the relationship between job
satisfaction and intention to stay. This study showed that job satisfaction has a higher
significant influence on the intention to stay. In order to enhance the FLEs intention to stay in
the organization and to induce higher levels of commitment and SRP, managers in Indian hotel
industry should focus on enabling job satisfaction. Managers should provide an environment
where FLEs can work with empowerment and freedom in order to increase job satisfaction. In
addition to this, managers must look at the extent of influence of their support, rewarding
strategies and training programs on job satisfaction of FLEs.
Managerial Implications
This study provides ideas for employee retention, which is one of the pressing problems in the
hotel Industry in India. Hotel Management should ensure that their front-line employees are
not only satisfied, but also interested in effective recovery of failed service delivery. This study
also finds that loyal front-line employees stay for longer periods with the organizations;
managers can thus retain talented employees by keeping them satisfied and can avoid service
failures to increase organizational efficiency.
Limitation and scope for future research
A limitation of the present research is that the study constructs were measured using self-repots.
Future studies can separate the measurement of independent and dependent constructs using
longitudinal research design. In the present study, partial mediation effect was found for the
serial mediation model proposed. Researchers can consider this as scope for identifying other
mediator variables between job satisfaction and SRP or between SRP and organisational
commitment or between organisational commitment and intention to stay. Future researchers
can also test the proposed model in other service sectorial organisations such as banking
industry and business processing units.
References
Alexandrov, A., Babakus, E., & Yavas, U. (2007). The effects of perceived management
concern for frontline employees and customers on turnover intentions moderating role of
employment status. Journal of service research, 9(4), 356-371.
Andrews, M. C., Witt, L. A., & Michele Kacmar, K. (2003). The interactive effects of
organizational politics and exchange ideology on manager ratings of retention. Journal of
vocational behavior, 62(2), 357-369. doi:http://dx.doi.org/10.1016/S0001-8791(02)00014-3
Ashill, N. J., Rod, M., & Carruthers, J. (2008). The effect of management commitment to
service quality on frontline employees' job attitudes, turnover intentions and service recovery

122
performance in a new public management context. Journal of Strategic Marketing, 16(5), 437-
462.
Babakus, E., Yavas, U., Karatepe, O. M., & Avci, T. (2003). The effect of management
commitment to service quality on employees' affective and performance outcomes. Journal
of the Academy of Marketing Science, 31(3), 272-286.
Back, K.-J., Lee, C.-K., & Abbott, J. (2011). Internal relationship marketing: Korean casino
employees’ job satisfaction and organizational commitment. Cornell Hospitality Quarterly,
52, 111-124.
Baron, R. M., & Kenny, D. A. (1986). The moderator–mediator variable distinction in social
psychological research: Conceptual, strategic, and statistical considerations. Journal of
personality and social psychology, 51(6), 1173.
Bendall-Lyon, D., & Powers, T. L. (2001). The role of complaint management in the service
recovery process. Joint Commission Journal on Quality and Patient Safety, 27(5), 278-286.
Bitner, M. J., Booms, B. H., & Mohr, L. A. (1994). Critical service encounters: the employee's
viewpoint. The Journal of Marketing, 95-106.
Boshoff, C., & Allen, J. (2000). The influence of selected antecedents on frontline staff's
perceptions of service recovery performance. International Journal of Service Industry
Management, 11(1), 63-90.
De Ruyter, K., & Wetzels, M. (2000). Customer equity considerations in service recovery: a
cross-industry perspective. International Journal of Service Industry Management, 11(1), 91-
108.
Fornell, C., & Larcker, D. F. (1981). Evaluating structural equation models with unobservable
variables and measurement error. Journal of Marketing Research, 39-50.
Frank, F. D., Finnegan, R. P., & Taylor, C. R. (2004). The race for talent: Retaining and
engaging workers in the 21st century. People and Strategy, 27(3), 12.
Hair, J. F., Black, W. C., Babin, B. J., Anderson, R. E., & Tatham, R. L. (2006). Multivariate
data analysis (Vol. 6): Upper Saddle River, NJ: Pearson Prentice Hall.
Hair Jr, J. F., Hult, G. T. M., Ringle, C., & Sarstedt, M. (2016). A primer on partial least
squares structural equation modeling (PLS-SEM): Sage Publications.
Hayes, A. F. (2013). Introduction to mediation, moderation, and conditional process analysis:
A regression-based approach. New York: Guilford Press.
Hee Yoon, M., Beatty, S. E., & Suh, J. (2001). The effect of work climate on critical employee
and customer outcomes: An employee-level analysis. International Journal of Service
Industry Management, 12(5), 500-521.
Hendrie, J. (2004). A review of a multiple retailer's labour turnover. International Journal of
Retail & Distribution Management, 32(9), 434-441.
Hobfoll, S. E. (1989). Conservation of resources: A new attempt at conceptualizing stress.
American Psychologist, 44(3), 513-524. doi:10.1037/0003-066X.44.3.513
Karatepe, O. M. (2006). The effects of selected antecedents on the service recovery
performance of frontline employees. The Service Industries Journal, 26(1), 39-57.
doi:10.1080/02642060500358795

123
Lorenzoni, N., & Lewis, B. R. (2004). Service recovery in the airline industry: a cross-cultural
comparison of the attitudes and behaviours of British and Italian front-line personnel.
Managing Service Quality, 14(1), 11-25.
MacKenzie, S. B., Podsakoff, P. M., & Ahearne, M. (1998). Some possible antecedents and
consequences of in-role and extra-role salesperson performance. The Journal of Marketing,
87-98.
MacKinnon, D., Cumbers, A., & Chapman, K. (2002). Learning, innovation and regional
development: a critical appraisal of recent debates. Progress in human geography, 26(3), 293-
311.
MacKinnon, D. P., Lockwood, C. M., & Williams, J. (2004). Confidence limits for the indirect
effect: Distribution of the product and resampling methods. Multivariate behavioral research,
39(1), 99-128.
Maden, C. (2014). Impact of fit, involvement, and tenure on job satisfaction and turnover
intention. The Service Industries Journal, 34(14), 1113-1133.
Magnini, V. P., Ford, J. B., Markowski, E. P., & Honeycutt Jr, E. D. (2007). The service
recovery paradox: justifiable theory or smoldering myth? Journal of Services Marketing,
21(3), 213-225.
Mrayyan, M. T. (2008). Hospital organizational climates and nurses’ intent to stay: differences
between units and wards. Contemporary nurse, 27(2), 223-236.
Nunnally, J. C. (1978). Psychometric theory: McGraw-Hill.
Pattusamy, M., & Jacob, J. (2016). The Mediating Role of Family-to-Work Conflict and
Work-Family Balance in the Relationship between Family Support and Family Satisfaction:
A Three Path Mediation Approach. Current Psychology, 1-11. doi:10.1007/s12144-016-9470-
y
Podsakoff, P. M., & Williams, L. J. (1986). The relationship between job performance and
job satisfaction. Generalizing from laboratory to field settings, 207, 253.
Preacher, K. J., & Hayes, A. F. (2008). Asymptotic and resampling strategies for assessing
and comparing indirect effects in multiple mediator models. Behavior research methods,
40(3), 879-891.
Ringle, C. M., Wende, S., & Will, A. (2005). SmartPLS 2.0 (beta): Hamburg, Germany.
Rod, M., Ashill, N. J., & Carruthers, J. (2008). The relationship between job demand stressors,
service recovery performance and job outcomes in a state-owned enterprise. Journal of
Retailing and Consumer Services, 15(1), 22-31.
Schneider, B., & Bowen, D. E. (1995). Winning the Service Game: Harvard Business School
Press.
Tax, S. S., Brown, S. W., & Chandrashekaran, M. (1998). Customer evaluations of service
complaint experiences: implications for relationship marketing. The Journal of Marketing, 60-
76.
Taylor, A. B., MacKinnon, D. P., & Tein, J.-Y. (2007). Tests of the three-path mediated effect.
Organizational Research Methods.
Van Jaarsveld, D. D., Walker, D. D., & Skarlicki, D. P. (2010). The role of job demands and
emotional exhaustion in the relationship between customer and employee incivility. Journal
of management.

124
White, L., & Yanamandram, V. (2007). A model of customer retention of dissatisfied business
services customers. Managing Service Quality: An International Journal, 17(3), 298-316.
Witt, L. A., & Wilson, J. W. (1990). Income Sufficiency as a Predictor of Job Satisfaction and
Organizational Commitment: Dispositional Differences. The Journal of Social Psychology,
130(2), 267-268. doi:10.1080/00224545.1990.9924578
Yavas, U., Karatepe, O. M., Avci, T., & Tekinkus, M. (2003). Antecedents and outcomes of
service recovery performance: an empirical study of frontline employees in Turkish banks.
International Journal of Bank Marketing, 21(5), 255-265.
The Role of Customer and Frontline Employee Interaction in Service Value Co-Creation
Brijesh Kumar Awasthi & Navneet Bhatnagar
ISB Hyderabad
Value co-creation is the process in which the consumer plays an active role along with a
marketer to create value in a product/ service offering (Ranjan and Read, 2016; Ramaswamy
and Ozcan, 2016; Kohler et al., 2011). This co-creation of value may occur through the entire
process value chain or at specific points in the value chain (Prahalad and Ramaswamy, 2004).
In the service context, value co-creation is even more significant because: (1) it involves
intangible resources, (2) is subject to nuances in the process, and (3) is dependent on dynamic
relationships between the firm and its stakeholders (Vargo and Lusch, 2004). Though service
value co-creation has attracted significant scholarly attention (Prahalad and Ramaswamy,
2000; Merrilees et al., 2017), the finer nuances at the interface of customers and frontline
employees have not yet been adequately examined. This paper is an attempt to fill that
significant gap in service and value co-creation literature. More specifically, we attempt to
examine how distinct sets of behaviours exhibited by customers and frontline employees
influence service design configurations. Further, we probe whether there are specific,
customer-employee behavioural combinations that lead to the development of distinct service
design configurations in the value co-creation process.
Customer and Frontline Employee Interaction
Customer is an essential entity in service value co-creation (Lusch et al., 2007), while going
by the service dominant logic, staff-led value co-creation is its counterpart (Merrilees, 2017).
Extant literature suggests that customers exhibit two distinct sets of behaviours in value co-

125
creation process, i.e., customer participation (in-role) behaviour and customer citizenship
(extra-role) behaviour (Bove et al., 2008; Groth, 2005). Customer participation behaviour
(like, interaction with the provider) is essential or key requirement for value co-creation,
whereas citizenship behaviour (like, brand advocacy) is voluntary (Yi, Nataraajan and Gong,
2011).
In their interactions with customers during service design and delivery, frontline service
employees also exhibit participation and citizenship behaviours. Their participation behaviours
(like, proactively working towards and helping the client arrive at solutions and exploring new
ways to enhance service design and delivery) are essential for value co-creation (Snape and
Redman, 2010). While citizenship behaviours (like, extending voluntary help to the clients and
firm’s advocacy to outsiders) are voluntary in nature, which are only likely to be exhibited by
employees with high levels of commitment towards the service firm (Boreman and Motowidlo,
1993; Podsakoff et al., 2000).
Customer and frontline employee participation behaviour has four dimensions namely,
information seeking, information sharing, responsible behaviour and personal interaction
(Bove et al., 2008). Similarly, citizenship behaviour of both exhibit four dimensions as
feedback, advocacy, helping and tolerance (Borman and Motowidlo, 1993; Merrilees et al.,
2017). Though the antecedents and consequences of ‘in-role’ and ‘extra-role’ behaviours of
customer and frontline employees have been probed (Merrilees et al., 2017; Yi et al., 2011;
Groth, 2005), their consequences on service design configuration outcomes have not yet been
adequately examined., which makes this study a worthy research pursuit.
Methodology
This study employs triangulation technique (Scandura et al., 2000; Johnston et al., 1999; Jick
& T.D., 1979) to arrive at the findings. The triangulation technique is advocated in service
research (Zeithaml et al., 1993; Ordanini et al., 2011; Bhatnagar and Gopalaswamy, 2017) as
it helps the researcher overcome limitations of any single research method. Hence, first we
explored value co-creation literature and observed key gaps in the service context. Then, we
identified three service industries (i.e., education, information technology and consulting) to
collect primary research data. For this, we conducted in-depth interviews with three customers
and three frontline employees of one company in each of these three industries. Thus, in all 18
interviews were conducted. The objective was to understand the service design, development
and delivery processes. More specifically, we probed them on the nature of interactions
between the customers and the firm that led to value co-creation. Observations from the
literature formed the basis of the interview questionnaire. Specifically, the interviewees were
probed on the nuances of the value co-creation process and the ‘in-role’ and ‘extra-role’
behaviours exhibited by them and their counterparts. The in-depth interview method was
adopted because it is considered a sound business research method to develop deep
understanding of a phenomenon (Saunders et al., 2011) and is widely used in service research
(Reinartz et al., 2004; Holloway and Beatty, 2003; Parasuraman et al., 1985).
Insights gained from the exploration of literature and in-depth interviews were supplemented
with three case studies (i.e., one service firm in each of these three service industries). Case
study method is frequently used and widely accepted in business and service research (Yin,
2013; Eisenhardt, 1989). More specifically, the focus of the case studies was to examine the
customer and frontline employee value co-creation behaviours exhibited in the development of
10 service offerings that resulted from value co-creation processes. These behaviours were

126
mapped to the respective service design configurations to identify whether there were any
meaningful patterns or clusters.
Findings and Discussion
Customers and frontline employees were found to make varying contributions to the service
value co-creation process. This was dependent on different combinations of their participation
and citizenship behaviours, respectively. Based on their value co-creation behaviours a two
dimensional matrix was developed (as shown in Figure 1 in the Appendix) to depict variations
in resulting service configurations.
Service Configurations and their Characteristics
The mapping of value co-creation behaviours exhibited by the customers and frontline
employees for the 10 service offerings examined, resulted into four distinct service
configurations. These service configurations were identified and labelled as following:
i. Type 1- Co-Production: When both the customer and frontline employee engage only in
participation behaviour, the scope of co-creation activities remains limited. Their
communication and interaction is limited to the essential requirements for basic service
design and delivery, hence we term it ‘Co-Production.’ This service configuration is low
in terms of the degree of customization and value co-creation.
ii. Type 2- Collaboration: These are service value co-creation instances where the customer
only engages in participation behaviour while frontline employee exhibits both,
participation and citizenship behaviour. The frontline employee goes an extra-mile to
seek and provide feedback, advocates the service features, helps customers and exhibits
tolerance at customer’s formal behaviour. We term this configuration as ‘Collaboration.’
The value co-creation that occurs in this case is higher than that created in Type 1
configuration.
iii. Type 3- Co-Designing: These are service value co-creation instances where the frontline
employee only engages in participation behaviour while the customer exhibits both,
participation and citizenship behaviour. The customer deeply influences the service
design and development by providing feedback. S/he actively promotes the service by
advocating its features and helping other buyers. We term this configuration as ‘Co-
Designing.’ On account of deeper engagement of the customer, the value co-creation that
occurs in this case is higher than that created in Type 1 and Type 2 configurations.
iv. Type 4- Immersed Composition: When both customers and frontline employees exhibit
both ‘in-role’ and ‘extra-role’ behaviours, the degree of service customization and value
co-creation is at its highest. We term this as ‘Immersed Composition’ due to the deep
involvement of both the customer and the employee in the value co-creation process.
Both of them help improve the quality of this service configuration by providing their
recursive feedback and advocate it to others.
Table-1 in the Appendix lists the ten service configurations that were studied in this research
and their respective service configuration categories based on behavioural interactions among
customers and frontline employees as they engaged in the value co-creation process.
Implications
Theoretical Implications

127
The study has significant theoretical implications. We establish that service value co-creation
is a complex phenomenon resulting from customer and frontline employee interactions. These
interactions vary depending on the behaviours exhibited by both parties. We specifically add
to the value co-creation literature by explaining the customer-frontline employee interface
based on two distinct sets of behaviours (i.e, participation and citizenship behaviours) resulting
into four types of service configurations with varying levels of co-created value and distinct
characteristics.
Practical Implications
The study also has important implications for service providers. They need to realize that value
co-creation is not a monolithic concept but a complex whole that is shaped by the dynamic
interaction involving participation and citizenship behaviours of the customer and the frontline
employee. Hence, service providers need to motivate customers on one hand and inspire and
empower employees on the other hand to facilitate and enrich the service value co-creation
process.
Limitations and Future Research
The study had limitations of geographical and industrial contexts in which it was conducted.
Future research can assess whether the findings can be generalized across geographies and
other service sectors. Future research can quantitatively validate the framework. Micro factors
of role of customer and frontline employees’ participation and citizenship behaviours in service
value co-creation still have scope to be explored further.
Conclusion
The study probes service value co-creation process from behavioural lens. It extends service
literature by establishing that distinct combinations of customer and frontline-employee
behaviours determine the level of value co-created and results into four different kinds of
service configurations. Hence, this study opens new vistas for knowledge and practice

128
APPENDIX
In-Role
(Participation
Behaviour)
Frontline
Employee
Extra-Role
(Citizenship
Behaviour)
Customer
In-Role Extra-Role
(Participation Behaviour) (Citizenship Behaviour)
1
2
3
4
Figure 1. Four Service Configurations with Different Combinations of
Customer and Frontline Employees’ Value Co-creation Behaviours
Source: Conceptualized by case authors, based on the data analysis.
Note: Size of the shapes does NOT represent magnitude.

129
Table 1. Distinct Service Configurations based on Customer and Frontline Employees’
Value Co-creation Behaviours
S.
No.
Industry Company/Institution
Area
Service Offering Service
Configuration
Type#
1 Education
Management Education
MBA Programme 3
2 Executive Education
Programme
4
3 Placement Services 2
4 Information
Technology
Software Development
Prototype Software 2
5 Retail Software 1
6 Customized Software 3
7 Networking Internet Services 1
8 Consulting
Business Consulting
Expert Solution 4
9 Software solution 3
10 Customer Care 2 Source: Collated by authors
Note: # Specific ‘in-role’ and ‘extra-role’ behaviours exhibited by customers and frontline employees
in value co-creation process were mapped for each service offering included in this study and based on
that, the service configuration type was determined. Those detailed maps are not included here due to
paucity of space.
REFERENCES
Bhatnagar, N., Gopalaswamy, A. K., (2017). The role of a firm’s innovation competence on
customer adoption of service innovation. Management Research Review, 40(4), 378-
409.
Borman, W. C., & Motowidlo, S. M. (1993). Expanding the criterion domain to include
elements of contextual performance. Personnel Selection in Organizations; San
Francisco: Jossey-Bass, 71.
Bove, L. L., Pervan, S. J., Beatty, S. E., & Shiu, E. (2009). Service worker role in encouraging
customer organizational citizenship behaviors. Journal of Business Research, 62(7),
698-705.
Eisenhardt, K. M. (1989). Building theories from case study research. Academy of Management
Review, 14(4), 532-550.
Groth, M. (2005). Customers as good soldiers: Examining citizenship behaviors in internet
service deliveries. Journal of Management, 31(1), 7-27.
Holloway, B. B., & Beatty, S. E. (2003). Service failure in online retailing: A recovery
opportunity. Journal of Service Research, 6(1), 92-105.
Jick, T. D. (1979). Mixing qualitative and quantitative methods: Triangulation in
action. Administrative Science Quarterly, 24(4), 602-611.
Johnston, W. J., Leach, M. P., & Liu, A. H. (1999). Theory testing using case studies in
business-to-business research. Industrial Marketing Management, 28(3), 201-213.

130
Kohler, T., Fueller, J., Matzler, K., Stieger, D., & Füller, J. (2011). Co-creation in virtual
worlds: The design of the user experience. MIS Quarterly, 773-788.
Lusch, R. F., Vargo, S. L., & O’Brien, M. (2007). Competing through service: Insights from
service-dominant logic. Journal of Retailing, 83(1), 5-18.
McColl-Kennedy, J. R., Vargo, S. L., Dagger, T. S., Sweeney, J. C., & Kasteren, Y. V. (2012).
Health care customer value cocreation practice styles. Journal of Service
Research, 15(4), 370-389.
Merrilees, B., Merrilees, B., Miller, D., Miller, D., Yakimova, R., & Yakimova, R. (2017). The
role of staff engagement in facilitating staff-led value co-creation. Journal of Service
Management, 28(2), 250-264.
Ordanini, A., Miceli, L., Pizzetti, M., & Parasuraman, A. (2011). Crowd funding: transforming
customers into investors through innovative service platforms. Journal of Service
Management, 22(4), 443-470.
Parasuraman, A., Zeithaml, V. A., & Berry, L. L. (1985). A conceptual model of service quality
and its implications for future research. The Journal of Marketing, 41-50.
Podsakoff, P. M., MacKenzie, S. B., Paine, J. B., & Bachrach, D. G. (2000). Organizational
citizenship behaviors: A critical review of the theoretical and empirical literature and
suggestions for future research. Journal of Management, 26(3), 513-563.
Prahalad, C. K., & Ramaswamy, V. (2000). Co-opting customer competence. Harvard
Business Review, 78(1), 79-90.
Prahalad, C. K., & Ramaswamy, V. (2004). Co-creating unique value with customers. Strategy
& Leadership, 32(3), 4-9.
Ramaswamy, V., & Ozcan, K. (2016). Brand value co-creation in a digitalized world: An
integrative framework and research implications. International Journal of Research in
Marketing, 33(1), 93-106.
Ranjan, K. R., & Read, S. (2016). Value co-creation: concept and measurement. Journal of the
Academy of Marketing Science, 44(3), 290-315.
Reinartz, W., Krafft, M., & Hoyer, W. D. (2004). The customer relationship management
process: Its measurement and impact on performance. Journal of Marketing
Research, 41(3), 293-305.
Scandura, T. A., & Williams, E. A. (2000). Research methodology in management: Current
practices, trends, and implications for future research. Academy of Management
Journal, 43(6), 1248-1264.
Snape, E., & Redman, T. (2010). HRM practices, organizational citizenship behaviour, and
performance: A multi‐level analysis. Journal of Management Studies, 47(7), 1219-1247.
Vargo, S. L. (2009). Toward a transcending conceptualization of relationship: a service-
dominant logic perspective. Journal of Business & Industrial Marketing, 24(5/6), 373-
379.
Vargo, S. L., & Lusch, R. F. (2004). Evolving to a new dominant logic for marketing. Journal
of Marketing, 68(1), 1-17.
Yi, Y., & Gong, T. (2013). Customer value co-creation behavior: Scale development and
validation. Journal of Business Research, 66(9), 1279-1284.

131
Yi, Y., Nataraajan, R., & Gong, T. (2011). Customer participation and citizenship behavioral
influences on employee performance, satisfaction, commitment, and turnover
intention. Journal of Business Research, 64(1), 87-95.
Yin, R. K. (2013). Case Study Research: Design and Methods. Sage Publications.
Zeithaml, V. A., Berry, L. L., & Parasuraman, A. (1993). The nature and determinants of
customer expectations of service. Journal of the Academy of Marketing Science, 21(1),
1-12.
The Role of Authenticity in Marketing Kerala Village Tourism
Jyotsna J H & Upendra Kumar Maurya
Indian Institute of Technology, Madras
Introduction
Derived from the Greek word Authentikos which means genuine, authenticity refers to
something that is real, genuine, pristine and veritable (Kolar and Zabkar, 2007). Brown et al.
(2003) considered authenticity as the crux of modern marketing. “Quality no longer
differentiates; authenticity does” (Gilmore and Pine, 2007, p. 23), signifying the potential that
is attributed to authentic brands. According to Bridger and Lewis (2000), there is a shift in

132
interest 'from abundance to authenticity' in contemporary consumption due to fake products
and imitations.
The quest for authenticity is a robust study in tourism as it is one of the factors that motivates
tourist to travel to distant places and times (Ritchie & Crouch, 2003). “Tourism destination
competitiveness is mainly bound up with the real or imagined specificities of place, it is
expected that the notion of authenticity has been taken up and refined within this field” (Bryce,
Curran, O'Gorman, & Taheri, 2015, p.3). It is worth noting that there has been a lack of
agreement among the experts on the concept of authenticity. In tourism, authenticity can be
differentiated broadly into two perspectives: the authenticity of the toured object and the
experience of the tourist himself. Authenticity of the toured object can be further looked from
two different approaches, namely objectivist approach and constructivist approach (Wang,
1999). Objective authenticity assumed a ‘museum-linked’ way of perception that there is
something inherently ‘authentic’, based on ‘original’ objects, such as an ‘authentic Roman
coin’. Constructivist philosophers claimed that authenticity is constructed by a society based
on certain view points, beliefs, power or interpretations. Therefore, what consumers or tourists
do is to project their expectations, and preferences to the objects in the destination and believe
them to be authentic when they meet their expectations. Authenticity of the toured object (both
objective and constructive authenticity), as object-related notions, can only explain a limited
range of tourist experiences. Whereas, existential authenticity, as activity-related situation, is
germane to the explanation of a greater variety of tourist experiences (Wang, 1999).
Though there has been increased interest among the scholars to study the concept of
authenticity in general and tourism in specific, there has been a dearth of studies exploring the
two perspectives (authenticity of the toured object and the experience of the tourist himself)
simultaneously. There have been calls for further research to discover empirically how object
based (objective, constructive or symbolic), and existential authenticities are distributed among
tourists and why certain tourists prefer one kind of authenticity to others (Wang, 1999).
Moreover, despite “authenticity’s long-standing, persistent, and contemporary marketplace
appeal” (Grayson and Martinec, 2004, p. 296), destination management organizations neither
have any indication of the influencing factors that might be used to promote brand authenticity
(Fritz, Schoenmueller, Bruhn, 2017) nor do they know much about how brand authenticity
affects consumer behavior and, in particular, the relational bonds between consumers and their
destination brands (e.g. the relationship of authenticity with customer satisfaction, loyalty and
attachment).
In this backdrop, the present study attempts to bridge the above gap by examining the
relationship of brand authenticity with its antecedent (destination image) and outcomes (Tourist
satisfaction, Place attachment and Destination loyalty) in Village Tourism setting in Kerala.
Under the existing scheme of destination development, Ministry of Tourism, Government of
India is giving emphasis in the development of tourism in potential rural villages. The culture,
tradition, architecture, lifestyle, entertainment, handicrafts and gastronomy of these areas can
attract visitors as they are the elements of an authentic village life. Village tourism allows a
tourist to experience the real life where the village is not artificially invented for exhibition and
residents have traditional life styles. The studies of Steiner & Reisinger (2006) identified that
while engaging in different activities at a destination, the visitor gets closer to the authentic self
by facing and overcoming experiential challenges.
In tourism, the elements of village life help to form a set of beliefs, ideas and impressions in
visitors’ mind about that particular destination which is referred to as the image of the
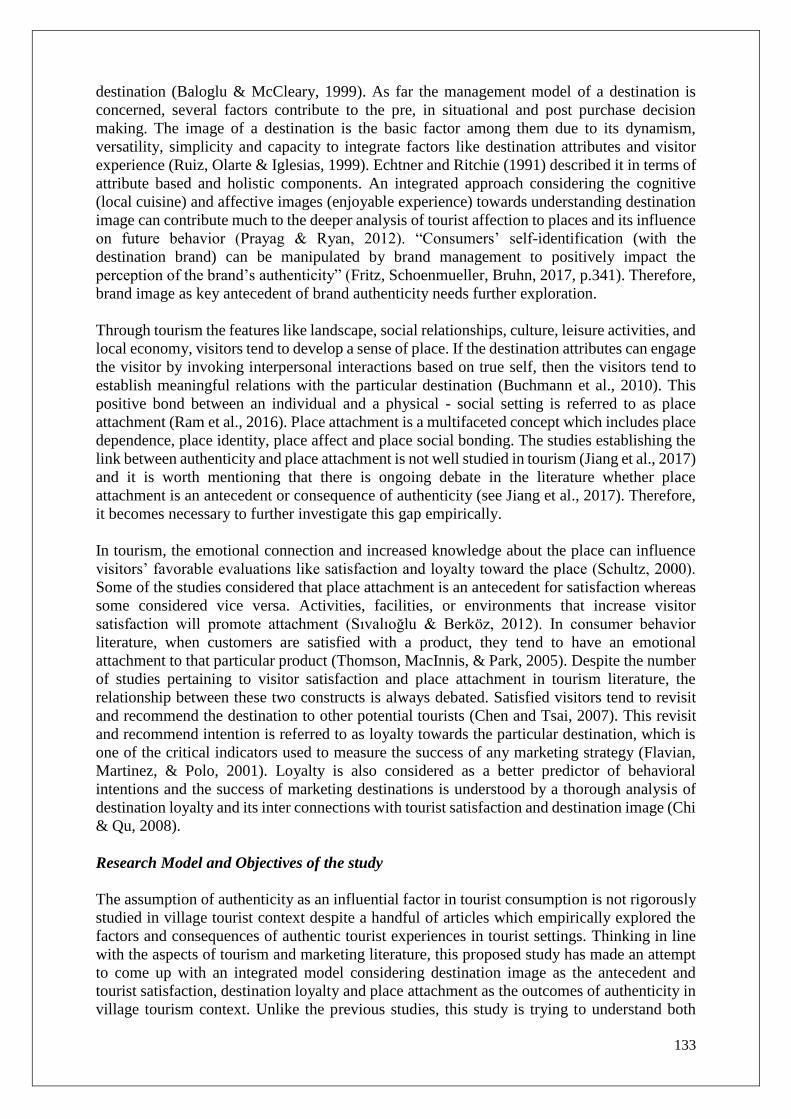
133
destination (Baloglu & McCleary, 1999). As far the management model of a destination is
concerned, several factors contribute to the pre, in situational and post purchase decision
making. The image of a destination is the basic factor among them due to its dynamism,
versatility, simplicity and capacity to integrate factors like destination attributes and visitor
experience (Ruiz, Olarte & Iglesias, 1999). Echtner and Ritchie (1991) described it in terms of
attribute based and holistic components. An integrated approach considering the cognitive
(local cuisine) and affective images (enjoyable experience) towards understanding destination
image can contribute much to the deeper analysis of tourist affection to places and its influence
on future behavior (Prayag & Ryan, 2012). “Consumers’ self-identification (with the
destination brand) can be manipulated by brand management to positively impact the
perception of the brand’s authenticity” (Fritz, Schoenmueller, Bruhn, 2017, p.341). Therefore,
brand image as key antecedent of brand authenticity needs further exploration.
Through tourism the features like landscape, social relationships, culture, leisure activities, and
local economy, visitors tend to develop a sense of place. If the destination attributes can engage
the visitor by invoking interpersonal interactions based on true self, then the visitors tend to
establish meaningful relations with the particular destination (Buchmann et al., 2010). This
positive bond between an individual and a physical - social setting is referred to as place
attachment (Ram et al., 2016). Place attachment is a multifaceted concept which includes place
dependence, place identity, place affect and place social bonding. The studies establishing the
link between authenticity and place attachment is not well studied in tourism (Jiang et al., 2017)
and it is worth mentioning that there is ongoing debate in the literature whether place
attachment is an antecedent or consequence of authenticity (see Jiang et al., 2017). Therefore,
it becomes necessary to further investigate this gap empirically.
In tourism, the emotional connection and increased knowledge about the place can influence
visitors’ favorable evaluations like satisfaction and loyalty toward the place (Schultz, 2000).
Some of the studies considered that place attachment is an antecedent for satisfaction whereas
some considered vice versa. Activities, facilities, or environments that increase visitor
satisfaction will promote attachment (Sıvalıoğlu & Berköz, 2012). In consumer behavior
literature, when customers are satisfied with a product, they tend to have an emotional
attachment to that particular product (Thomson, MacInnis, & Park, 2005). Despite the number
of studies pertaining to visitor satisfaction and place attachment in tourism literature, the
relationship between these two constructs is always debated. Satisfied visitors tend to revisit
and recommend the destination to other potential tourists (Chen and Tsai, 2007). This revisit
and recommend intention is referred to as loyalty towards the particular destination, which is
one of the critical indicators used to measure the success of any marketing strategy (Flavian,
Martinez, & Polo, 2001). Loyalty is also considered as a better predictor of behavioral
intentions and the success of marketing destinations is understood by a thorough analysis of
destination loyalty and its inter connections with tourist satisfaction and destination image (Chi
& Qu, 2008).
Research Model and Objectives of the study
The assumption of authenticity as an influential factor in tourist consumption is not rigorously
studied in village tourist context despite a handful of articles which empirically explored the
factors and consequences of authentic tourist experiences in tourist settings. Thinking in line
with the aspects of tourism and marketing literature, this proposed study has made an attempt
to come up with an integrated model considering destination image as the antecedent and
tourist satisfaction, destination loyalty and place attachment as the outcomes of authenticity in
village tourism context. Unlike the previous studies, this study is trying to understand both
134
aspects of authenticity (object based and existential) explicitly in village tourism context. From
the above mentioned aspects, the proposed study would be addressing the following gaps.
1. Highlighting the role of authenticity in the context of village tourism
2. Highlighting the effect of authenticity on its antecedent (destination image) and outcomes
(Tourist satisfaction, Place Attachment and Destination loyalty).
3. The coexistence of object based authenticity and existential authenticity in the context of
village tourism.
4. Proposing and empirically validating the relationship between antecedent (destination image)
and outcomes (Tourist satisfaction, Place Attachment and Destination loyalty) of authenticity.
5. Examining the mediating role of authenticity (object based authenticity and existential
authenticity) in the following relationships
a) Destination image and tourist satisfaction
b) Destination image and destination loyalty
c) Destination image and place attachment
(Please refer Annexure A for Hypothesized statements)
Fig 1 The proposed model
Research Methodology
The first phase of study is qualitative in nature wherein researchers are trying to understand the
relevance of proposed model and constructs meaning in Indian context. Followed by the
qualitative phase a structured questionnaire would be developed and validated through pilot
study and data would be collected with the help of final questionnaire. Five major village
tourism destinations namely Kumarakom, Thekkaday, Kovalam, Wayanad and Bekel would
be chosen as the sampling frame. Since the constructs like destination image, existential
authenticity, object authenticity lack well developed scales, study will also develop and
validate the suitable measures. Established items from previous papers would be adopted for
measuring place attachment, loyalty and satisfaction.
Findings and Discussion
The research model theoretically brings out the importance of brand authenticity in village
tourism. It would be interesting to empirically establish the model.
135
Implications of the Study
The research has implication that brand authenticity is a critical construct in village tourism
which directly and indirectly affects place attachment, loyalty and customer satisfaction. Also
destination brand image helps in managing destination brand authenticity. Considering the
village tour destination as the product, destination marketing managers or the concerned DMOs
have a superior role in enhancing the experience of the visitors leading to their satisfaction,
attachment to the particular place and there by fostering revisit and positive word of mouth. In
village tourism settings, a visitor gets closer to the authentic self by taking the village life
activities. Hence destination managers must give a boost to such activities without giving stains
of commoditization. Managers should leverage on this genuine experiences of customers in
their communication strategy as well.
References
Baloglu, S., & McCleary, K. W. (1999). A model of destination image formation. Annals of
tourism research, 26(4), 868-897.
Brown, S., Kozinets, R. V., & Sherry Jr, J. F. (2003). Teaching old brands new tricks: Retro
branding and the revival of brand meaning. Journal of Marketing, 67(3), 19-33.
Bryce, D., Curran, R., O'Gorman, K., & Taheri, B. (2015). Visitors' engagement and
authenticity: Japanese heritage consumption. Tourism Management, 46, 571-581.
Buchmann, A., Moore, K., & Fisher, D. (2010). Experiencing film tourism: Authenticity &
fellowship. Annals of Tourism Research, 37(1), 229-248.
Chen, C. F., & Tsai, D. (2007). How destination image and evaluative factors affect behavioral
intentions? Tourism management, 28(4), 1115-1122.
Chi, C. G. Q., & Qu, H. (2008). Examining the structural relationships of destination image,
tourist satisfaction and destination loyalty: An integrated approach. Tourism
management, 29(4), 624-636.
Echtner, C. M., & Ritchie, J. B. (1991). The meaning and measurement of destination
image. Journal of tourism studies, 2(2), 2-12.
Flavian, C., Martı́nez, E., & Polo, Y. (2001). Loyalty to grocery stores in the Spanish market
of the 1990s. Journal of Retailing and Consumer Services, 8(2), 85-93.
Fritz, K., Schoenmueller, V., and Bruhn, M. (2017). Authenticity in branding–exploring
antecedents and consequences of brand authenticity. European Journal of
Marketing, 51(2), 324-348.
Grayson, K., & Martinec, R. (2004). Consumer perceptions of iconicity and indexicality and
their influence on assessments of authentic market offerings. Journal of consumer
research, 31(2), 296-312.

136
Jiang, Y., Ramkissoon, H., Mavondo, F. T., & Feng, S. (2017). Authenticity: The link between
destination image and place attachment. Journal of Hospitality Marketing &
Management, 26(2), 105-124.
Kolar, T., & Zabkar, V. (2007). The meaning of Tourists’ authentic experiences for the
marketing of Cultural Heritage sites. Economic and Business Review for Central and
South-Eastern Europe, 9(3), 235.
Lewis, D., & Bridger, D. (2000). Authenticity; the Soul of the New Consumer.
MacCannell, D. (1973). Staged authenticity: Arrangements of social space in tourist
settings. American journal of Sociology, 79(3), 589-603.
Prayag, G., & Ryan, C. (2012). Antecedents of tourists’ loyalty to Mauritius: The role and
influence of destination image, place attachment, personal involvement, and
satisfaction. Journal of Travel Research, 51(3), 342-356.
Ram, Y., Björk, P., & Weidenfeld, A. (2016). Authenticity and place attachment of major
visitor attractions. Tourism Management, 52, 110-122.
Reisinger, Y., & Steiner, C. J. (2006). Reconceptualizing object authenticity. Annals of tourism
research, 33(1), 65-86.
Ritchie, J. B., & Crouch, G. I. (2003). The competitive destination: A sustainable tourism
perspective.
Ruiz, A. V., Olarte, R., & Iglesias, V. (1999). Evaluación de los destinos turísticos en función
de su valor de marca. Actas del XI Encuentro de Profesores Universitarios de
Marketing, 427-450.
Rural Tourism. (2015, May 26). Retrieved July 10, 2017, from http://tourism.gov.in/rural-
tourism
Schultz, D. E. (2000). Understanding and measuring brand equity. Marketing
Management, 9(1), 8.
Sıvalıoğlu, P., & Berköz, L. (2012). Perceptual evaluation of the national park users. Procedia-
Social and Behavioral Sciences, 50, 928-940.
Thomson, M., MacInnis, D. J., & Park, C. W. (2005). The ties that bind: Measuring the strength
of consumers’ emotional attachments to brands. Journal of consumer
psychology, 15(1), 77-91.
Wang, N. (1999). Rethinking authenticity in tourism experience. Annals of tourism
research, 26(2), 349-370.
Annexure A
H1: Object based authenticity positively influence existential authenticity
H2: Destination Image positively influence existential authenticity
H3: Destination Image positively influence object based authenticity
H4: Destination image positively influence place attachment

137
H5: Existential authenticity positively influence place attachment
H6: Objective authenticity positively influence place attachment
H7: Existential authenticity positively influence visitor satisfaction
H8: Objective authenticity positively influence visitor satisfaction
H9: Tourist satisfaction positively influence place attachment
H10: Destination image positively influence tourist satisfaction
H11: Destination image positively influence destination loyalty
H12: Existential authenticity positively influence destination loyalty
H13: Objective authenticity positively influence destination loyalty
H14: Tourist satisfaction positively influence destination loyalty
H15: Place attachment positively influence destination loyalty
H16: Existential authenticity mediates the relationship between destination image and place
attachment
H17: Object based authenticity mediates the relationship between destination image and place
attachment
H18: Existential authenticity mediates the relationship between destination image and visitor
satisfaction
H19: Object based authenticity mediates the relationship between destination image and visitor
satisfaction
H20: Existential authenticity mediates the relationship between destination image and
destination loyalty
H21: Object based authenticity mediates the relationship between destination image and
destination loyalty.

138
The Need for Continuous Improvement in Supplier Performance: The Mediating Effect of
Commitment Constructs
Baliga.J Ashwin & Upendra Kumar Maurya
Indian Institute of Technology, Madras
Introduction: Marketing channels are a set of interdependent organizations that are involved
in making a product or service available for use or consumption, to the end customer. Firms
within the channels need to maintain good relationship amongst themselves to ensure success,
to enhance their performance and to reduce opportunism. Reducing opportunism is of prime
importance in any relationship and is vital to ensure channel performance. Opportunism is
defined as “self-interest seeking with guile” (Williamson, 1985). It is as an act of deceit
engaging in unethical/ unlawful behavior that can be active (doing things implicitly or
explicitly) or passive that usually has a cunning motive (guile). Opportunism if not minimized,
will lead to significant losses for both the firms.
There have been multiple approaches to improve channel performance and reduce opportunism
Careful partner selection, incentive design, monitoring, governance measures etc., are some
means. Earlier research carried in marketing channels was mainly based on economic based
approaches such as transaction cost theory, agency theory etc. But it was Bucklin (1966) and
Stern (1969) who provided new approaches (behavioral based) to study relationships (Watson
IV et al., 2015).
John (1984) found that the strategies of influence can reduce as well as worsen opportunism.
Strategies of influence tells about the content and structure of communication, that one party
uses to change the attitude and behavior of another channel member. Coercive strategies-
makes use of force/ threats, promises and legal routes. Non-coercive strategies- relies on
information exchange, recommendation and requests.
A few researchers have suggested that when the coercive strategies of influence is used it might
increase opportunism (John, 1984; Provan and Skinner, 1989), whereas the non-coercive
strategies might discourage opportunism (Wathne and Heide, 2000). The kind of problem that
the channel faces determines the choice of a particular strategy of influence. Although multiple
approaches has been used, no study has made an attempt to integrate multiple behavioral based
approaches to study opportunism. Here we make an attempt here to see if strategies of influence
along with moderating effect of relational governance can help build trust, commitment in the
relationship and thus reduce opportunism.
In this study the objective would be to
1. To understand how the behavioral variables interact with each other and reduce opportunism
(In the context of a supplier-distributor relationship).
Accordingly following are the research questions:
1. What role does the relational governance (comprising of relational norms and collaborative
activity) play in curbing opportunism?
2. What are the conditions under which different strategies of influence can be used?
3. Is it better to limit opportunism or eliminate it completely from the system?
H3a,b
Coercive
strategies
Opportunism

139
H8 H7
H5b
H6
H5a H4a,b
H1,2
Figure 1: Proposed Model
Hypotheses development: Relational governance measures are also commonly used to study
the Interfirm relationships. A recent study carried out by Zhou et al., (2015) has shown that the
relational governance should comprise of attitudinal and behavioral measures. This was also
recommended by Kim (1999).Therefore relational governance measures comprising of
relational norms and collaborative activities (joint planning and joint problem solving) have
been used in the study. It was found that when the relational norms were lower, joint planning
reduces opportunism and joint problem solving aggravates opportunism. When the relational
norms are lower, joint planning enables co-operation. This reduces information asymmetries
and reduces opportunism. But when the norms are higher, joint planning may hinder
cooperation, create misunderstanding and increase opportunism. Joint problem solving should
only be used when the relational norms are high, because partners receive what they expect.
Both the partners provide relevant, accurate information and are less likely to misjudge the
behavior. Therefore it is hypothesized that
H1: When the relational norms are lower, joint planning reduces opportunism and joint
problem solving exacerbates opportunism.
H2: When the relational norms are higher, joint problem solving reduces opportunism and joint
planning exacerbates opportunism.
Impact of non-coercive influence on Opportunism
Non-coercive influence strategies is based on rational persuasion, reasoning etc., with no room
for conflicts. The very objective here is to make the other party understand the consequence of
its action and thus avoid/ reduce opportunism. It also facilitates two way communication
between the parties. When the relational governance are higher, i.e. when the roles are clearly
defined and when there is constructive problem solving, the combined effect reduces the
opportunism in return (Brown, Grzeskowiak and Dev, 2009). Therefore it is hypothesized that
H3a: When the firms perceives that the level of relational governance in their relationship as
higher (i.e. high relational norms and joint problem solving), the non-coercive strategies of
influence is negatively associated with the opportunism of a partner firm. (This is because the
things are communicated in advance through agreements and any deviation is brought to the
Non- Coercive
strategies
Trust Commitment
Relational Governance
(Norms + Collaborative
activity)

140
notice by persuasion. When the level of relational norms are higher, joint problem solving
ensures cooperation between the partners and they are less likely to misjudge the behavior).
Relational governance attempts to reduce opportunism as they promote openness in
communication. But when the measures are not developed well, it can be a cause of frequent
disagreements and a party may find it very difficult to control another party’s opportunism, due
to inconsistencies in behavior. Under such cases, the non-coercive strategies of influence may
be misinterpreted and lead to retaliation. The opportunistic party might refuse to adapt for the
changes asked or might do forced re-negotiation to protect its self-interest, which is an act of
opportunism (Brown, Grzeskowiak and Dev, 2009). Therefore it is hypothesized that
H3b: When the firms perceives that the level of relational governance in their relationship as
lower (low relational norms and joint problem solving), the non-coercive strategies of influence
is positively associated with the opportunism of a partner firm. (Low level of relational norms
and joint problem solving creates ambiguity and uncertainty in relationships).
Impact of Coercive influence on Opportunism
Here rewards are offered whenever there is compliance and the non-compliance is dealt with
actions in the form of punishments. Coercive strategies of influence aim to restrict the
opportunism behavior of the partner firm in the short term itself. Having low level of relational
governance measures with high degree of coercive influence limits opportunism. Therefore it
is hypothesized that
H4a: When the firms perceives that the level of relational governance in their relationship as
lower, the coercive strategies of influence is negatively associated with the opportunism of a
partner firm. But when both the relational governance measures and the coercive strategies of
influence is higher, it amplifies and may create tension, frustration amongst the partner firm.
The level of opportunism can be expected to be higher, as parties may reject this or express
displeasure by following unfair practices to avoid another party’s dictatorship. Therefore it is
hypothesized that
H4b: When the firms perceives that the level of relational governance measures in their
relationship as higher, the coercive strategies of influence is positively associated with the
opportunism of a partner firm.
Impact of strategies of influence on Trust with Moderating Effect of Relational
Governance
In most of the marketing literature, there is consensus that more communication helps ease
tensions between the parties and is better. Although it is true, the studies have not considered
the nature of relationships between the parties. When the exchange between the firms is
relational, the firms can predict behavior of each other with less communication (Anderson and
Weitz, 1989; Simpson and Mayo, 1997). Influence strategies be it coercive or non-coercive is
an indication of power. When this is combined with the higher relational governance measures
(norms and collaborative activity) it can lead to communication overload and can reduce trust
in the exchange relationship. Therefore it is hypothesized that
H5a: The association between the non-coercive strategies of influence and trust, weakens with
the moderating effect of higher relational governance measures.
H5b: The association between the coercive strategies of influence and trust, worsens with the
moderating effect of higher relational governance measures.
Impact of Trust and Commitment on Opportunism
141
Trust is having confidence in an exchange partner’s integrity (Morgan and Hunt, 1994).
Commitment is the persistent want to maintain a valued relationship (Moorman, Deshpande
and Zaltman, 1992). Trust and commitment are key measures of Interfirm relationships. It helps
the firms contribute to meet the mutual goals and prevents the members within the channel
from acting opportunistically. Trust is built at individual level whereas commitment at the firm
level, thereby leading to interpersonal relationships and not vice versa (development of trust
takes place first and commitment follows it, but it takes a longer time to develop and is thus
complex. Thus trust acts as an antecedent to commitment), although this varies from context
to context. As trust tends to commitment it leverages information asymmetries, dependence
and thus reduces opportunism (Gundlach, Achrol and Mentzer, 1995). Therefore it is
hypothesized that
H6: Trust in Interfirm relationships is associated positively to commitment.
H7: Commitment in Interfirm relationships is associated negatively to opportunism.
H8: Trust in Interfirm relationships is associated negatively to opportunism.
Proposed Methodology
A case study methodology along with in depth interview will be conducted in order to know
the various reasons as to why firms in channels act opportunistically. In addition, survey
instruments will be used to collect the data. The various spillover effects (secondary effects)
that takes place will also be determined. Special observational qualitative methods such as
ethnographic studies can be used in this regard.
Discussions
Opportunism leads to opportunity loss and also results in wastage of time and resources. The
efficiency and the effectiveness, of the influence strategies used to curb opportunism depends
on the level of relational governance measures. Coercive strategies of influence exacerbates
opportunism whereas the non-coercive strategies limits opportunism. We also believe that the
moderating effect of relational governance plays a major role in limiting opportunism. When
the norms are higher, it is preferable to opt for joint problem solving instead of joint planning.
The use of a particular collaborative activity, depends on the level of relational norms.
Incorporation of the right governance measures ensures win-win situation for the firms
involved in exchange. Trust and commitment also play a key role in limiting opportunism. We
also suggest that it is better to have a tolerable limit of opportunism in the system instead of
striving for complete elimination. It is also consistent with the study conducted by Dutta,
Bergen and John (1994). When the costs involved in eliminating the opportunism exceeds
benefits, it is advisable to have a tolerable limit of behavior within the relationship.
Limitations of the study
The results of the study is based on the distributor’s perceptions of the influence strategies used
by the supplier. It would also be useful to capture the perceptions of supplier. Also the study
does not address the impact of relational governance measures on performance dimensions
such as satisfaction, sales etc. Since the data collected, focuses only on the impact after
development of relationship, it may not be possible to determine the equity and impact levels
during the initial stages.
References
Anderson, E. and Weitz, B., 1989. Determinants of continuity in conventional industrial
channel dyads. Marketing science, 8(4), pp.310-323.

142
Brown, J.R., Grzeskowiak, S. and Dev, C.S., 2009. Using influence strategies to reduce
marketing channel opportunism: The moderating effect of relational norms. Marketing
Letters, 20(2), pp.139-154.
Bucklin, L.P., 1966. A theory of distribution channel structure. University of California,
Institute of Business and Economic Research.
Dutta, S., Bergen, M. and John, G., 1994. The governance of exclusive territories when
dealers can bootleg. Marketing Science, 13(1), pp.83-99.
Gundlach, G.T., Achrol, R.S. and Mentzer, J.T., 1995. The structure of commitment in
exchange. The Journal of Marketing, pp.78-92.
John, G., 1984. An empirical investigation of some antecedents of opportunism in a
marketing channel. Journal of marketing Research, pp.278-289.
Kim, K., 1999. On determinants of joint action in industrial distributor–supplier
relationships: Beyond economic efficiency. International Journal of Research in
Marketing, 16(3), pp.217-236.
Moorman, C., Zaltman, G. and Deshpande, R., 1992. Relationships between providers and
users of market research: The dynamics of trust within and between organizations. Journal
of marketing research, 29(3), p.314.
Morgan, R.M. and Hunt, S.D., 1994. The commitment-trust theory of relationship
marketing. The journal of marketing, pp.20-38.
Provan, K.G. and Skinner, S.J., 1989. Interorganizational dependence and control as
predictors of opportunism in dealer-supplier relations. Academy of management
Journal, 32(1), pp.202-212.
Simpson, J.T. and Mayo, D.T., 1997. Relationship management: a call for fewer influence
attempts? Journal of Business Research, 39(3), pp.209-218.
Stern, L.W. ed., 1969. Distribution channels: Behavioral dimensions. Houghton Mifflin
Harcourt (HMH).
Wathne, K.H. and Heide, J.B., 2000. Opportunism in interfirm relationships: Forms,
outcomes, and solutions. Journal of marketing, 64(4), pp.36-51.
Watson, G.F., Worm, S., Palmatier, R.W. and Ganesan, S., 2015. The evolution of
marketing channels: trends and research directions. Journal of Retailing, 91(4), pp.546-
568.
Williamson, O.E., 1985. The economic institutions of capitalism. The Free Press, New
York.
Zhou, Y., Zhang, X., Zhuang, G. and Zhou, N., 2015. Relational norms and collaborative
activities: roles in reducing opportunism in marketing channels. Industrial Marketing
Management, 46, pp.147-159.

143
Web care quality: Conceptualization scale development and Validation
Ghosh Tathagata
ICFAI Business, Hyderabad
Internet-based technologies have triggered a wave of changes in the way consumers interact
with brands, including how they search, evaluate, and purchase products and services, and later
share their consumption experiences with others (Mukhopadhyay, Mahmood, and Joseph 2008;
Labrecque 2014; Ullrich and Brunner 2015). Specifically in the context of sharing product- or
service-related opinions, they are now empowered to spread positive or negative word of mouth
(henceforth, PWOM and NWOM, respectively) in the form of written reviews through a wide
array of online channels like company websites, micro-blogs, social networking websites, and
product- or industry-specific review sites (Ward and Ostrom 2006). While positive reviews
make brands popular, negative reviews possess potent harm-inflicting characteristics that may
significantly erode brand image and trigger other negative consequences like decreased brand
attitude (Purnawirawan et al. 2015), purchase intention (Lee and Youn 2009), product trial
(Huang and Korfiatis 2015), and sales (Cui, Lui, and Guo 2012). Therefore, marketers must
safeguard the reputation of their brands by effectively managing the detrimental effects of
negative reviews (Hennig-Thurau et al. 2010; Van Noort and Willemsen 2012).
In the pursuit of controlling damages caused by negative reviews, a defensive tool called
webcare has gained momentum in recent times. It is defined as “the act of engaging in online
interactions with complaining consumers, by actively searching the web to address consumer
feedback (e.g., questions, concerns and complaints)” (Van Noort and Willemsen 2012, p. 133).
Marketers have started using webcare either reactively to address negative reviews and specific
response requests of consumers (e.g., “I want an answer from the company for the service
failure that occurred.”), or proactively without any such provocation to respond (Van Noort
and Willemsen 2012). Extant studies on webcare underscore the significance of this tool in
curtailing detrimental effects of negative reviews. For example, Hong and Lee (2005) revealed
that online responses by companies resolve concerns of complaining consumers, which in turn
increases their PWOM and loyalty, and stops other consumers from getting engaged in
unnecessary follow-up attacks. Depending upon the strategy adopted (proactive or reactive)
and online platform used (consumer-generated or brand-generated), webcare also has the
ability to attenuate negative brand evaluations (Van Noort and Willemsen 2012). Valence and
level of negativity manifested in the reviews determine what strategy a marketer should adopt
while writing online responses (Dens, De Pelsmacker, and Purnawirawan 2015). A successful
endeavour ultimately results in generating positive consumer engagement with brands through
the online environment (Schamari and Schaefers 2015).
These aforementioned studies highlighted managerial relevance of webcare and called for
comprehensive research in this domain, but ironically, it is still in a stage of infancy. While
most of the prior studies investigated the effects of various webcare response strategies on
behaviour of complaining consumers, they failed to measure the quality of these responses as
perceived by the complainants. It is salient to note that a wrongly perceived webcare may
backfire on the marketers and weaken its intended effects (Lee and Song 2010). Consider the
following case that happened with a telecommunication company called T-mobile1: A famous
Dutch comedian, after not being satisfied with the company’s product, posted a negative review
in his Twitter account. The company, in turn, wrote a webcare apologizing for the mistake that
happened. However, due to some reason, the quality of webcare was not perceived appropriate
by the comedian. Eventually, he used social media to escalate the problem, which engendered
1 https://www.telecompaper.com/news/dutch-cabaretier-declares-war-on-tmobile-help-desk--764548

144
a vicious circle of negative information about the company and its brand. This is not an isolated
event but might occur at some point of time with any individual where there is a mismatch
between consumers’ expectation from a webcare and managers’ perception about the intensity
of the problem (Van Noort and Willemsen 2012; Van Noort et al. 2015). Therefore, it becomes
imperative for the marketers to ensure that their responses are acknowledged and approved by
the complaining consumers failing which resolution of the complaints remains incomplete
(Hong and Lee 2005; Van Noort and Willemsen 2012; Van Noort et al. 2015).
From the above discussion, it is clear that marketer should have a sound understanding about
how their responses are evaluated by complaining consumers. In other words, they should gain
deeper insight into the parameters used by complainants to evaluate the quality of responses,
i.e., webcare, posted against their negative reviews. Such an insight is expected to augment the
effectiveness of the dialogical communication between the complainant and the transgressing
firm and help in countering the harmful effects of negative reviews in a better way (Van Noort
et al. 2015). Eventually, a refined measure of webcare quality would complement previous
research on webcare responses with a quality-of-response specific investigation, facilitate
marketers to understand whether their responses are able to meet the expectations of the
complaining consumers, and provide executable strategies to marketers at a granular level.
To sum up, the objective of the present research is to develop a robust scale that measures
quality of webcare. A grounded theory approach would be adopted to establish the baseline
dimensions of webcare quality as suggested by Rossiter (2002). Then a modified scale
development process would be undertaken using Churchill’s (1979) methodology.
LITERATURE REVIEW:
Managing Negative Reviews through Webcare
Service failures and corresponding negative reviews, being trigger events, may occur during consumer
lifecycles and initiate change in their relationship with the company (Malthouse 2007). Therefore,
marketers need to detect and intervene in the negative stream of information as early as possible in order
to prevent brand switching and other adverse outcomes (Malthouse 2007). Though detection is
comparatively easy, intervention becomes increasingly difficult because negative reviews, and for that
matter all forms of consumer-generated communication, are beyond the reach and direct control of
marketers (Williams and Buttle 2014). Therefore, as Deighton and Kornfeld (2009, p.4) suggest: “today
marketing is less a matter of domination and control, and more a matter of fitting in,” webcare has
emerged as a fit-in-context communicative tool that allows brands to relinquish their control yet manage
online damage in a subtle, conversational manner (Dens, Pelsmacker, and Purnawirawan 2015; Lee and
Song 2010; Van Noort and Willemsen 2012).
Webcare draws its conceptual origin from traditional service recovery literature. There, marketers’
timely explanations for service failures accompanied with justification, apology, and compensation
have been found to affect satisfaction and future business intention of complaining consumers (Conlon
and Murray 1996). A survey paper by Davidow (2003) categorized management responses to consumer
complaints (offline) into salient response dimensions, namely timeliness, redress, facilitation, apology,
attentiveness, and credibility. With the advent of social media and other forms of online channels,
consumers’ propensity to post negative reviews has substantially increased (Gelb and Sundaram 2002).
Marketers are, therefore, left with lesser alternatives than to simultaneously engage in online activities
and post responses in order to prevent their brand images from being deteriorated. If consistently
harnessed, this response mechanism pays off well and results in heightened company reputation
(Dijkmans et al. 2015). Responses which are timely in nature, contain elements of two-way
communication, and reveal information about the company, help in building intimacy and trust, reduce
uncertainties and eventually foster long-term relationship between brands and consumers (Labrecque
2014). Due to this persuasive strength of webcares, marketers not only respond when complainants seek
reasons and/or solutions to service failures but also post them proactively in anticipation of favourable

145
outcomes (Van Noort and Willemsen 2012). On the contrary, brand evaluations and purchase intentions
may seriously hurt if no webcares are provided when they are required the most (Van Noort and
Willemsen,2012; Ullrich and Brunner 2015).
Broadly, webcares follow certain strategies like accommodative response (combined explanations such
as apology and a promise of full compensation) and defensive response (shifting blame to others), the
former being more effective in generating favourable brand evaluation and attribution of responsibility
than the latter (Lee and Song 2010). Accommodative webcare responses are further classified into
strategies like apology only, apology plus prospective explanation, apology plus compensation, and
apology plus prospective explanation plus compensation each of which has differential impact on
consumers’ brand attitude, patronage intentions, and propensity to cater PWOM (Dens, Pelsmacker,
and Purnawirawan 2015). A slightly different categorization of management responses to negative
reviews is provided by Sparks and Bradley (2014) that encompasses strategies like acknowledgement,
action, accountability, and action. Which strategy one should adopt depends on factors like type of
platform (consumer- vs. brand-generated) (Van Noort and Willemsen 2012) and review set balance,
i.e., the ratio of positive and negative reviews related to any product or service (Dens, Pelsmacker, and
Purnawirawan 2015).
Extant research on webcare also highlights the effect of webcare attributes on consumer behaviour. For
example, Waiguny, Kniesel, and Diehl (2014) found that an attribute called webcare voice, human or
corporate, have varying effect on consumers’ attitude toward the brand. On the other hand, Kumar and
Maheswarappa (2012) investigated the effects of webcare attributes like depth and valence on brand
evaluation. However, much contrary to hypothesized relationships, no significant differences in brand
evaluation were found between webcare valence conditions, namely negative valence (refutation of
complaints) and positive valence (acceptance of complaints) (Kumar and Maheswarappa 2012). Finally,
Ghosh (2017) empirically validates the positive effects of two salient webcare attribute namely, webcare
strength and webcare timeliness, on consumer forgiveness in the presence of review helpfulness as a
moderator.
From the afore-mentioned paragraphs, it becomes clear that prior research in the domain of webcare
have focussed mostly on webcare strategies and attributes and their effects on behaviour of complaining
consumers. However, as mentioned earlier, unless marketers understand the parameters used by
complainants to evaluate the quality of these response strategies and attributes, they would not be able
to ensure whether and to what extent complainants are satisfied with the service recovery efforts.
Therefore, it is high time for researchers to shift their attention from response strategies and
systematically explore the dimensions of webcare quality.
KEY RESEARCH QUESTIONS
The following research questions are being answered through the present research:
1. How do complaining consumers evaluate quality of managers’ responses to negative reviews?
2. What is the effect of such an evaluation on behaviour of complaining consumers?
The first question would be addressed by means of developing a refined scale of webcare
quality. The scale development process would encapsulate (a) grounded theory approach to
identify baseline dimensions of webcare quality as suggested by Rossiter (2002), and (b) a
scientific item development, purification, and retention procedure followed by a series of
reliability and validity tests as suggested by Churchill (1979). Together, these two approaches
would enable the researchers to develop a solid, multidimensional psychometric measure of
webcare quality.
PROPOSED METHODOLOGY

146
By adopting a grounded theory approach (Rossiter 2002; Spiggle 1994), identification of the broad
themes pertaining to the dimensions of webcare quality would involve two sources – (a) thorough
review of literature on webcare, and extant scale development studies in the domain of service recovery
and service exception handling, and (b) a series of qualitative research techniques (two focus groups,
one qualitative survey). This would be followed by an exhaustive item generation procedure, expert
review to achieve face validity of the items, exploratory data collection, and a scale validation study.
The details of the studies to be conducted are reported below:

147
Study Type Objective Sample Detail Expected Outcome
Statistical
Tool/Technique to be
Used and Other
Associated Activities
1
Focus
Group
Interview
To identify the broad dimensions of
webcare quality from the marketers'
perspective, i.e., dimensions that
marketers think are salient to be
considered.
Sampling Frame: Employees in a service
firm having responsibility of posting
webcare in online sites.
Sample Size: Approximately 25
A list of dimensions of webcare
quality perceived to be
important by marketers.
Content analysis using
QDA Miner
Coding by judges
(validated by inter-judge
correlation)
2 Qualitative
Survey
To identify the broad dimensions of
webcare quality from the complaining
consumers' perspective, i.e.,
dimensions complainants focus to
evaluate the quality of webcare
received from the marketers.
Sampling Frame: Individuals aged above
18 years who show the propensity of
writing negative reviews.
Sample Size: Approximately 100
A list of dimensions of webcare
quality perceived to be
important by complaining
consumers.
Cumulatively, the literature
review, Study 1, and Study 2
would help generate a complete
list of broad dimensions of
webcare quality.
Content analysis using
QDA Miner
Coding by judges
(validated by inter-judge
correlation)
3
Item
Generation
and Expert
Reviews for
Face
Validity
To generate items pertaining to each of
the identified dimensions of webcare
quality.
Sampling Frame: NA
Sample Size: NA
These items would be generated by the
researcher with the help of two to three
research scholars/assistants.
Once the entire list of items are generated,
a group of experts (academicians and
research scholars) would be recruited who
would read each item and retain important
items. In other words, these experts would
help in achieving face validity.
A list of items pertaining to
each dimension of webcare
quality.
NA

148
4
Preliminary
Scale
Assessment
To conduct a preliminary
psychometric assessment of the
webcare quality scale, i.e., to explore a
basic factor structure comprising of the
multiple dimensions of webcare
quality.
Sampling Frame: Individuals aged above
18 years who show the propensity of
writing negative reviews in various online
channels.
Sample Size: Approximately 500
A basic, multidimensional
webcare quality scale.
Exploratory Factor
Analysis (IBM SPSS 20.0)
5 Scale
Validity
To empirically validate the webcare
quality scale. Typically three validity
tests would be conducted
1. Convergent Validity
2. Discriminant Validity
3. Nomological Validity
For conducting nomological validity,
three justice dimensions (distributive,
procedural, and interactional) would
be considered as the dependent
variables that are affected by webcare
quality
Sampling Frame: Individuals aged above
18 years who show the propensity of
writing negative reviews in various online
channels.
Sample Size: Approximately 200
A scientifically reliable and
valid multidimensional webcare
quality scale.
Second Order
Confirmatory Factor
Analysis (since webcare
quality is being considered
as a multidimensional
construct) (AMOS 20.0)
Structural equation
modelling (AMOS 20.0)
A research agency would be appointed to collect the data for Study 1, 2, 4, and 5 while Study 3 would be conducted by the researcher in the university.

149
EXPECTED CONTRIBUTION:
Prior studies on management responses to negative online reviews have systematically dealt with
the effects of various response (i.e., web care) strategies and web care attributes on behaviour of
complaining consumers while totally ignoring how these consumers evaluate the quality of these
responses. The present research aims to fill this research void by developing a multidimensional
scale called web care quality. Such a research is expected to open a new domain of investigation
and would facilitate future researchers to investigate the effects of web care quality on various
cognitive, affective, conative, and behavioural aspects of complaining consumers.
From the managers’ perspective, the present research would enable them to gain insight into the
evaluative procedures of their responses to critical negative reviews. They would be in a better
position to understand whether and to what extent their web care facilitates in pacifying the
complainants for the transgression that occurred. They would also be able to emphasize on the
right aspects or dimensions of their web care while posting in the online channel. This in turn
would help the marketers to convert complaining consumers into satisfied ones, achieve sustained
brand commitment, and profitability.
RESEARCH TIMELINES AND BUDGET
Activities Time Duration Cumulative Time Budget
Literature review to
identify dimensions of
webcare quality
15 days 15 days NIL
Study 1 1 month 1.5 months 252 * 1000 = 25000
Study 2 1 month 2.5 months 100 * 150 = 15000
Study 3 15 days 3 months NIL
Study 4 2 month 5 months 500 * 150 = 75000
Study 5 1 month 6 months 200 * 150 = 30000
Drafting of research article 15 days 6.5 months Rs. 145, 000
2 In the budget column, the first number in each cell represents sample size while the second number represents
the amount of money required to collect data from each respondent.
150
REFERENCES:
Churchill Jr, Gilbert A. (1979), “A Paradigm for Developing Better Measures of Marketing
Constructs,” Journal of Marketing Research, 16, 1, 64-73.
Conlon, Donald E. and Noel M. Murray (1996), “Customer Perceptions of Corporate
Responses to Product Complaints: The Role of Explanations,” Academy of Management Journal,
39, 4, 1040-1056.
Cui, Geng, Hon-Kwong Lui, and Xiaoning Guo (2012), “The Effect of Online Consumer
Reviews on New Product Sales,” International Journal of Electronic Commerce, 17, 1, 39-58.
Davidow, Moshe (2003), “Organizational Responses to Customer Complaints: What
Works and what doesn’t,” Journal of Service Research, 5 (3), 225-250.
Deighton, John and Leora Kornfeld (2009), “Interactivity’s Unanticipated Consequences
for Marketers and Marketing,” Journal of Interactive Marketing, 23, 1, 4-10.
Dens, Nathalie, Patrick De Pelsmacker, and Nathalia Purnawirawan (2015), “We(b)care:
How Review Set Balance Moderates the Appropriate Response Strategy to Negative Online
Reviews,” Journal of Service Management, 26, 3, 486-515.
Dijkmans, Corne, Peter Kerkhof, Asuman Buyukcan‐Tetik, and Camiel J. Beukeboom
(2015), “Online Conversation and Corporate Reputation: A Two‐wave Longitudinal Study on the
Effects of Exposure to the Social Media Activities of a Highly Interactive Company,” Journal of
Computer‐Mediated Communication, 20 (6), 632-648.
Ghosh, Tathagata (2017), “Managing Negative Reviews: The Persuasive Role of Webcare
Characteristics,” Journal of Internet Commerce, 16, 2, 148-173.
Hennig-Thurau, Thorsten, Edward C. Malthouse, Christian Friege, Sonja Gensler, Lara
Lobschat, Arvind Rangaswamy, and Bernd Skiera (2010), “The Impact of New Media on
Customer Relationships,” Journal of Service Research, 13, 3, 311-330.
Hong, Yi-Young and Wei-Na Lee (2005), “Consumer Complaint Behaviour in the Online
Environment” in Web System Design and Online Consumer Behaviour, Yuan Gao, ed. Hershey:
Idea Group Publishing, 90-105.
Kumar, Sushant and Satish Maheswarappa (2012), “Taming the Technological Beast:
Effect of Corporate Response Strategies to Product Dissatisfaction Related Popular Anti-brand
Websites on Brand Evaluation,” Asia-Pacific Advances in Consumer Research, 10, 368-371.
Labrecque, Lauren I. (2014), “Fostering Consumer-brand Relationships in Social Media
Environments: The role of Parasocial Interaction,” Journal of Interactive Marketing, 28, 2, 134-
148.

151
Lee, Mira and Seounmi Youn (2009), “Electronic Word of Mouth (eWOM): How eWOM
Platforms Influence Consumer Product Judgement,” International Journal of Advertising, 28, 3,
473-499.
Lee, Young L. and Seokwoo Song (2010), “An Empirical Investigation of Electronic
Word-of-Mouth: Informational Motive and Corporate Response Strategy,” Computers in Human
Behavior, 26, 5, 1073-1080.
Malthouse, Edward C (2007), “Mining for Trigger Events with Survival Analysis,” Data
Mining and Knowledge Discovery, 15, 3, 383-402.
Mukhopadhyay, Somnath, M. Adam Mahmood, and Jimmie L. Joseph (2010), “Measuring
Inter-commerce Success: What Factors are Important?” Journal of Internet Commerce, 7, 1, 1-28.
Purnawirawan, Nathalia, Martin Eisend, Patrick De Pelsmacker, and Nathalie Dens (2015),
“A Meta-Analytic Investigation of the Role of Valence in Online Reviews,” Journal of Interactive
Marketing, 31, 17-27.
Rossiter, John R. (2002), “The C-OAR-SE Procedure for Scale Development in
Marketing,” International Journal of Research in Marketing, 19, 4, 305-335.
Schamari, Julia and Tobias Schaefers (2015), “Leaving the Home Turf: How Brands Can
Use Webcare on Consumer-Generated Platforms to Increase Positive Consumer
Engagement,” Journal of Interactive Marketing, 30, 20-33.
Sparks, Beverley A. and Graham L. Bradley (2014), “A “Triple A” Typology of
Responding to Negative Consumer-generated Online Reviews,” Journal of Hospitality & Tourism
Research, Published Online, doi: 10.1177/1096348014538052
Spiggle, Susan (1994), “Analysis and Interpretation of Qualitative Data in Consumer
Research,” Journal of Consumer Research, 21, 3, 491-503.
Ullrich, Sebastian, and Christian Boris Brunner (2015), “Negative Online Consumer
Reviews: Effects of Different responses,” Journal of Product & Brand Management, 24, 1, 66-77.
Van Noort, Guda and Lotte M. Willemsen (2012), “Online Damage Control: The Effects
of Proactive Versus Reactive Webcare Interventions in Consumer-generated and Brand-generated
Platforms,” Journal of Interactive Marketing, 26, 3, 131-140.
Waiguny, Martin K., Heike Kniesel, and Sandra Diehl (2014), “Is it Worth Responding?
The effect of Different Response Strategies on the Attitude toward the Reviewed Hotel,”
Proceedings of International Conference on Research in Advertising, Amsterdam, Netherlands.
Ward, James A. and Amy L. Ostrom (2006), “Complaining to the Masses: The Role of
Protest Framing in Customer-created Complaint Web Sites,” Journal of Consumer Research, 33,
2, 220-230.
Williams, Martin and Francis Buttle (2014), “Managing Negative Word-of-mouth: An
Exploratory Study,” Journal of Marketing Management, 30, 13-14, 1423-1447.

152
Cozying up to the Kardashians: A Theory for Consumers' Affinity towards Celebrity Gossip
Nasa Jayant, Tanuka Ghoshal & Rajagopal Raghunathan
Indian School of Business, Hyderabad
In this research, our goal is to understand the reasons for high popularity of celebrity gossip magazines and websites. The focus of our research is at the individual-level (consumer behavior). We wish to study the psychological processes which drive consumers' (huge) fascination with celebrities and their personal lives. Building on the gossip literature in psychology and the compensatory consumer behavior stream of research, we propose a new theory for consumption of celebrity gossip. We conjecture that, when an aspect of consumers' identity (which they consider important) is threatened, their interest increases in personal lives of celebrities – thus increasing their propensity to read celebrity gossip. We believe this effect is, not just due to post-threat distraction tendencies, but also driven by the innate human desire to affiliate with powerful people – this desire is particularly heightened after an individual’s sense of self is threatened. We further hypothesize that this effect of identity threats on consumption of celebrity gossip is moderated by consumers' trait self-esteem, and also plan next to examine the role of cultural power distance beliefs and celebrity likeability as boundary conditions for our proposed effects. Introduction
While there exists abundant research on peer-to-peer gossip (Anderson et al. 2011; Baumeister, Zhang, and Vohs 2004; Dunbar 2004; Eder and Enke 1991; Feinberg et al. 2012; Feinberg, Willer, and Schultz 2014; Fine and Rosnow 1978; Foster 2004; Kniffin and Wilson 2005; Kurland and Pelled 2000; Martinescu, Janssen, and Nijstad 2014; Wert and Salovey 2004), very little research has investigated what makes people interested in gossip about celebrities (DeBacker 2012; Peng et al. 2015) . This is surprising considering the humongous popularity of celebrity gossip magazines, websites, and even social media accounts of the celebrities as well as those of the gossip magazines/blogs. Given that celebrities aren't directly related to the general public, what makes people so curious to know about their personal lives by reading gossip articles about them in magazines or on the internet? The present research aims to answer this question by proposing a new theory – the tendency to know more about personal lives of celebrities is a result of the innate human desire to affiliate with successful and powerful people (Cialdini et al. 1976; Cialdini and Richardson 1980; Dijkstra et al. 2010). By getting intimate details about celebrities’ personal lives, we propose that people tend to develop a (oneway) friendship with them (DeBacker 2012) and this affiliation-based friendship becomes a source of comfort for them, particularly when an aspect of their identity (which they consider important) is threatened (Cialdini et al. 1976; Synder, Lassegard, and Ford 1986).

153
Literature Review & Main Hypotheses
Compensatory consumer behavior model (for a review, see Mandel et al. 2017) states that individuals use five different types of strategies to cope with various kinds of identity threats. One of these post-threat coping strategies is fluid compensation, i.e. affirming the self in an aspect of the identity distinct from the one that was threatened (Mandel et al. 2017). After a social exclusion threat, individuals may either directly satisfy their need of belongingness by connecting more with other people, including strangers (Gardner, Pickett, and Brewer 2000; Maner et al. 2007), or may use fluid compensation coping strategy to affirm themselves by satisfying their materialistic desires (Lastovicka and Sirianni 2011). On similar lines, we argue that another way in which individuals could use fluid compensation as a post-threat coping strategy is by fulfilling their inner desire to affiliate with powerful people – by engaging in consumption of celebrity gossip (celebrity gossip could also serve as a means to escape from the source of threat, but we assert that it serves more than just distractive function). Further, contrary to what one may initially think, we hypothesize that such susceptibility to reading celebrity gossip under an identity threat is more among high self-esteem (SE) individuals relative to low SE ones. Our conjecture is not that, in general, high SE people consume more celebrity gossip than low SE ones. Let us clarify that we do expect the main effect of self-esteem on consumption of celebrity gossip to be negative – all we are saying is that low SE people don't use celebrity gossip consumption as a post-threat coping strategy (via fluid compensation path). Past research has shown that high and low SE individuals use different techniques to cope up with identity threats. While high SE people seek contact with close others as it makes them feel less distressed (Park and Maner 2009; Teng and Chen 2012), low SE persons tend to avoid social contact as they feel defeated under threat and lack self-efficacy to put any effort in forming a connection (Brockner, Derr, and Laing 1987). Why study in India?
Considering that our theory for wanting to read celebrity gossip is based on people’s desire to affiliate with powerful people, it is essential to understand the role of the extent to which people perceive celebrities as more powerful than them, which is what makes an emerging market like India a perfect place for investigating our research question. India is high on cultural power distance belief (PDB), the extent to which people expect and accept power disparity in the society (Zhang, Winterich, and Mittal 2010), which makes people in India perceive celebrities as relatively much more powerful than their counterparts in low PDB cultures (e.g. USA). Thus, not only an emerging market like India a good place for testing our main research question What makes people interested in celebrity gossip – but also by doing a parallel study in India and USA (or simply by priming high and low PDBs to participants), we can further

154
enhance our knowledge of the phenomenon and explore the role of cultural PDB as a boundary condition. Since in high PDB cultures, there is greater power disparity, people are okay with the inequality, and hierarchy in society, the extent of fascination with celebrities is expected be greater here than in low PDB cultures. This hypothesis makes sense because it has already been shown that brand endorsements featuring celebrities are more prevalent and more effective in high PDB cultures than low PDB ones (Winterich, Gangwar, and Grewal 2016). It has also been shown that people in high PDP cultures have a greater desire for status products (Kim and Zhang 2014), which suggests that they’ll also be more likely to enhance their status by wanting to be affiliated with high-status individuals, such as celebrities. Finally, since many celebrities have been given God-like status in emerging countries like India (McCutcheon, Lange, & Houran 2002; Winterich et al. 2016), it will be interesting to see how this liking for celebrities interacts with our proposed effects. Given such high stature for certain celebrities, doing the research in India gives us an avenue to test celebrity likeability as another boundary condition for our theory. We expect that the desire to affiliate with celebrities by reading gossip about them will hold only for the celebrities which are liked by the public, but not for those which are disliked, as people won't be able to affirm their threatened self by affiliating with a celebrity they dislike. Proposed Methodology
We plan to test our hypotheses by running a series of experiments as listed below: Study 1 (already done): This study was done on 167 college students in Hyderabad. It was a two factor study, with competence-based self-threat (high/low) being a manipulated factor and participants’ trait self-esteem as a measured continuous factor. The dependent variable was choice of an article to read (as a part of an “unrelated” study). Gender and general liking for the celebrities (about whom the gossip articles were presented) were measured as covariates. Self-threat was manipulated by giving a pre-determined false feedback after a lateral thinking ability test (LTAT,Raghunathan and Trope 2002) – half of the Ps were randomly assigned to high threat condition (scored in bottom 5/10/15%) and other half were assigned to low threat condition (top 5/10/15%). These values (5/10/15%) were also included as covariates while analyzing the responses. The stimuli articles out of which the reading choice was to be made (DV) were selected based on a pretest, also done on 51 students from the same population (but not used in the main study). They were given 10 article titles (comprising of both celebrity gossip and non-gossip articles) to read and they provided their ratings for interest, tone, likelihood of being published in Filmfare magazine, etc. Finally, based on the pretest, four articles were identified for using as stimuli in the main study. Pretest questions were used as manipulation checks in the main study.

155
Study 2: This will be same as Study 1, except for three major changes: (1) Reading choice won’t be a DV anymore. Instead, Ps will be randomly given either a gossip or a non-gossip article (pretested) to read and the liking for the article will be measured as a DV. (2) Desire to affiliate with powerful people will be measured as the mediator (as part of an ostensibly unrelated study). (3) Escapism will also be measured as a parallel mediator to rule out distraction as an alternate explanation for our findings. Study 3: This will be identical to Study 1, except for two departures: (1) Instead of competence based identity threat, we will manipulate social exclusion threat (Maner et al. 2007). Ps will be asked to remember and write a short essay about a time when they felt rejected, accepted or their events from the last day (control). (2) We’ll also include cultural power distance belief as a factor by priming the participants using a sentence forming task - from jumbled words (Zhang et al. 2010), or by running the same study in two different cultures (Study 3B) – a low PDB one (USA) and a high PDB one (India). Study 4: This will also be identical to Study 2, except for inclusion of a fictitious celebrity (manipulated using social capital as likeable vs. unlikeable) as stimulus for the gossip articles. This will test the role of celebrity likeability as a boundary condition, without confounding our results with the extreme emotions that people may feel towards likeable and unlikeable celebrities in the real world. The mediators won't be measured and analyzed again in this study to reduce its duration. Additionally, we may include a non-gossip fun article as control for the celebrity gossip article as a stimulus in this study, to further rule out distraction as alternate explanation for our findings. Initial Findings
In study 1, we found support for our main hypothesis: high SE participants, under threat, exhibited greater preference for celebrity gossip articles relative to non-gossip articles. We ran a logistic regression on the choice variable with identity threat, trait self-esteem, their interaction term and general liking for the celebrities (those included aspart of stimuli articles) as factors. Gender and % value of manipulated LTAT feedback (5/10/15) were initially included as covariates too, but were then dropped from the analysis as they turned out to be non-significant. There was no significant main effect for manipulated threat, while self-esteem had a marginally significant negative main effect (B = -1.382, SE = 0.795, p = 0.082), suggesting that in general low SE Ps are more likely to choose a celebrity gossip article over a non-gossip one (as can be expected intuitively). There was also a marginally significant interaction effect of manipulated threat with self-esteem (B = 1.726, SE = 1.044, p = 0.098), which on further probing using spotlight analysis (Krishna 2016) we found made the effect of threat on choice DV as significant and positive

156
for high SE Ps (B = 1.018, SE = 0.517, p = 0.049) but not significant for low SE Ps. This confirms our main hypothesis that high SE individuals under threat are more interested in reading celebrity gossip articles over non-gossip ones. Next Steps
Though we now have evidence for our main effect, we still haven’t tested for the psychological process underlying this effect. Thus, we next want to run Study 2 and run a mediation analysis through the construct: desire to affiliate with powerful people. We also want to examine the role of cultural power distance belief as a boundary condition in Study 3, which shall act as further proof for our proposed process explanation. Finally, we wish to run Study 4 to explore another boundary condition: celebrity likeability. Through studies 2 and 4, we also aim to rule out distraction as an alternative explanation for our findings. Target Journal: Journal of Consumer Research (JCR) Proposed Budget & Anticipated Timelines
Study Required No of
Participant
Participant
Compensation (INR)
Expected dates
Two more pretests
(to select stimuli
articles)
150 100*150= 15000 Jan & Feb 2018
Study 2 250 100*250=25000 Feb 2018
Study 3 200 100*200=20000 April 2018
Study 4 200 100*200=20000 April 2018
Sub total 80,000
Expected local travel cost (for running the studies) = INR 15000
GRAND TOTAL = INR 95,000
References
Anderson, Eric, Erika H. Siegel, Eliza Bliss-Moreau, and Lisa Feldman Barrett (2011), “The Visual Impact of Gossip,” Science, 332(6036), 1446–48. Baumeister, Roy F., Liqing Zhang, and Kathleen D. Vohs (2004), “Gossip as Cultural Learning,” Review of General Psychology, 8(2), 111–21. Brockner, Joel, William R. Derr, and Wesley N. Laing (1987), “Self-Esteem and Reactions to Negative Feedback: Toward Greater Generalizability,” Journal of Research in Personality, 21(3), 318–33. Cialdini, Robert B., Richard J. Borden, Avril Thorne, Marcus Randall Walker, Stephen Freeman, and Lloyd Reynolds Sloan (1976), “Basking in Reflected Glory: Three (Football) Field Studies,” Journal of Personality and Social Psychology, 34(3), 366–75.

157
Cialdini, Robert B. and Kenneth D. Richardson (1980), “Two Indirect Tactics of Image Management: Basking and Blasting,” Journal of Personality and Social Psychology, 39(3), 406–15. DeBacker, C. J. S. (2012), “Blinded by the Starlight: An Evolutionary Framework for Studying Celebrity Culture and Fandom,” Review of General Psychology, 16(2), 144–51. Dijkstra, Jan Kornelis, Antonius H. N. Cillessen, Siegwart Lindenberg, and René Veenstra (2010), “Basking in Reflected Glory and Its Limits: Why Adolescents Hang Out With Popular Peers,” Journal of Research on Adolescence, 20(4), 942–58. Dunbar, R. I. M. (2004), “Gossip in Evolutionary Perspective,” Review of General Psychology, 8(2), 100–110. Eder, Donna and Janet Lynne Enke (1991), “The Structure of Gossip: Opportunities and Constraints on Collective Expression among Adolescents,” American Sociological Review, 56(4), 494–508. Feinberg, Matthew, Robb Willer, and Michael Schultz (2014), “Gossip and Ostracism Promote Cooperation in Groups,” Psychological Science, 25(3), 656–64. Feinberg, Matthew, Robb Willer, Jennifer Stellar, and Dacher Keltner (2012), “The Virtues of Gossip: Reputational Information Sharing as Prosocial Behavior,” Journal of Personality and
Social Psychology, 102(5), 1015–30. Fine, Gary Alan and Ralph L. Rosnow (1978), “Gossip, Gossipers, Gossiping,” Personality and
Social Psychology Bulletin, 4(1), 161–68. Foster, Eric K. (2004), “Research on Gossip: Taxonomy, Methods, and Future Directions,” Review of General Psychology, 8(2), 78–99. Gardner, Wendi L., Cynthia L. Pickett, and Marilynn B. Brewer (2000), “Social Exclusion and Selective Memory: How the Need to Belong Influences Memory for Social Events,” Personality
and Social Psychology Bulletin, 26(4), 486–96. Kim, Youngseon and Yinlong Zhang (2014), “The Impact of Power-Distance Belief on Consumers’ Preference for Status Brands,” Journal of Global Marketing, 27(1), 13–29. Kniffin, Kevin M. and David Sloan Wilson (2005), “Utilities of Gossip across Organizational Levels,” Human Nature, 16(3), 278–92. Kurland, Nancy B. and Lisa Hope Pelled (2000), “Passing the Word: Toward a Model of Gossip and Power in the Workplace,” Academy of Management Review, 25(2), 428–38. Lastovicka, John L. and Nancy J. Sirianni (2011), “Truly, Madly, Deeply: Consumers in the Throes of Material Possession Love,” Journal of Consumer Research, 38(2), 323–42.

158
Mandel, Naomi, Derek D. Rucker, Jonathan Levav, and Adam D. Galinsky (2017), “The Compensatory Consumer Behavior Model: How Self-Discrepancies Drive Consumer Behavior,” Journal of Consumer Psychology, 27(1), 133–46. Maner, Jon K., C. Nathan, Roy F. Baumeister, and Mark Schaller (2007), “Does Social Exclusion Motivate Interpersonal Reconnection? Resolving the ‘Porcupine Problem’” Journal
of Personality and Social Psychology, 92(1), 42–55. Martinescu, Elena, Onne Janssen, and Bernard A. Nijstad (2014), “Tell Me the Gossip: The Self- Evaluative Function of Receiving Gossip About Others,” Personality and Social Psychology
Bulletin, 40(12), 1668–80. Park, Lora E. and Jon K. Maner (2009), “Does Self-Threat Promote Social Connection? The Role of Self-Esteem and Contingencies of Self-Worth,” Journal of Personality and Social
Psychology, 96(1), 203–17. Peng, Xiaozhe, You Li, Pengfei Wang, Lei Mo, and Qi Chen (2015), “The Ugly Truth: Negative Gossip about Celebrities and Positive Gossip about Self Entertain People in Different Ways,” Social Neuroscience, 10(3), 320–36. Raghunathan, Rajagopal and Yaacov Trope (2002), “Walking the Tightrope between Feeling Good and Being Accurate: Mood as a Resource in Processing Persuasive Messages,” Journal of Personality and Social Psychology, 83(3), 510–25. Synder, C. R., MaryAnne Lassegard, and Carol E. Ford (1986), “Distancing after Group Success and Failure: Basking in Reflected Glory and Cutting off Reflected Failure,” Journal of
Personality and Social Psychology, 51(2), 382–88. Teng, F. and Z. Chen (2012), “Does Social Support Reduce Distress Caused by Ostracism? It Depends on the Level of One’s Self-Esteem,” Journal of Experimental Social Psychology, 48(5), 1192-95. Wert, Sarah R. and Peter Salovey (2004), “A Social Comparison Account of Gossip,” Review
of General Psychology, 8(2), 122–37. Winterich, Karen Page, Manish Gangwar, and Rajdeep Grewal (2016), “When Celebrities Count: Power Distance and Celebrity Endorsements,” Working Paper (retrieved from
www.researchate.net). Zhang, Yinlong, Karen Page Winterich, and Vikas Mittal (2010), “Power Distance Belief and Impulsive Buying,” Journal of Marketing Research, 47(5), 945–54.
159
Is Nostalgia Always Salutary? Effects of Post-crisis Nostalgia-themed Advertisements on
Brand Affect and Brand Trust
Xavier Catherine, Raj Raghunathan & Tanuka Ghoshal
Indian School of Business, Hyderabad
Extended Abstract
Crisis situations take a toll on any company’s finances, sales and reputation. Most times, as crisis
situations are unprecedented and require immediate handling, companies are ill-prepared to deal
with them. Further still, companies that are wriggling out of a crisis, struggle with designing post-
crisis communication that can help in retaining and restoring consumer confidence and trust. Prior
research has shown that advertisements have long been used as post-crisis communication to
provide consumers with reassurances of the quality, credibility, and safety of the product.
Considering that nostalgia is a desirable longing for past good things, one would imagine that our
knowledge of the use and effectiveness of nostalgia-themed advertisements in crisis situations,
would be rich and informative. Surprisingly, research examining the use of nostalgia-themed
advertisements and their effectiveness during post-crisis communication is very sparse. Though
companies’ use of nostalgia-themed advertisements as post-crisis communication is widely
prevalent in the marketplace, expect for case studies, a systematic empirical investigation of the
same, is missing. This research is designed to address this gap. It is aimed to contribute to the
academic literature, by examining the influence of post-crisis nostalgia-themed advertisements on
brand affect and brand trust. Using attribution theory, the study posits that consumers’ attributions
of blame for the crisis and the nature of the crisis moderate the relationship between nostalgia-
themed advertisements and brand affect and brand trust. The researchers aim to empirically
examine the differential salutary (unsalutary) effects of nostalgia-themed advertisements based on
consumers’ attributions of blame and the nature of the crisis to provide greater insights to
companies on ‘when’ to use (disuse) post-crisis nostalgia-themed advertisements.
160
The objectives and contributions of this research project include:
Examining and understanding “When” companies can make effective use (disuse) of nostalgia-
themed advertisements after a crisis. These insights can help companies to design effective post-
crisis advertising strategies based on the psychology of the target audience in crisis situations,
rather than following a trial-and-error approach, as is currently done by most companies.
Understanding sparsely studied crisis consumer psychology and consumer reactions post-crisis.
This in turn, will aid the development of effective communication strategies to regain consumer
trust and confidence in post-crisis situations. The findings will also enrich the post-crisis
communication literature related to the examination of consumers as major stakeholders.
Extending the findings of the study to aid marketers and advertisers in relation to the content,
design and delivery of nostalgia-themed advertisements so that maximum positive impact can be
gained for both companies and consumers.
Examining key research questions: 1) Are post-crisis nostalgia-themed advertisements the mantra
to enhancing brand affect and brand trust in consumers? 2) What factors affect/influence (aka,
mediate/moderate) the relationship between post-crisis nostalgia-themed advertisements and
brand affect and brand trust post-crisis?
Examining both positive (salutary) and negative (unsalutary) outcomes of nostalgia in a less-
examined context such as post-crisis, as opposed to prior research that has focused only on positive
outcomes.
Brief Literature Review and Conceptual Foundation
Why post-crisis communication with consumers is important?
Post-crisis communication is pivotal to the sustenance of a company that has recently faced a crisis.
The crisis-management literature informs us that one of the biggest threats arising from a crisis is
the loss of reputation that can affect stakeholders’ relations with the company (Coombs, 2007).
Therefore, post-crisis communication with stakeholders is used to as a tool to repair/to arrest
further reputational damage (Coombs and Holladay, 2005). While the post-crisis management
literature has adequately examined post-crisis communication with different segments of
stakeholders such as shareholders, employees, and suppliers, one important segment, namely
consumers, has been largely overlooked. Theoretical insights about post-crisis communication
with consumers is sparse as a very limited number of studies has focused on consumer evaluations
of post-crisis communication (see Ahluwalia, Burnkrant, and Unnava 2000; Chen et al., 2009) and
its effectiveness. This paucity is glaring as consumers are significant stakeholders: attracting,
retaining and generating loyalty from consumers is critical to the long-term financial success of a
company. Product harm crisis, in particular are clearly undesirable because they can distort
consumers’ favorable brand perceptions, tarnish a company’s reputation, destroy a company’s
brand equity, and cause huge financial losses owing to reduced market share and falling revenue
(Cleeren, Dekimpe, and Helsen, 2008; Chen, Ganesan, and Liu 2009; Thirumalai and Sinha 2011).

161
Further, product harm crisis that affect consumers the most, has become increasingly common and
preponderous (Ahluwalia et al., 2000). For example, in India alone, there have been several
examples of product crisis that have rattled consumers: Cadbury’s worms’ crisis,1 Pepsi and
Coke’s pesticide controversy, and Maggi’s high lead content are some examples. A crisis tends to
affect consumers the most; limited prior research informs us that when a crisis strikes a company,
customers tend to evaluate their relationship with the company. Post-crisis, consumers choose to
either continue with the brand or head in another direction; In fact, studies have shown that when
crisis hits the company, then wrongdoing/attributions of wrongdoing is likely to affect consumers’
purchase of the company’s products and services (see Brian K. Jorgensen, 1996). Thus,
examination of consumers in post-crisis situations stands warranted.
Companies are ill prepared for post-crisis communication with consumers. Though post-crisis
communication is so important for the sustenance of a company, most companies struggle to
communicate after a crisis. Firstly, companies are ill prepared to handle crisis (Dawar and Pillutla,
2000). Secondly, what makes it worse is that they are even lesser prepared with their post-crisis
communication strategy. For example, In India, the food conglomerate, Nestle, was recently in the
eye of a storm when its market-leading noodles called Maggi was banned in India because of its
excessive levels of lead and monosodium glutamate. Eventually, the ban on Maggi was lifted, but
not before the company recalled the products for fear that consumers’ trust had been compromised
(The Economist, June 30, 2015).2 When Maggi was reintroduced into the market, the company
first adopted an advertising approach that focused on highlighting “safety”. After a few months,
in the light of reduced revenues, Nestle India shifted to ‘nostalgia advertising’ as part of recovery
management that focused on ‘memories, good times, and fond moments with Maggi’.3 Despite all
this, the theoretical underpinnings for the use and effectiveness of post-crisis communication
strategies with consumers, do not exist. The recent increase in product crisis and companies’
increased use of post-crisis communication call for greater empirical examination that can lead to
a more precise theoretical understanding of the concept.
Using nostalgia-themed advertisements as post-crisis communication:
Nostalgia, a collection of fond and meaningful memories that makes individuals feel sentimental,
tender or happy (Lasaleta, Sedikides, & Vohs, 2014) is used extensively in advertisements (Latour
et al., 2013; Sullivan, 2009) to positively impact consumers. Specifically, studies have shown that
nostalgia advertisements created positive reactions and attitudes towards the advertisement and the
brand; it was also shown to increased purchase intentions (see Sprott and Meuhling, 2002) while
promoting positive and emotional factors that increased consumer preference for the brand
(Reisenwitz, Iyer, and Cutler, 2004; Sierra and McQuitty, 2007). The use of nostalgia-themed
advertisements in post-crisis communication is more prevalent than commonly believed. Latour et
al., (2013) point out that during crisis, many marketers use nostalgia to create comfort and to boost
sales in tough times. Strangely though, despite its widespread use, nostalgia advertising as post-
crisis communication has not been addressed theoretically or empirically. Ahluwalia et al., (2000)
contend that there is very little theoretical research on how consumers process negative publicity
information during or after a crisis, thereby, leaving companies less equipped to develop strategies
to combat its effects.
Research indicates that in times of crisis, companies try to shore up positive associations while
down playing negative information (see Monga and John, 2008). One-way of doing this to use

162
nostalgia advertising to encourage consumers ‘to return to their past’ (Meuhling and Sprott, 2004).
The use of nostalgia during post-crisis could stem (see Meuhling and Pascal, 2012) from
nostalgia’s capacity to counteract distress and to restore psychological equanimity as individuals
may be more susceptible to nostalgic influences arising during stressful situations such as a crisis.
Extending this idea, we suggest that in times of crisis, companies can use nostalgia-themed
advertisements to create pro-brand sentiments by shoring up positive associations with the brand
owing to the following three reasons: 1) Nostalgia helps consumers evaluate past events favorably
and to connect past events’ relevance to the present event (see Lasaleta, Sedikides, & Vohs, 2014).
This positive favorable evaluation of the past and its subsequent relation to the present can be of
utmost importance during a post-crisis when consumers’ trust has been shaken. Nostalgic
advertisements help in downplaying the negative effect of the crisis in the minds of consumers by
focusing on the emotional connection that consumers enjoyed with the brand in the past. 2) The
appeal of nostalgia will be greater in a crisis situations because an external reference is not used:
consumers are comparing their present with their own past. As consumers tend to trust their
personal lived memories more than vicariously learned ones, post-crisis nostalgia is more likely to
lead to positive evaluation of the consumers’ relation with the brand (Bartier, 2011). 3) Nostalgia
is a coping mechanism (see Bambauer-Sachse and Gierl, 2009) that helps consumers come to terms
with the present crisis circumstances or uncertainties about the future.
The million dollar question: Is nostalgia advertising the mantra to handling all crisis situations?
Though the use of post-crisis nostalgia-themed advertisements is common, an examination of
‘when’ and ‘what factors’ determine their use and effectiveness, is missing. Thereby, an
understanding of whether all nostalgia-themed advertisements result in positive customer-brand
relationships, is ambiguous. What we know from prior research is that nostalgic experiences can
result in both positive and negative emotional responses (Holak and Havelan, 1998). Though
research findings (see Reisenwitz, Iyer, and Cutler, 2004) show that nostalgia-themed
advertisements positively influence consumers’ attitudes towards the product and product
intention, it needs to be examined if these findings will hold in post-crisis situations as well. It is
not clear whether nostalgia-themed advertisements will have the same positive effect on consumer
evaluations in all crisis situations. Nestle (mentioned earlier) successfully used nostalgia
advertising during the post-Maggi crisis, while Cadburys, Pepsi and Coke chose to tread the non-
nostalgia route. That begs the question: Is nostalgia advertising the mantra to handle crisis in all
crisis situations? “When” is post-crisis nostalgia effective? “What” factors determine its
effectiveness? This needs empirical examination: on the one hand, because nostalgia advertising
appeals to the emotions of the consumer, it is likely to enhance the emotional bonding that the
consumer has with the brand. On the other hand, nostalgia advertisements could also be subtle
reminders of how the brand breached consumer trust in times of crisis ---in which case, the effect
of nostalgic advertisements will negatively influence consumer-brand relationship evaluations.
An important concept that researchers have been examining in relation to consumer-brand
relationship is whether the company has committed a transgression that has led to a crisis. The
research findings on consumer-brand relationship in the context of a crisis remains inconclusive
(see Chung and Beverland, 2006). Some studies demonstrated that crisis do not affect consumer-
brand relationships negatively (Mattila, 2001), while other studies showed consumer-brand
relations did suffer in case of crisis (Aaker et al. 2004). These findings are of particular interest to
this study because they provide evidence that post-crisis customer-brand relationships are
moderated/mediated by other factors that need examination.

163
Consumers’ attributions of blame
Attribution theory and its linkage with crisis situations (see Coombs, 2007) informs us that
stakeholders will access crisis responsibility to make judgements whether the crisis was a result of
situation factors or something that the company did. Coombs and Holladay (2005) suggest that
stakeholders’ attributions have affective and behavioral consequences, in that, if the company is
deemed responsible, stakeholders are likely to exit the relationship with the company or spread
negative word of mouth.

164
Exploring the Impact of Self-Service Technologies on Retail Shoppers: A Multi-national
Investigation in UK and Australia
Akiko Ueno; Piyush Sharma; Russel Kingshott
Middlesex University, UK; Curtin University, Australia
Abstract : Prior research shows a mixed response from shoppers to the use of self-service
technologies (SST) in the retail sector, which includes both machine assisted (on-site) and
electronic (off-site) services. For example, SCMs were first introduced in both UK and Australia
about a decade back by major supermarket chains aiming to make the customer checkout
experience more efficient. However, recent surveys of shoppers in these two countries show
contrasting results, with many UK shoppers claiming that they had never used self-checkout
machines (SCM) that they need help when using these. In contrast, most Australian shoppers are
quite satisfied with their experience of using SCM and they feel more confident in using these.
Similar results are reported for online grocery shopping more than half of UK consumers (55%)
not using online shopping for groceries and only 10% claiming that they always do their grocery
shopping online, which is exactly the opposite of shoppers in Australia, majority of whom claim
to regularly shop online. We aim to explore and understand these contrasting results in these two
countries using two field-survey based studies. We find significant differences between the
shoppers in the two countries in the extent to which perceived quality and customer satisfaction
with each checkout method (staffed, self or online) affect customers’ overall perceived quality,
satisfaction and loyalty towards the store. We discuss the theoretical contribution and managerial
implications of these differences in the paper.
Keywords: Checkout method, Retail shopping, Self-service technology (SST), Online shopping

165
Role of Customer-Acquiescence in Business-to-Business Markets: Exploring the Antecedents
and Consequences
Liane W.Y. Lee, Leslie S.C. Yip & Xubing Zhang
Technological and Higher Education Institute of Hong Kong & Hong Kong Polytechnic
University
Introduction and Research Aim
One of the key strategies adopted by manufacturers is the ability to cater and accept extensive
tailor-made requests by the customer to support their sourcing decision. Using the acquiescence
concept defined in key mediating variable (KMV) model of relationship marketing, this study
examines the antecedents, moderators and outcomes of acquiescence behavior in a business to
business setting.
The aim of the research is: To investigate the antecedents of customer-acquiescence as a
manufacturer’s strategy, the moderating factors as well as the buyer’s outcomes when the
manufacturer adopts a customer-acquiescence strategy.
We address three questions in line with this aim:
RQ1: What are the antecedents of manufacturers’ customer-acquiescence behavior?
RQ2: What are the moderators of the manufacturers’ customer-acquiescence strategy?
RQ3: What are the buyer’s sourcing decision outcomes when a manufacturer adopts a
customer-acquiescence strategy?
Conceptual Model
In order to answer the research question, a conceptual model is proposed based on the acquiescence
construct established in Morgan and Hunt (1994) key mediating variable model (KMV) of
relationship marketing. The model tests for related antecedents for acquiescence, including buyer-
manufacturer power asymmetry (Heide, 2003; Lacoste & Blois, 2015), manufacturer’s technical
capability, and component supplier-buyer relational tie (Dwyer, Schurr & Oh, 1987; Granovetter,
1983). In addition, we test manufacturer’s pre-purchase detailing efforts as well as their post-
purchase influence strategy as moderators of acquiescence strategy. Finally, the buyer’s outcomes
of manufacturer’s acquiescence strategy will be measured through channel power maintenance
(Ireland & Webb, 2007), outcome certainty, sourcing flexibility and information diversity.
Methodology
A quantitative questionnaire survey method using regression analysis was used to test and validate
the conceptual framework. The tests of the hypotheses use a sample of 212 coal mine operators
who are customers of key mining machinery and key mining components suppliers.
Implications for Theory and Practice: The study adds to relationship marketing theory of the
concept of acquiescence in a business-to-business market setting. The findings provide strategic

166
and operational insights for suppliers who wish to secure key relationships when buyers need to
make key procurement decisions.
References
Dwyer, F., Schurr, P., & Oh, S. (1987). Developing buyer-seller relationships. Journal of
Marketing, 51(2), 11. doi:10.2307/1251126
Granovetter, M. (1983). The strength of weak ties: A network theory revisited. Sociological
Theory, 1(1), 201-223. doi:10.2307/202051
Heide, J. B. (2003). Plural governance in industrial purchasing. Journal of Marketing, 67(4), 18-
29.
Ireland, R., & Webb, J. (2007). A multi-theoretic perspective on trust and power in strategic
supply chains. Journal of Operations Management, 25(2), 482-497.
doi:10.1016/j.jom.2006.05.004
Lacoste, S., & Blois, K. (2015). Suppliers’ power relationships with industrial key customers.
Journal of Business & Industrial Marketing, 30(5), 562-571. doi:10.1108/jbim-03-2013-
0057
Morgan, R. M., & Hunt, S. D. (1994). The commitment-trust theory of relationship marketing.
Journal of Marketing, 58(3), 20-38. doi:10.2307/1252308
167
Examining Psychological Engagement, Empowerment and Entitlement on Co-Creation in
Virtual Communities
Leo Cheryl, Chou Cindy Yunhsin & Chen Tom
Murdoch University, Australia, University of Newcastle, Australia
Virtual communities depend on the participation of consumers and there are high failure rates
(Brodie et al., 2013; Ling et al., 2005). Studies on virtual communities discussed both the
psychological barriers and motivations behind participation (Füller, 2006), however none have
holistically examined the motivational states that prompt individuals to give and contribute in
virtual development activities. This paper theorises three specific psychological states that
contribute to value co-creation in a virtual community: psychological empowerment, engagement
and entitlement.
Psychological empowerment is a cognitive psychological state that reflects a consumer’s
perception of meaningfulness, competence, and self-determination (Bandura, 1977; Spreitzer,
1995). Empowerment beliefs have been shown to drive co-creation experiences (Verleye, 2015).
We propose H1: Empowerment positively drives value co-creation behaviour. Engagement is a
psychological state consisting of cognitive, affective, and behavioural dimensions (Brodie et al.,
2011; Kahn, 1990). Engagement arises when people invest their self-energies (Kahn, 1990) and
has been shown to fuel efforts towards effort and energy towards co-creation. We propose H2:
Engagement positively drives value co-creation behaviour. Psychological entitlement reflects
refers to the affective and motivational imperative that people develop on the basis of perceived
outcomes and attributes (Lerner, 1987). Emerging studies show the psychological state drives
voice and change within organisations (Klimchak et al., 2016; Zitek and Vincent, 2015). We
propose H3: Entitlement positively drives value co-creation behaviour.
An online survey utilising data of N=494 Taiwanese consumers who had previously been or are
currently customers engaged in a firm-hosted virtual community was conducted. Purposive and
snowball sampling strategies were used for recruitment. Existing measures of psychological
empowerment, psychological engagement, psychological entitlement, and value co-creation
behaviours were adopted from the literature. The data was analysed quantitatively using Structural
Equation Modelling (SEM) using AMOS. The results indicate the three psychological states
significantly influenced customer value co-creation. In addition, a post-hoc analysis demonstrate
entitlement relate positively the specific to the dimension of customer participation behaviour, but
not the dimension of customer citizenship behaviour.
Results of this study contribute to theoretical understanding of a range of psychological states
when consumers engage in co-creation within a virtual community. It provides a refined
understanding of affiliative and non-affiliative psychological states on distinct co-creation
behaviours. This study present significant implication for service managers to manage virtual
communities and to encourage specific co-creation practices online.
Keywords: psychological states, co-creation, virtual community
168
The Changing Role of Salespeople and the Unchanging Feeling toward Selling: Implications
for Pursuit of Sales Careers by Business Graduates
Silvio Cardinali, Graziella Pacelli & Luca Ballestra
Università Politecnica delle Marche, Italy
Abstract
As the pervasiveness of professional selling continues to grow and expand, salespeople’s
approaches to selling also are evolving. In the past, salespeople adopted a sales orientation that
focused on discrete exchanges through aggressive and sometimes unethical sales tactics to
maximize short-run sales volume. Rather than developing an understanding of the customer’s
needs in order to offer products with a superior value, salespeople focused on pushing existing
products with little or no regard as to the needs of those customers (Weitz & Bradford, 1999).
Today, more and more organizations are striving to adopt and implement the marketing concept
and a customer orientation in their selling activities (Manning, Reece, & Ahearne, 2010). Such an
orientation, with a focus on understanding and fulfilling consumer’s needs by means of adopting
customer-oriented strategies, which include long-term profitability and integrated marketing
efforts, implies that the goal of the salesperson has changed significantly.
Over the last five decades, several studies have shown how students’ reticence toward
choosing a sales career has remained constant. The lack of awareness and misconceptions
regarding a sales job are two of the main reasons behind this negative perception and the lack of
students’ “work readiness.”
In order to meet this ever-increasing demand for qualified salespeople, companies have
often turned to universities for a pool of potential sales recruits (Amin, Hayajneh, & Nwakanma,
1995; Swenson, Swinyard, Langrehr, & Smith, 1993; Weeks & Muehling, 1987; Wiles & Spiro,
2004). College students are attractive recruits largely because they are perceived as being young,
intelligent, and capable of learning and adapting quickly (Caballero & Walker, 2010; Dubinsky,
1980; Lysonski & Druvasula, 1998). Therefore, to the companies’ eyes, college graduates seem to
be “work ready” to succeed in the changing sales landscape (Peltier, Cummins, Pomirleanu, Cross,
& Simon, 2014; Weilbaker & Williams, 2006).
169
Over the past five decades, a rich literature base has developed on the appeal of personal
selling as a career, mostly for U.S. students and recently for U.K. students (Fournier, Chéron,
Tanner, Bikanda, & Wise, 2014). However, very little attention has been focused on students
outside the Anglo-Saxon countries. According to Cummins, Peltier, Erffmeyer, and Whalen
(2013), there are few articles with a non-U.S. sample that explore the perceptions of sales, and,
according to Lee et al. (2007). According to Cummins, Peltier, Erffmeyer, and Whalen (2013),
there are few articles with a non-U.S. sample that explore the perceptions of sales, and, according
to Lee et al. (2007), there is little concrete insight available in to the way salespeople are viewed
in Europe and emerging countries. Exploring these issues from an international perspective may
be important for a variety of reasons, such as the fact that different countries perceive the relative
importance and prestige of sales positions in different ways.
A survey was carried out in a western and emerging countries involving students coming
from the most generic First Cycle Degree Program (Bachelor), Business Administration.
Based on the conceptual model on student intention to pursue a sales career developed by
Karakaya et al. (2011), this study want to: (a) understand if students recognize the changes of the
salespeople’s role; (b) investigate if the understanding of these changes has an impact on students’
feelings and perceptions of selling as a career choice; (c) understand if the salespeople’s role is
similar in different nations.
References
Honeycutt, E. D., Jr., Ford, J. B., Swenson, M. J., & Swinyard, W. R. (1999). Student preferences
for sales careers around the Pacific Rim. Industrial Marketing Management, 28, 27-36.
Karakaya, F., Quigley, C., & Bingham, F. (2011). A cross-national investigation of student
intentions to pursue a sales career. Journal of Marketing Education, 33(1), 18-27.
Peltier, J. W., Cummins, S., Pomirleanu, N., Cross, J., & Simon, R. (2014). A parsimonious
instrument for predicting students’ intent to pursue a sales career: Scale development and
validation. Journal of Marketing Education, 36(1), 62-74.
Terho, H., Eggert, A., Haas, A., & Ulaga, W. (2015). How sales strategy translates into
performance: The role of salesperson customer orientation and value-based selling.
Industrial Marketing Management, 45(February), 12-21.
Weitz, B. A., & Bradford, K. D. (1999). Personal selling and sales management: A relationship
marketing perspective. Journal of the Academy of Marketing Science, 27(2), 241-254.

170
The Impact of Multifactorial Gender on the Evaluation of de-gendered Brand offerings
Nivedita Bhanja & Ritu Mehta
Indian Institute of Management, Calcutta
Introduction
Gender remains one of the central divisions of society (Fenstermaker 2002). In view of this, we
are conditioned to perform one or the other gender identity, thus making our consumption practices
highly gendered (Fischer & Arnold 1994). Many of the products we use are gendered comprising
separate variants for males and females. There are products that are gendered in categories like
personal care, apparel & accessories - starting from face-wash and perfume to sunglasses and
handkerchief. Similarly, certain brands are strongly identified with either masculinity or
femininity. For instance, Hugo Boss and Chanel are perceived as masculine and feminine brands
respectively (Jung & Lee 2006). However, owing to backlash from certain sections of the media,
feminist forums, and consumer feedback, firms have begun paying attention to what is termed as
„gender neutral marketing‟. Research establishes that gender-neutral marketing rids kids from
gender stereotypes and enables them to fully realize their potential (Weisgram et al, 2014).
Responding to similar concerns, Target, the US based retailer decided to have genderless toy aisles
in its stores (Hains, 2015). Marketing efforts towards providing a de-gendered buying experience
implies removal of any form of gender based labeling from products and brands. This is a
marketing move triggered partly in the wake of a wider discourse around the need to establish an
egalitarian social set-up and blurring of gender boundaries, and partly by the business need to cater
to a segment willing to don a unisex image. More recently, Selfridges, the London based premium
retailer remodeled parts of its store into gender-neutral shopping areas; and Zara, the apparel
retailer launched its line of unisex clothing named Ungendered (The Atlantic 2015; The
Independent 2016). From a marketer‟s perspective, it would be interesting to assess consumers‟
responses to de-gendering. How would most consumers react to a de-gendered offering from a
brand that is traditionally perceived as masculine or feminine?
Theoretical Framework - Multifactorial Gender of the Consumer
Biological gender being a given, an individual has little agency in the „choice‟ of his or her gender.
However, having said that other aspects of the gender like individual gender identity and gender
role attitude (Carter 2014) would influence the significance one attaches to ones biologically
determined gender as social identity. At the outset it is important to have clarity w.r.t three aspects
of gender as a construct: biological gender, psychological gender identity and gender role attitudes
(Fischer & Arnold 1994).Gender as combination of biological sex, psychological gender, and
gender attitudes influences consumption choices (Ulrich 2013; Ye & Robertson, 2012). Different
aspects of gender that contribute to one‟s self-concept such as:
Biological Sex – How males and females make different consumption/purchase decisions
(Morris & Cundiff 1971; Stutville 1971; Lee 2006).

171
Gender Identity/gendered personality qualities-The extent to which one identifies oneself
with masculine and feminine/ personality traits and how it influences consumption choices
(Fischer & Arnold, 1990; 1994; Ulrich 2013).
Gender Role Attitudes: Beliefs about the gender roles corresponding to men and women
considered appropriate and how this impacts consumption (Fischer & Arnold1994; Ulrich 2013).
This role attitude reflects the approach of the individual to gender roles distribution - whether
believes in egalitarian or traditional role distribution. However, it is to be noted that this construct
captures only the attitude towards gender roles, but not how the individual actually behaves in real
life.
Extant literature in marketing and consumer behaviour at some length discusses about acceptance
of feminine/masculine products by males/females (Morris & Cundiff 1971; Stuteville 1971),
evaluation and consumer responses of cross-gender brand extensions (Jung & Lee 2006; Ulrich
2013) and gender bending marketing efforts wherein a gendered brand targets the other gender
(Avery 2012). The findings of these studies highlight that females using masculine products or
brands is more acceptable than the other way round (Stuteville 1971). In addition, males are more
likely to purchase gender congruent products and brands than females (Fugate & Phillips 2010).
This could be explained by the unequal status accorded to masculinity and femininity in most
cultures. Taking up of the consumption practices of the men by women is seen as women „striving‟
to move higher up on the social ladder; whereas men trying to become feminine fail to get social
approval (Stuteville 1971). Gender remains one of the central divisions of society (Fenstermaker
2002). Children spend most part of their formative years with the mother. While a girl learns what
it means to be „feminine‟ from her mother, a boy learns it as a process of discarding what denotes
femininity. “Boys come to recognize that what they are supposed to be is what their mothers are
not. Rejecting femininity is then consonant with denigrating femininity, so that tasks, traits, and
qualities associated with being feminine are considered less socially valuable than are tasks, traits,
and qualities associates with being masculine” (Beall 2004, p. 156).
Scope of the Study
In the context of de-gendered market offerings the objective of the study is to infer if the gender
in its multifactorial form has any significant influence on consumer responses towards a de-
gendered offering. Biological sex, as a variable has been shown to significantly influence
consumption behaviour in a wide range of studies. However, in most of these studies other aspects
of the broader construct of gender were not considered. Gender in such studies was essentially
operationalized as male or female. Recently, consumer researchers have begun to incorporate
constructs such as the gender identity and the attitude to gender roles. But accurate
operationalization of these constructs continues to remain a challenge for researchers.
Despite changing gender norms and roles and blurring of boundaries, possession of symbols of
masculinity and its display in various forms seem to be more valued than the same for femininity.
Stereotypical feminine traits like nurturance and empathy are best seen as qualities to be expressed
in the private sphere of home whereas masculine characters of dominance and aggression in the
public sphere. As society progresses and more women join public spheres, the socio-economic
status of women improves too. The notion of a woman appropriating masculine consumption
practices is possibly more resisted in traditional set-ups and more acceptable in
172
vegalitarian and progressive societies; nevertheless masculinity is universally more valued as a
symbol of authority, power and achievement. Men from egalitarian social settings would be more
open to the idea of women taking on „masculine‟ roles or traits and encourage this „upward‟
movement of women but may not be equally receptive to the idea of men becoming feminine.
Taking up of the consumption practices of the men by women is seen as women „striving‟ to move
higher up on the social ladder. But men trying to become feminine even today mostly fail to get
social approval (Stuteville 1971). This could be explained by the unequal status accorded to
masculinity and femininity in most cultures. More often than not, there is a perception of one-one
correspondence between men – masculinity and female-femininity. So a woman invariably is
associated with femininity and a man with masculinity, masculinity being the more valued trait of
the two. So why should a man irrespective of his psychological gender identity (masculinity or
femininity) and attitude to gender roles (traditional vs. egalitarian) give away something highly
held and more valued by society, bestowed upon him by the virtue of his birth? He is more likely
to be possessive about products and brands that maintain this „distinction‟ between masculinity
and femininity, more specifically between males and females. So evaluation of a de-gendered
offering is by a given biological sex is likely to be moderated by the gender identity as well as the
attitude to gender-roles of the individual concerned. Like gender identity, the construct of attitude
to gender roles, too captures the degree to which an individual identifies with the differences
between the sexes. The more someone identifies with the differences between the sexes, more
gendered is going to be his/her trait, attitude and hence behavior. A part of one‟s gendered behavior
is likely to be explained by one‟s trait or personality which is the gender identity of the individual;
and a part of it is explained by his/her attitude to traditional gender-roles.
The current study looks into this relationship between multifactorial gender and responses to
brand-degendering through a quantitative experimental study.
References:
Avery, J. (2012).Defending the markers of masculinity: Consumer resistance to brand gender
bending. International Journal of Research in Marketing, 29(4), 322-336.
Belk, R. (1988). Possessions and the extended self. Journal of Consumer Research, Vol. 15, No.
2 (Sep., 1988), pp. 139-168
Eagly, A. H., Beall, A. E., & Sternberg, R. J. (Eds.). (2004). The psychology of gender. Guilford
Press.
Carter, Michael J. "Gender socialization and identity theory." Social Sciences 3, no. 2 (2014):
242-263.
Fenstermaker, S., & West, C. (2002). Doing gender, doing difference: Inequality, power, and
institutional change. Psychology Press.
Fischer, E., & Arnold, S. J. (1994). Sex, gender identity, gender role attitudes, and consumer
behaviour. Psychology & Marketing, 11(2), 163-182.

173
Fugate, D. L., & Phillips, J. (2010). Product gender perceptions and antecedents of product
gender congruence. Journal of Consumer Marketing, 27(3), 251-261
Hains, R. (2015). Target will stop labelling toys for boys or for girls. Good. The Washington
Post, August 13, 2015.
Retrieved from https://www.washingtonpost.com on May 10, 2016
Lee, W. (2006). Cross-gender brand extensions: Effects of gender of the brand, gender of
consumer, and product type on evaluation of cross-gender extensions. Advances in consumer
research, 33.
Morris, G. P., & Cundiff, E. W. (1971). Acceptance by males of feminine products. Journal of
Marketing Research, 8(3), 372-374.
Stutevile. Jr. (1971).Sexually polarized products and advertising strategy. Journal of Retailing,
47(2), 3-13.
The Atlantic (2015). A Brief History of Unisex Fashion. Retrieved from
http://www.theatlantic.com on June 30, 2016
The Independent (2016). Zara joins the gender fluid movement with new unisex clothing line.
Retrieved from http://www.independent.co.uk on June 30, 2016
Ulrich, I. (2013). The effect of consumer multifactorial gender and biological sex on the
evaluation of Cross‐Gender brand extensions. Psychology & Marketing, 30(9), 794-810.
Weisgram, E. S., Fulcher, M., & Dinella, L. M. (2014). Pink gives girls permission: Exploring
the roles of explicit gender labels and gender-typed colors on preschool children's toy
preferences. Journal of Applied Developmental Psychology, 35(5), 401-409.
Ye, L., & Robertson, T. A. (2012). Gender Identity: Does It Matter for Consumers' Perceptions?
The Journal of Business Diversity, 12(3), 81.
174
Impact of Affective Intensity of Online Reviews on Decision Comfort
Nitin Soni, Sana Ansari & Jagrook Dawra
Indian Institute of Management Raipur
Introduction
An important and open research question in the electronic word of mouth (eWOM) literature is
"How does eWOM change the consumer decision-making journey" (King, Racherla, & Bush,
2014). eWOM can have an impact on stages of decision-making. Different stages of consumers’
decision making include “pre-decision, decision, post-decision/pre-outcome(PDPO),
outcome(experience) and post-outcome” (Parker, Lehmann, & Xie, 2016). This paper contributes
to the literature by investigating the impact of eWOM, more specifically online reviews on a
construct of PDPO decision-making, .i.e., Decision Comfort.
Some of the characteristics of eWOM studied in the context of decision making include its
“Volume, Dispersion, Persistence and Observability, Anonymity and Deception, Salience of
Valence and Community Engagement” (King et al., 2014). This paper contributes to the literature
by investigating the impact of Affective intensity of eWOM on Decision Comfort.
Past Literature
Previous Research on Impact of Online Reviews on Consumer Decision Making: eWOM has been
shown to impact Consumers’ willingness to pay in a product category, consumer engagement and
levels of trusts and loyalty, purchase intention (Park, Lee, & Han, 2007) (King et al., 2014). The
impact of the valence of a review is inconclusive. Ludwig et al., (2013) have shown positive
valence of a review of an online retailer influences that retailers' conversion rates. Other
researchers such as Chevalier & Mayzlin (2006); Baum & Spann (2014) have shown that valence
of a review can have a persuasive impact on review readers' attitudes. On the other hand
researchers such as P.-Y. Chen, Wu, & Yoon (2004) have shown that valence of a review has no
influence on review readers' choices. Some of the moderators on the relationship between valence
of a review and review reader's choice include product popularity information (Ma, Khansa, Deng,
& Kim, 2013) and product variety (Zhu & Zhang, 2010).
Pleasure Arousal Theory and Intensity of Emotions: According to Pleasure Arousal Theory of
emotions, “the core affect of an emotion is described by two continuous, bipolar and orthogonal
dimensions: pleasure-displeasure (represented as P)and arousal-sleep or activation-deactivation
(represented as A)” (Russell, 2003). This scale doesn't account for the relative intensity of
emotions. That is, this scale doesn't account for the fact that people are little, somewhat, or very
angry, .i.e., the intensity of emotions. According to Frijda, Ortony, Sonnemans, & Clore (1992),
ignoring the intensity of affect in any study may lead to misinterpretations of empirical findings.
Reisenzein (1994) included intensity in Pleasure-Arousal Model. According to Reisenzein, (1994),
“Emotion Quality is determined by the proportion of P and A and Emotion Intensity is determined
by an absolute degree or values of P and A.”
Decision Comfort: Parker, Lehmann, & Xie (2016) introduced the construct of Decision Comfort
to capture the following elements of post-decision pre-outcome experience: “the extent to which
consumers feel comfortable with a decision.” Parker et al. (2016) define decision comfort as “the

175
degree of psychological and physiological ease, contentment, and well-being one feels in relation
to a specific decision.”
Parker et al. (2016) distinguish Decision Comfort from Decision Confidence by stating that the
Decision Confidence is driven by comparison between what was chosen and what was foregone,
whereas Decision Comfort, which measures one's' sense of contentment between the choice, does
not necessarily depends on comparisons - it can be derived from absolute quality of chosen option.
Processing Fluency: According to Alter & Oppenheimer (2009), “Processing Fluency is the
subjective experience of the ease with which people process information.” Alter & Oppenheimer
(2009), identify different instantiations of the fluency in the form of Linguistic Fluency, Perceptual
Fluency, Spatial Fluency etc. A form of linguistic fluency is Lexical Fluency which involves
differential ease of processing and subsequent differential influence on judgments.
Berlyne (1973) showed that people process intermediate level of arousal more fluently than the
high or little level of arousal. Intermediate level of arousal is linked to the moderate complexity of
stimuli, high level of arousal to the high complexity of stimuli and little level of arousal to simple
stimuli (Berlyne, 1973). Also, fluency has been positively linked to confidence in judgments
(Kelley & Lindsay, 1993) and favorable evaluations (Lee & Labroo, 2004).
Based on the above literature review, following are hypothesis 1 & 2
H1: Decision comfort for choosing a product based on an online review with moderate intensity
of expressed emotion will be more than it would be for choosing a product based on reviews with
the low or high intensity of emotions.
H2: Processing fluency of the review mediates the relationship between the emotional intensity of
an online product review and subsequent decision comfort for the choice of that product.
Brakus, Schmitt, & Zhang (2014), found that consumers judged hedonic products with experiential
attributes (the sensory and affective attributes presented in a non-verbal way) more favorably than
they judged utilitarian products with experiential attributes. The reason given by Brakus et al.
(2014) was that processing fluency for hedonic products with experiential attributes was higher
than for utilitarian products with experiential products as experiential attributes were congruent
with hedonic products and not utilitarian products. Extending this reasoning to our context of
online consumer reviews would mean that processing fluency of online reviews with emotional
content would be higher for hedonic products than it would be for utilitarian products. As higher
processing fluency is positively linked to confidence in judgments (Kelley & Lindsay, 1993) and
in this paper's case decision comfort, the third hypothesis is:
H3: The product category about which review is written moderates the relationship between the
emotional content of the review and subsequent processing fluency and decision comfort, the
impact of emotional content on processing fluency and subsequent decision comfort would be
greater for hedonic products as compared to utilitarian products.
Research Methodology
A 2(product category utilitarian vs. hedonic) X 3(review intensity high, low, medium) experiment
with between the subjects design was used to test Hypothesis 1, 2 and 3 using review with positive
affective quality, .i.e., the reviews with an emotion containing a greater proportion of pleasure than
displeasure. To be specific, online reviews embedded with emotion expression of

176
elation/happiness were selected. Direct manipulation of the intensity of review was done using
between the subjects design. 160 participants of the experiment were exposed to three treatment
reviews for products/services of hedonic (heritage hotels) and utilitarian categories (Hospitals).
One treatment review was modified with a modifier denoting low intensity (e.g., slightly happy);
another treatment review was modified with a modifier denoting high intensity (e.g., extremely
happy), and the third treatment review was modified with a modifier for moderate intensity (e.g.
very happy) (Reisenzein, 1994). For each treatment, participants were asked about their likelihood
of choosing the product after reading the review and they were asked to rate the review in terms
of ease of processing (1 = Difficult to process, 7 = Easy to process) using a six-item scale (Chae
& Hoegg, 2013) to assess their processing fluency and they were asked to indicate their subsequent
decision comfort using NC-comfort scale given by Parker et al., (2016). The participants were also
asked about the overall tone of the review shown on a seven-point scale (1=much higher on
excitement, 7=extremely lower on excitement) as a manipulation check of the review intensity.
Results
The mean values of the overall tone of the message for the three review intensities were
significantly different (μlow = 4.32, μmedium = 2.36, μhigh = 1.51, p<0.001). This indicates that
manipulation for review intensities was successful. We found support for H1. The mean value of
decision comfort ( DCmean ) was significantly higher (1=highest, 7=lowest) for reviews with
moderate intensity ( DCmean, moderate = 2.603) than for reviews with low ( DCmean, low = 4.588) and
for reviews with high intensity ( DCmean, moderate = 4.048). We found partial support for H3. Product
category moderated the link between online review intensity and processing fluency (p<0.001).
But there was no moderation effect of product category on the link between affective intensity of
online review and decision comfort. To examine the mediating role of processing fluency, we used
PROCESS Macro (Hayes, 2012). We were unable to find support for H3.
Implications of the Study
Many online B2B and B2C websites and review platforms explicitly ask users to review products
and services. Some websites ask users to restrain their feelings while writing the review while
others ask users to freely express their feelings. The results of this study would shed light on the
impact of affective intensity of an expressed online product review on the subsequent decision
process, in this paper case decision comfort. The results of this paper can help online websites
design guidelines for reviews.
References
Baum, D., & Spann, M. (2014). The interplay between online consumer reviews and
recommender systems: An experimental analysis. International Journal of Electronic
Commerce, 19(1), 129–162.
Berlyne, D. E. (1973). The vicissitudes of aplopathematic and thelematoscopic pneumatology (or
the hydrography of hedonism). Pleasure, Reward, Preference: Their Nature, Determinants,
and Role in Behavior, 1–33.
Chae, B., & Hoegg, J. (2013). The future looks “right”: Effects of the horizontal location of
advertising images on product attitude. Journal of Consumer Research, 40(2), 223–238.
Chen, P.-Y., Wu, S., & Yoon, J. (2004). The impact of online recommendations and consumer

177
feedback on sales. ICIS 2004 Proceedings, 58.
Chevalier, J. A., & Mayzlin, D. (2006). The effect of word of mouth on sales: Online book
reviews. Journal of Marketing Research, 43(3), 345–354.
Frijda, N. H., Ortony, A., Sonnemans, J., & Clore, G. L. (1992). The complexity of intensity:
Issues concerning the structure of emotion intensity.
Hayes, A. F. (2012). PROCESS: A versatile computational tool for observed variable mediation,
moderation, and conditional process modeling. University of Kansas, KS.
Kelley, C. M., & Lindsay, D. S. (1993). Remembering mistaken for knowing: Ease of retrieval
as a basis for confidence in answers to general knowledge questions. Journal of Memory
and Language, 32(1), 1.
King, R. A., Racherla, P., & Bush, V. D. (2014). What we know and don’t know about online
word-of-mouth: A review and synthesis of the literature. Journal of Interactive Marketing,
28(3), 167–183.
Lee, A. Y., & Labroo, A. A. (2004). The effect of conceptual and perceptual fluency on brand
evaluation. Journal of Marketing Research, 41(2), 151–165.
Ludwig, S., De Ruyter, K., Friedman, M., Brüggen, E. C., Wetzels, M., & Pfann, G. (2013).
More than words: The influence of affective content and linguistic style matches in online
reviews on conversion rates. Journal of Marketing, 77(1), 87–103.
Ma, X., Khansa, L., Deng, Y., & Kim, S. S. (2013). Impact of prior reviews on the subsequent
review process in reputation systems. Journal of Management Information Systems, 30(3),
279–310.
Park, D.-H., Lee, J., & Han, I. (2007). The effect of on-line consumer reviews on consumer
purchasing intention: The moderating role of involvement. International Journal of
Electronic Commerce, 11(4), 125–148.
Parker, J. R., Lehmann, D. R., & Xie, Y. (2016). Decision Comfort. Journal of Consumer
Research, ucw010.
Reisenzein, R. (1994). Pleasure-arousal theory and the intensity of emotions. Journal of
Personality and Social Psychology, 67(3), 525.
Russell, J. A. (2003). Core affect and the psychological construction of emotion. Psychological
Review, 110(1), 145.
Zhu, F., & Zhang, X. (2010). Impact of online consumer reviews on sales: The moderating role
of product and consumer characteristics. Journal of Marketing, 74(2), 133–148.
178
What makes consumers buy organic products: Determinants of purchase of organic milk
Vivek K .Dubey
Organic products are now considered growing part of a retailer’s product-line. As costs for such
products improve the manufacturers are able to compete better with regular products. We consider
organic milk as a case in point. The impact of demographics the learning/learning ability of an
individual, budget constraints, occupation status, and family size are considered. On the other hand
retailer actions that may influence a consumer decision to buy, such as price, discounts, and
information are considered. We consider organic milk purchase decision as a two-step process.
The first step being the participation decision and the next step being the decision to buy a certain
quantity.
We find that education of head of household, the family size, budget allocated to milk (both regular
and organic) and status of the job affect the decision to participate in organic milk purchase. The
surprising find was that income does not affect the participation decision and that a large family is
a deterrent to participation decision in buying organic milk. At the store level, the impact of
communicating with the customer (through displays and advertisement) and that of price is found
to be important. Income is again found to be, surprisingly, not important to quantity buying
decision.
Introduction
Organic food is a growing industry in the US and in EU. As per the USDA report (Economic
Information Bulletin Number 58 September 2009) “retail sales of organic foods up to $21.1 billion
in 2008 from $3.6 billion in 1997.” This study informs us that consumer are now buying organic
food in conventional supermarkets (instead of specialty stores). Cost studies are now providing
better insights into the supply side of organic production/ supply chain (Maine Agricultural and
forest Experiment Station, The University of Maine, bulletin number 851, July 2008). These
studies find that although the cost structure of organic and non-organic farms, for comparable sizes
are a bit different, the organic farms are able to improve their performance over recent years and
are able to compete well with non-organic farms. This project was initiated to investigate the
factors that affect the consumer decisions to buy organic dairy products. For this purpose a data
set was made available by Agricultures Economics Dept., UW-Madison (IRI Marketing Data Set,
Bronnenberg, Kruger, Mela, Marketing Science, 2008).
The above USDA study has investigated the consumer behavior related to organic products. They
find that education of the consumer is an important factor in consumer’s decision to buy organic
food. But on the other hand they conclude that “Other factors, such as race, presence of children
in the household, and income, do not have a consistent effect on the likelihood of buying organic
products.”
Our study proposes to understand the issues related to demographics and marketing aspects of
organic dairy consumption. This information could not only help improve the sales of organic milk

179
through improved communication with the consumer but also help the suppliers to understand
what consumer value.
The project specifically asks the following questions:
a. What factors, if any, inherent to a consumer’s background, influence spending decision on
organic dairy products?
b. How does the action by the retail stores affect the decision on part of the consumer to buying
organic dairy products?
c. Do consumer buy organics as a result of sale (incentive) or improved information availability?

180
References (partial)
D. Kahneman and A.Tversky, “Prospect Theory: An Analysis of Decision under Risk”,
Econometrica, Vol. 47, No. 2 (Mar., 1979), pp. 263-291
D. Shaw and E. Shiu, “Ethics in consumer choice: A multivariate modeling approach”, European
Journal of Marketing; 2003; 37, 10; ABI/INFORM Global, pg. 1485
I.Ajzen, “The Theory of Planned Behavior”, Organizational Behavior And Human Decision
Processes 50, 179-211 (1991)
I. Ajzen, M. Fishbein, “Understanding attitudes and predicting social behavior”, Prentice Hall,
1980
P. E. Green And V. Srinivasan, Conjoint Analysis in Consumer Behavior: Status and Outlook," J.
Consumer Res. 5, 103-23 (1978).
J.R. Hauser and S. M. Shugan, “Intensity Measures of Consumer Preference” Operations
Research, Vol. 28, No. 2, March-April 1980
D. McFadden, Daniel "Conditional Logit Analysis of Qualitative Choice," in Frontiers in
Econometrics, P. Zarembka, ed. New York: Academic Press, 105-42. 1973
P.M. Guadagni, and J. D. C. Little "A Logit Model of Brand Choice Calibrated on Scanner Data,"
Marketing Sci-ence, 2 (Summer), 203-38, (1983)
P.M. Guadagni, and J. D. C. Little (1998), “When and What to Buy: A Nested Logit Model of
Coffee Purchase”, Journal of Forecasting, J. Forecasting. 17, 303-326 (1998)
S. Gupta and P. K. Chintagunta , “On Using Demographic Variables to Determine Segment
Membership in Logit Mixture Models”, Journal of Marketing Research, Vol. 31, No. 1 (Feb.,
1994), pp. 128-13

181
The impact of range extension on attraction effect: validation of the relative advantage model
and the reference dependent model
Pravesh Kumar Padamwar & Jagrook Dawra
Indian Institute of Management, Raipur
Abstract :
‘Attraction effect’ (AE) is a robust phenomenon of consumer behavior. In AE, the introduction of
a new alternative in the choice set systematically increases the choice share of an existing
alternative. The new alternative works as a decoy to increase the market share of the target
alternative. AE violates some of the core axioms (similarity & regularity) of rational choice theory.
AE can be strategically used to gain a competitive advantage by marketers and retailers. Although,
range extension (RE) (i.e. increment of the distance between the decoy and the target) has
important managerial and academic implications in the design and analysis of AE, the findings of
existing literature on the impact of RE are inconsistent. This paper focuses on the impact of RE on
AE. Two experimental studies have been conducted with 218 subjects. The first study confirms
that RE amplifies AE. According to the literature asymmetric dominance is a necessary and
sufficient condition for AE, the second study refutes this claim by proving significant AE caused
by symmetrically dominated alternatives. These findings also refute the predictions made by the
two explanatory models of AE, the relative advantage model and the reference dependent model,
while the findings support value added model.
Introduction:
Intuitively, a newly introduced brand will capture some market share and reduce market shares of
some of the existing brands. However, in some special cases, the introduction of a new brand
systematically increases the market share of an existing brand at the cost of other existing brands
(Huber, Payne, & Puto, 1982). The systematic change in relative preference between two non-
dominating or equi-preferred alternatives caused by the introduction of a new alternative into the
core choice set is called ‘context effect’ (CTE) (Lehmann & Pan, 1994; Lichters, Brunnlieb, Nave,
Sarstedt, & Vogt, 2015; Prelec, Wernerfelt, & Zettelmeyer, 1997; Tversky & Simonson, 1993).
‘Attraction effect’ AE is one type of CTE. For example, CP and TR are two alternatives of two-
wheelers that are same in every aspect except their mileage and ride quality & comfort rating as
presented in figure 1. CP and TR have 66% and 44% choice share
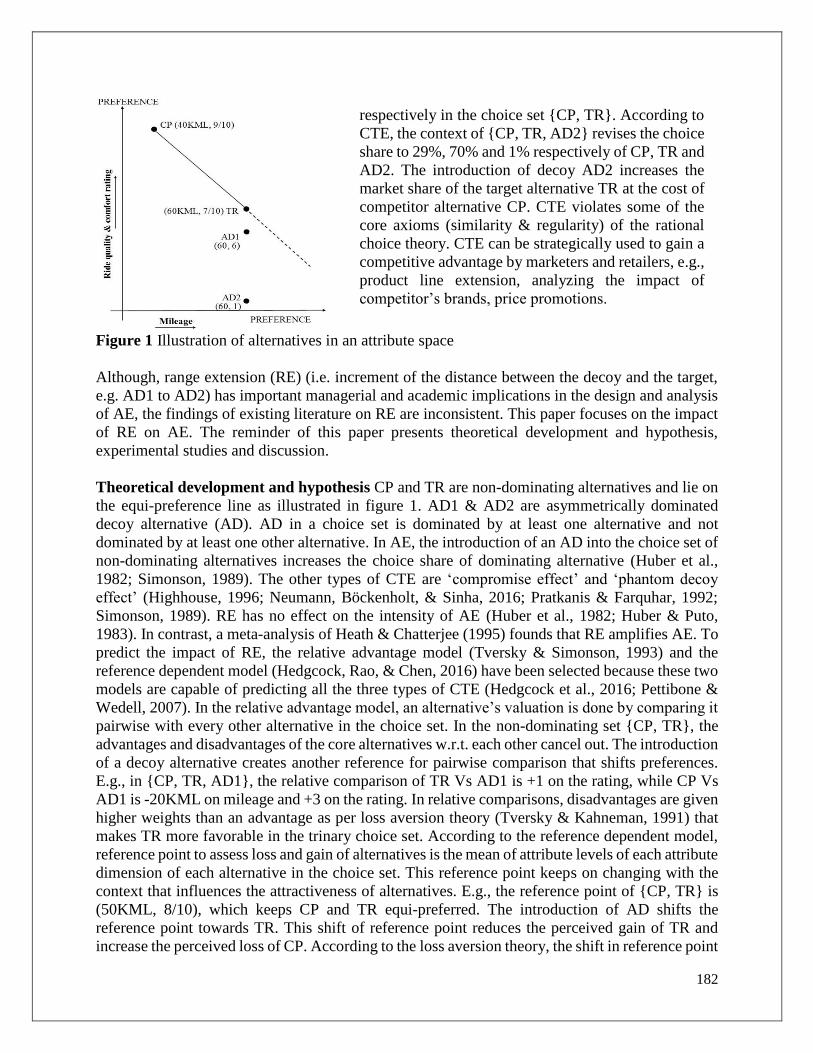
182
Figure 1 Illustration of alternatives in an attribute space
Although, range extension (RE) (i.e. increment of the distance between the decoy and the target,
e.g. AD1 to AD2) has important managerial and academic implications in the design and analysis
of AE, the findings of existing literature on RE are inconsistent. This paper focuses on the impact
of RE on AE. The reminder of this paper presents theoretical development and hypothesis,
experimental studies and discussion.
Theoretical development and hypothesis CP and TR are non-dominating alternatives and lie on
the equi-preference line as illustrated in figure 1. AD1 & AD2 are asymmetrically dominated
decoy alternative (AD). AD in a choice set is dominated by at least one alternative and not
dominated by at least one other alternative. In AE, the introduction of an AD into the choice set of
non-dominating alternatives increases the choice share of dominating alternative (Huber et al.,
1982; Simonson, 1989). The other types of CTE are ‘compromise effect’ and ‘phantom decoy
effect’ (Highhouse, 1996; Neumann, Böckenholt, & Sinha, 2016; Pratkanis & Farquhar, 1992;
Simonson, 1989). RE has no effect on the intensity of AE (Huber et al., 1982; Huber & Puto,
1983). In contrast, a meta-analysis of Heath & Chatterjee (1995) founds that RE amplifies AE. To
predict the impact of RE, the relative advantage model (Tversky & Simonson, 1993) and the
reference dependent model (Hedgcock, Rao, & Chen, 2016) have been selected because these two
models are capable of predicting all the three types of CTE (Hedgcock et al., 2016; Pettibone &
Wedell, 2007). In the relative advantage model, an alternative’s valuation is done by comparing it
pairwise with every other alternative in the choice set. In the non-dominating set {CP, TR}, the
advantages and disadvantages of the core alternatives w.r.t. each other cancel out. The introduction
of a decoy alternative creates another reference for pairwise comparison that shifts preferences.
E.g., in {CP, TR, AD1}, the relative comparison of TR Vs AD1 is +1 on the rating, while CP Vs
AD1 is -20KML on mileage and +3 on the rating. In relative comparisons, disadvantages are given
higher weights than an advantage as per loss aversion theory (Tversky & Kahneman, 1991) that
makes TR more favorable in the trinary choice set. According to the reference dependent model,
reference point to assess loss and gain of alternatives is the mean of attribute levels of each attribute
dimension of each alternative in the choice set. This reference point keeps on changing with the
context that influences the attractiveness of alternatives. E.g., the reference point of {CP, TR} is
(50KML, 8/10), which keeps CP and TR equi-preferred. The introduction of AD shifts the
reference point towards TR. This shift of reference point reduces the perceived gain of TR and
increase the perceived loss of CP. According to the loss aversion theory, the shift in reference point
respectively in the choice set {CP, TR}. According to
CTE, the context of {CP, TR, AD2} revises the choice
share to 29%, 70% and 1% respectively of CP, TR and
AD2. The introduction of decoy AD2 increases the
market share of the target alternative TR at the cost of
competitor alternative CP. CTE violates some of the
core axioms (similarity & regularity) of the rational
choice theory. CTE can be strategically used to gain a
competitive advantage by marketers and retailers, e.g.,
product line extension, analyzing the impact of
competitor’s brands, price promotions.

183
will make TR favorable over CP. This model also incorporates screening of alternatives based on
their relational properties with other alternatives in the choice set. The following hypothesis is
according to the predictions of these two models.
H1: Range extension will not affect the intensity of attraction effect.
Experimental Studies Two experimental studies are conducted. The first study explores the
impact of RE on AE. The subjects in the first study were PGP students of IIM-Raipur. The sample
size was 161 (55 female, average age= 24.15 years). 3x1 between subject design was used with
one control group exposed to the core binary choice set and two treatment groups exposed to
trinary choice sets consisted of CP, TR and a decoy (AD1 or AD2.) The participants were randomly
exposed to control and the two treatment group and asked to make a choice from the given
alternatives that also included choice deferral. Each participant made choices from three product
categories as presented in table 1. The two-wheeler alternatives were same as shown in figure 1.
External hard drive varied in storage capacity and replacement warranty, and the alternatives were
CP (1TB, 3 years), TR (2TB, 1 year), AD1 (2TB, 11 months), and AD2 (2TB, 1 month).
Smartphone varied in RAM and battery, and the alternatives were CP (1GB, 12 hours), TR (2, 6),
AD1 (2, 5), and AD2 (2, 0.5). The results as shown in table 1 confirm RE amplifies AE, thus refute
H1. The magnitude of AE is higher for AD2 as compared to AD1 for all the categories, also AD 1
didn’t produce significant AE for smartphone and hard drive. AD2 produced significant AE in all
the category. In study 1, subjects also rated the attribute importance in the scale of 7 (Kim & Kim,
2016) for each category. The two attributes of each category were high on the importance
(mean>5) and were not statistically different (t-test p-value>0.05,) thus any alternative explanation
of asymmetry in attribute importance stand invalid.
Table 1 result of study 1 Category External hard drive Two-wheeler Smartphone
Choice set {CP, TR,
AD1}
{CP, TR}
{CP, TR, AD3}
{CP, TR, AD1}
{CP, TR}
{CP, TR, AD3}
{CP, TR,
AD1}
{CP, TR}
{CP, TR,
AD3}
Sample Size 51 56 54 56 54 51 54 51 56
Choice deferrals 0 4 0 2 1 0 8 10 4
decoy selections 3 1 2 0 1 0
CP Selections 20 26 14 21 35 10 16 19 12
TR Selections 28 26 39 31 18 41 29 22 40
∆% of Target share 8% 24% 26% 46% 11% 23%
χ² p value 0.4 0.0128 0.0084 0.0000018 0.309 0.018
It can be observed that AD2s are inferior on the y-axis attribute to an extend that they could be
dominated even by CP. This motivated to conduct the second study to verify the relational property
of decoy alternatives with CP. The subjects in the second study were students of an engineering
college of Raipur city. The sample size was 57 (23 female, average age= 21.7 years). The subjects
were asked to make a choice from choice sets {CP, AD1} and {CP, AD2} of all the three categories
of study 1. In a non-dominating binary set, the choice shares are expected to be 50% of each
alternative. The results confirm that AD1 is non-dominating with CP (χ² p value > 0.05), while CP
dominated AD2 (χ² p value < 0.0001). Therefore, AD2 is a symmetrically dominated alternative.

184
Discussion
The relative advantage model and the reference depend model have been validated to predict all
the three types of CTE including AE in existing literature (Hedgcock et al., 2016; Herne, 1998;
Highhouse, 1996; Pettibone & Wedell, 2007). This research work extends the validation work of
these models for their prediction capability of RE. This paper found that RE amplifies AE, and it
refutes the predictions of the above two explanatory models. Asymmetric dominance is a necessary
and sufficient condition for AE (Wedell, 1991). In contrast, this paper refute this claim by proving
significant AE by symmetrically dominated alternatives. As screening of alternatives based on
their relational properties is not possible in symmetric dominance, the second part of reference
dependent model is not applicable is such situation. The findings of this paper support value shift
model (Huber et al., 1982; Wedell, 1991) that suggest that the AE is caused just by the increase in
the lower range of values of attribute level on which the target is inferior over the competitor.
Further, the findings of this paper have important managerial implications. AE caused by
symmetrically dominated alternatives suggest that the presence of a brand that is too inferior to
the competing brands can also affect the relative preference among competing brands. Therefore,
the practitioner should not limit their focus just to competing brands. Also, as the location of decoy
alternatives plays an important role in AE, practitioners should consider this factor to get a
favorable market response. The limitation of this paper is that it covers only one type of CTE for
RE. This work can be extended by exploring the impact of RE on the other types of CTE. Also,
instead of just two decoy alternatives, placement of three or more decoys along the range of
attribute dimension can strengthen the results.
References
Heath, T. B., & Chatterjee, S. (1995). Asymmetric Decoy Effects on Lower-Quality Versus
Higher-Quality Brands : Meta-Analytic and Experimental Evidence. Journal of Consumer
Research, 22(3), 268–284.
Hedgcock, W. M., Rao, R. S., & Chen, H. A. (2016). Choosing to Choose : The Effects of
Decoys and Prior Choice on Deferral. Management Science, (February), 1–25.
Herne, K. (1998). Testing the reference-dependent model: An experiment on asymmetrically
dominated reference points. Journal of Behavioral Decision Making, 11(3), 181–192.
Highhouse, S. (1996). Context-Dependent Selection : The Effects of Decoy and Phantom Job
Candidates. Organizational Behavior and Human Decision Processes, 65(1), 68–76.
Huber, J., Payne, J. W., & Puto, C. (1982). Adding Asymmetrically Dominated Alternatives :
Violations of Regularity and the Similarity Hypothesis. Journal of Consumer Research, 9
(June), 90–99.
Huber, J., & Puto, C. (1983). Market Boundaries and Product Choice: Illustrating Attraction and
Substitution Effects. Journal of Consumer Research, 10(1), 31.
Kim, S. (Ange), & Kim, J. (2016). The influence of hedonic versus utilitarian consumption
situations on the compromise effect. Marketing Letters, 27(2), 387–401.

185
Lehmann, D. R., & Pan, Y. (1994). Context Effects, New Brand Entry, and Consideration Sets.
Journal of Marketing Research, 31(3), 364–374.
Lichters, M., Brunnlieb, C., Nave, G., Sarstedt, M., & Vogt, B. (2015). the Influence of
Serotonin Deficiency on Choice Deferral and the Compromise Effect. Journal of Marketing
Research, LIII(April), 183–198.
Neumann, N., Böckenholt, U., & Sinha, A. (2016). A meta-analysis of extremeness aversion.
Journal of Consumer Psychology, 26(2), 193–212.
Pettibone, J. C., & Wedell, D. H. (2007). Testing alternative explanations of phantom decoy
effects. Journal of Behavioral Decision Making, 20(3), 323–341.
Pratkanis, A. R., & Farquhar, P. H. (1992). A Brief History of Research on Phantom
Alternatives: Evidence for Seven Empirical Generalizations About Phantoms. Basic and
Applied Social Psychology, 13(1), 103–122.
Prelec, D., Wernerfelt, B., & Zettelmeyer, F. (1997). The Role of Inference in Context Effects:
Inferring What You Want from What Is Available. Journal of Consumer Research, 24(1),
118–126.
Simonson, I. (1989). Choice Based on Reasons : The Case of Attraction and Compromise
Effects. Journal of Consumer Research, 16(September), 158–174.
Tversky, A., & Kahneman, D. (1991). Loss Aversion in Riskless Choice: A Reference-
Dependent Model. Quarterly Journal of Economics, 106(4), 1039–1061.
Tversky, A., & Simonson, I. (1993). Context- dependent Preferences. Management Science,
39(10), 1179–1189.
Wedell, D. H. (1991). Distinguishing Among Models of Contextually Induced Preference
Reversals. Journal of Experimental Psychology: Learning, Memory, and Cognition, 17(4),
767–778.

186
EXQ (Customer Experience quality): Exploring manifestations across services and customer
types
Subhadip Roy & Sunita Mall
IIM Udaipur & MICA Ahmedabad
BACKGROUND
There is an increasing trend for creating a unique experience for the customers in order to gain
their confidence and loyalty (Klaus, 2014). Pine and Gilmore (1999) were among the first few to
understand the importance of experience and propose the possibility of an ‘experience economy’.
They opined, “A new, emerging economy is coming to the fore, one based on a distinct kind of
economic output, goods and services are no longer enough” (p. 11). Subsequently, consumer
researchers further refined the concept and definition of Customer Experience. Prahalad and
Ramaswamy (2004) emphasized that companies do not sell experience but rather act as a platform
that is employed by consumers to co-create their own and unique experiences. In an early attempt,
Parasuraman et al. (1988) conceptualized the SERVQUAL to measure customer experience from
the service quality perspective on five dimensions – reliability, assurance, tangibility, empathy and
responsiveness. However, later researchers (Coulthard, 2004; Klaus and Maklan, 2011)
commented on the conceptualization and methodology of the SERVQUAL, especially because it
does not serve as a comprehensive tool to measure customer experience in real-life business
scenarios. One such critique led to the development of the customer experience quality or EXQ
scale by Klaus and Maklan (2011). Klaus and Maklan (2011) argued in favor of EXQ over
SERVQUAL on three grounds: the measurement tool was based on the customer’s point of view;
it conceptualized and measured service and customer experience; and it fulfilled the psychometric
properties of a scale. The four dimensions of EXQ are product experience, outcome focus,
moments-of-truth and peace-of-mind. These dimensions act as a reflection of customer’s
perception of service experience. Klaus and Maklan (2013) further supported the generalizability
of their scale in subsequent studies.
However, Klaus and Maklan (2013) noted a few questions that were worth investigating in
future such as the temporal effects of EXQ and the role of the service nature (utilitarian/hedonic)
on the consumer outcomes. Some of these issues have been raised by other researchers such as
differential effect of service environment on first time vs. repeat visitors (Ryu and Han, 2011) or
the difference in shopping value (hedonic/utilitarian) and its effect on customers (Jones, Reynolds
and Arnold, 2006). However, they have not been integrated and tested in the context of service
experience. Thus, the present research study aims to answer three questions. First, it examines the
effect of experience quality of a service with a higher hedonic value on the consumer attitudes
compared to a service with a lesser hedonic value (or higher utilitarian value). Second, it explores
the differential impact of experience quality on the customer outcomes for a regular vs. new
customers for a hedonic service. Third, it investigates the temporal change (if any) taking place on
the customers converting from new to revisiting customers. The following hypotheses were tested
in the study:

187
H1A: EXQ will have a higher (positive) effect on customer satisfaction for a
hedonic service compared to a utilitarian service.
H1B: EXQ will have a higher (positive) effect on loyalty intentions for a hedonic
service compared to a utilitarian service.
H1C: EXQ will have a higher (positive) effect on word of mouth for a hedonic
service compared to a utilitarian service.
H2: Customer experience (EXQ) will have a positive and significant effect on only
customer satisfaction for the first-time customers (while it will influence
satisfaction, loyalty and WOM for regular customers).
H3A: The effect of customer experience (EXQ) on customer satisfaction will
change for first-time customers with time if they (are satisfied and) keep revisiting
the service provider.
H3B: The effect of customer experience (EXQ) on loyalty intentions will change
for first-time customers with time if they (are satisfied and) keep revisiting the
service provider.
H3C: The effect of customer experience (EXQ) on word of mouth behavior will
change for first-time customers with time if they (are satisfied and) keep revisiting
the service provider.
METHODOLOGY
Developing nations such as India, China, and Brazil have shown evidence of economic growth
and hold potential for the service sector internally and externally (Clark and Rajaratnam, 1999;
Javalgi and White, 2002; Riddle, 1996; Wirtz, 2000) and thus India was the selected country for
study. Restaurant (hedonic service) and bank (utilitarian service) were retained as services for the
main study based on pre-tests. The EXQ questionnaire was adopted from Klaus and Maklan (2013)
with purifications to make it applicable for both first-time and regular customers which was then
tested for face and content validity. The final set of questions had 16 items for the first time
customers and 15 items for the revisit/regular customers. The questions for customer satisfaction
(Dagger et al. 2007), behavioral loyalty (Zeithaml et al., 1996; Parasuraman et al., 2005) and
word of mouth behavior (Brown et al., 2005) were adopted from existing literature with minor
modifications. The data collection was conducted through three studies. Study 1 consisted of data
collection from two groups of respondents where group 1 (n=234) consisted regular customers of
a hedonic service (fine dine restaurant) and group 2 (n=272) consisted of regular customers of a
utilitarian service (national bank). Study 2 consisted of data from a group of first time visitors of
the same fine dine restaurant selected in study 1 (n=226). Study 3 consisted of the respondents
selected in study 2 (n=209 )only with a time lag of 60 days with respect to the same restaurant
that they responded in study 2.

188
RESULTS
Study 1
The EFA results for the EXQ items (for both hedonic and utilitarian service) yielded a four factor
solution with satisfactory KMO values (0.893 and 0.856 respectively) and statistically significant
Bartlett’s test values. All scale items had communality values above 0.6 (for both data sets) and
the total variance extracted was 73.23% (hedonic) and 74.26% (utilitarian) respectively. The
internal consistency reliability for all constructs was measured through Cronbach’s Alpha and all
the constructs displayed reasonably high (Nunnally, 1978) levels (above 0.6) of internal
consistency reliability. The factor structure obtained had no cases of cross loadings higher than 0.4
and implied that items were converging to their respective constructs.
Confirmatory Factor Analysis (CFA) for study 1 data (both hedonic and utilitarian service)
ensured the desired factor structure for EXQ and assessed reliability and construct validity for the
study constructs. Independent structural models for the hedonic and the utilitarian service data
indicated good fit respectively. The path estimates from the analysis suggested a positive and
significant effect of EXQ on satisfaction, loyalty and word of mouth behavior for both service
types. However, the magnitude of the standardized estimates was lesser for utilitarian service than
hedonic service. A pairwise comparison of the path estimate of the outcomes of EXQ on consumer
satisfaction, loyalty and WOM suggested statistically significant (and stronger) effect of EXQ on
the outcomes for a hedonic service compared to a utilitarian service. Thus, at this stage Hypotheses
1A-1C were supported.
Study 2
The data on the hedonic service of the regular customers was included in study 2 along with the
fresh data on first time customers. The path model estimates indicated a statistically significant
effect of Customer Experience (EXQ) on satisfaction (SAT) but not on loyalty and word of mouth.
Thus, the initial findings and the diagnostic tests found support for Hypothesis 2.
Study 3
In this phase, the data collected from the first time customer (in study 2) after the time lag was
analyzed (objective was to test Hypotheses 3A-3C). A detailed analysis of the direct and indirect
effects of EXQ on loyalty and WOM behavior revealed that the indirect effects of EXQ to be close
in magnitude to the direct effects of satisfaction on loyalty and WOM. Thus, at this stage
hypothesis 3A through 3C were supported.
DISCUSSION
Our study contributes to the existing research on customer experience and EXQ (Klaus and
Maklan, 2013) in multiple ways and supports the call for linking various related concepts in
services marketing into a single study (Helkkula, 2011). First, present study found a stronger effect
of service experience quality (EXQ) on consumer attitudes for a hedonic service compared to a
utilitarian service. Thereby it supports the general notion that experiences would matter more for

189
a hedonic service compared to a utilitarian service (Jones et al., 2006). The findings from
hypotheses 2 add to the literature on the temporal nature of customer experience (Arnould and
Price, 1993). The support for hypotheses 2 mean that experience may not time bound and may not
have an impact on all consumer attitudes at the first instant. Hypotheses 3A-C imply that customer
experience developing over time (this was for regular customers) could lead to patronage behavior
(through positive word-of-mouth) and behavioral loyalty. Both these outcomes are desired of
experiential marketing (Pine and Gilmore, 1999; Chang and Hong, 2010). The findings also
support the ‘flow’ nature of customer experience (Grundey, 2008; Luigi et al., 2012) where the
customer experience begins before the service encounter, and continues after the encounter is over
that leads to repeat buying and loyalty with time.
MANAGERIAL IMPLICATIONS
The present study has several managerial implications. First, the differential effects of hedonic vs.
utilitarian service on the consumer attitudes underline the need of creating a favorable service
experience in case of a hedonic service provider. Second, the findings indicate that the service
provider has to think of a different strategy for the new customers. For the revisiting customers,
the previous experience may act as a benchmark and thus a deviation in the negative direction
may influence loyalty and word-of-mouth. To summarize, the findings from the present study
provides the manager with implications on the importance of service experience and guidelines
on execution depending on service/customer types.3
3 References available upon request.

190
A real world application of optimal pricing under three-part tariff
Manish Gangwar & Rajesh Gaurav
Indian School of Business, Hyderabad
Service providers in industries such as communication, information, and software often use a three
part tariff structure. A three part tariff structure consists of three elements: a fixed fee component,
a certain allowance of “free” units that is included in the fixed fee, and a per unit price for usage
above the included allowance. Existing theory may suggest that moving from a two part tariff to a
three part tariff increases both usage and satisfaction due to various consumer biases. There are
various effects of risk aversion, anchoring, insurance effect etc. which would impact the
consumer’s choice. However, there are no guidelines that offer optimal pricing under three-part
tariff structure. In this study we work with a car rental firm that uses a three part tariff structure.
Similar to hotels and airlines industry they also have to allocate their car fleet across various tariffs
plans. However, unlike hotel industry in this setting marginal cost is not zero (because firm bears
the cost of fuel and maintenance) hence firm does not engage in dynamic pricing as in revenue
management. Hence, the traditional revenue management models are not applicable here. We
estimate a two-stage demand model based on the usage and utilization data to recommend prices.
These prices are then implemented in few markets to test model performance. Our aim is to find
out the optimal price given tier levels which a service provider can offer to the customers to
maximize its profits.
Keywords: Pricing, nonlinear pricing, three part tariffs

191
Service Recommendation and Antecedents: A Panel Data Exploration
Pravat Surya Kar
GIM, Goa
Extended Abstract
Purpose:
Purpose of this study is to explore, with panel data, relationships between service
recommendations (SR) and selected antecedents. In spite of extensive body of knowledge on SR
and word of mouth (WOM), longitudinal studies on the above topic is rare. However, successes
and failures of brands these days often critically depend on SR and WOM. Hence, this study is
intended to fill a gap in theory and suggest improvements for practice.
Design/methodology/approach:
A panel data set was curated, from published records of a reputed house, for SR and its
antecedents in a specific industry. Consequent database had 8 repeated measures, spread between
2010 and 2017, on 61 brands on their ‘SR and key antecedents’. Various statistical models were
explored and tested for assessing fixed and random effects.
Findings:
It was found that customers’ propensity for SR has strong relationships with some of the
theoretical antecedent factors. It was also discovered that certain others factors’ relationship with
SR is weak. These findings reported in this paper, are more powerful owing to the longitudinal
nature of this study.
Research limitations/implications:
More research needs to be undertaken to explore nature of relationship among SR and its
antecedents across various sectors and industries. It is also necessary to conduct research
employing experimental designs from across industries using robust measures.
Originality/value”
This is one of the first longitudinal study with multiple brands on Service recommendation and
its antecedents. The procedures adopted in this study improves our understanding about SR and
its antecedents. These findings can help organisations to design more effective interventions to
manage SR.
Keywords- Service recommendation, Antecedents, Longitudinal study, Panel data.

192
References
Venkatesan R. and Kumar V. (2004), “A Customer Lifetime Value Framework for Customer
Selection and Resource Allocation Strategy, Journal of Marketing, Vol. 68, No. 4, pp. 106-
125
Ryu G. and Feick L. (2007), “A Penny for Your Thoughts: Referral Reward Programs and
Referral Likelihood”, Journal of Marketing, Vol. 71, No. 1 pp. 84-94
Haenlein M. and Libai B. (2017), “Seeding, Referral, and Recommendation: Creating Profitable
Word-of-Mouth Programs”, California Management Review Vol. 59, No. 2
Jabr W. and Zheng Z. (2014), “Know Yourself and Know Your Enemy: An Analysis of Firm
Recommendations and Consumer Reviews in a Competitive Environment”, MIS Quarterly
Vol. 38 No. 3

193
Power Matters: Cultural Influence on Consumer’s Response to Service Failure
Himanshu Shekhar Srivastava, Gurbir Singh & Deepak Ranjan
IIM Indore
Introduction:
The variability in service delivery process makes service failure a common occurrence, which
leads to dissatisfactory service experiences and unfavorable consumer responses. The unfavorable
response from the consumer may take the shape of complaint, which provides an opportunity to
the service providers to improve their services accordingly (Fornell and Wernerfelt, 1987). Many
studies attempted to provide a comprehensive typology of consumer complaining behavior (CCB)
which range from inertia, voice, exit, NWoM (Istanbulluoglu et al., 2017; Singh, 1988).
The global presence of firms put a challenging task of satisfying the consumers at all the location
as per their perception of service. It has been argued that this perception of service is often
influenced by the cultural factors (Zeithaml et al., 2002). Consumer’s response to the
dissatisfactory service encounter is one of the most prominent area which get influenced by the
cultural factors (Chan et al., 2009). Most of the studies investigated the cultural influence in the
context where the bargaining power lies with customers and customers are treated as king, such as
hotels, restaurant services, transport services but literature is very scant in the context where
service providers may have more power as in the case of professional service industry (Hospital
services, Legal Services). In such cases, power distance may influence the tolerance level for
service failure. Similarly, response to embarrassing vs. non-embarrassing service failure may also
vary with the change in power distance orientation.
This research attempts to address following issues pertaining to cultural influence on CCB:
How power distance influences the consumer’s response to the service failure and whether
these responses vary with the shift in the relative power between consumer and service
provider?
How power distance influences the consumer’s response to service failure in case of
embarrassing service failure vis a vis non-embarrassing service failure?
Conventionally, culture has been operationalized using the national culture dimensions proposed
by Hofstede but criticized in recent past based on the fact that an individual’s cultural value
orientation may differ from his country’s cultural value (Oyserman et al., 2002; Sharma, 2010).
Thus, we propose to measure culture as individual’s personal level cultural value orientation
(Sharma, 2010) for this study.
194
Theoretical Background and Propositions:
Consumer Complaining Behaviour (CCB):
CCB has been defined as “an action taken by an individual which involves communicating
something negative regarding a product or a service to either the firm manufacturing or marketing
that product or service, or to some third-party organizational entity (Jacoby and Jaccard, 1981,
p.6)”. When a consumer leaves the company, and decides to not buy again from the same provider
in response to dissatisfied service experience, it is referred as exit behavior, whereas complaining
directly to the company is referred as voice behavior. Loyalty was defined as not complaining and
staying supportive to the company (Hirschman, 1970). Singh (1988) based his taxonomy structure
of CCB on the object of the consumer’s complaint (e.g., company, friends and family or third
party) and classified the CCB responses into three dimensions, namely, Voice action (e.g., seeking
redressal), private action (e.g. exit or NWoM), and third party action (e.g., legal action) (Singh,
1988, p.101). In next section, we discuss the literature related to the relationship between culture
and CCB responses.
Culture and Consumer Complaining Behaviour:
Culture influences the social exchanges through established norms, roles, attitudes, beliefs, values
and expectations (Samaha et al., 2014) and since service encounters are also social exchanges, it
bound to be influenced by the culture. Patterson et al. (2006) argued that service encounters get
influenced by the culture at multiple levels, such as evaluations, expectations, and service recovery
evaluations by consumers. Hofstede (1980) initially mentioned four cultural value orientations -
power distance, individualism vs. collectivism, masculinity vs. femininity, and uncertainty
avoidance – later Hofstede and Bond (1988) added one more dimension to it i.e., long term vs.
short term orientation. Apart from individualism-collectivism, few studies considered other
cultural dimensions such as power distance (Ngai et al., 2007; Patterson et al., 2006) and
uncertainty avoidance (Hernandez et al., 1991) for comparing and contrasting the complaint
behavior of consumers.
Power Distance and Complaining Behaviour:
People from societies with large power distance respect the person with high social status and are
more likely to show “greater tolerance of power and wealth inequalities” (Wan and Chu, 2013,
p.196). Although, several researchers argued that customers from small power distance culture
have higher expectations regarding service quality (Donthu and Yoo, 1998; Malhotra et al., 1994;
Tam et al., 2016) some other researchers reported the findings contrast to it and showed that people
from large power distance culture exhibit higher expectations for service quality (Mueller et al.,
2003). One plausible explanation given in the literature for this ambiguous finding lies in the
dynamic of power between customer and service providers. Most of the studies ignored the power
difference between consumer and service provider in their investigation of the influence of power
distance on service quality expectations and evaluations. Normally it is believed that in service
encounters, consumers have upper hand as far as power is concerned, but in some cases, this

195
dynamic is reversed. There may be some services where consumers have power to modify the
service provider’s state, whereas in some other cases service provider has the power to modify the
consumer’s state, for instance, in hospitality context normally service employee have low status
but in some other service context, (e.g., professional services like hospitals, legal services,
consulting) service provider has power over their consumers which comes from the skills,
expertise, and professional knowledge (Wan and Chu, 2013). It has been observed that power
status influences the cognitive and behavioural outcomes in a way that more powerful individual
indulges in more pro-social behaviours (Keltner et al., 2003), tend to exhibit increased attention to
rewards and less attention to threat in the external environment, and actively seeks rewards. These
arguments of power in addition to the power distance orientation leads to our preposition that:
Proposition 1a: Consumers with large power distance orientation will show greater intention to
complain after failed service encounter in service context where relative power is with the
consumer (e.g., restaurant) as compared to the service context where relative power is with the
service provider (e.g., Hospital).
Proposition 1b: Consumers with small power distance orientation will show uniform intention to
complain after failed service encounter in both service context where relative power is with the
consumer (e.g. restaurant) as well as the service context where relative power is with the service
provider (e.g., Hospital).
Proposition 2a: In service encounters where the service provider has power over their consumers,
consumers with large power distance orientation will exhibit greater tolerance (less intention to
complain) to service failure than the consumers with small power distance orientation.
Proposition 2b: In service encounters where the consumer has power over service provider,
consumers with small as well as large power distance orientation will exhibit a uniform level of
intention to complain after failed service encounter.
Embarrassing Service Failure and Complaining Behaviour
The presence of other consumers during a failed service encounter may induce the feeling of
uneasiness that leads to the embarrassment
(Wan, 2013) which in turn influence the
complaint behaviors. Prior researches indicate
that in the case of embarrassing service
failure, consumers from collectivist society as
against to their normal complaint behavior are
more likely to complain at both public and
private level (Fan et al., 2015). However,
review of the extant literature showed that
none of the studies investigated the influence
of power distance in case of embarrassing
service failure. We predict that consumers
from large power distance culture are more
likely to voice their complain than consumers Figure 1: Conceptual Model
196
from small power distance culture in case of embarrassing service failure because former will try
to reinstate their prestige and authority in-front of others. Conversely, in the case of non-
embarrassing service failure, consumer form both large and small power distance culture may
exhibit a similar response to the service failure. Thus, we propose:
Proposition 5: Consumer from large power distance culture is more likely to complain vs.
consumer from small power distance culture after an embarrassing service failure.
Proposition 6: Consumer from large as well as small power distance culture will show a uniform
level of intention to complain after a non-embarrassing service failure.
Proposed Methodology:
We will adopt scenario-based experiment to test our conceptual model. Two scenarios consisting
the manipulations for relative power between customer and service provider will be developed for
the testing the cultural influence on CCB. Another set of two scenarios containing the situation
depicting the embarrassing vs. non-embarrassing service failure will be developed. Cultural
dimension will be measured at individual level using the scale developed by the Sharma (2010).
Intentions to complain, switch, and negative NWoM will be used as the proxy to measure the CCB
using the scale used in Wan’s (2013) study.
Conclusion:
The conceptual model proposed in the study shows that customers differ in their CCB responses
based on their cultural orientation, but this difference in CCB is contingent on the service encounter
settings. As conceptual model indicates that power distance orientation influences the CCB to a
different degree based on whether service failure is embarrassing and whether relative power is
with consumer or service provider.
Expected Contribution:
This study will contribute to the theory by enhancing our understanding of the influence of power
distance in the context of embarrassing service failure and the situations of change in relative
power dynamics between consumers and service providers. None of the prior studies have
investigated the influence of power distance in these scenarios.
As far as contribution to the practice is a concern, service providers can devise better complain
handling by understanding the various CCB demonstrated by the consumers from different power
orientation in different service failure context.

197
References:
Chan, H., Wan, L. C., & Sin, L. Y. (2009). The contrasting effects of culture on consumer
tolerance: Interpersonal face and impersonal fate. Journal of Consumer Research, 36(2), 292-
304.
Donthu, N., & Yoo, B. (1998). Cultural influences on service quality expectations. Journal of
service research, 1(2), 178-186.
Fan, A., Mattila, A. S., & Zhao, X. (2015). How does social distance impact customers’ complaint
intentions? A cross-cultural examination. International Journal of Hospitality Management, 47,
35-42.
Fornell, C., & Wernerfelt, B. (1987). Defensive marketing strategy by customer complaint
management: a theoretical analysis. Journal of Marketing research, 337-346.
Hofstede, G. (1980). Culture’s consequences: National differences in thinking and
organizing. Beverly Hills, Calif.: Sage.
Istanbulluoglu, D., Leek, S., & Szmigin, I. T. (2017). Beyond exit and voice: developing an
integrated taxonomy of consumer complaining behaviour. European Journal of
Marketing, 51(5/6).
Jacoby, J., & Jaccard, J. J. (1981). The sources, meaning, and validity of consumer complaint
behavior: A psychological analysis. Journal of retailing.
Keltner, D., Gruenfeld, D. H., & Anderson, C. (2003). Power, approach, and inhibition.
Psychological review, 110(2), 265.
Mueller, R. D., Palmer, A., Mack, R., & McMullan, R. (2003). Service in the restaurant industry:
an American and Irish comparison of service failures and recovery strategies. International
Journal of Hospitality Management, 22(4), 395-418.
Ngai, E. W., Heung, V. C., Wong, Y. H., & Chan, F. K. (2007). Consumer complaint behaviour
of Asians and non-Asians about hotel services: an empirical analysis. European Journal of
Marketing, 41(11/12), 1375-1391.
Oyserman, D., Kemmelmeier, M., & Coon, H. M. (2002). Cultural psychology, A new look: reply
to Bond (2002), Fiske (2002), Kitayama (2002), and Miller (2002).
Patterson, P. G., Cowley, E., & Prasongsukarn, K. (2006). Service failure recovery: the moderating
impact of individual-level cultural value orientation on perceptions of justice. International
Journal of Research in Marketing, 23(3), 263-277.
Samaha, S. A., Beck, J. T., & Palmatier, R. W. (2014). The role of culture in international
relationship marketing. Journal of Marketing, 78(5), 78-98.

198
Sharma, P. (2010). Measuring personal cultural orientations: scale development and
validation. Journal of the Academy of Marketing Science, 38(6), 787-806.
Singh, J. (1988). Consumer complaint intentions and behavior: definitional and taxonomical
issues. The journal of Marketing, 93-107.
Tam, J. L., Sharma, P., & Kim, N. (2016). Attribution of success and failure in intercultural service
encounters: the moderating role of personal cultural orientations. Journal of Services
Marketing, 30(6), 643-658.
Wan, L. C. (2013). Culture's impact on consumer complaining responses to embarrassing service
failure. Journal of Business Research, 66(3), 298-305.
Wan, L. C., & Chu, M. Y. (2013). Cross-Cultural Research on Consumer Responses to Service
Failure: A Critical Review. In Multinationals and Global Consumers (pp. 185-206). Palgrave
Macmillan UK.
Zeithaml, V. A., Parasuraman, A., & Malhotra, A. (2002). Service quality delivery through web
sites: a critical review of extant knowledge. Journal of the academy of marketing science, 30(4),
362-375.

199
Brand advocacy and its antecedents - An inquiry
Susobhan Goswami
TSM Madurai
Satisfaction alone may not be enough to beget competitive advantage. Marketers are going beyond
traditional means trying to explore the emotional side of consumption and consequent loyalty.
They wish to germinate a passion, a liking which envelopes all other rational thinking. Consumers
may build up a personal fortress alluding to a brand of their choice and aspiration. At the heart,
lies a sense of affection and unflinching attention. Consumers therefore do anthromorphize brands
that instill deep relationships between them. To be a strong brand, a brand needs more than just
liking it- a notion of love and attachment should permeate the layers of human minds.
Constituents
This paper goes into love and passion, what inspires love and passion, and what benefits does it
conference on the marketing managers. It is about how a brand moves from a ‘liked’ brand to a
‘loved’ brand, and proceed further from a loved brand to a ‘passion’ brand. A passion brand stays
and generates continuous advocacy. There are antecedents of brand passion, which are the
constructs of this study. Brand prestige, Brand Image, Brand Trust, Brand Uniqueness, Brand
congruity, Brand admiration- all contributing to brand love and consequently, to brand passion.
Brand status, admiration, brand experience are the drivers of brands like Cadburys chocolates,
HSBC. In the information age, luxury brands create passion; accumulates pleasurable total
experiences for consumers in addition to fulfilling their functional and symbolic needs Further,
research has examined the luxury brand in relation to the larger business environment paying
particular focus to contributors to success in periods of economic recession .Still other research
has gone into the ephemeral and temporary nature of the luxury brand suggesting clues for
companies adjusting growth trade-offs (e.g. brand architecture) while navigating markets of
varying maturity levels.
Method
The proposed hypotheses were examined using a survey research. Initially we floated the online
survey link to a database of consumers collected from different branded retail outlets. Survey
participants were offered an Amazon coupon as a consideration for their participation. 512
responses were received, of which 450 responses were identified as usable data (46% women; 12%
from age group below 20 years; 52% from age group from 20 to 30 years; 36% from age group
above 30 years; 26% are students).
A two stage structural equation modelling was used to test the proposed hypotheses. First,
confirmatory factor analysis was tested to check the satisfying conditions for content validity.
Inter-correlations analysis in comparison with average variance extracted (AVE) was tested to
ensure convergent and discriminant validity. Reliability was checked to know the scale is free from
measurement error. Followed by sequence of validity tests, the structural equation modelling was
used to test the proposed hypotheses and paths.
Only brand commitment was found to be having positively associated (significant) with brand
advocacy. In the same vein, value congruity, brand commitment, and brand trust were also found

200
to be having a positive association with brand love and brand experience with brand passion. It is
apparent, therefore, that commitment goes along with trust, and self-congruity to generate brand
love. The connection is highly psychological. Similarly, brand experience and brand passion go
together. A rich experience with a brand and continuing sets of experiences are enough to
germinate brand passion. They can also work on creating unique experiences that add value for
consumers. The model fit is acceptable. R square values showed a good fit. Brand value congruity
and Brand advocacy relationship mediating through brand love was found to have the maximum
value of 68.5%, followed by brand trust and brand image. When it was passion, brand experience
was found to have the highest impact (42.3%). It implies that brand love significantly mediates the
relationship through brand value congruity meaning that brands are ‘loved’ only when its values
turn out to be congruent with the individual values. Similarly, brand experience and brand passion
go together like Harry Potter books and associated movie, Starbucks Coffee, Barista, HSBC and
the like companies.
The findings give solid evidence of the need to consider the brand experience affect and cognition
in the development of brand advocacy. Love fructifies overall level of contentment and pleasure
resulting from experience with a service or product. Managers can go into on the antecedents and
long-term consequences of brand experiences and launch targeted marketing strategies and
campaigns.
Implication
A commitment by senior management is required to approach branding as an integrated business
process, instilling the brand concept and trade-offs in all company functions, not just marketing
alone. This integrated and inclusive concept of strategy reaches a point where the brand represents
the core beliefs and values of the company as a whole. By aligning the elements of vision and
culture within the company, companies create a favorable image in the public market resulting in
strong brand identity.
References:
Agustin, C., & Singh, J. (2005). Curvilinear effects of consumer loyalty determinants in
relational exchanges. Journal of Marketing Research, 42(1), 96–108.
http://doi.org/10.1509/jmkr.42.1.96.56961
Alloza, A. (2008). Brand Engagement and Brand Experience at BBVA, the Transformation of a
150 Years Old Company. Corporate Reputation Review, 11(4), 371–379.
http://doi.org/10.1057/crr.2008.31
Amine, A. (1998). Consumers’ true brand loyalty: the central role of commitment. Journal of
Strategic Marketing, 6(5), 426-33
Amine, A. (1998). Consumers’ true brand loyalty: the central role of commitment. Journal of
Strategic Marketing, 6(4), 305–319.

201
Anderson, J. J. C., & Narus, J. A. (1990). A model of distributor firm and manufacturer firm
working partnerships. The Journal of Marketing, 54(1), 42–58. http://doi.org/10.2307/ 1252172
Moorman, Christine, Gerald Zaltman, and Rohit Deshpande (1992), "Relationships between
Providers and Users of Market Research: The Dynamics of Trust within and Between
Organizations," Journal of Marketing Research, 29 (August), 314-29.
Rehman, A., Ahmed, M. A., Mahmood, F., Shahid, M., & Sciences, A. (2014). The Effects of
Brand Experience, Satisfaction and Trust on Brand Loyalty; an Empirical Research on the
Internet Services of Cellular Companies in Pakistan 2. Significance of Study: 3. Literature
Review: International Journal of Management Sciences and Business Research, 3(9), 90–100.
Reichheld, F. F., Markey, R. G., Hopton, C. (2000).
Vogel V, Heiner Evanschitzky, & B. Ramaseshan (2000). Customer Equity Drivers and Future
Sales, Journal of Marketing Vol. 72 (November 2008), 98–108.

202
Is Nostalgia Only for Legacy Brands: Is Old Always Gold?
Catherine Xavier
The Indian School of Business, Hyderabad
Over the last decade, companies have been using nostalgia as a marketing tool to signal
authenticity and quality (Sierra & Mc Quitty, 2007). Therefore, is it not surprising that most legacy
brands have joined the nostalgia band-wagon. There is no dearth of evidence to indicate that
numerous legacy brands are using nostalgia to relaunch their products by appealing to consumers’
strong social and historic roots (Kessous, 2015), and to invoke customers’ positive associations
with the product.
Coco-cola for example, has embraced its nostalgic past and has portrayed the production of iconic
bottles of the 1950s and the use of 1930s Santa Claus imagery.4 Describing its new nostalgic
campaign, Coco-cola’s marketing director for the UK and Ireland, Aedamar Howlett explained
that in the use of nostalgic campaign, the brand has been ensuring that the campaign is “modern,
relevant and bang-up-to-date”1 Nestle is yet another legacy brand that has used nostalgia as a
comeback campaign for Maggi in August 2015. The Maggi campaign by Nestle India titled “We
miss you too” was created to feature Indians’ nostalgic associations with Maggi.2 Other legacy
brands that are using nostalgia-campaigns include Old Navy, Pepsi, Jack Daniel’s whiskey, Royal
Enfield, Bajaj, VIP, Godrej, Louis Vuitton, Rolls-Royce, Honda, and Fujifilm --- to name a few.
Apparently, old brands have been effectively using the magic of the “good old days” to enhance
customers positive brand affect by engaging and communicating with consumers. After all, it’s all
about making campaigns personally relevant to customers by using situations, events or products
they experienced in the past (Merchant et al., 2013). Therefore, legacy brands that have been
around for a while, can effectively tap into customers’ positive experiences of the past, and use
those past experiences to increase consumers’ purchase intentions in the present and the future.
That said, a young company, Google, also successfully used nostalgia advertisement in the Indian
context: Google created a six-minute ad titled “The Hero-A Bollywood Story” that touched upon
how Bollywood films have stirred and doused hopes of countless number of people. The campaign
portrayed an unlikely protagonist, a young aspiring actor from the 1960s, who had to give up his
dreams because of the lack of access to technology such as Google.5 Another very famous example
of a young company’s successful use of nostalgia campaign is Paper Boat, a traditional Indian
drinks brand that was launched in 2013.This new company, considered to be the new kid on the
block, tasted tremendous success by the use of a nostalgia campaign that pinches on customers’
good old summer days. Titled “My First Train Ride” that evoked childhood memories related to
the joys of travelling, Paper Boat’s nostalgic campaign appealed to reliving the thrills of childhood
travels using Indian Railways.6 Apparently, younger brands do not have much to tap into
4 https://www.marketingweek.com/2016/12/06/coca-cola-innovate-christmas-ad/ 5 http://www.livemint.com/Sundayapp/lJ0QfbPVqyi0fSZAmj0k1J/From-Paper-Boat-to-Google-how-brands-rely-on-nostalgia.html 6 https://campaignsoftheworld.com/tv/paper-boat-presents-my-first-train-ride/

203
consumers’ product affect, hence, they appeal to consumers’ positive associations with past
relevant memories or events.
The apparent discrepancy in the examples cited above is that both legacy companies and young
companies are successfully using nostalgia as a mantra to engage customers and to increase
purchase intentions. Until recently, it was strongly believed that legacy companies alone could
make effective use of nostalgia because of their ability to remind customers of their positive past
product-use. By the same token, younger brands that do not have consumers’ positive past
associations also have been successfully using nostalgic advertisements even when past consumer
experience with the product is totally absent. That begs the question: Is nostalgia only meant for
legacy (older) brands? What factors determine the successful use of nostalgia campaigns by legacy
and young brands? This study is aimed to examine the different conditions under which nostalgia
influences customer’s intentions to purchase ---in case of legacy brands and young brands.
Prior research informs us that nostalgia is a collection of fond and meaningful memories that makes
individuals feel sentimental, tender or happy (Lasaleta, Sedikides, & Vohs, 2014). Nostalgia in
itself will be of less importance to marketers unless its insights can be used to examine and
understand consumer behaviors. What we do know until now is that nostalgia campaigns create
positive reactions and attitudes towards the brand, and increase purchase intentions towards the
brand (Sprott and Meuhling, 2002). This mainly works because of nostalgia appeals to customers’
“yearning for yesterday” (Davis, 1979) that makes them value ‘anything old’. Nostalgia heightens
customers’ attraction to old clothes, old music, old family roots, and old architecture (Reisenwitz
et al., 2004). Empirical findings further show that nostalgia encourages consumers to develop
relationship with brands that they use (Fournier, 1998). That said, there is a dearth of empirical
evidence that examines whether nostalgia works for legacy brands or even for new brands. If
consumers yearn for anything old, or anything from the past, then one would imagine that legacy
brands would benefit most from the use of nostalgia campaigns. Customers can be made to
remember their past, their associations with the product, their social connectedness with the
product, and fond past memories ---all of which is feasible only in case of legacy products. Then,
are young brands less likely to benefit from nostalgia campaigns as their products are new and do
not evoke ‘old’ memories?
This study posits the following:
1) Mere prior product use is not likely to have a strong influence on the relationship between
nostalgia campaigns and customers’ intention to purchase.
2) Young brands are also likely to be successful in using nostalgia campaigns (even if the
consumer has not used the product earlier): this depends on the strength of the consumers’
valuation of a memory or past event. That is, the strength of the association moderates the
relationship between nostalgia and intention to purchase. If consumers associate strongly
with the nostalgic memory, then its influence on intention to purchase is likely to stronger,
for young and legacy brands. Thus, legacy brands are not likely to have an advantage in
terms of increased customer intention to purchase, when compared to young brands.

204
3) Legacy brands could be successfully linked to nostalgic memories of product use.
However, the influence of nostalgic memories on purchase intentions is likely to be
mediated by consumers’ perception of meaningful novelty of the product. A nostalgic
campaign of a product will induce nostalgia, but it is not likely to influence the customer
to purchase a product, unless the customer perceives the product to have meaning, newness
and relevance to the present.
4) In case of young brands, nostalgia campaigns’ influence on purchase intentions will be
moderated by the strength of the customers’ valuation of a past event. If the nostalgia
campaign invokes a meaningful and relevant memory (totally unrelated to prior product
use), consumers’ intentions to buy will be stronger. If the nostalgic campaign invokes a
weak relation to a memory, then even if the consumer enjoys the campaign, it is less likely
to influence purchase intentions.
Using a series of experiments and surveys, the study attempts to examine the hypothesis, of
whether nostalgia works better for legacy brands when compared to young brands, and the factors
that determine the influence of nostalgia on purchase intentions for legacy and young brands. The
insights can have huge marketing and policy implications in terms of designing nostalgia
campaigns for legacy and young brands.
References:
Fournier, Susan (1998), “Consumers and Their Brands: Developing Relationship Theory in
Consumer Research,” Journal of Consumer Research, Vol. 24, No. 4 (March 1998) (pp. 343-
353).
Fred, D. (1979). Yearning for Yesterday: A sociology of nostalgia. The Free Press.
Kessous, A. (2015). Nostalgia and brands: a sweet rather than a bitter cultural evocation of the
past. Journal of marketing management, 31(17-18), 1899-1923.
Lasaleta, J. D., Sedikides, C., & Vohs, K. D. (2014). Nostalgia weakens the desire for
money. Journal of Consumer Research, 41(3), 713-729.
Merchant, A., Latour, K., Ford, J. B., & Latour, M. S. (2013). How Strong is the Pull of the
Past?. Journal of Advertising Research, 53(2), 150-165.
Pascal, V. J., Sprott, D. E., & Muehling, D. D. (2002). The influence of evoked nostalgia on
consumers' responses to advertising: An exploratory study. Journal of Current Issues &
Research in Advertising, 24(1), 39-47.
Reisenwitz, T. H., Iyer, R., & Cutler, B. (2004). Nostalgia Advertising and the Influence of
Nostalgia Proneness. Marketing Management Journal, 14(2).
Sierra, J. J., & McQuitty, S. (2007). Attitudes and emotions as determinants of nostalgia
purchases: An application of social identity theory. Journal of Marketing Theory and
Practice, 15(2), 99-112.

205
Brand Trust & Students Loyalty: Modeling a path analytic approach
Anish Yousaf, Harnoor Kaur Sandhu & Ravinder Dogra
Rajalakshmi School of Business; Mittal School of Business & IITTM, Gwalior
Abstract
Purpose – Building brand trust among customers is very important for marketers (Sahin, Zehir, &
Kitapci, 2011) and academics is no exemption. Despite its importance, academic research lack
sufficient empirical investigations in this area. Current study aims to measure and asses empirically
the relationship between brand trust and student loyalty towards academic institutions. An attempt
was, therefore, made to investigate the impact of brand trust on student’s loyalty which can have
implications for positive word-of-mouth.
Sampling & Measurement - Stratified random sampling technique was used to arrive at the final
sample of 580 respondents which was divided into two halves. The first half was used for scale
validation and the other half was used for checking nomological validity followed by a path
analysis modeling between dimensions of brand trust and student’ loyalty. Brand Trust (18 items),
Student satisfaction (3 items) and word-of-mouth (4 items) was measured using Guriez and
Korchia (2002) and Ballester and Aleman (2005). Brand trust was defined as consisting of
reliability (4 items), credibility (3 items), integrity (3 items), commitment (3 items), and
benevolence (5 items) on a 7 point-Likert scale from 1 (Strongly Disagree) to 7 (Strongly Agree).
Method - A structured questionnaire was prepared consisting of two sections. Section A consists
of demographic related information and section B included 25 items for measuring the constructs.
The model fit indices for first order model for brand trust construct were found satisfactory. The
results for factor loadings, composite reliability, AVE, Cronbach alpha and nomological validity
indices were also found satisfactory and above the cut off level (Hair et al., 1998).
Findings – Results of data analysis revealed that brand trust towards an educational institution
impact the loyalty of students which in turn positively generate positive word-of-mouth. This in
the long-run can help universities to attract more students at zero cost in a highly competitive
education industry especially in case of outgoing students.
Significance - Findings of the study have direct implications for top management / administrators
or large academic institutions that can use them to increase students’ trust toward their institutions
generating student loyalty, hence, word-of-mouth in the long-run. Directions for future research
and Limitations of the study are also discussed at the end of the paper.
Keywords: brand trust, student satisfaction, higher education, private universities, lovely
professional university, word-of-mouth

206
References
Ballester, E. D. & Aleman, J. L. M. (2005). Does brand trust matter to brand equity? Journal of
Product & Brand Management, 14(3), 187-196.
Hair, J.F. Jr. , Anderson, R.E., Tatham, R.L., & Black, W.C. (1998). Multivariate Data Analysis,
(5th Edition). Upper Saddle River, NJ: Prentice Hall.
Gurviez, P. & Korchia, M. (2002). Proposition of a multidimensional brand-trust scale. Recherche
et Applications en Marketing, 17(3), 41-59.
Sahin, A., Zehir, C. & Kitapci, H. (2011). The effects of brand experiences, Trust and Satisfaction
on Building Brand Loyalty: An Empirical Research on Global Brands. Procedia – Social
& Behavioral Sciences, 24, 1288-1301.
Annexure:
Figure: Final Model Validation via Path Analysis
*The First Order and Second Order Models can be shown on request.

207
Customer Brand Engagement Fosters Brand Loyalty with special reference to App based Cab
services
Neena Prasad & Preran Prasad J M
Global academy of Technology, Bengaluru; M S Ramaiah Institute of Technology, Bengaluru
Introduction
Consumer brand engagement is an extension of the relationship with the customers who interact
with the brand and share their experiences with the brand. The outcome of this new phenomenon
is rewarding to the marketer in the contemporary market place because the brand moves closer to
the consumer and gets embedded in their minds through their protagonist view in terms of a
satisfied physical and value based propositions coupled with technological revolutions. The app
based cab hailing services in India with special reference to UBER, OLA and MERU have been a
major market disruptor with due consideration to the high impact of digitalization as it brought
with it convenience, assurance, value for money, saved time and fatigue of driving through traffic
clogged roads. The transformation in the behavioral intention of the customers’ usage of the app
aided by the high penetration of smartphones has made an impact on the customer experience,
which is further enhanced by brand attitudes and brand relationship.
The aim of this study was to consider the app based cab services and empirically examine whether
customer brand engagement would foster brand loyalty and hence a hypothesis, which states that
customer experience, does not influence brand attitude and brand relation has been formulated
with an assumption that customer experience is mainly nurtured by emotions.
In this study, customer experience has been collated to a relationship similar to the relationship
that is developed between people, which may sometimes be very genuine or at times may be need
based. Understanding the difference between these two types of relationships is very critical and
marketers who realize this will be successful in their brand positioning, retaining the customers
and will be able foster brand loyalty. This has been evaluated on the basis of the customers’
response to the brand depending on the value proposition expressed in terms of price and the
experience evaluated in terms of the emotions it delivers.
Research Methodology
The Research gap was identified on the premise that the influence of the all-pervasive technology
in every speck of business and the lives of human beings have brought in a revolution driving the
marketers to the wall in the context of customer relations and profits which subsequently has given
rise to a collective business objective of driving organic growth which the business organizations
have to address by encouraging customer engagement activities in order to sustain brand loyalty
in sharing economy with special reference to app based cab hailing services. To investigate the
existence of relationship between customer experience and brand loyalty would be the first
objective and to contain customer defection by ensuring a great customer experience and real-
perceived value that makes up for a synergistic lifetime relationship between the brand and the
customers would be the second objective. A sample of 100 respondents who use app based services

208
were chosen. Based on the results from the regression analysis, which was used to test the
hypotheses, the respondents were classified as high or low in affective orientation in terms of
consumer brand attitudes and brand relations that eventually helps in fostering brand loyalty.
Managerial Implications
The implications of this study provide a rather useful insight on the essential elements needed to
implement a successful customer brand engagement strategy from the service providers’
perspective.
Conclusion
The results of this study provide a promising evidence to support the growing field of experience-
based marketing and the need for the right brand strategies. The study has been concluded by
stressing on the importance of emotions and customer experience on customer brand engagement
activities. Also, the study suggests that customizing the brand engagement activities in the
background of the cultural diversity would be significant in activating customers’ emotions and
would act as a catalyst in establishing a genuine relationship purely centred around the value
propositions as perceived by them.
Keywords: Brand Attitude, Emotions, Customer Engagement, Customer Experience, Brand
Loyalty.
References
Chan, N. (2014). 3 customer engagement strategies that marketers can’t ignore. Available:
http://www.outbrain.com/blog/2014/06/3-golden-customer-engagement-strategies-that-
marketers-cant-ignore.html. Last accessed 12th June 2017.
Chang, Pao-Long and Ming-Hua Chieng (2006), “Building consumer-brand relationship: A cross-
cultural experiential view. Psychology & Marketing, 23(11), pp. 927-59.
Gambetti, R. C. et al. (2012). The Grounded Theory approach to consumer–brand engagement:
The practitioner’s standpoint. International Journal of Market Research. 54 (5), pp. 659 – 687.
Gunelius, S. (2013). How to Build Brand Engagement – Part 1: http://aytm.com/blog/research-
junction/how-to-build-brand-engagement-part-1/. Last accessed 12th June 2017.
Hollebeek, L.D. (2011a) Exploring customer–brand engagement: definition and themes. Journal
of Strategic Marketing, 19, pp. 555–573.
Ute Walter, Bo Edvardsson, Åsa Öström, (2010) "Drivers of customers' service experiences: a
study in the restaurant industry", Managing Service Quality: An International Journal, Vol. 20
Issue: 3, pp. 236-258, https://doi.org/10.1108/09604521011041961

209
Services Outsourcing and Performance: Evidence from US Hospitals
Saurabh Mishra, Sachin B. Modi & Peter A. Salzarulo
McGill University; Wayne State University & Miami University
Service organizations often struggle with the decision to outsource key activities and processes to
potentially improve financial performance versus keeping them in-house to better safeguard
service quality to customers. Due to increasing governmental scrutiny and pressures from other
stakeholders, these pressures are exceptionally acute for hospitals as they look to control costs
while delivering high quality patient care. However, extant literature in marketing provides limited
insight into the performance implications of services outsourcing for organizations and there is
scant attention in marketing on hospitals as a services context. To address these issues, this paper
presents a framework understanding the influence of services outsourcing of hospitals on their
financial performance and patient care quality. The framework is evaluated using a comprehensive
database covering more than 90% of hospitals in the United States over a 14-year period (1996 –
2009). Results utilizing a mixed-methods estimation approach and accounting for indigeneity
concerns confirm the tradeoff between financial and customer performance in relation to services
outsourcing in hospitals and highlight key boundary conditions to guide hospital administrators.
Overall, the study provides some novel insights and practical implications for service managers in
general and hospital administrators in particular.

210
A comparative study of preferred purchase media for fashion apparels
Mallika Srivastava , Semila Fernande, Vidyasaga. A & Tanay Singh & Janhavi Kanthak
SIBM Bengaluru
A reasonable depth of understanding of service quality is vital for recognizing the parts of service
requiring execution management, surveying how much change is required on every angle, and
assessing the effect of changes made. Service quality is unique and not like product quality which
can be measured easily because the latter is quantifiable, and consequently service quality is best
measured by studies that measure client assessments of service. One of the primary measures to
be developed particularly to quantify service quality was the SERVQUAL study.
The SERVQUAL scale involves a survey containing 21 service attributes, grouped into five
service quality dimensions of reliability, responsiveness, assurance, empathy and tangibles. The
survey sometimes asks the customer to provide two different ratings on each attribute –one
reflecting the level of service they would expect from excellent companies in a sector and the other
reflecting their perception of the service delivered by a specific company within that sector. The
difference between the expectation and perception ratings constitutes a quantified measure of
service quality.
Introduction
The ability to sustain delivery of quality services is essential for long-term success of service
companies (Owen et al., 2001), and companies differentiate themselves by maintaining higher
quality sustainably (Kotler et al., 2001). The service quality provided by e-services take into
consideration a wider range of focus points which can make a break the online service, i.e. the
quality of website in terms of delivering the intended message as clearly as possible, navigation
through the website and security of it as well. (Barnes and Vidgen, 2002; Loiacono et al., 2007;
Wolfinbarger and Gilly, 2002; Zeithaml et al., 2002; Santos, 2003; Parasuraman et al., 2005). E-
service compliments the core aspect of any business who shift from a brick and mortar to a click
store. Thus, e-service quality implies the degree to which an online site facilitates efficient and
effective shopping experience, purchasing and delivery of products and services being made
convenient (Zeithaml, 2002; Zeithaml et al, 2000).

211
Literature Review
Service quality is basically the differentiation of the expectations a customer has on the firm and
the perceived service performance of the firm (Parasuraman et al, 1988). Past research creates the
relationship between word-of-mouth marketing (Caruana, 2002), profitability (Santos, 2003),
costs (Crosby, 1979), customer satisfaction (Cronin and Taylor, 1992) and service quality.
Additionally, service quality levels influence post-purchase behaviour along with individual’s
future decisions (Jabnoun and Al-Tamimi, 2003).
The examination of service quality is generally based on Parasuraman's research paper published
in 1988 which sheds light on the unique advancement in the measurement of service quality.
Extensive analysis of the reliability and legitimacy of the scale has resulted into creating a 22-point
scale (Parasuraman et al., 1991), which measures five distinct items on service quality. They are
mentioned below: Assurance, Responsiveness, Tangibles, Reliability and Empathy.
SERVQUAL is generally used in an assortment of enterprises, including the banking sector
(example; Caruana, 2002) and is a vital predecessor to consumer loyalty, which is inseparably
connected to the pre-purchase behaviour of customers and the process involved in decision making
(Cronin and Taylor, 1992).
E-service quality
The ascension of web based services has altered the manner in which organizations and customers
interface. E-Service is conceptualized being an intuitive data source (Rowley, 2006) which gives
a functioning mechanism to firms to separate their service offering and fabricate a competitive
advantage over other players (Santos, 2003). Key subjects inside the e-service journals
incorporates the measurements and estimation of E-service, components of website involvement
and its linkage towards web experience, trust, consumer loyalty, expectation to buy, and reliability
(Rowley, 2006). This ideates the importance of innovative service facilitators as compared to
traditional research on service quality which highlights the human component of service
administration (Jabnoun and Al-Tamimi, 2003).
Previous research on e-service quality embraced traditional SERVQUAL measurements when
online environments are looked at, creating scales without adequate quantifiable data,
212
concentrating on the assessment of website quality instead of entire service quality measurements,
and barring the appraisal of the customer buying process (Kim et al., 2005; Parasuraman et al.,
2005). For example, Szymanski and Hise (2000) analyze satisfaction levels instead of client
service or satisfaction with regards to online convenience, marketing, website layout along with
financial security (Zeithaml et al., 2002). Yoo and Donthu (2001) constructed a 4 point
SITEQUAL scale focusing predominantly on website attributes which includes usability, website
design, processing speed and security.
Upon recognizing these shortcomings, Zeithaml et al. (2002) developed an e-service quality
measure (e-SQ), which includes five dimensions: Availability of information, Ease of use, Privacy,
Graphic style, and Reliability. In another study conducted by (Parasuraman et al., 2005) the e-
service quality dimensions were reduced to four: Efficiency, Fulfilment of need, Availability, and
Privacy. In a cross-examinatoin of e-service quality involving online book and CD stores, Ribbink
et al. (2004) stated their own items: Customisation, Responsiveness, Ease of use, Assurance, and
e-Scape.
Research Focus
Zeithaml (2000) suggested various questions related to service quality, productivity, and client's
financial worth. They ask in what ways can organizations achieve high service quality for clients
to acquire hostile impacts, what levels of service arrangements are expected to retain customers,
what parts of services are most vital for client retention, what marketing and service factors direct
the connection between profits and service quality? According to our study, e-service quality
sustainability is a part of the answer. The other part of the solution is rather a mixture of both
regular service quality as well as m-service quality. There is no one plausible solution if the three
service entities are looked as individuals. Only when all three are brought into focus at the same
point of time is when an all-round solution to improving the quality can be a viable solution. Firm
related factors which were identified from internal users’ perspectives to explore organizational
characteristics as antecedents to both e-service quality and its sustainability, in contrast to other
studies that only focus on perceptual attributes (e.g. site maneuverability, checkout speed, order
accuracy, etc.) (Zeithaml et al., 2000) is only a part of the bigger picture. The customer is now
exposed to new avenues where he is exposed to the brand. Here, we would like to point out that
the answer to which area to focus on has become dynamic. No more is the customer going to look
only on one platform (brick and mortar, websites, mobile interface) for the brand. Therefore,

213
service quality needs to be updated on all three platforms at the same point of time in order to
increase chances of a positive outcome at moments of truth. (Times when the customer comes in
contact with the brand (either physically or virtually)).
Although strong theory usually stems from a few hypotheses (Sutton and Staw, 1995), we
encompass a larger number of organizational perspectives, with the goal of filling a gap of theory
and empirical research absent from the literature.
Previous Research Research Sample SERVQUAL Dimensions
Parasuraman et al. (1988) Customers Reliable, Assurance,
Tangible, empathy and
responsiveness.
Oberoi & Hales (1990) Customers Tangibles and in-tangibles
Knutson et al. (1990) Customers Reliable, Assurance,
Tangible, empathy and
responsiveness.
Saleh & Ryan (1991) Customers Tangibles, avoid sarcasm,
Conviviality, reassurance,
and empathy
Getty & Thompson (1994) Customers Tangibles and in-tangibles
Akan (1995) Customers knowing and understanding
the customer, accuracy and
speed of service, solutions to
problems , Courtesy and
competence of the personnel,
communications and
transaction, tangibles, and
accuracy of hotel
reservations
Ekinci et al. (1998) Customers Tangibles and in-tangibles
Al-Khatib & Gharaibeh
(1998)
Customers Physical features and
facilities, the staff you

214
contact, responsiveness to
customer’s needs, pricing
dimensions
Mei et al. (1999) Customers Employees, tangibles, and
reliability
Abo Roman (2002) Customers He found that there was
negative gap between the
expected level of service
quality and the actual
performed quality in the fast
food, at McDonald’s
restaurant
Al-Tamimi and Al-Amiri
(2003)
Customers Tangibles, reliability, and
empathy
Khan (2003) Customers Responsiveness, assurance,
Tangibles, eco-tangibles,
reliability and empathy
Al-Shurah (2004a) Customers Physical surrounding along
with service personnel
Arasli et al. (2005) Customers Reliability, assurance,
Tangibles, and empathy
Jabnoun and Khalifa (2005) Customers reliability, Personal skills,
values, and image
Kang (2006) Customers Reliable, Assurance,
Tangible, empathy and
responsiveness.
Ladhari (2009) Tangibles, confidence and
communications, reliability,
responsiveness,

215
Objective of the study
The purpose of this paper is to track customer’s expectations and perceptions on their preferred
media like online, offline and mobile shopping for purchase of fashion apparel. Different scales of
SERVQUAL dimensions SERVQUAL, M-SERVQUAL, and E-SERVQUAL will be used to
identify the gaps. A comparative analysis between three types of SERVQUAL dimensions M-
SERVQUAL, E-SERVQUAL, and SERVQUAL on customer’s expectations and perceptions will
also be conducted. Additionally, to identify how and why SERVQUAL items are varied from
managers’ and customers’ perspectives, along with evaluating antecedents and outcomes of
service quality.
Methodology
A survey questionnaire will be conducted among 300 participants, falling in the age group 20-30
years of age, regarding consumer perception and expectations regarding purchase of fashion
apparels on their preferred media of purchase, online, offline and mobile. The data will be analysed
using ANOVA on the five-dimensional SERVQUAL model along with its effect on the
satisfaction of customers. The target population for the research will be city of Bengaluru, India.
Sample Frame
Bengaluru being the IT Hub of the country with population covering the entire socio-economic
spectrum was found appropriate by the researchers to conduct the study. The demographic
diversification of the population can be seen clearly.
Data Analysis
The SERVQUAL Model.
The SERVQUAL model has been developed in a rather high number of versions applied in
assorted industries. It was designed to evaluate customers` perceptions of service quality with the
aim to examine the degree of implementation of an effective and reliable business (Hill and
Alexander, 2006). The SERVQUAL model has been chosen over other models as one that has
been well used in assorted industries and also as one that could bring a status of research validity
(Heung et al, 2000). The main purpose of model is to apply its dimensions in identifying the gap
216
between customer expectations and perceptions (Peters and Pikkemaat, 2006; Zeithaml et al,
2006). Vendors and customers may perceive level of quality differently.
Factor Analysis
A statistical tool measures the impact of a few un-observed variables called factors on a large
number of observed variables. It may be used to uncover and establish the cause and effect
relationship between variables or to confirm the hypothesis. It is often used to determine a linear
relationship between variables before subjecting them to further analysis. Principle factor analysis
is also called Common factor analysis and it aims to identify the minimum number of factors that
can lead to correlation between a given set of variables.
ANOVA (Analysis of Variance)
It is used to test if there exists a significant difference between the means. Say, a retail chain wants
a better understanding of its customers buying behaviour to increase its footfalls. It can construct
a questionnaire to be administered among mall visitors and also conduct focus group interview
among select few top malls. Data from these will help create a profile of the customers and
ANOVA will help determine which mall is considered best for factors like prices, recreational
activities, fashion, value for money and so on. This information can then be used to create an
effective marketing campaigns to increase footfalls.
Proposed Findings
From the author’s viewpoint, SERVQUAL comprise of five dimensions which follow a RATER
approach: reliability, tangibility empathy, assurance, and responsiveness. We intend to find the
SERVQUAL dimensions from the customer’s point of view and obtain concrete conclusion on
comparative analysis between three types of SERVQUAL dimensions (M-SERVQUAL, E-
SERVQUAL, SERVQUAL) on customer’s expectations and perceptions.
Implications
The results will allow companies to identify domains in which strengths and weaknesses related
to sustainable e-service quality reside, and information obtained will be of diagnostic value as a
leading factor in defining future strategies for service quality management.

217
Limitations
Some part of the questionnaire is based on qualitative data which is hard to assess as it is
statistically unreliable. Furthermore, there might be respondents who do not fill in the survey
completely on the required parameters. For such instances, the author’s discretion will be taken
into consideration. The SERVQUAL model is a generic instrument for measuring service quality
across different service sector and not a specific tool to quantity perceptual data.
The validity of the SERVQUAL model as a generic instrument for measuring service quality
across different service sector has been raised. SERVQUAL five dimensions are not universal.
Items do not always load on to the factors which one would a priori expect; and there is a high
degree of inter correlation between the five dimensions.
References
Bibliography
Abo Roman, A. (2002). The measurement of service quality in the fast food: an empirical study
on McDonalds chain restaurants in Amman. Jordan Journal of Applied Sciences, 28(5), 1-
24.
Adrienne Curry, E. S. (2002). Assessing the quality of physiotherapy services using Servqual.
International Journal of Health Care Quality Assurance, 15(5), 197-205. Retrieved from
https://doi.org/10.1108/09526860210437412
Akan, P. (1995). Dimensions of service quality: A study in Istanbul. Managing Service Quality,
6(6), 39-43. Retrieved from
http://www.emeraldinsight.com/doi/full/10.1108/09604529510796575
Al-Khatib, F. a. (1998). Service quality: bank customers’ expectations and perceptions in Jordan.
Journal of Dirasat, Administrative Sciences, 25(1), 199-210.
Al-Shurah, M. (2004). Customers’ evaluation for the physical evidence and employees at fast food
restaurants – KFC: an empirical study. Mu’tah Lil-Buhuth Wad-Dirasat, 19(2), 189-214.
Al-Shurah, M. (2004). The measurement of quality services of Amman five stars hotels services
as perceived by hotel’s quests. Jordan Journal of Applied Sciences, 7(1), 62-76.

218
Al-Tamimi, H. a.-A. (2003). Analyzing service quality in the UAE Islamic banks. Journal of
Financial Services Marketing, 8(2), 119-132. Retrieved from
https://link.springer.com/article/10.1057%2Fpalgrave.fsm.4770112
Amjad A. Abu‐El Samen, M. N.‐L. (2013). Mobile SERVQUAL: A Comparative Analysis of
customers' and managers' perception. International Journal of Quality & Reliability
Management, 30(4), 403-425. Retrieved from
https://doi.org/10.1108/02656711311308394
Analyzing service quality in the UAE Islamic banks. (2003). Journal of Financial Services
Marketing, 8(2), 119-132. Retrieved from
https://link.springer.com/article/10.1057%2Fpalgrave.fsm.4770112
Arasli, H. K.-S. (2005). A comparison of service quality in the banking industry: some evidence
from Turkish- and Greek-speaking areas in Cyprus. International Journal of Bank
Marketing, 23(7), 506-526. Retrieved from
http://www.emeraldinsight.com/doi/full/10.1108/02652320510629881
Carmel Herington, S. W. (2009). E-retailing by banks: e-service quality and its importance to
customer satisfaction. European Journal of Marketing, 43(9/10), 1220-1231. Retrieved
from https://doi.org/10.1108/03090560910976456
Cronin, J. a. (1992). Measuring service quality: a re-examination and extension. Journal of
Marketing, 56(3), 55-68. Retrieved from
http://www.jstor.org/stable/1252296?origin=crossref
Ekinci, Y. R.-S. (1998). Which school of thought? The dimensions of resort hotel quality.
International Journal of Contemporary Hospitality Management, 10(2), 63-67. Retrieved
from http://www.emeraldinsight.com/doi/full/10.1108/09596119810207200
Getty, J. a. (1994). The relationship between quality, satisfaction, and recommending behaviour
in lodging decisions. Journal of Hospitality & Leisure Marketing, 2(1), 3-22. Retrieved
from http://www.tandfonline.com/doi/abs/10.1300/J150v02n03_02

219
Gjoko Stamenkov, Z. D. (2015). A sustainable e-service quality model. Journal of Service theory
and practice, 25(4), 414-442. Retrieved from https://doi.org/10.1108/JSTP-09-2012-0103
Ilieva, J. B. (2002). Online surveys in marketing research: pros and cons. International Journal
of Market Research, 44(3), 361-367. Retrieved from
http://cel.webofknowledge.com/InboundService.do?mode=FullRecord&customersID=aty
poncel&IsProductCode=Yes&product=CEL&Init=Yes&Func=Frame&action=retrieve&
SrcApp=literatum&SrcAuth=atyponcel&SID=X1NmaBXV785TmjVpBNt&UT=WOS%
3A000177223400006
Jabnoun, N. a. (2005). A customized measure of service quality in the UAE. Managing Service
Quality, 15(4), 374-388. Retrieved from
http://www.emeraldinsight.com/doi/abs/10.1108/09604520510606844
Kang, G. (2006). The hierarchal structure of service quality: integration of technical and
functional quality. Managing Service Quality, 16(1), 37-50. Retrieved from
http://www.emeraldinsight.com/doi/abs/10.1108/09604520610639955
Kang, G. a. (2004). Service quality dimensions: an examination of Gronroos’s service quality
model. Managing Service Qualtiy, 14(4), 266-277. Retrieved from
http://www.emeraldinsight.com/doi/full/10.1108/09604520410546806
Khan, M. (2003). ECOSERV: ecotourists quality expectations. Annals of Tourism Research,
30(1), 109-124. Retrieved from
https://www.sciencedirect.com/user/chooseorg?targetUrl=%2Fscience%2Farticle%2Fpii
%2FS0160738302000324%3Fvia%253Dihub
Knutson, B. S. (1990). LODGSERV: A service quality index for the lodging industry. Hospitality
Research Journal, 14(2), 227-284.
Ladhari, R. (2008). Alternative measures of service quality: a review. Managing Service Quality,
18(1), 65-86. Retrieved from
http://www.emeraldinsight.com/doi/abs/10.1108/09604520810842849

220
Ladhari, R. (2009). A review of twenty years of SERVQUAL research. International Journal of
Quality and Service Sciences, 1(2), 172-198. Retrieved from
https://doi.org/10.1108/17566690910971445
Ladhari, R. (2009). Service quality, emotional satisfaction, and behavioural intentions: a study in
the hotel industry. Managing Service Quality, 19(3), 308-331.
Mei, A. D. (1999). Analyzing service quality in the hospitality industry. Managing Service
Quality, 9(2), 136-143. Retrieved from
http://www.emeraldinsight.com/doi/full/10.1108/09604529910257920
Oberoi, U. a. (1990). Assessing the quality of the conference hotel service product: Towards an
empirically based model. Service Industries Journal, 10(4), 700-721. Retrieved from
http://www.tandfonline.com/doi/abs/10.1080/02642069000000083
Parasuraman, A. B. (1991). Refinement and reassessment of the SERVQUAL scale. Journal of
Retailing, 67(4), 420-450. Retrieved from
http://www.emeraldinsight.com/servlet/linkout?suffix=p_58&dbid=128&key=A1991HP
01800003&doi=10.1108%2F02656711311308394&cf=showBestFormat
Saleh, F. a. (1991). Analysing service quality in the hospitality industry using the SERVQUAL
model. Services Industries Journal, 11(3), 324-343. Retrieved from
http://www.tandfonline.com/doi/abs/10.1080/02642069100000049
Sang-June Park, Y. (2016). Performance-only measures vs. performance-expectation measures of
service quality. The Service Industries Journal, 36(15-16), 741-756. Retrieved from
https://doi.org/10.1080/02642069.2016.1275579
Sunil Sahadev, K. P. (2008). Modelling the consequences of e-service quality. Marketing
Intelligence & Planning, 26(6), 605-620. Retrieved from
https://doi.org/10.1108/02634500810902857

221
The Fragility of Market Leadership : Insights from a Historiographical Approach
Debanjan Mitra & Peter Golder
University of Florida; Dartmouth College
Market share leadership is a strategic imperative at many leading companies. Theories
abound on market leaders’ persistence as well as their transience. Yet, surprisingly little is known
about market leadership’s fragility in terms of actual durations. The authors take a
historiographical approach in compiling leadership durations of market leaders over nearly a
century and across numerous consumer product categories. Expected leadership durations in recent
decades range between 11-16 years, dramatically shorter than the durations identified in the current
literature. Interestingly, once market leadership is lost, the likelihood of regaining it drops
precipitously after only nine months following the loss. The authors discuss the implications of
these and many other related findings for management practice and future research.
Keywords: Market Leadership, Leadership Duration, Persistence, Market Evolution, Historical
Method, Archival data.
Introduction
The ultimate goal of many marketing managers is to be the number one selling brand in
their category. Battles for market supremacy have generated some of the most compelling histories
in marketing—Coke vs. Pepsi, Ford vs. Chevrolet, Colgate vs. Crest, Pampers vs. Huggies, and
Sony vs. Nintendo. Brands with the highest market share have been found to enjoy many
advantages over lower-tier brands including lower unit costs of production and advertising, a
broader customer base, higher purchase frequency, and greater customer loyalty (e.g., Ehrenberg
1988; Fader and Schmittlein 1993). In fact, customers often use a heuristic of purchasing the top-
selling brand in a category (Aaker 1996). Leading brands also have more time to respond to
competitors’ actions because of the ‘cushion’ of popularity that they enjoy although “such market
leadership may not be reflected immediately in financial performance” (Crittenden et al. 2011, p.
80; Ferrier, Smith, and Grimm 1999; Mitra and Golder 2006). As a result of these forces, market
leaders tend to enjoy a substantial market share advantage over number two brands7 as well as a
profit advantage over lower share brands (Buzzell, Gale, and Sultan 1975; Gawer and Cusumano
2002; Wernerfelt 1986). Not surprisingly, market share leadership is so fundamental to
competitive strategy that firms seek to achieve it even by “pricing below cost during the product
launch phase to stimulate growth and accumulate experience faster than rivals” (Varadarajan 1999,
p. 91; Ritz 2008). Today, Bloomberg validates the financial significance of market leadership by
highlighting market leaders in each industry based on their market shares.8 Jeff Bezos, Amazon
CEO, states:
7 Based on IRI data, the average market share gap between the number one and number two selling brands is 21.4%. Also see Axtell (2001) for an empirical generalization on the difference. 8 http://www.bloomberg.com/visual-data/industries/q/market-leaders

222
“The stronger our market leadership, the more powerful our economic model.
Market leadership can translate directly to higher revenue, higher profitability,
greater capital velocity, and correspondingly stronger returns on invested capital.”9
Indeed, the goal of becoming the top-selling brand is a strategic imperative at many preeminent
companies including Procter & Gamble, General Electric, and Amazon.com. However, even
though market share leadership is important to managers, researchers, and financial analysts,
surprisingly few studies examine the actual frequency and duration of maintaining market
leadership. Even fewer studies examine loss of market leadership and no previous study examines
regaining market leadership. As a result, fundamental empirical questions remain unanswered.
For decades, researchers have advanced theories supporting either leadership persistence
or leadership transience (e.g., see Kozlenkova et al. 2014 for an excellent perspective on resource
based theory followed by commentaries by Birger Wernerfelt, Jay Barney, and George Day). At
one end of the philosophical spectrum, economist Joe Bain (1956) set the stage for future
leadership persistence researchers by documenting the many barriers confronting competitors of
leading brands. At the other end of the spectrum, Joseph Schumpeter (1939), argued that markets
are dynamic, with innovation and entrepreneurship opening doors for competitors to overtake
leading brands. Unfortunately, empirical evidence in support of these philosophies remain
selective, at best, and suffer from four critical limitations. First, as highlighted in an American
Economic Review article, “the central problem with the [persistence] debate is that no benchmark
is proposed relative to which the duration of leadership might be judged long or short” (Sutton
2007, p. 222, italics added). Therefore, conclusions of leadership persistence (Bain 1956;
Bronnenberg, Dhar, and Dubé 2009; Chandler 1962, 1990; Dekimpe and Hanssens 1995; Lal and
Padmanabhan 1995; Schmalensee 1982) or leadership transience (Abernathy and Clarke 1985;
Aghion and Howitt 1992; Golder 2000; Schumpeter 1939, 1989) are not judged relative to an
accepted baseline market leadership persistence rate. Second, sample sizes in empirical analyses
tend to be small. Third, most studies utilize data from decades ago when market conditions and
their impact on leadership may have been substantially different than they are today. Fourth, the
industries examined tend to be primarily manufacturing industries, whereas claims of long-term
leadership are more often made for mature consumer goods. Due to these limitations, the net result
of the forces promoting leadership persistence versus the forces promoting leadership transience
is not clear, especially for mature consumer goods. Therefore, both multi-category and long-term
empirical evidence is necessary to shed light on the conflicting perspectives of Bain’s paradigm of
leadership persistence and Schumpeter’s paradigm of leadership transience.
In this study, we examine newly collected evidence on the prevalence of leadership
persistence and leadership transience in 125 broadly defined mature consumer goods markets
based on archival records of annual market shares in 1921, 1962, 1982, and in more recent periods
at five year intervals: 1995, 2000, 2005, 2010, and 2015. Using such a historiographical approach,
we address the following research questions:
1. How frequently do market leaders persist as leaders?
2. How long do market leaders persist as leaders?
3. Is expected future leadership duration related to prior leadership duration?
9 http://www.sec.gov/Archives/edgar/data/1018724/000119312511110797/dex991.htm

223
4. When market leaders lose leadership, how frequently do they regain it?
5. When market leaders lose leadership, how long does it take to regain leadership?
6. Do these results vary across types of product categories?
We supplement our analyses using a second dataset sourced from Information Resources
Inc. (IRI) aggregated store panel data. These data consist of leading brands in 877 narrowly defined
consumer product categories measured quarterly from 2003-2008. The IRI data, compiled over a
shorter observation period but at higher frequency, enable us to validate our findings based on the
longer observation period lower frequency archival data.
The remainder of the paper is organized as follows. The next section presents extant
theories and empirical evidence for leadership persistence and leadership transience. Following
that, we describe our method and present results on our six research questions. Finally, we
summarize our findings, discuss their implications, and outline directions for future research.
224
Through the Looking Glass: Role of Construal Level on Description-Intensive Reviews
Swagato Chatterjee & Aruna Divya T.
International Management Institute, Kolkata, Indian Institute of Management, Ahmedabad
Despite the increasing importance attached to the post-consumption consumer engagement
(Venkatesan, 2017), the questions framed around the effect of consumer’s psychological factors
on post-consumption engagement drivers remains largely unexplored. Encouraging consumers to
share experiences across several media is one way to ensure ongoing engagement. We contribute
to the stream of studies which have shed light on factors that motivate consumers to share their
experiences through reviews (Luís Abrantes, Seabra, Raquel Lages and Jayawardhena, 2013;
Alves, Abrantes, Antunes, Seabra and Herstein, 2016). In this paper, we focus on how consumer’s
construal level impacts the propensity to express their opinions by means of detailed vs. brief
reviews. We also focus on how such propensity can impact consumers’ overall evaluations. We
narrow our theoretical arguments and hypothesis to the evaluation of services context where the
overall evaluation could be on two broad components –outcome (during and post-exchange result
for the consumer) and process (the way through which the outcome is transferred) (Mohr and
Bitner, 1995; Dabholkar and Overby, 2005). Based on the theories of construal level and
information processing we propose:
H1: Consumers’ in lower construal level give reduced importance to others’ experiences.
H2: Consumers’ in lower construal consumers give increased importance to own
experience with service process and reduced importance to own experience with service
outcome.
H3: Information accessibility of own experience mediates the above relationship.
We have used real life data on consumer reviews from a well-known hotel review website.
Our results support the above mentioned hypotheses. While the results found in the paper are
unique and contributing to the theoretical understanding of consumer’s retrospective evaluation,
our results also have important managerial implications for service managers it terms of
understanding about the correct time to solicit reviews, correct way of solicit reviews and correct
design of the website while soliciting reviews.

225
REFERENCES
Alves, S., Abrantes, J. L., Antunes, M. J., Seabra, C., and Herstein, R. (2016). “WOM antecedents
in backpacker travellers”. Journal of Business Research, 69(5), 1851-1856.
Dabholkar, P. A., and Overby, J. W. (2005). “Linking process and outcome to service quality and
customer satisfaction evaluations: An investigation of real estate agent service”. International
journal of service industry management, 16(1), 10-27.
Dhar, R., and Kim, E. Y. (2007). “Seeing the forest or the trees: Implications of construal level
theory for consumer choice”. Journal of Consumer Psychology, 17(2), 96-100.
Kim, K., Zhang, M., and Li, X. (2008). “Effects of temporal and social distance on consumer
evaluations”. Journal of Consumer Research, 35(4), 706-713.
Kyung, E. J., Menon, G., and Trope, Y. (2010). “Reconstruction of things past: Why do some
memories feel so close and others so far away?”. Journal of experimental social psychology, 46(1),
217-220.
Liberman, N., Trope, Y., and Wakslak, C. (2007). “Construal level theory and consumer
behaviour”. Journal of Consumer Psychology, 17(2), 113-117.
Luís Abrantes, J., Seabra, C., Raquel Lages, C., and Jayawardhena, C. (2013). “Drivers of in-group
and out-of-group electronic word-of-mouth (eWOM)”. European Journal of Marketing, 47(7),
1067-1088.
Mohr, L.A. and Bitner, MJ. (1995), “The role of employee effort in satisfaction with service
transactions”, Journal of Business Research, 32(3), 239-52.
Pizzi, G., Marzocchi, G. L., Orsingher, C., and Zammit, A. (2015). “The Temporal Construal of
Customer Satisfaction”. Journal of Service Research, 18(4), 484-497.
Stapel, D. A., and Koomen, W. (2001). “I, we, and the effects of others on me: how self-construal
level moderates social comparison effects”. Journal of personality and social psychology, 80(5),
766.
Trope, Y., Liberman, N., and Wakslak, C. (2007). “Construal levels and psychological distance:
Effects on representation, prediction, evaluation, and behaviour”. Journal of consumer
psychology, 17(2), 83-95.
van Baaren, R. B., Maddux, W. W., Chartrand, T. L., De Bouter, C., and van Knippenberg, A.
(2003). “It takes two to mimic: behavioral consequences of self-construals”. Journal of personality
and social psychology, 84(5), 1093.
Venkatesan, R. (2017). “Executing on a customer engagement strategy”, Journal of the Academy
of Marketing Science. 1-5
White, K., MacDonnell, R., and Dahl, D. W. (2011). “It's the mind-set that matters: The role of
construal level and message framing in influencing consumer efficacy and conservation
behaviors”. Journal of Marketing Research, 48(3), 472-485.

226
Marketing's role in Sustainability
Ravi Parameswaran , Krishna Parameswaran, Steven Kooy & Susan Kuzee
Oakland University
This paper examines how sustainability concepts emanating within the organization can
be channeled through the marketing function to evolve as a “top of consciousness” corporate
aspiration permeating the organization and the world beyond. The concepts presented in this paper
are then made concrete through reviewing the sustainable practices employed by Haworth Inc.
(Haworth), a global leader in the design and manufacture of office furniture and organic
workspaces based in Michigan and opportunities for applying sustainability concepts in the future
are explored. Based on the classic Brundtland Commission’s (1987) definition of sustainable
development (intergenerational compact built on three pillars: economic growth, ecological
balance, and social progress), we discuss how sustainability concepts are applied to other activities
such as mining, manufacturing, agriculture, forestry, and the like in order to determine how these
concepts can be applied to marketing before speculating on an augmented role for marketing in
the sustainability debate.
In order for sustainability efforts to be comprehensive, it has to address all four basic
economic activities within a society (Goodwin et. al 2007) -- resource maintenance (enhancing
an economy’s productivity by preserving or improving its stock of capital resources – natural,
manufactured, human, social and financial), production (conversion of resources into useful goods
and services), distribution (the sharing of products and resources among people through exchanges
and transfers) and consumption (process by which goods and services are put to final use by the
society at large). Sustainability in the two former activities is usually engendered through
conservation of natural resources and energy, mitigation of environmental impacts and
engagement of stakeholders. In contemporary business, the latter two activities are commonly
associated with the marketing function. Marketing with its generally perceived focus of
stimulating demand for products (Kotler and Keller 2009) can be unfavorably viewed as fostering
unsustainable levels of consumption but market mechanisms can be used to address environmental
and social problems. This paper highlights what sustainable practices are as applied to marketing
and how to avoid or mitigate behaviors that are unsustainable. In other words, the role of marketing
has shifted from a purely value delivery mode to a value exploration (a company identifying new
value opportunities), value creation (a company more efficiently creates promising new value
opportunities) and a value delivery (company uses its capabilities and infrastructure to deliver
these new offerings more efficiently) foci (Kotler, Jain and Maesincee 2002).
As the central and critical nature of marketing in the business domain is increasingly
appreciated, the dual roles of marketing have also crystallized. In addition to marketing’s role as
a function within the organization, it is also recognized as a set of values and processes that all
functions within participate in implementing (Moorman and Rust 1999). This recognition of
marketing as “the function of business” (Haeckel 1997) is known as the firm’s marketing
orientation. Therefore marketing is both an orientation and a function within an organization.
Moorman and Rust delineate the impact of both these roles for marketing in their Journal of
Marketing (1999) article.

227
It is this thesis, and demonstration through a case study using Haworth, of the potential
dual role of marketing in the elevation of sustainability consciousness within organizations, that
is the primary focus of this paper.
REFERENCES
Bhagwat, S. (2005). Economics of sustainable mining. In V. Rajaram, S. Dutta & K.
Parameswaran (Eds.), In sustainable mining practices- a global perspective. (pp. 54-61).
Leiden, Netherlands: A.A. Balkema Publishers.
Carson, R. (1962). Silent spring. New York, NY: Houghton Mifflin Company.
Chabowski, B. R., Mena, J. A., & Gonzalez-Padron, T. L. (2011). The structure of sustainability
research in marketing, 1958-2008: a basis for future research opportunities. Journal of the
Academy of Marketing Science, 39, 55-70. doi:10.1007/s11747-010-0212-7
Closs, D. J., Speier, C., & Meacham, N. (2011). Sustainability to support end-to-end value chains:
The role of supply chain management. Journal of the Academy of Marketing Science, 39,
101-116. doi:10.1007/s11747-010-0207-4
Goodwin, N. R., Nelson, J. A., Ackerman, F., & Weisskopf, T. (2006). Essential economic
activities. In C. Cleveland (Ed.), Encyclopedia of Earth. Retrieved from
http://www.eoearth.org/article/Essential_economic_activities
Haeckel, S. H. (1997). Preface. In D. Lehmann & K. Jocz (Eds.), Reflections on the futures of
marketing (pp. ix-xvi). Cambridge, MA: Marketing Science Institute.
Hult, T. M. (2011). Market-focused sustainability: Market orientation plus! Journal of the
Academy of Marketing Science, 39, 1-6. doi:10.1007/s11747-010-0223-4
Kilbourne, W. E. & Beckmann, S. (1998). Review and critical assessment of research on
marketing and the environment. Journal of Marketing Management, 14, 513-532.
Kotler, P., Jain, D. & Maesincee, S. (2002). A new approach to profits, growth, and renewal.
Boston, MA: Harvard Business School Press.
Kotler, P. & Keller, K. (2009). Marketing management (13th edition). Upper Saddle River, NJ:
Prentice-Hall.
Mooreman, C. & Rust, R. T. (1999). The role of marketing. Journal of Marketing, 63, 180-197.
Muth, R.J. & Parameswaran, K. (1998). The 21st century: Challenges and opportunities in the
mining industry. Proceedings International Symposium on Environmental Management of
Mining and Mineral Industries, (EMOMAMI-’98). Bhubaneswar, India, 84-104.
Peattie, K. (2001). Towards sustainability: The third age of green marketing. The Marketing
Review, 2, 129-146.

228
Rajaram, V., & Parameswaran, K. (2005). What is sustainable mining? In V. Rajaram, S. Dutta
& K. Parameswaran (Eds.), In sustainable mining practices- a global perspective. (pp. 1-
3). Leiden, Netherlands: A.A. Balkema Publishers.
World Commission on Environment and Development. (1987). Our Common Future, Oxford,
U.K.: Oxford University Press.

229
Strategies for US Business in the India Market: Ethnocentrism and Country-of-Origin
Nabarun Ghose
The University of Findlay, Ohio, USA
Introduction
The West Bengal market is on the cusp of a major revival. It is a great time for foreign
businesses to consider operating in this market. Relations between the central government of India
and the state government of the State of West Bengal shows signs of significant improvement with
funds for projects flowing in, the State has a political party in power that is well settled. These and
other indicators increase the likelihood of an increase in economic activity and political stability;
the two major ingredients for successfully expanding markets. Operating successfully in a foreign
country has been highly challenging for several reasons: 1) cultural barriers, 2) consumer
animosity, and, 3) consumer reluctance to buy imports rather than domestic products (Yoo and
Donthu 2005, Jain and Jain, 2013).
Theoretical Framework
This study is within the context of the Global Market Assessment Model.
Figure l. Global Market Assessment Model
Source: Developed by the author (Ghose and Shah, 2008)
Consumer Ethnocentrism
International trade activity is a central part of the world economy, and it is recognized that
there is a greater necessity to gauge consumers' attitudes toward both domestic and foreign
products (Netemeyer et al., 1991). Over the years, researchers found time and again that
respondents preferred products that were believed to have originated in their respective home
countries and culturally similar countries (Balabanis and Diamantopoulos, 2004) over those
DEMOGRAPHICS
SOURCE OF
INFORMATION
SOURCE
CREDIBILITY
FINANCIAL CONFIDENCE PREFERED FORM OF
GOVERNMENT CONSUMER
ETHNOCENTRISM
COUNTRY-OF-ORIGIN IMAGE
PRODUCT-SPECIFIC
COUNTRY-OF-ORIGIN
IMAGE
ATTITUDE TOWARD
THE ACT

230
products believed to have originated abroad (Bilkey and Nes, 1982; Rierson, 1967; Samiee, 1994).
This tendency of biased preferences of consumers for domestic products over foreign products is
termed as consumer ethnocentrism. Tracking consumer ethnocentrism may help explain product
preferences based on country-of-origin (Han and Terpstra, 1988; Parameshwaran and Yaprak,
1987).
The Indian Market and the State of West Bengal
The Asian continent has numerous rapidly growing markets. Annual world development
reports published by the World Bank and UNCTAD (United Nations, 2012) ranked three Asian
markets among four of the topmost economies in the world. The three markets from Asia are
China, Japan, and India. India is a highly diversified country of many religions, languages, cultural
values and beliefs. Not every organization is ready to be successful in international exchanges, let
alone in the booming market in India.
The lure of the Indian market is simply irresistible. India is a US$ 1 trillion economy with 700
million people under the age of 35. Although the annual economic growth rate has faltered in
recent years, it is still large enough to attract marketers. According to the 2011 Census Report and
projections, the State of West Bengal has a population of around 100 million, around 78% literacy,
and around 11% of population is below 6 years of age.
Global organizations, including those utilizing electronic means for interaction, need to keep
in mind certain intricate challenges posed in this market that have a strong effect on their operations
before starting and during the conduct of business with and within these markets. Primary among
these competitive challenges are the need for the establishment of globally cooperative work
environments, the need for understanding of cultural and language barriers, the role of family, the
need for language and religious sensitivity, and the need for culturally sensitive studies. Increasing
communication and travel between the western and the eastern markets has facilitated higher
interaction between markets and inspired consumers to have a greater say in their own choices
(Macchiette and Roy, 2001).
This is a significant time to study the relationship between consumer ethnocentrism and
country-of-origin image in the Indian market, including the State of West Bengal.
The Study
As globalization grows in strength with its resultant competition, efforts in foreign markets to
maintain country-of-origin image becomes more critically important. This paper reports the
findings from a 15-year longitudinal empirical study conducted in the State of West Bengal, India.
Subjects (n = 4418 adults) from around the state responded to a survey/interview questionnaire
conducted by trained administrators. Consumer ethnocentrism was measured using a 17-item, 7-
point “Strongly Disagree-Strongly Agree Scale” developed and tested by Shimp and Sharma
(1987). Country-of-origin image was measured using a 5-item, 7-point “Strongly Disagree-
Strongly Agree Scale.” Data was compiled and analysed using SPSS (Statistical Package for Social
Sciences).
231
Market Segmentation
Four segments were identified from the findings. Respondents that were found to be above the
mean of the medians (1999-2013) in a category were considered to be “High” in it and those below
the mean of the medians (1999-2013) were considered “Low” in it. The four segments were:
S1: Segment 1: Low Ethnocentrism – Low Country-of-Origin Image
S2: Segment 2: Low Ethnocentrism – High Country-of-Origin Image
S3: Segment 3: High Ethnocentrism – Low Country-of-Origin Image
S4: Segment 4: High Ethnocentrism – High Country-of-Origin Image
Some Recommended Strategies for US Organizations’ Success
The following strategies are recommended:
1. Joint ventures with strongly established partners in India should be considered as a
potential entry strategy for global firms. The focus should be on partnerships and strategic
alliances.
2. The US firms should be seen as a contributor to increasing the quality of life of Indian
citizens and as a law-abiding corporation. Public relations efforts to build goodwill and
contributions to nation building in India are essential. Initially, market entry strategies
focusing on slow roll outs and minority shareholding would be recommended.
3. Over time, U.S. entrants should go in with local subsidiaries. A subsidiary would build an
image of sincere commitment.
References
Balabanis, G., and Diamantopoulos, A. (2004). Domestic Country Bias, Country-of-Origin
Effects, and Consumer Ethnocentrism: A Multidimensional Unfolding Approach.
Journal of the Academy of Marketing Science, 32(1), 80-95.
Bilkey, W., and Nes, E. (1982). Country-of-Origin Effects on Product Evaluations, Journal of
International Business Studies, 13 (Spring/Summer), 89-100.
Government of India. (2011). 2011 Census of India. Retrieved from http://censusindia.gov.in
Ghose, N. and Shah, L. (2008). Research Insights Into A Developing Market: Relationship
Between Financial Confidence And Consumer Ethnocentrism. Journal of the World
Universities Forum, 1(6), 71-78.
Han, C. M.and Terpstra, V. (1988), Country-of-Origin Effects for Uni-National and Bi-National
Products. Journal of International Business Studies, 19(16), 235-256.
Jain, S. K. and Jain, R. (2013). Consumer Ethnocentrism and Its Antecedents: An Exploratory
Study of Consumers in India. Asian Journal of Business Research, 3,(1).

232
Macchiette, B. and Roy, A. (2001). The New Marketing Paradigm Shift: Are Consumers
Dominating the Balance of Power in the Marketplace? Taking Sides: Clashing Views on
Controversial Issues in Marketing. Guilford, CT: McGraw-Hill/Dushkin.
Netemeyer, R. G. et al. (1991). A Cross-National Assessment of the Reliability and Validity of
CETSCALE. Journal of Marketing Research 28(August), 320-7.
Parmeswaran, R. and Yaprak, A. (1987). A Cross-National Comparison of Consumer Research
Measures. Journal of International Business Studies, 18(Spring), 35-49.
Rierson, C. (1967). Attitude Changes Toward Foreign Products. Journal of Marketing Research,
4(November), 385-387.
Samiee, S. (1994). Customer Evaluation of Products in a Global Market. Journal of International
Business Studies, 25(3), 579-604.
Shimp, T. A. and Sharma, S. (1987). Consumer Ethnocentrism: Construction and Validation of
the CETSCALE. Journal of Marketing Research, 24(August), 280-289.
Yoo, B. and Donthu, N. (2005). The Effect of Personal Cultural Orientation on Consumer
Ethnocentrism: Evaluation and Behaviors of U.S. Consumers toward Japanese Products.
Journal of International Consumer Marketing, 18(1-2), 7-44(38).
United Nations (2012), UNCTAD World Investment Prospects Survey 2012-2014. United
Nations: New York and Geneva.

233
Product Adaptation in International Marketing: A Hype, Hope or Necessity
Megha Kandoi & Sunita Kumar
Christ University, Bangalore
Abstract
Purpose: In this era of globalization and international marketing, there are endless reasons to
support global thinking. To gain a competitive edge, organizations cannot solely depend on just
domestic market and need to come up with strategies to go global and look for target markets and
opportunities for product across borders. Consumers’ tastes and preferences with respect to their
cultural background plays an immense role for any product to be successful in the market. It
happens that a consumer in India consumes product differently than consumers in Europe or USA.
For an organization or a brand to be successful in the global market, it must come up with a
marketing plan to tap global markets with respect to the culture in practice in each country.
In international marketing, both product adaptation and product standardization have their own
advantages and disadvantages mainly with respect to consumer’s satisfaction and acceptance of
the product or service offered. Product Adaptation can be defined as a strategy implemented for
modification or alteration of a particular product rather than a standardized product so that it is
competent with the needs and preferences of a specific set of consumers or a market. Within an
international marketing context, each particular market is analyzed and planned to capture by a
particular brand to become a global brand. Adaptation is a more preferred strategy than
standardization when marketing to multiple countries with different cultures is considered and
there is a possibility of significant differences in consumer wants and preferences with respect to
a particular product or a service. Culture, market development, competition, and laws are the
factors that influence product adaptation.
Organizations by adopting the “Glocal” or “adaptation” strategy effectively tries to understand the
preferences of the local consumers and other particular requirements before adapting the marketing
mix to tap the untapped market and build a consumer base by satisfying their needs and wants.
Best-known companies like Coca-Cola, McDonald’s, KFC and many others have done a little
adaptation to their products depending on the culture across the entire globe. Kentucky Fried
Chicken (KFC) serves porridge for breakfast in Shanghai and Pecking Duck burgers for lunch
while in India it has tried to attract more consumers by introducing vegetarian menu options such
as Veg Zinger, Paneer Zinger, Potato Krisper Burger, and Hot Veg Snacker. Similarly,
McDonald’s goes glocal by adapting menus depending on the location – kosher restaurants in
Israel and Argentina and Halal branches in Pakistan and other predominantly Muslim countries
while avoiding any beef or pork based products in Indian market keeping in mind the Hindu and
Islamic cultural beliefs.
This study explores the product adaptation of various multinational brands in India, and the
consumers’ preferences, thinking, and acceptance to the adapting behavior of the brands. An
attempt has been made to understand if the product adaptation strategy in international marketing
is just a hype, hope or a necessity.
234
Objectives: The objectives of the study are to –
1. To analyze the entrance strategy of multinational brands and their product adaptation strategy
towards the marketing mix.
2. To study the role of the culture in international Market
Design/ Methodology/ Approach: In this study, a thorough review of existing relative literature
and theories about product adaptation strategy in the context of culture and cultural adaptation is
done. Primary data collection will be done through a structured questionnaire. Descriptive and
inferential statistical methods will be employed in the present investigation. Statistical tools like
descriptive statistics, ANOVA, correlation, and regression will be used in the study along with
reliability test to check the measurement error and to ensure the goodness of the data.
Finding: Globalization reflects a business orientation based on the belief that the world is
becoming more homogeneous and that distinctions between national markets are not only fading
but, for some products, will eventually disappear which is not completely true. Thus, companies
need to use their adaptation process to be successful in international market because every country
differ in terms of culture and product preference
Practical implication: The factors that determine the need for either mandatory or discretionary
product adaptation. The adaptation decision also needs to be assessed as a function of time and
market involvement. The characteristics and behavior of intended customer groups are an
important factor influencing the product adaptation decision. Product decisions of consumer-
product marketers are especially affected by local behavior, tastes, attitudes, and traditions.
This paper will help the marketer to understand the of factors which determine cultural and
psychological specificity in relation to products and services:
Consumption patterns; Psychosocial characteristics; General cultural criteria; so, that marketer can
take more informed decision in the international market.
Keywords: Product, adaptation, Culture, behavior and Strategy
References
Aboulnasr, K., Narasimhan, O., Blair, E., & Chandy, R. (2008). Competitive Response to Radical
Product Innovations. Journal of Marketing,72(3), 94-110. doi:10.1509/jmkg.72.3.94
Batra, R., Ramaswamy, V., Alden, D., Steenkamp, J., & Ramachander, S. (2000). Effects of Brand
Local and Nonlocal Origin on Consumer Attitudes in Developing Countries. Journal of
Consumer Psychology,9(2), 83-95. doi:10.1207/s15327663jcp0902_3
Bronnenberg, B., Dube, J., & Gentzkow, M. (2010). The Evolution of Brand Preferences:
Evidence from Consumer Migration. doi:10.3386/w16267
Calantone, R. J., Kim, D., Schmidt, J. B., & Cavusgil, S. T. (2006). The influence of internal and
external firm factors on international product adaptation strategy and export performance:

235
A three-country comparison. Journal of Business Research,59(2), 176-185.
doi:10.1016/j.jbusres.2005.05.001
Cavusgil, S. T., Zou, S., & Naidu, G. M. (1993). Product and Promotion Adaptation in Export
Ventures: An Empirical Investigation. Journal of International Business Studies,24(3),
479-506. doi:10.1057/palgrave.jibs.8490242
Cleff, T., Fischer, L., Sepulveda, C. J., & Walter, N. (n.d.). How Global are Global Brands? An
Empirical Brand Equity Analysis. SSRN Electronic Journal. doi:10.2139/ssrn.1554343
Cui, G. (1997). Marketing Strategies in A Multi-Ethnic Environment. Journal of Marketing
Theory and Practice,5(1), 122-134. doi:10.1080/10696679.1997.11501756
Czinkota, M. R., & Ronkainen, I. A. (2014). An International Marketing Manifesto. Developments
in Marketing Science: Proceedings of the Academy of Marketing Science Proceedings of
the 2002 Academy of Marketing Science (AMS) Annual Conference,46-46.
doi:10.1007/978-3-319-11882-6_16
Dow, D. (2006). Adaptation and performance in foreign markets: evidence of systematic under-
adaptation. Journal of International Business Studies,37(2), 212-226.
doi:10.1057/palgrave.jibs.8400189
Fosfuri, A., & Giarratana, M. S. (2009). Masters of War: Rivals Product Innovation and New
Advertising in Mature Product Markets. Management Science,55(2), 181-191.
doi:10.1287/mnsc.1080.0939
Gupta, N. (2012). The impact of globalization on consumer acculturation. Asia Pacific Journal of
Marketing and Logistics,24(1), 41-58. doi:10.1108/13555851211192696
Hatzithomas, L., Fotiadis, T. A., & Coudounaris, D. N. (2016). Standardization, Adaptation, and
Personalization of International Corporate Social Media Communications. Psychology &
Marketing,33(12), 1098-1105. doi:10.1002/mar.20944
Hollender, L., Zapkau, F. B., & Schwens, C. (2017). SME foreign market entry mode choice and
foreign venture performance: The moderating effect of international experience and
product adaptation. International Business Review, 26 (2), 250-263.
doi:10.1016/j.ibusrev.2016.07.003
Johnson, J. L., & Arunthanes, W. (1995). Ideal and actual product adaptation in US exporting
firms. International Marketing Review,12 (3), 31-46. doi:10.1108/02651339510091726
Kacker, M. P. (1973). Patterns of marketing adaptation in international business. The International
Executive,15(2), 27-29. doi:10.1002/tie.5060150217
Kacker, M. P. (1975). Patterns and Problems of Export-Oriented Product Adaptation. Foreign
Trade Review,10(2), 122-131. doi:10.1177/0015732515750205

236
Leonidou, L. C. (1996). Product standardization or adaptation: the Japanese approach. Journal of
Marketing Practice: Applied Marketing Science,2(4), 53-71.
doi:10.1108/eum0000000004136
Nijssen, E. J., & Douglas, S. P. (2011). Consumer World-Mindedness and Attitudes Toward
Product Positioning in Advertising: An Examination of Global Versus Foreign Versus
Local Positioning. Journal of International Marketing,19(3), 113-133.
doi:10.1509/jimk.19.3.113
Ramarapu, S., Timmerman, J. E., & Ramarapu, N. (1999). Choosing between Globalization and
Localization as A Strategic Thrust for Your International Marketing Effort. Journal of
Marketing Theory and Practice,7(2), 97-105. doi:10.1080/10696679.1999.11501832
Solberg, C. A. (2002). The Perennial Issue of Adaptation or Standardization of International
Marketing Communication: Organizational Contingencies and Performance. Journal of
International Marketing, 10 (3), 1-21. doi:10.1509/jimk.10.3.1.19546
Steenkamp, J. E., & Jong, M. G. (2010). A Global Investigation into the Constellation of Consumer
Attitudes Toward Global and Local Products. Journal of Marketing,74(6), 18-40.
doi:10.1509/jmkg.74.6.18
Terpstra, V. (1985). The Changing Environment Of International Marketing. International
Marketing Review, 2 (3), 7-16. doi:10.1108/eb008279
Vrontis, D., Thrassou, A., & Lamprianou, I. (2009). International marketing adaptation versus
standardisation of multinational companies. International Marketing Review,26(4/5), 477-
500. doi:10.1108/02651330910971995
Wang, J., Novemsky, N., & Dhar, R. (2009). Anticipating Adaptation to Products. Journal of
Consumer Research,36(2), 149-159. doi:10.1086/597050
Zaiem, I., & Zghidi, A. B. (2011). Product Adaptation Strategy and Export Performance: The
Impacts of the Internal Firm Characteristics and Business Segment. Contemporary
Management Research,7(4). doi:10.7903/cmr.9697

237
Comparing online and in store motivational factors for hedonic and utilitarian products
Anu C H & Angeline Gautami Fernando
VIT University, Chennai
Introduction
Convenience, speed, information availability, cost and product virtualization are the major
motivational factors of online shopping (Morganosky and Cude, 2000). In-store shopping factors
include store environment, aesthetic appeal, trust, shopping experience and customer service.
Consumer motivations may also differ based on product type (Liu et. al., 2013). Hedonic product
purchases are not pre-planned, mostly emotional and the major motive behind purchase is
enjoyment, pleasure and leisure. Utilitarian products are purchased with utmost care as the goal is
to have a product with maximum functional utility (Hirschman and Holbrook, 1982).
Identifying consumer motives is important when retailers are looking to work in multiple
channels. There are very few studies that focus on comparing online and in-store shopping of
hedonic/utilitarian products based on motivational factors. This study addresses this gap with the
following questions:
1. What are the values associated with online and in-store purchase of hedonic and utilitarian
products?
2. Do they differ for hedonic and utilitarian products based on channels?
Identifying the dominant values linked with motivational factors will give an outlook of channel
preferences for hedonic and utilitarian products. This in turn will help retailers reframe strategies
for multiple channels.
Methodology
We use means-end approach (Reynolds and Gutman, 1988) to identify the motivational
variables influencing online and in-store purchases of hedonic and utilitarian goods. Means-end
approach is a hierarchical process that focuses on the development of attributes, consequences and
values based on consumer perception. Values refer to the most abstract concept and the abstraction
level increases from attributes to values (Peter et. al., 1999).
We carried out the following two-stage process to identify the dominant values in online
and in-store shopping:
(i) Identification of the means-end elements for hedonic and utilitarian products (apparel was
chosen as the hedonic product (Kim et. al., 2011) and electronics was chosen as the utilitarian
product (Kushwaha and Shankar, 2013)).
(ii) Construction of hierarchical virtual map (HVM) for identifying the dominant perceived value
elements.
Convenience sampling was used to select 100 respondents (50 each for apparel and
electronics). Means-end elements were derived using a laddering approach. The objective of

238
laddering interviews is to derive a hierarchical network of meanings. The interviews followed a
bottom-up process of questioning where the lower-level attributes are gleaned first followed by
questions on the higher- level values (Phillips and Reynolds, 2009). Thus, the bottom-up approach
generates the attributes -> consequences -> values (A->C; C->V) relationship.
A semi-structured interview with probe questions was conducted based on the convenience
of the interviewees. The process was carried out in a one-to one mode in a silent environment.
Interview started with demographic questions moving to how often they purchase utilitarian and
hedonic products. Open-ended questions were asked following a “why” pattern. Subsequent
questions were based on the previous response. The interview duration ranged from half an hour
to one hour and the whole process was audio taped and transcribed later.
The interviews were coded and content analysis, a systematic approach was carried out for
in-depth analysis of text data (Kassarjian, 1977). Content analysis creates pattern using words of
the text for providing a deeper understanding of the meanings involved with in the text (Yang,
2008). Nvivo 11 (http://www.qsrinternational.com) was used to identify the dominant values of
online and in-store shopping for apparel and electronics (Clisbee, 2003).
Next, hierarchical virtual maps (HVM) were constructed based on the identified means-
end elements. The derived values aid in comparing the motivational factors for online and in-store
for hedonic and utilitarian products.
Results and Discussion
The results showed that the ratio of channel preference was 70:30 for online and in-store
for apparel. In case of electronics, preference ratio is 50:50 for online and in-store. Satisfaction
was the common value for apparel online and in-store purchases. Other values included
accomplishment for apparel online and self-esteem for apparel in-store shopping. It is concluded
from the analysis that availability of products results in satisfaction and accomplishment for online
apparel purchases. On the other hand, store environment and social interaction provides
satisfaction and self-esteem in in-store purchases. In case of electronics, satisfaction was the
common value noted for in-store and online purchase. Security was the additional value derived
for electronics in-store purchase. Consumers who were highly risk aversive preferred buying
electronics in-store (Tan, 1999). In-store product “feel” and in-person experience resulted in
achievement of satisfaction and security for electronics. However, cost benefits and product
comparison was important online electronics purchases.
Findings of this research serve as a first step to understand the motivational factors that
drive the channel preference for hedonic and utilitarian products. Retailers should provide
improvised customized experience with safer transactions for electronics online purchase.
Enhanced customer service with availability of brands of their choice attracts consumers towards
in-store electronics purchase. In the case of apparel, in-store retailers should create a pleasant store
environment and online retailers should offer virtual trials with quicker delivery to encourage
shoppers. Future research should work on identifying dominant shopping motivations for multi-
channel or cross-channel shoppers like brick and click or mobile and online.

239
References
Clisbee, M. (2003), Using N-vivo for Literature Analysis: Strategies in Qualitative Research:
Methodological Issues and Practices using QSR NVivo and NUD *IST, University of
London, London
Hirschman, E.C. and Holbrook, M.B. (1982), “Hedonic consumption: emerging concepts, methods
and propositions”, Journal of Marketing, Vol. 46 No. 3, pp. 92-101.
Kassarjian, H.H. (1977), “Content analysis in consumer research’’, Journal of Consumer
Kassarjian, H.H. (1977), “Content analysis in consumer research’’, Journal of Consumer
Research, Vol.4 No.1, pp. 8-18.
Kim, M., Kim, J. and Lennon, S. J. (2011),"E-service attributes available on men's and women's
apparel web sites", Managing Service Quality: An International Journal, Vol. 21 No. 1,
pp. 25 - 45.
Kushwaha, T. and Shankar, V. (2013), "Are Multichannel Customers Really More Valuable? The
Moderating Role of Product Category Characteristics", Journal of Marketing, Vol. 77, No.
4, pp. 67-85.
Liu, X., Burns, A.C. and Hou, Y. (2013),"Comparing online and in-store shopping behavior
towards luxury goods", International Journal of Retail & Distribution Management, Vol.
41 No. 11/12, pp. 885 – 900.
Morganosky, M.A. and Cude, B.J. (2000), “Consumer response to online grocery shopping”,
International Journal of Retail & Distribution Management, Vol. 28 No. 1, pp. 17-26.
Peter, J.P., Olson, J.C. and Grunert, K.G. (1999), Consumer Behaviour and Marketing Strategy,
European ed., McGraw-Hill Publishing, London.
Phillips, J. M. and Reynolds, T. J. (2009),"A hard look at hard laddering", Qualitative Market
Research: An International Journal, Vol. 12 No. 1, pp. 83 – 99.
Reynolds, T.J. and Gutman, J. (1988), “Laddering theory, method, analysis, and interpretation”,
Journal of Advertising Research, Vol. 28 No. 1, pp. 11-31.
Tan, S.J. (1999) "Strategies for reducing consumers’ risk aversion in Internet shopping", Journal
of Consumer Marketing, Vol. 16 No. 2, pp.163-180.
Yang, K. & Miller, G.J. (2008). Handbook of research methods in public administration (2nd
edition), New York: M. Dekker.
240
Sustainable Consumption: Role of Habits
Narasimhan Ramesh & Nattuvayikkal Barnabas
SVKM’s NMIMS University, Bangalore
Abstract: This research paper explores the reward types and influencers of sustainable
consumption habits. Prior research has called for further enquiry into post-choice behaviour of
consumers and especially into the role of habits in sustainable consumption. Drawing on the habit-
loop framework that includes the three components of motive, action and reward we state the
research objectives of 1) describing the rewards sought by sustainable consumers and 2) stating
testable propositions on the influencers of sustainable consumption habits. Through online
ethnography we gathered data from the discussions in a social-forum meant for people who cycled-
to-work regularly. Qualitaive analysis of data revealed 4 types of rewards sought by these cyclists,
and 10 influencers that affect continuation in the cycling-to-work habit. We further raise a set of
propositions around the identified reward types and influencers that could be tested for empirical
validation. We close this paper with discussions on implications for research as well as practice.
Keywords: Sustainable consumption, Habit-loop, Netnography
INTRODUCTION
Consumption behaviors of people could have significant impact on sustainability (Prothero et al,
2011). Consumption of goods and services that have minimal impact upon the environment, are
socially equitable and economically viable while meeting the basic needs of humans is called
sustainable consumption (Defra, 2008). Research on sustainable consumption has so far been
limited to the consumer choice phenomenon while the post-choice behaviors including product
usage and disposal have received little attention (Prothero et al, 2011; Wells 1993). About half of
our daily consumption is said to be habitual in nature (Duhigg, 2012), and hence an exploration
into consumption habits may be considered relevant to the sustainability cause. While researchers
have argued that habit formation could be a much less expensive approach towards sustainable
consumption compared to massive investments in infrastructural technology development and
implementation (Warde & Southerton 2012) attempts to empirically explore sustainable
consumption applying the habit-loop framework has not been attempted so far. Drawing on the
three components of the habit-loop namely motive, action and reward we attempt to describe the
influencers of sustainable consumption habits and the types of rewards that motivate such habits.
REVIEW OF LITERATURE
Researchers adhering to competing theoretical models have attempted to explain sustainable
consumption behaviour or the lack of it (Jackson, 2005). These models include rational choice
based models, normative behaviour models, habitual behaviour models, integrative theoretical
models, and social learning models. The choice model is described below with its significance for
sustainable consumption.

241
Choice:
Consumption choice includes the 5 steps of need-awareness, search for information, evaluation of
alternatives, selection of the preferred alternative and purchase (Schiffman and Kanuk, 2010). The
‘choice model’ of consumer decision making contends that consumers make decisions by
calculating the individual costs and benefits of different courses of action and choosing the option
that maximises their expected benefits (Jackson 2005). For instance given a choice between
products that vary in a number of attributes, a rational choice rule would be to weigh each attribute
on its importance or impact, combine these values with weights of the attributes, and choose the
alternative which has the highest weighted value (Verplanken, 2015). Sustainability could be one
among the attributes with a potential to contribute to the final selection of the sustainable
alternative. Marketers present sustainability as an important attribute often citing the imminent
dangers that the human society would confront from unmindful unsustainable consumption.
Consumption choices could be first time or routine and high involvement or low involvement.
First time choice of a high involvement product would be very elaborate whereas its repeat tend
to be less elaborate. Low involvement product choices are less elaborate and their repeat buy
becomes automatic or habitual.
The choice model assumes consumer decision making to be rational in nature and is based on the
ideology of a ‘sovereign consumer’ who selects goods and services to meet his preferences and
values (Warde and Southerton 2012). Creation of a sustainable world was not included as a goal
of sustainable consumption by customers except by those for whom sustainability was a core-value
central to their self-concept (Verplanken & Roy, 2015). Sustainable consumption could also be
driven by goals such as efficiency, cost reduction, convenience and comfort (Verplanken & Roy,
2015).
Post-choice:
One of the criticisms of the choice-model is that it equates consumption with purchase (Warde and
Southerton 2012). The full consumption cycle (including the post-choice behaviours such as
product usage, product life extensions and disposal) does not find space in the rational choice
model. More elaborately, the components of the post choice (usage) phenomenon could be: 1)
consumption experience including how is the product used or consumed, who uses it, when, where,
and how often and the feelings and opinions surrounding the consumption experience, how the
product is stored, how is it maintained and disposed, 2) the relationship consumer has with the
product including how long has relationship been going on? How has it evolved or changed over
time? Good and bad experiences in the relationship, 3) Satisfaction or dissatisfaction with the
product.
The quantity and frequency of consumption, product maintenance, reuse and disposal could have
significant environmental impacts. Heavy unmindful usage and disposal of products could be
unsustainable. Research on sustainable consumption has so far been limited to the consumer
choice phenomenon while the post-choice behaviors including product usage and disposal have
received little attention (Prothero et al, 2011; Wells 1993).

242
Habit:
A habit may be conceptualized as a recurrent, often unconscious pattern of behavior hat is accrued
through frequent repetition in a stable context (Verplanken, 2008). Repeated purchase and usage
become ‘routinized’ and develop into a pattern of behaviour called consumption habit (Thogersen
and Olander 2002a, 2002b). By that logic repeated consumption of sustainable products and
services would be defined as Sustainable consumption habits. Repetition results in “automaticity”
which means less rational deliberation (Verplanken, 2015). An inertia into consumption system is
introduced by habits and strengthened by the prevailing infrastructure and social culture supporting
the dominant habit. Habits form a behavioural ‘lock-in’ that could undermine people’s best
intentions to change. Thus habits could be seen as one of the key challenges to any behavioural
change initiatives. On the contrary, once in it, habit may be seen as a key opportunity for promoting
sustainable consumption. Therefore sustainability could often demand interventions to break the
existing lock-in and creating new and sustainable consumer habits. Cycling to work instead of
driving a car, composting kitchen waste instead of dumping, carrying a shopping bag instead of
buying a cheap plastic bag etc. are a few examples.
The inertia in a consumption system is introduced by habits and strengthened by the prevailing
infrastructure and social culture supporting the dominant habit. Thus habit, infrastructure and
culture are important determinants of consumption and among these constant factors such as
infrastructure and culture have an important influence on identification and choice of options thus
creating inertia even in situations not ruled by habits. A substantial change such as a crisis, an
epiphany, change in circumstances, or a shift in a stage in lifecycle to another is necessary for
individuals to come out of habit (inertia) and engage in a search for an alternative course of action.
Such incidents break the habit loop formed of three components namely; motive, action and reward
(Duhigg, 2012). As per habit loop, people are driven to a course of action for a specific reward. A
more attractive reward and/or their inability to take a specific course of action could drive people
to a different courses of action. Creation of sustainable consumption habit would demand
breaking the habit loop by exposing to people to attractive rewards and to alternative courses of
action.
In this research we study a specific sustainable consumption behavior (Cycling to Work) of a group
of people with an intention to understand 1) the rewards sought by them, 2) their motivations to
continue in the habit and 3) the challenges that prompt them to defect from a sustainable
consumption habit. The study was expected to achieve the following research objectives:
a) Describe the rewards/benefits sought by consumers in a sustainable consumption habit.
b) Develop a few testable propositions on: a) what hooks the consumers into a sustainable
habit and b) what causes defection from a sustainable consumption habit.
c) Further inform practitioners who design sustainability programmes aimed at consumers.

243
Scope of the Study
Our research interest is not in purchase transactions per se, but in consumption habits. Therefore,
only customers who are habituated to sustainable consumption and those consumers who defected
after some period of acceptance of a sustainable consumption habit are of interest to this study.
For example, people who regularly ride cycles to office and back, who regularly carry jute bags
for shopping, who regularly segregate domestic waste, recycle or process it for gardening etc.
would be relevant population. This is because only those who have gone through the passage of
sustainable consumption could adequately inform about the rewards and influencers of sustainable
consumption habit.
The current study is confined to Cycling-to-Work (C2W) habit. Studies have found that active
travel has a habit component to it (Aunger et al., 2010). Besides, ‘travelling to work’ is one of the
most regular activities performed in a consistent context and therefore may be considered well
suited for exploring the sustainable consumption habit phenomenon. Moreover, mode of
transportation, has been identified as having significant implications for sustainability (Marell et
al, 2009 as in Prothero 2011).
METHODOLOGY
Retrospective recall and thick description by consumers on how & why they adopted a sustainable
consumption habit and how & why they continued to engage in that habit were gathered through
a netnography (online ethnography). The outcomes of netnographic data analysis was corroborated
with findings of a fitness study.
Netnography: It is a qualitative empathic research methodology utilizing adapted ethnographic
research techniques to enable researchers to deeply immerse in online consumer conversations
(Bartl et al. 2009). C2W cyclists are those professionals who travel to and from their office in a
cycle as an alternate mode of transportation instead of motor vehicles. We searched for suitable
online communities, forums, and social media threads to get an appropriate set of discussions
among C2W cyclists. A specific group formed of cyclists who cycled to work was identified. The
group had been formed since 2010 and is still in existence. We followed the discussions within the
group for about 5 years (year 2010 to year 2015). The group has 128 members of which about 60
have been active with comments. All discussion data during the period were directly copied from
an active thread on to a computer for analysis. We used a qualitative data analysis software for
coding and analysis of the data.
Depth interview: We conducted a depth interview survey to understand the factors driving habit
formation in fitness context. Search on the internet for suitable respondents brought to a blog where
the blogger gave autobiographical notes on how he turned fit from being highly obese and how he
could help others to be fit like him. We contacted the blogger and conducted a depth interview that
gave insights into what helped him remain in a healthy habit.

244
ANALYSIS AND FINDINGS
Content analysis of the qualitative data resulted in identification of major themes of discussion
among the Cyclists as given in Table 1 below. Four of these themes correspond to rewards .sought
by the cyclist and the rest to influencers on the C2W habit.
Table 1: Themes that emerged from content analysis;
Name
1 Emotional Benefits
2 Functional Benefits
3 Social Benefit (Missing)
4 Catalyst for social change (sustainability concern, self-
actualisation)
5 Appreciation (Encouragement, Help& referencing)
6 Explicit rewards
7 Frequency and distance
8 Friends and family
9 Heroes & Learnings
10 Passion& Nostalgia
11 Special events
12 Starting C2W
13 Struggles& dress& safety& parking
14 Traffic management
Content analysis of the qualitative data also resulted in the following word cloud (Figure-1).
Figure1: Word cloud of most repeated 100 words in the coded references

245
As evident from Figure 1, the most recurring word was ‘cycling’ followed by ‘work’, ‘riding’,
‘time’, ‘office’, ‘bike’, ‘parking’, ‘traffic’, ‘anyone’ etc. The word cloud was used for a text search
query. The text search query captured the words that were closely associated with the most
repeated words. The query resulted in the following word trees as exemplified in Figure-2.
Figure 2: Word tree for Work
Cycling to “Work” also had many positive associations as evident in Figure 2.

246
ANALYSIS for Emotional and Functional benefits
The benefits perceived by the cyclists included functional, emotional, social and self-actualisation
benefits. The number of references to emotional benefits were 30 and those to functional benefits
(Including health, economic and travel time related benefits) were 25. The emotional benefits
ranged from ‘feeling good’, ‘feeling proud’, ‘being relaxed’ to ‘getting a sense of how life should
be’ and ‘being happy in life before others’ and ‘being practically-wiser than others’. The
functional benefits could be categorised into physical like ‘staying fit and fresh at work’, ‘reducing
weight’, ‘being on time to work’ and ‘saving time’, ‘saving money on fuel cost’.

247
Both functional as well as emotional benefits derived from cycling to work are valued by cyclers.
A clear understanding and appreciation of the value they derived from C2W seems to keep people
in the habit. The absence of altruistic benefit among these many benefits referred to is striking.
There was only one comment that mentioned an altruistic achievement by a cyclist (of reducing
carbon footprint). People were not appreciating so much what they were doing to the nature and
society but they were constantly referring to the fun as well as the practical benefits they got out
of the habit.
That the emotional reward such as fun is ‘inherent’ in the cycling activity is a significant feature
that could work in favor of cycling becoming a habit more easily. The emotional experience is
natural to the activity and is also deeply felt while riding. The fun seeking cyclist only need to be
put on to the cycle and the emotional reward perception would be easy. One does not really have
to give an external reward to get people habituated in C2W other than providing basic facilitation
such as safe roads, parking space, and avoid any externally induced negative emotions.
Proposition 1: There is relationship between the perceived a) emotional, b) economic and c)
functional benefits inherent in a sustainable consumption activity and the consumer’s propensity
to continue in the activity.Insights from existing literature and analysis of the netnographic data
resulted in further propositions listed below. Arguments resulting in the propositions are not given
here for brevity.
Proposition 2: There is relationship between the perceived social acceptance of a sustainable
consumption activity, and how long a consumer to continue in the activity.
Proposition 3: There is relationship between the appreciation one receives from others in a
sustainable consumption activity, and how long a consumer continues in the activity.
Proposition 4: There is no direct relationship between the altruistic value perception of a
sustainable consumption activity and the continuation of that activity.
Proposition 5: There is a direct relationship between the altruistic value perception of a sustainable
consumption activity and the intention to engage in that activity.
Proposition 6: There is relationship between how long a person had been into a sustainable
consumption activity, and the chance for that person to defect from the activity.
Proposition 7: There is relationship between the life stage while adopting a sustainable
consumption activity for the first time, and how passionate one feels about the activity at a later
stage in life.
Proposition 8: There is relationship between how passionate a person feels about a sustainable
consumption activity, and how long the person would stay in the activity.
Proposition 9: Active support for a sustainable consumption campaign from habituated consumers
is influenced by the kind of media coverage the campaign attracts.
Proposition 10: Starting or quitting a sustainable consumption activity is linked to some important
personal events.

248
Proposition 11: There is relationship between the attitude of significant others towards a
sustainable consumption activity and the duration a person continues in it. The relationship is
moderated by the number of years the person had already been in the activity.
Proposition 12: There is relationship between the infrastructural support mechanisms in place for
a sustainable consumption activity and the social support sought by a habituated consumer from
others in similar habit..
Implications:
The research has revealed the types of rewards that are sought by habitual sustainable consumers
and the influencers of such habits. By applying the habit-loop framework in the sustainable
consumption context we build on the understanding of the kind of rewards that motivate
sustainable consumers into action. The impact of these rewards and influencers on sustainable
consumption habits could be measured by further refining these propositions into testable
hypotheses. Our study reveal that it is essential to experience the rewards to stay put in a
sustainable consumption habit. The major dimensions of this experience are: 1) Fun, 2) Functional
benefits, 3) Economic benefits, 4) Social benefits, 5) Positive image (through respectable
associations with people, ambassadors and events). It is also necessary to avoid occasions for bad
experiences from people around and facilities while a consumer is introduced into a sustainable
consumption activity.
There is a behavioural change dimension as well as habit dimension to sustainable transportation
practice. For example, those who have never cycled, those who cycled only as a child, those who
cycle for errands and those who C2W are at different stages of readiness for habituation. The closer
one is to C2W the easier the behavioural change. Approaches to each one of these groups would
have to be different. For those endowed with the cycling skills and in the habit of occasional usage
there is need to have a critical number of cyclists in C2W as attraction. They would subscribe to a
culture provided the culture exists. The most recurring question “anybody in my route?” may be
treated an indication of this expectation for a culture that the cyclist wants to attach themselves to.
As mentioned earlier such culture building needs to be multi-pronged: a) at the work-place level,
b) residential community level, c) schools and colleges level.
For the lesser endowed ones who are not comfortable with cycling or who left cycling early in life,
the personal benefits may be less appealing compared to the altruistic intents and socialisation
appeal. For, benefits are to be positively experienced and may not have any effect on those who
have not comfortably experienced cycling. On the contrary altruism figured as relevant intent i. e.
a factor relevant while considering C2W. Therefore, for those who are to be attracted to cycling a
message highlighting the environmental benefits of cycling would be of value.
Given the multiple struggles a sustainable consumer would be dealing with, it would be important
that persons who design programmes for building sustainable consumption habits to be realistic
while designing such intervention. As there are many benefit that the consumer get from
sustainable consumption, there are also many challenges and trade-offs associated with it. Over
emphasizing the benefits could result in not anticipating the many trade-offs and therefore

249
defecting early. At an organizational level, image building interventions among employees for the
sustainable consumption activity and providing supporting infrastructure would help the habit to
flourish among the interested employees.
CONCLUSION
On the one hand, habits could be among the key challenges to sustainable consumption initiatives
as they could ‘lock’ customers into unsustainable consumption patterns. On the contrary, the same
‘lock-in’ characteristic of habit may be considered a key opportunity for promoting sustainable
consumption. Appropriate rewards along with social and infrastructural support facilitate
sustainable consumption habits. Insights on the rewards sought by people and the factors that drive
them to stay-put or defect-from a habit could inform practitioners (with responsibilities to design
interventions to break or create consumption habits) to be effective in their interventions. We
suggest further empirical validation of the propositions raised in this exploratory study to better
inform the theory and practice of sustainable consumption.
REFERENCES
Charles Duhigg. (2012). The power of Habit: Why We Do What We Do in Life and Business.
New York: Random House.
McDonagh, P., & Prothero, A. (2014). Sustainability marketing research: past, present and
future. Journal of Marketing Management, 30(January 2015), 1186–1219.
http://doi.org/10.1080/0267257X.2014.943263
Verplanken, B., & Roy, D. (2015). Sustainable Consumption . Elgar Original Reference .
Edward Opus : University of Bath Online Publication Store 15 . Consumer habits and
sustainable consumption, 243–253.
Warde, A., & Southerton, D. (2012). Preamble: Social sciences and sustainable consumption.
The Habits of Consumption. Studies across Disciplines in the Humanities and Social
Sciences, 1–25.
Young, William (2010). "Sustainable Consumption: Green Consumer Behaviour when
Purchasing Products". Sustainable Development (18): 20–31

250
Service-Dominant Logic and Value Co-Creation :“( How) does ‘phenomenological
hermeneutic’ matter?
Sudeep Rohit & Mayank Kumar
Indian Institute of Management, Trichy

251
Implication of Brand Strength for the Choice of Group versus Individual Sales Incentives
Wenshu Zhang & Subramanian Balachander
Silberman College of Business, Fairleigh Dickinson University
Firms often use individual and group performance incentives to motivate and compensate
their salesforce. A WorldatWork survey on 195 firms in 2016 found that 79% of organizations
used individual performance incentives while 33% used group performance incentives (Open
Symmetry 2016). Likewise, a pharmaceutical industry survey by The Hay Group in 2011 showed
that 71% of companies based incentive compensation on individual performance while 29% based
it on group performance (Wilcox et al. 2012). These observations on firms’ different choices of
incentive compensation raise an interesting research question as to why some firms motivate their
salespeople based on individual performance while others based on group performance.
The compensation literature has pointed to a number of advantages and disadvantages of group
incentives. On the one hand, incentivized to increase group performance, employees accelerate the
information diffusion within the team by pooling their know-how and resources (Chan et al. 2014,
Kotler and Armstrong 2007). On the other hand, group incentives may give rise to free riding if
some employees free ride on the efforts of other hard-working employees (Alchian and Demsetz
1972, Holmstrom 1982, Kotler and Armstrong 2007). However, to the best of our knowledge, none
of the previous work on salesforce compensation addresses the issue of how the strength of a firm’s
brands should affect its choice between group and individual incentives for its sales force. The
issue of brand strength or brand equity is particularly relevant for salesforce compensation because
the strength of the brand can critically affect the relationship between salesperson efforts and sales
outcomes. Thus, one might expect that brands that are not well known among consumers, or brands
that have not clearly communicated their value propositions, would require more extensive sales
efforts with more uncertain sales results. Because advertising often significantly contributes to
brand equity (Aaker 1991, Keller 1997, Sriram et al. 2007), addressing the issue of tailoring the
salesforce compensation structure to the strength of the brand would also lead to better integration
between elements of the communication mix, a goal that is valued by marketers. Thus, in this
research, we focus on how brand strength affects a firm’s choice between individual and group
incentives for its salesforce. Further, we study how this choice of group versus individual
incentives would, in turn, influence the salary and commission components of salesforce
compensation.
We investigate the above research questions using a principal-agent model with a risk-
neutral firm employing multiple risk-averse salespersons. The salespersons serve consumers who
are heterogeneous in their readiness to purchase the firm’s product, thus requiring different levels
of efforts to generate sales from different consumers. Because the assignment of consumers to
salespersons is stochastic, as happens in a retail floor, salespersons face risks from an adverse
consumer mix during a performance measurement period. Our model assumes that a strong brand
with a well-understood value proposition would have consumers who are more homogenous in
terms of their readiness to purchase the product, thereby posing a lower risk to the salesperson
from an adverse consumer mix. Under these conditions, we find that the firm with a weak brand
may find it optimal to offer group performance incentives to its salesforce, while a stronger brand

252
would prefer to offer individual sales performance incentives. Moreover, the salary component
would be greater for the weak brand under the group incentive plan than it would have been under
an individual incentive plan. The intuition for these results is as follows. When salespersons can
differ in their customer mix in terms of purchase readiness, pooling sales across consumers can
reveal information to the firm on whether difficult sales have been realized from consumers who
require greater sales effort. The reason is that a low level of sales indicates with high confidence
that difficult sales were not made because it is unlikely that difficult sales were made without easy
sales being made to consumers who are more ready to adopt the products. On the other hand, a
high level of sales indicates with high confidence that difficult sales have been made, because sales
could not have been high without both the difficult and easy sales being made. Thus, conditioning
on group sales allows the firm to condition incentives on truly difficult sales that involve greater
sales effort. We call this effect of group incentives in our model as the pooling effect. With
individual incentives, the firm cannot distinguish between sales to consumers with different
readiness to purchase, resulting in overpayment of commission for easy sales.
On the other hand, group incentives provide less motivation to the salesperson exerting the
greater effort for the difficult sale because the incentive payment will be shared with colleagues.
Consequently, a bigger incentive payment is needed to motivate a given level of effort under group
incentive compensation. We term this factor the free-riding effect because the salesperson making
the easy sale gets to share in the incentive payment earned because a fellow salesperson made the
difficult sale. Thus, with group incentives in our model, there is a tradeoff between the ability to
target the incentives to only the difficult sales because of the pooling effect and the need for a
larger incentive to stimulate effort because of the free-riding effect. When a brand is weak,
consumers are more heterogeneous in their readiness to purchase in our model, so that the benefit
of the pooling effect dominates the negative free-riding effect from group incentives. On the other
hand, when a brand is strong, there is less consumer heterogeneity, so that the free-riding effect
becomes more important favoring individual incentive payments.
Following the development of our analytical results, we empirically test the findings of our
analytical model using a unique dataset which contains sales compensation schemes and sales
information on 51 brands sold by a consumer electronic retailer in multiple categories. Our
empirical results are consistent with our analytical predictions.
In the sales compensation literature, Caldieraro and Coughlan (2009) propose a rationale
for group incentives by showing that when salespeople are allocated to negatively correlated
territories, having a group commission pay component is optimal for the firm. The intuition for
their results is the reduction in the variability of a salesperson’s plan because the incentive is based
on sales from a diverse set of territories. Our model also implies a negative correlation of the sales
outcomes across salespersons because of consumer heterogeneity. The pooling effect from group
incentives identified above does help to diversify the sales base on which incentives are based but
the intuition for our results go beyond the benefits of such diversification. In particular, a key
benefit of the pooling effect of group incentives in our model is that it enables the firm to
differentiate difficult sales from easy sales and reward accordingly. This is a distinct intuition than
the one in Caldieraro and Coughlan (2009). Moreover, our model incorporates ex ante consumer
heterogeneity in the form of difference in readiness to purchase the product that implies different
effort to sales relationships. However, the territories assigned to salespeople in Caldieraro and
253
Coughlan (2009) are ex ante identical, although the sales outcomes in those territories could be
different ex post for the same effort. Finally, our model identifies different implications for strong
and weak brands regarding the use of group incentives unlike Caldieraro and Coughlan (2009).
Keywords: Agency Theory; Salesforce Compensation; Group Incentives; Individual
Incentives; Brand Equity
References
Basu AK, Lal R, Srinivasan V, Richard Staelin (1985) Salesforce Compensation Plans: An Agency
Theoretic Perspective. Mark. Sci. 4(4):267–291.
Bhardwaj P (2001) Delegating Pricing Decisions. Mark. Sci. 20(2):143–169.
Caldieraro F, Coughlan AT (2009) Optimal Sales Force Diversification and Group Incentive
Payments. Mark. Sci. 28(6):1009–1026.
Chan TY, Li J, Pierce L (2014) Compensation and Peer Effects in Competing Sales Teams
Compensation and Peer Effects in Competing Sales Teams. Manage. Sci. 60(8):1965–1984.
Holmstrom B (1982) Moral hazard in teams. Bell J. Econ. 11(2):74–91.
Lim N, Chen H (2014) When Do Group Incentives for Salespeople Work? J. Mark. Res.
51(3):320–334.
Mantrala MK., Prabhakant Sinha, Andris A . Zoltners (1994) Structuring a Multiproduct Sales
Quota-Bonus Plan for a Heterogeneous Sales Force : A Practical Model-Based Approach.
Mark. Sci. 13(2):121–144.
Misra S, Coughlan AT, Narasimhan C (2005) Salesforce compensation: An analytical and
empirical examination of the agency theoretic approach. Quant. Mark. Econ. 3(1):5–39.
Misra S, Nair HS (2011) A structural model of sales-force compensation dynamics: Estimation
and field implementation. Quant. Mark. Econ. 9(3):211–257.
Nalbantian HR, Schotter A (1997) Productivity Under Group Incentive : An Experimental Study.
Am. Econ. Rev. 87(3):314–341.
OpenSymmetry (2016) Sales Compensation Programs and Practices.
Rasmusen E (1987) Moral Hazard in Risk-Averse Teams. RAND J. Econ. 18(3):428–435.
Simester D, Zhang J (2014) Why Do Sales People Spend So Much Time Lobbying for Low
Prices? Mark. Sci. 33(May):796–808

254
Developing promotional support as a new construct and examining its influence on customer
orientation and selling skills
Harindranath R M
Anna University, Chennai
Introduction
In Pharmaceutical, the promotional tools have a positive and significant effect on sales (Kremer,
Bijmolt, Leeflang, & Wieringa, 2008) and key decision maker in pharmaceuticals is the physicians
and “they are the focus of promotional efforts” (Gönül, Carter, Petrova, & Srinivasan, 2001). The
main method of promotion involve the visit of Pharmaceuticals Marketing Representatives
(PMRs) to physicians and referred as “detailing” (Hurwitz & Caves, 1988; Stremersch & Van
Dyck, 2009). The promotional instruments dispensed to physicians during the PMRs visit are free
drug samples, sponsor of Continuing Medical Education (CME) program, gifts, honorarium,
medical books and journals (Wazana, 2000). PMRs receive assortment of promotional inputs from
their organizations (Chew et al., 2000) to satisfy the diverse need of physicians in the sales
territories (Gönül et al., 2001). These inputs can act as inducements to physicians and can influence
his choices of drug prescription (Lieb & Scheurich, 2014) and hence it is termed as promotional
support.
Promotional instruments can help the salesperson who have multitude of goals, like the physicians
looking for promotional items (Waheed, Jaleel, & Laeequddin, 2011), help to stay in competition,
access to physicians and establishing rapport (Andaleeb & Tallman, 1996; Chressanthis, Khedkar,
Jain, Poddar, & Seiders, 2012), achieve the sales quota and success of new products. However, the
promotion in pharmaceuticals saw declining (as % of sales) owing to the lesser number of new
product launch (Kornfield, Donohue, Berndt, & Alexander, 2013) and due to high promotional
cost. Due to lesser number of new products launch and the high cost, companies cannot afford to
allocate the sufficient quantity of promotional inputs and mix of assortment to the PMRs
(Kornfield et al., 2013; Lurker & Caprara, 2005). Nevertheless, the results of the systematic
literature review describe that in pharmaceuticals, the promotion is more pertinent than other Ps
of marketing (Michael Stros & Lee, 2014). There is no study discussed on the promotional support
given to salesperson and it is a major research gap of the study.
Research questions
The study propose to develop a new construct “promotional support” and assessing its influence
on salesperson job performance, customer orientation and selling skills.
Construct definition
The construct definition is developed using the procedure suggested by Gilliam and Voss (2013)
and based on the extant literature and in-depth interview, we compare the existing definitions and
propose a preliminary definitions. The items generated will be examined with the domain experts
using test for substantive validity, which is a quantitative content validity (Gerbing & Anderson,
1988; Lawshe, 1975). These reflective items are then used to evolve an inclusive definition of the
construct “Promotional support”. Promotional support is the allocation of promotional inputs to
sales personnel by their organization for promotional activities, can induce sales and build
customer loyalty.
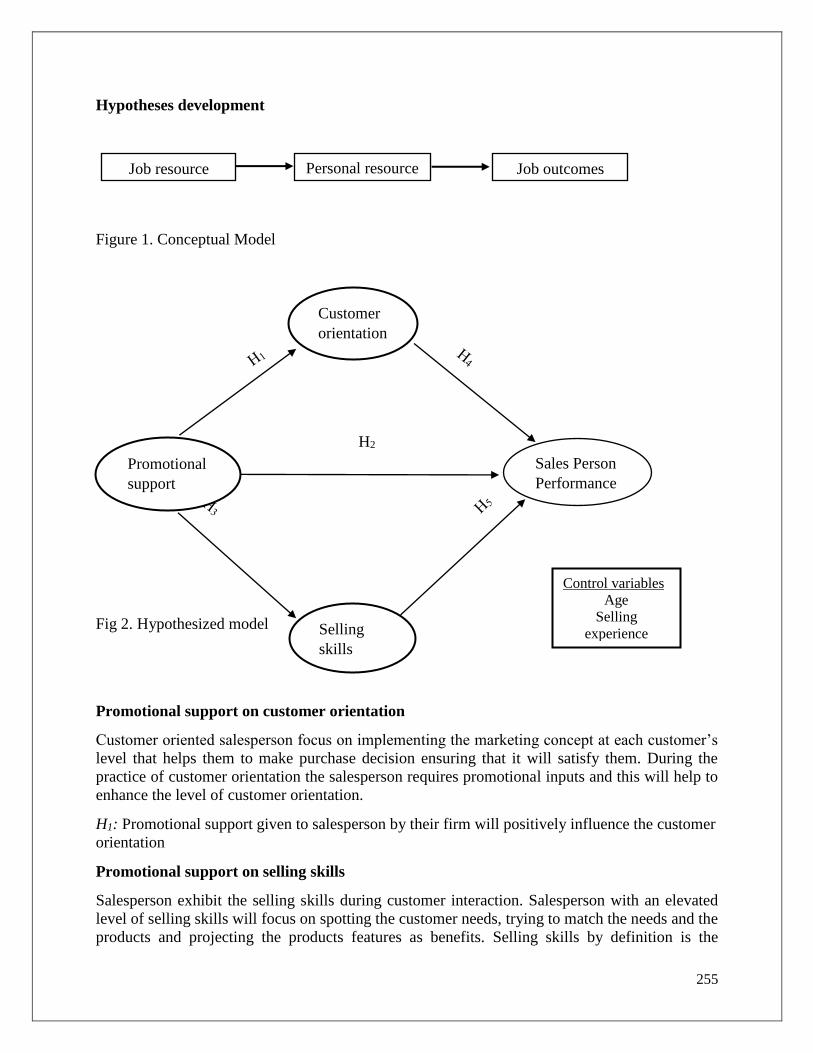
255
Hypotheses development
Figure 1. Conceptual Model
Fig 2. Hypothesized model
Promotional support on customer orientation
Customer oriented salesperson focus on implementing the marketing concept at each customer’s
level that helps them to make purchase decision ensuring that it will satisfy them. During the
practice of customer orientation the salesperson requires promotional inputs and this will help to
enhance the level of customer orientation.
H1: Promotional support given to salesperson by their firm will positively influence the customer
orientation
Promotional support on selling skills
Salesperson exhibit the selling skills during customer interaction. Salesperson with an elevated
level of selling skills will focus on spotting the customer needs, trying to match the needs and the
products and projecting the products features as benefits. Selling skills by definition is the
H2
Promotional
support
Selling
skills
Sales Person
Performance
Control variables
Age
Selling
experience
Customer
orientation
Job resource Personal resource Job outcomes
H2

256
salesperson capability to execute sales tasks. The sales task for a salesperson could be like
providing free drug samples, sponsor of medical education program, compliments, etc. and in order
to satisfy the customer needs the salespeople need promotional support. To accomplish these sales
task, the salesperson require promotional support. Salesperson who receive adequate level of
promotional support from their firms will have the chance of dispensing the promotional inputs as
per the need of the customers (Physicians).
With this argument, the study propose that
H2: Promotional support given to salesperson positively influence the selling skills.
The other hypotheses are:
H3: Promotional support given to salesperson influence sales performance.
H4: Customer orientation influence positively sales performance.
H5: Selling skills will positively influence sales performance.
Data and methodology
Participants were full-time sales representatives in the pharmaceutical industry, working in Indian
or multinational companies. This study was quantitative and cross-sectional in nature. Using PLS
SEM the model will be estimated as PLS SEM will be useful in an exploratory research.
Scale development
The scale development and testing procedure for the new construct of “promotional support” was
based on Churchill (1979) scale development procedure, and had four main steps: (1) Construct
development and examination of the face and content validity (2) Dimensionality testing (3)
Inspecting the internal consistency and (4) ensuring convergent, nomological and discriminant
validities. Reliability analysis and validity are the steps that follow in scale development
procedure. Using SPSS, exploratory factor analysis will be performed using varimax rotation.
Reliability will be assessed using Cronbach alpha while convergent validity was assessed using
the AVE.
Discussion
The study propose and build a new construct “Promotional support” with clear definition and
operationalize with measures and conceptualized the selling skills and customer orientation as
personal skills of PMRs. The newly developed scale posit as an antecedent in the model to personal
resources and sales performance. As a salesperson competes with the other salespeople from
competing firms in the same areas, having substantial promotional resources at their disposal can
help reduce their vulnerability and stress levels (Hobfoll & Shirom, 2001).
Salespeople face a tough competition in the market place where achieving sales quota has become
a continuous challenge (Guenzi, De Luca, & Spiro, 2016), so organization need to give importance
to promotional support. Another reason for the requirement of promotional support is that the time
slot given to PMRs are less by the physicians and the promotional inputs (free drug sample) can
be a visible brand reminder with the physicians (Gönül et al., 2001). On the contrary, promotional
inputs accelerate positively the level of customer orientation and selling skills among salespeople.
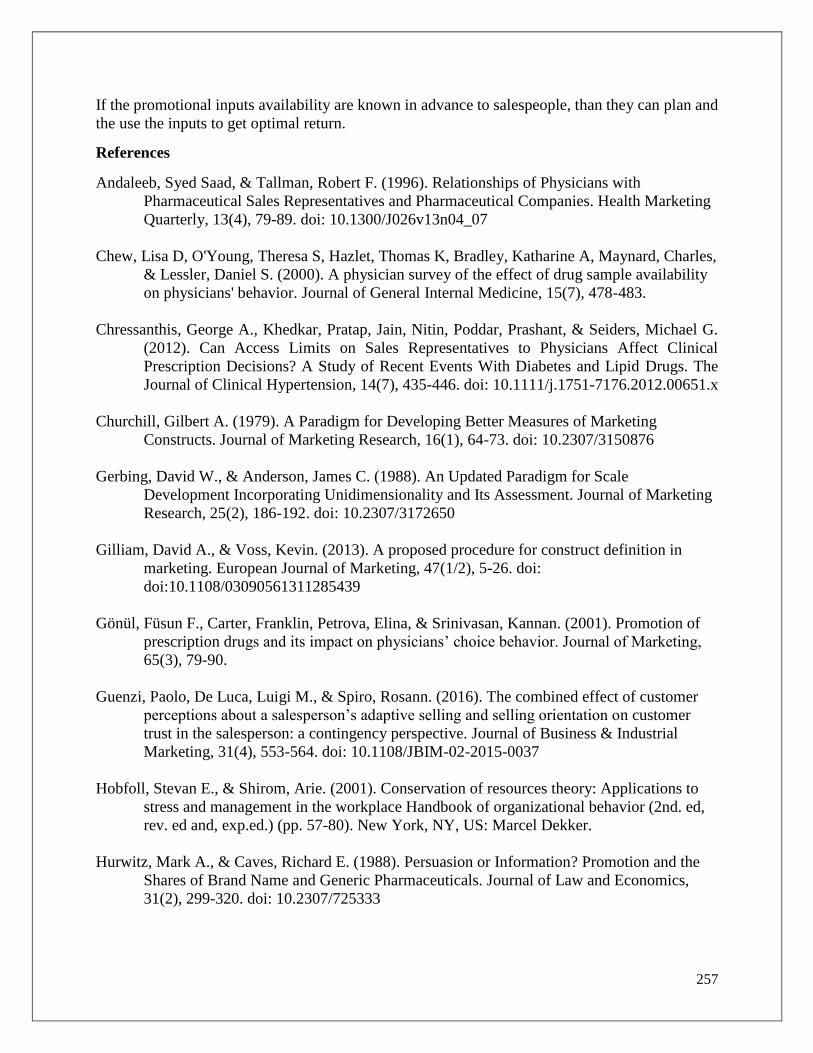
257
If the promotional inputs availability are known in advance to salespeople, than they can plan and
the use the inputs to get optimal return.
References
Andaleeb, Syed Saad, & Tallman, Robert F. (1996). Relationships of Physicians with
Pharmaceutical Sales Representatives and Pharmaceutical Companies. Health Marketing
Quarterly, 13(4), 79-89. doi: 10.1300/J026v13n04_07
Chew, Lisa D, O'Young, Theresa S, Hazlet, Thomas K, Bradley, Katharine A, Maynard, Charles,
& Lessler, Daniel S. (2000). A physician survey of the effect of drug sample availability
on physicians' behavior. Journal of General Internal Medicine, 15(7), 478-483.
Chressanthis, George A., Khedkar, Pratap, Jain, Nitin, Poddar, Prashant, & Seiders, Michael G.
(2012). Can Access Limits on Sales Representatives to Physicians Affect Clinical
Prescription Decisions? A Study of Recent Events With Diabetes and Lipid Drugs. The
Journal of Clinical Hypertension, 14(7), 435-446. doi: 10.1111/j.1751-7176.2012.00651.x
Churchill, Gilbert A. (1979). A Paradigm for Developing Better Measures of Marketing
Constructs. Journal of Marketing Research, 16(1), 64-73. doi: 10.2307/3150876
Gerbing, David W., & Anderson, James C. (1988). An Updated Paradigm for Scale
Development Incorporating Unidimensionality and Its Assessment. Journal of Marketing
Research, 25(2), 186-192. doi: 10.2307/3172650
Gilliam, David A., & Voss, Kevin. (2013). A proposed procedure for construct definition in
marketing. European Journal of Marketing, 47(1/2), 5-26. doi:
doi:10.1108/03090561311285439
Gönül, Füsun F., Carter, Franklin, Petrova, Elina, & Srinivasan, Kannan. (2001). Promotion of
prescription drugs and its impact on physicians’ choice behavior. Journal of Marketing,
65(3), 79-90.
Guenzi, Paolo, De Luca, Luigi M., & Spiro, Rosann. (2016). The combined effect of customer
perceptions about a salesperson’s adaptive selling and selling orientation on customer
trust in the salesperson: a contingency perspective. Journal of Business & Industrial
Marketing, 31(4), 553-564. doi: 10.1108/JBIM-02-2015-0037
Hobfoll, Stevan E., & Shirom, Arie. (2001). Conservation of resources theory: Applications to
stress and management in the workplace Handbook of organizational behavior (2nd. ed,
rev. ed and, exp.ed.) (pp. 57-80). New York, NY, US: Marcel Dekker.
Hurwitz, Mark A., & Caves, Richard E. (1988). Persuasion or Information? Promotion and the
Shares of Brand Name and Generic Pharmaceuticals. Journal of Law and Economics,
31(2), 299-320. doi: 10.2307/725333

258
Kornfield, Rachel, Donohue, Julie, Berndt, Ernst R., & Alexander, G. Caleb. (2013). Promotion
of Prescription Drugs to Consumers and Providers, 2001–2010. PLoS ONE, 8(3),
e55504. doi: 10.1371/journal.pone.0055504
Kremer, Sara, Bijmolt, Tammo HA, Leeflang, Peter SH, & Wieringa, Jaap E. (2008).
Generalizations on the effectiveness of pharmaceutical promotional expenditures.
International Journal of Research in Marketing, 25(4), 234-246.
Lawshe, Charles H. (1975). A quantitative approach to content validity1. Personnel psychology,
28(4), 563-575.
Lieb, Klaus, & Scheurich, Armin. (2014). Contact between Doctors and the Pharmaceutical
Industry, Their Perceptions, and the Effects on Prescribing Habits. PloS one, 9(10),
e110130.
Lurker, NANCY, & Caprara, B. (2005). The sampling subsidy. Pharmaceutical Executive, 1.
Michael Stros, & Lee, Nick. (2014). Marketing dimensions in the prescription pharmaceutical
industry: a systematic literature review. Journal of Strategic Marketing (ahead-of-print),
1-19.
Stremersch, Stefan, & Van Dyck, Walter. (2009). Marketing of the life sciences: A new
framework and research agenda for a nascent field. Journal of Marketing, 73(4), 4-30.
Waheed, Kareem Abdul, Jaleel, Mohammad, & Laeequddin, Mohammed. (2011). Prescription
loyalty behavior of physicians: an empirical study in India. International Journal of
Pharmaceutical and Healthcare Marketing, 5(4), 279-298.
Wazana, Ashley. (2000). Physicians and the pharmaceutical industry: is a gift ever just a gift?
Jama, 283(3), 373-380.

259
Multi-Channel Marketing and its impact on Customer Satisfaction
Chetan Srivastava & Raja Debashis
University of Hyderabad, Hyderabad
Introduction:
Multi-channel marketing should not be perceived simply as a marketing fad, it is rather, a strategic
marketing challenge, because customers these days are demanding more channel options, at the
same time, the modern technology has made multiple channel options possible and economically
feasible. (Verhoef & Donkers, 2005). It deserves the attention of top management.
For understanding multi-channel marketing, one must visualize a typical consumer buying process,
where a consumer begins with the initial stage of ‘needs recognition’ (aided by marketing
communication sent through various channels) and proceeds towards ‘searching alternatives’
(online & offline). Before finalizing the product s/he does a research on the product on social
media (on face book fan pages, review portals etc.) and narrows down the search for an online
comparison of available alternatives. Still undecided the consumer checks out the cart product in
a nearby physical store for touch & feel experience. Finally, after comparing the complete price of
the product, both tangible and intangible, the consumer decides for the online v/s offline which
leads towards the optimization of the value.
The consumer buying process discussed above depicts just one combination of various channel
combinations possible in multi-channel marketing. Different consumers may choose different
combinations of channels out of all the permutations and combinations possible, which gives the
option of planning and designing their merchandise and channels. Rapid diffusion of information
communication technology has paved the way for new channels helping the marketers to reach
their target customer more efficiently. Usage of all available channels simultaneously to make
product/service accessible to customer has been termed as multi-channel marketing. “When firms
use both the Internet and physical stores for distributing goods and services, this dual-channel
retailing strategy is called multichannel retailing” (Carlson & O’Cass, 2011). Internet technologies
enable the development and management of more complex multi-channel and cross-channel
relationships (Payne & Frow, 2004). This emerging phenomenon of multi-channel
marketing/retailing has been gaining attention in both practice and research (Konus, Verhoef and
Neslin 2008; Neslin and Shankar 2009).
Proportion of channel mix is yet another factor in multi-channel strategy, which majorly depends
on product type. Products can be broadly categorized into ‘‘search category’’ and ‘‘experience
category’’ products. Search category products are those in which complete product attribute
information can be acquired prior to purchase whereas, in the case of experience products
information search is costly and difficult to obtain before consumption (Nelson, 1981). It is found
that physical store channel is preferred by consumers for products high in experience attribute, and
virtual (online) channels are considered apt for search category products. In multi-channel
marketing strategy, a marketer’s endeavour is to provide better customer experience by offering
both types of channels.

260
Literature Review:
From the literature review, it is found that there is a lack of unanimity among scholars on the extent
of the impact of Multi-Channel Marketing on Customer satisfaction. However, in practice,
marketers/retailers are gung-ho on the Multi-Channel strategy. Although traditional (physical)
retailers like Walmart have embraced emerging multi-channel strategy, still their online retail
segment accounts for comparatively minuscule percentage of sales revenue (Agnihotri, 2015).
Because of lack of real time shopping experience, some scholars doubt on e-tailing/online retailing
becoming a dominating trend in future (Doherty & Ellis-Chadwick, 2010). Nevertheless, double-
digit growth of online retailers cannot be ignored. Moreover, tech savvy generation of millennials
(also called net generation) compels companies to offer virtual (online & mobile) channels apart
from physical channel.
The dominant view in the literary community is that in the multi-channel setting firms must attend
to service quality at both fronts: physical as well as virtual. Moreover, it is needed to have seamless
integration between the services offered through these two broad types of channels. It is also
suggested that seamless integration of various available channels can be a differentiating factor for
a marketer. At the same time failure to integrate channels seamlessly may harm the perceived
service quality. “In some industries, marketing channel costs may represent over 40% of the price
paid by the customer, so these often represent a prime opportunity for cost reduction” (Bucklin,
Defalco, DeVincentis, & Levis, 1996).
According to extant literature, well integrated channel strategy could facilitate customer to migrate
into more efficient channels which could enhance long term customer profitability.
Having seen the necessity of channel integration it is also suggested that there cannot be single
best multi-channel strategy and firms should devise their own strategy based on their individual
situation. Availability of multiple channels may not necessarily increase satisfaction level,
however; seamless integration of those channels does have a positive impact on customer
satisfaction.
Research Propositions:
Present research purports to add to the body of knowledge on emerging phenomenon of Multi-
channel marketing and conceptualize impact of integrated physical and virtual service quality on
customer satisfaction and in turn customer loyalty. Here, we discuss key factors and develop
propositions based on the literature.
Pauwels & Neslin, 2015, show that addition of physical store apart from catalogue and online
channel leads to the “availability effect” and increases returns and exchanges. Nevertheless, it
leads to net increase in buying frequency across channels resulting in higher overall revenues.
Cao & Li, 2015, focus on the impact of integration of various channels on performance. Their
analysis of US retailer’s data and sales performance suggest that integration is positively related
to performance.
“The overall objective of multichannel integration is to provide a significantly enhanced customer
experience that results in higher customer satisfaction, and increased sales, profits, and share of
wallet. Ideally, this should be accompanied by a lower cost to serve, through alternate channels,
lower in the value chain” (Payne & Frow, 2004).

261
Several studies, such as, Neslin et al. (2006), Neslin and Shankar (2009), Patrício, Fisk, and Cunha
(2008), have considered channel integration an important research topic. In fact, in the multi-
channel literature it has been suggested that channel integration failure may harm the perceived
levels of physical and virtual quality.
Hence, based on extant literature we propose that:
Proposition 1: Today’s customer demands multiple channels throughout their buying journey.
Moreover, customer values consistent and seamless experience across channels. Hence, the goal
of multichannel marketing is to provide a superior customer experience.
Proposition 2: Seamless shopping experience across channels leads to increased customer
satisfaction and in turn customer loyalty.
Proposition 3: To provide superior customer experience firms can harness enabling technologies,
such as advanced analytics, to provide data supported customer interactions, which can lead to
increased customer satisfaction and thus customer loyalty.
Further we explore relationship between Customer’s perceived service quality, both physical as
well as virtual, and Customer Experience.
Proposition 4: Customer’s perceived virtual service quality has influence on perceived physical
service quality.
Proposition 5: Customer’s perceived service quality (physical as well as virtual) has influence on
Customer Experience.
Proposition 6: Customer’s experience has influence on customer satisfaction.
Proposition 7: Customer overall satisfaction has influence on customer loyalty.
Conclusion: Present study is an attempt to add to the multi-channel marketing literature. Based
on extensive literature survey and observations some propositions have been framed. Our
propositional inventory present efforts to contribute to the systematic development of theory of
multi-channel marketing. Objective of the present study is theory development rather than testing,
though, in future authors intend to test the same using empirical research.
Keywords: Multi-channel Marketing/Retailing, Physical Service Quality, Virtual Service Quality,
Customer Experience, Customer Satisfaction, Customer Loyalty.

262
References:
(Baxendale, Macdonald, & Wilson, 2015;
Beck & Rygl, 2015;
Bilgicer, Jedidi, Lehmann, & Neslin, 2015;
Brynjolfsson, Hu, & Rahman, 2009;
Cao & Li, 2015;
Carlson & O’Cass, 2011;
Chen & Lamberti, 2016;
Doherty & Ellis-Chadwick, 2010;
Emrich, Paul, & Rudolph, 2015;
Fürst, Leimbach, & Prigge, 2016;
Juaneda-Ayensa, Mosquera, & Murillo, 2016;
Konuş, Verhoef, & Neslin, 2008;
Macdonal, Wilson, & Konus, 2012;
Melis, Campo, Breugelmans, & Lamey, 2015;
Neslin & Shankar, 2009;
Park & Park, 2016;
Parsons & Descatoires, 2016;
Pawar & Sarmah, 2015;
Payne & Frow, 2004;
Piotrowicz & Cuthbertson, 2014;
Rapp, Baker, Bachrach, Ogilvie, & Beitelspacher, 2015;
Rigby, 2011;
Rodríguez-Torrico, San José Cabezudo, & San-Martín, 2016;
Rosenbloom, 2007;
Verhoef & Donkers, 2005;
Verhoef, Neslin, & Vroomen, 2007;
Wallace, Giese, & Johnson, 2004;
Wang, Malthouse, & Krishnamurthi, 2015;
Yang, Y., Chau, & Gupta, 2017)

263
Moderation Effect of Gender on Consumer Adoption Intention towards Mobile Banking
Monica Rose & Renu Aggarwal
Fortune Institute of International Business, Delhi & YMCA University, Faridabad
Introduction
The market of financial services has witnessed humongous change owing to technology
advancements, increasing liberalized markets and emergence of phenomena of global markets.
Efficient processes, enhanced products and innovative service delivery channels are product of
this transformation. Latest delivery medium is the banking via electronic mode using mobile
devices called as mobile banking. This channel has dissolved the spatial and temporal constraints
allowing the users to access their money any time anywhere. Being the most cost-effective channel
of conducting banking transactions this medium is transforming the manner consumers carry their
banking transactions (Teka, b. M., & sharma, d. 2017). With emergence of e-commerce the
interaction of user has been re-defined with its provider. As internet has grown astronomically, m-
banking forms significant part of this growth and the young generation is the most prevalent
segment participating in it.
Previous researches have revealed a differential behavior pattern between the genders towards the
e-banking (Laukkanen, T. 2016). However few studies have investigated this issue in young
segment in India. Hence the purpose of this research is to bridge this gap. In order to provide an
insight into the whether gender moderates the user’s behavior towards m-banking adoption
intention in youth in India, the following specific research objective is employed which is:
to investigate whether gender has moderation effect on the user adoption towards m-
banking adoption in youth in India;
Review of Literature
Literature on consumer behavior emphasizes the differences in gender behavior by virtue of their
information processing specifically in responses on product or service choices and their
motivations (Holbrook, 1986; Palmer and Bejou, 1995; Meyers-Levy, 1989; Chiu et al, 2005).
Women seek social orientation, general communications and have inclination towards
cooperation. Men are competitive in their discussions with definitive communications having
concealed purpose to build and maintain social status (Preisler, 1987; Coates, 1986; Gefen &
Straub, 1997). Men strive to safeguard their autonomous identity where women have tendency to
seek and reaffirm closeness, affinity, support and harmony. Such disparity is also visible in
interfaces meant for solving the problems where men have propensity to solve the problem and
women lay focus on understanding, accord and compassion (Tannen, 1990; Coates, 1986; Gefen
& Straub, 1997). Women responses to non verbal impetus seeks associations, are fantasized and
relatively more elaborative then men (Gilligan, 1982; Chiu et al, 2005). These gender differences
by consumer researchers in past years were believed to be more intricate and evolving from factors
other than biological differences such as gender trait differences (Aiken, 1963; Vitz and Johnston,

264
1965; Kolyesnikova et al, 2009). Certain aspects of personality are related with masculinity and
femininity. Masculinity implies being assertive, independent and rational and femininity is related
with relational and interdependent features like being considerate, empathetic, sensitive,
responsible and caring (Cross and Markus, 1993; Palan, 2001; Kolyesnikova et al, 2009).
Therefore the consumer behavior research inculcates the concepts of gender identity occasionally
referred to as psychological sex and deemed to be phenomena having two dimensions masculine
personality traits and feminine traits (Palan, 2001; Kolyesnikova et al, 2009). Some researchers
believe that irrespective of the biological sex an individual may associate himself with any of these
dimensions (Kolyesnikova et al, 2009). Other researchers suggest that the gender roles are the
common cultural expectations laid on the individuals based on their socially defined gender
(Donaghue & Fallon, 2003; Eagly & Karau, 1991; Kidder, 2002; Williams et al, 2009). As
proposed by Chodorow (1994) based on Freud analysis of early childhood, the girls consider their
mothers as role models and imitate them in social communications when encouraged to do so and
turn out to be caring, compassionate and associative. On the contrary boys are distanced from their
mothers that create a sense of isolation within them making them explore their own identities. In
a way where girls are driven to be empathetic, social and caring boys on the other hand are
motivated to have independence, boldness and sense of accomplishment. Hence these two roles
form the cultural expectations that coerce the gender role processing for lifetime. The individuals
abide by these cultural expectations and behave in consistence with the expectations concerning
their gender in order to avoid the social pressures (Douglas, 1987; Kidder, 2002, p. 630; Williams
et al, 2009). These expectations drive individuals to form and get associated in groups that develop
their self and overall social identity which lays significant influence on individual’s way of living,
career, relationship and expression of feelings(Williams et al, 2009). In addition to these theories
Jackson et al (2011) proposed that the model of consumer socialization (Moschis and Churchill,
1978) and cohort theory (Ryder, 1965) supports differences in attitudes, norms and behavior
among social groups like gender groups. The consumer socialization pertains to influences from
sources or ‘‘socializing agents’’ which carry forward the social norms, attitudes, drives and
behavior to the novice individual or recipient of the influence (Moschis, 1987;Moschisand
Churchill, 1978;Ward,1974). As per the cohort theory, customers shared experiences with overall
social, political and economic incidents occurring during the adolescent years (Egri andRalsston,
2004; Ingelhart, 1997; Strauss and Howe, 1991) can be imbibed into distinct consumer groups as
unique value set, beliefs, aspirations and behaviors. In an integrative manner these frameworks
propose logical reasoning to indicate differences in preferences among the different social groups
(Jackson et al, 2011).
Gender specific distinctions are supported in plenty of previous studies (Johnson, 1993; Tannen
,1994). Some previous researches also focused on gender differences in IT, but these differences
did not pertain to IT diffusion in specific context (Gefen & Straub, 1997). Some of these studies
suggest that men recognize more prospects in trying out different PC applications then women
demonstrating higher positive attitude and keenness towards computer technology. (Van Slyke et
al., 2002; Lian and Yen, 2014). Women possess low self-confidence in their capability to use
newer technologies and are more reactive to elaborative and comprehensive information to learn
then men (Teo & Lim, 1996; Schultz, Schultz, & Sieland, 2010; Kempf, Laczniak, & Smith, 2006;
Wang, 2014). As a result of female tendency to sought information the impact of skillfulness
and challenge on investigative behavior is greater (Richard et al, 2010). Previous literature
suggests the behavioral differences in individuals in the virtual context on basis of their gender.

265
Gefen and Straub (1997) confirmed the existence of dissimilarities in perceptions of male and
female with respect to e-mail usage. Venkatesh and Morris (2000) concluded presence of motive
differences for usage of new software system in the office. Men are believed to possess higher
propensity to engage in e commerce then women. Men are more likely to carry out planned
purchasing whereas women tend to purchase other kinds of stuff and do less planned purchasing
(Van Slyke et al., 2002; Liébana-Cabanillas et al, 2014). Men have comparatively higher positive
attitude towards online shopping than women (Wu, 2003; Lian & Yen 2014) .These gender
differences may contribute to the moderating role for perceptions on attitudes and mobile banking
intentions. It is implied that influences of usefulness and ease of use on attitude and mobile banking
intentions may be moderated by gender
3. Research Model and Constructs
Perceived Usefulness (PU)
On basis of Bem (1981) sex role inventory (BSRI), men are found to possess more masculine
traits than women. In addition literature supports that masculinity is related to characteristics such
as self assertiveness, accomplishments, independence, confidence that are characteristics of men
rather than women (Spence and Helmreich, 1980; Nysveen et al. (2005). Men rate realistic
developments highly (Hofstede, 1980; Moutinho and Goode, 1995; Oumil and Erdem, 1997) by
proficiently carrying out tasks of internet transactions, indicating that usefulness is of prime
importance (Chiu et al, 2005). So the mobile banking intentions indicating a practical sense are
more prominent for male consumers. In addition in terms of IT use, males demonstrate more firmly
and thoughtfully the attitudes of task-orientation and instrumental features than females
(Venkatesh and Morris, 2000) That is indicative of influence of perceived usefulness on attitudes
since IT use is greater for males than females (Chiu et al, 2005). Likewise men intend to use more
Gender
Trust
Perceived Usefulness
Intention Perceived ease of use
Attitude

266
ecommerce applications and exert higher level of confidence, affinity toward new technology and
risk taking behavior. Hence, it appears plausible to propose a stronger effect of perceived
usefulness on attitude towards mobile banking intention among men than among women.
H1. Perceived usefulness will influence attitude towards intention to use mobile banking services
more strongly for men than for women.
Perceived Ease of Use (PEOU)
According to Venkatesh and Morris (2000), the influence of perceived ease of use on intention to
use IT is greater for females than males, suggestive of a higher influence of perceived ease of
mobile banking on both attitude and mobile banking intentions for females than for males. Since
females exhibit low level of computer aptitude (Venkatesh and Morris, 2000) that may result
influence of perceived ease of use on attitudes and mobile banking intentions more significantly.
Besides, it can be argued that though usefulness is more significant in accomplishing end objective
of technology use (i.e. extrinsic motivation), ease of use is more imperative in shaping contentment
with the procedure of mobile banking (i.e. intrinsic motivation)( Nysveen et al., 2005). In addition
females are more likely to possess greater levels of technology anxiety (Igbaria and Chakrabarti,
1990) implying that the influence of perceived ease of use on technology use may be moderated
by gender, in which it may be stronger for females than for males (Venkatesh and Davis, 1996;
Chiu et al, 2005). Concurrently, the following hypothesis is proposed:
H2. Perceived ease of use will influence attitude towards intention to use mobile banking services
more strongly for women than for men.
Additionally, gender generates dissimilar levels of the intention to use. More precisely, the higher
is the usefulness of the mobile banking system, the higher men’s prospect to use it (Choi, 2010).
Consequently, the following research hypothesis is proposed:
H3. Perceived usefulness will influence intention to use mobile banking services more strongly for
men than for women.
Trust
Many past research studies have highlighted the gender-related differences relating to the attitude
towards the adoption of new technologies (Hasan, 2010). Lately, it has been established that
women have a greater perceptions of trust in the adoption of electronic services that enhances their
attitude as compared to men (Okazaki, 2007) and, consequently augments intention levels (Neil et
al., 2009; Liébana-Cabanillas et al, 2014). On this basis it is proposed:
H4. Trust will influence attitude towards intention to use mobile banking services more strongly
for women than for men.

267
Attitude
Attitude towards using a service is identified through the perceptions about the consequences of
using it and positive evaluation of the consequences (Nysveen et al., 2005). Men and women differ
significantly in terms of attitude towards new technologies. As suggested by Venkatesh et al.
(2000), attitude towards using a technology in the place of work is predominantly influenced by
perceived usefulness of this technology and usefulness has stronger influence on males than
females. However, usefulness is just one determinant of attitudes and attitude is influenced by both
usefulness, ease of use and also by trust and social influence in the present context of mobile
banking services. As previously argued gender moderates the effect of these determinants.
Consequently, the hypothesis is put forth:
H6. Attitudes will influence intention to use mobile banking services more strongly for men than
for women.
Research Methods
Sample and procedure
The study followed a quantitative research approach by testing the proposed conceptual model as
done in previous researches on technology adoption particularly in e-banking (Im et al., 2011).
Survey was done using administrated questionnaire with 21 measurement items using convenience
sampling method from the users of m-banking in Delhi NCR region in India falling in the age
segment of 18-35 years. The data was partly collected from the institutes and universities in Delhi
and NCR regions and from customers in the corridors of major banks near these institutes and
universities during May to July 2016. The choice of these respondent was done primarily for the
following reasons. The inclusion of students was necessary as they are the largest age group as
users of technologies (Yu, 2012) so they have high probability of having familiarity with electronic
banking. Moreover this segment represents the current and the most potential future users of
banking services (Alalwan et al., 2014). So it would be rational to assume that the perceptions of
the respondents in this study represented the beliefs of majority of the m-banking users. The
respondents participated on voluntary basis and were requested to fill the questionnaire based on
their perceptions regarding the m-banking adoption and use. The individual participant took an
average of 11minutes to fill the questionnaire. Out of 1200 questionnaires distributed 862 were
returned showing 71 per cent response rate. After the review of all received questionnaires, 69
questionnaires were excluded from the study due to missing or incomplete values. Hence the total
usable responses for the study were 793.

268
As shown in the table 1, the gender distribution constituted of 69% males and 31% females.
GENDER Male 550 69%
Female 243 31%
Total 793 100%
Table 1
The age distribution was as shown in the table 2 varying from 18 to 35 years. Respondents in age
category were 15%. The distribution in the age category 2, 3 and 4 were almost similar having
28%, 30% and 26% respondents respectively.
AGE 1 18-21 52 15%
2 22-25 98 28%
3 26-30 105 30%
4 31-35 90 26%
Total 345 100%
Table 2
Regarding their experience of using m-banking ranged from using less frequently and accessing
limited services or using it more no. of times and using it over a period of considerable time.
Measurement
The scale items were identified on basis of extensive literature review. The items Peou and PU
were taken from Davis et al.(1989) and (Luarn and Lin(2005), trust was taken from Liang et al
(2011), attitude and behavioural intention Taylor and Todd (1995). A seven-point Likert-type scale
was used where 1 indicated strongly disagree and 7 as strongly agree. Though the measurement
items were sourced from the established and tested models, pilot test was done involving 25
respondents selected at random to check the question understanding, language clarity or
questionnaire length from the respondents to build the content validity and reliability. The
questionnaire had slight modifications following the pilot-test results.

269
Analysis and Findings
Descriptive analysis: The descriptive statistics for every construct in the conceptual model is
shown in Table II. All means were higher than 5.32 that show positive inclinations of most of the
respondents towards the given factors in the study. Moreover the values of Cronbach’s α showed
that all constructs demonstrated high internal reliability.
Construct Mean SD Cronbach α
Peou 5.62 1.28 .862
PU 5.68 1.23 .831
Trust 5.32 1.36 .844
Attitude 5.77 1.12 .896
Behavioural Intention 5.63 1.19 .847
Measurement model
A two-step approach was followed in the study to investigate the relationship between the
constructs in the conceptual model as recommended by Anderson and Gerbing
(1988) and Schumacker and Lomax (2010). Firstly the analysis of measurement model was done
to evaluate the reliability and validity of the research instrument before examining research
hypotheses in the structural model. So, confirmatory factor analysis(CFA) using AMOS 18.0 was
done to identify measurement model fit and thereafter followed the examination of the validity of
the model (Arbuckle, 2009). This study adopts the principal component analysis method to
measure the model’s parameters where all analyses were conducted on variance-covariance
matrices (Hair et al., 2010).
However, it was necessary to examine the multi collinearity prior to the analysis. As suggested by
(Pallant, 2010), multi collinearity happens where two or more variables are highly correlated with
each other. There has been disparity in the benchmark acceptable values by different researchers.
For example, correlations close to 0.8 or 0.9 are indicated as of big concern by (Tabachnick and
Fidell, 2007) whereas Pallant (2010) identifies the correlation values close to 0.7 or higher as
highly concerning. The existence of multi collinearity is identified through 2 values, tolerance and
variance inflation factor (VIF) (Pallant, 2010).
Multi collinearity do not exist where tolerance values are higher than 0.10 and VIF less than 3.0.
Given all the independent constructs had VIP value less than 3.0 and tolerance value above
0.10, this suggests the absence of multi collinearity in our sample.

270
The model fit goodness is established through few fit indices. (Hair et al., 2010; Kline, 2010).
Initially value of chi square was used to determine the minimum fit values but due to it’s sentivity
to the sample size it is not considered as a very good indicator of model fit (Hu and Bentler, 1999).
Instead the ratio of chi square statistic with degree of freedom having score of less than 3 indicates
an acceptable fit (Carmines and McIver, 1981). Besides this there are few more fit indices as
suggested by Hair et al. (2010), which are: “goodness-of-fit index; normed fit index; parsimony
normed fit index; root mean square residuals; comparative fit index; adjusted goodness-of-fit
index; and the root mean square error of approximation”.
Fit
index
Recommended
values
Measurement
model
Structural
model
χ2 NS at p<0.05 803.181 792.919
df n/a 358 354
χ
2
/df
<5 preferable <3 2.244 2.240
GFI >.90 .907 0.910
CFI >0.90 .954 0.955
RMR >.10 .076 0.087
RMSEA >.08 .040 0.040
NFI >.90 .921 0 .922
Notes: AGFI, adjusted goodness-of-fit; CFI, comparative fit index; df, degrees of freedom; GFI,
goodness-of-fit index; NFI, normed fit index; RMSEA, root mean square error of approximation;
RMSR, root mean square residuals ( Sources: a Hu and Bentler (1999), Kline (2010) and Hair et
al. (2010)
Convergent validity checks if each factor is determined by its own measurement items (Gefen et
al., 2000) to establish that the factor is uni-dimensional and to remove the non-reliable indicators
(Bollen, 1989). Discriminant validity measures the degree to which the measurement items of the
different factors are statistically different (Gefen et al., 2000).
According to Hair et al. (2010), the assessment of reliability, convergent and discriminant validity
can be done through composite reliability (CR), average variance extracted (AVE), maximum
shared squared variance (MSV), and average shared squared variance (ASV). The reliability is
considered significant at CR valus from 0.6 desirable is 0.7 and higher according to Hair et
al. (2010). Convergent validity is ensured at values of AVE from 0.5 (that means that the 50 per
cent variability of indicators is by due to latent variables) and values of CR are higher values of

271
AVE. To ensure discriminant validity the values of MSV should be lower than AVE and ASV
value is lower than AVE (Hair et al., 2010).
4.4 Results
Moderation SEM results
The results of the moderation effect on the structural path revealed that perceived usefulness and
trust to be significant determinants in influencing adoption intention behavior of both males and
females. However, moderation effect on path from perceived ease of use was not significant in
females as compared to the males. The path from trust to attitude was significant in bother genders
along with the path from attitude to intention (BI) to adopti m-banking.
Model Fit Summary : Male
Model Fit Summary
CMIN/DF RMR CFI TLI RMSEA
2.240 .087 .955 .946 .040
Model Fit Summary
Gender
Trust
Perceived Usefulness
Perceived ease of use
Attitude
Intention
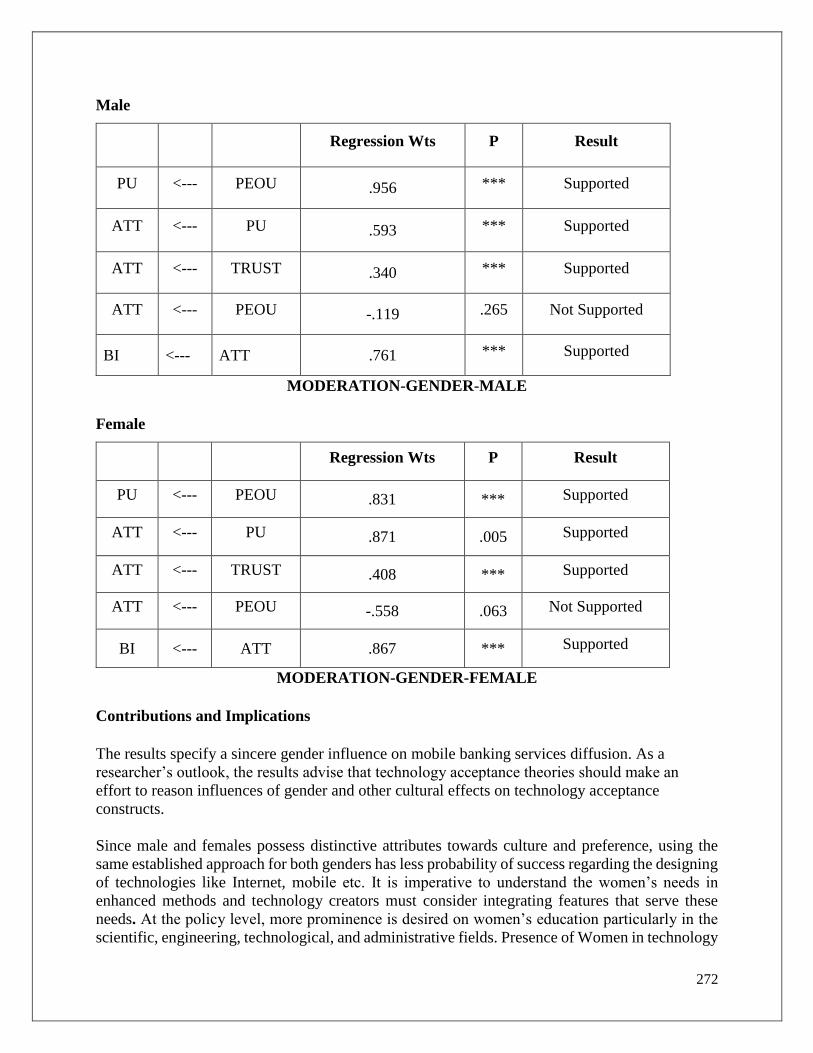
272
Male
Regression Wts P Result
PU <--- PEOU .956 *** Supported
ATT <--- PU .593 *** Supported
ATT <--- TRUST .340 *** Supported
ATT <--- PEOU -.119 .265 Not Supported
BI <--- ATT .761 *** Supported
MODERATION-GENDER-MALE
Female
Regression Wts P Result
PU <--- PEOU .831 *** Supported
ATT <--- PU .871 .005 Supported
ATT <--- TRUST .408 *** Supported
ATT <--- PEOU -.558 .063 Not Supported
BI <--- ATT .867 *** Supported
MODERATION-GENDER-FEMALE
Contributions and Implications
The results specify a sincere gender influence on mobile banking services diffusion. As a
researcher’s outlook, the results advise that technology acceptance theories should make an
effort to reason influences of gender and other cultural effects on technology acceptance
constructs.
Since male and females possess distinctive attributes towards culture and preference, using the
same established approach for both genders has less probability of success regarding the designing
of technologies like Internet, mobile etc. It is imperative to understand the women’s needs in
enhanced methods and technology creators must consider integrating features that serve these
needs. At the policy level, more prominence is desired on women’s education particularly in the
scientific, engineering, technological, and administrative fields. Presence of Women in technology

273
intensive areas like ICT and other tech products and services is higher in Singapore since the
government has focused efforts in state directed ICT trainings. The use should have a broader
perspective encompassing not only having appropriate technology use skills but also be able to use
in diverse mode and in an environment where one could have children, babies and community
(Dholakia et al, 2004). Empirical evidence on gender influencing individual behavior have been
established in prior studies that recognize women being more involved in doing purchases, give
greater consideration to the salespeople, are more apprehensive about confidentiality, and attribute
superior value to interactions with salespeople. Conversely, males strive for building their own
individuality, tend to be relatively self-governing in their purchase process and possess more
purposeful intentions when transacting. Majorly literature emphasize two gender differences that
affect the consumer buying behavior: (1) men are more practical and are mainly conducted by
social norms that necessitate control, dominance and self-efficacy to follow selfish goals, while
(2) women face bigger concern while undergoing new endeavors, and lay prominence on
association and pleasant relations with others (San Martín & Jiménez, 2011). Men usually are
driven by task achievement and electronic banking services are primarily determined by goal
fulfillment. Women feel greater threat in an electronic transaction than men do, influences of social
group exert higher influence on women in mobile services, there is more probability of men in
using mobile banking than women (Yu, C. S, 2012). Similar findings were observed in Brazil
(Puschel et al, 2010) in India (Joshua and Koshy, 2011) that men are more predominant users and
are more likely to use electronic banking services than women. When promoting mobile banking
services and bearing in mind its effects, the practitioners should ponder on the gender of their
users. As the socio-cultural variances impact marketing, management and technology acceptance
policies, so should gender. In providing training to handlers on using mobile banking, it would be
emphatic to address clusters having majorly women in diverse manners than mixed or largely male
groups. For women, the capability of this service to convey the existence of the communicator of
her feelings and opinions could be stressed for instance the user-friendly aspect of this service is a
feature to which women may be predominantly sensitive (Gefen, D., & Straub, D. W., 1997). If
the promotion targets women, it should be concentrated on anxieties pertaining to security and/or
privacy as a means to build a positive attitude towards the service. Specifically such strategies
could be complemented by the including security information page links and appropriate policies.
Additionally assurances like money back guarantees and evidences from comments from the
customer may be highly influential. Also, it is crucial be cautious in service functionality for
example having no technical failures, content management and various ways of interaction with
the providers. In case of men the impact of social influences like social media groups, electronic
word of mouth can serve as amazing control measure and management over men who have
tendency to get influenced by third party as compared with women. It is suggested to build forums
to increase the influence men receives that influences their attitude towards using mobile banking
services.
Limitations and future scope
The data was collected using a cross-sectional method that does not illuminate the existence and
research of development of users’ behavior over time. A long period focus would permit
verification of the strength of the recognized relations. To get better uniformity in the outcomes,
the study must be repeated in the future to authenticate the influence of gender and evaluate how
it impacts other factors and associations.

274
References
Laukkanen, T. (2016). Consumer adoption versus rejection decisions in seemingly similar
service innovations: The case of the Internet and mobile banking. Journal of Business
Research, 69(7), 2432-2439.
Teka, b. M., & sharma, d. (2017). Influence of demographic factors on users'adoption of
electronic banking in ethiopia. Journal of internet banking and commerce, 22(s7), 1.
T. Al-Maghrabi, T & C. Dennis, “The driving factors of continuance online shopping: gender
differences in behaviour among students, the case of Saudi Arabia”, International Journal
Im, I., Hong, S. and Kang, M.S. (2011), “An international comparison of technology adoption:
testing the UTAUT model”, Information & Management, Vol. 48 No. 1, pp. 1-8.
Yu, C.-S. (2012), “Factors affecting individuals to adopt mobile banking: empirical evidence
from the UTAUT model”, Journal of Electronic Commerce Research, Vol. 13 No. 2, pp. 104-
121.
Alalwan, A., Dwivedi, Y. and Williams, M. (2014), “Examining factors affecting customer
intention and adoption of internet banking in Jordan”, UK Academy for Information Systems
Conference Proceedings, Paper 3, Oxford, 7-9 April.
Schumacker, R.E. and Lomax, R.G. (2010), A Beginner’s Guide to Structural Equation
Modeling, Routledge, Lawrence Erlbaum, York.
Anderson, J.C. and Gerbing, D.W. (1988), “Structural equation modeling in practice: a
review and recommended two-step approach”, Psychological Bulletin, Vol. 103 No. 3, pp.
411-423.
Arbuckle, J. (2009), Amos 18 User’s Guide, SPSS Incorporated, Armonk, NY.
Hair, J.F.J., Black, W.C., Babin, B.J., Anderson, R.E. and Tatham, R.L. (2010), Multivariate
Data Analysis, Prentice Hall, NJ, Upper Saddle River.
Pallant, J. (2010), SPSS Survival Manual: A Step by Step Guide to Data Analysis using
SPSS,4th ed., Open University Press, Berkshire.
Tabachnick, B.G. and Fidell, L.S. (2007), Using Multivariate Statistics, 5th ed., Allyn &
Bacon, Needham Height, MA.

275
Customer Engagement in Cause Related Online Brand Communities: A Conceptual
Framework
Shilpi Saxena
IIT Madras
Introduction
In recent years, the internet & web page exposure has facilitated fast and easy communication
among users, thus, contributing to the rapid growth of online brand communities (OBCs). A virtual
or online community is defined as an “aggregation of individuals or business partners who interact
around a shared interest, where the interaction is at least partially supported and/or mediated by
technology and guided by some protocols or norms” (Lee, Vogel, and Moez 2003; Preece 2000).
Customer’s growing concern of companies doing well for society entails companies to move
forward for building socially responsible frame of reference. Most of the companies therefore
plunge into cause related online marketing for enhancing customer engagement and participation.
Customer engagement (CE) is a “psychological process that models the underlying mechanisms
by which customer loyalty forms for new customers of a service brand, as well as the mechanisms
by which loyalty may be maintained for repeat purchase customers of a service brand”. This
definition by Bowden (2009) states that how customer engagement leads to repeat purchase
behavior. However according to Doorn and Lemon (2010), Customer Engagement Behaviors
(CEB) leads not only to repeat purchase behaviors but also other behavioral manifestations that
will benefit brands and firm in long run.
The present study is among the first study in the cause related online brand community literature
highlighting factors which leads to positive customer engagement and behavioral manifestations
which provide long term customer bonding as well as profit to the firm. The study contributes to
“Total Customer Engagement Value,” framework given by Kumar et al. (2010) for managerial
perspectives by providing a conceptual framework for Customer engagement behavior. It also add
valuable insight as to how positive CEB from consumers involved in the cause related online brand
community of the Starbucks can leads to other behavioral manifestations of customers such as
positive word of mouth, blogging, brand community membership, involvement, co-creation,
suggestion for improving the brand/Product as well as increased awareness and contribution for
the cause in the cause related online brand communities (CROBCS) etc. that will benefit the firm
in the long run.
2. Research Questions & Propositions
2.1 Research Gap
Although the construct of consumer engagement behaviors (CEBs) has been reviewed abundantly
in online brand communities (OBCs) with the strong focus of customer attitude and purchase
behavior, the gap exist to study how CEBs leads to behavioral modifications other than purchase.
The study provides the conceptual model to identify triggers and outcomes for CEBs in the cause
related OBC to address this gap.
2.2 Research Questions

276
The specific research questions (RQs) employed in this inquiry are:
RQ1. What are the key triggers leading to the positive CEBs and behavioral modifications for
consumers in the Cause related OBCs?
RQ2.What are the outcomes of positive CEBs other than purchase behavior for brand, organization
and society in the Cause related OBCs?
2.3 Research Propositions
The supporting propositions addressing two research questions are the following:
2.3.1 For Triggers
P1.Strong brand association with the cause leads to positive CEBs
P2.High Perceived quality/performance for the cause by brand develop positive CEBs
P3.High involvement of the brand in CSR activities leads to positive CEBs.
P4.Higher the cause-brand image fit, higher is the CEBs
P5.Customer Ideology and values for serving the cause leads to positive CEBs.
P6. Higher the cause-customer fit, higher is the CEBs
P7.Positive social integration leads to positive CEBs.
2.3.2 For Outcomes
P8. Positive CEBs leads to positive Brand Image building
P9. Positive CEBs leads to sustainable Brand loyalty
P10. Positive CEBs leads to positive WOM
P11. Positive CEBs leads to increased participation in OBCs
P12. Positive CEBs leads to increased Customer co creation
P13. Positive CEBs leads to achieving triple line benefits of social, economic and environmental
growth.
P14. . Positive CEBs leads to increased awareness for the Cause.
3. Data and Methodology
The qualitative research methodology was adopted in the study and data was analyzed through
content analysis. The research plan involves two stages. The first stage is exploratory study of
construct and variables based on secondary data available in literature for past ten years .Further,
content analysis of the customer reviews and feedback has been done for the chosen OBCs through
qualitative data analysis software.
4. Discussion
4.1 Conceptual Model

277
The qualitative study highlight CEBs of the consumer in the cause-related OBCs.On the basis of
two stage research approach a conceptual model for CEBs has been developed in the cause-related
OBCs. The proposed conceptual framework identifies four key triggers of participation in CROBC
namely brand related,customer related ,social & functional which explain the reasons for positive
CEBs.The outcomes of Positive CEBs shows how the behavioral modifications in consumers leads
to benefit for brand, organization,OBC & society as a whole especially in terms of other than
purchase The study recommend that the company by developing CROBCs can move towards
developing and fostering long run customer engagement & retention, increased sales & value for
the firm.
4.2 Managerial Implications
For managerial implications the research findings signifies that the other behavioral modifications
from consumer like positive word of mouth, blogging, brand community membership and
involvement, cocreation and suggestion for improving the brand/Product as well as increased
awareness and contribution for the cause by involving in the cause related online brand community
leads to more positive reasons for consumer to associate and remain with the firm for the long
term. Also it will increase the purchase intension and leads to greater sales.
References
Aaker, D.A. (1996). Managing Brand Equity. New York : The Free Press
Adkins, S. (2000). Cause Related Marketing: Who Cares Wins. Butterworth Heinemann.
Oxford,:
Adjei, M.T., Noble, S.M. and Noble, C.H. (2010).The influence of C2C communications in
online brand communities on customer purchase behavior. Journal of the Academy of Marketing
Science , 38 , 634-653
Algesheimer, R., Dholakia, U. and Herrmann, A. (2005).The social influence of brand
community: evidence from European car clubs”, Journal of Marketing, 69, 19-34.
Ashforth, B.E. and Mael, F. (1989), Social identity theory and the organization, Academy of
Management Journal, 14 N, 20-39.
Batra, R. and Ahtola, O.T. (1991), Measuring the hedonic and utilitarian sources of
consumer attitudes, Marketing Letters, 2, 159-170.
Bender, B. (1978). Gatherer-Hunter to farmer: a social perspective , World Archaeology, 10,
204-222. .
Bennett, R. and Gabriel, H. (2000), Charity affiliation as a determinant of product purchase
decisions. Journal of Product and Brand Management, 9,410-425

278
Bigne´-Alcaniz, E., Curra´s-Pe´rez, R., and Sa´nchez-Garcı´a, I. (2009). Brand credibility in
cause-related marketing: the moderating role of consumer values, Journal of Product & Brand
Management, 18, 437–447
Bhattacharya, C. &Sen, S. (2003). Consumer-company identification: a framework for
understanding consumers’ relationships with companies, Journal of Marketing, 67, 76-88.
Blazevic, V., Hammedi, W., Garnefeld, I., etal. (2013). Beyond traditional word-of-mouth: an
expanded model of customer-driven influence, Journal of Service Management, 24, 294-313.
Brink, D. V. D., Odekerken-Schroder, G., &Pauwels, P. (2006).The effect of strategic and
tactical cause-related marketing on consumers' brand loyalty. Journal of Consumer Marketing,
23, 15-25.
Brodie, R. J., Ilic, A., Juric, B., &Hollebeek, L. (2013). Consumer engagement in a virtual brand
community: An exploratory analysis. Journal of Business Research, 66(1), 105-114.
Broderick, A., Amandeep, J and Garry, T .(2003), Tickled Pink: The Personal Meaning of Cause
Related Marketing for Customers, Journal of Marketing Management, 19, 589.
Boorstin, D. (1973). The Americans: The Democratic Experience. New York: Random House.
Bowden, J.L. (2009). The process of customer engagement: a conceptual framework, Journal of
Marketing Theory and Practice, 17 , 63-74.
Business in the Community (2000), The case of cause related marketing: guidelines towards
excellence, available at http://crm.org.uk/step2/ publications/guidelines.htm
Casalo´, L., Flavia´n, C. and Guinalı´u, M. (2007). The impact of participation in virtual brand
communities on consumer trust and loyalty: the case of free software, Online Information
Review, 31, 775-792.
Dholakia, U.M., Blazevic, V., Wiertz, C. and Algesheimer, R. (2009). Communal service
delivery: how customers benefit from participation in firm-hosted virtual P3 communities,
Journal of Service Research, 12 ,2, 208-226.
Dorr, Nancy, etal. (1999),. Psychosocial Correlates of Voluntary HIV Antibody Testing in
College Students, AIDS Education and Prevention, 11 , 14–27.
Dupree, J. (2000). Review of Brand Spirit: how cause related marketing builds brands
Fellman, M.W. (1999). Cause related marketing takes a strategic view, Marketing News, 26
April, p.4 Fishbein, M., &Ajzen, I. (1975). Belief, attitude, intention, and behaviour: An
introduction to theory and research. Reading. Massachusetts: Addison-Wesley Publishing
Company.

279
Grayson, D. (1998) Communities and Partnerships, A Business in the Community paper
prepared for Committee of Inquiry Into a New Vision for Business and The Oxford Mail .
Grau, S. L., &Folse, J. A. G. (2007). Cause-related marketing (CRM): The influence of donation
proximity and message framing cues on the less-involved consumer., Journal of Advertising, 36,
19-33.
HRH The Prince of Wales. (1998). The Cause Related Marketing Guidelines – Towards
Excellence Business in the Community.
Hughes, D.E. and Ahearne, M. (2010).Energizing the reseller’s sales force: the power of brand
identification, Journal of Marketing, 74, 81-96.
Jang, H., Olfman, L., Ko, I., Koh, J. and Kim, K. (2008). The influence of on-line brand
community characteristics on community commitment and brand loyalty , International Journal
of Electronic Commerce, 12 , 3, 57-80.
Kim, J.H., Bae, Z.T. and Kang, S.H. (2008). The role of online brand community in new product
development: case studies on digital product manufacturers in Korea, International Journal of
Innovation Management, 12, 357-376.
Kim, J.W., Choi, J.H., Qualls, W. and Han, K.S. (2008). It takes a marketplace community to raise
brand commitment: the role of online communities, Journal of Marketing Management, 24 , 409-
431.
Kozinets, R.V. (2002). The field behind the screen: using netnography for marketing research in
online communities, Journal of Marketing Research, 39, 61-72.
Laaksonen, P. (1994). Consumer Involvement: concepts and research, London, Routledge
Lee, F. S., D. Vogel, and L. Moez. (2003). Virtual community informatics: A review and research
agenda. Journal of Information Technology Theory and Application, 5, 47–61.
Madupu, Vivek&Cooley,O.Delonia. (2010). Antecedents and consequences of Online Brand
Community Participation: A Conceptual Framework. Journal of Internet Commerce, 9, 127-147
Mattila, A. and Wirtz, J. (2002), The impact of knowledge types on the consumer search process
– an investigation in the context of credence services, International Journal of Service Industry
Management, 13, 214-230
McKenna, K., and J. A. Bargh. (1999). Causes and consequences of social interaction on the
Internet: A conceptual framework. Media Psychology, 1, 249–269.
Mollen, A. and Wilson, H. (2010). Engagement, teTriandislepresence and interactivity in online
consumer experience: reconciling scholastic and managerial perspectives, Journal of Business
Research, 63, 919-925. Moss Katter, R. (1995) World Class, Thriving in the Global Economy,
Simon & Schuster, New York
Muniz, A. M., and L. O. Hamer. (2001). Us versus them: Oppositional brand loyalty and
the cola wars, Advances in Consumer Research, 28, 355–361.

280
Muniz, A.M. Jr and O’Guinn, T.C. (2001). Brand community, Journal of Consumer Research, 27
412-432 Oliver, R. L. (1999). Whence consumer loyalty, Journal of Marketing, 63 (Special Issue),
33–44
Oloko, S. (2008). Cause related Marketing – An overview of a new marketing instrument
(Cause related Marketing -EinneuesMarketinginstrumentim U¨ berblick). Berlin.
Ouwersloot, H. and Odekerken-Schro¨der, G. (2008). Who’s who in brand communities – and
why?”, European Journal of Marketing, 42, 571-585.
Preece, J. ( 2000). Online communities: Designing usability, supporting sociability. New York:
Wiley.
Pringle, H. and Thompson, M. (1999). Brand spirit: how cause related marketing build brands,
Chichester: John Wiley and Sons.
Ross, J.K., Patterson, L.T. &Stutts, M. A. (1992). Consumer Perceptions of organizations that use
cause related marketing, Journal of the Academy of Marketing Science, 20, 93-97.
Schwartz, Shalom H. (1977).Normative Influences on Altruism.Advances in Experimental Social
Psychology. New York: Academic Press.
Stipp, H. &Schiavone, N.P. (1996). Modelling the Impact of Olympic Sponsorship on Corporate
Image, Journal of Advertising Research, (July/August), 22-28.
Svensson, G. & Wood, G. (2008). Cause related marketing: commercialism or altruism: finding
the balance?, International Journal of Electronic Customer Relationship Management, 1 , 231-41.
Till, B. & Nowak, L. (2000). Using toward effective use of cause-related marketing alliances,
Journal of Product and Brand Management, 9, 472-84.
Van Doorn, J., Lemon, K. N., Mittal, V., Nass, S., Pick, D., Pirner, P., &Verhoef, P. C. (2010).
Customer engagement behavior: Theoretical foundations and research directions. Journal of
Service Research, 13(3), 253-266.
Wiertz, C. & de Ruyter, K. (2007). Beyond the call of duty: why customers contribute to firm-
hosted commercial online communities, Organization Studies, 28, 347.
Wirtz, J &Ramaseshan.B.(2013), Managing brands and customer engagement in online brand
communities. Journal of service management, 24, 223-244
Woisetschla¨ger, D.M., Hartleb, V. &Blut, M. (2008). How to make brand communities work:
antecedents and consequences of consumer participation, Journal of Relationship Marketing, 7,
237-256.

281
Exploring antecedents of payment options in online retail
Deepak Ranjan, Manoj Motiani & Himanshu Shekhar Srivastava
IIM Indore
Introduction
From last few decades rise of Internet and increase in mobile phone penetration has brought
revolution throughout the world. It has changed the way we communicate with each other, way
we read, way we shop etc. It has completely changed our way of living. It has also permitted
buyers and sellers to actually sell and buy anything, anytime by sitting from any part of the world.
Electronic commerce is basically commerce or business conducted with the help of internet
(Toyin, O. & Damilola O.,2012). Indian consumers purchasing online is expected to cross 100
million by the end of 2017 along with e-retail market likely to grow by 65% by 2018 as per
ASSOCHAM – Resurgent India study (2017). This growth has accelerated after demonetization
with various digital initiatives and improved cheap internet connectivity. By 2020, online shoppers
are expected to reach 175 million, as per joint study conducted by Google and A.T. Kearney
conducted in 2016.
Despite being huge growth of online shoppers in India, various problems still persist. Customers
are not having good experience from the website due to which customers are unsatisfied. As per
statistics published on consumer forum website of India from April 2015-March 2016 customer
complaint in online retail segment is second highest after telecom companies
(http://www.consumerforums.in/complaint-statistics). Bad experiences reduce the interest of
consumer to shop online. Moreover, consumer perceived various types of online risk while
shopping online. Also this perceived risk is a result of absence of physical interaction between
online sellers and consumers, along with temporal separation of payment and product delivery
(Xiao & Benbasat, 2011). This inhibits growth of online retail to its full pace. The success of online
retail depends majorly on secure and safe payment system and trustworthy delivery infrastructure
(Gavish et. al.,2006, Kshetri, N. ,2013) . The accessibility of convenient payment option and
delivery choices may influence customers' choice to buy from a site or not (Melián Alzola, L.,
et.al. 2010). Earlier studies have focussed on how consumer is influenced by different payment
and delivery options in online retail (Koyuncu, C., et. al. 2004, Mascha, M. F., et.al. 2011).
Generally, two major problems that are prevalent in online retail are poor payment facilities and
unpredictable logistics (Molla, A., et.al., 2005, Odedra-Straub, et. al., 2003). Online retail
companies in India have identified these problems and worked out solution to provide better
customer experience by providing some unique features with respect to payment option on their
website to attract customers. Online retail companies in India are providing different payment
option like payment through credit cards, debit cards, internet banking, mobile wallet and cash on
delivery. Pay on order is attractive because it provide convenience to the customer but still payment
on delivery is widely used by Indian consumer. Payment on delivery is widely used by consumers
who are between 26-35 and more than 45 (A.T.Kearney-Google Study, 2016). Pay on delivery
mode is acting like boon to E commerce industry. It is adding new consumer on regular basis.

282
Payment on delivery will give a boost to Ecommerce industry and bring new customer to online
shopping as it enables to process more orders (Chiejina & Soremekun, 2014). Though payment on
delivery attracts new customers but it also adds additional cost to the company. Payment on
delivery burdens online retailer more than pay on order (Mangiaracina et.al. 2009). Therefore,
some crucial questions emerge in the mind of the retailer. How do different payment options
impacts consumer behaviour? What are the various factors which influences consumer decision
to choose particular payment options? Does reputation of Ecommerce website or reputation of a
seller affect payment preference of a customer? Thus, purpose of this study is to find answers to
these questions and to explore antecedents of different payment option in online retail. This study
will also identify factors impacting different payment option in online retail.
Theoretical Background and Hypothesis
Theory of Planned Behaviour
Theory of Planned Behaviour (TPB) was an extension of Theory of reasoned action (TRA). TPB
explains behaviours over which individuals have inadequate voluntary control (Azjen, 1985).
Intention is supposed to be impacted by Attitude toward a behaviour and subjective norm about
engaging in behaviour. Attitude reflects an individual’s feelings towards performing behaviour. A
person’s overall attitudes toward using a new technology or procedure play a vital role in
determining as to whether or not he/she will ultimately use the system (Davis, 1993). Subjective
norms basically refer to perceived social pressure from other persons (e.g., family, friends, peers,
etc.) on whether or not to perform specific behaviour. Friends, family etc. opinions about online
shopping and different payment choices will influence online shopping behaviour of an individual.
Also reviews of product by others will impact decision of choosing between the various payment
option of an individual. TPB also includes perceived behaviour control over engaging in
behaviours that suggests human behavioural decision-making is impacted by the consumer’s
ability to perform certain behaviour. The ability to shop online and to chose between different
payment option will be impacted by accessibility of Internet, credit card ownership, availability of
cash etc.
Hypothesis 1: Ecommerce website having both payment option payment on order and payment
on delivery will be more trusted by the consumer over Ecommerce website having only payment
on order facility.
Hypothesis 2a: Customer shopping online for the first time will prefer to make payment on
delivery over payment on order
Hypothesis 2b: Consumer shopping online frequently will prefer to make payment on order
over payment on delivery.
Hypothesis 3: Customer perceiving risk in transaction will prefer to make payment after delivery
over payment on order.
Hypothesis 4: Consumer preferring convenience will prefer to make payment while placing the
order over payment after delivery.

283
Hypothesis 5: Customer fear of delayed product delivery or not getting it delivered/losing, it in
transit will prefer to make payment after delivery over payment on order.
Hypothesis 6: Customer will prefer to pay on order over payment on delivery if Ecommerce
website has good and easy return policy.
Hypothesis 7: Customer attracted towards cash back and loyalty addition more and wants better
deal will prefer to make payment on order over payment on delivery.
Moderator
Good experience of online purchase: In our above discussion, we have found that customer
perceived various types of risk while making online purchase. And customer perceiving risk will
prefer to make payment on delivery over payment on order. But, if customer is having good
experience while making online purchase will weaken the relationship with payment on order. If,
consumer shopping online are happy and satisfied with the product will shift their payment choice
from payment on delivery to payment on order. Hence, we can propose following Hypothesis
Hypothesis 8: Customer having good experience while making purchase online will shift from
payment on delivery to payment on order.
Demographic Factors
There are certain demographic factors like age, gender and income which will play very important
role in deciding the payment choices. As per joint study conducted by Google and A.T. Kearney
conducted in 2016, Customers in age groups 26-35 and 36-45 years show 1.5 times more
preference for cashless payment modes relative to age groups 18-25 and 45+ years. When it comes
to gender, women purchases are more influenced by social media advertisement as compared to
men. As per joint study conducted by Google and A.T. Kearney conducted in 2016, it was also
found that current women buyers have
higher preference for COD payments as
compared to men especially for low ticket
items like fresh food and groceries. So, we
can say that gender also act as moderator in
deciding payment various payment options.
It was also found in joint study conducted by
google and A.t. Kearney conducted in 2016
that people having low income will prefer to
make payment while delivery over payment
on order. They almost prefer two and half
times more for cash on delivery as compared
to higher income segment people. Hence,
demographic factors like age, gender and
income act as an moderator in deciding
various payment option.

284
Proposed Methodology
Study will be conducted in two parts. In first part, qualitative study will be conducted to get insights
of different payment option of consumers. These insights will help in developing measure to
collect responses on the variables discussed above. In second part of the study survey will be
conducted using questionnaire developed based on qualitative study to test the hypothesis.
Conclusion
In India payment on delivery is used by most of the consumer which incurs cost to the online
retailer. Payment on delivery burdens online retailer more than pay on order (Mangiaracina et.al,
2009). Therefore this study will help online retailer to understand why consumer are preferring
payment on order over payment on delivery or vice versa. The various antecedent of different
payment option which have been explored in the study are low cost, convenience, perceived risk,
trust, easy and good return policy, strong and fast delivery of the product, frequency of the
purchase impacts decision of various payment option used in online retail. As companies incurs
different cost on different payment option companies can improve their delivery system and
develop good and easy return policy which will help them to reduce their cost of selling. Also both
payment options help to build trust in the mind of the consumers towards online shopping. To
further reduce cost of sale, company need to further work on good and easy return policy, strong
delivery system which will help in developing trust in consumers towards online shopping.
References
Ajzen, I. (1985). From intentions to actions: A theory of planned behavior. J. Kuhl, & J. Beckman
(Eds.), Action-control: From cognition to behavior (pp. 11-39). Heidelberg: Springer.
ASSOCHAM–Resurgent India study (2017), http://www.assocham.org/newsdetail.php?id=6130
A.T. Kearney-Google study based on GFK consumer survey (2016), Digital Retail in 2020:
Rewriting the rules.
Chiejina, C., & Olamide, S. E. (2014). Investigating the Significance of the 'Pay on Delivery
'Option in the Emerging Prosperity of the Nigerian e-commerce sector. Journal of Marketing and
Management, 5(1), 120.
Davis, F. D. (1993). User acceptance of information technology: system characteristics, user
perceptions and behavioral impacts. International journal of man-machine studies, 38(3), 475-487.
Gavish, B., & Tucci, C. L. (2006). Fraudulent auctions on the Internet. Electronic Commerce
Research, 6(2), 127-140.
Kshetri, N. (2013). Cybercrime and cyber-security issues associated with China: some economic
and institutional considerations. Electronic Commerce Research, 13(1), 41-69.
Mangiaracina, R., & Perego, A. (2009). Payment systems in the B2c eCommerce: Are they a
barrier for the online customer?. Journal of Internet Banking and Commerce, 14(3), 1.
Figure: Conceptual Model

285
Mascha, M. F., Miller, C. L., & Janvrin, D. J. (2011). The effect of encryption on Internet purchase
intent in multiple vendor and product risk settings. Electronic Commerce Research, 11(4), 401-
419.
Melián Alzola, L., & Padrón Robaina, V. (2010). The impact of pre-sale and post-sale factors on
online purchasing satisfaction: a survey. International Journal of Quality & Reliability
Management, 27(2), 121-137.
Molla, A., & Licker, P. S. (2005). Ecommerce adoption in developing countries: a model and
instrument. Information & management, 42(6), 877-899.
Toyin, O. & Damilola O. (2012). Abandonment factors affecting e-commerce transactions in
Nigeria. Int J Comput Appl, 46(23), 41-47
Xiao, B., & Benbasat, I. (2011). Product-related deception in e-commerce: a theoretical
perspective. Mis Quarterly, 35(1), 169-196.

286
Cozying up to the Kardashians: A Theory for Consumers' Affinity towards Celebrity Gossip
Jayant Nasa, Tanuka Ghoshal & Rajagopal Raghunathan
Indian School of Business, Hyderabad & McCombs School of Business, UT Austin
In this paper, we investigate the underlying psychological mechanism for Indians’ huge
fascination with celebrities (which will be applicable, more generally, for consumers in all high
power distance belief cultures - comprising of most emerging market countries). We hypothesize
that, under identity threat, consumers’ interest increases in personal lives of celebrities, thereby
making them more willing to consume celebrity gossip articles versus non-gossip news articles.
We propose that this increased propensity to read celebrity gossip is due to the innate human desire
to affiliate with powerful people, which is heightened when an individual’s sense of self is
threatened, and is moderated by an individuals’ trait self-esteem as well. Since celebrities are
perceived to be more powerful than the general public, particularly in high power distance belief
(PDB) cultures (e.g. India), thus we expect this effect to be stronger here than in low PDB cultures
(e.g. USA).

287
Scarcity Promotions Customers’ Negative Experiential Journey
Harikrishnan.P.K & Prem P Dewani
IIM Lucknow
Firm measures the effectiveness of a scarcity promotion in terms of units sold. Often
customer-aggression to win the promotions, adds credibility to their marketing tactic
and neglects the negative experiential journey of the customer. Above negligence is a
small gain at the cost of big gains. This study conceptualises the customers’ negative
experiential journey: underlying causal mechanism, their response strategies and
recommendations for firms to inhibit aggression.
‘Big Billion Day’, a scarcity promotion by an Indian online retailer was done with an intent to
create a race to win customers. Although the firm hit the target of $100m in 10hrs against the
targeted 10 day slot, there was 78% negative customer sentiment (Dalal & Verma, 2014). This
78% negative sentiment towards the perpetrator translated in to a positive customer sentiment of
82% and 74% for the next biggest rivals. Hence, current one billion was achieved at the cost of
many future billions. In UK, bargain hunting turns frenzy during ‘Boxing Days’ and incidents of
violence, threats and abuse are on the rise (Gunter, 2015). In Us, ‘Black Friday’ violence is
becoming scary and has reported incidents of shooting, leading to death as shoppers flock to stores
(Helmore, 2016). Hence, the Big Billion Day in India, Boxing Day in UK and Black Friday in US
are pointing to the negative experiential journey during scarcity promotions, which is poorly
researched and weakly conceptualised.
In order to enhance the experiential journey of the customer, academic researchers are framing
concepts on customer engagement ecosystem (Maslowska, Malthouse, & Collinger, 2016),
customer life time value and so on. In similar vein, industry practitioners are creating a culture of
‘Customer Xperience and Xellence- CXX’, where the employees’ performance and rewards are
linked to customer delight. Marketers are trying to enhance value through induced scarcity. But
the unseen side of the experiential journey of the customer looks scary especially during scarcity
promotions. Hence, this research aims at discovering ‘Black Box’ and unwinding the experiential
journey of customers’ emotional crash. The research also explores the causal linkages, response
strategies the customers adopt and recommendations for firms during scarcity promotions.
Scarcity promotions are made with the sole objective to win customers. The firms evaluate the
effectiveness of the promotions in terms of the level of competitive orientation generated
translating in to sales. A detailed literature review revealed that firms rarely appraise the dark side
of scarcity promotions and is neglected as an object of research (Zarantonello, Romani, Grappi, &
Bagozzi, 2016). Previous studies ratify the generation of negative emotions during scarcity
promotions and evidence higher level of negative emotions in ‘Limited Quantity Scarcity’ than in
‘Limited Time Scarcity’ (Kristofferson, McFerran, Morales, & Dahl, 2016). The extant research
failed to identify the causal mechanism behind negative emotions and the response strategies
customers adopt during scarcity promotions. Since, quantity scarcity is causing more damage to
customers and firms, this study will focus on quantity based scarcity promotions (QBSP).
In view of the customers’ negative experiential journey, the following research questions will be
addressed through the research: i) What is the causal mechanism behind customer-aggression in
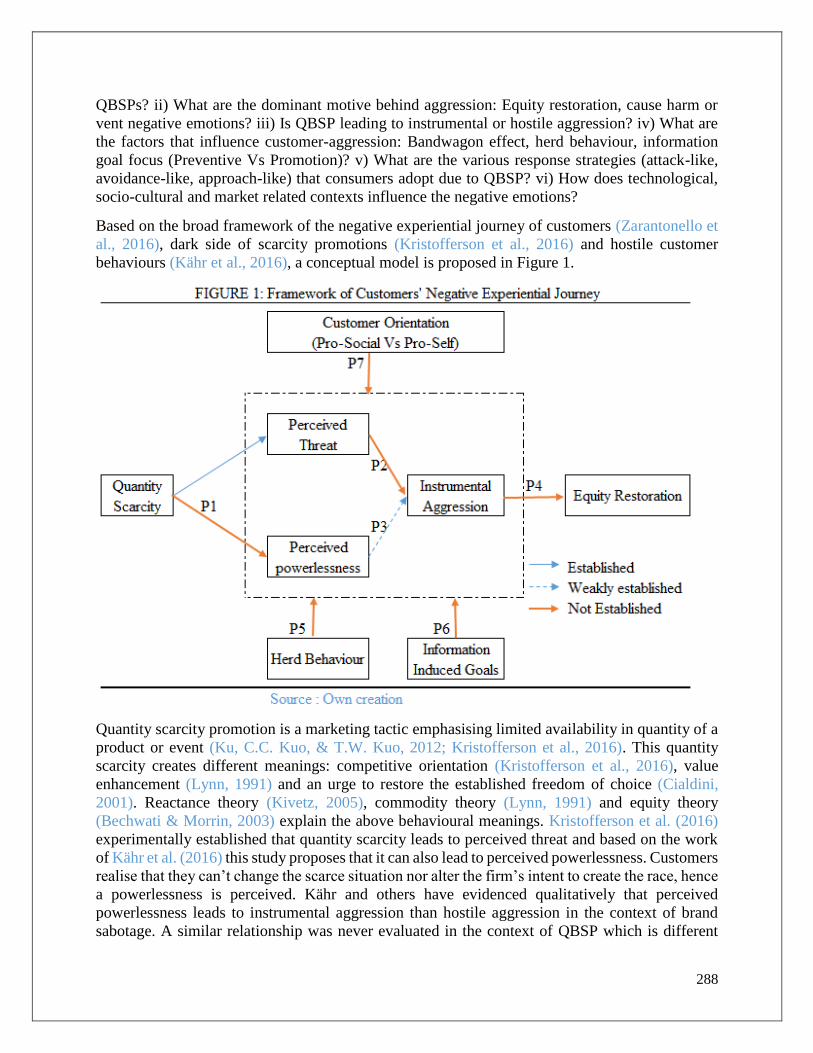
288
QBSPs? ii) What are the dominant motive behind aggression: Equity restoration, cause harm or
vent negative emotions? iii) Is QBSP leading to instrumental or hostile aggression? iv) What are
the factors that influence customer-aggression: Bandwagon effect, herd behaviour, information
goal focus (Preventive Vs Promotion)? v) What are the various response strategies (attack-like,
avoidance-like, approach-like) that consumers adopt due to QBSP? vi) How does technological,
socio-cultural and market related contexts influence the negative emotions?
Based on the broad framework of the negative experiential journey of customers (Zarantonello et
al., 2016), dark side of scarcity promotions (Kristofferson et al., 2016) and hostile customer
behaviours (Kähr et al., 2016), a conceptual model is proposed in Figure 1.
Quantity scarcity promotion is a marketing tactic emphasising limited availability in quantity of a
product or event (Ku, C.C. Kuo, & T.W. Kuo, 2012; Kristofferson et al., 2016). This quantity
scarcity creates different meanings: competitive orientation (Kristofferson et al., 2016), value
enhancement (Lynn, 1991) and an urge to restore the established freedom of choice (Cialdini,
2001). Reactance theory (Kivetz, 2005), commodity theory (Lynn, 1991) and equity theory
(Bechwati & Morrin, 2003) explain the above behavioural meanings. Kristofferson et al. (2016)
experimentally established that quantity scarcity leads to perceived threat and based on the work
of Kähr et al. (2016) this study proposes that it can also lead to perceived powerlessness. Customers
realise that they can’t change the scarce situation nor alter the firm’s intent to create the race, hence
a powerlessness is perceived. Kähr and others have evidenced qualitatively that perceived
powerlessness leads to instrumental aggression than hostile aggression in the context of brand
sabotage. A similar relationship was never evaluated in the context of QBSP which is different

289
from brand sabotage. Drawing on the work of Anderson & Bushman (2002), Antonetti (2016),
Bechwati and Morrin (2003), Inman, Peter, & Raghubir (1997), Kähr et al. (2016), Rook (2006)
and Roux, Goldsmith, & Bonezzi (2015) the following propositions are made.
P1: Quantity scarce promotions creates a cognitive feeling of perceived powerlessness.
P2: Perceived threat felt due to limited availability in quantity generates instrumental aggression.
P3. Perceived powerlessness felt due to limited availability in quantity generates instrumental
aggression
P4: Customers use aggression as an instrument to restore their lost equity.
P5: Herd behaviour affects the customers’ quest to aggress for restoring equity.
P6: Customers’ information goal orientation (prevention vs promotion) influences the rumination
of aggression.
P7: Pro-social vs pro-self orientation of the individual impact the rumination of aggression.
The above concept will be studied through blended research with a paradigm focusing on
epistemology, ontology and methodology (Sobh & Perry, 2006). Through the epistemological lens
of equity theory and reactance theory, the researcher connects with the reality. This mixed method
study with a pragmatic approach doesn’t align with a single ontological view (Creswell, Clark,
Gutmann, & Hanson , 2003) and will be using deductive and abductive inquiries (Harrison &
Reilly, 2011). Above propositions will be tested deductively to uncover the phenomenon using the
best set of explanations. Methods include in-depth interviews, focus group discussion and design
of experiments. The framework will be tested in the context of mobile phone users due to its high
impact for QBSP. Data analysis will be done through the emergent codes, themes and using
appropriate statistical tools. Data reporting will be done considering the needs of multiple audience
comprising of researchers and industry practitioners.
Theoretical and managerial implications: This work contributes to theory by i) reaffirming that
negative emotions during scarcity promotions shouldn’t be neglected as an object of research, ii)
providing a conceptual framework of customers’ negative experiential journey, iii) identifying the
possible equity restoration strategies adopted by the customer and iv) recommending suitable
tactics to firms for preventing an outrage. For practitioners this research is an eye opener as only
extreme negative experiential journey comes up in the vicinity of the firms. Customers suppress
their emotions as they are i) incapable of using empowered technology to refute, ii) choosing
avoidance-like strategies, iii) widespread but isolated, creating islands of negative experiential
journey preventing a group formation.
In majority of the negative situations an acknowledgement of responsibility, apology and ensuring
interactive justice through polite communication (Bechwati & Morrin, 2003) reduces the emotions.
When firm opens a way for equity restoration through apology the customers reciprocate with
‘return in kind’ attitude and ‘return the favour’ creating an elastic response (Grégoire, Tripp, &
Legoux, 2009). Explanations clarifying the reasons for mismanagement and downward social
comparisons (situations for other customers are worse than yours) are strategies to inhibit
aggression (Antonetti, 2016). In sum, along with the promotion leaflet created for communicating
the offer an equal number of explanation leaflets for acknowledging and apologising towards the
negative experiential journey is required. Such an explanation leaflet benefit the firm in two ways.
290
First, it reduces customers’ inner aggression and minimises the loss in terms of customer life time
value. Secondly, an apology for a negative incident implies that the promotion was widely
subscribed and enhancing firms credibility.
To conclude, preliminary qualitative discussions reaffirmed the richness of the model, gave
insightful pointers to unwind the causal mechanism and diverse customer response strategies for
equity restoration emerged.
----------------------------------------------Thank You!----------------------------------------------------
REFERENCES:
Anderson, C. A., & Bushman, B. J. (2002). Human aggression. Annual review of psychology, 53.
Antonetti, P. (2016). Consumer anger: a label in search of meaning. European Journal of
Marketing, 50(9/10), 1602-1628.
Bechwati, N. N., & Morrin, M. (2003). Outraged consumers: Getting even at the expense of getting
a good deal. Journal of Consumer Psychology, 13(4), 440-453.
Bechwati, N. N., & Morrin, M. (2003). Outraged consumers: Getting even at the expense of getting
a good deal. Journal of Consumer Psychology, 13(4), 440-453.
Cialdini, R. B., & Rhoads, K. V. (2001). Human behavior and the marketplace. Marketing
Research, 13(3), 8.
Creswell, J. W., Plano Clark, V. L., Gutmann, M. L., & Hanson, W. E. (2003). Advanced mixed
methods research designs. Handbook of mixed methods in social and behavioral research, 209,
240.
Dalal, M. & Verma, S. (2014, October 07). Flipkart apologizes to customers for Big Billion Day
sale glitches. Livemint. Retrieved from http://www.livemint.com.
Grégoire, Y., Tripp, T. M., & Legoux, R. (2009). When customer love turns into lasting hate: The
effects of relationship strength and time on customer revenge and avoidance. Journal of
Marketing, 73(6), 18-32.
Gunter, J. (2015, December 26). Millions of shoppers hit Britain's high street as retailers slash
prices. The Guardian. Retrieved from https://www.theguardian.com.
Harrison, R. L., & Reilly, T. M. (2011). Mixed methods designs in marketing research. Qualitative
Market Research: An International Journal, 14(1), 7-26.
Helmore, E. (2016, November 25). New Jersey mall shooting leaves one dead as shoppers flock
to stores. The Guardian. Retrieved from https://www.theguardian.com.
Inman, J. J., Peter, A. C., & Raghubir, P. (1997). Framing the deal: The role of restrictions in
accentuating deal value. Journal of Consumer Research, 24(1), 68-79.
Kähr, A., Nyffenegger, B., Krohmer, H., & Hoyer, W. D. (2016). When hostile consumers wreak
havoc on your brand: The phenomenon of consumer brand sabotage. Journal of marketing, 80(3),
25-41.

291
Kivetz, R. (2005). Promotion reactance: The role of effort-reward congruity. Journal of consumer
research, 31(4), 725-736.
Kristofferson, K., McFerran, B., Morales, A. C., & Dahl, D. W. (2016). The Dark Side of Scarcity
Promotions: How Exposure to Limited-Quantity Promotions Can Induce Aggression. Journal of
Consumer Research, 43(5), 683-706.
Ku, H. H., Kuo, C. C., & Kuo, T. W. (2012). The effect of scarcity on the purchase intentions of
prevention and promotion motivated consumers. Psychology & Marketing, 29(8), 541-548.
Lynn, M. (1991). Scarcity effects on value: A quantitative review of the commodity theory
literature. Psychology & Marketing, 8(1), 43-57.
Maslowska, E., Malthouse, E. C., & Collinger, T. (2016). The customer engagement
ecosystem. Journal of Marketing Management, 32(5-6), 469-501.
Rook, L. (2006). An economic psychological approach to herd behavior. Journal of Economic
Issues, 40(1), 75-95.

292
Role of Social media marketing in Indian Business Retail: Current Research and Implications
Gursimranjit Singh, Priyanka Singh & Maninder Singh
Indian Institute of Management, Udaipur; Amritsar College of Engineering & Technology,
Amritsar; IKG Punjab Technical University
Keywords: Social Media, trust, purchase intention, attitude, e-loyalty, privacy, e-wom
Introduction
Social media plays a very significant role in social commerce (Hajli, 2014) and is associated to
online communities and social networking sites (SNSs) (Lu and Hsiao, 2010). Social media is
generally combination of web-based technologies to create highly interactive platforms through
which customers can communicate, contribute, re-create, discuss, and tweak User-Generated
content. In recent times trust can be backed by social commerce by increasing social interactions
of consumers, which enhances trust (Hajli et al., 2014). Therefore, trust is a significant point in
social media context. In a very short duration, marketers all around the globe are using social media
for a variety of marketing objectives including advertising, building loyalty, innovation, product
development, customer relationship management, branding etc (eMarketer, 2013), but privacy
concern on consumers’ responses to social media cannot be neglected as advertisements on social
media are positively related to ad effectiveness (Trampe, Stapel, Siero, and Mulder, 2010). In light
of this there is lots of anecdotal proof that highly concretize messages increase privacy concern,
but only a few researchers have attempted to figure out the privacy concern in social media context
(Zhu and Chang, 2016).
Theoretical Background
The advent of Web 2.0 has led to a paradigm shift in the usage of various SNSs by the consumers
and has influenced the way the customers used to interact through them by creating and sharing
content across various SNSs such as twitter, facebook, Instagram, blogs etc., thereby becoming the
most influential channel of marketing communication i.e. word of mouth (Anderson, 2008;
Kietzmann et al., 2011). Past literature has revealed a significant interaction between trust and the
privacy issues. There is an increasing concern for the privacy of the information disclosed by the
users across various SNSs now-a-days. The privacy of consumers is considered to be under threat
because of sharing and disclosing of too much information. When people identify breach of
privacy by unlawful people or loss of control of their personal information, privacy concern is
triggered (Debatin, Lovejoy, Horn, and Hughes, 2009; Gross and Acquisti 2005). A plethora of
research has emphasized on the usage of social media to build brand loyalty and hence propound
that organizations active on social media have a growing ability to tailor their customer interfaces
and provide them with services which enhance customer retention. Furthermore, Srinivasan et al.
(2002) identified the key precursors of e-loyalty vis-à-vis customization, interactivity, choice,
community and character.

293
Conceptual Framework
Research Methodology
The present study uses the data collected through a well-structured questionnaire. The existing
scales were adapted from literature to measure the proposed constructs. A total of 600
questionnaires were filled out, however, only 492 questionnaires could be used for the final
analysis, thereby fetching a response rate of 82 per cent. The scale items were refined using item
analysis and statistical reliabilities of scales were ascertained by computing Cronbach α (Nunnally, 1978).
Confirmatory factor analysis (CFA) was used to access the validity of the scale. Further, the proposed
relationships were tested using Structural Equation Modeling (SEM).
Results and Discussion
The findings support the conceptual framework and hence, this provides a strong case for
examining the role played by social media in influencing the consumer brand purchase behavior
by delineating the theoretical relationships between the proposed constructs. The proposed
relationships tested using Structural Equation Modeling (SEM) suggest an acceptable fit between
the sample data and the hypothetical model. The goodness-of-fit measures were greater than 0.90
and the Root Mean Square Error of Approximation i.e. RMSEA was again less than 0.8. All the
proposed hypothesis were supported which implies that social media has a significant impact on
the consumer brand purchase behavior. The advancements in technology has brought a
phenomenal increase in usage of social media through platforms like smart phones, tablets, smart
watches, smart TV etc to share, co-create, discuss, and modify user-generated content. Consumers
who are sensitively attached to the brand have stronger urge for purchase intention through social
Social Media
User
Generated
Content
Firm
Generated
Content
Trust
E-Loyalty
Privacy
Purchase
Intention
E-WOM
Attitude

294
media. The results revealed that there was a significant impact of both user generated content as
well as firm created content on the consumer behavioral outcomes.
Limitations of the Study
One of the major limitations of the present study is that it is conducted only in Punjab region. The
findings of the present study cannot be as such generalized. Future research may examine the
proposed conceptual framework across regions also so as to generalize the findings. Secondly,
future studies may identify the intervening variables that may influence the relationships examined
in the present study. For instance, the direct effect of other variables such as risk, fun, enjoyment
and moderating role of demographics can be examined in the upcoming studies.
References
Anderson, T. (Ed.). (2008). The theory and practice of online learning. Athabasca University
Press.
Chaudhuri, A., & Holbrook, M. B. (2001). The chain of effects from brand trust and brand
affect to brand performance: the role of brand loyalty. Journal of marketing, 65(2), 81-93.
Debatin, B., Lovejoy, J. P., Horn, A. K., & Hughes, B. N. (2009). Facebook and online privacy:
Attitudes, behaviors, and unintended consequences. Journal of Computer‐Mediated
Communication, 15(1), 83-108.
Gross, R., & Acquisti, A. (2005, November). Information revelation and privacy in online
social networks. In Proceedings of the 2005 ACM workshop on Privacy in the electronic
society (pp. 71-80). ACM.
Hajli, M. N. (2014). A study of the impact of social media on consumers. International Journal
of Market Research, 56(3), 387-404.
Hajli, N., Lin, X., Featherman, M. S., & Wang, Y. (2014). Social word of mouth: How trust
develops in the market.
Kietzmann, J. H., Hermkens, K., McCarthy, I. P., & Silvestre, B. S. (2011). Social media? Get
serious! Understanding the functional building blocks of social media. Business
horizons, 54(3), 241-251.
Lu, H. P., & Hsiao, K. L. (2010). The influence of extro/introversion on the intention to pay
for social networking sites. Information & Management, 47(3), 150-157.
Srinivasan, S. S., Anderson, R., & Ponnavolu, K. (2002). Customer loyalty in e-commerce: an
exploration of its antecedents and consequences. Journal of retailing, 78(1), 41-50.

295
Trampe, D., Stapel, D. A., Siero, F. W., & Mulder, H. (2010). Beauty as a tool: The effect of
model attractiveness, product relevance, and elaboration likelihood on advertising
effectiveness. Psychology & Marketing, 27(12), 1101-1121.
White, G. L., Shah, J. R., Cook, J. R., & Mendez, F. (2008). Relationship between information
privacy concerns and computer self-efficacy. International Journal of Technology and Human
Interaction (IJTHI), 4(2), 52-82.
Zhu, D. H., Chang, Y. P., Luo, J. J., & Li, X. (2014). Understanding the adoption of location-
based recommendation agents among active users of social networking sites. Information
Processing & Management, 50(5), 675-682.

296
Handling Student Depression in Indian College Campuses:
Paromita Goswami, Anindita Chaudhuri & Himadri Roy Chaudhuri
Shiv Nadar University; University of Calcutta; International Management Institute, Kolkata
Introduction
India has highest number of people living with depression on planet earth, and China is the
only country that scores above India in this regard (WHO, 2017). Given the 1.3 billion
strong Indian population, the number of people afflicted by depression is a mind-boggling
5 crore, with another 3 crore affected by anxiety disorder (WHO, 2017). Not surprisingly,
depression was India's tenth-biggest cause of early deaths in 2015 (Global Burden of
Disease Study as quoted by Jain, 2017). Attempt to suicide has been known to be one of
the effects of depression, and till 2016 it was deemed a criminal offense. Nearly half the
people with suicidal tendencies have mental health challenges; and in 2012, India had over
258,000 suicides (Bekedam, 2016).
As recently as 27th March 2017, suicide has been decriminalized by the Mental Health Care
Act, 2017. Not surprisingly, there was no Govt. program for mental health promotion, or
suicide prevention till 2014 (WHO, 2014). The existing health care infrastructure to cater
to those suffering from depression is also totally inadequate. The abysmal state of affairs
is reflected in the available health-care professionals. With 0.3 psychiatrist, .07 social
worker, 0.07 psychologist, 0.12 nurses per lakh population in India (WHO, 2014), there is
no way to effectively handle the disease. Suggested figures for these categories are in the
range of 1-2, 1.5-4, 2-4, 1-4 respectively (NIMHANS, 2016). In effect, there is a whopping
77% national deficit of psychiatrists in India (NIMHANS, 2016). Given the abysmal
condition of allopathic medical facilities, WHO representative in India, Henk Bekedam
(2016) ponders whether AYUSH (Ayurveda, Yoga, Unnani, Siddha, Homoepathy)
Ministry can play an important role in prevention of depression through yoga and holistic
practices?
Student Depression and Suicide
The latest National Crime Records Bureau (NCRB) statistics pertaining to 2015 show that
every hour one student commits suicide in India. In the year 2015 the number of student
suicides stood at 8934, while for the five-year period up to 2015 the figure stood at 39,775
(Saha, 2017). It is pertinent to mention here that since suicide was a criminal offense during
this time-period, the number of attempted suicides that went unreported are likely to be far
higher. A recent paper published in the Asian Journal of Psychiatry studied depression
among students in Indian universities, and found that 37, 13 and 2.4 per cent of students
suffer from moderate, severe to extremely severe depression (Deb et al 2017 as quoted by
Kunju, 2017). What are Indian universities doing to cope with this situation?
Unfortunately, almost nothing. Most non-residential college campuses do not have even a
social-worker or counsellor available to talk to students who are going through depressive
episodes. Even in residential colleges and universities, where students do not have access
to family support during depressive periods, there is no well thought-out system to handle
the situation. Some campuses do have qualified counsellors, but in the absence of
campaigns to handle the stigma related to mental health, many students do not opt to

297
approach these facilities. Sometimes students do not even realize that they are suffering
from depression. Often the symptoms that make them withdraw from friends, miss classes,
or resort to substance abuse, is deemed to be plain ‘lazy’ or being the wayward ‘drug-
addict’, furthering the cycle of torturous pain.
How can Social Marketing help?
Social Marketing (SM) is the application of commercial marketing principles for social
good. In the context of increasing cases of student suicides and depression in India, the
question we ask in this proposal is whether SM may be used to design campus-specific
campaigns to minimize stigma around mental health, generate awareness about the
symptoms of depression, or encourage those suffering in silence to reach out for help?
The objective of this paper is to lay out the plan to conduct formative research that would
help design a SM campaign in a residential university campus located far away from urban
area. The research questions are:
1. Are the students aware of depressive symptoms? 2. Is there stigma attached to acknowledging that a person is suffering from depression, both
from (a) those that are depressed, and (b) those that know students who are depressed? 3. What stops a student from seeking help if resources are available within campus? 4. How far in the university administration and student services department (SSD) sensitized to
mental health challenges/issues faced by the students?
Keeping this in mind, the following research agenda is being proposed:
For item 1(a) above, we will use General Health Questionnaire for screening and Beck
Depression Inventory for assessing depressive symptoms in the target group (Beck et al,
1961; Goldber and Hiller, 1979). The scale shall be administered by SSD or a group of
MBA students as a part of their class project, and will be a graded component of their
course-work. For item 2(a), we will approach the key student informants, or student
opinion leaders in academic programs to identify those that are currently suffering from
depression. They will initially be sensitized to the symptoms and asked to identify students
who seem to be depressed and not seeking help. Next, one-on-one depth interviews will be
conducted with a convenience sample of depressed students to identify barriers is seeking
medical help [(item 2 (a) and 3 above]. For item 2(b), a judgmental sample of around ten
students fairly representing different academic programs, in terms of student proportion,
shall be depth-interviewed. For item 4, key administrators as well as SSD staff shall be
depth-interviewed. For this purpose, a judgmental sample size of five-six respondents shall
be used.
Path Ahead
Based on the results of formative research, we will design a SM campaign targeting
students and/or administration of a residential university campus in the semester beginning
on 24th July 2017. We will also draw inspiration from interventions like the student-led
Active Minds program in USA, as well as the success stories presented at the 2017
Conference on Depression on College Campuses held at Depression Centre of Michigan

298
Medicine, to finally design an appropriate intervention. This intervention may then be used
as a sample prototype for other similar campuses in India.
References
Beck A.T., Ward C. H., Mendelso M., Mock, J., Erbaugh J. (1961), ‘An Inventory for measuring
depression, Archives of General Psychiatry’, 4, 561-571.
Bekedam H. (2016), ‘The Importance of Psychological First-aid’,
http://www.searo.who.int/india/about/who_representative/wr_oped_mental_h
ealth_hbl_161016.pdf?ua=1 , last accessed on 20th April 2017
Goldber D.P and Hiller V.E (1979), ‘A scaled version of the General Health Questionnaire.
Psychological medicine’, 9, 1369-146.
Jain (2017), ‘Depression and mental health: How India can stop these silent deaths’,
http://www.dailyo.in/politics/mental-health-bill-modi-government-depression-
who/story/1/16641.html ,
Kunju S.S. (2017), ‘Study finds 37 per cent university students in India suffer moderate
depression’, http://www.ndtv.com/education/world-health-day-2017-study-finds-
37-per-cent-university-students-in-india-suffer-moderate-depressio-1679142
NIMHANS (2016), ‘2015-16 National Mental Health Survey of India: Mental Health Systems’, http://www.nimhans.ac.in/sites/default/files/u197/NMHS%20Report%20%28Mental%20Health%20Syst
ems%29%201.pdf , last accessed on 20th April 2017
Saha D. (2017), ‘Every hour, one student commits suicide in India,’ http://www.hindustantimes.com/health-and-fitness/every-hour-one-student-commits-suicide-in-
india/story-7UFFhSs6h1HNgrNO60FZ2O.html , last accessed
WHO (2014), India: Mental Health Atlas Country Profile 2014,
http://www.who.int/mental_health/evidence/atlas/profiles-2014/ind.pdf?ua=1 , last accessed on 20th
April 2017
WHO (2017), ‘Depression and Other Common. Mental Disorders: Global Health Estimates’,
http://apps.who.int/…/1…/254610/1/WHO-MSD-MER-2017.2-eng.pdf, last accessed on 20th April
2017

299
Role of Anthropomorphization on Pro-Social Behavior: Exploring Moderating Effect of Need
for Cognition
Archit Vinod Tapar, Ashish Sadh, Aditya Billore & Abhishek Mishra
Indian Institute of Management Indore
One of the vital parts of social marketing in communicating social causes is public service
advertisement (Andreasen, 2006). According to Bagozzi and Moore (1994), these public service
advertisements are either addressed to the people who are in need of help, or are targeted to make
people help others. In the latter type, it has been observed that people are often hesitant to comply
with the advertisement of public services aimed at a social cause, as it requires contributing their
time, effort, or money. For public service advertisements to be successful that may bring about a
change in people’s behavior, it is necessary that the advertisements are perceived to be unusual
from others (Sciulli & Bebko, 2006).
Marketers have been using anthropomorphism, meaning attributing human like characters
to non-human entity, as a part of their communication (Aggarwal & McGill, 2007). Delbaere,
McQuarrie, and Phillips, 2011 found that anthropomorphization in advertisements elicits
emotions, attributions, and greater liking. Ahn, Kim, and Aggarwal (2014) have argued that
anthropomorphizing social causes enhances the compliance by providing intrinsic motivation for
individuals to act. However, the study was restricted with only the positive representation of
anthropomorphization. Also, the extant literature in marketing deals with only positive effects of
anthropomorphization. Nevertheless, examining effects of negative type of anthropomorphic
representation remains largely untapped. The present study is based emphasizes on the negative
representation of anthropomorphization precisely because (a) consumers’ pay keen attention to
any negative information and is found to alter their attitude (Pulling et al. 2006); and (b) the effect
of negative event was found to be more detrimental in case of anthropomorphism on consumers’
in forming impressions (Puzakova et al. 2013). The present study considers the role of need for
cognition as it affects consumers’ inference, especially the one that is of negative type (Zhang &
Buda, 1999).
The present study proposes to examine the effect of persuasive ads with anthropomorphic
(positive vs. negative) entities on individuals’ pro social behavior. Furthermore, the study would
explore the role of need for cognition (high vs. low) in tandem with anthropomorphic
representation on effectiveness of persuasive ads. In following section, we theorize the hypotheses
relevant to the present study followed by a proposed research methodology to test the hypotheses.
Towards the end potential contributions and limitations of the study are discussed.
CONCEPTUAL BACKGROUND
Anthropomorphism:
“Anthropomorphism refers to imbuing the imagined or real behavior of nonhuman agents with
humanlike characteristics, motivations, intentions, and emotions” (Epley, Waytz, & Cacioppo,
2007, p.864). Anthropomorphism has been studied in various contexts in the literature including
religious, animals, and gadgets (Aggarwal & McGill, 2007). The seminal works of Epley et al.

300
(2007) in social psychology gave a foundation for studies in the area of anthropomorphization,
which gave a three-factor theory for why and when people anthropomorphize. Following
Aggarwal & McGill’s (2007) study, adoption of the concept in marketing saw a shift from why
and when to how anthropomorphization affects the behavior and judgments of the consumers.
Anthropomorphism and Pro-social Behavior:
Public service advertisements of social causes are believed to trigger emotional appeals such as
fear, disgust, anger, concern, surprise, and sadness to comply with pro-social behavior (Sciulli &
Bebko, 2006). Anthropomorphization in ads is found to elicit emotions, attitude towards ad, and
liking (Delbaere et al. 2011). Tom, Lee, and Chao (2013) found that the compliance to
conservation behavior could be augmented with the help of anthropomorphizing the nature. As
stated earlier, anthropomorphizing social causes boosts the compliance by providing intrinsic
motivation for individuals to act. Also, the effects of negative event was found to be more
detrimental in case of anthropomorphism on individuals’ (Puzakova et al., 2013). Zhang & Buda
(1999) found that negatively framed messages have stronger effects as compared positively framed
messages. In line with the findings from the extant literature and mentioned arguments, we
hypothesize
H1: Compliance for the pro-social behavior would be higher in case of negative anthropomorphic
representation of ads.
Need for Cognition on Pro-social Behavior:
Need for cognition (NFC) is primarily a motivational variable proposed by Cacioppo & Petty
(1984) in order to capture the differences in individuals’ processing of information in persuasive
settings. Further, this difference in individuals affects the way they persuade advertisements
(Zhang & Buda, 1999). Based on the elaboration likelihood model (ELM) by Cacioppo & Petty
(1984), it is argued that individuals’ with high NFC are likely to process information about a
product meticulously, engage in further elaboration and counter arguments whereas, consumers’
with low NFC are less likely to rely on heuristics in forming their judgments. NFC is primarily
relevant in the present study as it forms one of the key determinants that affect anthropomorphism
(Epley et al., 2007), which in turn would have an impact on pro-social behavior (H1). Epley et al.
(2007) reasoned high need for cognition and seeking more information to have weaker effects on
anthropomorphization. Also, it was identified low need for cognition is more prone to getting
influenced by negative as compared to positive message frames (Zhang & Buda 1999) of
anthropomorphism in advertisements. Thus, with the help of the support of the above arguments
we hypothesis:
H2: Individual’s with low NFC are highly influenced by negative representation
anthropomorphization to comply with pro social behavior as compared to positive representations.
PROPOSED METHODOLOGY
With an objective to establish causation, the present study involves experimental research
design to identify the causal relation between anthropomorphic representations in the
advertisement (independent variable) and pro-social behavior (outcome variable).
Anthropomorphization is hypothesized to cause an effect on the outcome variable and would be

301
manipulated using human schemas or human like visual elements along with short description in
first person to examine its impact on the outcome variable. Need for cognition would be captured
with the help of 18-item scale provided by Cacioppo Petty & Kao (1984).
Treatment: The study would involve following treatment with anthropomorphic image
(Positive/Negative) of ad with need for cognition (low/high) and response to pro-social behavior:
EXPECTED CONTRIBUTIONS
The present study shall offer theoretical and empirical explanation for the underlying
process involving positive and negative impact of anthropomorphization on compliance to pro
social behavior. The study would also contribute to deepen the understanding of need for cognition
and examining its moderating effect on anthropomorphization in social causes ads. The current
study would help practitioners to use anthropomorphization in public service advertisements that
in turn will enhance the efficacy of pro-social behavior through ads.
In conclusion, the proposed study has threefold learning outcomes: (1) it would be helpful
in advancing the knowledge of anthropomorphization by exploring the notion in marketing
research; (2) it will enhance understanding of anthropomorphism and need for cognition
framework by examining its outcome on compliance of consumers’ pro-social behavior and (3)
for practitioners, the study is expected to help in enhancing the effectiveness of public service
advertisements for social cause by with either positive or negative representation of
anthropomorphization.
REFERENCES:
Aggarwal, P., & McGill, A. L. (2007). Is that car smiling at me? Schema congruity as a basis for
evaluating anthropomorphized products. Journal of Consumer Research, 34(4), 468-479.
Ahn, H. K., Kim, H. J., & Aggarwal, P. (2014). Helping fellow beings anthropomorphized social
causes and the role of anticipatory guilt. Psychological Science, 25(1), 224-229.
Andreasen, A. R. (Ed.). (2006). Social marketing in the 21st century. Sage Publications.
Bagozzi, R. P., & Moore, D. J. (1994). Public service advertisements: Emotions and empathy guide
prosocial behavior. Journal of Marketing, 58(1) 56-70.
Cacioppo, J. T., Petty, R. E., & Feng Kao, C. (1984). The efficient assessment of need for
cognition. Journal of personality assessment, 48(3), 306-307.
Delbaere, M., McQuarrie, E. and Phillips, B. J. 2011. Personification in advertising: Using a visual
metaphor to trigger anthropomorphism. Journal of Advertising, 40(1), 121-130
Epley, N., Waytz, A., & Cacioppo, J. T. (2007). On seeing human: a three-factor theory of
anthropomorphism. Psychological review, 114(4), 864-886.
Klein, J., & Dawar, N. (2004). Corporate social responsibility and consumers' attributions and
brand evaluations in a product–harm crisis. International Journal of research in Marketing,
21(3), 203-217.

302
Pulling, C., Netemeyer, R. G., & Biswas, A. (2006). Attitude basis, certainty, and challenge
alignment: A case of negative brand publicity. Journal of the Academy of Marketing Science,
34(4), 528-542.
Puzakova, M., Kwak, H., & Rocereto, J. F. (2009). Pushing the envelope of brand and personality:
antecedents and moderators of anthropomorphized brands. Advances in Consumer Research,
36, 413-420.
Sciulli, L. M., & Bebko, C. (2006). Social cause versus profit oriented advertisements: An analysis
of information content and emotional appeals. Journal of Promotion Management, 11(2-3),
17-36.
Zhang, Y., & Buda, R. (1999). Moderating effects of need for cognition on responses to positively
versus negatively framed advertising messages. Journal of Advertising, 28(2), 1-15.

303
Emergence of rural periodic markets in subsistence economies: An exploratory study
Satyam & Rajesh K. Aithal
Jindal Global Business School; Indian Institute of management, Lucknow
Introduction and research objectives
The research interest in the area of the bottom of the pyramid (BOP) or subsistence markets has
gained momentum in the last decade following the seminal work by Prahalad (2005). A systematic
review of BOP literature reveals that there are limited micro-level studies investigating pre-
existing marketplaces. In particular, there is minimal research on rural periodic markets in
emerging economies despite having significant market size. Most of the literature on the base of
the pyramid (BOP) markets focuses on product, distribution, and internationalization strategies
tailored to consumers and organizations in these markets (Kolk et al., 2013; London et al., 2010).
Periodic markets, a little-known phenomenon in marketing literature, act as the nerve center of
growth in rural areas across emerging markets. The aim of the paper is to investigate the emergence
of periodic markets, as well as the subsequent outcomes of the periodic market formation.
The periodic market is an informal marketplace which consists of small unincorporated businesses
started by individuals or households primarily to generate survival income and simultaneously
cater to the needs of poor for whom institutional support is absent or scarcely available
(Velayudhan, 2007). According to one estimate, there are more than 47000 periodic markets in
rural India. The periodic market is an example of subsistence marketplace, i.e., intensely personal,
social and relational environment (Viswanathan et al., 2010), and activities in subsistence
marketplaces are largely guided by informal institutions (London & Hart, 2004).
Methodology
A qualitative case study research design was adopted since case studies allow current issues in
complex environments to be investigated. This approach was chosen to reduce researcher biases
and to increase the chance to build empirically valid theories (Eisenhardt, 1989), as case research
methodology is considered better for new situations where little is known about the phenomenon
and current literature seems inadequate (Yin, 2013). We analyze two case studies of rural periodic
markets from the capital city of North India which have been there for more than two decades.
Data were collected through semi-structured interviews, observations, and secondary research.
Purposive sampling was employed in the selection of the participants. Our research focuses on the
insights from the interaction of subsistence buyer-sellers (rural sellers with household income less
than $2 per day) in rural periodic markets. We have examined marketplace interactions at micro-
level and adopted a bottom-up orientation for developing recommendations for marketers and
public policy.
Results and Implications of the study
The rural periodic markets are dynamic entities, and they evolve depending on the needs of the
buyers and sellers participating in them, the nature of competitive forces, and the external
environment. Periodic markets are located near other central places such as religious places,
administrative offices, and socio-cultural institutions to minimize the efforts, expenses, and
inconvenience in travel. Periodic markets as commercial institutions perform utility functions,

304
exchange functions, and institutional functions. The function is basically to provide a wide range
of goods and services to the population of the surrounding areas.
Findings of this research are expected to help subsistence consumer-merchants prosper and can be
helpful in framing the policy for periodic markets which aim to look beyond economic value
creation. This paper has made an attempt to improve the understanding of rural periodic markets
and associated issues of infrastructure, information, etc. Some of the barriers to access to formal
institutions have also been brought out. Implications for businesses which are interested in having
access to rural periodic markets are also brought out.
References
Eisenhardt, K. M. 1989. Building theories from case study research, Academy of Management
Review, vol. 14 no. 4, pp. 532-550.
Kolk, A., Rivera-Santos, M., & Rufín, C. 2014. Reviewing a decade of research on the
base/bottom of the pyramid (BOP) concept, Business & Society, vol. 53 no. 3, pp. 338-377.
London, T., Anupindi, R., & Sheth, S. 2010. Creating mutual value: Lessons learned from
ventures serving base of the pyramid producers, Journal of Business Research, vol. 63 no. 6, pp.
582–594.
London, T., & Hart, S. L. 2004. Reinventing strategies for emerging markets: beyond the
transnational model, Journal of International Business Studies, vol. 35 no. 5, pp. 350-
370.
Prahalad, C. K. 2005. The fortune at the bottom of the pyramid. Upper Saddle River, NJ:
Wharton School Publishing.
Velayudhan, Sanal K. 2007. Rural marketing: targeting the non-urban consumer, New Delhi:
Response Books
Viswanathan, M., Rosa, J. A., & Ruth, J. A. 2010. Exchanges in Marketing Systems: The Case
of Subsistence Consumer–Merchants in Chennai, India, Journal of Marketing, vol. 74 no. 3, pp.
1–17.
Yin, R. K. 2013. Case study research: Design and methods, Thousand Oaks, CA: SAGE.

305
Effect of intra-household heterogeneity and communal consumption on household demand
Vedha Ponnappan, Avadhoot Jathar, Srinivas Prakhya
Indian Institute of Management Bangalore
Family consumption is characterized by the need to accommodate the preferences of multiple
members as well as the economies arising out of joint consumption. In this paper, we study these
two aspects of household demand by contrasting the demand of the multi member households
(MMH) against that of the single member households (SMH). We show that the intra-household
heterogeneity in preferences of MMH results in multiple discrete continuous (MDC) demand in
addition to other drivers such as variety seeking or consumption heterogeneity that may be driving
SMH’s MDC purchase. We also propose that the savings arising from economies of scale from
the shared consumption of public goods, enable MMH to purchase higher quality and multiple
brands of the inside goods.
Behavioral Patterns of Family consumption
Family level joint consumption has many key features that differentiate it from individual level
consumption: (1) The revealed family preference is generally composed of individual member
level preferences, which may be distinct from each other in varying degree. (2) Consumption
decision maker(s) may be altruistic or egoistic in his/her disposition towards other family
members. Thus, the family income may be commonly pooled, or individually used based on a host
of factors. (3) Within family consumption may display a communal pattern of joint consumption
and sharing, resulting in economies of scale. This is dependent on the nature of the products
consumed. Market goods may be consumed in private (as exclusive or assignable goods) or jointly
as (non-assignable or public goods) or processed further.
“Private” goods are those that are consumed individually and non-jointly which can be exclusively
tracked or assigned to the consuming individual. They are characterized by an exclusion restriction
property, i.e., the fact that a brand pack is consumed by one member excludes any other member
from consuming the same. We classify all goods bought by households that are “private” in
consumption nature into a “Private Goods” category. These are goods on which little or no
economies of scale arise. When different members of the household have different preferences
with respect to private goods, the shopping decision maker in the household may act altruistically
to satisfy member’s preferences or impose her preference on others. Prior studies (Becker, 1991;
Aribarg, Arora, and Bodur, 2002) provide evidence to the presence of altruism, caring,
benevolence, sacrifice and most importantly, sharing in family consumptions. Following their lead,
we propose that multi member households behave in an altruistic fashion with respect to the day-
to-day consumption of CPG product categories, to provide for the family member’s preferences
and hence more often purchase multiple brands in the same trip as compared to single member
households.
“Public” goods are those whose consumption by one member does not impact the supply available
for the other member (e.g. house rent, air freshener, light bulbs, household cleaners etc.). The
presence of public goods in the family consumption basket releases more income to be spent on
both private and public goods alike. For instance, a couple living together need to spend on house

306
rent only once compared to the amount to be expended separately were they living alone
individually, and hence may have more in their kitty to spend. Therefore, one would expect the
economies of scale to ease the budget constraint, induce a positive income effect and a negative
substitution effect on the demand for private good if it is considered a “necessity”. On the other
hand, if the focal product is not considered as a “necessity” by the multi-member household, the
members may prefer to spend the extra amount arising out of economies of scale on other products
that are preferred resulting in a per capita demand pattern that is not significantly different from
that of a single member household. In this paper, we explore the household’s behavior by
comparing across households of different size to analyze household’s degree of necessity for the
focal product.
Insights from data
We use a dataset granted by the Nielson Company subscribed from the Kilts Center (University of
Chicago) for the year 2013 and choose yogurt as the inside product category. Along with this focal
inside category, we group the purchase basket of the household into a composite “private goods”
category and “public goods” category. The purchase pattern of the focal category of yogurt shows
that larger households buy more quantities and many brands in a trip. The larger households also
spend higher per unit price on yogurt signifying that they are buying relatively expensive higher
quality brands. There are two contrasting forces that impact the purchases of households. The per
capita income of MMH is lower than that of SMH, implying that they are under greater constraint
than SMH. On the other hand, they gain economies of scale by sharing public goods. Whether
living together brings in more constraint or relaxes constraint is dependent on whether the gains
brought in by economies of scope is sufficient to make up the reduced per-capita income in MMHs.
We analyze the effect of these forces in the empirical analysis.
The Model
We use a direct utility based structural model to capture household’s spending across the inside
category, the private goods category and the outside public goods category in each shopping trip.
We assume that these three categories are weakly separable and are independent, but the brands
within the inside good category are imperfect substitutes among themselves. Following Allenby,
Kim and Rossi (2017), and Bhat (2008), we model the per capita utility of a household member to
arise from the quantities purchased of the inside good, composite quantities of private and public
goods using an additive, translated and log structure. We scale the quantities purchased of inside
good and private goods using household size to capture the effect of per capita consumption. We
capture the diminishing utility by using a log function on the quantities purchased and the corner
solution with a translated structure. The non-linear log form on outside good ensures that the
budget constraint impacts the marginal utilities of the inside and private goods under the adding
up constraint. We incorporate heterogeneity in household preferences by making the baseline
preference parameters for the inside good, private and public good and the satiation parameters of
the inside good to vary by household. We use Kuhn Tucker conditions to solve the constrained
utility maximization problem that gives a closed form solution under the assumption of extreme
value errors. We estimate the model using Bayesian Markov Chain Monte Carlo (MCMC)

307
methods and Random Walk algorithm and use a hierarchical structure to estimate household level
type parameters.
Results
Our results suggest that MMHs have stronger preferences for various brands as compared to SMHs
(Figure 1). This is especially so for higher priced brands such as Chobani, Yoplait, Dannon etc. in
relation to Store brand. The preference for the private goods bundle is much stronger compared to
the brands in the Inside good which is also reflected in the purchase patterns of the households.
However, the MMHs seem to enjoy higher preference for the inside good category with respect to
private goods category as compared to SMH.
Figure 1 – Baseline Preferences for Brands and
Private goods
Figure 2: Satiation for Inside Good (Yogurt)
across different household sizes
The satiation cum translation parameter estimates increase as the household size increases,
suggesting that MMHs purchase more brand variants of inside good as compared to the SMHs
(Figure 2). This is possible due to the income effect brought in by the public goods for the MMHs.
The shadow prices of SMH, arising from the money spent on public good and derived from the
utility structure, is higher than that of MMH, which in effect increases the “savings” enjoyed by
the MMHs. These results indicate that MMHs do enjoy savings arising out of sharing of public
goods that enables MMHs to enjoy higher priced brands and more variety.
Discussion
Results from our proposed altruistic model indicate the possibility of intra-household
heterogeneity and sharing of public goods as the driving factor for multiple discrete continuous
choices, observed commonly in certain product categories. Our key contribution is in categorizing
the household’s shopping basket based on the nature of consumption, that highlights the savings
arising from the shared consumptions in a household. The structural nature of our model gives
household level parameter estimates for the baseline preferences and satiation, that can be used to

308
perform the counterfactual analysis. Particularly, manufacturers and retailers who have even the
basic information of the demographic profiles of their customers such as household size, and
overall purchase pattern across categories, can easily evaluate the importance of the focal category
with respect to the overall purchase bundle and the effect of savings enjoyed by the households
from their purchase of public goods.
Key References
Allenby, G. M., Kim, J., & Rossi, P. E. (2017). Economic models of choice. In Handbook of
Marketing Decision Models (pp. 199-222). Springer, Cham.
Arora, N., & Allenby, G. M. (1999). Measuring the influence of individual preference structures
in group decision making. Journal of Marketing Research, 476-487.
Bhat, C. R. (2008). The multiple discrete-continuous extreme value (MDCEV) model: role of
utility function parameters, identification considerations, and model
extensions. Transportation Research Part B: Methodological, 42(3), 274-303.
Becker, G. S. (1991). A Treatise on the Family, enl. ed. Cambridge, Mass: Harvard.

309
A Simple Procedure to Correct for Measurement Error in Two-Group Mean Comparison
Studies
Srinivas Durvasula, Subhash Sharma & Manoj Malhotra
Marquette University; University of South Carolina; Western Reserve University
Marketing and its sister disciplines such as management, human resources, operations
management, and management information systems continue to publish papers where researchers
use rating scales to measure variables of interest (e.g., consumer ethnocentrism, service quality,
ad involvement) and compare mean differences on those variables between demographic groups
(e.g., gender, industry type). We performed a content analysis of such studies published in various
top-tier journals and found that when the comparison is between two groups, then t-test is
invariably the analytic of choice. Very few studies employed structural equation modeling (SEM),
despite exhortations from methodologists that SEM is a superior technique as it accounts for
measurement error – error that occurs when latent variables are measured with rating scales.
Given the sparing application of SEM in mean comparison studies in the marketing
discipline, Durvasula, Sharma, and Carter (2012) proposed a way to correct the t-statistic and
cohen’s d – the effect size estimate – for measurement error. At the same time, in the applied
psychology discipline, Sharma, Durvasula, and Ployhart (2012) illustrated some scenarios where
effect size estimates can be significantly under-estimated in the presence of measurement error,
and showed how the corrected cohen’s d is comparable to the effect size estimate obtained by
using SEM. We extend this stream of research by offering an alternative method that researchers
may find even easier to apply when they compare two-group mean differences. Our proposed
method is rooted in the concept for attenuation correction for correlations that Nunnally and
Bernstein (1994) have recommended.
In this paper, we first present a simple method that corrects for measurement error when
computing the t-statistic and cohen’s d. Next, we illustrate its application using both contrived data
and published data. In both applications, we find the corrected estimate of Cohen’s d to be
comparable to the effect size estimate obtained from SEM. Finally, we explain the implications of
our study’s results for scholars who intend to compare two-group mean comparisons.
References
Durvasula, S., Sharma, S., & Carter, K. (2012). Correcting the t statistic for measurement error.
Marketing Letters, 23, 671-682.
Nunnally, J.C., Bernstein, I.H. (1994). Psychometric Theory (3rd ed.), New York: McGraw-Hill.
Sharma, S., Durvasula, S., & Ployhart, R.E. (2012). The Analysis of Mean Differences Using
Mean and Covariance Structure Analysis. Organizational Research Methods, 15 (1), 75-
102.
Steenkamp, J.E.M., & Baumgartner, H. (1998). Assessing measurement invariance in cross-
national consumer research. Journal of Consumer Research, 25 (1), 78-90.

310
Changing the Power Equation: A Structural Analysis of the Impact of Used Cars on the
Automobile Distribution
Dinakar Jayarajan , S. Siddarth & Jorge Silva-Risso
IIT Stuart School of Business, Chicago, University of Southern California
Automobile manufacturers in the US (e.g., Toyota) are represented by a set of dealers in a local
market, each of whom exclusively sells the models offered by that manufacturer (e.g., Camry,
Corolla). However, in addition to selling the new versions of these products, most new car dealers
also sell used cars from the same physical location, with their inventory often including makes and
models made by competing manufacturers. Because durable products have a usable life of many
years, and used versions are potential substitutes for new ones, it is interesting to understand the
demand and supply side consequences of the competition between these versions. Interestingly,
the used cars sold by these dealers are relatively good substitutes for new cars.
For example, in the data that we analyze, only 36% of used cars traded-in to a dealer are four years
old or younger, while accounting for about 71% of the used cars sold by dealers. Similarly, vehicles
1 with less than 50,000 miles on the odometer account for about only 39% of the cars traded-in to
dealers but for about 73% of the used cars sold by them. In other words, dealers appear to retain
the best used cars that they receive for sale through their dealerships, and thus maximize the
potential for cannibalization.
The supply side consequences of new-used demand substitution for manufacturers have interested
economists and marketers for some time. Some of the literature argues that competition with the
used version allows the manufacturer to price discriminate among consumers and charge higher
prices for the new version (Hendel & Lizzeri, 1999). Other work suggests that the cannibalization
of new product sales by used cars is a net negative effect (Liebowitz, 1982). However, previous
research has not studied the implications of new-used competition on the strategic interaction
between the manufacturer and dealer, which is the central focus of our work. Our research seeks
to make the following three contributions to the literature.
First, we develop and estimate a model of consumer demand for both new and used vehicles that
accounts for product characteristics, consumer heterogeneity and price endogeneity. While the
theoretical literature on this topic envisages different levels of substitutability between new and
used products, there has been relatively little empirical research on this topic. The proposed
research enables us to quantify substitutability between new and used cars and provide insights
into the nature of competition between these versions. Second, we develop and estimate alternative
full equilibrium supply models to identify how these demand linkages impact the pricing decisions
of the dealer and the manufacturer. Specifically, we examine two alternative dealer pricing
scenarios. In the first scenario (separate), the dealer sets new and used car prices, ignoring the
substitutability between the two, in effect treating his new and used car businesses as separate
entities. In the second scenario (joint), the dealer accounts for the substitutability between new and
used cars and chooses prices that maximize the combined profits from both categories. We
compare the implied margins and profits from both scenarios to understand how the dealer pricing
strategy affects the profits and margins of manufacturer and dealer 2 Finally, recognizing that
manufacturers have a lot more control over the pricing and promotion strategies of cars sold on

311
dealer lots, while dealers are similarly placed with respect to used cars, we examine the impact of
the used car market on total channel profit and how this is shared by the two entities. Specifically,
we use the change in new car profits accruing to manufacturers and dealers under the two scenarios
to identify the shift in channel power brought about by the ability to sell used cars.
Overview of Results
On the demand side, we find that new car prices have a higher impact on used car sales than vice
versa. On the supply side, we find that margins for manufacturers and dealers and total channel
profits increase under the joint pricing strategy. The most surprising result is that the all of the
incremental channel profits from the joint strategy, as well as some additional profit, accrue to the
dealer. Thus, the ability to sell used cars and the accompanying pricing flexibility enables shifts
power in the distribution channel from manufacturers to dealers.
References
Hendel, I., & Lizzeri, A. (1999). Interfering with secondary markets. The Rand Journal of
Economics, 1–21.
Liebowitz, S. (1982). Durability, market structure, and new-used goods models. The American
Economic Review, 72(4), 816–824. 3

312
The Multidimensional Nature of Social Environment and its Impact on Customer Shopping
Experience and Impulse Buying
Priyanka Singh , Maninder Singh & Gursimranjit Singh
IKG Punjab Technical University; Indian Institute of Management, Udaipur; Amritsar College
of Engineering & Technology, Amritsar
Keywords: Customer shopping experience, retail crowding, social environment, impulse
buying, customer interactions
Introduction
A growing prevalence of impulse buying in the present market place has led to an increased
academic research on this phenomenon. Now-a-days, shopping has turned out to be a stimulation
which reinforces the refreshment and amusement among Bolton et al. (2014) advocated that the
use of sensory stimuli provokes a favourable behavioural response and influences the behavioural
outcome of the customers. This highlights the role of various cues the customers get from the retail
environment that shape their shopping experience. The paper is divided into four sections. Firstly,
the theoretical background is discussed. Secondly, the conceptual framework is discussed followed
by research design. Thirdly, the key findings of the study are explained. The paper concludes with
managerial implications and issues for future research.
Theoretical Background
A plethora of research has shown that the retail social environment plays a significant role in
shaping customer shopping experiences (Eroglu et al., 2005; Sands, Harper and Ferraro, 2011;
Singh and Soch, 2015; Turley and Milliman, 2000). Despite this solid backdrop, additional
research is required to gain an insight into the impact of social environment on customer shopping
experience, specifically in retailing context (Verhoef et al., 2009). Shopping with the reference
groups is an enduring trait and has a potential to influence the purchase behavior of the consumers.
Bagozzi (2000) asserted that there is a need to examine the interaction effect of customers acting
in groups to develop a better understanding of the interplay between social environment and
customer shopping experience. The staff interactions are considered to be the keystone of the retail
customer service experience. The interaction between the customer and the staff has a significant
impact on the customer’s mood and in turn leads to the varied behavioural outcomes by satisfying
their social and functional goals (Boye and Jones, 1997). Borges, Chebat and Babin (2010)
supported the notion that the presence of other customers is an important environmental stimulus
that impacts the behavioral outcomes of the customers. Similarly, the customers can also influence
the other customers experience by the roles that they assume (Verhoef et al., 2009).
In light of the foregoing discussion, it becomes necessary to examine the role played by the social
factors in determining the customer shopping experience and further how this chain of effects
influences impulse buying. Based on the review of literature, it is posited that social environment
is explained through staff interactions and customer to customer interactions. It is also advocated
that social environment and retail crowding have a significant impact on customer shopping
experience, which in turn exhibits a significant and positive impact on impulse buying.

313
Research Methodology
The present study uses the data collected through a well-structured questionnaire. A total of 300
questionnaires were filled out, however, only 276 questionnaires could be used for the final
analysis, thereby fetching a response rate of 92 per cent.
Results and Discussion
AMOS output yielded a Chi-square value (χ2) of 781.275 with 490 degrees of freedom. The
CMIN/DF i.e. the ratio between the minimum discrepancy divided by degrees of freedom was
1.594. This suggests an acceptable fit between the sample data and the hypothetical model. The
goodness-of-fit index (GFI) was .913 and adjusted goodness-of-fit index (AGFI) was reported as
.900. The comparative fir index i.e. CFI was .974, whereas the Tucker-Lewis index i.e. TLI was
.972. The Root Mean Square Error of Approximation i.e. RMSEA was .035, which is again less
than 0.8. The Bollen’s incremental fit index i.e. IFI was .982 while the Bentler-Bonett normed fit
index i.e. NFI was .934. The standardized parameter estimates for the proposed model as well as
the direct effects showed that there was a significant and positive impact of social environment
and retail crowding on customer shopping experience (βSE = 0.474; βRC = 0.160; p< 0.001). It was
also found that customer shopping experience had a positive and significant impact on impulse
buying (βCSE = 0.680; p < 0.001).
Conclusion
The findings revealed that social environment and retail crowding were found to have significant
impact on the customer shopping experience. This implies that the customers who visit a mall have
a strong association with the environment in which they are shopping. Both staff and customer
interactions were found to have a significant and a positive impact on the customer shopping
experience. A significant relationship between retail crowding and customer shopping experience
implies that customers do not prefer to shop in a retail format where there is large human crowding.
The findings also demonstrated that customer shopping experience has a significant impact on the
impulse buying behavior.
Managerial Implications
The study is a unique contribution as it provides a framework for retailers for decision making
with respect to the key drivers of customer shopping experience and also posits the chain of effects
from the various antecedents to the impulse buying. For marketers, it will help promoting such
atmospherics for it will add to the flavour what their consumer want and finally consumer will
have better shopping experiences, thereby providing a strong case for impulse buying behavior.
Issues for Future Research
It has been seen that the culture has a significant impact on the consumer buying behavior. Future
studies could examine the impact of culture on the shopping experience of the customers which in
turn derives their buying behavior. Besides the relationships tested in the current study, there might

314
be some other variables that have an intervening impact on the proposed model. For instance, the
moderating effects of gender, age, income should be tested. The advancement in technology has
led to an increased usage of social media in influencing the way customers shop at the retail
formats. It could be interesting to study the interaction effect of social media with these antecedents
to examine if the usage of social media while shopping influences the behavioural outcomes of the
customers.
References
Rook, D. W. 1987. The buying impulse. The Journal of Consumer Research, 14(2): 189–199.
N. Bolton, R., Gustafsson, A., McColl-Kennedy, J., J. Sirianni, N., & K. Tse, D. (2014). Small
details that make big differences: a radical approach to consumption experience as a firm's
differentiating strategy. Journal of Service Management, 25(2), 253-274.
Singh, P., & Soch, H. (2015). Examining Mediating Effects of Customer Shopping Experience
on the Relationship between Antecedents of In-Store Experience and Impulse Buying-A
Theoretical Framework. International Proceedings of Economics Development and Research,
85, 39.
Eroglu, S. A., Machleit, K., & Barr, T. F. (2005). Perceived retail crowding and shopping
satisfaction: the role of shopping values. Journal of business research, 58(8), 1146-1153.
Sands, S., Harper, E., & Ferraro, C. (2011). Customer-to-noncustomer interactions: Extending
the ‘social’dimension of the store environment. Journal of Retailing and Consumer
Services, 18(5), 438-447.
Turley, L. W., & Milliman, R. E. (2000). Atmospheric effects on shopping behavior: a review
of the experimental evidence. Journal of Business Research, 49(2), 193-211.
Verhoef, P. C., Lemon, K. N., Parasuraman, A., Roggeveen, A., Tsiros, M., & Schlesinger, L.
A. (2009). Customer experience creation: Determinants, dynamics and management
strategies. Journal of retailing, 85(1), 31-41.
Bagozzi, R. P. (2000). On the concept of intentional social action in consumer
behavior. Journal of Consumer Research, 27(3), 388-396.
Borges, A., Chebat, J. C., & Babin, B. J. (2010). Does a companion always enhance the
shopping experience?. Journal of Retailing and Consumer Services, 17(4), 294-299.
Boye, M. W., & Jones, J. W. (1997). Organizational culture and employee counter
productivity. Antisocial behavior in organizations, 172-184.
Grewal, D., Levy, M., & Kumar, V. (2009). Customer shopping experience management in
retailing: An organizing framework. Journal of Retailing, 85(1), 1-14.

315
Social Environment
Appendix
Fig. 1 Conceptual Framework
Customer
Density
Customer
Interactions
Customer
Shopping
Experience
s
Staff
Interactions
Impulse
Buying
316
Forecasting Shopping Apps based Impulsive Buying Behavior among Shoppers Using Neural
Network Technique
Priyanka Gupta & Sanjeev Prashar
Indian Institute of Management Raipur
With the growing use of smartphone and subsequent rapid evolution of mobile application started
from traditional voice-based function to the multimedia exchange, shopping, gaming, social
networking change the way customer interact with a product and brand and acquire information.
The study aims to predict and identify the specific features of the mobile shopping apps that trigger
the impulse buying intention using neural network forecasting technique. The result of research
reflects that the proposed forecasting model has a prediction rate of 94.25%. In addition to that
proposed study also identifies the most important antecedents that influence the impulsiveness
among the shoppers. Out of six features of the mobile app, layout and user satisfaction has it has
maximum importance. Hence, the shopping app provider has to focus on these aspects.
Introduction
With 71% growth of mobile app market, India is one of the fastest growing markets in terms of
downloading and using apps (Statista, 2017). Nearly six billion apps were downloaded in 2016 as
against 3.5 billion in 2015 (Live Mint, 2017). The adaptation of the mobile app by the consumer
helps in adding value through its features that make them fit in their life. The previous studies on
mobile apps establishes the relation with personality traits (Xu et al., 2016), factors influencing
installation of mobile app (Harris, Brookshire, & Goyal, 2016), usage of mobile app (Kim, Yoon,
& Han, 2014), app adoption (Bellman et al., 2011), factors influencing continuous attachment to
app (Furner, Racherla, & Babb, 2014), and app usage recommendation (Xu, Peak, & Prybutok,
2015). Even The Technology Acceptance model (TAM) examine the satisfaction and purchase
intention of the app but it does not explain about the consequences of using app (Yang & Lin,
2013). Considerably, studies have not discussed the mobile app based impulse buying behavior
in the context of mobile-based shopping app using either Sequential Equation Modeling (SEM) or
Artificial Neural Network Technique (ANN). In this study, we are examining the six antecedents
of the technology adoption for getting sequential influence of the different feature of mobile app
on impulse buying. The literature will provide the brief introduction of the six mobile app features;
effort expectancy (Chang, Tsai, & Lin, 2012), price and discount (Hardesty & Bearden 2003),
atmosphere (Wells, Verhagen & Van Dolen, 2011), layout (Wu et al., (2013), user experience
(Wu, Kang, & Yang, 2015) and user satisfaction (Alnawas & Aburub 2016) which affect the
impulse buying intention leads to actual impulse buying.
Methodology
Based on the previous literature on mobile app and online consumer behavior, a list of influencing
features related to mobile app (effort expectancy, price and discount, layout, atmosphere, user
experience, and user satisfaction) has been identified which impacts impulse buying behavior.
Three scales, each with three items, from Venkatesh (2012) were used to assess performance
expectancy, effort expectancy and price and discount respectively. Similarly, to measure the

317
constructs – layout and atmospherics, four-item scale from Wu et al. (2013) was used. Four items
scale for measuring user experience was adopted from the study of Prashar et al. (2016). The scale
for construct user satisfaction was made up of four items that were adapted from Alnawas and
Aburub (2016). Out of twenty-six variables, 23 variables had been selected for the survey and
framed into statement. For the entire process of sample collection 297 data points had been
collected. For conducting the neural network analysis, the data set divided into two parts; training and
testing set. The training set used to identify the potential predictive relationship between the dependent and
independent variable and form a significant model.
Finding
The training set of predicted values 181 consumers like to buy impulsively using mobile app. Moreover,
the seven consumers don’t prefer buying impulsively using mobile app, so, the model has 90.8% overall
accuracy in prediction. Similarly, in the test set data, the seventy-eight consumers like to buy impulsively
and predicted correctly using mobile shopping app. The model accuracy using neural network technique is
94.3% shown in table 1.
Table 1: Classification matrix for training and test set
Sample Observed Predicted
No Yes Percent correct
Training No 7(TN) 17(FP) 29.2%
Yes 2(FN) 181(TP) 98.9%
Overall Percentage 4.3% 95.7% 90.8%
Testing No 4(TN) 3(FP) 57.1%
Yes 2(FN) 78(TP) 97.5%
Overall Percentage 6.9% 93.1% 94.3% *TN (True Negative), FP (False Positive), FN (False Negative), TP (True Positive)
In the retail setting, the ‘recall value’ also called ‘sensitivity’ explains all real true positive cases. The value
of the sensitivity is 97.5%, so this model showing a good ability to identify mobile app based impulse-
shopping behavior. The 66.66% negative predictive value determines that the there are many consumer
who forecasted as non-impulse buyer but they are actual impulse buyer.
Table 2 Neural network analyses: calculated indicators for test set
Indicators Calculation Percentage
Accuracy (TP+TN)/(TP+FP+FN+TN) (78+4)/(78+4+2+3) 94.25
Positive Predictive Value TP/(TP + FP) 78/(78+3) 96.29
Negative Predictive Value TN/(TN + FN) 4/(4+2) 66.66
Recall or Sensitivity TP/(TP + FN) 78/(78+2) 97.5
Specificity TN/(TN + FP) 4/(4+3) 57.14
The most significant variable among these entire variable is the user satisfaction regarding the mobile app
use followed by layout related to how the app has been design, how easily you get the product. On the other
hand the aggregate important variable is layout (product visibility, product arrangement, collection of
product, searching effort) with the contribution of around 23% in mobile app based impulse buying.

318
Table 3 Relative significance of variables
Variable Importance
Factor
Overall
Importance
Aggregate
Importance
This shopping app is highly Attractive .017 Atmosphere 1.68%
15.73
This shopping app is visibly light .079 Atmosphere 7.71%
This shopping app is highly Stimulating .065 Atmosphere 6.34%
Ease of use .095 User Experience 9.31%
22.35%
Portal with faster navigation .036 User Experience 3.55%
Privacy of personal information .018 User Experience 1.75%
Availability of personalized features .079 User Experience 7.74%
Discounts and promotional offers .062 Price and Discount 6.09%
13.28%
I use this app because I get more discount as compared to website .042 Price and Discount 4.08%
Shopping apps offer me more deals .032 Price and Discount 3.11%
Learning how to use this shopping app is easy for me. .037 Effort Expectancy 3.60%
10.46%
My interaction with this app is clear and understandable. .018 Effort Expectancy 1.76%
In my daily life this app saves time and effort .052 Effort Expectancy 5.10%
This shopping app has well organized layout .021 Layout 2.02%
23.02%
This shopping app has good display .102 Layout 10.00%
This shopping app has large collection .016 Layout 1.60%
This shopping app has helpful signage .096 Layout 9.40%
I am satisfied with my overall experience from shopping app .012 User Satisfaction 1.15%
12.96%
I am satisfied with the pre-purchase experience from using this shopping app .061 User Satisfaction 6.00%
I am satisfied with the purchase experience from using this shopping app .027 User Satisfaction 2.66%
I am satisfied with the post-purchase experience from using the shopping app .032 User Satisfaction 3.15%
Conclusion
The consumers who give importance to the in-store shopping environment expect the same for the online
shopping condition. If the features of the app match with the consumer expectation as per the in-store
shopping, then the consumer easily connects with the app and its products. The 94.25% accuracy rate
considered being good for predicting impulse buying behavior of consumer. The mobile app provider must
focus on the layout and the user satisfaction of the app along with the customize customer specific
promotional offers. The study will help the app provider to understand the basic antecedents of the app
which impact consumer unplanned buying intention and focus on that for increasing efficiency and profit.
Building a good brand image through effective management of the mobile app environmental variable will
force the consumer to buy impulsively, which increase consumer time and frequency of using the app.
Taking out the non-impulse purchaser from the study can help to forecast the future sales.

319
Reference
Alnawas, I. and Aburub, F., (2016), 'The effect of benefits generated from interacting with
branded mobile apps on consumer satisfaction and purchase intentions', Journal of Retailing
and Consumer Services, Vol. 31 No. 1, pp.313-322.
Bellman, S., Potter, R.F., Treleaven-Hassard, S., Robinson, J.A. and Varan, D., (2011), 'The
effectiveness of branded mobile phone apps', Journal of interactive Marketing, Vol. 25 No.4,
pp.191-200.
Chang, T.Y., Tsai, C.J. and Lin, J.H., (2012), 'A graphical-based password keystroke dynamic
authentication system for touch screen handheld mobile devices', Journal of Systems and
Software, Vol. 85 No.5, pp.1157-1165.
Furner, C.P., Racherla, P. and Babb, J.S., (2014), 'Mobile apps stickiness (MASS) and mobile
interactivity: a conceptual model', The Marketing Review, Vol.14 No.2, pp.163-188.
Hardesty, D.M. and Bearden, W.O., (2003), 'Consumer evaluations of different promotion
types and price presentations: the moderating role of promotional benefit level', Journal of
retailing, Vol.79 No.1, pp.17-25.
Harris, M.A., Brookshire, R. and Chin, A.G., (2016), 'Identifying factors influencing
consumers’ intent to install mobile applications', International Journal of Information
Management, Vol.36 No.3, pp.441-450.
Kim, S.C., Yoon, D. and Han, E.K., (2016), 'Antecedents of mobile apps usage among
smartphone users', Journal of marketing communications, Vol.22 No.6, pp.653-670.
Live Mint (2017), ‘India beats US in 2016 mobile apps market growth, sees most Google Play
downloads’, [online] http://www.livemint.com/Consumer/IXEa9lR07ZAx7yROaRcarK/India-beats-US-in-2016-mobile-app-market-growth-sees-most-G.html” (Assessed in 16 may 2017)
Statista, (2017), ‘Number of smartphone users in India from 2015 to 2021 (in millions)’,
[online] https://www.statista.com/statistics/467163/forecast-of-smartphone-users-in-india/
(Assessed on 16 May 2017)
Wells, J.D., Parboteeah, V. and Valacich, J.S., (2011), ‘Online impulse buying: understanding
the interplay between consumer impulsiveness and website quality’, Journal of the Association
for Information Systems, Vol.12 No.1, p.32.
Wu, L., Kang, M. and Yang, S.B., (1970), 'What makes users buy paid smartphone
applications? Examining app, personal, and social influences', The Journal of Internet Banking
and Commerce, Vol.20 No.1, pp.1-22.
Xu, C, D Peak, and V Prybutok. (2015). 'A Customer Value, Satisfaction, and Loyalty
Perspective of Mobile Application Recommendations', Decision Support Systems, Vol.79
No.1, pp.171–83. http://www.sciencedirect.com/science/article/pii/S016792361500161X.

320
Xu, Runhua, Remo Manuel Frey, Elgar Fleisch, and Alexander Ilic. (2016), 'Understanding
the Impact of Personality Traits on Mobile Apps Adoption--Insights from a Large-Scale Field
Study', Computers in Human Behavior, Vol.62 No.1, pp.244–56.
Yang, H.L. and Lin, C.L., (2014), ‘Why do people stick to Facebook web site? A value theory-
based view’, Information Technology & People, pp.27 Vol.1, pp.21-37.

321
Effects of online store layout on variety seeking behavior
Aishwarya Ramasundaram & Avinash Mulky
Indian Institute of Management, Bangalore
Internet shopping is often complex as shoppers cannot touch and feel the product (Elliot
and Fowell, 2000). In such situations, moods can often serve as heuristic information in shopping
tasks when complex decision making is involved (Kelley, 1972). Research has shown that positive
affect can lead to positive behavioural intentions in an internet shopping context and would also
reduce the chances of them withdrawing from a website. Previous studies have shown that positive
affect can be created by store atmosphere. Thus, store atmosphere created by website elements
(e.g. background colour, layout, etc) is an important concern for marketers. The paper addresses
the research question-what is influence of e-commerce site design on consumer behaviour? The
paper highlights the theoretical and managerial motivations for studying site design followed by a
review of literature. It finally proposes a theoretical framework on how the website design element
of layout can influence the consumer’s variety seeking behaviour by influencing the emotional
state of the consumer.
Some of the theoretical and managerial motivations which make this problem important and
relevant are given below.
ELM Model-According to the elaboration likelihood model (ELM) (Petty and Cacioppo,
1986), there are two routes to persuasion: the central and peripheral ones. The central
route requires effort to scrutinize attitude-relevant information while peripheral route looks
at contextual factors. Since there are several uncertainties in an online store-branding
uncertainty of the stores, performance uncertainty of the products, behavioural
uncertainty of the visitors, and environmental uncertainty of the stores (Sirgy Sirgy,
Grewal, Mangleburg, 2000), the consumer often resorts to heuristic cues to evaluate the
website. Thus, encouraging consumers to evaluate an online store by its environmental
elements, such as special layout design and atmosphere, is extremely important for online
retailers (Vrechopoulos, O’Keefe, Doukidis, & Siomkos, 2004; Eroglu, Machleit, & Davis,
2001).
Experiential value of hedonic consumption-According to Holbrook and Hirschman
(1982), a consumption experience can be intrinsically satisfying, or satisfying for its own
sake, when the experience provides pleasure to the senses, fun, feelings, and fantasies. A
well-designed website can thus contribute to an overall positive consumption experience
by delighting the consumer senses.
Listed below are some quotations from website developers and designers-
• “The design of a website is important because it affects how quickly visitors can find what
they are looking for. If it is difficult or frustrating, the visitor will leave and try on another
site – and that is a lost opportunity. A good design will be easy to understand and navigate,
helping potential customers find what they need and taking you one step closer to making
a sale or getting in touch.”

322
• A website’s design will make the site visitor decide whether to stay and take action or leave
– it’s as simple as that. It will need to create trust, make sense and allow people to find
what they need quickly and easily – while doing what you want them to do.”
-Sunrise Pro Websites
From the above, we see that it is important to scientifically study the phenomenon of design under
controlled environments to see which design works for your company.
The online store environment lacks some aspects present in a traditional retail store and
possessed other qualities. An online store environment consists of four components:(1) virtual
layout and design;(2) virtual atmospherics;(3) virtual theatrics; and (4) virtual social presence
(Manganari, Siomkos, & Vrechopoulos, 2009). E-tailing effectiveness has been found to depend
to a great extent on interface design (Burke, 2002). The present study examines the effects of the
first component (i.e. the virtual layout) on consumer behaviour.
S-O-R Framework
The paper builds on the Stimulus-organism-response framework developed by Mehrabian
and Russel (1974) according to which the Environmental stimuli(stimulus) influences consumers’
internal states(organism), which in turn influence consumers’ overall responses(response). The
consumers’ internal states act as a mediator between the stimulus and individuals’ responses. From
an environmental psychology perspective, the online environmental cues (in this study it will be
layout) serve as stimuli and influences the affective (and cognitive reactions) of online shoppers
through pleasure, arousal and dominance.
Layout theory
Layout design is defined as the arrangement of product information content and the images
on the websites. (Wu, Lee, Fu & Wang, 2013). In an online retail setting, store layout refers to the
underlying web site structure (Griffith, 2005). According to retailing theory, there are 3 types of
layout (Mason, Meyer and Ezell, 1991; Levy and Weitz, 1998, 2008)-grid, freeform and racetrack.
In the grid layout, shoppers navigate the online store through a hierarchical structure (i.e. product
category-> product subcategory -> end-product). Users use the forward-back tabs to visit product
categories. In the freeform layout, shoppers can reach their desired products at once, by utilizing
the multiple links provided at each search outcome web page of the store (e.g. either through the
use of a search engine or by selecting any of the items/options permanently displayed on every
page). Since grid and freeform layouts are the most commonly used layouts in e-commerce
(Vrechopoulos et al., 2004), we will look at only these two layouts in this study.
Variety seeking
Variety seeking behaviour refers to a choice that differs from its predecessor (McAlister,
Leigh, and Edgar Pessemier, 1982). It is the tendency of consumers to prefer varied bundles of
consumption (Simonson, 1990). Assortment has been shown to drive variety seeking positively
(Morales, Andrea, Kahn, McAliste and Broniarczyk, 2005). Maimaran and Wheeler (2008) find
that exposure to novel visual stimulus affects consumers' real choices among products.

323
Arousal Theory
Pleasure is “the degree to which a person feels good, joyful, or happy” (Mehrabian and
Russell, 1974) and arousal is “the degree to which a person feels excited, stimulated, alert or active
(Mehrabian and Russell, 1974).Some researchers have however proposed a two-dimensional view
on arousal. (Smith and Apter 1975; Henthorne, LaTour, & Nataraajan, 1993; Gorn,
Chattopadhyay,& Dahl, 1997) according to which, there are two dimensions of arousal: one
dimension of arousal goes from boredom to excitement, and is called excitement. The second
dimension of arousal goes from tension to relaxation, and is called as relaxation. Excitement is
preferred to boredom and relaxation is preferred to tension. It is possible to simultaneously
experience feelings from each of these dimensions. Pleasure, arousal, and dominance are the three
basic emotions that improve consumers' attitudes towards the stores (Porat et al., 2007).
Building on the above streams of literature a relationship between the two types of layout (freeform
vs grid) and variety seeking (within and across category) is established based on which the paper
comes up with the following theoretical framework and hypotheses-
Hypothesis 1: Freeform layout will generate a higher level of pleasure relative to grid layout
Hypothesis 2a: Shoppers using a grid layout will feel less aroused and be high on calmness relative
to those using a freeform layout.
Hypothesis 2b: Shoppers using a freeform layout will feel more aroused and be high on
excitement relative to those using a grid layout.
Hypothesis 2c: Shoppers using a freeform layout will feel more aroused and be high on excitement
relative to those using a grid layout. This will be more for
a) Shopper using laptops
b) Shoppers purchasing hedonic goods
c)Shoppers high on atmospheric responsiveness
324
Hypothesis 2d: Shoppers using a grid layout will feel less aroused and be high on calmness
relative to those using a grid layout. This will be more for
a) Shopper using mobile phone
b) Shoppers purchasing utilitarian goods
c) Shoppers low on atmospheric responsiveness
Hypothesis 3: Individuals who are more aroused (excited) will be more variety seeking than those
who are less aroused (calm).
Hypothesis 4a: Individuals who are more aroused (excited) will be more variety seeking across
categories than within categories.
Hypothesis 4b: Individuals who are less aroused (calm) will be more variety seeking within
categories than across categories.
Hypothesis 5: A freeform layout will induce higher variety seeking across categories compared
to a grid layout.
Hypothesis 6a: Grid layout would lead to lower variety seeking behaviour across categories and
high variety seeking within categories. This is mediated by the low levels of arousals (calmness)
in the shopper.
Hypothesis 6b: Freeform layout would lead to higher variety seeking behaviour across categories
and low variety seeking within categories. This is mediated by the high levels of arousals
(excitement) in the shopper.
REFERENCES
Bettman, J. R., Luce, M. F., & Payne, J. W. (1998). Constructive consumer choice processes.
Journal of consumer research, 25(3), 187-217.
Bitner, M. J. (1992). Servicescapes: The impact of physical surroundings on customers and
employees. The Journal of Marketing, 57-71.
Burke, Raymond R. 2002. "Technology and the Customer Interface: What Consumers Want in the
Physical and Virtual Store." Journal of the Academy of Marketing Science 30 (4): 411-432.
Childers, T. L., Carr, C. L., Peck, J., & Carson, S. (2002). Hedonic and utilitarian motivations for
online retail shopping behavior. Journal of retailing, 77(4), 511-535.
Davis, F. D. (1993). User acceptance of information technology: system characteristics, user
perceptions and behavioral impacts. International journal of man-machine studies, 38(3), 475-
487.
Donovan, R. J., Rossiter, J. R., Marcoolyn, G., & Nesdale, A. (1994). Store atmosphere and
purchasing behavior. Journal of retailing, 70(3), 283-294.

325
Elliot, S., & Fowell, S. (2000). Expectations versus reality: a snapshot of consumer experiences
with Internet retailing. International journal of information management, 20(5), 323-336.
Eroglu, S. A., Machleit, K. A., & Davis, L. M. (2001). Atmospheric qualities of online retailing:
A conceptual model and implications. Journal of Business research, 54(2), 177-184.
Henthorne, T. L., LaTour, M. S., & Nataraajan, R. (1993). Fear appeals in print advertising: an
analysis of arousal and ad response. Journal of Advertising, 22(2), 59-69.
Gorn, G. J., Chattopadhyay, A., Yi, T., & Dahl, D. W. (1997). Effects of color as an executional
cue in advertising: They're in the shade. Management science, 43(10), 1387-1400
Holbrook, M. B., & Hirschman, E. C. (1982). The experiential aspects of consumption: Consumer
fantasies, feelings, and fun. Journal of consumer research, 9(2), 132-140.
Huber, J., Payne, J. W., & Puto, C. (1982). Adding asymmetrically dominated alternatives:
Violations of regularity and the similarity hypothesis. Journal of consumer research, 9(1), 90-98.
Kelley, H. H. (1972). Causal schemata and the attribution process (pp. 151-174). Morristown, NJ:
General Learning Press
Levin, I. P., & Gaeth, G. J. (1988). How consumers are affected by the framing of attribute
information before and after consuming the product. Journal of consumer research, 15(3), 374-
378.
Levy, M., Weitz, B. A., & Grewal, D. (1998). Retailing management. New York: Irwin/McGraw-
Hill.
Manganari, E. E., Siomkos, G. J., & Vrechopoulos, A. P. (2009). Store atmosphere in web
retailing. European Journal of Marketing, 43(9/10), 1140-1153.
Maimaran, M., & Wheeler, S. C. (2008). Circles, squares, and choice: The effect of shape arrays
on uniqueness and variety seeking. Journal of Marketing Research, 45(6), 731-740.
McAlister, Leigh, and Edgar Pessemier. "Variety seeking behavior: An interdisciplinary review."
Journal of Consumer research 9, no. 3 (1982): 311-322.
Mehrabian, A., & Russell, J. A. (1974). An approach to environmental psychology. the MIT Press.
Michael, L., & Weitz, B. A. (2008). Retailing management. New York: McGraw-Hill.
Montoya-Weiss, M. M., Voss, G. B., & Grewal, D. (2003). Determinants of online channel use
and overall satisfaction with a relational, multichannel service provider. Journal of the Academy
of Marketing Science, 31(4), 448-458.
Morales, A., Kahn, B. E., McAlister, L., & Broniarczyk, S. M. (2005). Perceptions of assortment
variety: The effects of congruency between consumers’ internal and retailers’ external
organization. Journal of Retailing, 81(2), 159-169.

326
Petty, R. E., & Cacioppo, J. T. (1986). The elaboration likelihood model of persuasion (pp. 1-24).
Springer New York.
Porat, T., & Tractinsky, N. (2012). It's a pleasure buying here: The effects of web-store design on
consumers' emotions and attitudes. Human–Computer Interaction, 27(3), 235-276.
Raju, P. S. (1980). Optimum stimulation level: Its relationship to personality, demographics, and
exploratory behavior. Journal of consumer research, 7(3), 272-282.
El Sayed, I. M., Farrag, D. A., & Belk, R. W. (2004). The effects of physical surroundings on
Egyptian consumers' emotional states and buying intentions. Journal of International Consumer
Marketing, 16(1), 5-27.
Simonson, I. (1989). Choice based on reasons: The case of attraction and compromise effects.
Journal of consumer research, 16(2), 158-174.
Simonson, I. (1990). The effect of purchase quantity and timing on variety-seeking behavior.
Journal of Marketing Research, 150-162.
Sirgy, M. J., Grewal, D., & Mangleburg, T. (2000). Retail environment, self-congruity, and retail
patronage: An integrative model and a research agenda. Journal of Business research, 49(2), 127-
138.
Smith, K. C. P., & Apter, M. J. (1975). A theory of psychological reversals. Picton Publishing.
Vrechopoulos, A. P., O’Keefe, R. M., Doukidis, G. I., & Siomkos, G. J. (2004). Virtual store
layout: an experimental comparison in the context of grocery retail. Journal of Retailing, 80(1),
13-22.
Wu, W. Y., Lee, C. L., Fu, C. S., & Wang, H. C. (2013). How can online store layout design and
atmosphere influence consumer shopping intention on a website?. International Journal of Retail
& Distribution Management, 42(1), 4-24.

327
Agree to Disagree: Role of Values Alignment in Franchising Relationships
Joseph Matthes & Amit Saini
Marquette University & University of Nebraska-Lincoln
Franchising as a business model has witnessed enormous domestic and international growth (Dant, Grünhagen, and Windsperger 2011). Since its origins as voluntary and cooperative groups that sought economies of scale through vertical or horizontal expansion (Konopa 1963), franchising has offered a cost-efficient way for companies to recruit business partners. As the concept progressed to franchise selling, or the practice of manufacturers allowing a limited number of retailers to sell their products for a fee (Konopa 1963), franchising offered exponential market expansion, more than would be possible with the manufacturer’s limited internal resources. Eventually, the practice evolved into its present design of free-enterprise franchising, a widely adopted alternative marketing channel of distribution (Walker and Etzel 1973). The channel relationship between franchisees and franchisors is characterized by a co-dependence without much assurance that individual strategies or tactics will align etween the partners (Kashyap, Antia, and Frazier 2012; Purvin 2008). Thus a critical aspect of the franchising relationship is the agreement on (and execution of) marketing strategy, objectives, and operations between the franchisor and the franchisees. As a result of the potential for misalignment, many franchising relationships fall short of achieving their desired level of success (Gibson 2007; Holmberg and Morgan 2004). Reasons often cited for lack of performance include having conflicting approaches to the market, poor relationship quality between franchising partners, as well as unrealistic financial, strategic, or operational expectations on the franchisee (Purvin 2008; Sniegowski 2012). Furthermore, agreement or cooperation between franchising partners on marketing efforts are often cited as critical factors for achieving superior business outcomes (Frazer 2013; Mathews, DeBolt, and Percival 2011). For instance, a recent move by McDonalds to offer all-day breakfast menu was heralded as a smart strategic play by business observers, but has upset many franchisees 2 who are concerned about slowdown in service, complex kitchen logistics, and lack of new customer acquisition (Gruley and Patton 2015; Peterson 2015). While past literature on franchising relationships has addressed the principle-agent dynamic (e.g., Castrogiovanni, Combs, and Justis 2006; Shane 1998), the use of franchising to escalate resources (e.g., Combs and Ketchen 1999; Kaufmann and Dant 1996), and the governance of franchising contracts (e.g., Agrawal and Lal 1995; Kashyap et al. 2012), (dis) agreements on factors related to marketing management and their consequences have not been examined. We explore how a lack of alignment between franchisees and franchisors in terms of their socio-economic viewpoints, beliefs, or values affects the franchising relationship. More specifically, when a captive franchisee personally disagrees with their franchisor's public response to topics such as religion, marriage equality, or politics; how do they respond? How does it affect their satisfaction, operations, and future interactions with the franchisor?

328
METHODOLOGY Both qualitative and cross-sectional quantitative approaches were utilized to examine marketing alignment. The qualitative portion comprised of thirteen in-depth interviews with current and past franchisees that owned one or more franchised units from one or more business concepts, within the U.S. food and beverage industry. This study was exploratory in nature and findings were used to enhance understanding of marketing’s role in franchising relationships, identify factors affecting franchising marketing relationships, verify the nomological net, and provide guidance for item development. The key respondent for the quantitative study was identified as a U.S. based food and beverage franchisee that owned one or more franchised units from one or more business concepts. In order to construct a broad and representative sampling frame of 3 franchisees, a comprehensive list of food and beverage franchise concepts was obtained from Entrepreneur Magazine publication (Keup and Keup 2012). All franchisors must legally maintain official documentation commonly referred to as Franchise Disclosure Documents, or FDDs (Needleman 2012). FDDS are annually updated legal agreements that are provided to all franchisees in the network and are also registered with every state in which the franchise operates. The documents cover all aspects of purchasing, owning, and running the franchise. FDDs also typically contain a list of every franchisee currently in the network as well as some degree of contact information for each franchisee. Using the list from Entrepreneur Magazine as a guide, we were able to acquire 54 FDDs. Each FDD had been updated within the past year, and each contained some type of information about the franchisees in their system. Through analysis of these documents, companies were deemed usable for the study based on two conditions: 1) the FDD contained all necessary and current franchisee contact information and 2) there existed at least 501 unique franchisees currently operating in the company’s network. Thus, utilizing the FDDs, a database was created containing 1000 franchisee participants, across 33 firms, which were randomly selected using a stratified approach, with each stratum populated by franchisees of an individual firm. Once the franchisee database was created, it was necessary to ensure that the contact information it contained was both valid and current prior to conducting the survey. To this end, approximately 25% of franchisee owners in every stratum were randomly selected and verified via telephone calls. Less than 1% of the calls resulted in faulty contact information. In such rare cases, the franchisee was replaced with the next one on the list. Based on the extremely high success rate of the subset of calls, the list was deemed both valid and acceptable. These results were not surprising considering the FDDs for all companies in the study had been updated and legally registered within nine months of creating the list. In total, 1000 unique franchisees were mailed survey packets that included the cover letter, printed survey, $1 bill as an incentive, and return envelope with postage paid. Followup packets were sent to non-respondents four weeks after the original mailing. Surveys were obtained from 144 participants (14.4% response rate). Fifteen cases were removed from the sample due to missing data, leaving 129 usable responses (12.9% effective response rate). In order to evaluate the risk of non-response bias, an extrapolation method was utilized that compared early respondents with late respondents (Armstrong and Overton 1977). No evidence was found that supported the existence of a non-response bias. An evaluation of respondent demographics indicated success in identifying a diverse pool of key informants.

329
Franchisees ranged from owning one to over a hundred units and varied in their years of franchising experience from one to more than forty. In case franchisees owned multiple business concepts, they were asked to complete the questionnaire in reference to their main franchise, which was defined as whichever franchise represented their largest or most significant investment. We utilize OLS regression to test our hypotheses and our findings underscore multiple contributions towards understanding alignment. Overall, we make a strong case for pursuing marketing alignment in franchising relationships.

330
E-tailer versus Brand: The E-commerce tussle
Preetha Menon & Raman. R
Symbiosis Institute of Business Management, Pune
Whether brands must maintain their own e-commerce sites or rely on e-tailers (online retailers)
has been a topic for discussion amongst practitioners as well as researchers. While brands would
like to build customer loyalty and engage in interactive exercises using their own sites, customers
tend to prefer multi-brand e-tailers for e-commerce (Shobeiri et al., 2015).
E-tailer sites provide convenience to customers by offering a wide variety of products at one place.
However, brand websites prefer to cut down on costly promotions to e-tailers who stand between
them and the customer (Simmons, 2010). E-commerce enabled brand websites can engage with
their customers directly while doing business. The spread of interactive media usage across several
sub-populations of interest has made such scenarios possible for both e-tailers and brands. (Moran
& Gossieaux, 2010).
According to a recent report by L2 inc., nearly 70% of all customers prefer shopping online via e-
tailers as compared to brand sites. A significant indication of the popularity of either channel is
the click through rate of advertisements for e-tailer/brand sites. User engagement can be effectively
measured by increase in conversion events or click-through rates (Gatarski 2002). Some of the
ways in which performance of the online advertisement can be measured are cost per impression
(CPI), performance models such as click-through rates (CTR), or hybrid models (Emarketer 2005).
Do click-through rates for e-tailer and brand ads differ? Does the content of the ad itself
(visual/verbal) lead to different click-through rates? Do click-through rates differ for different
product categories? Answers to these questions will direct decision making on brands being
available on e-tailer sites, brand-owned sites or both. This research studies the effect of e-
tailer/brand advertisement on click through rates in high and low involvement products for ads
with visual/verbal cues.
Methodology
Two studies were conducted to examine how the e-tailer/brand ads with two ad formats using
visual/verbal cues affected customer click through rates for high and low involvement products.
The products were chosen after a pretest using the Product Category Involvement Scale (PSI). The
two products chosen for the study are mobile phone (high involvement category) and men’s
garments (low involvement category).
Findings
Study 1
For study 1, 128 post-graduate students were shown either an e-tailer ad or a brand ad interspersed
between a blog that they followed regularly. Both ads were for a popular apparel brand that they
were already aware of. Brand awareness was measured in an unaided and aided pre-test prior to
the experiment. The subjects saw the ad placed in the middle of the blog (center-right), for effective
viewing (Li and Lo, 2015). Half of the views were for an ad with a visual cue whereas the other
half views were of an ad with verbal cues. Results revealed that main effects for ad source and ad
format were statistically significant. The results demonstrated that e-tailer ads were clicked far
more than brand ads. This established that consumer click through rates were higher for e-tailer

331
ads as compared to brand ads. The study also revealed that visual ads were clicked more often than
verbal ads for both e-tailer and brand ads. However, considering that the product category chosen
was men’s apparel, these findings can only be extended to other low involvement products.
Study 2
Study 2 was conducted to check whether product category differences interacted with ad formats
of visual or verbal cues, resulting in differences in click through rates. Two products - mobile
phone (high involvement) and jeans (low involvement) were chosen for the study. 245 subjects
were recruited into the experiment. All of them had prior experience in purchase of either a mobile
phone or jeans.
The results for low involvement product (jeans) were similar to study 1, reinforcing the findings
of study1. However, for high involvement product (mobile phone) verbal cues were preferred over
visual cues. Also, the difference in click-through rate for e-tailer v/s brand narrowed. This
difference, when statistically tested was found to be insignificant.
Concluding, this study is useful for brand managers who may be undecided on their channel
strategy to attract customers. In case of ‘push strategy’ or offers, it is better to use a multi-band e-
tailer than try and establish the brand’s own channel of communication. This study also informs
the practitioner on the usage of visual or verbal cues for product categories with different levels of
involvement. While visual ads have a higher click through rate for low involvement products,
verbal ads have a higher click through rate for high involvement products. Future studies can
consider the congruence of blog content and ad category to check for its effects.
References
Emarketer (2005), "Online Ads Soared in First Half," September 28, available
at http://www.Emarketer.com
Gatarski, R. (2002). Breed better banners: design automation through on-line interaction. Journal Of
Interactive Marketing, 16(1), 2-13.
Li, H., & Lo, H. (2015). Do You Recognize Its Brand? The Effectiveness of Online In-Stream Video
Advertisements. Journal Of Advertising, 44(3), 208-218.
Moran, E., & Gossieaux, F. (2010). Marketing in a hyper-social world: The tribalization of business study
and characteristics of successful online communities. Journal Of Advertising Research, 50(3), 232-239.
Shobeiri, S., Mazaheri, E., & Laroche, M. (2015). How would the e-retailer's website personality impact
customers' attitudes toward the site?. Journal Of Marketing Theory & Practice, 23(4), 388-401.
Simmons, G., Thomas, B., & Truong, Y. (2010). 'Managing i-branding to create brand equity', European
Journal of Marketing, 44 (9), 1260-1285.

332
Economic Impact of Inter-firm Similarity in Marketing Strategy
Prakash Satyavageeswaran, Ashish Galande & Sudhir Voleti
Indian School of Business, Hyderabad
Short Abstract
Firm strategy is widely recognized as a key determinant of firm performance. But firm
strategy is an intangible quantity whose measurement, modelling and analysis have proven to be a
challenge. Since firms most often express and communicate firm strategy in descriptive terms and
in textual form, we develop and demonstrate an objective and scalable approach to measure and
analyse the impact of stated firm strategy on firm performance. We (i) invoke text analysis
procedures to tokenize and extract strategic content from raw text data, (ii) use latent space models
to transform similarities in firms' strategic vocabulary into firm locations in a large-dimensional
latent strategy space, and (iii) draw upon spatial econometrics for estimation, inference and
interpretation. We label our approach textspatial modeling. We implement our approach on data
from the Fortune 1000 public US firms and find a statistically significant performance differential
across firms attributable to elements of firm strategy.
Keywords: Latent space model, Firm Performance, Strategic Interaction
Introduction and Research Aim
"What explains firm performance?" is a pivotal question in management research. Firm
performance (FP) is some function of characteristic factors internal to the firm (e.g., firm
demographics, capital structure etc.), of environmental factors (e.g., industry structure, regulatory
controls, etc.), and of firm’s marketing strategy, which connects and reconciles the two (e.g., Grant
2008). Despite various available metrics, measuring and modeling this complex, contextual and
evolving firm’s marketing strategy object has remained a challenge. Previous approaches have
used metric variables to proxy for particular aspects of firm’s marketing strategy (e.g., Cassiman
and Veugelers 2006; Schilling and Phelps 2007) or have tested theoretical conceptualization using
primary data collected from managers (e.g., Kirkpatrick et al. 2002). We take an alternative,
general and scalable approach. We mine for and directly transform strategic content in relevant
textual sources into usable variables. The two elements of strategy focal to this study are readily
available in regulatory filings in the form of descriptive text. However, three obstacles stand in the
way of practical implementation: (a) extracting objective measures of firm’s marketing strategy
from text alone; (b) modeling cross-firm externalities in the firm's strategic elements; and (c)
estimating, interpreting and statistically inferring marginal effects of firm’s marketing strategy on
FP.
The aim of this study is to investigate the what, how and how much of firm performance is
explained by cross-firm strategy.

333
We address three research questions in line with this aim:
RQ1: Do cross-firm externalities in product portfolio and risk factors explain FP
outcomes?
RQ2: How much additional FP is explained due to cross-firm externality effects?
RQ3: How do these externalities act? Through neighbors’ inputs, outcomes, or both?
Background and/or Conceptual Model
The determinants of firm performance have elicited a lot of research attention, particularly
in the economics and management literatures. A widely accepted perspective is that firm
performance is some function of factors internal to the firm (e.g., firm demographics,
organizational structure, capital structure etc.), of factors external to the firm such as
environmental variables (e.g., industry structure and characteristics, regulatory environment,
macroeconomic conditions etc.), and of firm strategy, which connects and reconciles these internal
and external factors (e.g., Grant 2008).
Hence, in conceptual terms, we could say:
Firm i's Internal External Environment Firm i's .
Performance Factors of i of firm i Strategy f
(1)
However, firm strategy is an intangible quantity whose measurement, modeling and
analysis have proven to be a challenge. Managers, when asked to describe firm strategy do so in
words. Most external communication by firms used to inform various stakeholders regarding firm
strategy is textual in form. Firms' compliance filings, made at the behest of the government and
regulators, often contain strategic content of interest and are again primarily textual in form.
Hence, under the assumption that what firms are saying about their strategy is significantly
correlated with an underlying, latent strategy construct, we could say in conceptual terms:
Internal External Environment
Factors of i of firm iFirm i's.
Performance Firm i's Strategy in a
descriptive, textual form
f
(2)
Following equation (2), we develop a robust and general approach to measure qualitatively
described quantities (firm strategy, in the current context), model their effects on a set of units of
interest (firms, in our case), and invoke well-established estimation and statistical inference
techniques to assess the marginal effect of a text-based quantity on outcomes of interest (firm
performance metrics).

334
Methodology
The solution approach innovatively combines three existing methods, viz. bag-of-words
text mining and analysis, latent space modeling, and conventional spatial econometrics, to
overcome the three obstacles mentioned. We use text analysis procedures to atomize a firm's
strategic vocabulary into a vector of frequency-weighted phrase-tokens in some latent space of
firm’s marketing strategy. Next, we use relative firm locations in this latent space as an input to a
class of spatial autoregressive models from the spatial econometrics literature (e.g., Handcock,
Raftery and Tantrum. 2007; Sewell and Chen 2015), and thereby enable estimation, inference and
interpretation of strategy externalities on FP. We label this approach as text-spatial modeling. We
use the Business Description (BD) and Risk Factors (RF) parts of 10K documents and financial
variables for 2013 of the 909 publicly listed firms in Fortune 1000.
.
SpaceStrategy in toRelative
Firms Outside ofPosition
Firm of
tEnvironmen External
Firm of
factors Internal
Firmfor
Outcomes Firm
i
ij
iif
i
(3)
Equation (3) thus integrates a positional or locational interpretation of Strategy effects into
a model of firm outcomes as a function of outcome determinants. Our goal is to estimate the
marginal effects of firm strategy FP while controlling for the effects of other factors and thereafter
perform analysis, interpretation and inference on the results. This requires the development and
deployment of a formal model that connects firm strategy to FP within the constraints outlined
thus far. We develop a variant of the generalized linear model to incorporate text attributes into
formal analysis. We use relative firm locations in latent strategy space as an input to a class of
spatial autoregressive models from the spatial econometrics literature (e.g., Anselin 2004), and
thereby enable estimation, inference and interpretation of inter-firm strategy effects on FP.
Results and/or Discussion and Contributions
We find that cross-firm externalities in strategy communication matter and inform firm
value and explain 38% more of variance in Tobin's Q than the model with only economic
covariates. The largest increase in model fit occurs when the interaction of the strategy variables
BD and RF is considered in addition to their main effects. We also find that strategy neighborhoods
seem to display spatial autoregressive effects in firm value. Thus, the Tobin's Q of any focal firm's
strategic neighborhood informs its own Tobin's Q with a magnitude larger than that of any
'modeled effect'.
Implications for Theory and Practice
In contribution terms, first, we empirically show the existence and the extent of strategy
externalities on firm performance, in a large and diverse sample of firms. In particular, we
demonstrate a systematic approach to measure firm strategy from text descriptions and use a spatial
transformation to measure externalities in strategy. Second, we throw light on how the inter-firm
strategy externality effects impact FP by investigating different externality conditions (externality

335
in product space alone, in risk space alone and in the intersection of both), and different paths of
action (whether through factor inputs, firm outcomes or both). Third, we demonstrate a simple,
powerful and objective method to analyze firm performance that is based on and leverages the
advantages of the generic regression framework.
References
Anselin L, Florax R, & Rey SJ. 2004. Advances in spatial econometrics: methodology, tools and
applications. Springer Science & Business Media
Cassiman, B., & Veugelers, R. (2006). In search of complementarity in innovation strategy:
Internal R&D and external knowledge acquisition. Management Science, 52(1), 68–82.
Grant RM. (2008). Contemporary Strategy Analysis. Blackwell Pub.
Handcock, M. S., Raftery, A. E., & Tantrum, J. M. (2007). Model-based clustering for social
networks. Journal of the Royal Statistical Society: Series A (Statistics in Society), 170(2), 301–
354.
Kirkpatrick, S. A., Wofford, J. C., & Baum, J. R. (2002). Measuring motive imagery contained
in the vision statement. The Leadership Quarterly, 13(2), 139–150.
Schilling, M. A., & Phelps, C. C. (2007). Interfirm Collaboration Networks: The Impact of
Large-Scale Network Structure on Firm Innovation. Management Science, 53(7), 1113–1126.
Sewell, D. K. and Chen, Y. (2015), Analysis of the formation of the structure of social networks
by using latent space models for ranked dynamic networks. Journal of the Royal Statistical
Society: Series C (Applied Statistics), 64: 611–633.

336
Understanding the Effects of Diverse Human Capital on Firm Performance
Ruchi Galande
Indian School of Business, Hyderabad
The determinants of firm performance have elicited a lot of research attention, particularly
in the economics and management literatures. A widely accepted perspective is that firm
performance (henceforth, FP) is some function of factors internal to the firm (e.g., firm
demographics, organizational structure, capital structure etc.), of factors external to the firm such
as environmental and control variables (e.g., industry structure and characteristics, regulatory
environment, macroeconomic conditions etc.), and of firm strategy, which connects and reconciles
the firm's internal and external factors (e.g., Grant 2008). In their recent work, Kumar and Pansari
(2015, 2016) show that higher employee engagement has a significant and positive effect on firm
performance. In this study, as shown in Figure 1, we attempt to understand the effects of diverse
human capital on employee engagement and hence on firm performance.
Figure 1. Human Capital Diversity and Firm Performance
Diversity can no longer be considered to be a simple task of creating a heterogeneous
workforce, but it has now evolved to utilizing that workforce to think creatively, improve the
services and business practices that potentially sets a firm apart and in turn gives it a competitive
advantage in the market. To compete on a global scale, firms have to continuously evolve this
definition to adapt to different markets and cultures.
Human capital or the workforce is the most importance asset of any firm. In order to
succeed in the global market, it is of utmost importance for every firm to utilize this asset to its
full potential. Firms not only need to attract and retain the best minds with the right skills, but they
Human Capital
Diversity
Employee Engagement
Firm Performance

337
also need to ensure that they have acquired these resources such that they are representative of the
cultural background – in other words, they are diverse (eg. Barrick et al. 2015, Downey et al. 2015,
Jones & Harter, 2005). With demographic shifts (eg. Avery et al. 2007), advances in technology
and communications, and globalization, diversity is quickly becoming a driver of growth around
the world. Maximizing the potential of a diverse workforce is not only a social imperative, but is
also a competitive advantage.
Past research has not shown any consistent, conclusive relationship between racial
diversity and firm performance. In this paper, we find a positive relationship between racial
diversity and firm performance. We attempt to understand how the relationship between racial
diversity and firm performance is moderated by the changes in diversity across multiple years. We
use human capital and performance data from American Law firms for the years 2010 to 2012 to
demonstrate our results.
References
Avery, D. R., McKay, P. F., & Wilson, D. C. (2007). Engaging the aging workforce: the
relationship between perceived age similarity, satisfaction with coworkers, and employee
engagement. Journal of Applied Psychology, 92(6), 1542.
Barrick, M. R., Thurgood, G. R., Smith, T. A., & Courtright, S. H. (2015). Collective
organizational engagement: Linking motivational antecedents, strategic implementation,
and firm performance. Academy of Management Journal, 58(1), 111-135.
Downey, S. N., Werff, L., Thomas, K. M., & Plaut, V. C. (2015). The role of diversity practices
and inclusion in promoting trust and employee engagement. Journal of Applied Social
Psychology, 45(1), 35-44.
Grant, R. M. (2010). Contemporary strategy analysis and cases: text and cases. John Wiley & Sons.
Jones, J. R., & Harter, J. K. (2005). Race effects on the employee engagement-turnover intention
relationship. Journal of Leadership & Organizational Studies, 11(2), 78-88.
Kumar, V., & Pansari, A. (2015). Measuring the benefits of employee engagement. MIT Sloan
Management Review, 56(4), 67.
Kumar, V., & Pansari, A. (2016). Competitive advantage through engagement. Journal of
Marketing Research, 53(4), 497-514.
338
Marketing Strategy, Decision Science, and Strategic Cognition: An Integrative Framework
and Research Agenda
Sreedhar Madhavaram & Radha Appan
Cleveland State University, USA
The fundamental thesis of all strategy is to achieve competitive advantage, and thereby, superior
financial performance (Madhavaram & Hunt, 2008). This quest for competitive advantage
compels firms to continuously engage in (marketing) strategy and related activities. However,
what do strategy and related activities entail? Decision making and cognition are two, somewhat
implicit and highly intertwined, concepts central to strategy. Despite the multitude of definitions
and perspectives on strategy, there is consensus that decision making undergirds all strategy
related activities. For Mintzberg (1978), strategy can be seen as a pattern in a stream of
decisions. For Schwenk (1984), decision making is critical to strategy formulation, generation of
strategic activities, and evaluation and selection of strategic alternatives. For Hart (1992),
decision making across organizations varies based on strategy mode, the manner in which
strategy is formulated and implemented in different organizations. For Porter (1996), the essence
of strategy involves decisions to perform different activities and/or specific activities differently,
compared to rivals. For Hendry (2000, p. 956), “decisions are the most visible elements of the
strategy process and a major focus of top management effort and attention.”
On similar lines, strategy scholars in marketing explicitly made decisions a part of the marketing
strategy definitions. For Slater and Olson (2001, p. 1056, italics added), “Marketing strategy is
the set of integrated decisions and actions by which a business expects to achieve its marketing
objectives and meet the value requirements of its customers.” For Day, Weitz, and Wensley
(1990), marketing strategy refers to marketing activities and decisions related to building and
maintain a sustainable competitive advantage. Synthesizing and building on the
conceptualizations of marketing strategy, Varadarajan (2010, p. 130, italics added) defines
marketing strategy as “an organization’s integrated pattern of decisions that specify its crucial
choices concerning marketing activities to perform and the manner of performance of these
activities, and the allocation of marketing resources among markets, market segments and
marketing activities toward the creation, communication and/or delivery of a product that offers
value to customers in exchanges with the organization and thereby enables the organization to
achieve specific objectives.”
Given that decision making is central to marketing strategy, it is important to integrate
developments in decision science into researching, understanding, and practicing marketing
strategy. There is growing recognition in decision science research that the explanations
provided by the expected utility theory, that forms the core of decision science, are inadequate
(Busemeyer, 2015; Sahlin, Wallin, & Persson, 2010). For Sahlin et al. (2010), theories proposed
as alternatives to the expected utility theory, such as dual process theory, lack robust theoretical
frameworks and the quest for good theory/theories in decision science should continue. Along
the same lines, Busemeyer (2015) calls for integrating theories developed in cognitive science to
make decision science more impactful. Specifically, for Busemeyer (2015, p.43), “One of the
main contributions of cognitive science to decision science is the development of dynamic
models that describe the cognitive processes that underplay the evolution of preferences during

339
deliberation phase of making a decision.” The impact that cognition can have on decision
making is also not lost on (marketing) strategy researchers.
In fact, strategy researchers like Stubbart (1989) and Schwenk (1984, 1995) have shed light on
the impact that cognition can have on strategy related decision making. For Stubbart (1989),
even though cognition must figure prominently in strategy-making, it is not explicitly explored in
academic and business literature on strategic management. In fact, Stubbart (1989) contends that
Schendel and Hofer’s (1979) influential book that represents the crystallization of the strategic
management discipline overlooked the critical role of cognition in strategy. Around the same
time, Schwenk (1984) examined how research in cognitive psychology and behavioral decision
making can inform strategic decision making involving the activities of goal formulation,
problem identification, alternatives generation, and evaluation/selection. In recent times,
Narayanan, Zane, and Kemmerer (2011) integrated the literature on cognition and developed a
framework that links the antecedents, structure, and processes of strategic cognition with
outcomes. Specifically, they develop a distinctive cognitive perspective on strategic processes
such as strategy formulation, strategy implementation, strategic change, and organizational
learning.
This research integrates the perspectives from marketing strategy and strategy, decision science,
and cognition to develop a framework that can shed light on how firms can succeed in their quest
for competitive advantages. Specifically, given that cognition (i) is seen as a missing link for
strategic marketing management and (ii) can impact strategic marketing decision making, this
research addresses the following questions: what decisions do firms and managers have to make
for strategy in the quest for competitive advantages? What kinds of cognition help firms and
managers in making decisions for marketing strategy? How and in what ways can firms help in
facilitating the cognition required for marketing strategy? What are the potential outcomes
decision making in the marketing strategy context? In doing so, this research, first, provides a
brief overview of the (marketing) strategy research in the context of decision making is provided,
and issues that are pertinent to marketing strategy wherein decision making can and should play
a crucial role are identified. Second, a brief overview of the origins and development of
cognition research for marketing strategy is provided. Here, we also identify variables that reflect
cognition for marketing strategy. Third, an integrative theoretical framework that approaches
marketing strategy from decision science and cognition perspectives and a corresponding
research agenda are developed.
There is a plethora of research on (marketing) strategy, decision science, and cognition.
Although scholars have explored the intersections of strategy and decision making, strategy and
cognition, and decision making and cognition, there is little research that takes an integrative
perspective to make our understanding of strategic decision making richer. Given that (i)
decision are an integral part of marketing strategy making, marketing strategy implementation,
and other marketing strategy related activities and processes, (ii) cognitive science can make
significant contributions to decision science, and (iii) cognitive psychology and behavioral
decision making can inform strategic decision making in marketing, this research integrates the
perspectives from (marketing) strategy, decision science, and cognition to develop a framework
that can shed light on how firms can succeed in their quest for competitive advantages.

340
This research makes three specific contributions. First, through a review of literature on decision
making for marketing strategy, we identify and discuss marketing strategy
formation/development ((Menon, Bhardawaj, Adidam, & Edison, 1998), marketing strategy
comprehensiveness (Atuahene-Gima & Murray, 2004), alignment of marketing strategy with
business strategy (Vorhies & Morgan, 2003), marketing strategy implementation, sense-making,
strategic change, dynamic capabilities, and evaluation of strategic alternatives as issues pertinent
to marketing strategy. Second, through a systematic review of cognition research for (marketing)
strategy, we identify and discuss several variables that represent cognition for marketing
strategy. Third, noting the importance of theoretical frameworks for explanation and prediction
in the context of strategic decision making, we develop an integrative framework that identifies
and proposes potential antecedents of cognition variables and potential consequences of strategic
decision making for marketing. The conceptual framework developed in this research and the
corresponding research agenda offer multiple avenues and opportunities for future research. In
conclusion, the advances in cognition science and decision science provide significant
opportunities for strategic marketing management in search of competitive advantage(s).
Sample References
Atuahene-Gima, K., & Murray, J. Y. (2004). Antecedents and outcomes of marketing strategy
comprehensiveness. Journal of Marketing, 68(4), 33-46.
Day, G. S., Weitz, B. A., & Wensley, R. (Eds.). (1990). The interface of marketing and
strategy (Vol. 4). Jai Press.
Madhavaram, S., & Hunt, S. D. (2008). The service-dominant logic and a hierarchy of operant
resources: developing masterful operant resources and implications for marketing
strategy. Journal of the Academy of Marketing Science, 36(1), 67-82.
Menon, A., Bharadwaj, S. G., Adidam, P. T., & Edison, S. W. (1999). Antecedents and
consequences of marketing strategy making: a model and a test. The Journal of Marketing, 18-
40.
Porter, M. E. (1996). What is strategy? Harvard Business Review, November.
Slater, S. F., & Olson, E. M. (2001). Marketing's contribution to the implementation of business
strategy: An empirical analysis. Strategic Management Journal, 22(11), 1055-1067.
Varadarajan, R. (2010). Strategic marketing and marketing strategy: domain, definition,
fundamental issues and foundational premises. Journal of the Academy of Marketing
Science, 38(2), 119-140.
Vorhies, D. W., & Morgan, N. A. (2003). A configuration theory assessment of marketing
organization fit with business strategy and its relationship with marketing performance. Journal
of Marketing, 67(1), 100-115.
341
Manifestations of psychological contract violation influencing word of mouth intention of
mobile shopping apps: Retailer reputation as moderator
Prasanta Kr Chopdar & V.J.Sivakumar
National Institute of Technology, Tiruchirappalli
Abstract
This research investigates the influence of psychological contract violation (PCV) on consumers
trust, satisfaction, perceived risk, and consequently on word of mouth intention in the context of
mobile shopping applications.We further investigate the moderating role of retailer reputation in
the model. An online survey conducted among mobile shopping application users reveal the
deleterious effects of PCV on trust, satisfaction, and perceived risk.The findings further confirm
the significant positive impact of consumers trust, and satisfaction on their word of mouth
intention, whereas perceived risk is shown to be a major deterrent. The significance of retailer
reputation as a trust building and risk relieving mechanism to dampen the adverse impacts of PCV
among mobile shopping application users is highlighted in the study, however its role in
safeguarding satisfaction is found to be insignificant. Several theoretical and practical implications
are discussed further.
Keywords Psychological contract violation (PCV), Trust, Perceived risk,Satisfaction, Retailer
Reputation, Word of mouth intention,Mobile shopping applications
Introduction
The rising number of smartphone users in India which is estimated to reach 340.2 million by 2017
(Statista,2017), coupled with swelling internet penetration is changing the buying behaviour from
desktop to mobile shopping. Notwithstanding the significant growth of m-commerce in India, the
e-tailing sector is plagued with many challenges related to delivery of products, return handling,
and payment issues (Pandey etal.,2015). Psychological contract is an important facet of every
buyer-seller interactions that entails buyers expectations, that are generally excluded from formal
legal contracts ( Pavlou and Gefen,2005;Theotokis etal.,2012). Psychological contract violation
(PCV) occurs when buyers opine they are not receiving what has been promised by a sellers
contractual agreement (Theotokis etal.,2012).
In India PCV issues are common on account of lack of robust cyber laws, delivery delays, supply
chain bottlenecks, product quality mismatch etc. Hence, based on India’s phenomenal e-tailing
growth and current scenario presented above, the current study is highly appropriate and likely to
illuminate researchers and practitioners on PCV and its consequences on mobile shopping
applications use in a developing country context.
Past literature has mostly explored the negative influence of PCV in organizational context and its
adverse impact on trust, satisfaction, commitment, and loyalty of employees (Zhao etal.,2007;
Tekleab etal.,2005; Suazo,2009). Only a handful of studies have investigated PCV and its
consequences in the context of buyer-seller relationship.The recent empirical work by Malhotra
etal. (2017) assessed the impact of PCV on customer reuse intention of e-tailers website via

342
mediation of trust and satisfaction. Despite of a few notable works in online context , studies on
psychological contract violation (PCV) and its consequences in the area of m-commerce and
particularly mobile shopping applications are non-existent. Hence, aiming to fill the above void in
literature and building on the future research directions proposed by Malhotra etal. (2017), The
current study examines the impact of PCV on consumers trust, satisfaction, and perceived risk
with mobile shopping applications in a single parsimonious model. We further examine the
moderating role of retailer reputation in our proposed model. We expect retailer reputation to play
a crucial role in lessening the negative effects of PCV in the model as it is found to reduce the risk
perception and intensify positive emotions of online shoppers (Kim and Lennon,2013).This study
conceptually develops and tests a model by extending PCV theory (Rousseau,1995) and the
stimulus-organism-response (S-O-R) framework (Mehrabian and Russell,1974) to shed more light
on buyer-seller relationships on mobile platforms.
Our proposed conceptual framework is presented in Figure1.
Notes: Direct effect; Moderating effect
Figure 1. Research Model
Methodology
An online survey was conducted using survey monkey platform and the sample was limited to
mobile shoppers who had frequently used mobile shopping applications on their smartphones for
purchasing goods or services from online retailers in the past and had encountered some form of
PCV
Satisfaction
Perceived
Risk
Trust
WOM
Intention
Retailer
Reputation
H1
H2
H3
H4
H5
H6
H7a
H7b H7c

343
psychological contract violation (PCV). Total 246 usable responses were kept for final
analaysis.The items employed in this research were all adapted from extant literature to establish
adequate reliability and validity. We employed the partial least square structural equation
modelling (PLS-SEM) approach to test our conceptual model.The PLS method is preferred as our
model comprises of both formative and reflective constructs and the research emphasis is more on
exploration than confirmation ( Henseler etal.,2009; Hair etal.,2014).
Findings
We analysed both measurement and structural model. Bootstrapping procedure was employed to
test the significance of path coefficients. Psychological contract violation is reported to exhibit
significant negative relationship towards both trust (β=-0.554;p<0.001) and satisfaction(β=-
0.447;p<0.000) while having a positive significant association with perceived risk construct
(β=0.198;p<0.01) as expected. Further, the impact of trust on word of mouth intention
(β=0.214;p<0.001) and satisfaction on word of mouth intention (β=0.556;p<0.001) were found
positive and statistically significant whereas perceived risk was observed to have a significant
negative impact on the word of mouth intent of users of mobile shopping applications (β=-
0.135;p< 0.01). The moderating influence of retailer reputation on the relationship between PCV
and trust (p<0.05) and between PCV and perceived risk(p<0.001) were both found significant
which implies that higher retailer reputation diminishes the negative impact of PCV on trust and
weakens the positive association between PCV and perceived risk associated with mobile shopping
applications.The results did not support the moderating influence of retailer reputation between
PCV and satisfaction.
Conclusions
This study carries enormous theoretical significance as no previous study has explored the concept
of PCV by including trust, satisfaction, and perceived risk in a single parsimonious model to
predict consumers word of mouth intention towards mobile shopping applications. With regard to
managerial implications, it indicates the adverse impact of PCV on customer retention and overall
success of mobile shopping applications. Further our finding upholds the paramount importance
of retailer reputation in shielding buyers trust and reducing their perceived risk from the adverse
impacts of PCV. Our current study makes significant contribution to mobile shopping literature by
conceptually developing and validating a model based on the S-O-R framework. This empirical
work sheds light on the underpinning relationships between PCV (stimulus), trust, perceived risk,
satisfaction (organism), and word of mouth intention (response) leading to a finer interpretation of
buyer-seller interactions in the context of mobile shopping apps.
References
https://www.statista.com/statistics/467163/forecast-of-smartphone-users-in-india/(accessed
14.02.2017).
Hair, J.F., Hult, G.T.M., Ringle, C.M., Sarstedt, M., 2014. A Primer on Partial Least Squares
Structural Equation Modeling (PLS-SEM). Sage, Thousand Oaks.
Henseler, J., Ringle, C.M. and Sinkovics, R.R., 2009. The use of partial least squares path
modeling in international marketing. In New challenges to international marketing (pp. 277-

344
319). Emerald Group Publishing Limited.
Kim, J. and Lennon, S.J., 2013. Effects of reputation and website quality on online
consumers' emotion, perceived risk and purchase intention: Based on the stimulus-organism-
response model. Journal of Research in Interactive Marketing, 7(1), pp.33-56.
Malhotra, N., Sahadev, S. and Purani, K., 2017. Psychological contract violation and
customer intention to reuse online retailers: Exploring mediating and moderating
mechanisms. Journal of Business Research, 75, pp.17-28.
Mehrabian, A. and Russell, J.A., 1974. An approach to environmental psychology. the MIT
Press.
Pandey, S., Chawla, D. and Venkatesh, U., 2015. Online shopper segmentation based on
lifestyles: an exploratory study in India. Journal of Internet Commerce, 14(1), pp.21-41.
Pavlou, P.A. and Gefen, D., 2005. Psychological contract violation in online marketplaces:
Antecedents, consequences, and moderating role. Information systems research, 16(4),
pp.372-399.
Rousseau, D., 1995. Psychological contracts in organizations: Understanding written and
unwritten agreements. Sage Publications.
Suazo, M.M., 2009. The mediating role of psychological contract violation on the relations
between psychological contract breach and work-related attitudes and behaviors. Journal of
Managerial Psychology, 24(2), pp.136-160.
Tekleab, A.G., Takeuchi, R. and Taylor, M.S., 2005. Extending the chain of relationships
among organizational justice, social exchange, and employee reactions: The role of contract
violations. Academy of Management Journal, 48(1), pp.146-157.
Theotokis, A., Pramatari, K. and Tsiros, M., 2012. Effects of expiration date-based pricing on
brand image perceptions. Journal of Retailing, 88(1), pp.72-87.
Zhao, H.A.O., Wayne, S.J., Glibkowski, B.C. and Bravo, J., 2007. The impact of
Psychological contract breach on work‐related outcomes: a meta‐analysis. Personnel
Psychology, 60(3), pp.647-680.

345
Winds of change: SCRM fuelled Customer Engagement Value &Increase the Firms
Profitability
Sukanya Roy
IIM Udaipur
Introduction:
In the era of new technology, social media plays a pivotal role in every business organization to
remain competitive in the market. Social customer relationship management is a business strategy
that uses web 2.0 services to create engagement between customer and the company this leads to
enhance customer engagement value. The present study discusses the capabilities of social
customer relationship management in enhancing the profitability in any business organizations.
Objective: The objective of this study is twofold. Firstly, the present study makes an attempt to
examine the linkages between SCRM and customer engagement values and secondly, how it
influences the profitability of the firm by SCRM & Customer engagement.
Social Customer Relationship Management: Theoretical Foundations
( Social Media+ CRM= SCRM)
Paul Greenberg, CRM guru, defines “Social CRM is a philosophy and a business strategy,
supported by a technology platform, business rules, workflow, processes and social characteristics,
designed to engage the customer in a collaborative conversation in order to provide mutually
beneficial value in a trusted and transparent business environment”. The theoretical roots of SCRM
concept lie in the integration of social media and CRM practices.
Customer Engagement:
In March 2006, the ARF announced the first definition of customer engagement; it is a business
communication between customer and company, where online engagement is qualitatively
different from the offline engagement. (Brodie et al, 2011) suggested that Consumer engagement
plays a central role in the process of relational exchange and it enhances loyalty, satisfaction,
empowerment, emotional bonding, trust and commitment between marketers and customers.
Methodology:
The present study is a review research paper where the key objective is to identify the inter-
linkages between the proposed constructs. Based upon existing literature a conceptual framework
is proposed that links the social CRM with the firm profitability through customer engagement
value across high and low levels of customer engagement. The model considers the dimension of
social media and CRM and how it influences the customer engagement value & increase firm
profitability

346
+ retention
Acquisition
+
Fig 1. Conceptual Framework
Proposition 1: The SCRM process can influence the customer engagement with the company,
by enhancing the customer participation in different forms of activities.
SCRM is a business strategy to understand the needs of customers and build a long term
relationship; it aims at enhancing customer relationship and making customer more engaged.
(M.Patil, 2014) suggested that the objective of SCRM is to engage customer rather than to manage
customer. (Malt house et al, 2013) advocated that SCRM is a two dimensional phenomenon, CRM
dimension and social media dimension. CRM dimension consists of (acquisition, retention
&termination) and social media dimension consists of (higher and lower engagement). SCRM is
the business strategy of engaging customers through social media with the goal of building trust
and brand loyalty (Greenberg, 2010) and it is all about people and relationship (Woodcock et al,
2011) Thus we can define SCRM as the global process which is adopted by every organization to
create and engage a long term profitable relationship between a company and its customers and to
enhance customer value.
Proposition 2: The customer engagement significantly drives the dimensions of customer
engagement value and builds on the notion that “Everything starts with a customer”
The essence of the customer engagement is to deliver value. Customer engagement is the means
by which a company creates a relationship with its customer. Traditionally CE was limited within
the offline mode, but in an increasing network society marketer can easily interact with their
customers through social mediocre consist of multiple behavior such as WOM, blogging,
providing ratings and so on (Van Door et al., 2010; Verhoef et al., 2010). Customer engagement
is defined as an emotional connection between customer and brand it is the depth of the relationship
a customer has with the brand. Recently Maggi comes up with the contest,“ Share your Maggi
moments with Facebook” This hints to create a non-transactional behavior, even today B2B
company like MAERSK Line follow the social media presence and trying to focus Customer
engagement beyond the transaction. Kumar et al. (2010) suggested Customer value is driven by
the nature and the intensity of customer engagement, the value of the customer engagement has a
four dimensions, customer lifetime value, customer referral value and customer knowledge value&
customer lifetime value, CEV strategies have a positive influence to target, acquire and retain the
customers. Emotionally engaged customers 300% more to recommend the products, more repeat
customers and less price sensitive (Banas, 2014) The greater the consumer engagement, or
emotional loyalty, the greater the financial value of the consumer (Woodcock, 2011)
SCRM
CRM
SOCIAL
MEDIA
ENGAGEMENT
(HIGH &LOW)
CUSTOMER ENGAGEMENT
VALUE
Reduce Cost &
Increase Firm’s
Profit
347
Proposition 3: SCRM can have a significant impact in reducing the business cost&
promoting the profitability of the company by engaging more customers:
Every business wants to reduce their operation costs, Social media is a valuable tool to reduce the
business cost while increasing revenues. It helps in reducing cost like customer service cost,
product design cost, advertising cost. In 2013, Social Media Examiner Study indicates that
business organization reduced marketing expenses by introducing social media as a business tool.
Smart Companies follow the SCRM strategy by engaging customers by involving them a feedback
information about the customer needs and demands. Woodcock (2011) advocated that the SCRM
generates profitability for a company on a four step process. Engaging prospects and customers,
conducting conversion (winning new customer) retaining customer and developing customer
value, Therefore SCRM supports the entire customer management strategy and life cycle and
should thus lead to increased sales. Through social media tools firms generate profit by using
customer ratings and reviews. Social media engages customers and this leads to increased revenue,
cost reduction and efficiencies for the company (Baird & G.parasnis, 2011). SCRM encourages
customer, employee interaction which helps to increase the customer loyalty; it also raises the
marketing return on investment and development of product quality (M.Patil, 2014)
Conclusion:
The present study makes an attempt to deal with a linkage between SCRM & customer engagement
and secondly it shows the influence of SCRM strategy on the firm’s profitability. The study result
suggested that the SCRM is a business strategy which is designed to engage the customers. The
essence of the customer engagement is to deliver customer value. Kumar et al., (2011) advocated
that the customer value is driven by the nature and intensity of the customer engagement. And the
second study result suggested that the SCRM generates profitability for a company on a four step
process. Engaging prospects and customers, conducting conversion (winning new customer)
retaining customer and developing customer value. Therefore, SCRM supports the entire customer
management strategy and life cycle and thus lead to increased sales.
References:
Malthouse, E. C., Haenlein, M., Skiera, B., Wege, E., & Zhang, M. (2013). Managing customer
relationships in the social media era: introducing the social CRM house. Journal of Interactive
Marketing, 27(4), 270-280.
Brodie, R. J., Ilic, A., Juric, B., &Hollebeek, L. (2013). Consumer engagement in a virtual brand
community: An exploratory analysis. Journal of Business Research, 66(1), 105-114.
Drury, G. (2008). Opinion piece: Social media: Should marketers engage and how can it be done
effectively?. Journal of Direct, Data and Digital Marketing Practice, 9(3), 274-277.
Dutot, V. (2013). A new strategy for customer engagement: how do French firms use social
CRM?. International Business Research, 6(9), 54.

348
Patil, M. Y. (2014). Social Media and Customer Relationship Management. IOSR Journal of
Business and Management (IOSR-JBM), 27-32.
Woodcock, N., Green, A., & Starkey, M. (2011). Social CRM as a business strategy. Journal of
Database Marketing & Customer Strategy Management, 18(1), 50-64.
Giannakis-Bompolis, C., &Boutsouki, C. (2014). Customer relationship management in the era of
social web and social customer: an investigation of customer engagement in the Greek retail
banking sector. Procedia-Social and Behavioral Sciences, 148, 67-78.
Banyte, J., &Dovaliene, A. (2014). Relations between customer engagement into value creation
and customer loyalty. Procedia-Social and Behavioral Sciences, 156, 484-489.
Dovaliene, A., Masiulyte, A., &Piligrimiene, Z. (2015). The relations between customer
engagement, perceived value and satisfaction: The case of mobile applications. Procedia-Social
and Behavioral Sciences, 213, 659-664.
Kumar, V., Aksoy, L., Donkers, B., Venkatesan, R., Wiesel, T., &Tillmanns, S. (2010).
Undervalued or overvalued customers: capturing total customer engagement value. Journal of
Service Research, 13(3), 297-310.
Greenberg, P. (2001). CRM at the speed of light: Capturing and keeping customers in Internet real
time. Elsevier.
TimMischuk..(2014, April, 7th).Reducemarketingcost..http://mavensocial.com/reduce-
marketing-costs-with-social/
Business Advisory team. (2017, April, 7).Use social media to reduce cost.
http://runapptivo.apptivo.com/use-social-media-to-reduce-your-business-costs-1336.html
349
Patterns of online grocery purchase: first and repeat buyers
Wasimakram Binnal & Anjula Gurtoo
Indian Institute of Science, Bengaluru
The paper aims for better understanding of online consumer decision making in low involvement
products by exploring the differences between first and repeat buyers. Collaboration with leading
online grocery retailer in India was formalized for data. The retailer gets more than a million clicks
each day. The following data was shared by the retailer and forms the base for the analysis - server
weblog information like purchase-orders, browsing patters, timestamp, session details, ip-address,
device used, navigation pages and browsers used. The tab-delimited data is for 20 days in total. Data
cleaning is done with a focus on answering the research questions. Multimethod research methodology
is used for data analysis. Descriptive statistics and CART decision trees techniques are used. The
findings provide insight into online consumer behaviour in low involvement products. . There is no
difference in average time spent on webpage between first and repeat buyers and there is a significant
difference between first and repeat buyers in order value. First time consumers exhibit hesitation in
using navigational choices, specifically product description and product search. The first-time
consumers exhibit no clear path but have higher inclination towards browsing of products. Fruit-
vegetables and grocery staples is the most visited category item for both.
Keywords
Online purchase; first-time buyers; repeat buyers; weblogs; grocery categories; navigational choices; source websites.

350
Investigating the effect of service quality and satisfaction on consumer behavioral intentions
with respect to online shopping in India.
Habeeb Syed & Francis Sudhakar
NIT Warangal
Abstract : The purpose of this paper is to examine the effects of service quality and satisfaction
on three consumer behavioral intentions like word of mouth, website revisit and repurchase
intentions with respect online shopping in India. To build a vision of the future, we carried on an
online survey with questionnaire highlighting the servqual and webqual dimensions along with
word of mouth, website revisit and repurchase intentions. 254 valid responses from south India
who must have made, at least one previous online purchase was collected. Data collected was
analysed using factor analysis to come up with the most important factors, which matters for
repurchase behavior. Then simple structural equation modeling was used as part of analysis. The
results reveal that e-service quality has a positive effect on e-satisfaction, where it also influences
the consumer’s behavioral intentions namely word of mouth, website revisit and repurchase.
Key words: Customer satisfaction, Service quality, Consumer behavior, online shopping.
Introduction:
E-commerce helped customers to get desired brand across product categories with discounts. Only
concern remains is most of the e-commerce businesses are still not profitable so long term
sustenance is challenging if it remains so. It’s a Boom to some extent & to further remain boom
all e-commerce businesses need to think about being profitable. One of the most significant
economic trends of the past decade is the growing use of the Internet for expanding business by
adoption of e-commerce to compete at the global level. Considering Asia pacific region internet
penetration for the year 2017, the top position is taken by China with 731 million internet users
and India takes second place with 462 million internet users (Statista, 2017). The number of
Internet users in India is expected to reach 450-465 million by June, up 4-8% from 432 million in
December 2016, a report from the Internet and Mobile Association of India and market research
firm IMRB International said. The report added its forecast does not factor in the impact of
demonetization, which gave a boost to digital and mobile transactions. The report said overall
Internet penetration in India is currently around 31%. This indicates there much good to happen
in the name of e-business and e-transactions.
According to Worldpay projections, India will be the world's second largest ecommerce market
by 2034, thanks to massive surges in internet penetration, a swelling millennial population and the
rising uptake of mobile phones, it added.
In recent years, the rapid development of Internet and ecommerce has created new business
practices and economic models. With online shopping platform providers putting more and more
emphasis on the virtual experience, service quality - an important concept in real economy that
influences customer satisfaction and consumer buying behavior – should also be valued by the
sellers of online shopping. One area that some e-commerce businesses excel in is customer service.
They find ways to beat the competition through better customer service. You cannot crush the

351
competition by solely focusing on customer service, but this gives you a significant advantage over
the competition. Better customer service means happier customers, which results in stronger word-
of-mouth advertising. We all know how effective word-of-mouth is, especially since we do not
have to pay for it. Also, satisfied customers become loyal customers, making multiple purchases.
Therefore, this paper attempts to access the relationship between service quality, customer
satisfaction and customer behavioral intentions in online-shopping environments.
Methodolgy
Survey method will be used for this study-using questionnaire as data collection instrument. The
questionnaire is adapted from scales already used for previous studies in the literature. The factors
of Customer satisfaction are System quality, Information quality, Service quality, Product quality,
and Delivery services taken from T. Ahn et al. (2004), and Irwin Brown and Ruwanga Jayakody
(2008), Hult, Boyer, and Ketchen (2007), and Spiros Gounaris Sergios Dimitriadis Vlasis
Stathakopoulos, (2010). Primary data of e-SQ, e-satisfaction and e-loyalty will be gathered by
questionnaires of customers who have already made an online purchase in India especially in South
India. A total of 255 responses collected through questionnaire which is distributed by E-mails and
Social apps.
Next factor analysis will be done to come up with the necessary factors to be considered for
measurement. The reliability of the questionnaires will be evaluated by assessing the internal
consistency of the items representing each construct e-satisfaction factors and behavioral
intentions by using IBM SPSS Statistics 21 trial version. The relation between the each factor of
customer satisfaction, behavioral intentions and their dimensions will be checked through the
Confirmatory factor analysis and model fit values by using AMOS 21 trial version. After that,
checking the entire predicted model construct will be tested CFA; model fit values by using AMOS
21 trial version.
Findings:
The factors that affect satisfaction levels more are Product information, Service quality, Security,
Delivery system. So the online stores have to concentrate more on these factors rather than
concentrating on service quality dimensions only. Relationship between e-service factors that
affect customer satisfactions and re-purchase intentions is highly significant. In addition, the
findings of the present study shows that word-of-mouth, a powerful mean to create awareness,
positive image and thus to attract new customers, also found a strong consequence of e-quality and
satisfaction. Thus managers need to concentrate that positive word of mouth is spread, this
recommendation will have a strong effect on bringing more visitors to the site.
The most important suggestion made is that Product quality, Reliable information and confidence
about product/service, System security, Functionality, Door to Door delivery, and Timely delivery
are having high impact on customer satisfactions and directly and indirectly effects the Re-
purchase intentions, Site revisit, and Word of mouth.

352
Conclusion:
As online stores are maintaining larger data bases or cloud storages where they are storing
customers viewed products, but they are failing in understanding the customer needs and keeping
their needs into products for buying. Online store should keep the Product varieties, product lines
to attract customers and leaving them in a condition to choose which the best choice is. After the
effect of demonetisation in India, every transactions becomes digital. So there is more number of
transactions being done through digital platform and it will affect the payment of online store
because of too many transactions at a time. So online store should have transaction facilities
securely and easily for having the name ‘Error free transaction’ attribute. Online store should
highly concentrate on Follow up services, Timely delivery, Navigation of the web or app,
Responsiveness of service personnel, Response time of the system (Web or App).
References :
Spiros Gounaris, Sergios Dimitriadis and Vlasis Stathakoopoulas (2010), “An examination of
the effects of service quality and satisfaction on customers’ behavioral intentions in e-
shopping”, Journal of services marketing, 24/2, 142-156.
Tony Ahn, Seewon Ryu (2204), “The impact of online and offline features on the user
acceptance on internet shopping malls”, electronic commerce research and applications 3, 405-
420.
Brown, I. and Jayakody, R. (2008), “B2C e-Commerce Success: a Test and Validation of a
Revised Conceptual Model.” The Electronic Journal Information Systems Evaluation Volume
11 Issue 3, 167 – 184
E.B. Khedkar (2015), ”Analysis of customer satisfaction during online purchase”, international
journal of research in finance and marketing (impact factor-5.230), vol 5, issue5, issn 2231-
5985.
Safa, N.S. & Von Solms, R., (2016), “Customers repurchase intention formation in e-
commerce”, South African Journal of Information Management 18(1), a712.
Khalifa, M. and Liu, V. (2007), “Online consumer retention: contingent effects of online
shopping habit and online shopping experience”, European Journal of Information Systems,
Vol. 16 No. 6, pp. 780-792
Selim Aren, Mevlüdiye Güzel, Kabaday, Lütfihak Alpkan (2013), “Factors Affecting
Repurchase Intention to Shop at the Same Website”, Procedia - Social and Behavioral
Sciences, Volume 99, Pages 536-544.
Hong-Youl Ha Siva K. Muthaly Raphaël K. Akamavi, (2010),"Alternative explanations of
online repurchasing behavioral intentions", European Journal of Marketing, Vol. 44 Iss 6 pp.
874 – 904

353
Parasuraman, A. Zeithaml, V.A., Malhorta, A. (2005). “E-S-QUAL, A Multiple-Item Scale for
Assessing Electronic and Revolution in Web Site Functionalities”, Decision Sciences, 35(3),
423-455.
Loiacono, E. T., Watson, R. T. & Goodhue, D. L. (2002). “WEBQUAL™: A Measure of Web
Site Quality,” in Evans, K. & Scheer, L. (Eds), Marketing Educators’ Conference: Marketing.
Peter Hackl & Anders H. Westlund (2000), “on structural equation modelling for customer
satisfaction measurement”, total quality management, vol 11, nos 4/5&6, pages 820-825.
Hellier, P. K., Geursen, G. M., Carr, R. A. & Rickard, J. A., (2003), “Customer Repurchase
Intention: AGeneral Structural Equation Model”, European Journal of Marketing, 37(11/12),
pp. 1762-1800.
Cronin, J. J., Brady M. K., & Hult, G. T.(2000), “ Assessing the effects of quality, value and
customer satisfaction on consumer behavioral intentions in service environments”, Journal of
Retailing, 76(2), 193-218.
Chevalier, J. A. & Mayzlin, D. (2006). “The effect of word of mouth on sales: Online book
reviews”, Journal of marketing research, 43(3), 345-354.

354
Service Quality and Attitudinal Loyalty: A Moderated Mediation Model of Customer
Satisfaction and Customer Trust
Mahesh Ramalingam , Murugan Pattusamy & Jyothi Chepur
Institute of Management Technology, Hyderabad; Australian Council for Educational Research,
New Delhi,
Introduction
The services sector is a dominant sector in India's GDP. Over the last two decades, India’s service
sector has seen rapid growth which made India become a second fastest growing service economy
in the world. The Confederation of Indian Industry (CII) and KPMG report (2016) says, service
sector in India contributes more than 60 percent to Indian economy. Hence, strategically service
industry is important to the country. Predominantly, Transport sector plays pivotal role in
promoting socio-economic development of a nation. Indeed, the progress of a country and progress
of its transport industry is complimentary to each other. However, road transport is the primary
mode of transport in India and has a greater significance due to easy accessibility, operational
flexibility and reliability. Among all modes of transport, road transport carries around 90 percent
of the total passenger traffic. However, increasing trend in vehicle ownership is declining the use
of public transport. High vehicular ownership leading to increased accidents, travel time and air
pollution. So, It is essential to ascertain what changes in public transport services will encourage
commuters to shift their mode to public transport. This service assessment is an expedient tool for
transport planners and transport operators to establish strategies and retain passengers (de Oña et
al. 2014).
The survival of service organizations depends on quality of the service they provide and how well
they satisfy the customer. Satisfied customer is always advantageous to the firm. Service quality
is one of the important components to improve superior service experience of customers and also
has been extremely studied in the area of services marketing. In order to evaluate quality in the
service industry, an academic researcher’s team, Parasuraman, Zeithaml, and Berry (1988),
designed a widely accepted multi-dimensional scale which is often called SERVQUAL.
Afterwards, several studies investigated the relationship between service quality and other
marketing constructs such as customer satisfaction and loyalty and also proved that there is a
positive relationship between them (Dabholkar, Thorpe, and Rentz 1995, Zeithaml, Parasuraman,
and Malhotra 2002, Taylor et al. 1997) . Furthermore, studies have been conducted for testing the
mediation effect of customer satisfaction on the relationship between service quality and loyalty
and confirmed as well (Mosahab, Mahamad, and Ramayah 2010, Ruben Chumpitaz and Nicholas
2007). However, today service providers are focusing mainly on relational-based approaches
rather than transaction-based approaches. Because, attracting new customers is more expensive
than retaining existing customers. Thus, managing sustainable and mutually advantageous
relationships with customers is vital for firms in order to gain competitive advantage. Loyalty is a
long-term relationship between customer and service provider and also profitable for the
organization. If a customer satisfies with the product/service most probably he repurchases the
product/service (Zeithaml, Berry, and Parasuraman 1996). But when the customer does not have
trust in the service provider, he will be dissatisfied and it may lead to discontinue his relationship

355
with the service provider. Moreover, academicians also argue that developing strong customer
loyalty depends on engendering customer trust in service provider operational abilities and service
process accuracy ((Reichheld, Markey Jr, and Hopton 2000, Stewart 2003) Therefore, Trust plays
a significant role in building and maintaining the relationships. Service quality-customer
satisfaction-loyalty is a widely researched relationship, where customer satisfaction plays a
mediation role. However, no empirical study has been conducted to test moderating role of trust
on the strength of mediated relationship between service quality & attitudinal loyalty. Hence, this
research attempts to fill this gap in the area of service quality research. Present study contends that
customer trust moderates the mediating effect of customer satisfaction on the relationship
between service quality and customer attitudinal loyalty, so that the mediating effect is
stronger when customer trust is higher.
Theoretical background and hypotheses development:
The theoretical frame work of the present study is developed based on the adaptation of the
Stimulus- Organism-Response (S-O-R) Model (Reichheld, Markey Jr, and Hopton 2000) and the
service quality literature. Reichheld, Markey Jr, and Hopton (2000) recommended that
environmental stimuli (S) lead to an emotional reaction (O) that evokes behavioral responses (R),
the S-O-R model has been app lied in various retail settings to explain the consumer decision
making process (Stewart 2003, Richard et al. 2010). Based on this notion we posit the service
quality as stimulus, they affect the emotional responses of the consumer i.e. customer satisfaction
as an organism and final actions, reactions, or responses emitted i.e. attitudinal loyalty as a
response. Previous work in this area has identified that the trust is an important element of long-
term buyer-seller relationships in a business environment (Garbarino and Johnson 1999, Anders
Gustafsson, Michael Johnson, and Roos 2005). Moreover, trust could moderate risk in the buying
process. The moderating role of trust has been focused on in studies of interpersonal behavior in
organizations and marketing settings (Rousseau et al. 1998, Andaleeb 1995). The moderating role
of trust in shaping causal relationships is the characteristic of studies of interpersonal behavior in
organizations and social settings, as found in both micro-organizational behavior and social
psychology (Robinson and Rousseau 1994). Finally, this study therefore develops and empirically
tests an integrated model that investigates the effects of the service quality on attitudinal loyalty
mediated by customer satisfaction and moderated by customer trust (Hayes 2013). Based on the
above mentioned key theoretical notions we propose the following hypotheses:
H1. Customer satisfaction mediates the relationship between service quality and attitudinal loyalty.
H2. Customer Trust will moderate the strength of the mediated relationships between service
quality and attitudinal loyalty via customer satisfaction such that the mediated relationship will be
stronger under high customer trust than low customer trust.

356
Theoretical Model: Moderated mediation model on customer trust
Methods
Data collection
An on-site survey was conducted at the central bus stand of the state capital Tamilnadu in India on
both weekdays and weekends using the purposive sampling technique. This technique was
employed, as the population of public transit passengers was not available (Lai and Chen 2011).
Of the 800 questionnaires that were distributed, 631 were returned; that accounted a response rate
of 78.88%.
Measures
Service quality (22 items) was measured in the context of public transport corporation by
adopting the SERVQUAL scale (Parasuraman, Zeithaml, and Berry 1988, Wen, Lan, and Cheng
2005) and this scale was anchored between 1= strongly disagree to 7 = strongly agree.
Customer Satisfaction (four items) measures were adopted from Brady and Cronin (2001). In
each case, 10-point bipolar scales (eg. happy/unhappy) were employed. The scale used to
measure customer trust (three item) was based on the scale proposed by (Doney and Cannon 1997)
and Wen, Lan, and Cheng (2005) with subsequent modification and the scale was anchored
between 1= strongly disagree to 7 = strongly agree. Attitudinal loyalty (four items) was measured
using behavioural intention of the respondents (Brady and Cronin 2001) and the scale was
anchored between 1= very unlikely to 7 = very likely.
Control variables
In the present study we have used gender, age, travel frequency and corporate image as a
control variables. PROCESS can facilitate to estimate the indirect effects using bootstrap
samples (5000 resamples) using 95 % confidence interval.
Data analysis and results
We have tested the second stage moderated mediation model using PROCESS macro (Hayes 2012,
2013). PROCESS macro is a computational tool used to simultaneously estimate the mediation
and moderation models. In the present study second stage moderated mediation model was used
Service
Quality
Customer
Satisfaction
Attitudinal
Loyalty
Customer
Trust

357
(MODEL 14). The overall moderated mediation model was assessed using the index of moderated
mediation (Hayes 2013). The descriptive statistics and correlations for this study variable are
presented in table 1.
Table 1
Descriptives and correlations
Variables Mean S.D. 1 2 3 4 5 6 7
1. Gender - - 1
2. Age 24.56 5.19 -.235** 1
3. Travel Frequency 3.55 3.07 -.158** .554** 1
4. Corporate Image 5.13 1.40 .026 .043 .057 1
5. Service Quality 6.05 3.61 -.038 .089* .057 .542** 1
6. Customer Trust 4.23 1.15 -.048 .094* .122** .513** .653** 1
7. Attitudinal Loyalty 4.35 1.08 -.069 .117** .105** .525** .599** .607** 1
Note: ** p<0.01, *p<0.05, S.D.-Standard Deviation.
Table 2
Moderated mediation analysis with trust as a moderator between customer satisfaction and
attitudinal loyalty
Prediction of Customer satisfaction (Mediator)
Predictor B Se t-values P value LLCI ULCI
Service Quality 0.08 0.01 8.56 0.00 0.06 0.10
Age 0.03 0.04 0.76 0.45 -0.04 0.10
Gender -0.35 0.34 -1.03 0.30 -1.02 0.32
Corporate Image 0.63 0.03 19.30 0.00 0.57 0.70
Travel Frequency 0.08 0.06 1.34 0.18 -0.04 0.20
Model Summary: R square=0.59, f value=181.21, p<0.001
Prediction of Attitudinal Loyalty (Dependent Variable)
Predictor B SE t-values P value LLCI ULCI
Age 0.03 0.03 0.89 0.370 -0.03 0.08
Gender -0.28 0.27 -1.03 0.300 -0.81 0.25
Travel Frequency 0.00 0.05 0.03 0.980 -0.09 0.10
Corporate Image 0.07 0.03 1.98 0.048 0.00 0.13
Customer Satisfaction 0.20 0.03 6.66 0.000 0.13 0.27
Service Quality 0.05 0.01 5.32 0.000 0.03 0.07
Customer Trust 0.12 0.12 0.96 0.340 -0.13 0.36
Customer satisfaction × Customer Trust 0.01 0.01 1.99 0.047 0.00 0.02
Model Summary: R square=0.49, f value=77.68, p<0.001 Note: B- Unstandardized regression weight, SE- Standard error, LLCL- Lower Limit Confidence Interval,
ULCL- Upper Limit Confidence Interval.
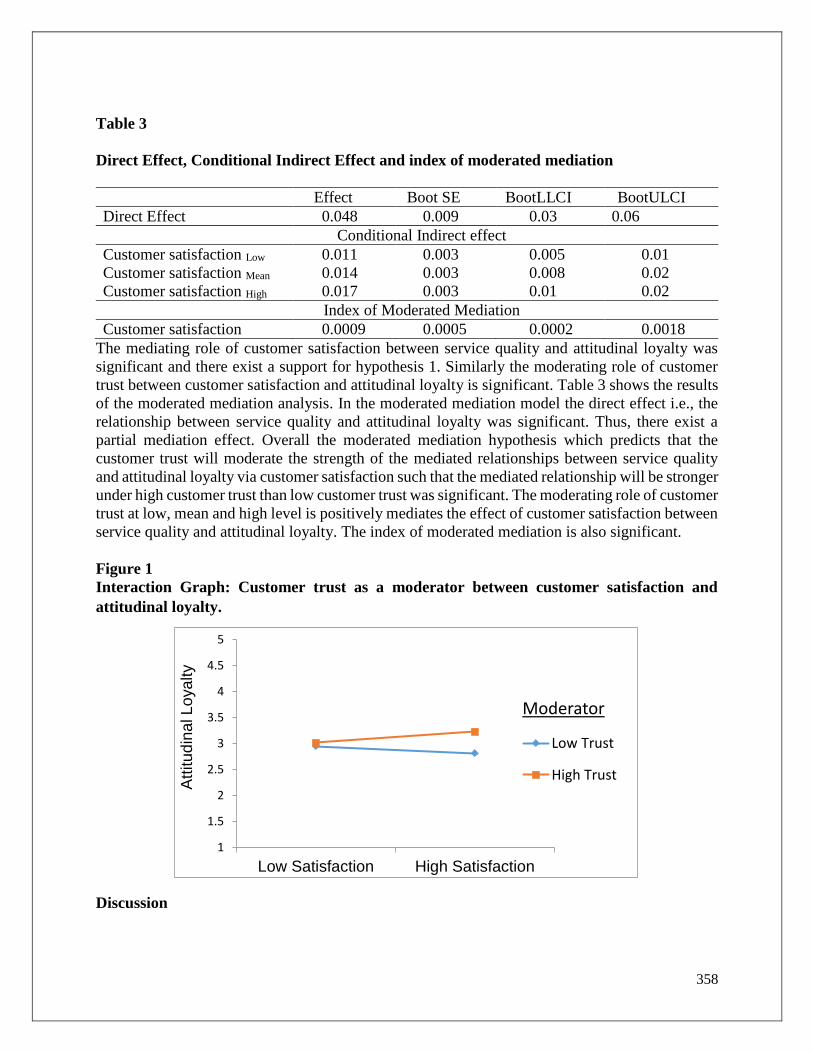
358
Table 3
Direct Effect, Conditional Indirect Effect and index of moderated mediation
Effect Boot SE BootLLCI BootULCI
Direct Effect 0.048 0.009 0.03 0.06
Conditional Indirect effect
Customer satisfaction Low 0.011 0.003 0.005 0.01
Customer satisfaction Mean 0.014 0.003 0.008 0.02
Customer satisfaction High 0.017 0.003 0.01 0.02
Index of Moderated Mediation
Customer satisfaction 0.0009 0.0005 0.0002 0.0018
The mediating role of customer satisfaction between service quality and attitudinal loyalty was
significant and there exist a support for hypothesis 1. Similarly the moderating role of customer
trust between customer satisfaction and attitudinal loyalty is significant. Table 3 shows the results
of the moderated mediation analysis. In the moderated mediation model the direct effect i.e., the
relationship between service quality and attitudinal loyalty was significant. Thus, there exist a
partial mediation effect. Overall the moderated mediation hypothesis which predicts that the
customer trust will moderate the strength of the mediated relationships between service quality
and attitudinal loyalty via customer satisfaction such that the mediated relationship will be stronger
under high customer trust than low customer trust was significant. The moderating role of customer
trust at low, mean and high level is positively mediates the effect of customer satisfaction between
service quality and attitudinal loyalty. The index of moderated mediation is also significant.
Figure 1
Interaction Graph: Customer trust as a moderator between customer satisfaction and
attitudinal loyalty.
Discussion
1
1.5
2
2.5
3
3.5
4
4.5
5
Low Satisfaction High Satisfaction
Att
itu
din
al L
oya
lty
Moderator
Low Trust
High Trust
359
In the present study we have tested the moderated mediation model on customer trust. In this model
we expected that the customer trust will moderate the mediating role of customer satisfaction
between service quality and attitudinal loyalty. The results indicate that our assumptions hold true
and consistent with the SOR model.
It is clear that when the customers are satisfied with the service quality of the transport services it
will lead to regular use of transport services. Further this relationship is strengthened by building
the customer trust. Based on this study result we implicate that customer trust is an important factor
which will strengthen the mediational relationship of customer satisfaction between service quality
and attitudinal loyalty. In this study we have found a partial mediation effect between service
quality and attitudinal loyalty through customer satisfaction. Future studies are needed to further
include the mediators between service quality and customer satisfaction or between customer
satisfaction and attitudinal loyalty. Similarly future studies can include the other moderators such
as image, commitment and switching cost as the moderators between service quality and customer
satisfaction and attitudinal loyalty.
References:
Andaleeb, Syed Saad. 1995. "Dependence relations and the moderating role of trust: implications
for behavioral intentions in marketing channels." International Journal of Research in
Marketing 12 (2):157-172. doi: http://dx.doi.org/10.1016/0167-8116(94)00020-O.
Anders Gustafsson, Michael D. Johnson, and Inger Roos. 2005. "The Effects of Customer
Satisfaction, Relationship Commitment Dimensions, and Triggers on Customer
Retention." Journal of Marketing 69 (4):210-218. doi: 10.1509/jmkg.2005.69.4.210.
Brady, M. K., and J. J. Cronin. 2001. "Customer Orientation: Effects on Customer Service
Perceptions and Outcome Behaviors." Journal of Service Research 3 (3):241-251. doi:
10.1177/109467050133005.
Dabholkar, Pratibha A., Dayle I. Thorpe, and Joseph O. Rentz. 1995. "A Measure of Service
Quality for Retail Stores: Scale Development and Validation." Journal of the Academy of
Marketing Science 24 (1):3-16. doi: 10.1177/009207039602400101.
de Oña, Juan, Rocio de Oña, Laura Eboli, and Gabriella Mazzulla. 2014. "Heterogeneity in
Perceptions of Service Quality Among Groups of Railway Passengers." International
Journal of Sustainable Transportation:null-null. doi: 10.1080/15568318.2013.849318.
Doney, Patricia M., and Joseph P. Cannon. 1997. "An Examination of the Nature of Trust in Buyer-
Seller Relationships." Journal of Marketing 61 (2):35-51. doi: 10.2307/1251829.
Garbarino, Ellen, and Mark S. Johnson. 1999. "The Different Roles of Satisfaction, Trust, and
Commitment in Customer Relationships." Journal of Marketing 63 (2):70-87. doi:
10.2307/1251946.
Hayes, Andrew F. 2012. "PROCESS: A versatile computational tool for observed variable
mediation, moderation, and conditional process modeling [White paper]."
Hayes, Andrew F. 2013. Introduction to mediation, moderation, and conditional process analysis:
A regression-based approach. New York: Guilford Press.

360
Lai, Wen-Tai, and Ching-Fu Chen. 2011. "Behavioral intentions of public transit passengers—The
roles of service quality, perceived value, satisfaction and involvement." Transport Policy
18 (2):318-325. doi: 10.1016/j.tranpol.2010.09.003.
Mosahab, Rahim, Osman Mahamad, and T Ramayah. 2010. "Service quality, customer satisfaction
and loyalty: A test of mediation." International Business Research 3 (4):p72.
Parasuraman, A., Valarie A. Zeithaml, and Leonard L. Berry. 1988. "SERVQUAL: A multiple-
item scale for measuring consumer perceptions of service quality." Journal of Retailing 64
(1):12-40.
Reichheld, Frederick F, Robert G Markey Jr, and Christopher Hopton. 2000. "The loyalty effect-
the relationship between loyalty and profits." European business journal 12 (3):134.
Richard, Marie-Odile, Jean-Charles Chebat, Zhiyong Yang, and Sanjay Putrevu. 2010. "A
proposed model of online consumer behavior: Assessing the role of gender." Journal of
Business Research 63 (9–10):926-934. doi: https://doi.org/10.1016/j.jbusres.2009.02.027.
Robinson, Sandra L, and Denise M Rousseau. 1994. "Violating the psychological contract: Not
the exception but the norm." Journal of organizational behavior 15 (3):245-259.
Rousseau, Denise M, Sim B Sitkin, Ronald S Burt, and Colin Camerer. 1998. "Not so different
after all: A cross-discipline view of trust." Academy of management review 23 (3):393-
404.
Ruben Chumpitaz, Caceres, and G. Paparoidamis Nicholas. 2007. "Service quality, relationship
satisfaction, trust, commitment and business‐to‐business loyalty." European Journal of
Marketing 41 (7/8):836-867. doi: 10.1108/03090560710752429.
Stewart, Katherine J. 2003. "Trust Transfer on the World Wide Web." Organization Science 14
(1):5-17. doi: 10.1287/orsc.14.1.5.12810.
Taylor, Steven A., Joel D. Nicholson, Jorge Milan, and Ramiro Valencia Martinez. 1997.
"Assessing the Roles of Service Quality and Customer Satisfaction in the Formation of the
Purchase Intentions of Mexican Consumers." Journal of Marketing Theory and Practice 5
(1):78-90. doi: 10.2307/40470977.
Wen, Chieh Hua, Lawrence Lan, and Hsiu Ling Cheng. 2005. "Structural Equation Modeling to
Determine Passenger Loyalty Toward Intercity Bus Services." Transportation Research
Record: Journal of the Transportation Research Board 1927 (-1):249-255. doi:
10.3141/1927-28.
Zeithaml, Valarie A, Arun Parasuraman, and Arvind Malhotra. 2002. "Service quality delivery
through web sites: a critical review of extant knowledge." Journal of the academy of
marketing science 30 (4):362-375.
Zeithaml, Valarie A., Leonard L. Berry, and A. Parasuraman. 1996. "The Behavioral
Consequences of Service Quality." Journal of Marketing 60 (2):31-46. doi:
10.2307/1251929.

361
Consumer Dissatisfaction, Causal Attributions and Complaining Behaviour: An investigation
among Indian Consumers’
Srinivasan.K
Jansons School of Business, Coimbatore
The way the consumers respond to dissatisfaction is widely referred as Consumer
Complaining Behaviour (CCB). Jaccoby & Jaccard10 define CCB as an action taken by an
individual, which involves communicating something negative regarding a product or service to
either the firm manufacturing or marketing the product or service or to some third party entity.
Consumer complaining behaviour is influenced by many factors that include demographic and
psychographic profile of consumers, nature and importance of the product, nature of the complaint
situation and previous experience in purchase or complaining.
One of the factors related to the dissatisfaction experience is the causal attribution by the
consumers. Attribution Theory views people as rational information processors and their actions
are influenced by their causal inferences. Weiner11 classified the causes by their causal dimensions.
Stability, Locus and Controllability are the dimensions identified by him. Stability classifies the
nature of the cause in terms of temporariness and permanency. The second dimension Locus is
about whether the location of the cause is in consumer or seller/manufacturer. The third
dimension, Controllability, relates to, if the product failure is under the control of the
manufacturer. Folkes12 has shown the Attribution theory to be useful in explaining the type of
redress behaviour the customer prefers. The attribution theory suggests that, dissatisfied customers
who feel the cause as stable and controllable, are more likely to exit and engage in negative word-
of-mouth.
The effect of causal attributions on complaining behaviour was studied as part of a
comprehensive study on complaining behaviour of Indian consumers. Among the three
dimensions, controllability had the highest mean score followed by stability and locus. Since
factors like stability, controllability and locus are likely to influence CCB, the study analysed the
relationships between these factors and responses to dissatisfaction i.e. between Voice, Negative
word-of-mouth, Exit and Post-dissatisfaction loyalty. Relevant hypotheses were formed and tested
for statistical significance.
Since stability of problem may be a sure cause of complaining, the relationship between
stability and consumer responses to dissatisfaction was analysed. The results indicated that those
with low and high scores are more likely to voice their dissatisfaction than those with medium
scores. As many of the respondents had medium scores on stability it is inferred that they were not
sure of stability or recurrence of the problem. The negative word-of-mouth behaviour among the
low, medium and high scorers of stability dimension was analysed and it was found that negative
10Jacoby, J and Jaccard, J.J.(1981) “The Sources, Meaning and validity of Consumer Complaining behaviour; A
psychological review”, Journal of Retailing, Vol.57, No.3: 4-24 11 Weiner, Bernard (1980b), “A Cognitive (Attribution)-Emotion-Action Model of Motivated Behaviour: An
Analysis of Judgments of Help-Giving,” Journal of Personality and Social Psychology.39 (February), 186-200 12 Folkes V.S(1984), “Consumer Reactions to Product failure: An Attributional Approach”, Journal of Consumer
Research, 10, 398-409
362
word-of-mouth behaviour does not depend upon the stability of problem. The relationship between
stability of problem and exit behaviour was studied and the results show that exit behaviour is
independent of the stability of problem.
The post-dissatisfaction loyalty behaviour among the respondents in low, medium and high
scorers of stability of problem was analysed and the results showed that post-dissatisfaction loyalty
is not influenced by stability of the problem. Hence it can be concluded that post dissatisfaction
behaviours, voice, negative word-of-mouth, exit and loyalty are not significantly influenced by
stability of the problem.
The relationship between controllability attribution and consumer responses was studied.
The voice behaviour is independent of controllability attribution. The N-WoM behaviour is also
independent of control that the dealers or manufacturers have in the products’ quality. But, there
is a very strong relationship between the high scorers of controllability and exit behaviour. Hence
it can be inferred that exit behaviour of consumers depends on the extent of control that the seller
or manufacturer has in delivering the right product. Higher the controllability higher is the exit
behavior. Loyalty behaviour was found to be independent of controllability attribution to
dissatisfaction.
The study analysed the responses to dissatisfaction among the respondents in low, medium
and high scorers in locus attribution. It was inferred that locus attribution or location of problem
in the opinion of consumer and voice behaviour are independent. The locus attribution does not
influence the N-WoM behavior also. Exit behaviour of consumers was also found to be
independent of location of problem (responsibility for the dissatisfaction). Post-dissatisfaction
loyalty behaviour and location of responsibility of the problem are dependent. When the location
of the problem is clearly known; be it with either consumer or seller the consumers move away
from the existing products. So the location the problem or locus attribution influences the loyalty
behaviour but does not influence voice, N-WoM and exit behaviour significantly.
Attributions & Expected relief on Complaining:
When consumers complain to the seller or company or a third party agency, they expect
the problem to be solved through some relief. Consumers generally expect four types of remedial
measures i.e., Refund, Replacement, Repair and Apology. The study found that a majority of the
consumers want the problem to be solved through rectifying the defective product followed by
replacement of the product. Attributions to dissatisfaction like stability, controllability, and locus
are likely to influence consumer expectations from seller or manufacturers as remedy to their
dissatisfaction.
The study examined the association between stability of the problem and consumer
expectations on complaining and the results indicated that the expectations on complaining are
independent of stability of the problem. It was also inferred that expectations on complaining are
independent of controllability attributions. But in case of locus attribution, among medium scorers
there is more likelihood of asking for repair and replacement, whereas in low scorers, there is more
likelihood of apology, refund and replacement. Hence expectations on complaining differ based

363
on the locus attribution or location of the problem of dissatisfaction. Among the three attribution
dimensions stability and controllability do not have significant influence on expectations on
complaining whereas locus dimension influences expectations significantly.
Thus, the paper describes the dissatisfaction experiences, consumer responses to
dissatisfaction, causal attributions and their influence on complaining & expected relief.
364
Green Purchase Behavior (GPB): Integrating New Constructs in a New Model
Sarita Uniyal & Subhadip
Indian Institute of Management, Udaipur
Introduction
The phenomenon ‘Green consumption’ is related to the environmental impact of purchasing,
using, and disposing of ‘green’ products or services by the consumers (Moisander, 2007). A A
‘green’ or eco-friendly product is one which meets up consumers’ expectation without harming
the environment (Shamdasami, Chon-Lin and Richmont, 1993). Such products have high
environment superiority, with low environmental impact. Marketers are increasingly
emphasizing on integrating environmental sustainability practices at all stages of production and
delivery of services and goods (Veleva and Ellenbecker, 2001). Although the number of
consumers of green products has increased in the last few years, there is yet a little evidence to
suggest that purchase intention of green products has increased (Bamberg, 2003; Kilbourne and
Beckmann, 1998; Nordlund and Garvill, 2002). Despite positive attitude of customers towards
green products and environmental concern, market share of green products remains restricted to
1-3% of the market (Bray, Johns and Killburn, 2011). Several issues exist regarding this attitude
– behaviour gap. Thus, it is important to examine the reasons for weaker consumer attitudes
towards green products and the causes of the same. Addressing this issue may prove beneficial
for the marketers through the identification of the motivating factors behind consumers’ attitudes
and behavior towards green products.
Review of Literature
‘Green purchasing behavior’ (GPB) is the purchase of environment friendly products (Chan,
2001). It is measured as green purchase behaviour and intention. GPB is influenced by green
purchasing attitudes that in turn are influenced by factor internal and external to the consumer.
The two prominent theories that have provided the backbone of GPB are the theory of reasoned
action (TRA) (Ajzen and Fishbein, 1980) and the theory of planned behaviour (TPB) (Ajzen,
1985). Some of the studies discussed about the hierarchical values–beliefs–attitude–behaviour
models. TRA and TPB states that behaviour of individual are decided social norms, individual
attitudes and perceived behavioural control (Ajzen, 1988).
Researchers have discussed TPB in the context of consumer attitudes, purchase intentions and
buying behaviour of green products (Smith and Paladino, 2010; Arvola et al., 2008; Tarkiainen
and Sundqvist, 2005; Tanner and Kast, 2003). The studies have found TPB constructs to enhance
the predictability of purchase intentions of green products (Jebarajakirthy and Lobo, 2014). TPB
has also been used as a conceptual framework to various GPB situations such as organic food
choice (Dean et al., 2012; Paul and Rana, 2012; Nuttavuthisit and Thogersen, 2017) recycling
behaviour (Davis et al., 2009; Davis, Phillips, Read and Iida, 2006; Oreg and Katz-Gerro, 2006)
and green product purchase intentions (Chen and Tung, 2014; Zhou et al., 2013; Chen and Peng,
2012).

365
Research Gap
However, researchers have observed the attitude–behaviour gap on multiple occasions (Tanner
and Kast, 2003; Vermeir and Verbeke, 2008; Webster, 1975; Wheale and Hinton, 2007) in the
context GPB. Thus, the predictive ability of attitudes remains debatable in the context of
environmental consumerism as studies show that environmental concern or attitudinal variables
fail to capture green purchase behaviour (Bamberg, 2003; Hines et al., 1987; Schultz et al., 1995;
Scott and Willis, 1994; Tanner, 1999). There may be two reasons behind this. First, the
researchers in GPB may have not covered enough relevant variables that influence consumer
attitudes and purchase intentions. Second, the problem may be originating in the wrong choice
of model. In the present study, we address both the issues. First, we model green product attitudes
as the consequence of norms and perceived behavioral control rather than considering it at the
same level as done by most researchers. Second, we include personal norms as influencer of
green product attitudes. Personal norms have been found to have a positive effect on behavior in
the domain of GPB (Jansson et al., 2010; Ha and Janda, 2012). Strong personal norms may even
increase the probability of changing consumption patterns over time to environmentally friendlier
behavior. Interestingly, a recent study on the effect personal norms on buying organic food found
a temporally increasing effect of personal norms on green purchasing behavior (Thøgersen and
Ölander, 2006). This emphasizes our point that norms lead to lead to attitudes lead to behavior.
Thus, we not only include personal norms in our study, but also model attitudes as an outcome
of norms and behavioral control. Third, we include environmental concern as a moderator of the
effect of norms and behavioral control on green product attitudes. Environment concern (EC) of
the consumer “takes into account the public consequences of his or her private consumption and
attempts to use his or her purchasing power to bring about social change” (Moisander, 2007).
Thereby, while EC may have a direct effect on GP attitudes, it may also have a moderating effect
on the norms relating to attitudes. Integrating the arguments, we develop the following study
hypotheses:
H1: Subjective norm of the consumer will have positive effect on attitude towards green
products
H2: Perceived Behavioral Control of the consumer will have positive effect on attitude towards
green products
H3: Personal Norm of the consumer will have positive effect on attitude towards green
products
H4: Attitude towards green products will have positive effect on purchase intention of green
products
H5: Environmental Concern moderates Effect of Subjective Norms on attitude towards green
products
H6: Environmental Concern moderates Effect of Perceived Behavioral Control on attitude
towards green products

366
H7: Environmental Concern moderates Effect of Personal Norms on attitude towards green
products
Methodology
The study questionnaire consisted items related to six constructs of 30 items that were adopted
from established scales. These were Subjective Norms and Perceived Behavioral Control (Paul,
Modi and Patel, 2016); Personal Norms (Khare, 2015); GP Attitudes (Han and Yoon, 2015);
Purchase Intentions (Wee et al., 2014); Environmental Concerns (Koenig-Lewis et al., 2014). All
items were measured on 5 point Likert scales (strongly agree-strongly disagree). The questionnaire
also had questions on basic demographics. The survey was conducted in a large metro city in India
using mall intercept method. Random sampling was used to select the malls (three) and systematic
sampling was used to intercept and interview the respondents (every 5th). The sampling method
led to a usable sample size of 200. Data analysis was conducted with Smart PLS 2.3 since a) we
had a moderating variable, and b) the sample size was small.
Results
The exploratory factor analysis yielded a six-factor solution with no cross loadings, thereby
implying a stable factor structure. This was followed by confirmatory factor analysis where the
reliability and the validity of the study constructs were ascertained. This was followed by the path
analysis where the hypothesized relations were tested. All the main effects were found significant.
Thereby, we found a significant effect Personal Norms, Subjective Norms and Perceived
Behavioral Control on Attitudes towards green products. A significant effect of attitudes was
observed on green purchase intentions. However, the moderation effect of environmental concerns
was only observed on the PBC-Green Product Attitude relationship.
Discussions
Findings from the present study support theory of planned behaviour (Ajzen 1985). However, the
novelty of the finding lies in the inclusion of variables beyond the domain of TPB. The significant
effect of personal norms on green product attitude support existing thoughts (Ha and Janda, 2012).
In addition, it also notes the need for inclusion of other theories such as self-regulation theory in
the context of GPB. The other contribution of the study lies in the modeling of attitudes as the
mediators between norms and purchase intention. This goes against existing thoughts where
attitude is considered at the same level as norms. Lastly, the study found a moderating impact of
environmental concern that was partial, but nevertheless, present the significant direct effect of
environmental concern underlying the need for inclusion of more variables in the GPB context. To
summarize, the present study has a novel contribution within its own limitation and provides
relevant directions for the academician and practitioners.

367
I care but I don’t buy –Analyzing factors that inhibit consumers from purchasing
environmentally friendly appliances
Gauri Joshi & Pratima Sheorey
Symbiosis centre for management and human resource development, Pune
Abstract – In the recent years there has been plenty of focus on understanding the strategies on
how mankind could contribute in reducing the environmental deterioration and lead a sustainable
life. Consumer today is flooded with options to choose products causing minimum damage to the
environment. A great number of policies are designed to promote sustainable products. However
despite the product choices, the policies and heightened consumer interest in sustainable products,
there is still dearth of consumers demanding environmentally friendly products. The consumer’s
interest in conserving the environment doesn’t get translated in their purchase behavior. Numerous
studies exist from the developed countries in understanding this attitude-behaviour gap, but there
are not many studies from the emerging economies like India in understanding this gap. This paper
analyses the factors that inhibit consumers from purchasing environmentally friendly products,
with special focus on home appliances.
Introduction
The last fifty years have been worst from planet Earth’s perspective. Our planet not only faced the
burden of increasing population but also the ever increasing pollution , irreversible loss of bio-
diversity and the damages brought about by climate change (IPCC, 2015). The major contributors
to climate change are the emissions occurring as a result of green house gases and carbon-di-oxide.
The ill-effects of climate change can be controlled if these emissions are controlled. At macro level
there are various Government initiatives to curb the emissions resulting from industries, however
at micro level which is at individual level these emissions can be controlled by households - by
reducing the number and intensity of carbon-di-oxide emissions and by increasing the usage of
environmentally friendly products (Schubert & Stadelmann, 2015). The consumption of green
products could be a way to minimize the environmental impact (Elliott, 2013).
Green products, as environmentally friendly products are called, are thought as the ones that are
produced with concern for the physical environment: air, water, and land (Shrum, McCarty, &
Lowrey, 1995). Green products as typically durable, non toxic, made of recycled materials, or
minimally packaged. No product can claim to be completely green, for they all use up energy and
resources and create by-products and emissions during their manufacture, transport to warehouses
and stores, usage, and eventual disposal. The term green is relative, describing products with less
impact on the environment than their alternatives (Ottman, 1998).
The problem as it seems, is not only in the awareness an individual has on the depleting condition
of the earth, but also in the realization that each one of us can contribute in lessening the impact
of increased emissions through green purchases. Consumers are motivated to buy green products
if they feel that purchasing those products helps in protecting the environment (Haytko &
Matulich, 2008). The greatest challenge encountered here is getting individuals to act in
environmentally friendly manner in their day to day life, involving them in making
environmentally friendly purchases, encouraging them to recycle products and to reduce their
purchase of non recyclable goods.
Purchasing or Buying as (Enis, 1974) puts it is “a process, which through inputs and their use
through process and actions lead to satisfaction of needs and wants”. Purchasing satisfies a

368
particular need or want of the consumer. Given such circumstances what does green buying or
green purchasing refer to? Is it just a need to buy just environmentally friendly products? Or need
to contribute towards building a better planet? Or need to have the product that would benefit self
with its green attributes and at the same time have a minimum impact on the environment? Hence
determining the underlying intention of what the consumer wishes to communicate to the world is
important in order to understand the green purchase behaviour. Intentions are assumed to be
predecessors of actual behaviour (Ajzen, 1991). It is assumed that intentions control the
motivational factors that influence the decision making process (Ramayah, Lee, & Mohamad,
2010). Purchase intention is a critical factor to predict consumer behaviour (Fishbein & Ajzen,
1975). In some cases consumer’s intention has been used as a proxy for actual behaviour (Follows
& Jobber, 2000). Purchase intention could also be thought of as a kind of decision-making that
studies the reason to buy a particular brand by consumer (Shah, Aziz, Jaffari, Waris, Fatima, &
Sherazi., 2012). The definition of purchase intention as put forth by (Fishbein & Ajzen, 1975) is
an individual’s willingness or readiness to purchase certain product or service. Green purchase
intention would be the willingness or readiness to purchase environmentally friendly products or
services. Different perspectives like willingness to pay for green products (Biswas & Roy, 2015),
environmental concern (Cowan & Kinley, 2014) of consumers, consumer’s perception towards
effectiveness of green practices (Han, Hsu, & Lee, 2009) (Kim, Palakurthi, & Hancer, 2012) have
all been studied to understand consumer’s green purchase intentions. In most of the cases intention
promotes buying. In this case green purchase intention should ideally result in green purchase
behaviour. There have been multiple studies in exploring the consumers green purchase intentions.
Research done by (Joshi & Zillur, 2016) gives an overview of studies done on understanding green
purchase behavior of the consumer from 2000 to 2014. Another study (Liobikiene & Bernatoniene,
2017) elaborates the studies done on green purchase behavior with special reference to green
cosmetic purchase behavior from 2011 to 2017. However both these studies focus on the
determinants of green purchase behavior and none on the barriers that hinder the green purchase
behavior of the consumers. The research on studying the inhibitors towards green purchase
behavior is scant (Carrete, Castaño, Felix, & Centeno, 2012). Understanding the barriers to green
purchase behavior can enable the marketers to develop strategies and address those barriers.
Methodology- Research design
This research paper studies the factors that inhibit consumers from purchasing environmentally
friendly appliances in the city of Pune in India. The research is based on a survey administered to
300 respondents across different areas in the Pune city limits. Simple random sampling method
was used to administer the questionnaire. The questionnaire was administered online and in-person
to the respondents. Measurement scales were adapted from previous studies in this field. Each
scale comprised a set of statements presented in Likert-type format with a five-point scale to
capture the extent to which respondents agree or disagree with the statements in the questionnaire.
The rationale to use a five point Likert scale is that individuals who have had education from grade
1 to 5 are used to thinking and evaluating things in terms of that range (Mejovšek, 2003, p. 42).
The final score for each of the measurement scales is the average of the scores on the items
included in the scale. The magnitude of each measurement against the green purchase intention
was measured and a model to study the barriers to purchase environmentally friendly appliances
was developed. The measurement scales that were adapted are the perceived product risks scale
(Chen.Y.S. & Chang, 2012), Skepticism towards green claims (Mohr, Eroglu, & Ellen, 1998),

369
Price sensitivity, Subjective norm (Ajzen & Fishbein, 1980), Perceived personal inconvenience.
All these measures were evaluated against the scale to measure green purchase intent.
The green purchase decision of the consumer is based either on the compromise they need to make
while selecting a green product or on the confidence they have in the green products (Peattie,
2001). Due to increasing competition some companies try to exaggerate their product attributes as
a result they make unsubstantiated false claims (Carlson, Stephen, & Kangun, 1993), such repeated
false claims could be attributed to consumer’s backlash towards green products as they are
constantly been mislead. This results in consumers becoming skeptical towards environmental
claims. This has been proved by research from countries like the USA, Peoples Republic of China
that consumers are skeptical about environmental claims made by the company (Chan & Lau,
2004). Such kind of Skeptical behaviour thereby reduces the consumer’s intention to purchase
green products. The present research framework proposes to study, the impact of consumer’s
skepticism toward green purchase intent and thereby green purchase behaviour.
Following skepticism towards environmental claims another factor which acts as hurdle between
consumer’s green purchase intent and actual green purchase is the perceived product risk. The
decision to purchase a product depends on the risk associated with the product viz the product
could be faulty, the product would not work, it will not be environmentally friendly etc (Murphy
& Enis, 1986). As mentioned earlier consumers like to maximize their utility while maintaining
the risk associated with the product at the minimum. Hence the proposed model tries to study the
impact of perceived product quality on the green purchase intent of the consumer.
Consumers always perform the cost benefit analysis prior to purchasing any product and especially
when it is a green product (Gupta & Ogden, 2009). Price is considered to be one of the biggest
barriers of green purchase behaviour (Bonini & Oppenheim, 2008). Consumer’s reaction to
increase or decrease in price has a great impact on his purchase decision. The proposed research
tries to study the impact of price sensitivity on the green purchase intent of the consumer.
Consumer’s decision to purchase (or not purchase) is dependent on the perceived social pressure,
or subjective norms. Subjective norms are the individual’s perception of the social pressure from
others who are important to him (for instance his family, friend circle etc) (Eckhardt, 2009). It is
important to study the impact of subjective norm as the consumer bases his decision to purchase
or not purchase a green product on the opinion of the people who matter him the most and if those
people approve (not approve) buying green products it will pass on to the consumer willing to
make a green purchase. Hence the proposed model tries to study impact of subjective norm on
green purchase intent of the consumer. The green purchase decision also requires the consumer
to take extra effort and look out for green products. Hence this paper also studies the impact of
perceived personal inconvenience on consumer’s decision to purchase green products.
Limitations- This study takes into consideration the barriers from the literature and designs a
framework around them, however in reality there could be some other barriers arising out of
consumer’s changing lifestyle. The study takes into account the barriers from an individual’s
perspective and not from the policy maker’s perspective. The future studies could focus on
understanding the barriers from policy maker’s perspective.
370
Demystifying the Marketing Actions for Dying Art and Culture
Swati Sisodia, Ashish S. Galande & Seshadri .D.V. R
Indian School of Business, Hyderabad
Due to the advent of modern technology and changing taste of consumers there is a need to fill a
critical vacuum in the marketing space for dying art and culture. For example, there are various
organisations/ NGO’s that are working to revive the dying arts (Garcia, 2016; The Hindu, 2017; The
Times of India, 2014). Paramparik Karigar and Best hands are some of the names. Not only this, even
the Government is making conscious efforts in this direction. Govt. of Telangana has identified a list
of 62 dying arts and roping in National School of Drama, New Delhi to preserve the cultural heritage
and promote it across the country. While consumers do appreciate the craftsmanship, there is little
which is done to make the art and craft accessible to them.
Artisans themselves are limited to the knowledge and making of the related art, and do not have formal
training to market their products. As a result of which there are a dime a dozen arts which are dying as
there are not enough takers for it. Another reason for extinction of arts is that it does not provide enough
employability and scalability to the individual pursuing it (Rana, 2013). These collective reasons are
snowballing and leading to the extinction of many art forms.
In the book titled “Nurturing Global leaders of tomorrow- An inclusive Learning Model (SKMSVM)
shows the way” the authors suggest there could be school with dual education model that can help in
preserving the dying arts by including courses on dying arts and crafts (The Indian Express, 2017).
This school is a recent departure from the existing education system and it is more comprehensive. It
teaches Veda along with mainstream CBSE curriculum. More specifically, it has become the
integration of Vedic Studies with CBSE syllabus upto +2 sage. With the penetration of the internet and
growing availability of smart phones, there seem to be a potential to reach out to the large populations
located even in the remotest areas, facilitating transfer of knowledge seamlessly (Manjoo, 2017). This
leads us to propose the conceptual model in Figure 1 below. To better understand the challenges of
both consumers and craftsman, the researchers propose to understand the role of intermediaries in
overcoming the challenges faced by dying arts and thereby come up with potential solutions to
overcome it.
Advertising and Promotion are two important marketing activities required for any firm to succeed
(Mela, Gupta, & Lehmann, 1997). Since the artisans and craftsmen are too naïve in doing so, it is of
utmost requirement to facilitate these activities by a third party. Since there is very little known about
the challenges argued earlier, we propose to conduct an exhaustive qualitative study to formulate a
theoretical framework which can then form the basis of future research. We propose to conduct in
depth interviews with both the artists and potential consumers to understand the challenges and then
discover the ways to bridge the gap
In particular, we aim to:
1. Understand consumers’ preferences towards niche arts and products – Using a grounded theory
based approach (Denzin & Lincoln, 2011; Thyer, 2010), the in-depth qualitative interviews with
consumers will help us formulate propositions which can form the basis of future research.

371
2. Understand challenges faced by manufacturers of these products – In a manner similar to the
consumers, the qualitative interviews with manufacturers (eg. artists, craftsmen) will help uncover
the challenges faced by them and the role played by intermediary organizations in bridging the gap
between their dying art and their potential consumers
References
Denzin, N. K., & Lincoln, Y. S. (2011). The SAGE Handbook of Qualitative Research. SAGE.
Garcia, M. (2016, February 2). Want to Buy a Keepsake and Help an Indian Artisan at the Same
Time? These 10 Portals Can Help You. Retrieved September 25, 2017, from
https://www.thebetterindia.com/44806/artisans-india-products-handicrafts-revival/
Manjoo, F. (2017, March 15). How the Internet Is Saving Culture, Not Killing It. The New York
Times. Retrieved from https://www.nytimes.com/2017/03/15/technology/how-the-internet-is-saving-
culture-not-killing-it.html
Mela, C. F., Gupta, S., & Lehmann, D. R. (1997). The Long-Term Impact of Promotion and
Advertising on Consumer Brand Choice. Journal of Marketing Research, 34(2), 248–261.
https://doi.org/10.2307/3151862
Rana, R. (2013, April 16). Ignored And Abandoned To Starve: Five Dance Forms Slowly Dancing
Towards Extinction. Retrieved September 25, 2017, from
https://www.youthkiawaaz.com/2013/04/ignored-and-abandoned-to-starve-five-dance-forms-slowly-
dancing-towards-extinction/
The Hindu. (2017, June 10). Changing landscapes, dying crafts. The Hindu. Retrieved from
http://www.thehindu.com/todays-paper/tp-miscellaneous/tp-others/changing-landscapes-dying-
crafts/article18954017.ece
The Indian Express. (2017, September 13). Learning Veda along with formal education. Retrieved
September 25, 2017, from https://india.breakingnow.co/newindianexpress/learning-veda-along-with-
formal-education/
The Times of India. (2014, December 7). Telangana govt to rope in NSD to save dying arts - Times
of India. Retrieved September 25, 2017, from
http://timesofindia.indiatimes.com/city/hyderabad/Telangana-govt-to-rope-in-NSD-to-save-dying-
arts/articleshow/45399756.cms
Thyer, B. (2010). The Handbook of Social Work Research Methods. SAGE.
/

372
Competitor intelligence: Inferring innovation and marketing capabilities from public data for
B2B firms
Ashish S.Galande & Sudhir Voleti
Indian School of Business, Hyderabad
Abstract : In the B2B market firms not only need to focus on attracting, winning and retaining
customers, but they also need to outwit and outperform their current and potential competitors.
Competitor intelligence provides firms insights into their competitors’ current and potential
strategies and hence critical to determine the firm’s marketing strategy and product offerings. We
propose a systematic and scalable means to infer competitive intelligence from publicly available
firm data which helps in better understanding the firm’s marketing and innovation focus. We
study how this focus evolves over a 10 year period from 2005-2014 for publicly traded firms in
the B2B domain and attempt to explain how firms that have adapted the winning strategies have
consistently outperformed the others.
Research Background
A B2B firm cannot hide its strategy from its competitors. A winning strategy by any of the
B2B firms is bound to be quickly adapted by all of the competitors thereby diminishing any returns
that could be derived by how brilliantly conceived or executed it was. But at the same time it is
equally challenging for any firm in this domain to accurately determine its competitors’ strategy,
predict if it could be the winning one, and then adapt it. The firms need to identify three key
components (Fahey 1999) to describe the competitor’s strategy – (i) marketplace scope, i.e. what
product-market segments does the competitor serve, (ii) competitive posture, i.e. how does the
competitor attract, win and retain customers within these segments, and (iii) marketplace goals,
i.e. what is the competitor trying to achieve. Currently, using popular qualitative methods such as
an extensive survey (Griffin, 2012; Woodside & Baxter, 2012) or a secondary source (Lilien,
2016), a B2B firm identifies its competitor’s current strategy.
A firm’s statutory filings are the largest source of information to infer competitive
strategies. Management's perceptions, priorities, plans, goals, constraints, strategies etc are
captured to a substantial extent in a firm's strategic vocabulary used in the filings. These
considerations influence managerial decision making, which in turn drives firm behavior (in
particular, marketing and innovation focus) and thereby, firm outcomes. Such data is open-ended
and textual in nature and hence often captures qualitative aspects of information on a subject that
may otherwise be unavailable (e.g., Stern 1996). Further, within text data source types, Berger and
Iyengar (2013) find that written (compared to oral) communication leads respondents to mention
more interesting facts. However, many survey researchers and competitive intelligence analysts
avoid open-ended response data because they are costly to analyze in a systematic manner
(Lavrakas 2008, pp. 653-654). In this study, using the set of all publicly traded B2B firms we mine
for the competitor’s marketing and innovation intent from the firms' 10-K filings with the SEC.
We use this in conjunction with the firm performance data which comes from Compustat to study
the effect of inferred B2B competitor’s intelligence, identify who is the closest and best performing
B2B competitor, and how this information affects the B2B firm’s own performance.

373
Research Objectives
This research study aims to answer the following questions:
What is the competitor’s current strategy?
Who are the outperforming competitors and who are their closest followers?
How has it evolved and what is the likely future direction?
What forces within and outside the competitor are driving the change in strategy?
How does this additional information help to understand a firm’s and its competitors’
performance?
Data and Method
We use a subset of the B2B firm's strategic vocabulary which comes from the firm’s 10-K
filings in conjunction with the financial performance data which comes from Compustat over a
period of 10 years from 2005 – 2014 to empirically investigate the extent to which a B2B firm’s
marketing domain focus and innovation focus informs competitor intelligence. We then use this
to explain market outcomes beyond those explained by observed firm characteristics, behavior and
standard control factors. We leverage text analytic methods to codify and measure competitor’s
focus in the Marketing and innovation domain. We also investigate how this focus has evolved.
Since the presence and actions of competitors may affect a given firm’s outcomes, we endeavor to
measure, model and explain cross-firm effects arising due to similarities in the stated marketing
and innovation drivers of firm behavior by classifying them as shown in Figure 1. We study how
the classification of the B2B firms in these groups evolves over time and how this movement
across groups informs firm’s adapting the winning strategy.
Figure 1: Similarities in Marketing and Innovation Focus

374
Potential Contributions
The proposed research provide a better understanding of the marketing’s role in B2B
innovation. It will also attempt to answer ‘How can firms measure the value of their
communications programs?’, and ‘How can we understand and model the likely behavior of
competition?’. The findings from the proposed research have theoretical and managerial
relevance. They will provide marketers in the B2B domain with a theoretical and causal
understanding to anticipate marketplace changes and hence undertake relevant strategy shifts.
The findings will also inform managers of competitor intelligence for adapting the winning
strategies.
References
Berger, J., & Iyengar, R. 2013. Communication channels and word of mouth: How the medium
shapes the message. Journal of Consumer Research, 40(3), 567-579.
Fahey, L. (1999). Outwitting, outmaneuvering, and outperforming competitors. Wiley.
Griffin, A. (2012). Qualitative research methods for investigating business-to-business marketing
questions. Handbook of business-to-business marketing. Elgar, Cheltenham, 659-679.
Lavrakas, P. J. 2008. Encyclopedia of Survey Research Methods. Sage Publications.
Lilien, G. L. (2016). The B2B Knowledge Gap. International Journal of Research in Marketing.
Stern, B. B. 1996. Textual analysis in advertising research: Construction and deconstruction of
meanings. Journal of Advertising, 25(3), 61-73.
Woodside, A. G., & Baxter, R. (2012). Case Study Research in Business-to-Business Contexts:
Theory and Methods. Handbook of business-to-business marketing. Elgar, Cheltenham,
680-698.

375
The Dominance - Prestige model can predict outcomes in buyer - seller interactions that entail
status asymmetries
Shirish Panchal & Tripat Gill
Wilfrid Laurier University
Abstract
One of the by-products of our social life is asymmetry in social standing or social influence.
High-ranking individuals tend to have disproportionate influence within a group, such that social
rank can be defined as the degree of influence one possesses over resource allocation, conflicts,
and group decisions. People with high social influence such as celebrities (actors, sportsmen, etc.),
politicians, business tycoons, scientists, etc. are considered to enjoy high status because they have
considerable influence on behavior and decisions of other people in the society. Within the
Marketing domain, influencing consumers during market exchanges and transactions (in both b2b
and b2c contexts) is important for obtaining optimal outcomes. Several Market exchanges entail
status asymmetries between the buyer-seller or customer-marketer interactions (e.g., a small
supplier negotiating with a large manufacturer, or a customer interacting with a sales representative
at a high-end luxury store). Using the Dominance-Prestige model (Henrich and Gil-White, 2001),
we hypothesize and empirically test the effect of status asymmetries on three fundamental
dimensions of interpersonal judgment and influence: trust, altruism, and compliance. Specifically,
we examine the effect of the type of status-asymmetry – dominance- versus prestige-based – on
these interpersonal judgments in one-shot economic interactions between two individuals. Using
economic games as the methodological tool we find that low status individuals show higher trust
and altruism when interacting with prestige-based high status individuals, however they show
higher compliance when interacting with dominance based high status individuals. These findings
have both theoretical and substantive implications in the domain of relationship marketing.
Theoretical background and Hypotheses
By considering the selection pressures that favored the emergence of social hierarchy
among groups, Henrich and Gil-White (2001) proposed that there are two distinct processes to
acquire social rank in humans: Dominance and Prestige. Dominance is the use of force or
intimidation to induce fear and thereby influence the followers. Prestige process does not involve
any intimidation or force but tries to influence through competence or expertise that is valuable in
some domain of social life. It has been argued that both of these processes may operate
concurrently within social groups, such that individuals can pursue either path to successfully
ascend the hierarchy.
According to the model, dominance initially arose in evolutionary past as a result of
violent contests for material resources and mates. Dominance hierarchies are thought to emerge
to help maintain patterns of submission directed from subordinates to dominant individuals,
thereby minimizing agonistic battles and incurred costs. In contrast, prestige is thought to have
emerged from selection pressures to preferentially attend to and acquire cultural knowledge from
highly skilled or successful others (also known as social learning or info-copying). Thus,
Dominance and Prestige can be thought of as coexisting avenues to attaining rank and influence
376
within social groups. They have also been conceptualized as individual level traits (Cheng et. al.
2013), whereby individuals tend to preferentially pursue dominance versus prestige-based status.
The dominance-prestige model also highlights distinct interpersonal interactions,
contingent upon the type of status asymmetry: dominance- versus prestige-based. Prestige
individuals are liked and admired by the low status individuals while dominant individuals are
disliked. Followers try to become proximate with prestige individuals but maintain distance
towards dominant individuals. Followers do not fear prestige individuals but respect them and
heed to their opinions even though the followers may not fully agree with the opinions. In contrast,
followers are intimidated by the dominant individuals and hence followership is involuntary. Also,
prestigious individuals receive more freely conferred gifts from followers compared to dominant
individuals.
The above model has implications in the domain of relationship marketing (see Palmetier
et al. 2006), specifically in market exchanges that entail status asymmetries between the buyer-
seller or customer-marketer dyads. For instance, a small supplier (seller) interacting / negotiating
with a large manufacturer (buyer) may show distinct outcomes contingent upon the prestige-
versus dominance-based status orientation of the latter. For instance, the low status (small) seller
may show positive interpersonal judgments (higher altruism, and trust) towards prestige-based
large manufacturers (buyers) as compared to buyers with dominance-based status orientation.
Conversely, since dominance-based status entails influence by controlling resources and using
punishment (for psychological intimidation), low status sellers will comply more with the
dominance-based high status buyers as compared to prestige-based ones. Similar predictions can
be made in the B-2-C contexts, when individual customers (low status) interact with high-end /
premium (high status) brands (e.g., customers purchasing an expensive / luxury automobile).
Based on the above theorization, we propose the following for dyadic interactions that
entail status-asymmetries between the two participants:
H1: Low status individuals will exhibit higher level of trust for prestige- versus
dominance-based high status individuals.
H2: Low status individuals will exhibit higher level of altruism towards prestige- versus
dominance-based high status individuals.
H3: Low status individuals will exhibit more compliance towards dominance- versus
prestige-based high status individuals.
Method
In order to test the predictions, we use three standard economic games: 1.Trust Game (TG;
for studying trust), 2. Dictator Game (DG; for studying altruism), and Ultimatum Game (UG; for
studying compliance). Data for all the games was collected in a single study. In each game,
participants (university students) assumed the role of a proposer (player 1). Responder (player 2)
in each game was a hypothetical individual with high-status with either prestige or dominance-
based status orientation. Thus the research design was 3 (Games: TG, DG, or UG) x 2 (Player2:
Dominance- vs. Prestige-based) between subjects design. A total of 384 participants (207 males;
average age = 20.60; SD = 1.87) participated for extra course credit, and were randomly assigned
to one of the six conditions.

377
Standard instructions for each game were given to the participants and it was ensured that
they clearly understood the rules of the game. Participants (in role of proposer / player 1) were told
that they would be randomly paired with player 2 (the responder) which was described as a person
drawn from the general population. The dominance- versus prestige-based status orientation of
player 2 was manipulated via a short description of the paired individual. The status orientation of
player 2 was measured using a six-item scale adapted from previously validated dominance
prestige scale developed by Cheng et al 2010. Each participant (in role of player 1) was endowed
with $10 and was instructed to make an offer to player 2 (responder) based on the rules of the
game. The magnitude of the offer made by the participants was the key dependent measure used
to measure the three interpersonal dimensions of trust (in TG conditions), altruism (in DG
conditions) and compliance (in UG conditions).
Results
Manipulation check: As intended, the descriptions of prestige-based Player 2 was
perceived to be high on prestige (M = 5.72, SD = 0.88) when compared to dominance-based Player
2 (M = 3.36, SD = 0.87), t(382) = 26.27, p < 0.001, two-tailed. However dominance-based Player
2 was perceived high on dominance (M = 6.20, SD = 0.74) when compared to prestige-based Player
2 (M = 3.72, SD = 1.32), t(382) = 22.80, p < 0.001, two-tailed. The descriptions were perceived to
be of equal status (t(382) = 0.542, p = 0.58, two-tailed).
Hypothesis testing: Overall, the results confirmed the three hypotheses. A one-way
between subjects ANOVA revealed significantly different mean offers across the six conditions
[F(5, 378) = 8.286, p < 0.001]. In the TG conditions, participants made significantly higher offers
(implying higher trust) to the prestige-based Player 2 (M = 5.93, SD = 3.11) than dominance-based
one (M = 4.55, SD = 2.85), t(378) = 2.58, p < 0.01, one- tailed (thus supporting H1). In the DG
conditions, participants gave significantly higher amounts (implying higher altruism) to the
prestige-based (M = 3.77, SD = 2.64) as compared to the dominance-based Player 2 (M = 1.92, SD
= 2.56), t(378) = 4.02, p < 0.001, one-tailed (confirming H2). In contrast, in the UG participants
made significantly lower offers (implying lower compliance) to the prestige-based (M = 4.37, SD
= 1.72) as compared to the dominance-based Player 2 (M = 4.89, SD = 1.79), t(378) = -1.70, p <
0.05, one- tailed (supporting H3).
Implications
Marketing is essentially a social process involving some kind of exchange between two
entities (either individuals or firms). In many such market exchanges, there is an apparent status-
asymmetry between the two exchange parties. We posit that the dominance-prestige model of
status attainment / orientation (Henrich and Gil-White 2001) is highly applicable in such contexts.
For example a small auto-ancillary manufacturer supplying components to a large automobile
manufacturer can perceive the high status buyer to be dominance- or prestige-oriented. We propose
and show that these distinct status asymmetries would affect the perceived trust, altruism and
compliance exhibited in such buyer-seller interactions. These findings have both theoretical and
substantive implications for the relationship marketing domain (Palmetier et al. 2006). For a high-
status larger firm, signaling dominance-based status can help in improving compliance in long
term contracts, but can have detrimental effects on perceived trust. In B-2-C contexts, positive

378
word of mouth (PWOM) by consumers can be considered as altruistic behaviors as consumers
incur costs (time and effort) to communicate positive aspects of the firm. A consumer interacting
with a high status brand, may exhibit higher PWOM for the firm / brand that is perceived as
prestige-based compared to a dominance-based high status brand. Future research should explore
these interpersonal judgments and substantive outcomes using studies conducted specifically in
buyer-seller or customer-marketer contexts.
References
Cheng J. T., Tracy, J. L., Foulsham T., Kingstone, A., & Henrich, J, (2013) Two Ways to
the Top: Evidence That Dominance and Prestige Are Distinct Yet Viable Avenues to Social
Rank and Influence. Journal of Personality and Social Psychology, Vol. 104, No. 1, 103–125
Cheng, J. T., Tracy, J. L., & Henrich, J. (2010). Pride, personality, and the evolutionary
foundations of human social status. Evolution and Human Behavior, 31, 334–347.
Henrich, J., & Gil-White, F. J. (2001). The evolution of Prestige: Freely conferred
deference as a mechanism for enhancing the benefits of cultural transmission. Evolution and
Human Behavior, 22, 165–196.
Palmatier, Robert W., Rajiv P. Dant, Dhruv Grewal, and Kenneth R. Evans (2006),
“Factors Influencing the Effectiveness of Relationship Marketing: A Meta-Analysis,” Journal of
Marketing, 70 (October), 136–53.

379
Coalition identification for loyalty programs
Banumathy S & Swetha Jayalakshmi J
PSG College of technology, Coimbatore
Abstract
Consumer loyalty is the buzzing word these days. Strong competition and growing
technological developments has made retailers aiming to increase their market share by gaining
more customers. Retailers are striving hard to keep their customers loyal. To keep customers loyal,
retailers spend heavily on loyalty programs. According to (Solomon, 2012) getting a new customer
is more than five times costlier than retaining an existing customer. Retailer practices many kinds
of loyalty programs to retain customers. There are varieties of loyalty programs like full loyalty,
divided loyalty, affective and continuance loyalty (Erciş, Ünal, Candan, & Yıldırım, 2012)
monetary based rewards and special treatment based rewards (Furinto, Pawitra, & Balqiah, 2009)
etc. Academicians and business heads are constantly working in this area to improve the benefits
of loyalty programs for both the retailer and customer. There are many studies on loyalty program
viz. study on customers preferred way of loyalty, business to business loyalty (Daams, Gelderman,
& Schijns, 2008), in understanding the factors that affect customer loyalty (Noyan & Şimşek,
2014) loyalty in m-commerce (W. O. Lee & Wong, 2016) etc.,. Among the different types of
loyalty programs, coalition loyalty program has gained wide acceptance among retailers (Dorotic,
Fok, Verhoef, & Bijmolt, 2011) of product and also service sectors. Recent trends in technology
and networking has also paved way for popularity in coalition loyalty program.
Coalition Loyalty Program is highly advantageous for the retailers in terms of sharing marketing,
promotional and infrastructure costs (Capizzi & Ferguson, 2005), creates greater potential for cross
selling (M. Y. Lee, Lee, & Sohn, 2013) and positive word of mouth. It also makes the customer
happy and loyal to multi retailers at a time. Customers can earn and redeem rewards at different
participating firms. Though there are many literatures on loyalty programs and this topic is much
of interest to retailers, there are only very few studies which suggests ways on identifying a partner.
There are different methods in identifying partners for loyalty program. It can be done by using
the transaction data. It can also be done by analyzing customer habitual behavior. Consumers shop
for different product categories at different retailers. This can be identified with their demography,
social class, monthly income, brand preferences etc. For an e.g. each consumer is conceptualized
to shop for apparel at a particular retailer and use a particular service provider for travel.
This study conceptualizes and aims to identify coalition by apparel retailers with other businesses
for exchanging loyalty rewards. The study is planned as follows. We will identify an apparel
retailer. By doing an online survey with their customers we will identify their habitual shopping
pattern. By using a decision tree based classification, the analysis would result in suggestions for
the retailer. Suggestions will be given to the apparel retailer to partner with one travel service
provider, one restaurant in their locality, one telecom operator, etc, with which, their customer
habituate. This study will be useful for an apparel retailer in identifying a partner for coalition
loyalty programs. The type of loyalty rewards, the duration can be decided by the partners. This
model can be employed by other retailers in identifying their partner for coalition loyalty program.

380
Customers will also be happy that the penny they spend on eating out is also rewarding them while
purchasing apparel and vice versa.
Reference
Capizzi, M. T., & Ferguson, R. (2005). Loyalty trends for the twenty-first century. Journal of
Consumer Marketing, 22(2), 72–80.
Daams, P., Gelderman, K., & Schijns, J. (2008). The impact of loyalty programmes in a B-to-B
context: Results of an experimental design. Journal of Targeting, Measurement and Analysis for
Marketing, 16(4), 274–284.
Dorotic, M., Fok, D., Verhoef, P. C., & Bijmolt, T. H. A. (2011). Do vendors benefit from
promotions in a multi-vendor loyalty program? Marketing Letters, 22(4), 341–356.
Erciş, A., Ünal, S., Candan, F. B., & Yıldırım, H. (2012). The Effect of Brand Satisfaction, Trust
and Brand Commitment on Loyalty and Repurchase Intentions. Procedia - Social and
Behavioral Sciences, 58, 1395–1404.
Furinto, A., Pawitra, T., & Balqiah, T. E. (2009). Designing competitive loyalty programs: How
types of program affect customer equity. Journal of Targeting, Measurement and Analysis for
Marketing, 17(4), 307–319.
Lee, M. Y., Lee, A. S., & Sohn, S. Y. (2013). Behavior scoring model for coalition loyalty
programs by using summary variables of transaction data. Expert Systems with Applications,
40(5), 1564–1570.
Lee, W. O., & Wong, L. S. (2016). Determinants of Mobile Commerce Customer Loyalty in
Malaysia. Procedia - Social and Behavioral Sciences, 224, 60–67.
Noyan, F., & Şimşek, G. G. (2014). The Antecedents of Customer Loyalty. Procedia - Social
and Behavioral Sciences, 109, 1220–1224.
Solomon, M. (2012). High-tech, high-touch customer service: inspire timeless loyalty in the
demanding new world of social commerce. AMACOM Div American Mgmt Assn.
381
The Use of Influence Strategies, Trust and Commitment to Curb Opportunism in Marketing
Channels: The Moderating Effect of Relational Governance Measures
Ashwin J. Baliga & Upendra Kumar Maurya
IIT Madras
Introduction: Marketing channels are a set of interdependent organizations that are involved in
making a product or service available for use or consumption, to the end customer. Firms within
the channels need to maintain good relationship amongst themselves to ensure success, to enhance
their performance and to reduce opportunism. Reducing opportunism is of prime importance in
any relationship and is vital to ensure channel performance. Opportunism is defined as “self-
interest seeking with guile” (Williamson, 1985). It is as an act of deceit engaging in unethical/
unlawful behavior that can be active (doing things implicitly or explicitly) or passive that usually
has a cunning motive (guile). Opportunism if not minimized, will lead to significant losses for both
the firms.
There have been multiple approaches to improve channel performance and reduce opportunism
Careful partner selection, incentive design, monitoring, governance measures etc., are some
means. Earlier research carried in marketing channels was mainly based on economic based
approaches such as transaction cost theory, agency theory etc. But it was Bucklin (1966) and Stern
(1969) who provided new approaches (behavioral based) to study relationships (Watson IV et al.,
2015).
John (1984) found that the strategies of influence can reduce as well as worsen opportunism.
Strategies of influence tells about the content and structure of communication, that one party uses
to change the attitude and behavior of another channel member. Coercive strategies- makes use of
force/ threats, promises and legal routes. Non-coercive strategies- relies on information exchange,
recommendation and requests.
A few researchers have suggested that when the coercive strategies of influence is used it might
increase opportunism (John, 1984; Provan and Skinner, 1989), whereas the non-coercive strategies
might discourage opportunism (Wathne and Heide, 2000). The kind of problem that the channel
faces determines the choice of a particular strategy of influence. Although multiple approaches has
been used, no study has made an attempt to integrate multiple behavioral based approaches to
study opportunism. Here we make an attempt here to see if strategies of influence along with
moderating effect of relational governance can help build trust, commitment in the relationship
and thus reduce opportunism.
In this study the objective would be to
2. To understand how the behavioral variables interact with each other and reduce opportunism (In
the context of a supplier-distributor relationship).
Accordingly following are the research questions:
4. What role does the relational governance (comprising of relational norms and collaborative
activity) play in curbing opportunism?
5. What are the conditions under which different strategies of influence can be used?
6. Is it better to limit opportunism or eliminate it completely from the system?

382
H3a,b
H8 H7
H5b
H6
H5a H4a,b
H1,2
Figure 1: Proposed Model
Hypotheses development: Relational governance measures are also commonly used to study the
Interfirm relationships. A recent study carried out by Zhou et al., (2015) has shown that the
relational governance should comprise of attitudinal and behavioral measures. This was also
recommended by Kim (1999).Therefore relational governance measures comprising of relational
norms and collaborative activities (joint planning and joint problem solving) have been used in the
study. It was found that when the relational norms were lower, joint planning reduces opportunism
and joint problem solving aggravates opportunism. When the relational norms are lower, joint
planning enables co-operation. This reduces information asymmetries and reduces opportunism.
But when the norms are higher, joint planning may hinder cooperation, create misunderstanding
and increase opportunism. Joint problem solving should only be used when the relational norms
are high, because partners receive what they expect. Both the partners provide relevant, accurate
information and are less likely to misjudge the behavior. Therefore it is hypothesized that
H1: When the relational norms are lower, joint planning reduces opportunism and joint problem
solving exacerbates opportunism.
H2: When the relational norms are higher, joint problem solving reduces opportunism and joint
planning exacerbates opportunism.
Impact of non-coercive influence on Opportunism
Non-coercive influence strategies is based on rational persuasion, reasoning etc., with no room for
conflicts. The very objective here is to make the other party understand the consequence of its
Coercive
strategies
Non- Coercive
strategies
Trust Commitment
Opportunism
Relational Governance
(Norms + Collaborative
activity)

383
action and thus avoid/ reduce opportunism. It also facilitates two way communication between the
parties. When the relational governance are higher, i.e. when the roles are clearly defined and when
there is constructive problem solving, the combined effect reduces the opportunism in return
(Brown, Grzeskowiak and Dev, 2009). Therefore it is hypothesized that
H3a: When the firms perceives that the level of relational governance in their relationship as higher
(i.e. high relational norms and joint problem solving), the non-coercive strategies of influence is
negatively associated with the opportunism of a partner firm. (This is because the things are
communicated in advance through agreements and any deviation is brought to the notice by
persuasion. When the level of relational norms are higher, joint problem solving ensures
cooperation between the partners and they are less likely to misjudge the behavior).
Relational governance attempts to reduce opportunism as they promote openness in
communication. But when the measures are not developed well, it can be a cause of frequent
disagreements and a party may find it very difficult to control another party’s opportunism, due to
inconsistencies in behavior. Under such cases, the non-coercive strategies of influence may be
misinterpreted and lead to retaliation. The opportunistic party might refuse to adapt for the changes
asked or might do forced re-negotiation to protect its self-interest, which is an act of opportunism
(Brown, Grzeskowiak and Dev, 2009). Therefore it is hypothesized that
H3b: When the firms perceives that the level of relational governance in their relationship as lower
(low relational norms and joint problem solving), the non-coercive strategies of influence is
positively associated with the opportunism of a partner firm. (Low level of relational norms and
joint problem solving creates ambiguity and uncertainty in relationships).
Impact of Coercive influence on Opportunism
Here rewards are offered whenever there is compliance and the non-compliance is dealt with
actions in the form of punishments. Coercive strategies of influence aim to restrict the opportunism
behavior of the partner firm in the short term itself. Having low level of relational governance
measures with high degree of coercive influence limits opportunism. Therefore it is hypothesized
that
H4a: When the firms perceives that the level of relational governance in their relationship as lower,
the coercive strategies of influence is negatively associated with the opportunism of a partner firm.
But when both the relational governance measures and the coercive strategies of influence is
higher, it amplifies and may create tension, frustration amongst the partner firm. The level of
opportunism can be expected to be higher, as parties may reject this or express displeasure by
following unfair practices to avoid another party’s dictatorship. Therefore it is hypothesized that
H4b: When the firms perceives that the level of relational governance measures in their
relationship as higher, the coercive strategies of influence is positively associated with the
opportunism of a partner firm.
Impact of strategies of influence on Trust with Moderating Effect of Relational Governance
In most of the marketing literature, there is consensus that more communication helps ease tensions
between the parties and is better. Although it is true, the studies have not considered the nature of
relationships between the parties. When the exchange between the firms is relational, the firms can
predict behavior of each other with less communication (Anderson and Weitz, 1989; Simpson and

384
Mayo, 1997). Influence strategies be it coercive or non-coercive is an indication of power. When
this is combined with the higher relational governance measures (norms and collaborative activity)
it can lead to communication overload and can reduce trust in the exchange relationship. Therefore
it is hypothesized that
H5a: The association between the non-coercive strategies of influence and trust, weakens with the
moderating effect of higher relational governance measures.
H5b: The association between the coercive strategies of influence and trust, worsens with the
moderating effect of higher relational governance measures.
Impact of Trust and Commitment on Opportunism
Trust is having confidence in an exchange partner’s integrity (Morgan and Hunt, 1994).
Commitment is the persistent want to maintain a valued relationship (Moorman, Deshpande and
Zaltman, 1992). Trust and commitment are key measures of Interfirm relationships. It helps the
firms contribute to meet the mutual goals and prevents the members within the channel from acting
opportunistically. Trust is built at individual level whereas commitment at the firm level, thereby
leading to interpersonal relationships and not vice versa (development of trust takes place first and
commitment follows it, but it takes a longer time to develop and is thus complex. Thus trust acts
as an antecedent to commitment), although this varies from context to context. As trust tends to
commitment it leverages information asymmetries, dependence and thus reduces opportunism
(Gundlach, Achrol and Mentzer, 1995). Therefore it is hypothesized that
H6: Trust in Interfirm relationships is associated positively to commitment.
H7: Commitment in Interfirm relationships is associated negatively to opportunism.
H8: Trust in Interfirm relationships is associated negatively to opportunism.
Proposed Methodology
A case study methodology along with in depth interview will be conducted in order to know the
various reasons as to why firms in channels act opportunistically. In addition, survey instruments
will be used to collect the data. The various spillover effects (secondary effects) that takes place
will also be determined. Special observational qualitative methods such as ethnographic studies
can be used in this regard.
Discussions
Opportunism leads to opportunity loss and also results in wastage of time and resources. The
efficiency and the effectiveness, of the influence strategies used to curb opportunism depends on
the level of relational governance measures. Coercive strategies of influence exacerbates
opportunism whereas the non-coercive strategies limits opportunism. We also believe that the
moderating effect of relational governance plays a major role in limiting opportunism. When the
norms are higher, it is preferable to opt for joint problem solving instead of joint planning. The use
of a particular collaborative activity, depends on the level of relational norms. Incorporation of the
right governance measures ensures win-win situation for the firms involved in exchange. Trust
and commitment also play a key role in limiting opportunism. We also suggest that it is better to
have a tolerable limit of opportunism in the system instead of striving for complete elimination. It
is also consistent with the study conducted by Dutta, Bergen and John (1994). When the costs

385
involved in eliminating the opportunism exceeds benefits, it is advisable to have a tolerable limit
of behavior within the relationship.
Limitations of the study
The results of the study is based on the distributor’s perceptions of the influence strategies used
by the supplier. It would also be useful to capture the perceptions of supplier. Also the study does
not address the impact of relational governance measures on performance dimensions such as
satisfaction, sales etc. Since the data collected, focuses only on the impact after development of
relationship, it may not be possible to determine the equity and impact levels during the initial
stages.
References
Anderson, E. and Weitz, B., 1989. Determinants of continuity in conventional industrial
channel dyads. Marketing science, 8(4), pp.310-323.
Brown, J.R., Grzeskowiak, S. and Dev, C.S., 2009. Using influence strategies to reduce
marketing channel opportunism: The moderating effect of relational norms. Marketing
Letters, 20(2), pp.139-154.
Bucklin, L.P., 1966. A theory of distribution channel structure. University of California,
Institute of Business and Economic Research.
Dutta, S., Bergen, M. and John, G., 1994. The governance of exclusive territories when dealers
can bootleg. Marketing Science, 13(1), pp.83-99.
Gundlach, G.T., Achrol, R.S. and Mentzer, J.T., 1995. The structure of commitment in
exchange. The Journal of Marketing, pp.78-92.
John, G., 1984. An empirical investigation of some antecedents of opportunism in a marketing
channel. Journal of marketing Research, pp.278-289.
Kim, K., 1999. On determinants of joint action in industrial distributor–supplier relationships:
Beyond economic efficiency. International Journal of Research in Marketing, 16(3), pp.217-
236.
Moorman, C., Zaltman, G. and Deshpande, R., 1992. Relationships between providers and
users of market research: The dynamics of trust within and between organizations. Journal of
marketing research, 29(3), p.314.
Morgan, R.M. and Hunt, S.D., 1994. The commitment-trust theory of relationship
marketing. The journal of marketing, pp.20-38.
Provan, K.G. and Skinner, S.J., 1989. Interorganizational dependence and control as predictors
of opportunism in dealer-supplier relations. Academy of management Journal, 32(1), pp.202-
212.
Simpson, J.T. and Mayo, D.T., 1997. Relationship management: a call for fewer influence
attempts? Journal of Business Research, 39(3), pp.209-218.
Stern, L.W. ed., 1969. Distribution channels: Behavioral dimensions. Houghton Mifflin
Harcourt (HMH).

386
Wathne, K.H. and Heide, J.B., 2000. Opportunism in interfirm relationships: Forms, outcomes,
and solutions. Journal of marketing, 64(4), pp.36-51.
Watson, G.F., Worm, S., Palmatier, R.W. and Ganesan, S., 2015. The evolution of marketing
channels: trends and research directions. Journal of Retailing, 91(4), pp.546-568.
Williamson, O.E., 1985. The economic institutions of capitalism. The Free Press, New York.
Zhou, Y., Zhang, X., Zhuang, G. and Zhou, N., 2015. Relational norms and collaborative
activities: roles in reducing opportunism in marketing channels. Industrial Marketing
Management, 46, pp.147-159.
387
Unenlightened Aspects of Employer Branding
Gurbir Singh, Himanshu Shekhar Srivastava & Arti Sharma
Indian Institute of Management Indore
Introduction: Employer branding refers to the projection of the image of an organization as the
best place to work (Barrow, 1990). It is an effective tool to attract potential employees and retain
the existing employees. Various research studies have reported the positive side of employer
branding benefiting the organization in recruitment, talent pooling, internalizing of organization
values, organization attractiveness, retention and more. This study intends to draw the attention
towards the ‘dark side’ of different types of employer branding, hampering the retention and
engagement of newly joined employees in the organization.
The exposure to employer branding messages in a pre-employment context can enhance the
expectations of newly hired employees. The realization that those expectations cannot be fulfilled
can negatively impact their behavior (Lapointe et al., 2013). The problem lies with the unrealistic
promises made by employers (Zhao et al., 2007). So, there is a need to understand the impact of
employer branding on a newly hired employee in a post-employment context.
We attempt to understand this unexplored side of employer branding where different types of
external employer branding communications negatively impact the retention of newly joined
employees. Another objective of this study is to highlight the role of emotions in negative behavior
of newly hired employees. We also intend to contribute to affective events theory by exploring the
specific behavioral outcomes of specific emotions elicited by new employees in an employer-
branding context.
THEORETICAL BACKGROUND
Employer Branding and Psychological Contract
The employer branding messages directed towards prospective employees contain information
about the organization, growth opportunities, challenges and work atmosphere (Backhaus and
Tikoo, 2004). These employer branding communications lead to the formation of implicit
expectations which are different from the formal employment contract terms and conditions. These
unwritten and implicit expectations come under the purview of the psychological contract which
is formed by a potential employee on the basis of projected employer brand. Breach or Violation
of Psychological Contract
When the implicit expectations of an employee formed by exposure to employer branding
communications remain unfulfilled, an employee may feel a breach or violation of his
psychological contract (Backhaus and Tikoo, 2004). When a prospective employee joins the
organization, he expects the employer to deliver on her promised obligations. But it is also
necessary for an employee to honor his promises made to the employer under psychological
contract before perceiving any unmet promise of the employer as a breach or violation.

388
Affective Events Theory
Affective Events Theory (AET) provides us with a framework to understand the emotions and
their impact on behaviors in a workplace (Weiss and Cropanzano, 1996). As per AET, the behavior
of employees is a function of how they feel in reaction to the events happening in a work
environment.
Emotions
We intend to study only four emotions namely, regret, disappointment, anger and brand hate.
These are the commonly elicited emotions. Anger and disappointment are among the top three
most experienced emotions (Schimmack and Diener, 1997). Regret is the second most mentioned
emotion by people in routine conversations (Shimanoff, 1984). Similarly, Fehr and Russel (1984),
found hate to be the second most important emotion in their survey.
Employee Behavior
The employer branding is an effort to project the organizational image before the prospective
employees and the internal employees. So, keeping in mind the motive of employer branding, we
attempt to study three employee behaviors which may negatively impact the employer branding.
The negative emotions evoked due to failed employer branding may lead to intention to quit,
negative word-of-mouth and workplace deviance. Workplace deviance refers to the intentional and
deliberate behavior that an employee showcase with a desire to bring harm to the organization
(Bennett & Robinson, 2000).
PROPOSITIONS
Employer branidng leads to formation of a brand image of the organization as an employer. The
employer image can be projected using instrumental and symbolic information. The instrumental
information about employer includes functional and tangible benefits like location, pay, benefits,
job security and advancement opportunities. The symbolic information about employer includes
subjecctive and intangible benefits like innovativeness, trendy and prestige.
In this study, we hypothesize that the employer branding on the basis of instrumental and symbolic
attributes will have a differential impact on the degree of psychological contract violation felt by
a newly joined employee.
Proposition 1- Violation of a psychological contract formed on the basis of symbolic attributes
will be severe as compared to psychological contract formed on the basis of instrumental
attributes.
We argue on the basis of existing literature that the employer branding contributes to the formation
of a psychological contract between the employee and the employer. In the post-employment
phase, when such psychological contract is violated by the employer, it may evoke negative
emotions which further lead to detrimental behavior by the employee.
Proposition 2- The negative emotions will mediate the relationship between the violation of
psychological contract formed due to employer branding and employee negative behavior towards
the employer.

389
Regret and Employee Behavior
People feel regretful when they realize that their present situation could have been better had they
chosen differently (Landman, 1993). The violation of that psychological contract will elicit a
feeling of regret as the employee will blame himself for the decision to join the employer. He will
not complain or spread negative word-of-mouth because he perceives that the employer is not
responsible for the negative outcome. We argue that in such condition an employee will intend to
switch the employer in pursuit of a better alternative.
Proposition 3- Employees regret will positively influence the intention to quit.
Disappointment and Employee Behavior
People feel disappointed when the outcomes of their decisions fail to live up to their expectations
(Zeelenberg et al., 1998). In an employer branding context, in a post-employment scenario, when
the employees encounter disconfirmed expectations on violation of psychological contract, they
feel disappointed. We argue that in such circumstances the employee will share his dissatisfaction
with his social network and engage in spreading negative word-of-mouth.
Proposition 4- Employees disappointment will positively influence the negative word-of-mouth.
Anger and Employee Behavior
Anger is categorized as a social emotion, which is elicited as a response to the action of other
people or entity, and is also directed towards other people or entity (Averill, 2012). Existing
literature has established that the violation of the psychological contract by an employer leads to
elicitation of anger by an employee in a workplace (Morrison and Robinson, 1997; Ortony et al.,
1988; Robinson and Morrison, 2000; Weiss and Corpanzano, 1996). Subsequently, they will
engage in behaviors harming the organization to take revenge. We argue that the elicitation of
anger due to a violation of the psychological contract in such situations will lead to workplace
deviance.
Proposition 5- Employees anger will positively influence workplace deviance.
An individual experiencing anger exhibit strong tendency to punish, harm or injure the other party
causing the anger (Fischer and Roseman, 2007; Harmon-Jones et al. 2003; Kuppens et al., 2003;
Romani, Grappi and Bagozzi, 2013). Such action tendencies can lead to a variety of behaviors
including switching or negative word-of-mouth.
Proposition 6- Employees anger will positively influence negative word-of-mouth.
Proposition 7- Employees anger will positively influence the intention to switch.
Brand Hate and Employee Behavior
Brand hate has been defined as “an intense negative emotional affect toward the brand” (Bryson
et al., 2013). One of the prominent antecedent of the brand hate is the unmet expectations of the
customer. The negative past experience lead to brand hate (Hegner et al., 2017; Zarantonello et al.,
390
2016). In an employer branding context, the communication directed towards prospective
employees create expectation in the form of psychological contract. We argue that the violation of
contract in a post-employment context will lead to brand hate. Brand hate elicitation leads to many
negative behaviors such as complaining, protesting, negative word-of-mouth, patronage cessation,
brand retaliation and brand avoidance (Hegner et al., 2017; Zarantonello et al., 2016).
Proposition 8- Employees brand hate will positively influence the intention to switch.
Proposition 9- Employees brand hate will positively influence negative word-of-mouth.
Proposition 10- Employees brand hate will positively influence the workplace deviance.
Brand Reputation
Brand reputation is the sum of perception of all the stakeholders about a brand (Fombrun and
Rindova, 2000). It is the effect of all the marketing activities undertaken by an organization over
a period of time. Many studies have found that even in case of failure of an organization in meeting
the expectations of its customers, the brand reputation reduces the negative impact of such failure
(Hess, 2008; Huang, 2011). In the context of employer-employee relations, when the expectations
set by employer branding in the form of psychological contact remains unmet, we argue that the
brand reputation will act as a moderator in the relationship between psychological contract
violation and negative emotions and negative behavior.
Proposition 11a- Brand reputation will moderate the relationship between psychological contract
violation and regret.
Proposition 11b- Brand reputation will moderate the relationship between psychological contract
violation and anger.
Proposition 11c- Brand reputation will moderate the relationship between psychological contract
violation and brand hate.
Proposition 11d- Brand reputation will moderate the relationship between psychological contract
violation and disappointment

391
Model
EL
PROPOSED METHODOLOGY
Two studies can be conducted to test these propositions in line with Zeelenberg and Pieters (1999).
In study 1, scenarios can be used to test the effect of emotions on behavior. After reading the
scenarios, the respondent will be asked about the likely behavioral response. It will give us an
initial idea about the support for the hypothesis.
In study 2, experience sampling can be used for testing hypothesis. Respondents will be asked to
come up with an autographical episode where they felt psychological contract violation. Then, all
the emotions and behavioral responses will be measure using the established scales.
EXPECTED THEORETICAL CONTRIBUTION
This study contributes to the literature by identifying the negative side of employer branding. We
have contributed to the Affective Events Theory (AET) by identifying the impact of four specific
negative emotions on three specific behaviors in a workplace. Till now, the effects of employer
branding on prospective employees has been studied only in a pre-employment context but we
have explored these effects in a post-employment context.
Our study also indicates towards an inherent conflict between the consequences of external
(attracting prospective employees) and internal (enhancing retention and engagement of existing
employees) employer branding. We also highlight the role played by emotions in the behavior of
newly joined employees. The kind of elicited emotion decides the behavioral response of a new
employee.
EXPECTED MANAGERIAL IMPLICATIONS
The employers need to handhold newly joined employees. The employees should be socialized in
the organization in a way that their perceptions regarding psychological contract fulfillment are
also addressed. Managers also need to be careful while devising their messages directed towards
prospective employees as part of employer branding. The accuracy of the information shared with
prospective employees is important for the accurate formation of perceived psychological contract
(Backhaus and Tikoo, 2004).

392
CONCLUSION
The existing research in employer branding context has reported the merits and positive aspects of
employer branding. This research may be a one of its own kind as it intends to dwell into the darker
side of employer branding which hasn’t been talked about. The commitments made under
employer branding which cannot be fulfilled in future can have detrimental effects for the
employer. So, there is a need to be careful about what is communicated to prospective employees.
REFERENCES
Backhaus, K., & Tikoo, S. (2004). Conceptualizing and researching employer branding. Career
development international, 9(5), 501-517.
Barrow, S. (1990). Turning Recruitment Advertising into a competitive weapon. Paper delivered
at CIPD Annual Conference. Harrogate, UK.
Bennett, R. J., & Robinson, S. L. (2000). Development of a measure of workplace
deviance. Journal of applied psychology, 85(3), 349.
Fehr, B., & Russell, J. A. (1984). Concept of emotion viewed from a prototype
perspective. Journal of experimental psychology: General, 113(3), 464.
Fischer, A. H., & Roseman, I. J. (2007). Beat them or ban them: the characteristics and social
functions of anger and contempt. Journal of personality and social psychology, 93(1), 103.
Fombrun, C. J., & Rindova, V. P. (2000). The road to transparency: Reputation management at
Royal Dutch/Shell. The expressive organization, 7, 7-96.
Harmon-Jones, E., Sigelman, J., Bohlig, A., & Harmon-Jones, C. (2003). Anger, coping, and
frontal cortical activity: The effect of coping potential on anger-induced left frontal
activity. Cognition & Emotion, 17(1), 1-24.
Hastings, S. E., & O’Neill, T. A. (2009). Predicting workplace deviance using broad versus narrow
personality variables. Personality and Individual Differences, 47(4), 289-293.
Hegner, S. M., Hegner, S. M., Fetscherin, M., Fetscherin, M., van Delzen, M., & van Delzen, M.
(2017). Determinants and outcomes of brand hate. Journal of Product & Brand
Management, 26(1), 13-25.
Huang, M. H. (2011). Re-examining the effect of service recovery: the moderating role of brand
equity. Journal of Services Marketing, 25(7), 509-516.
Landman, J. (1993). Regret: The persistence of the possible. Oxford University Press.

393
Lapointe, É., Vandenberghe, C., & Boudrias, J. S. (2013). Psychological contract breach, affective
commitment to organization and supervisor, and newcomer adjustment: A three-wave moderated
mediation model. Journal of Vocational Behavior, 83(3), 528-538.
Morrison, E. W., & Robinson, S. L. (1997). When employees feel betrayed: A model of how
psychological contract violation develops. Academy of management Review, 22(1), 226-256.
Robinson, S. L., & Morrison, E. W. (2000). The development of psychological contract breach
and violation: A longitudinal study. Journal of organizational Behavior, 525-
Schimmack, U., & Diener, E. (1997). Affect intensity: Separating intensity and frequency in
repeatedly measured affect. Journal of Personality and Social Psychology, 73(6), 1313.
Shimanoff, S. B. (1984). Commonly named emotions in everyday conversations. Perceptual and
Motor Skills, 58(2), 514-514.
Weiss, H. M., & Cropanzano, R. (1996). Affective events theory: A theoretical discussion of the
structure, causes and consequences of affective experiences at work.
Zarantonello, L., Romani, S., Grappi, S., & Bagozzi, R. P. (2016). Brand hate. Journal of Product
& Brand Management, 25(1), 11-25.
Zeelenberg, M., Van Dijk, W. W., SR Manstead, A., & der Pligt, J. (1998). The experience of
regret and disappointment. Cognition & Emotion, 12(2), 221-230.
Zhao, H. A. O., Wayne, S. J., Glibkowski, B. C., & Bravo, J. (2007). The impact of psychological
contract breach on work‐related outcomes: a meta‐analysis.

394
Retargeted Advertisements- An Exploratory Study
Geetha. M
Indian Institute of Management, Ahmedabad
Introduction : Advertisement in print and broadcast media and its influence on purchase behavior
in a physical store is well documented. But buying at brick and mortar stores is gradually getting
replaced with online stores in recent times. Hence, advertisements are also moving from
traditional medium to online medium leading to digital advertising. Digital advertising uses
electronic devices such as personal computers, smart phones, tablets and game consoles to engage
with consumers. Digital applies technologies or platforms such as websites, e-mail, apps (classic
and mobile) and social networks (Radin, 2006).Digital advertising gives room for personalized
messages. One type of digital adverting is retargeted advertisements that are based on the previous
purchase pattern or current search behavior or purchase history about a product or service in an
online platform. Retargeting ads entice a user to visit a site by taking into account the users past
web history (Kilbourn, 2012). When a user visits a website, a retargeting campaign cookie is
attached to the visitor, taking note of what pages and products the user visits while browsing the
site. Once the user leaves the advertiser’s site and begins journeying to other websites, targeting
ads can be made to appear in certain ad spaces, displaying ads that specifically call out what the
user was looking at on the advertiser’s site earlier (Word stream.com, 2015).
NEED FOR THE STUDY
Advertising influences purchase behavior but in-store ads are specific and have better impact as
communication at the point of purchase is very important (Zhou and Wong, 2003). Holding the
same logic retargeting ads which are similar to in-store ads should induce both planned and
hedonic purchase behavior. E-Commerce is one the areas in India with tremendous growth.
Broadcast and print are increasingly replaced with digital ads along with the shift in the shopping
formats. Most of the researches in marketing on digital / internet advertising have, focused on
understanding the effectiveness of banner ads with click-through rates (Novak and Hoffman 2000,
Chatterjee, Hoffman and Novak 2003). Dreze and Hussherr (2003) found that consumers avoid
looking at banner ads. On the one hand, the $11.2 billion (Hallerman, 2009) online display
advertising market has evolved beyond traditional banner ads to include many visual and audio
features. On the other hand, Google has developed a highly profitable non-search display
advertising division (called AdSense) that generates an estimated $6 billion in revenues by
displaying plain content-targeted text ads: 76% of US internet users are estimated to have been
exposed to AdSense ads(Goldfarb and Tucker, 2011). Hence the scope of retargeted
advertisements is wide.
Compared to in store-ads in traditional advertising the online ads can be customized based on the
search behavior and browsing history of the person. Automated collection of the vast stream of
electronic data from consumers' use of the internet represents an opportunity to target their
marketing campaigns better. Digital media spending globally is expected to exceed 25% of total
advertising spending in 2016 (Live Mint, 2015). Many /Most of the purchase decision happens in
the website and hence influencing the customer at that stage is important. Retargeted ads help in

395
that scenario influencing purposeful and hedonic purchase behavior like impulse buying and
variety seeking behavior. In the case of impulse buying retargeted ads are likely to influence the
urge to buy impulsively. Brand switchers are vulnerable to point of purchase influence. Hence
retargeted ads will influence online variety seeking behavior. Brand loyalty is decreasing among
consumers. Hence new brands /store brands can use this strategy to influence consumers.
OBJECTIVES OF THE STUDY
To study the effectiveness of retargeting and to identify the behavior of consumers towards
retargeted advertising.
RESEARCH DESIGN
In-depth interviews with experts and online consumers will be carried out initially. The different
types of approaches in order to know the effect of retargeted ads on the sales and marketing
strategy of firms are qualitative approach and quantitative approach.
QUALITATIVE APPROACH
Qualitative approach is about finding out not just what people think but why they think it. It’s
about getting people to talk about their opinions so you can understand their motivations and
feelings. For Qualitative Approach, three interviews were taken. x
QUANTITATIVE APPROACH
For Quantitative Approach, an experiment on online testing for a retargeted advertisement was
conducted. In order to analyze how effective the particular advertisement is, we need to calculate
click through rate. More detailed explanation of this experiment will be discussed in the full paper.
IMPLICATIONS
With almost all the Ecommerce companies struggling with their bottom-line, this will lead to
effectively increasing the profits. It helps brands to find an avenue to influence online sales and
enhance profitability. It gives insights on ways of aligning promotion and advertisements. It also
helps companies to create a judicious mix of retargeted advertisements and promotion. From the
discussions and findings and analysis of in-depth interview of experts, it can be observed that
retargeted advertising is still at its nascent stage .Hence, though retargeting is found to be an
effective tool, it has to carve itself with tangibility and structured ad creation procedures to out
beat the effectiveness of traditional ad forms.

396
REFERENCES
Chatterjee, Patrali, Donna L. Hoffman, and Thomas P. Novak (2003), “Modeling theClickstream,”
Marketing Science, 22 (4), 520-541.
Dreze, Xavier and Francois-Xavier Hussherr (2004), “Internet Advertising: Is Anybody Watching?,”
Journal of Interactive Marketing, 17 (4), 8-23.
Economic Times Dec 2013, Accessed at “(http://articles.economictimes.indiatimes.com/2013-12-
30/news/45711192_1_e-commerce-market-online-shoppers-survey) on 21/04/2015”
Goldfarb, A., and C. Tucker. “Online Display Advertising:Targeting and Obtrusiveness.” Marketing
Science 30.3 (2011): 389-404.
Hallerman, David (2009). “US Advertising Spending: The New Reality”, April, Emarketer Technical
Report
Kilbourn, Chris 2012 “Remarketing 101: A Beginner’s Guide
“http://www.searchenginejournal.com/remarketing-101-beginners-guide/89043/accessed on 17/04/2015
Livemint 2015a, “Digital will account for a quarter of all ad spends globally in 2016
”http://www.livemint.com/Consumer/XoxfM8HBiwTzlnWryBnxfI/Digital-will-account-for-a-quarter-of-
all-ad-spends-globally.html?utm_source=copyaccesed on 08/04/2014
Novak, Thomas P. and Donna L. Hoffman (2000), “Advertising and Pricing Models for the Web,” in
Internet Publishing and Beyond, Cambridge: MIT Press.
Radin, David 2006 “The future has arrived with Digital Marketing in 2006
“https://news.google.com/newspapers?nid=1129&dat=20061007&id=UPNRAAAAIBAJ&sjid=YnIDAA
AAIBAJ&pg=4900,3120135&hl=enaccessed on 17/04/2015
Word stream.com accessed from http://www.wordstream.com/online-ads on 02/04/2015
Zhou, L. and A. Wong (2003) Consumer impulse buying and in-store stimuli in Chinese supermarkets.
Journal of International Consumer Marketing, 16 (2), 37-53
Copyright © 2022 FDOKUMEN