Status of Yellow Perch in Lake Michigan 2010-2011 - Great Lakes ...
23
Yellow Perch Task Group, Progress Report, 2012 1 Status of Yellow Perch in Lake Michigan 2010-2011 [Michigan DNR crew members Kendra Porath and Carl Christiansen display a few nice northern Lake Michigan yellow perch, 2011] REPORT TO THE LAKE MICHIGAN COMMITTEE Windsor, Ontario March 19, 2012 Prepared by: Dan Makauskas (ILDNR) and David Clapp (MDNRE)
-
Upload
khangminh22 -
Category
Documents
-
view
2 -
download
0
Transcript of Status of Yellow Perch in Lake Michigan 2010-2011 - Great Lakes ...
Yellow Perch Task Group, Progress Report, 2012
1
Status of Yellow Perch in Lake Michigan 2010-2011
[Michigan DNR crew members Kendra Porath and Carl Christiansen display a few nice northern
Lake Michigan yellow perch, 2011]
REPORT TO THE LAKE MICHIGAN COMMITTEE Windsor, Ontario March 19, 2012
Prepared by:
Dan Makauskas (ILDNR) and David Clapp (MDNRE)
Yellow Perch Task Group, Progress Report, 2012
2
Table of Contents Page
List of Graphs 3 Contact List 5 Status of Yellow Perch in Lake Michigan 6
Adult Relative Abundance 6 Population Age Structure 10 Recruitment 14 Lakewide Assessment – Micromesh Gill Net Evaluation 18
2012 Yellow Perch Harvest Restrictions 22 Task Group Meetings 22 References 22 Appendix 23
Yellow Perch Task Group, Progress Report, 2012
3
List of Graphs Figure Page
Adult Relative Abundance 1. Adult yellow perch gill net CPUE and percent female from Illinois waters
of Lake Michigan, 1976 to 2011 (ILDNR) 6
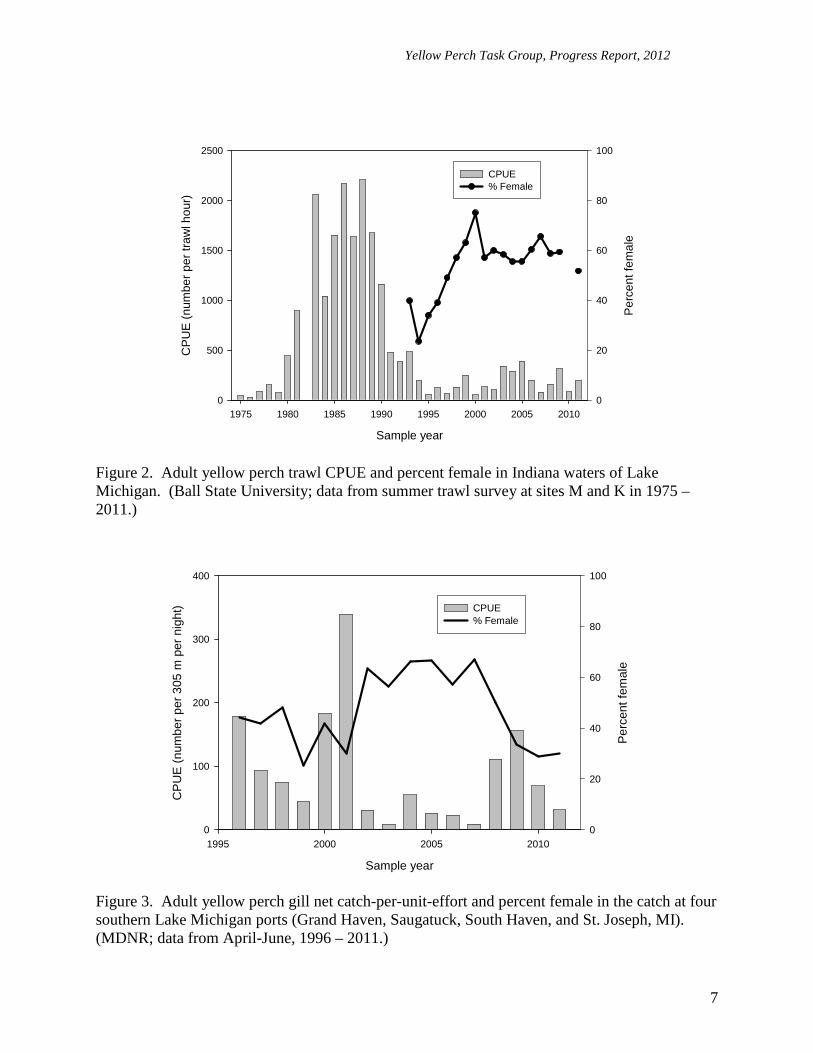
2. Adult yellow perch trawl CPUE and percent female from Indiana waters of Lake Michigan, 1975 to 2011 (BSU) 7
3. Adult yellow perch gill net CPUE and percent females from Michigan waters of Lake Michigan, 1996 to 2011 (MDNR) 7
4. Adult yellow perch gill net CPUE and percent females from Michigan waters
of Bays de Noc, Lake Michigan, 1989 to 2011 (MDNR) 8 5. Adult yellow perch gill net CPUE and percent female from Wisconsin waters
of Lake Michigan, 1986 to 2012 (WDNR) 8 6. Adult yellow perch trawl CPUE from Wisconsin waters of Green Bay, Lake
Michigan, 1978 to 2011 (WDNR) 9 7. Standard graded mesh (51, 64, 76-mm stretched mesh) gill net CPUE of adult
yellow perch from Indiana, Illinois, Michigan, and Wisconsin waters of Lake Michigan, 1984 to 2011 9
Age Structure
8. Yellow perch age structure from gill net assessment in Illinois waters of Lake
Michigan, 2011 (ILDNR) 10 9. Yellow perch age structure from gill net assessment in Illinois waters of Lake
Michigan, 2011 (INHS) 11 10. Yellow perch age structure from gill net assessment in Michigan waters of Lake
Michigan, 2011 (MDNR) 11
Yellow Perch Task Group, Progress Report, 2012
4
List of Graphs (continued) Figure Page 11. Yellow perch age structure from gill net assessment in Michigan waters of Bays de Noc, Lake Michigan, 2011 (MDNR) 12 12. Yellow perch age structure from gill net assessment in Wisconsin waters of Lake
Michigan, 2011 (WDNR) 12 13. Yellow perch age structure from commercial harvest monitoring in Wisconsin
waters of Green Bay, Lake Michigan, 2010 (WDNR) 13 14. Yellow perch age structure from gill net assessment in Indiana waters of Lake Michigan, 2011 (BSU) 13
Recruitment 15. Age-0 yellow perch seine CPUE from Illinois waters of Lake Michigan, 1978 to 2011 (ILDNR) 14 16. Age-0 yellow perch trawl CPUE from Illinois waters of Lake Michigan,
1987 to 2011 (INHS) 15 17. Age-0 yellow perch trawl CPUE from Michigan waters of Lake Michigan,
1996 to 2011 (MDNR) 15 18. Age-0 yellow perch trawl CPUE from Michigan waters of Bays de Noc, Lake
Michigan, 1989 to 2011 (MDNR) 16 19. Age-0 yellow perch seine CPUE from Wisconsin waters of Lake Michigan,
1989 to 2011 (WDNR) 16 20. Age-0 yellow perch trawl CPUE from Wisconsin waters of Green Bay, Lake
Michigan, 1978 to 2011 (WDNR) 17
21. Age-0 yellow perch trawl CPUE from lakewide waters of Lake Michigan, 1973 to 2011 (USGS) 17
Lakewide Assessment – Micromesh Gill Net Evaluation
22. Comparison between standard micromesh gill net catches and traditional YOY assessment (seine, trawl) catches in Wisconsin and Michigan, 2007-2011 20 23. Comparison between standard micromesh gill net assessment catches in Wisconsin and Michigan waters, 2007-2011 21
Yellow Perch Task Group, Progress Report, 2012
5
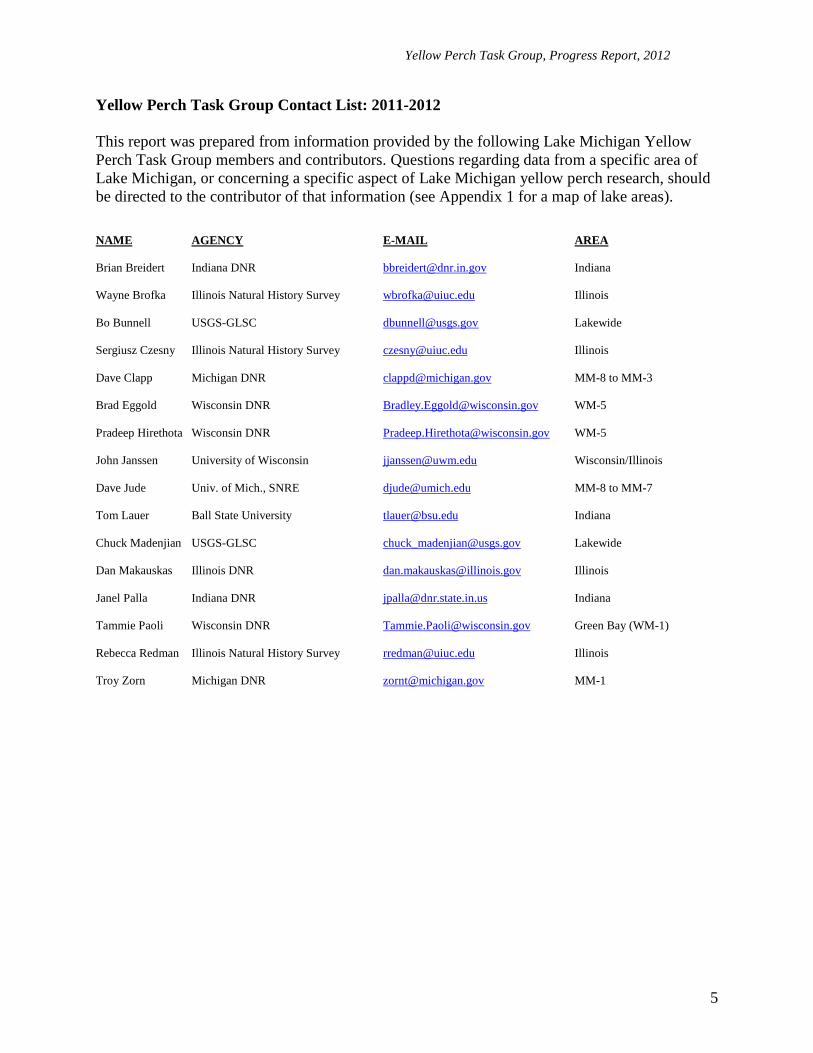
Yellow Perch Task Group Contact List: 2011-2012 This report was prepared from information provided by the following Lake Michigan Yellow Perch Task Group members and contributors. Questions regarding data from a specific area of Lake Michigan, or concerning a specific aspect of Lake Michigan yellow perch research, should be directed to the contributor of that information (see Appendix 1 for a map of lake areas). NAME AGENCY E-MAIL AREA Brian Breidert Indiana DNR [email protected] Indiana
Wayne Brofka Illinois Natural History Survey [email protected] Illinois
Bo Bunnell USGS-GLSC [email protected] Lakewide
Sergiusz Czesny Illinois Natural History Survey [email protected] Illinois
Dave Clapp Michigan DNR [email protected] MM-8 to MM-3
Brad Eggold Wisconsin DNR [email protected] WM-5
Pradeep Hirethota Wisconsin DNR [email protected] WM-5
John Janssen University of Wisconsin [email protected] Wisconsin/Illinois
Dave Jude Univ. of Mich., SNRE [email protected] MM-8 to MM-7
Tom Lauer Ball State University [email protected] Indiana
Chuck Madenjian USGS-GLSC [email protected] Lakewide
Dan Makauskas Illinois DNR [email protected] Illinois
Janel Palla Indiana DNR [email protected] Indiana
Tammie Paoli Wisconsin DNR [email protected] Green Bay (WM-1)
Rebecca Redman Illinois Natural History Survey [email protected] Illinois
Troy Zorn Michigan DNR [email protected] MM-1
Yellow Perch Task Group, Progress Report, 2012
6
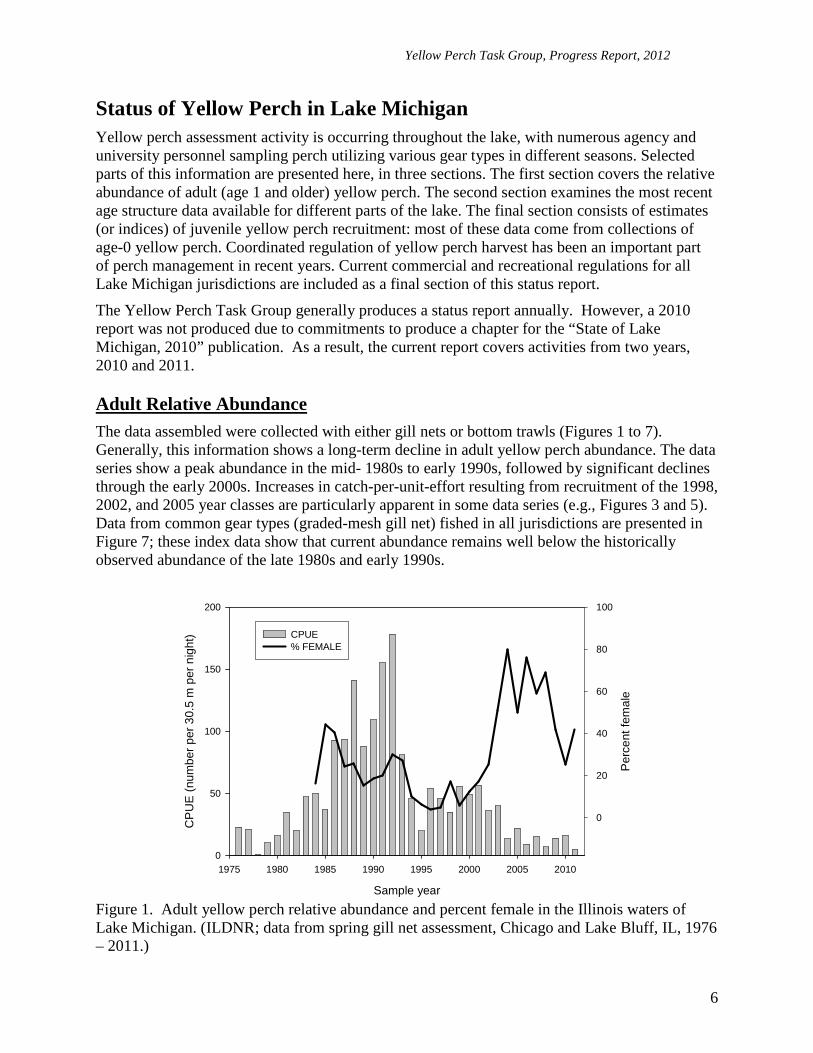
Status of Yellow Perch in Lake Michigan Yellow perch assessment activity is occurring throughout the lake, with numerous agency and university personnel sampling perch utilizing various gear types in different seasons. Selected parts of this information are presented here, in three sections. The first section covers the relative abundance of adult (age 1 and older) yellow perch. The second section examines the most recent age structure data available for different parts of the lake. The final section consists of estimates (or indices) of juvenile yellow perch recruitment: most of these data come from collections of age-0 yellow perch. Coordinated regulation of yellow perch harvest has been an important part of perch management in recent years. Current commercial and recreational regulations for all Lake Michigan jurisdictions are included as a final section of this status report.
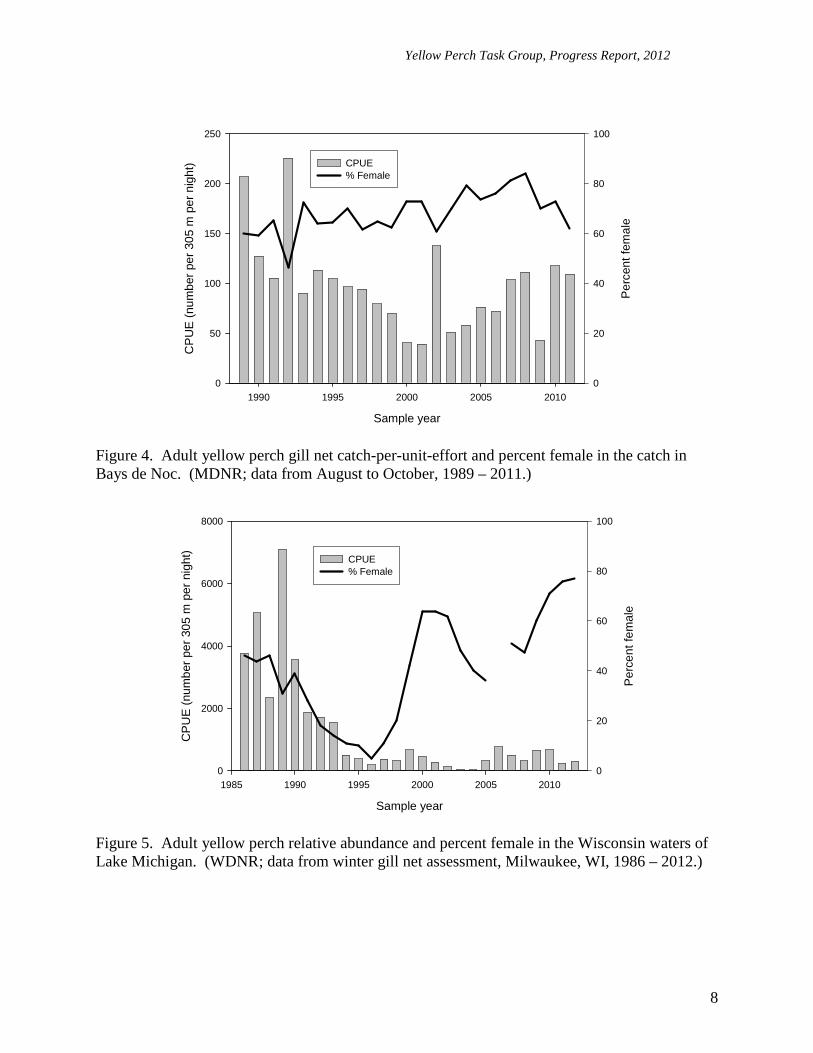
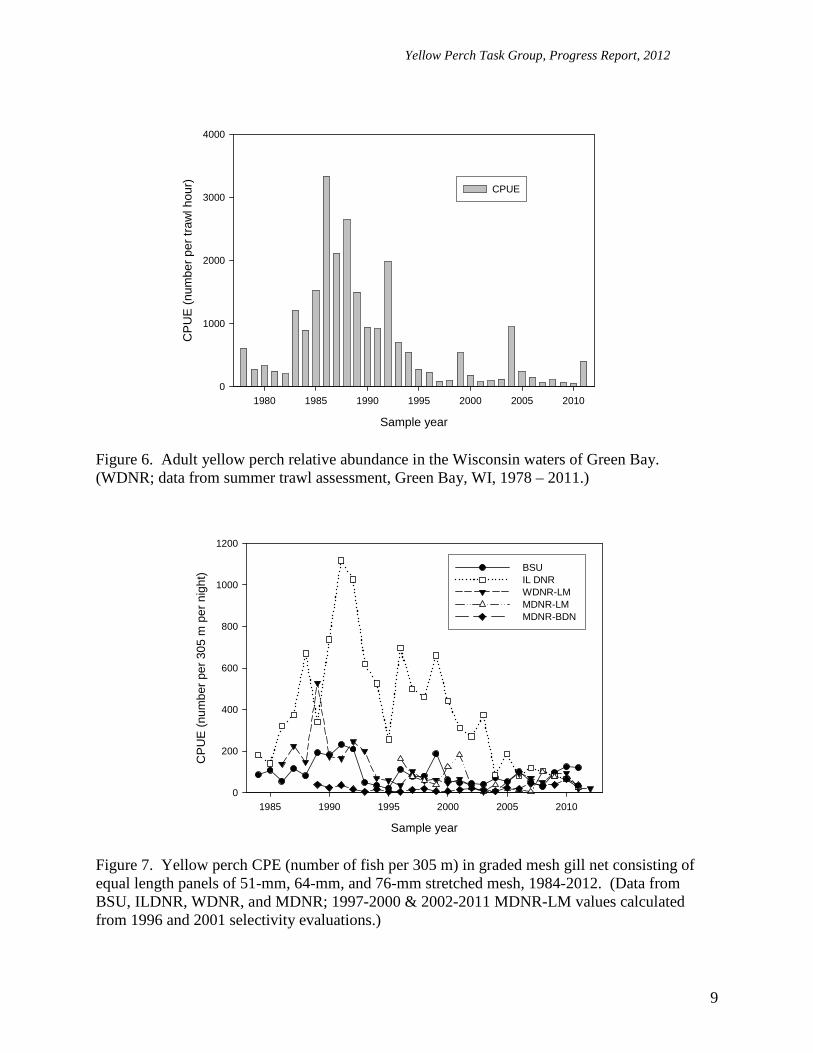
The Yellow Perch Task Group generally produces a status report annually. However, a 2010 report was not produced due to commitments to produce a chapter for the “State of Lake Michigan, 2010” publication. As a result, the current report covers activities from two years, 2010 and 2011. Adult Relative Abundance The data assembled were collected with either gill nets or bottom trawls (Figures 1 to 7). Generally, this information shows a long-term decline in adult yellow perch abundance. The data series show a peak abundance in the mid- 1980s to early 1990s, followed by significant declines through the early 2000s. Increases in catch-per-unit-effort resulting from recruitment of the 1998, 2002, and 2005 year classes are particularly apparent in some data series (e.g., Figures 3 and 5). Data from common gear types (graded-mesh gill net) fished in all jurisdictions are presented in Figure 7; these index data show that current abundance remains well below the historically observed abundance of the late 1980s and early 1990s.
Sample year
1975 1980 1985 1990 1995 2000 2005 2010
CP
UE
(nu
mbe
r pe
r 30
.5 m
per
nig
ht)
0
50
100
150
200
Per
cent
fem
ale
0
20
40
60
80
100
CPUE% FEMALE
Figure 1. Adult yellow perch relative abundance and percent female in the Illinois waters of Lake Michigan. (ILDNR; data from spring gill net assessment, Chicago and Lake Bluff, IL, 1976 – 2011.)
Yellow Perch Task Group, Progress Report, 2012
7
Sample year
1975 1980 1985 1990 1995 2000 2005 2010
CP
UE
(nu
mbe
r pe
r tr
awl h
our)
0
500
1000
1500
2000
2500
Per
cent
fem
ale
0
20
40
60
80
100
CPUE% Female
Figure 2. Adult yellow perch trawl CPUE and percent female in Indiana waters of Lake Michigan. (Ball State University; data from summer trawl survey at sites M and K in 1975 – 2011.)
Sample year
1995 2000 2005 2010
CP
UE
(nu
mbe
r pe
r 30
5 m
per
nig
ht)
0
100
200
300
400
Per
cent
fem
ale
0
20
40
60
80
100
CPUE% Female
Figure 3. Adult yellow perch gill net catch-per-unit-effort and percent female in the catch at four southern Lake Michigan ports (Grand Haven, Saugatuck, South Haven, and St. Joseph, MI). (MDNR; data from April-June, 1996 – 2011.)
Yellow Perch Task Group, Progress Report, 2012
8
Sample year
1990 1995 2000 2005 2010
CP
UE
(nu
mbe
r pe
r 30
5 m
per
nig
ht)
0
50
100
150
200
250
Per
cent
fem
ale
0
20
40
60
80
100
CPUE% Female
Figure 4. Adult yellow perch gill net catch-per-unit-effort and percent female in the catch in Bays de Noc. (MDNR; data from August to October, 1989 – 2011.)
Sample year
1985 1990 1995 2000 2005 2010
CP
UE
(nu
mbe
r pe
r 30
5 m
per
nig
ht)
0
2000
4000
6000
8000
Per
cent
fem
ale
0
20
40
60
80
100
CPUE% Female
Figure 5. Adult yellow perch relative abundance and percent female in the Wisconsin waters of Lake Michigan. (WDNR; data from winter gill net assessment, Milwaukee, WI, 1986 – 2012.)
Yellow Perch Task Group, Progress Report, 2012
9
Sample year
1980 1985 1990 1995 2000 2005 2010
CP
UE
(nu
mbe
r pe
r tr
awl h
our)
0
1000
2000
3000
4000
CPUE
Figure 6. Adult yellow perch relative abundance in the Wisconsin waters of Green Bay. (WDNR; data from summer trawl assessment, Green Bay, WI, 1978 – 2011.)
Sample year
1985 1990 1995 2000 2005 2010
CP
UE
(nu
mbe
r pe
r 30
5 m
per
nig
ht)
0
200
400
600
800
1000
1200
BSU IL DNR WDNR-LM MDNR-LM MDNR-BDN
Figure 7. Yellow perch CPE (number of fish per 305 m) in graded mesh gill net consisting of equal length panels of 51-mm, 64-mm, and 76-mm stretched mesh, 1984-2012. (Data from BSU, ILDNR, WDNR, and MDNR; 1997-2000 & 2002-2011 MDNR-LM values calculated from 1996 and 2001 selectivity evaluations.)
Yellow Perch Task Group, Progress Report, 2012
10
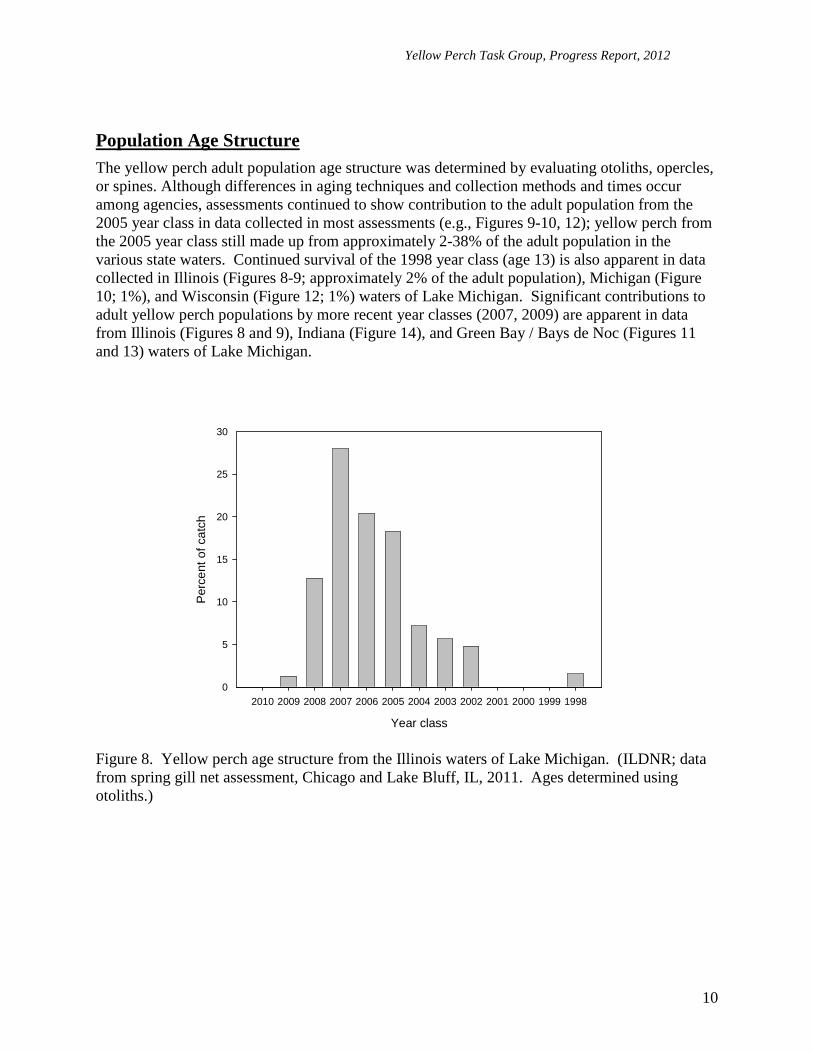
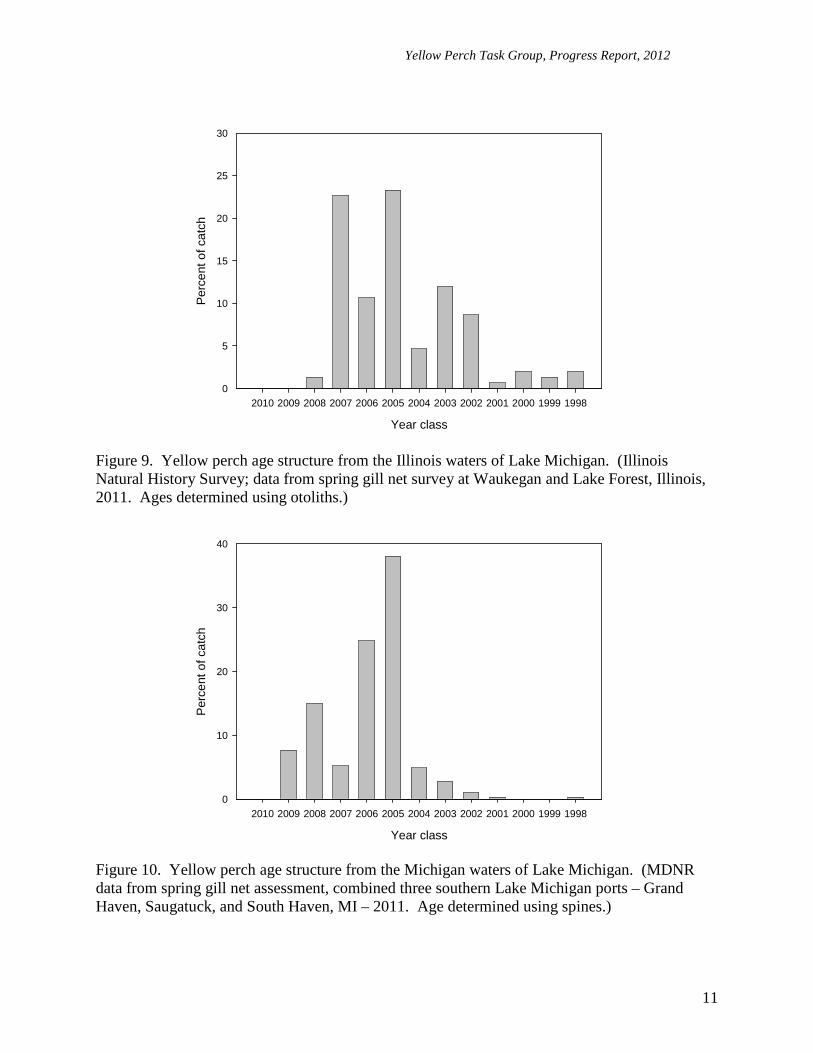
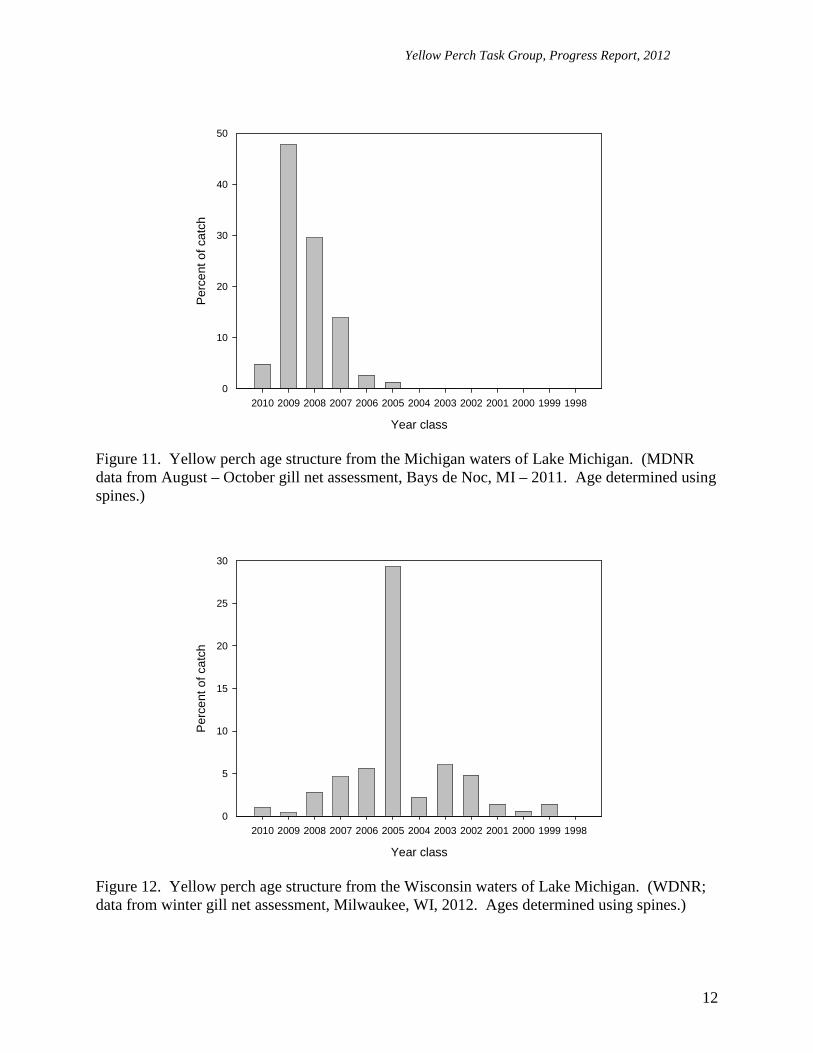
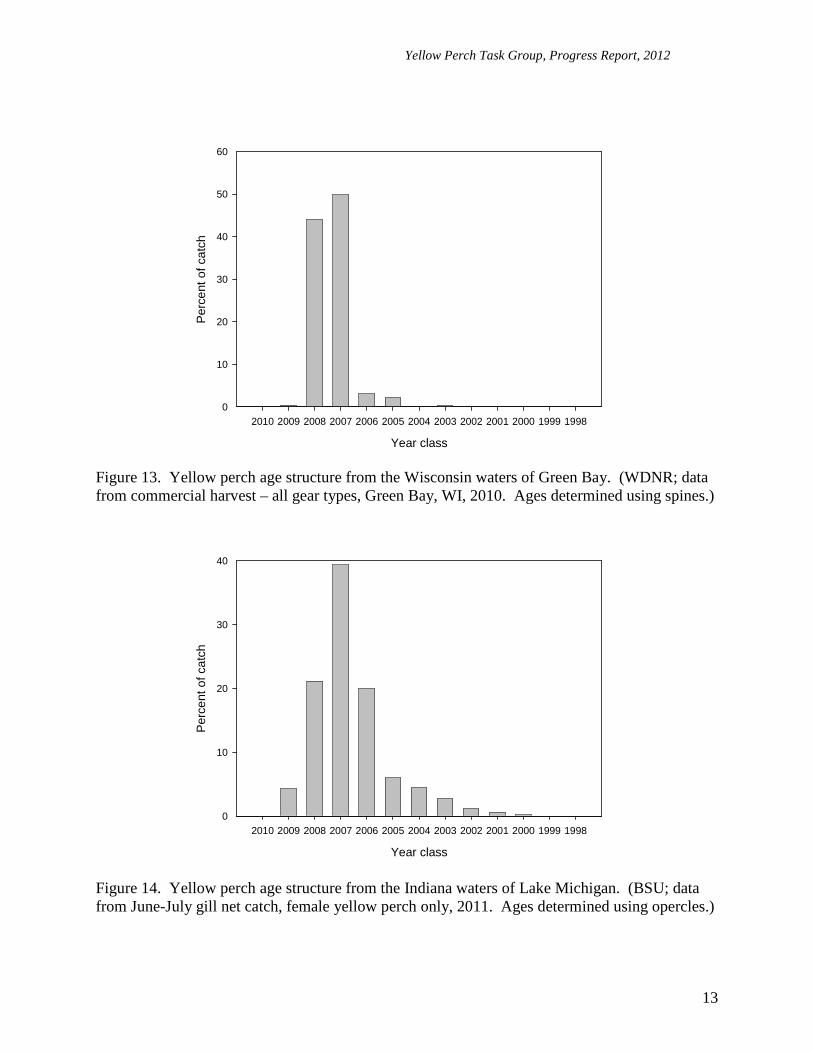
Population Age Structure The yellow perch adult population age structure was determined by evaluating otoliths, opercles, or spines. Although differences in aging techniques and collection methods and times occur among agencies, assessments continued to show contribution to the adult population from the 2005 year class in data collected in most assessments (e.g., Figures 9-10, 12); yellow perch from the 2005 year class still made up from approximately 2-38% of the adult population in the various state waters. Continued survival of the 1998 year class (age 13) is also apparent in data collected in Illinois (Figures 8-9; approximately 2% of the adult population), Michigan (Figure 10; 1%), and Wisconsin (Figure 12; 1%) waters of Lake Michigan. Significant contributions to adult yellow perch populations by more recent year classes (2007, 2009) are apparent in data from Illinois (Figures 8 and 9), Indiana (Figure 14), and Green Bay / Bays de Noc (Figures 11 and 13) waters of Lake Michigan.
Year class
2010 2009 2008 2007 2006 2005 2004 2003 2002 2001 2000 1999 1998
Per
cent
of c
atch
0
5
10
15
20
25
30
Figure 8. Yellow perch age structure from the Illinois waters of Lake Michigan. (ILDNR; data from spring gill net assessment, Chicago and Lake Bluff, IL, 2011. Ages determined using otoliths.)
Yellow Perch Task Group, Progress Report, 2012
11
Year class
2010 2009 2008 2007 2006 2005 2004 2003 2002 2001 2000 1999 1998
Per
cent
of c
atch
0
5
10
15
20
25
30
Figure 9. Yellow perch age structure from the Illinois waters of Lake Michigan. (Illinois Natural History Survey; data from spring gill net survey at Waukegan and Lake Forest, Illinois, 2011. Ages determined using otoliths.)
Year class
2010 2009 2008 2007 2006 2005 2004 2003 2002 2001 2000 1999 1998
Per
cent
of c
atch
0
10
20
30
40
Figure 10. Yellow perch age structure from the Michigan waters of Lake Michigan. (MDNR data from spring gill net assessment, combined three southern Lake Michigan ports – Grand Haven, Saugatuck, and South Haven, MI – 2011. Age determined using spines.)
Yellow Perch Task Group, Progress Report, 2012
12
Year class
2010 2009 2008 2007 2006 2005 2004 2003 2002 2001 2000 1999 1998
Per
cent
of c
atch
0
10
20
30
40
50
Figure 11. Yellow perch age structure from the Michigan waters of Lake Michigan. (MDNR data from August – October gill net assessment, Bays de Noc, MI – 2011. Age determined using spines.)
Year class
2010 2009 2008 2007 2006 2005 2004 2003 2002 2001 2000 1999 1998
Per
cent
of c
atch
0
5
10
15
20
25
30
Figure 12. Yellow perch age structure from the Wisconsin waters of Lake Michigan. (WDNR; data from winter gill net assessment, Milwaukee, WI, 2012. Ages determined using spines.)
Yellow Perch Task Group, Progress Report, 2012
13
Year class
2010 2009 2008 2007 2006 2005 2004 2003 2002 2001 2000 1999 1998
Per
cent
of c
atch
0
10
20
30
40
50
60
Figure 13. Yellow perch age structure from the Wisconsin waters of Green Bay. (WDNR; data from commercial harvest – all gear types, Green Bay, WI, 2010. Ages determined using spines.)
Year class
2010 2009 2008 2007 2006 2005 2004 2003 2002 2001 2000 1999 1998
Per
cent
of c
atch
0
10
20
30
40
Figure 14. Yellow perch age structure from the Indiana waters of Lake Michigan. (BSU; data from June-July gill net catch, female yellow perch only, 2011. Ages determined using opercles.)
Yellow Perch Task Group, Progress Report, 2012
14
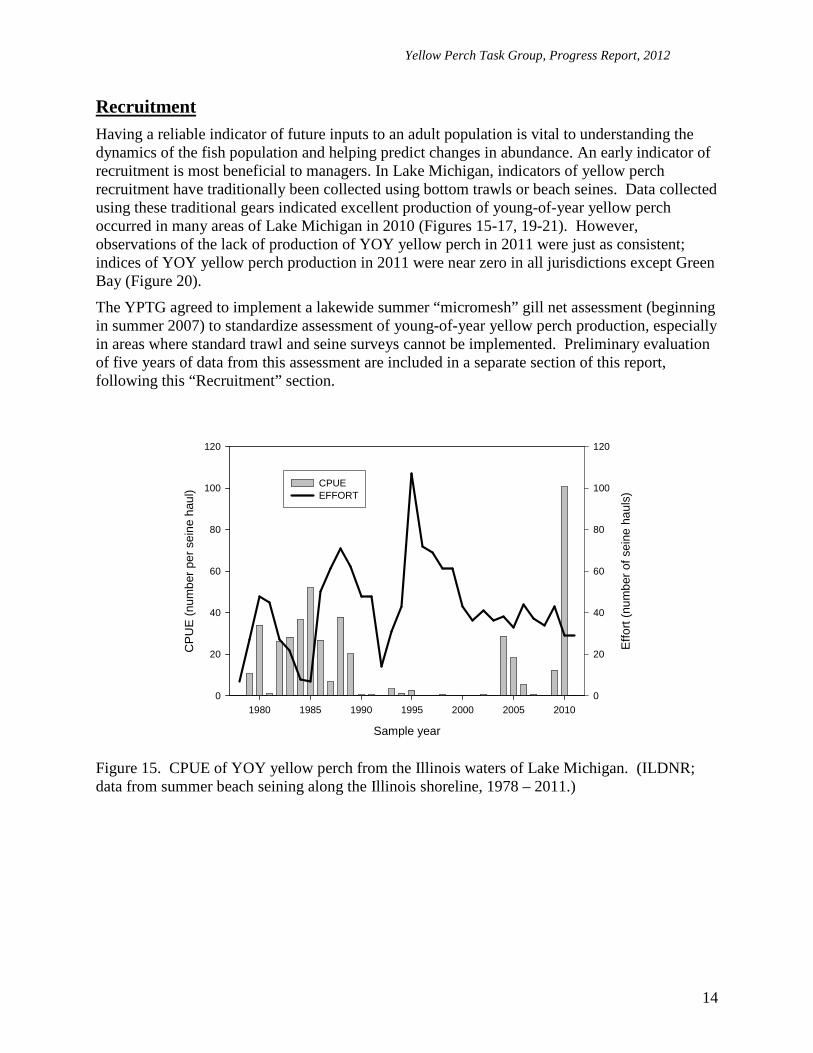
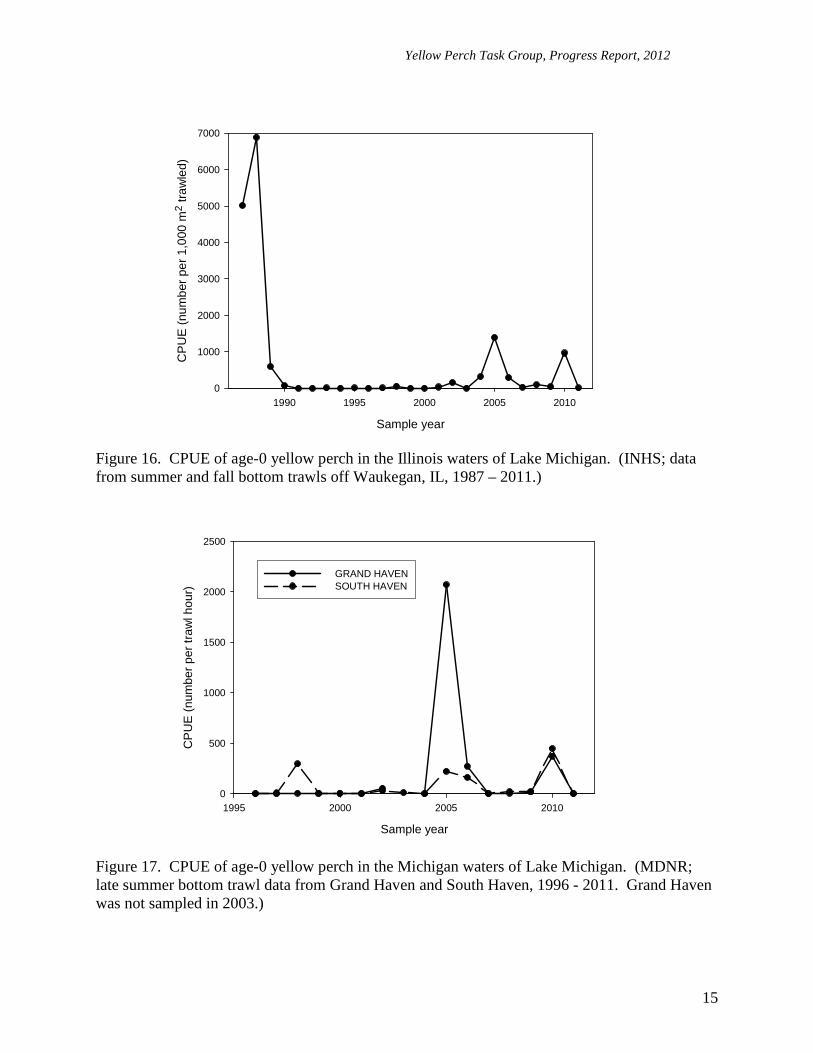
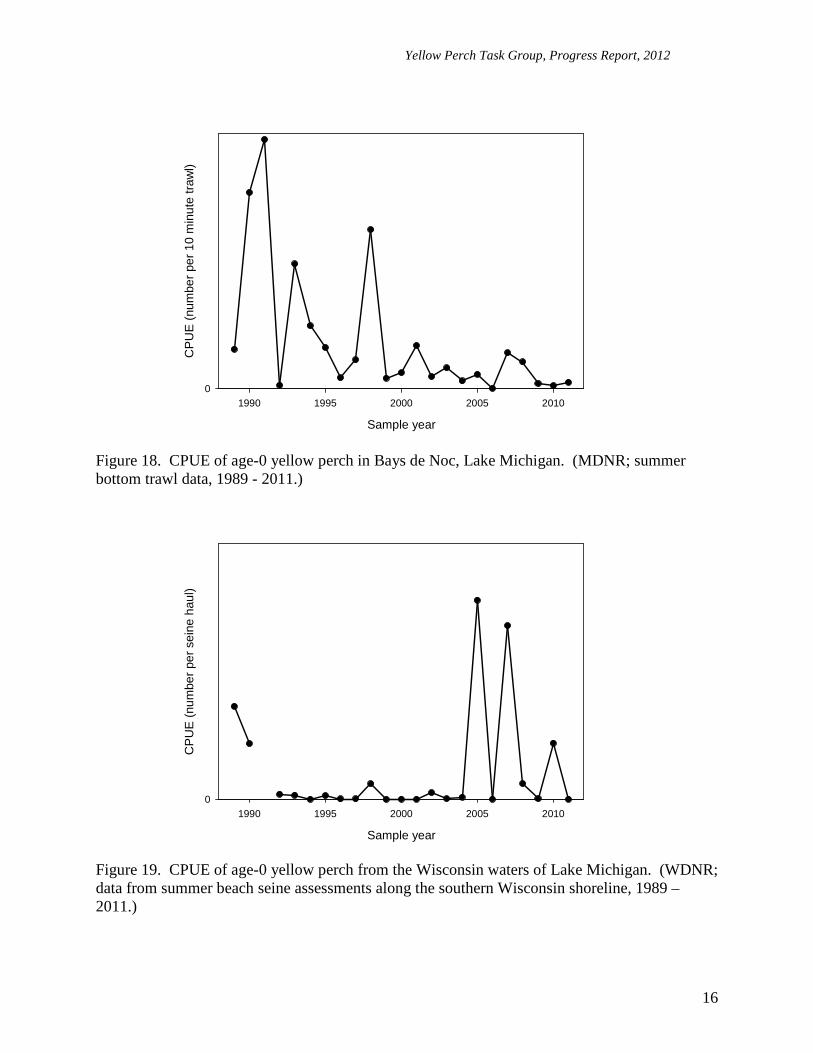
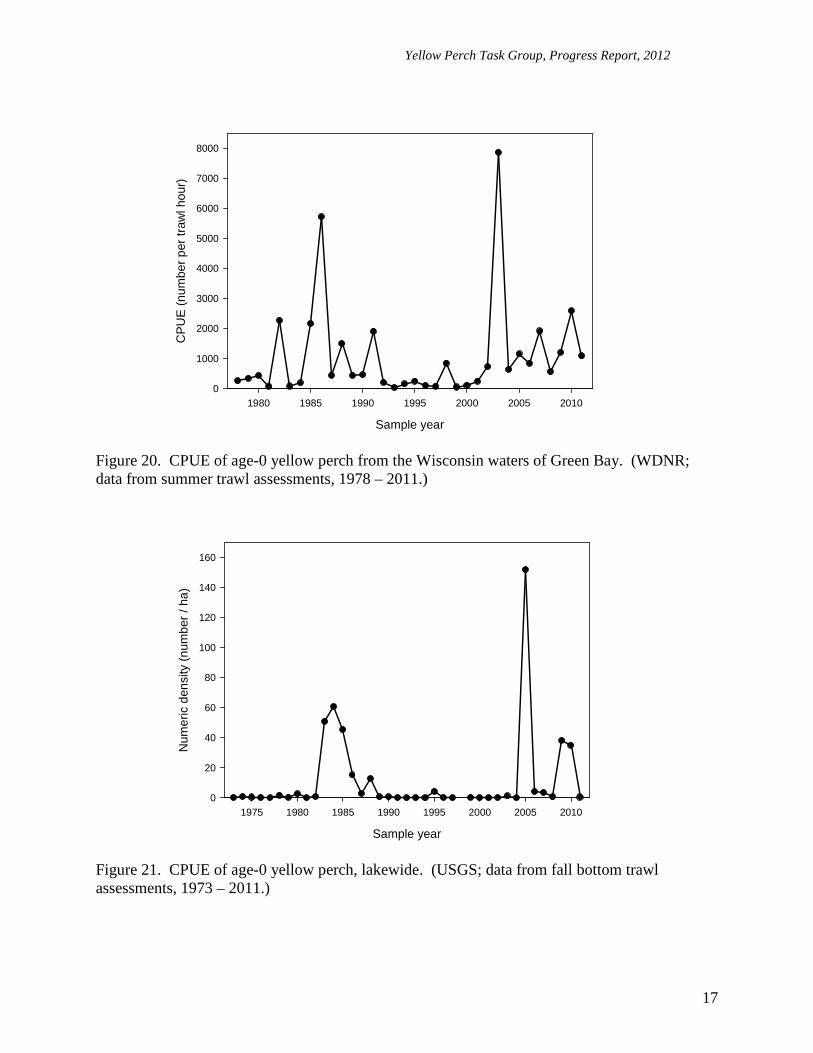
Recruitment Having a reliable indicator of future inputs to an adult population is vital to understanding the dynamics of the fish population and helping predict changes in abundance. An early indicator of recruitment is most beneficial to managers. In Lake Michigan, indicators of yellow perch recruitment have traditionally been collected using bottom trawls or beach seines. Data collected using these traditional gears indicated excellent production of young-of-year yellow perch occurred in many areas of Lake Michigan in 2010 (Figures 15-17, 19-21). However, observations of the lack of production of YOY yellow perch in 2011 were just as consistent; indices of YOY yellow perch production in 2011 were near zero in all jurisdictions except Green Bay (Figure 20).
The YPTG agreed to implement a lakewide summer “micromesh” gill net assessment (beginning in summer 2007) to standardize assessment of young-of-year yellow perch production, especially in areas where standard trawl and seine surveys cannot be implemented. Preliminary evaluation of five years of data from this assessment are included in a separate section of this report, following this “Recruitment” section.
Sample year
1980 1985 1990 1995 2000 2005 2010
CP
UE
(nu
mbe
r pe
r se
ine
haul
)
0
20
40
60
80
100
120
Effo
rt (
num
ber
of s
eine
hau
ls)
0
20
40
60
80
100
120
CPUEEFFORT
Figure 15. CPUE of YOY yellow perch from the Illinois waters of Lake Michigan. (ILDNR; data from summer beach seining along the Illinois shoreline, 1978 – 2011.)
Yellow Perch Task Group, Progress Report, 2012
15
Sample year
1990 1995 2000 2005 2010
CP
UE
(nu
mbe
r pe
r 1,
000
m2
traw
led)
0
1000
2000
3000
4000
5000
6000
7000
Figure 16. CPUE of age-0 yellow perch in the Illinois waters of Lake Michigan. (INHS; data from summer and fall bottom trawls off Waukegan, IL, 1987 – 2011.)
Sample year
1995 2000 2005 2010
CP
UE
(nu
mbe
r pe
r tr
awl h
our)
0
500
1000
1500
2000
2500
GRAND HAVENSOUTH HAVEN
Figure 17. CPUE of age-0 yellow perch in the Michigan waters of Lake Michigan. (MDNR; late summer bottom trawl data from Grand Haven and South Haven, 1996 - 2011. Grand Haven was not sampled in 2003.)
Yellow Perch Task Group, Progress Report, 2012
16
Sample year
1990 1995 2000 2005 2010
CP
UE
(nu
mbe
r pe
r 10
min
ute
traw
l)
0
Figure 18. CPUE of age-0 yellow perch in Bays de Noc, Lake Michigan. (MDNR; summer bottom trawl data, 1989 - 2011.)
Sample year
1990 1995 2000 2005 2010
CP
UE
(nu
mbe
r pe
r se
ine
haul
)
0
Figure 19. CPUE of age-0 yellow perch from the Wisconsin waters of Lake Michigan. (WDNR; data from summer beach seine assessments along the southern Wisconsin shoreline, 1989 – 2011.)
Yellow Perch Task Group, Progress Report, 2012
17
Sample year
1980 1985 1990 1995 2000 2005 2010
CP
UE
(nu
mbe
r pe
r tr
awl h
our)
0
1000
2000
3000
4000
5000
6000
7000
8000
Figure 20. CPUE of age-0 yellow perch from the Wisconsin waters of Green Bay. (WDNR; data from summer trawl assessments, 1978 – 2011.)
Sample year
1975 1980 1985 1990 1995 2000 2005 2010
Num
eric
den
sity
(nu
mbe
r / h
a)
0
20
40
60
80
100
120
140
160
Figure 21. CPUE of age-0 yellow perch, lakewide. (USGS; data from fall bottom trawl assessments, 1973 – 2011.)
Yellow Perch Task Group, Progress Report, 2012
18
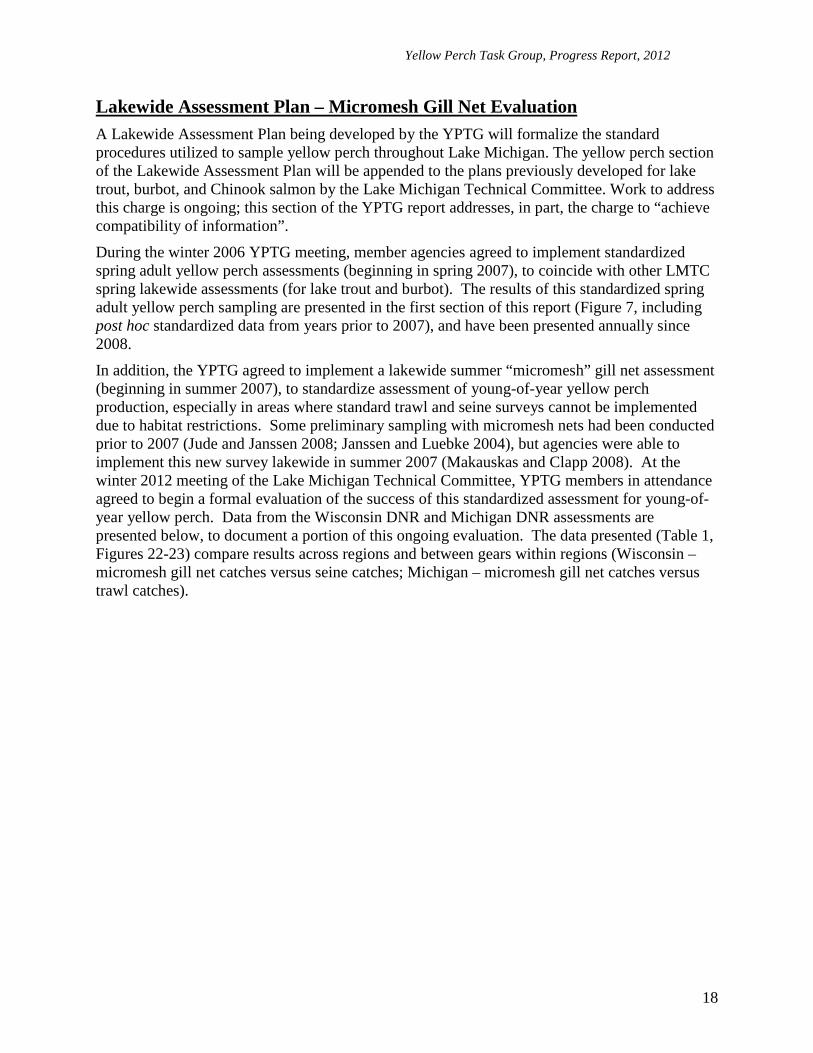
Lakewide Assessment Plan – Micromesh Gill Net Evaluation A Lakewide Assessment Plan being developed by the YPTG will formalize the standard procedures utilized to sample yellow perch throughout Lake Michigan. The yellow perch section of the Lakewide Assessment Plan will be appended to the plans previously developed for lake trout, burbot, and Chinook salmon by the Lake Michigan Technical Committee. Work to address this charge is ongoing; this section of the YPTG report addresses, in part, the charge to “achieve compatibility of information”.
During the winter 2006 YPTG meeting, member agencies agreed to implement standardized spring adult yellow perch assessments (beginning in spring 2007), to coincide with other LMTC spring lakewide assessments (for lake trout and burbot). The results of this standardized spring adult yellow perch sampling are presented in the first section of this report (Figure 7, including post hoc standardized data from years prior to 2007), and have been presented annually since 2008.
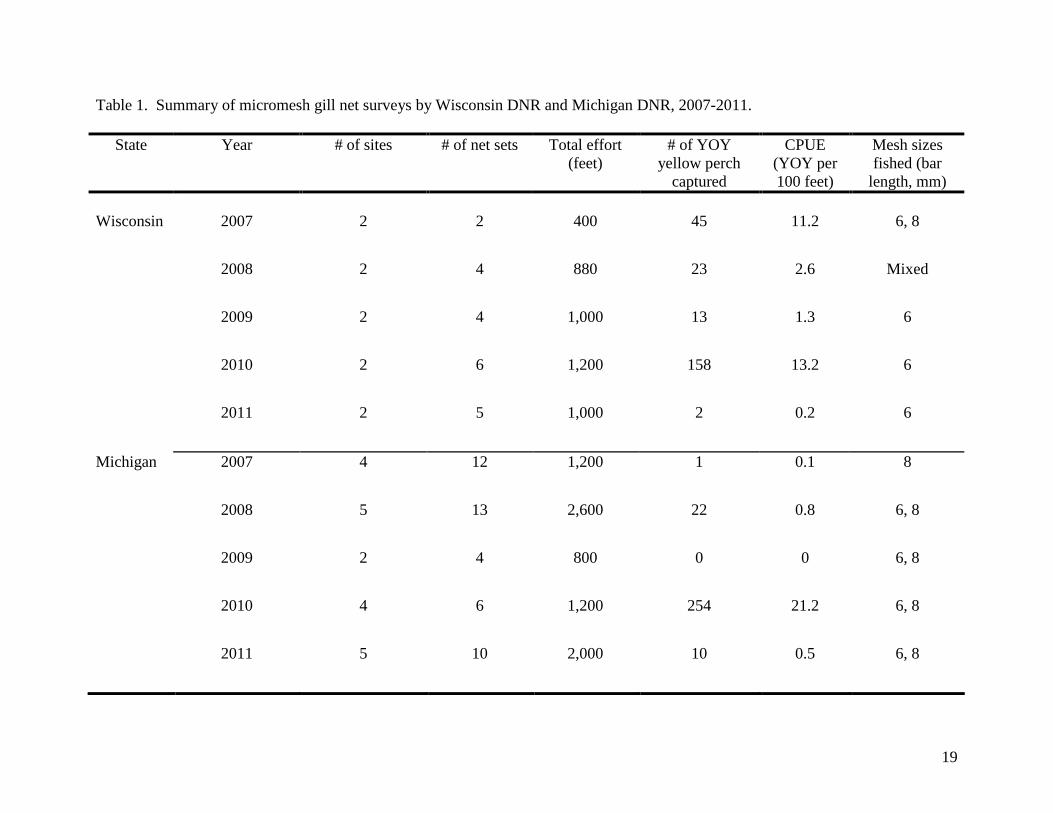
In addition, the YPTG agreed to implement a lakewide summer “micromesh” gill net assessment (beginning in summer 2007), to standardize assessment of young-of-year yellow perch production, especially in areas where standard trawl and seine surveys cannot be implemented due to habitat restrictions. Some preliminary sampling with micromesh nets had been conducted prior to 2007 (Jude and Janssen 2008; Janssen and Luebke 2004), but agencies were able to implement this new survey lakewide in summer 2007 (Makauskas and Clapp 2008). At the winter 2012 meeting of the Lake Michigan Technical Committee, YPTG members in attendance agreed to begin a formal evaluation of the success of this standardized assessment for young-of-year yellow perch. Data from the Wisconsin DNR and Michigan DNR assessments are presented below, to document a portion of this ongoing evaluation. The data presented (Table 1, Figures 22-23) compare results across regions and between gears within regions (Wisconsin – micromesh gill net catches versus seine catches; Michigan – micromesh gill net catches versus trawl catches).
19
Table 1. Summary of micromesh gill net surveys by Wisconsin DNR and Michigan DNR, 2007-2011.
State Year # of sites # of net sets Total effort (feet)
# of YOY yellow perch
captured
CPUE (YOY per 100 feet)
Mesh sizes fished (bar
length, mm) Wisconsin 2007 2 2 400 45 11.2 6, 8
2008 2 4 880 23 2.6 Mixed
2009 2 4 1,000 13 1.3 6
2010 2 6 1,200 158 13.2 6
2011 2 5 1,000 2 0.2 6
Michigan 2007 4 12 1,200 1 0.1 8
2008 5 13 2,600 22 0.8 6, 8
2009 2 4 800 0 0 6, 8
2010 4 6 1,200 254 21.2 6, 8
2011 5 10 2,000 10 0.5 6, 8
20
A) WISCONSIN - MICROMESH VS. SEINE
Sample year
2007 2009 20112008 2010
CP
UE
(nu
mbe
r Y
OY
per
100
feet
)
0
2
4
6
8
10
12
14
CP
UE
(nu
mbe
r Y
OY
per
sei
ne)
0
10
20
30MICROMESH GILL NETSEINE
B) MICHIGAN - MICROMESH VS. TRAWL
Sample year
2007 2009 20112008 2010
CP
UE
(nu
mbe
r Y
OY
per
100
feet
)
0
5
10
15
20
25
CP
UE
(nu
mbe
r Y
OY
per
traw
l hou
r)
0
100
200
300
400
MICROMESH GILL NETTRAWL
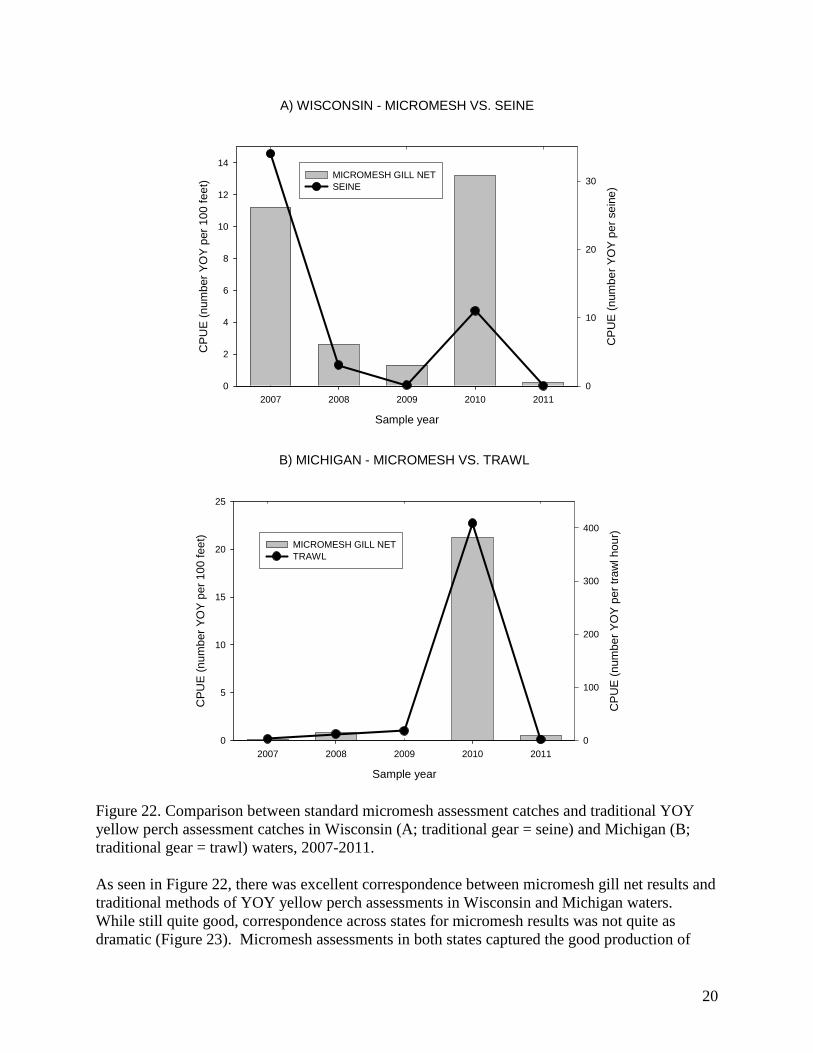
Figure 22. Comparison between standard micromesh assessment catches and traditional YOY yellow perch assessment catches in Wisconsin (A; traditional gear = seine) and Michigan (B; traditional gear = trawl) waters, 2007-2011. As seen in Figure 22, there was excellent correspondence between micromesh gill net results and traditional methods of YOY yellow perch assessments in Wisconsin and Michigan waters. While still quite good, correspondence across states for micromesh results was not quite as dramatic (Figure 23). Micromesh assessments in both states captured the good production of
Yellow Perch Task Group, Progress Report, 2012
21
YOY yellow perch in 2010, and catches were generally low in both states in 2008, 2009, and 2011. However, 2007 results were not consistent between the two regions of Lake Michigan.
Sample year
2007 2008 2009 20112010
CP
UE
(Y
OY
yel
low
per
ch p
er 1
00 fe
et)
0
5
10
15
20
25
MICHIGANWISCONSIN
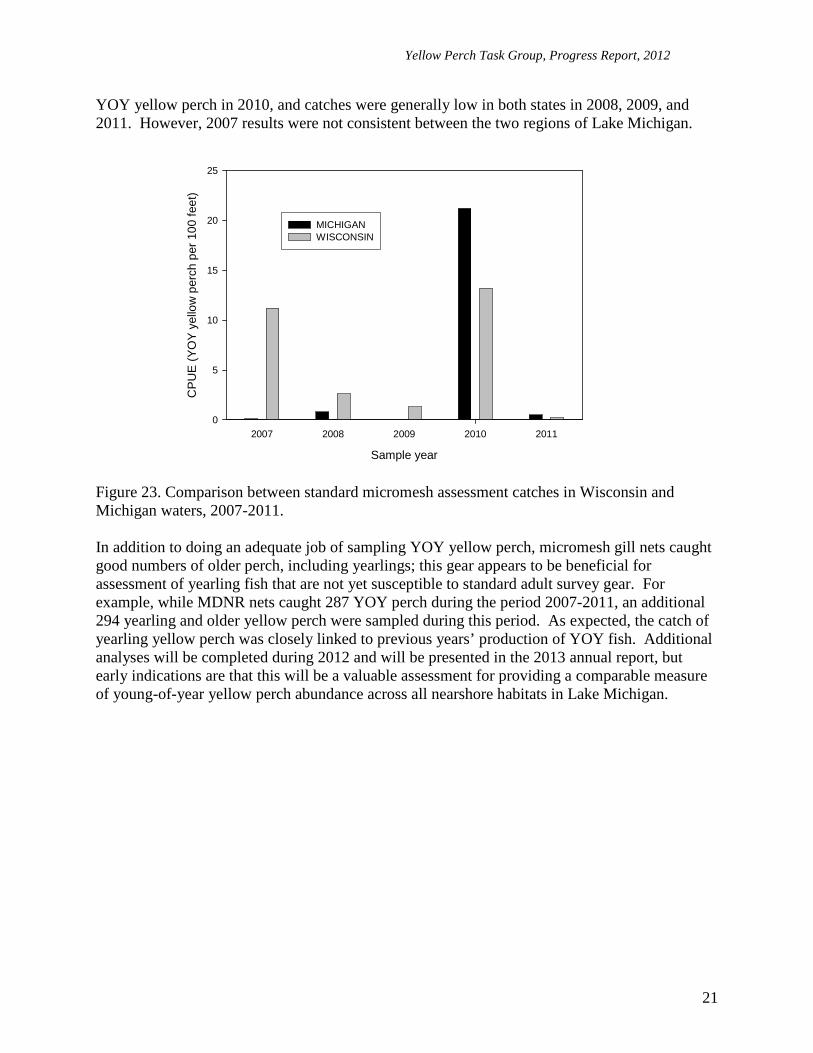
Figure 23. Comparison between standard micromesh assessment catches in Wisconsin and Michigan waters, 2007-2011. In addition to doing an adequate job of sampling YOY yellow perch, micromesh gill nets caught good numbers of older perch, including yearlings; this gear appears to be beneficial for assessment of yearling fish that are not yet susceptible to standard adult survey gear. For example, while MDNR nets caught 287 YOY perch during the period 2007-2011, an additional 294 yearling and older yellow perch were sampled during this period. As expected, the catch of yearling yellow perch was closely linked to previous years’ production of YOY fish. Additional analyses will be completed during 2012 and will be presented in the 2013 annual report, but early indications are that this will be a valuable assessment for providing a comparable measure of young-of-year yellow perch abundance across all nearshore habitats in Lake Michigan.
Yellow Perch Task Group, Progress Report, 2012
22
2012 Yellow Perch Harvest Restrictions Sportfishing regulations:
� Illinois o July closed to sportfishing for yellow perch (exception: under 16 years of age – 10
fish bag limit) o Daily bag limit 15 fish
� Indiana o No closed season for yellow perch o Daily bag limit 15 fish
� Michigan o No closed season for yellow perch o Daily bag limit; 35 fish (south of the 45th parallel) / 50 fish (north of 45th parallel
and Grand Traverse Bays) � Wisconsin (Lake Michigan)
o May 1 through June 15; closed to sportfishing for yellow perch o Daily bag limit 5 fish
� Wisconsin (Green Bay) o March 16 through May 19; closed to sportfishing for yellow perch o Daily bag limit 15 fish
Commercial regulations:
� Illinois perch fishery remained closed � Indiana perch fishery remained closed � Michigan does not allow a commercial harvest (outside of 1836 Treaty waters) � Wisconsin perch fishery remained closed (outside of Green Bay, where quota for
2012 is 100,000 pounds) Task Group Meetings Outside of the regular summer and winter LMTC meetings, no additional meetings of the YPTG were convened during 2010-11. However, during this period members of the YPTG did complete the “Inshore and Benthivore Objectives” chapter of the 2010 State of Lake Michigan draft publication. References Janssen, J., and M. A. Luebke. 2004. Preference for rocky habitats by age-0 yellow perch and
alewives. Journal of Great Lakes Research 30:93-99. Jude, D., and J. Janssen. 2008. Impact of round gobies on yellow perch recruitment success.
Annual progress report to U.S. EPA. Makauskas, D., and D.Clapp. 2008. Status of Yellow Perch in Lake Michigan, and Yellow
Perch Task Group Progress Report. Minutes of the Lake Michigan Committee.
Yellow Perch Task Group, Progress Report, 2012
23
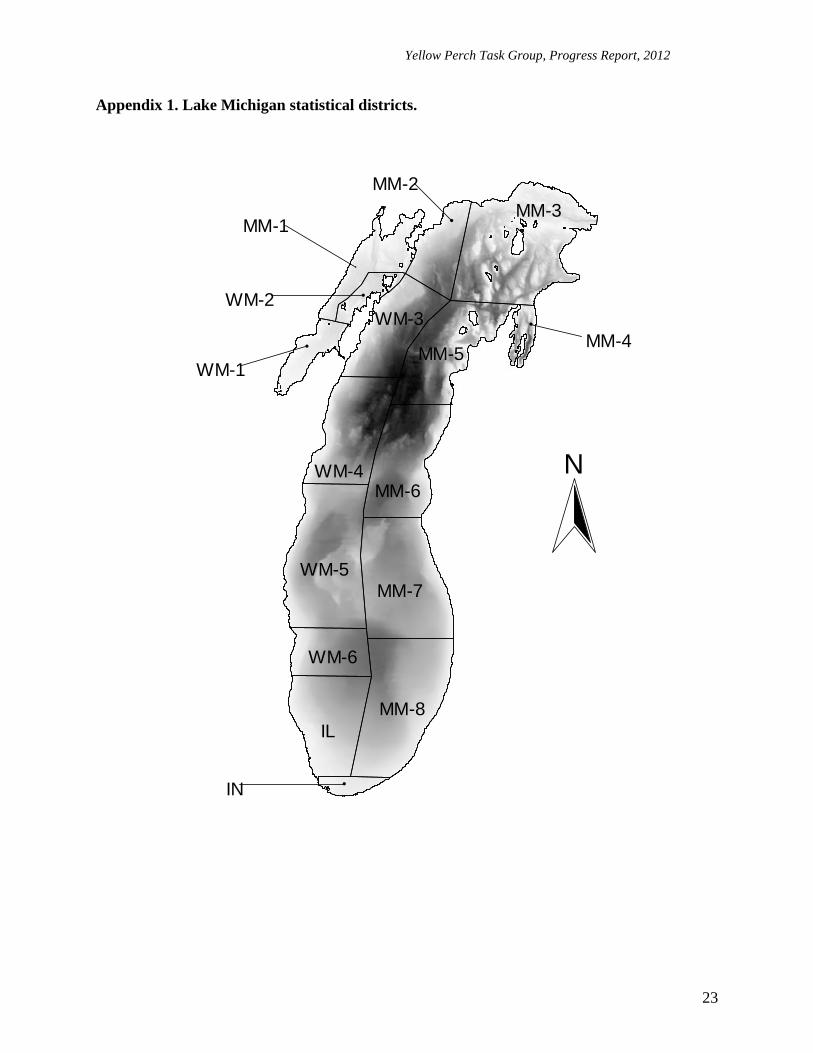
Appendix 1. Lake Michigan statistical districts.
WM-5MM-7
MM-8
WM-6
IL
WM-4MM-6
MM-5
WM-3
MM-3
#
WM-1
#WM-2#
MM-4
#IN
#
MM-1 #
MM-2
N