Status of Yellow Perch in Lake Michigan 2010-2011 - Great Lakes ...
Upload
khangminh22Category
view
0download
0
Waterscape genetics of the yellow perch(Perca flavescens): patterns across large connectedecosystems and isolated relict populations
OSVALDO J. SEPULVEDA-VILLET*† and CAROL A. STEPIEN*
*Great Lakes Genetics Laboratory, Lake Erie Center and Department of Environmental Sciences, The University of Toledo, 6200
Bayshore Road, Toledo, OH 43616, USA
Abstract
Comparisons of a species’ genetic diversity and divergence patterns across large con-
nected populations vs. isolated relict areas provide important data for understanding
potential response to global warming, habitat alterations and other perturbations.
Aquatic taxa offer ideal case studies for interpreting these patterns, because their dis-
persal and gene flow often are constrained through narrow connectivity channels that
have changed over geological time and/or from contemporary anthropogenic perturba-
tions. Our research objective is to better understand the interplay between historic
influences and modern-day factors (fishery exploitation, stocking supplementation and
habitat loss) in shaping population genetic patterns of the yellow perch Perca flaves-cens (Percidae: Teleostei) across its native North American range. We employ a modi-
fied landscape genetics approach, analysing sequences from the entire mitochondrial
DNA control region and 15 nuclear DNA microsatellite loci of 664 spawning adults
from 24 populations. Results support that perch from primary glacial refugium areas
(Missourian, Mississippian and Atlantic) founded contemporary northern populations.
Genetic diversity today is highest in southern (never glaciated) populations and also is
appreciable in northern areas that were founded from multiple refugia. Divergence is
greater among isolated populations, both north and south; the southern Gulf Coast rel-
ict populations are the most divergent, reflecting their long history of isolation. Under-
standing the influence of past and current waterway connections on the genetic
structure of yellow perch populations may help us to assess the roles of ongoing
climate change and habitat disruptions towards conserving aquatic biodiversity.
Keywords: glacial refugia, landscape genetics, Perca, Percidae, relict populations, waterscape
genetics, yellow perch
Received 5 October 2011; revision received 6 August 2012; accepted 15 August 2012
Introduction
The genetic diversity of a species that has a wide geo-
graphic range is regulated by habitat connectivity, dis-
persal and distribution over the landscape (Petit et al.
2003; Stepien et al. 2009; Blum et al. 2012). Climate
change may disproportionally increase or decrease
genetic variability across a taxon’s range due to shifts in
physical conditions or biological resources (Hewitt 1999;
Petit et al. 2003; Hampe & Jump 2011), as occurred dur-
ing Pleistocene glaciations (Oberdorff et al. 1997; Davis &
Shaw 2001; Soltis et al. 2006) and is ongoing today (Ara-
ujo & Rahbek 2006; Harris & Taylor 2010). Large con-
nected ranges are believed to provide a variety of
environmental resources that foster robust, diverse popu-
lations, reflecting interplay between migration opportu-
nity and localized adaptation (Lindsay et al. 2008;
Vandewoestijne et al. 2008; Kunin et al. 2009). In contrast,
Correspondence: Carol A. Stepien, Fax: +01 419 530 8399;
E-mail: [email protected]†Present address: Agricultural Research Service, US Department
of Agriculture, 600 E. Greenfield Ave., Milwaukee, WI, 53204,
USA
© 2012 Blackwell Publishing Ltd
Molecular Ecology (2012) doi: 10.1111/mec.12044
isolated relict populations with little connectivity proba-
bly possess relatively low genetic diversity due to
genetic drift, bottlenecks and selection (Moran & Hop-
per 1983; Petit et al. 2003; Coulon et al. 2012). However,
such relict and ‘rear edge’ populations (those found in
fringe latitudinal portions of the native range) may
house critical repositories of genetic diversity, serving
as possible sources for future range expansion in the
face of climate changes (Hampe & Petit 2005; Diekmann
& Serrao 2012).
Aquatic ecosystems offer greater opportunity than
most terrestrial systems to evaluate the respective roles
of historic and contemporary connectivity patterns in
shaping genetic variability due to the preponderance of
narrow and relatively ephemeral connections that link
populations (Boizard et al. 2009; Lamberti et al. 2010).
Because most aquatic populations depend on these link-
ages among lakes, rivers, streams and channels to
migrate and disperse, such physical ‘landscape’ compo-
nents pose distinct biological challenges. For example,
small connected channels may offer limited food and
shelter and extensively differ in size and habitat com-
plexity, which then influence the distribution of popula-
tion variability.
Temperate fauna were shaped by climate change,
habitat loss and geophysical modifications during the
Pleistocene glaciations 2.6 million—10 000 years ago
(ya), whose populations persisted by retreating to gla-
cial refugia (Petit et al. 2003; Hewitt 2004; Provan &
Bennett 2008). Migrants from three primary North
American glacial refugia—Missourian, Mississippian
and Atlantic—then founded the contemporary biodiver-
sity of populations in the northeast and Midwest
regions (Fig. 1). Notably, an estimated 90 fish species
migrated northward from the Mississippian glacial refu-
gium to found modern populations in the Laurentian
Great Lakes, another 14 expanded up from the Atlantic
coastal refugium and some from each met and mixed.
To the west, colonists from the Missourian refugium
primarily founded populations in the upper Great
Plains and Canadian prairies—we term these the
‘Northwest Lake Plains’—as well as the upper Missis-
sippi River watershed and western Lake Superior
(Mandrak & Crossman 1992; Billington 1996; Stepien
et al. 2009; Backhouse-James & Docker 2012).
Our study evaluates the distribution of genetic
diversity across the broad native geographic range of
the yellow perch Perca flavescens (Percidae: Teleostei),
100 200 km050
Great Lakes WatershedWisconsinan Glacial Maximum
Atlantic Ocean
Gulf of Mexico
105° 95° 85° 75° 65°
95° 85° 75° 65°
30°
40°
50°
30°
40°
50°
B
C
ED
M,NO Q
U
S
T
V
W
FG
I,J K,LH
I
I
II
II
IIIIII
IX
IX
V
VIV
IV
VIII
VIII
VII
VIIP
R
X
VI
VI
X
XA
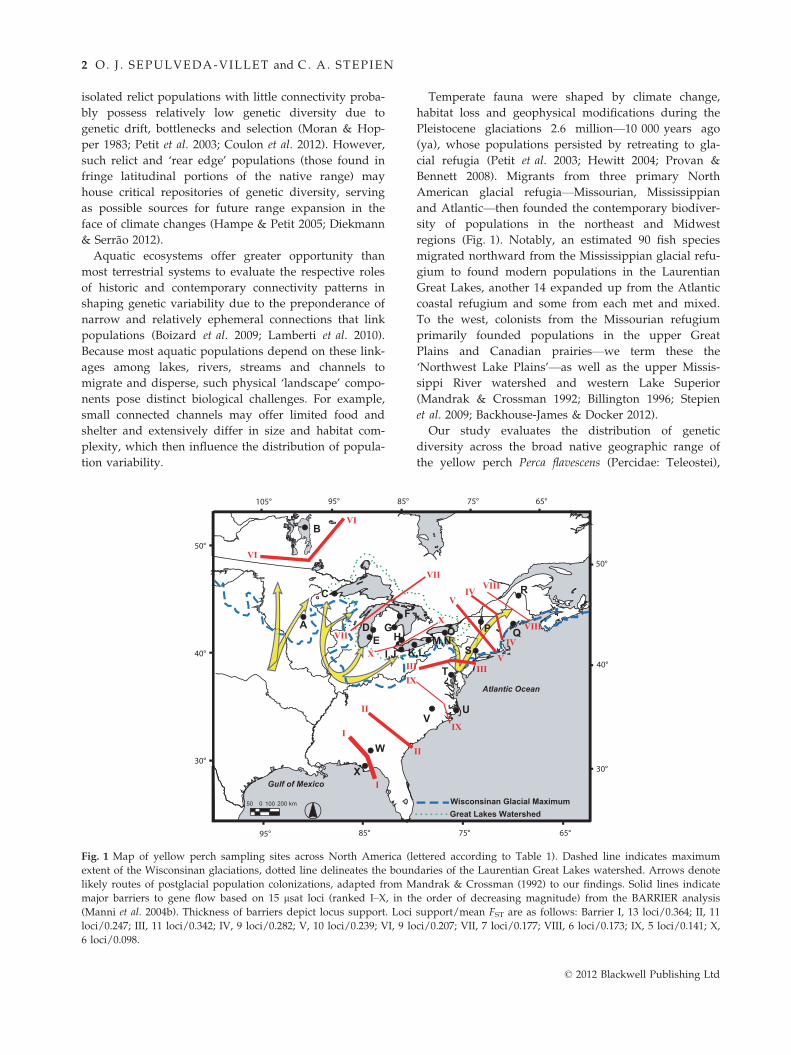
Fig. 1 Map of yellow perch sampling sites across North America (lettered according to Table 1). Dashed line indicates maximum
extent of the Wisconsinan glaciations, dotted line delineates the boundaries of the Laurentian Great Lakes watershed. Arrows denote
likely routes of postglacial population colonizations, adapted from Mandrak & Crossman (1992) to our findings. Solid lines indicate
major barriers to gene flow based on 15 lsat loci (ranked I–X, in the order of decreasing magnitude) from the BARRIER analysis
(Manni et al. 2004b). Thickness of barriers depict locus support. Loci support/mean FST are as follows: Barrier I, 13 loci/0.364; II, 11
loci/0.247; III, 11 loci/0.342; IV, 9 loci/0.282; V, 10 loci/0.239; VI, 9 loci/0.207; VII, 7 loci/0.177; VIII, 6 loci/0.173; IX, 5 loci/0.141; X,
6 loci/0.098.
© 2012 Blackwell Publishing Ltd
2 O. J . SEPULVEDA-VILLET and C. A. STEPIEN
comparing and contrasting genetic structure of northern
postglacial vs. southern relict populations. Its native
range spanned from Nova Scotia to southern Gulf of
Mexico estuaries, with its greatest numbers in Lake Erie
(Fig. 1; Scott & Crossman 1973; Boschung & Mayden
2004). Although largely a freshwater species, a few
native yellow perch populations inhabit brackish estua-
rine systems, including deltas of the Chesapeake Bay
(Hardy 1978) and coastal Atlantic seaboard lagoons
(Wang & Kernehan 1979; Jenkins & Burkhead 1994),
which are evaluated here (Fig. 1). We also analyse a
rare relict native population from the Gulf Coast, docu-
mented from 1851 (Smith-Vaniz 1968) and archaeologi-
cal bone evidence from native American settlements
(Sheldon & Cottier 1983). The yellow perch was widely
and intentionally introduced for fisheries throughout
much of North America, for which Great Lakes stocks
were prevalently used (Lee et al. 1980; Grzybowski et al.
2010). Here, we avoid sampling stocked areas to con-
centrate on native population patterns.
Yellow perch school throughout the year, with large
schools of adults congregating in shallow areas of lakes
or rivers during the late spring for spawning (Krieger
et al. 1983; Jansen et al. 2009). Mark and recapture stud-
ies in Lake Michigan suggest loosely organized spawn-
ing complexes, with some straying among proximate
spawning groups (Glover et al. 2008). Evidence for kin
recognition and aggregative homing using olfactory
cues has been reported in the European perch Perca flu-
viatilis (Gerlach et al. 2001; Behrmann-Godel & Gerlach
2008), which similarly might govern fidelity of yellow
perch. Small groups of spawning yellow perch males
fertilize the egg strands of a female (Mangan 2004),
which are draped on submerged vegetation or other
structures (Scott & Crossman 1973). Aalto & Newsome
(1990) found that egg mass removals from given
spawning sites led to fewer fish returning to that popu-
lation in subsequent years than in control sites, suggest-
ing that yellow perch return to the same spawning
populations year after year. Movements of yellow perch
after the spawning season largely are dictated by habi-
tat complexity and foraging capacity, with highest sea-
sonal movements during the fall and the lowest in
summer (Radabaugh et al. 2010). Thus, habitat connec-
tivity and the presence of discrete spawning groups
may determine the overall genetic structure of yellow
perch in a water body.
Earlier studies described selected yellow perch popula-
tions using various genetic markers, including allozymes
(Todd & Hatcher 1993; Moyer & Billington 2004), mitoco-
hondrial (mt) DNA restriction enzyme fragment poly-
morphisms (Billington 1993), mtDNA control region (D-
loop) sequences (Ford & Stepien 2004; Sepulveda-Villet
et al. 2009) and nuclear DNA microsatellites (Brown et al.
2007; Leclerc et al. 2008; Parker et al. 2009; Grzybowski
et al. 2010; Sepulveda-Villet & Stepien 2011). Sampling
limitations and/or lack of genetic marker resolution pre-
cluded prior comprehensive understanding of their pop-
ulation relationships. Here, we evaluate contemporary
and historic influences on yellow perch population
genetic diversity and divergence across the native range
using mtDNA control region sequences and 15 nuclear
DNA microsatellite (lsat) loci. We believe that the com-
bination of mitochondrial and nuclear microsatellite anal-
yses, as well as additional sample sites, allows us to
better evaluate the relationships among spawning
groups, improving our understanding of population
structure.
Objective, hypotheses and experimental framework
Our objective is to analyse population genetic variability
of an ecologically important and commercially valuable
fish species as a baseline in the face of ongoing climate
and anthropogenic changes. We employ a ‘waterscape’
genetics approach that adapts landscape genetics (the
interplay of physical and environmental features on pop-
ulation genetic structure; Manel et al. 2003; Sork & Waits
2010) to a system of isolated relict populations and geo-
graphically connected watersheds linked by small chan-
nels. Our study compares results from nuclear and
mitochondrial DNA markers to evaluate possible evolu-
tionary factors and contemporary influences that shaped
diversity and divergence. Northerly populations were
recolonized from glacial refugia and thus may have
lower genetic diversity from founder effects. Large popu-
lations in the Great Lakes may be relatively genetically
homogenous with high gene flow. Southerly populations
resided a longer time in relatively stable environments,
probably allowing them to differentiate in specialized
habitats, but presumably experienced bottlenecks and
drift due to small population sizes. The following
hypotheses (alternative/null) are tested:
1 Genetic diversity and divergence patterns differ/are
comparable in connected vs. isolated populations.
2 Relationships reflect/do not reflect a pattern of
genetic isolation with geographic distance in connected
vs. unconnected populations.
3 Relationships among northern populations show/do
not show genetic patterns consistent with colonization
from various hypothesized glacial refugia.
4 Genetic diversity and divergence are greater/compa-
rable for populations found in formerly unglaciated
regions than in those that were glaciated.
© 2012 Blackwell Publishing Ltd
WATERSCAPE GENETICS OF YELLOW PERCH 3
Materials and methods
Sampling, DNA extraction and amplification andsequencing
Spawning adult yellow perch (N = 664) were collected
by agency scientists, colleagues and our laboratory from
24 native locations (Table 1). We avoided areas having
known stocking supplementation from nonoriginal pop-
ulation sources (Lee et al. 1980; Fuller & Neilson 2012).
Fin clip tissues were preserved in 95% ethanol in the
field or frozen after collection, from which genomic
DNA was extracted and purified with DNeasy Qiaquick
kits (QIAGEN, Inc., Valencia, CA, USA) and aliquots
were frozen at �80 °C, labelled and archived.
We analysed 15 nuclear lsat DNA loci: Svi4, 17 and
33 (Borer et al. 1999), Svi2, 3 and 7 (Eldridge et al. 2002),
YP13 and 17 (Li et al. 2007) and Mpf1–7 (Grzybowski
et al. 2010), multiplexing some loci and running others
separately, following Sepulveda-Villet & Stepien (2011).
Denatured amplification products were analysed on our
ABI 3130XL Genetic Analyzer with GeneMapper v3.7
software (Applied Biosystems Inc., Foster size City, CA,
USA). Output profiles were manually reviewed to con-
firm correct identification of allelic size variants.
The mtDNA control region (912 bp) was amplified
and sequenced in both directions following Sepulveda-
Villet et al. (2009) using the PCR primers Pro-L, HW1-r
and 12sarH (Martin et al. 1992) and Applied Biosys-
tems, Inc. (ABI; Fullerton, CA, USA) big dye terminator
chemistry sequencing. Sequences were aligned by us
with BIOEDIT v.7.05 (Hall 1999; http://www.mbio.ncsu.
edu/bioedit/bioedit.html, and unique haplotypes were
identified and compared with our laboratory databases
and other percid sequences (Faber & Stepien 1997; Ford
& Stepien 2004; Strange & Stepien 2007; Sepulveda-Vil-
let et al. 2009). GenBank Accession numbers for the
unique haplotype sequences are as follows:
1 = FJ155931, 2 = FJ155932, 3 = FJ155933, 4 = FJ155934,
5 = FJ155935, 6 = FJ155936, 7 = FJ155937, 8 = FJ155938,
9 = FJ155939, 10 = FJ155940, 11 = FJ155941, 12 = FJ155942,
13 = FJ155943, 14 = FJ155944, 15 = FJ155945, 16 = FJ155946,
17 = FJ155947, 18 = FJ155948, 19 = FJ155949, 20 = FJ155950,
21 = FJ155951, 22 = JX454954, 23 = JX454955, 24 =X454956, 25 = JX454957 and 26 = JX454958. Five haplo-
types were newly described in this study (22–26); other
numbers that are not included here were endemic to
Lake Erie and not found in the present study’s sam-
pling regime (Sepulveda-Villet et al. 2009).
Microsatellite DNA data analyses
Population samples were tested for conformance to
Hardy–Weinberg equilibrium (HWE) expectations at
each locus, with significance estimated using the
Markov Chain Monte Carlo (MCMC) method and 1000
randomization procedures (Guo & Thompson 1992) in
GENEPOP v4.0 (Rousset 2008; http://kimura.univ-montp2.
fr/~rousset/Genepop.htm). Deviations were tested for
heterozygote deficiency and null (nonamplified) alleles
(MICRO-CHECKER v2.2.3; van Oosterhout et al. 2004, 2006;
http://www.microchecker.hull.ac.uk), and loci were
analysed for linkage disequilibrium (LD). Significance
levels for HWE and LD tests were adjusted using Bon-
ferroni correction (Sokal & Rohlf 1995). Numbers of pri-
vate (unique) alleles (NPA; those occurring only in a
single spawning group) were identified with CONVERT
v1.31 (Glaubitz 2004; http://www.agriculture.purdue.
edu/fnr/html/faculty/rhodes/students and staff/glau-
bitz/software.htm). Numbers of alleles (NA) and allelic
richness (AR; the number of alleles per locus, adjusted
for sample size using rarefaction per Mousadik &
Petit (1996)) were calculated with FSTAT v2.9.3.2 (Goudet
2002; http://www2.unil.ch/popgen/softwares/fstat.
htm).
To evaluate hypothesis 1 of whether spawning popu-
lations genetically differ, unbiased h (Weir & Cocker-
ham 1984) and q (Michalakis & Excoffier 1996)
estimates of F-statistics and their associated levels of
significance were compared with genetic heterogeneity
at different scales in FSTAT. Pairwise tests for microsatel-
lite and mtDNA data used hST (the FST estimate of Weir
& Cockerham 1984), shown to effectively evaluate
recently diverged populations (Balloux & Lugon-Moulin
2002), and exact nonparametric comparisons with
MCMC probability estimates; both were conducted in
Genepop (Raymond & Rousset 1995; Goudet et al.
1996), with probabilities adjusted via sequential Bonfer-
roni corrections to minimize type I errors (Rice 1989).
Our use of hST facilitated comparisons with our other
studies on this species and other percids (Sepulveda-
Villet et al. 2009; Stepien et al. 2009; Sepulveda-Villet &
Stepien 2011).
We assessed demographic partitioning of genetic var-
iation, testing for correspondence of genetic distance
(hST/1 � hST) to the natural logarithm of geographic
distance, measured as the shortest waterway distance;
regression significance was interpreted from 1000 per-
mutations in GENEPOP (Rousset 1997). Relative magni-
tude of genetic differences among populations was
investigated with BARRIER v2.2 (Manni et al. 2004a,b;
http://www.mnhn.fr/mnhn/ecoanthropologie/software/
barrier.html) to identify genetically discontinuous
assemblages, independent from a priori knowledge of
their relationships. Barriers were ranked according to
their relative number of supporting loci, and bootstrap
support from 2000 iterations of the multilocus hSTmatrix in GENELAND v3.1.4 (Guillot et al. 2005a,b, 2008;
© 2012 Blackwell Publishing Ltd
4 O. J . SEPULVEDA-VILLET and C. A. STEPIEN
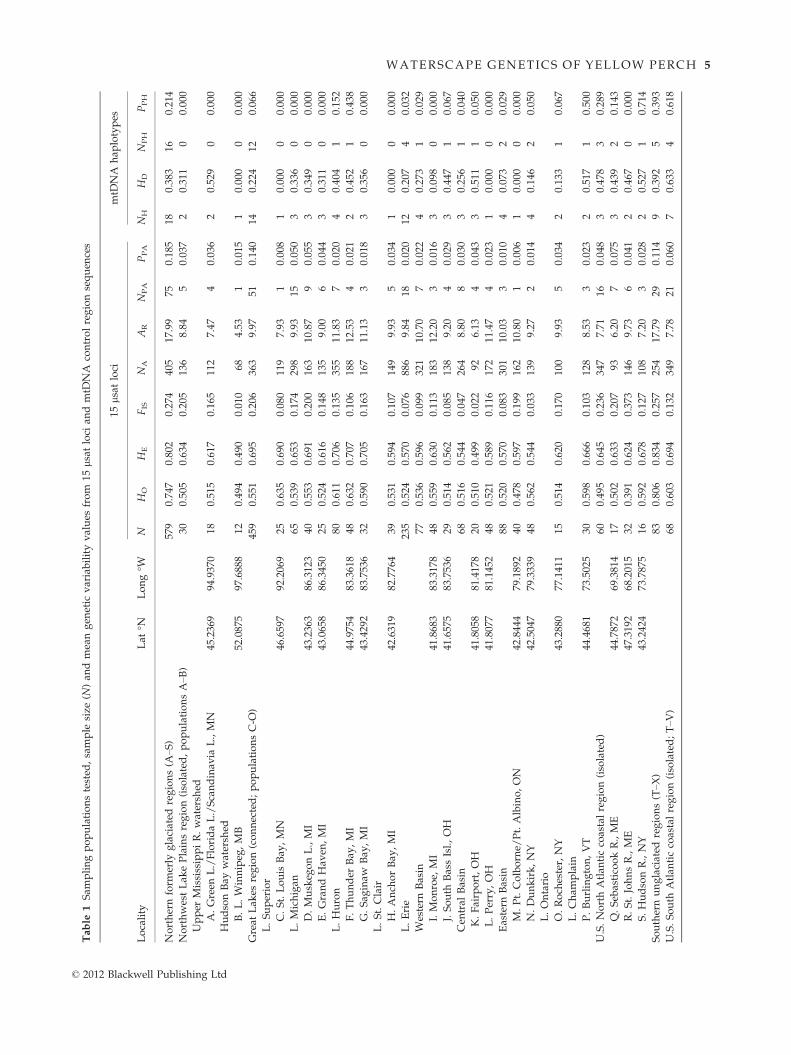
Tab
le1
Sam
plingpopulationstested
,sample
size
(N)an
dmeangen
etic
variabilityvalues
from
15lsat
loci
andmtD
NA
controlregionsequen
ces
Locality
Lat
°NLong°W
15lsat
loci
mtD
NA
hap
lotypes
NH
OH
EFIS
NA
AR
NPA
PPA
NH
HD
NPH
PPH
Northernform
erly
glaciated
regions(A
–S)
579
0.747
0.802
0.274
405
17.99
750.185
180.383
160.214
NorthwestLak
ePlainsregion(isolated,populationsA–B
)30
0.505
0.634
0.205
136
8.84
50.037
20.311
00.000
Upper
MississippiR.watersh
ed
A.Green
L./FloridaL./Scandinav
iaL.,MN
45.2369
�94.9370
180.515
0.617
0.165
112
7.47
40.036
20.529
00.000
HudsonBay
watersh
ed
B.L.Winnipeg
,MB
52.0875
�97.6888
120.494
0.490
�0.010
684.53
10.015
10.000
00.000
Great
Lak
esregion(connected;populationsC-O
)459
0.551
0.695
0.206
363
9.97
510.140
140.224
120.066
L.Superior
C.St.Louis
Bay
,MN
46.6597
�92.2069
250.635
0.690
0.080
119
7.93
10.008
10.000
00.000
L.Michigan
650.539
0.653
0.174
298
9.93
150.050
30.336
00.000
D.Muskeg
onL.,MI
43.2363
�86.3123
400.553
0.691
0.200
163
10.87
90.055
30.349
00.000
E.GrandHav
en,MI
43.0658
�86.3450
250.524
0.616
0.148
135
9.00
60.044
30.311
00.000
L.Huron
800.611
0.706
0.135
355
11.83
70.020
40.404
10.152
F.Thunder
Bay
,MI
44.9754
�83.3618
480.632
0.707
0.106
188
12.53
40.021
20.452
10.438
G.Sag
inaw
Bay
,MI
43.4292
�83.7536
320.590
0.705
0.163
167
11.13
30.018
30.356
00.000
L.St.Clair
H.Anch
orBay
,MI
42.6319
�82.7764
390.531
0.594
0.107
149
9.93
50.034
10.000
00.000
L.Erie
235
0.524
0.570
0.076
886
9.84
180.020
120.207
40.032
Western
Basin
770.536
0.596
0.099
321
10.70
70.022
40.273
10.029
I.Monroe,
MI
41.8683
�83.3178
480.559
0.630
0.113
183
12.20
30.016
30.098
00.000
J.South
BassIsl.,OH
41.6575
�83.7536
290.514
0.562
0.085
138
9.20
40.029
30.447
10.067
Cen
tral
Basin
680.516
0.544
0.047
264
8.80
80.030
30.256
10.040
K.Fairport,OH
41.8058
�81.4178
200.510
0.499
�0.022
926.13
40.043
30.511
10.050
L.Perry,OH
41.8077
�81.1452
480.521
0.589
0.116
172
11.47
40.023
10.000
00.000
Eastern
Basin
880.520
0.570
0.083
301
10.03
30.010
40.073
20.029
M.Pt.Colborne/
Pt.Albino,ON
42.8444
�79.1892
400.478
0.597
0.199
162
10.80
10.006
10.000
00.000
N.Dunkirk,NY
42.5047
�79.3339
480.562
0.544
�0.033
139
9.27
20.014
40.146
20.050
L.Ontario
O.Roch
ester,NY
43.2880
�77.1411
150.514
0.620
0.170
100
9.93
50.034
20.133
10.067
L.Cham
plain
P.Burlington,VT
44.4681
�73.5025
300.598
0.666
0.103
128
8.53
30.023
20.517
10.500
U.S.NorthAtlan
ticcoastalregion(isolated)
600.495
0.645
0.236
347
7.71
160.048
30.478
30.289
Q.Seb
asticookR.,ME
44.7872
�69.3814
170.502
0.633
0.207
936.20
70.075
30.439
20.143
R.St.JohnsR.,ME
47.3192
�68.2015
320.391
0.624
0.373
146
9.73
60.041
20.467
00.000
S.HudsonR.,NY
43.2424
�73.7875
160.592
0.678
0.127
108
7.20
30.028
20.527
10.714
Southernunglaciated
regions(T–X
)83
0.806
0.834
0.257
254
17.79
290.114
90.392
50.393
U.S.South
Atlan
ticcoastalregion(isolated;T–V
)68
0.603
0.694
0.132
349
7.78
210.060
70.633
40.618
© 2012 Blackwell Publishing Ltd
WATERSCAPE GENETICS OF YELLOW PERCH 5
http://www2.imm.dtu.dk/~gigu/Geneland/) using R
v2.13.1 (R Development Core Team 2008; http://www.
r-project.org/). To further test for distinctive popula-
tions, Bayesian-based STRUCTURE v2.3.3 analyses
(Pritchard et al. 2000; Pritchard & Wen 2004; http://
pritch.bsd.uchicago.edu/structure.html) evaluated
membership of individuals to groups, regardless of
their population identity. We compared results from
K = 1 to K = 21 (the total N of significantly divergent
spawning groups) with 10 independent runs each, with
burn-ins of 100 000 and 500 000 MCMC replicates,
using an admixture model, an initial inferred alpha
value of 1.0, a correlated allele assumption, a prior FSTmean of 0.01 and a prior for standard deviation of 0.05.
Optimal K was determined via the DK likelihood proce-
dure from Evanno et al. (2005).
The Bayesian program GENECLASS2 (Piry et al. 2004;
http://www1.montpellier.inra.fr/URLB/index.html) eval-
uated self-assignment of individuals to populations,
using a simulated population size of 10 000 individuals
per site, with a 0.01 rejection level (Cornuet et al. 1999).
To more comprehensively test scenarios of demo-
graphic partitioning, we evaluated % genetic variance
and its significance using Analysis of Molecular Var-
iance (AMOVA; Excoffier et al. 1992) in ARLEQUIN v3.5.12
(Excoffier et al. 2005; Excoffier & Lischer 2010; http://
cmpg.unibe.ch/software/arlequin35/), which compared
relative levels of variation among and within popula-
tion samples. To further examine relationships among
sampling sites, Nei’s (1972) pairwise genetic distances
(Ds) and Cavalli-Sforza and Edwards’ (1967) chord
distances (Dc) were calculated using GENDIST in PHYLIP
v3.69 (Felsenstein 2008) and used to construct a
neighbor-joining (NJ) tree (Saitou and Nei 1987). Rela-
tive support values for the nodes were estimated using
1000 bootstrap pseudoreplicates (Felsenstein 1985) in
PHYLIP. To test the relationship between environmental
variation and genetic structure, we compared heterozy-
gosity and water body area (km2) using GESTE v2.0
(http://www-leca.ujf-grenoble.fr/logiciels.htm; Foll &
Gaggiotti 2006), which utilizes FST values and relates
them to the surface area values using a general linear
model.
Mitochondrial DNA control region data analyses
Pairwise comparisons between sites were performed as
previously described for microsatellite loci. Relation-
ships among mtDNA control region haplotypes were
evaluated using maximum likelihood (ML) in PHYML 3.0
(Guindon et al. 2010; http://www.atgc-montpellier.fr/
phyml/). The tree was rooted to the European perch
Perca fluviatilis (GenBank #Y14724; Nesbø et al. 1999;
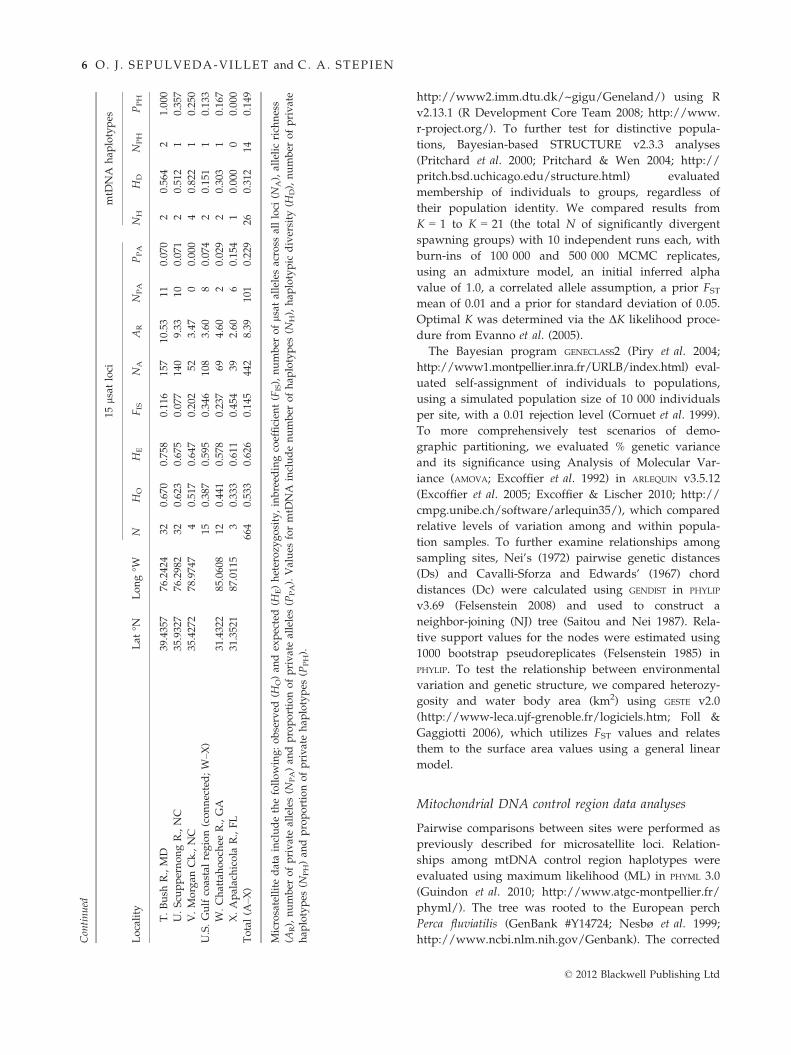
http://www.ncbi.nlm.nih.gov/Genbank). The correctedContinued
Locality
Lat
°NLong°W
15lsatloci
mtD
NA
hap
lotypes
NH
OH
EFIS
NA
AR
NPA
PPA
NH
HD
NPH
PPH
T.Bush
R.,MD
39.4357
�76.2424
320.670
0.758
0.116
157
10.53
110.070
20.564
21.000
U.Scu
ppernongR.,NC
35.9327
�76.2982
320.623
0.675
0.077
140
9.33
100.071
20.512
10.357
V.Morgan
Ck.,NC
35.4272
�78.9747
40.517
0.647
0.202
523.47
00.000
40.822
10.250
U.S.Gulfcoastalregion(connected;W
–X)
150.387
0.595
0.346
108
3.60
80.074
20.151
10.133
W.Chattahooch
eeR.,GA
31.4322
�85.0608
120.441
0.578
0.237
694.60
20.029
20.303
10.167
X.Apalachicola
R.,FL
31.3521
�87.0115
30.333
0.611
0.454
392.60
60.154
10.000
00.000
Total(A
–X)
664
0.533
0.626
0.145
442
8.39
101
0.229
260.312
140.149
Microsatellitedataincludethefollowing:observed
(HO)an
dexpected(H
E)heterozy
gosity,inbreed
ingcoefficien
t(F
IS),number
oflsat
allelesacross
allloci
(NA),allelicrich
ness
(AR),number
ofprivatealleles(N
PA)an
dproportionofprivatealleles(P
PA).Values
formtD
NA
includenumber
ofhap
lotypes
(NH),hap
lotypic
diversity
(HD),number
ofprivate
hap
lotypes
(NPH)an
dproportionofprivatehap
lotypes
(PPH).
© 2012 Blackwell Publishing Ltd
6 O. J . SEPULVEDA-VILLET and C. A. STEPIEN
Akaike information criterion (AICC) from JMODELTEST 0.1.1
(Posada 2008; http://darwin.uvigo.es/software/jmodel-
test.html) was used to determine the most appropriate
model of substitution; the Kimura (1981) six-parameter
model, with unequal frequencies (A = 0.3106; C = 0.2061;
G = 0.1601; T = 0.3231) and a gamma distribution
(a = 0.100), was selected. Support for nodes of the tree
was evaluated with 2000 bootstrap pseudoreplications
(Felsenstein 1985).
The ML tree was compared with a Bayesian analysis
using a Metropolis-coupled MCMC (MC3) approach in
MRBAYES 3.10 (Huelsenbeck & Ronquist 2001; Ronquist &
Huelsenbeck 2003). Analyses were run for 10 million
generations, with sampling every 100. The MC3 burn-in
period was determined by plotting log-likelihood values
for each generation to identify when stationarity was
reached; 25% of the generations were discarded as
burn-in, along with the trees and parameter values sam-
pled prior to burn-in. A 50% majority rule consensus
tree was based on the remaining generations, and
branch support was obtained via the posterior
probability distribution (Holder & Lewis 2003) in MRBA-
YES.
Divergence times among yellow perch haplotypes
were evaluated using a penalized likelihood approach
(Sanderson 2002) in R8S v1.71 (Sanderson 2003). Initially,
the data set was tested for conformance to a molecular
clock model, from which it was determined to vary sig-
nificantly (P < 0.0001). A second analysis then was con-
ducted with an optimal smoothing parameter (=1.00)determined via cross-validation. Divergence time esti-
mates under the latter method need three or more fossil
calibration points to estimate the dates of their respective
nodes, for which other members of the family Percidae
were used: Gymnocephalus cernua (GenBank #AF025355.1;
Stepien et al. 1998; Stepien et al. 2005, G. baloni
(AF025360.1), G. schraetser (AF025361.1), P. fluviatilis
(Y14724), Sander vitreus (AF162272), S. canadensis
(U90618.1) and Percina maculata (PMU90623). Fossil date
estimates for origins of three percid genera included the
early Pliocene epoch [c. 1.8 million years ago (Ma)] for
Gymnocephalus (Holcık & Hensel 1974), Pliocene epoch
(c. 8–10 Ma) for Sander (Murray et al. 2009), and Miocene
epoch (c. 26 Ma) for Perca (Lebedev 1952; based on P. flu-
viatilis from the Crimean Peninsula in Ukraine). To deter-
mine localized mutation rates and 95% confidence
intervals, we utilized the BEAST software suite (1.7.2,
Drummond et al. 2012), as well as the software TRACER 1.4
(Rambaut & Drummond 2007), to visualize interval
and rate data points. We additionally delineated patterns
of genetic aggregation and spatial dispersion, using a
statistical parsimony haplotype network in TCS 1.21
(Clement et al. 2000, http://darwin.uvigo.es/software/
tcs.html).
Results
Genetic composition and diversity of connected andisolated populations (Question 1)
Population genetic parameters from 15 nuclear DNA lsatloci and mtDNA control region sequences for 24 spawning
sites across much of the native range of yellow perch
(Fig. 1) are compared in Table 1. All lsat loci were
unlinked and conformed to HWE expectations after Bon-
ferroni correction (Appendix I). Numbers of lsat alleles
per locus ranged from 14 (Svi3 and 7) to 53 (Mpf1), total-
ling 442 throughout the sampling range. Populations from
the Great Lakes, that is, Thunder Bay in Lake Michigan
(site F; 188 alleles) and Monroe in western Lake Erie (site
I; 183 alleles), possessed the most alleles (Table 1). In com-
parison, a total of 26 mtDNA control region haplotypes
were recovered across the range (Appendix II) and haplo-
type diversity per sample was relatively low, ranging
from a single haplotype (in three populations: Lake Win-
nipeg, site B; Anchor Bay of Lake St. Clair, site H; Apal-
achicola River in the U.S. Gulf coastal region, site X) to a
maximum of four (two populations: Dunkirk in eastern
Lake Erie, site N; Morgan Creek in the U.S. Atlantic
coastal region, site V).
Nuclear DNA heterozygosity (HO) per single sampling
location was highest overall in the Bush River of the U.S.
South Atlantic coastal region (site T; 0.670 mean HO), and
lowest in the Apalachicola River of the Gulf coastal region
(site X; 0.333)—with the latter congruent with its low
mtDNA diversity. All populations except for Morgan
Creek in the South Atlantic coastal region (site V) con-
tained private (i.e. unique) lsat alleles (Table 1); they
numbered from one (Lake Winnipeg; site D) to 11 (Bush
River; site U). Overall, there was a higher proportion of
private alleles in the South Atlantic and Gulf coastal popu-
lations, with the Apalachicola River having the most (site
X; 0.154) and Great Lakes populations having the least—
lowest at Pt. Colborne/Pt. Albino in eastern Lake Erie (site
M; 0.006; Table 1).
In contrast, few regions and individual populations
were distinguished by unique mtDNA control region
haplotypes, with the Great Lakes containing a total of
12 (of those, few were unique to a single Lake; i.e.
Huron-1, Erie-4 and Ontario-1) and the U.S. North
Atlantic coastal region containing three unique haplo-
types, including one predominant in the Hudson River
sample (site S; 0.714). The South Atlantic coastal region
housed the largest proportions of private haplotypes
(0.618), including the Bush River sample (site T; 1.000)
that contained two unique endemic types, distinguishing
all of its individuals (Table 1). Levels of private haplo-
types in the other South Atlantic coastal populations
also were high. Other appreciable private haplotype rep-
© 2012 Blackwell Publishing Ltd
WATERSCAPE GENETICS OF YELLOW PERCH 7
resentation characterized populations from Lake
Champlain (site P; 0.500) and Thunder Bay in Lake
Huron (site F; 0.438). By comparison, overall represen-
tation of unique haplotypes in Lake Erie was much
less (0.032).
Genetic structure and divergence among populationsand regions (Question 1)
Pairwise comparison tests showed that most yellow
perch populations were genetically distinctive, (270 of
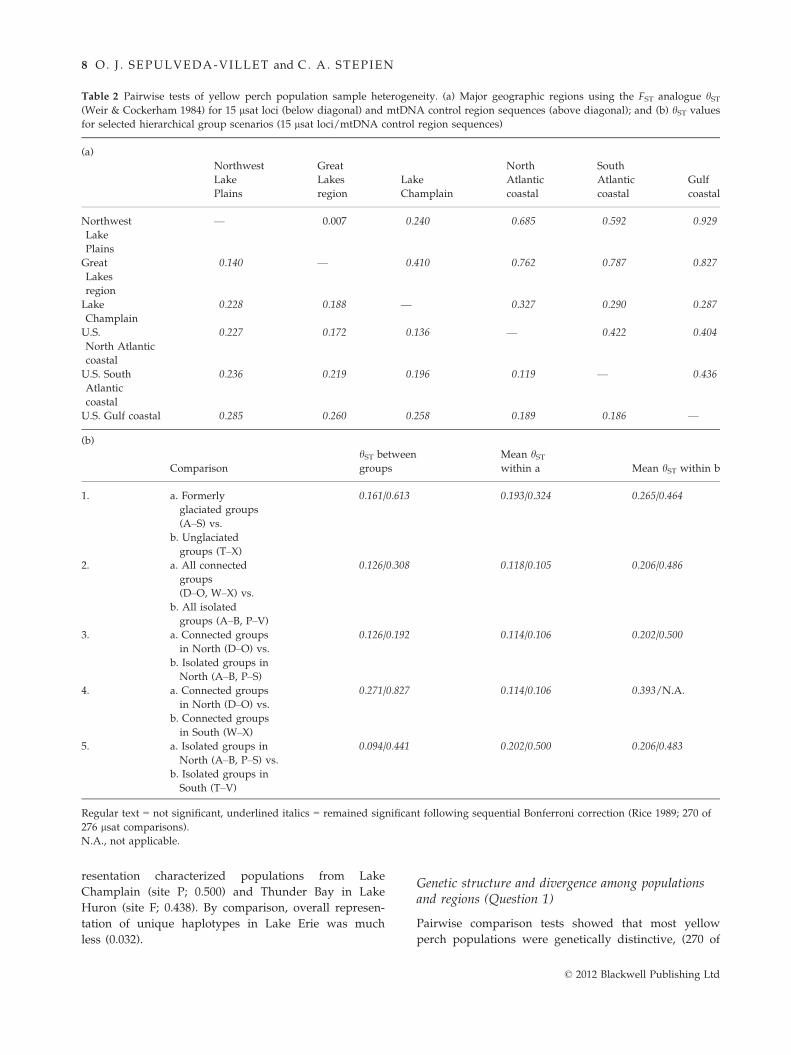
Table 2 Pairwise tests of yellow perch population sample heterogeneity. (a) Major geographic regions using the FST analogue hST(Weir & Cockerham 1984) for 15 lsat loci (below diagonal) and mtDNA control region sequences (above diagonal); and (b) hST values
for selected hierarchical group scenarios (15 lsat loci/mtDNA control region sequences)
(a)
Northwest
Lake
Plains
Great
Lakes
region
Lake
Champlain
North
Atlantic
coastal
South
Atlantic
coastal
Gulf
coastal
Northwest
Lake
Plains
— 0.007 0.240 0.685 0.592 0.929
Great
Lakes
region
0.140 — 0.410 0.762 0.787 0.827
Lake
Champlain
0.228 0.188 — 0.327 0.290 0.287
U.S.
North Atlantic
coastal
0.227 0.172 0.136 — 0.422 0.404
U.S. South
Atlantic
coastal
0.236 0.219 0.196 0.119 — 0.436
U.S. Gulf coastal 0.285 0.260 0.258 0.189 0.186 —
(b)
Comparison
hST between
groups
Mean hSTwithin a Mean hST within b
1. a. Formerly
glaciated groups
(A–S) vs.
0.161/0.613 0.193/0.324 0.265/0.464
b. Unglaciated
groups (T–X)2. a. All connected
groups
(D–O, W–X) vs.
0.126/0.308 0.118/0.105 0.206/0.486
b. All isolated
groups (A–B, P–V)
3. a. Connected groups
in North (D–O) vs.
0.126/0.192 0.114/0.106 0.202/0.500
b. Isolated groups in
North (A–B, P–S)
4. a. Connected groups
in North (D–O) vs.
0.271/0.827 0.114/0.106 0.393/N.A.
b. Connected groups
in South (W–X)5. a. Isolated groups in
North (A–B, P–S) vs.
0.094/0.441 0.202/0.500 0.206/0.483
b. Isolated groups in
South (T–V)
Regular text = not significant, underlined italics = remained significant following sequential Bonferroni correction (Rice 1989; 270 of
276 lsat comparisons).
N.A., not applicable.
© 2012 Blackwell Publishing Ltd
8 O. J . SEPULVEDA-VILLET and C. A. STEPIEN
276 lsat comparisons), revealing significant genetic struc-
ture (Appendix III). Results of hST and qST tests were
congruent, and thus, patterns were not influenced by
sample size; we report the former to facilitate compari-
sons with other studies. The most pronounced differ-
ences were between the Northwest Lake Plains and Gulf
coastal population regions (Table 2a). Isolated popula-
tions had greater among site divergences than character-
ized connected populations (Table 2b). This pattern was
evident in the south as well as in the previously glaci-
ated northern groups, with both having similar diver-
gence levels. Significant differences among spawning
groups within bodies of water further denoted local and
regional genetic structure.
Relationship of geographic distance and populationisolation to genetic divergence (Question 2)
Genetic differences among yellow perch populations
reflected isolation by geographic distance, discerned
from both genetic marker systems: lsat loci (R2 = 0.387,
P < 0.001; Appendix IVa) and mtDNA control region
sequences (R2 = 0.041, P < 0.001; Appendix IVb). Overall,
geographically more distant populations were distin-
guished by higher divergences, yet some nearby groups
also were very different [e.g. Anchor Bay in Lake St.
Clair (site H) vs. western Lake Erie’s South Bass Island
(site D)], indicating localized genetic structure within
connected waterways. Notably, genetic differences
among Lake Erie yellow perch spawning groups
appeared independent of geographic distance in our ear-
lier fine-scale study using lsat data (R2 = 0.014, N.S.; see
Sepulveda-Villet & Stepien 2011). Likewise, among the
connected populations of the Great Lakes region, genetic
isolation did not follow geographic distance using our
present lsat (R2 = 0.130, N.S.) and mtDNA data
(R2 < 0.001, N.S.).
Patterns of genetic delineation and phylogeneticrelationships (Question 3)
BARRIER analysis results identified probable genetic dis-
continuities across the native North American range of
yellow perch. The two most significant barriers (Barrier
I, 13 loci/0.364 mean FST; II, 11 loci/0.247) separated the
Gulf coastal populations from the others, with the third
(III, 11 loci/0.342) isolating unglaciated Atlantic Coast
populations from those north of the maximum extent of
the last glaciations. The next two barriers (IV, 9 loci/
0.282; V, 10 loci/0.239) distinguished the North Atlantic
coastal from the Great Lakes and Northwest populations,
and barrier VI (9 loci/0.207) divided Lake Winnipeg
from the rest. The remaining barriers isolated smaller
populations, such as Lake Superior from the other upper
Great Lakes (VII, 7 loci/0.177), the St. Johns River from
other Atlantic coastal locations (VIII, 6 loci/0.173), Mor-
gan Creek from nearby Chesapeake Bay and Albemarle
Sound (IX, 5 loci/0.141) and finally a division between
the upper and lower Great Lakes (X, 6 loci/0.098; Fig. 1).
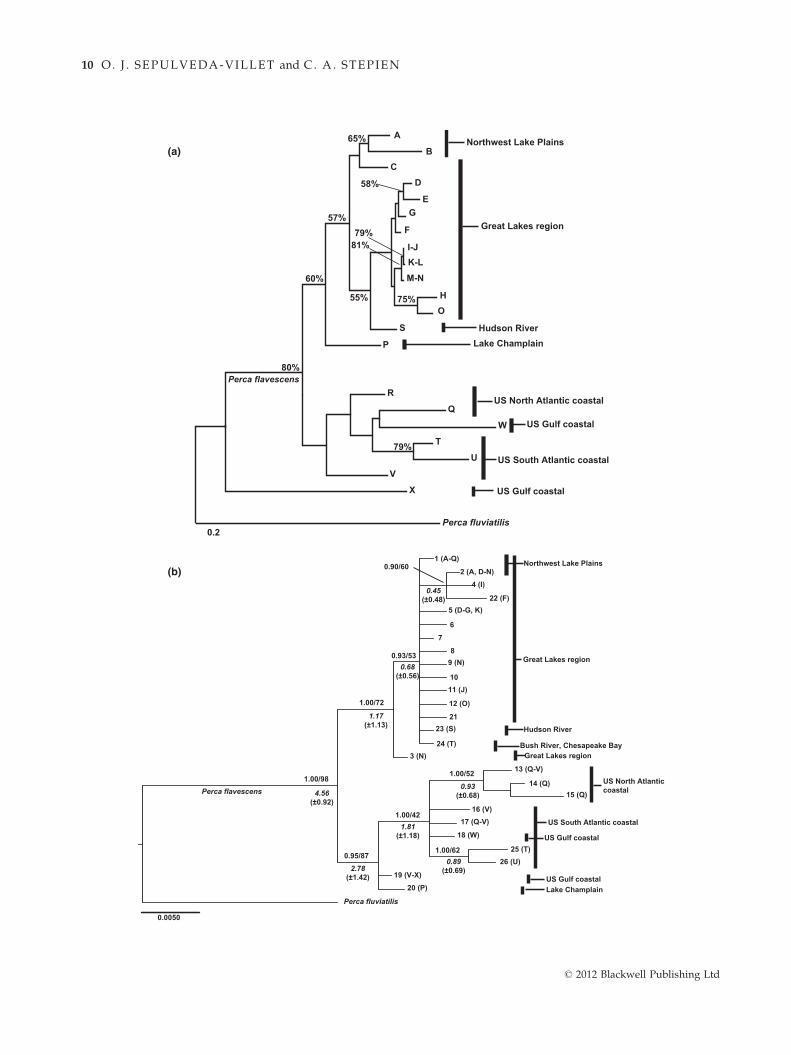
Phylogenetic and genetic distance trees (Fig. 2) dis-
cerned similar population relationships using nuclear
lsat loci (Fig. 2a) and mtDNA haplotypes (2b). The lsatneighbor-joining tree (Fig. 2a) depicted the Gulf coastal
Apalachicola River population as basal to two clusters,
one containing the other Gulf coast population (site W),
along with populations from the South Atlantic (sites
T-V) and North Atlantic coasts (Sebasticook and St. Johns
rivers; sites Q-R). The other cluster contained spawning
groups A-P, encompassing the Northwest Lake Plains
(sites A-B), Great Lakes region (sites C-O), Lake Champ-
lain (site P) and the Hudson River (site S). Populations
from the Northwest Lake Plains (sites A-B) clustered
together with those from Lake Superior (site C), whereas
the residual populations from the Great Lakes region
formed a single cluster.
The phylogenetic tree of mtDNA haplotypes (Fig. 2b)
supported two primary clades, distinguished by rela-
tively high posterior probability and bootstrap support.
One primary clade (diverging c. 1.17 ± 1.13 Ma) com-
prised haplotypes from the Northwest Lake Plains and
the Great Lakes (haplotypes 1–2, 4–12 and 21–22 from
sites A-Q), along with the Hudson River (haplotype 23;
site S) and the Bush River (24; site T). Within that first
primary clade, haplotype 3 (unique to site N, the eastern
basin of Lake Erie at Dunkirk, NY) was basal, diverging
c. 0.45 (±0.48) Ma and forming the sister lineage to the
others. The second primary mtDNA clade, which
diverged c. 2.78 (±1.42) Ma, contained haplotypes from
the Atlantic and Gulf coastal populations (with an indi-
vidual clade of North Atlantic haplotypes 13–15,
c. 1.81 ± 1.18 Ma; and 25–26 from the South Atlantic
region, c. 0.89 ± 0.69 Ma), along with two haplotypes
located basally: 20 from Lake Champlain (site P) and 19
widespread in the Gulf coastal region (sites V-X).
The statistical parsimony network in Fig. 3 identified a
broadly distributed haplotype 1 from the Northwest
Lake Plains (sites A–B), the Great Lakes region (sites
C–O), Lake Champlain (site P) and the Sebasticook (site
Q) and Hudson (site S) rivers, which was less prevalent
in the east. The network depicted a large closely related
haplotype group from the Great Lakes and Northwest
Lake Plains (2–3, 5–12, and 21), along with haplotype 23
in the Hudson River (site S) and haplotype 26 of the
Scuppernong River (site U); all differ by single nucleo-
tides from predominant haplotype 1. From this Great
Lakes cluster, five substitutions separated haplotype 19
of Morgan Creek (site V) and the Gulf Coast (sites
W–X), with an additional substitution distinguishing
© 2012 Blackwell Publishing Ltd
WATERSCAPE GENETICS OF YELLOW PERCH 9
Perca fluviatilis
F
G E
D
M-N K-L I-J
H O
S
A
B C
P
R
Q
W
T
U
V
X
0.2
79%
80%
60%
57%
55%
81%
75%
58%
65%
79%
Great Lakes region
Northwest Lake Plains
Hudson River
US North Atlantic coastal
US South Atlantic coastal
Lake Champlain
US Gulf coastal
US Gulf coastal
Perca flavescens
1.00/72
1.00/52
1.00/42
1.00/620.95/87
0.93/53
0.90/60
21
10
8
7
6
Perca fluviatilis
0.0050
3 (N)
4 (I)
22 (F)
2 (A, D-N)
11 (J)
5 (D-G, K)
12 (O)
9 (N)
23 (S)
26 (U)
1 (A-Q)
13 (Q-V)
14 (Q) 15 (Q)
25 (T)
24 (T)
20 (P) 19 (V-X)
18 (W)
16 (V) 17 (Q-V)
Great Lakes region
US South Atlantic coastal
Bush River, Chesapeake Bay
US North Atlanticcoastal
US Gulf coastalLake Champlain
Hudson River
US Gulf coastal
4.56(±0.92)
1.17(±1.13)
2.78(±1.42)
0.93(±0.68)
0.45 (±0.48)
0.68(±0.56)
0.89(±0.69)
1.81(±1.18)
1.00/98
Great Lakes region
Perca flavescens
Northwest Lake Plains
(a)
(b)
© 2012 Blackwell Publishing Ltd
10 O. J . SEPULVEDA-VILLET and C. A. STEPIEN
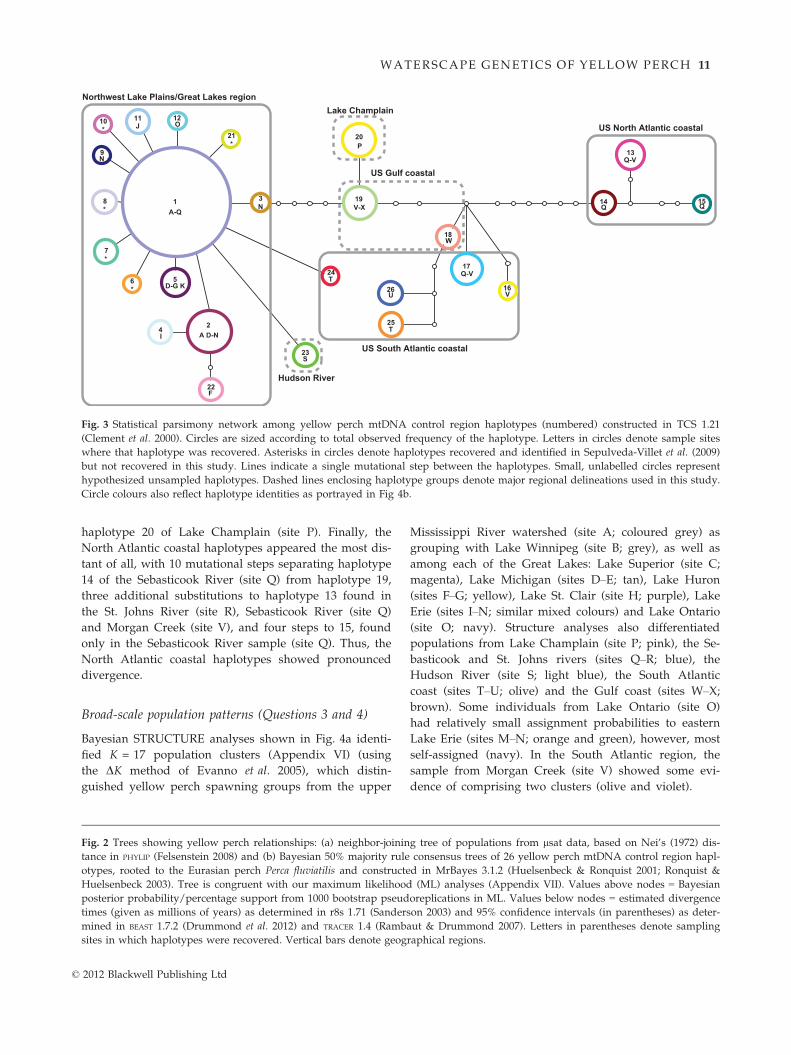
haplotype 20 of Lake Champlain (site P). Finally, the
North Atlantic coastal haplotypes appeared the most dis-
tant of all, with 10 mutational steps separating haplotype
14 of the Sebasticook River (site Q) from haplotype 19,
three additional substitutions to haplotype 13 found in
the St. Johns River (site R), Sebasticook River (site Q)
and Morgan Creek (site V), and four steps to 15, found
only in the Sebasticook River sample (site Q). Thus, the
North Atlantic coastal haplotypes showed pronounced
divergence.
Broad-scale population patterns (Questions 3 and 4)
Bayesian STRUCTURE analyses shown in Fig. 4a identi-
fied K = 17 population clusters (Appendix VI) (using
the DK method of Evanno et al. 2005), which distin-
guished yellow perch spawning groups from the upper
Mississippi River watershed (site A; coloured grey) as
grouping with Lake Winnipeg (site B; grey), as well as
among each of the Great Lakes: Lake Superior (site C;
magenta), Lake Michigan (sites D–E; tan), Lake Huron
(sites F–G; yellow), Lake St. Clair (site H; purple), Lake
Erie (sites I–N; similar mixed colours) and Lake Ontario
(site O; navy). Structure analyses also differentiated
populations from Lake Champlain (site P; pink), the Se-
basticook and St. Johns rivers (sites Q–R; blue), the
Hudson River (site S; light blue), the South Atlantic
coast (sites T–U; olive) and the Gulf coast (sites W–X;
brown). Some individuals from Lake Ontario (site O)
had relatively small assignment probabilities to eastern
Lake Erie (sites M–N; orange and green), however, most
self-assigned (navy). In the South Atlantic region, the
sample from Morgan Creek (site V) showed some evi-
dence of comprising two clusters (olive and violet).
1210*
8*
6*
1
2
5
7*
9
11
4
16
17
18
20
15
13
A-Q
A D-N
Q-V
P
Q-V
J
D-G K
W
V
Q
O
I
N
24
25
22
26
21*
U
F
T
T
S23
Northwest Lake Plains/Great Lakes region
US Gulf coastal
US South Atlantic coastal
US North Atlantic coastal
Lake Champlain
Hudson River
3N
19V-X
14Q
Fig. 3 Statistical parsimony network among yellow perch mtDNA control region haplotypes (numbered) constructed in TCS 1.21
(Clement et al. 2000). Circles are sized according to total observed frequency of the haplotype. Letters in circles denote sample sites
where that haplotype was recovered. Asterisks in circles denote haplotypes recovered and identified in Sepulveda-Villet et al. (2009)
but not recovered in this study. Lines indicate a single mutational step between the haplotypes. Small, unlabelled circles represent
hypothesized unsampled haplotypes. Dashed lines enclosing haplotype groups denote major regional delineations used in this study.
Circle colours also reflect haplotype identities as portrayed in Fig 4b.
Fig. 2 Trees showing yellow perch relationships: (a) neighbor-joining tree of populations from lsat data, based on Nei’s (1972) dis-
tance in PHYLIP (Felsenstein 2008) and (b) Bayesian 50% majority rule consensus trees of 26 yellow perch mtDNA control region hapl-
otypes, rooted to the Eurasian perch Perca fluviatilis and constructed in MrBayes 3.1.2 (Huelsenbeck & Ronquist 2001; Ronquist &
Huelsenbeck 2003). Tree is congruent with our maximum likelihood (ML) analyses (Appendix VII). Values above nodes = Bayesian
posterior probability/percentage support from 1000 bootstrap pseudoreplications in ML. Values below nodes = estimated divergence
times (given as millions of years) as determined in r8s 1.71 (Sanderson 2003) and 95% confidence intervals (in parentheses) as deter-
mined in BEAST 1.7.2 (Drummond et al. 2012) and TRACER 1.4 (Rambaut & Drummond 2007). Letters in parentheses denote sampling
sites in which haplotypes were recovered. Vertical bars denote geographical regions.
© 2012 Blackwell Publishing Ltd
WATERSCAPE GENETICS OF YELLOW PERCH 11
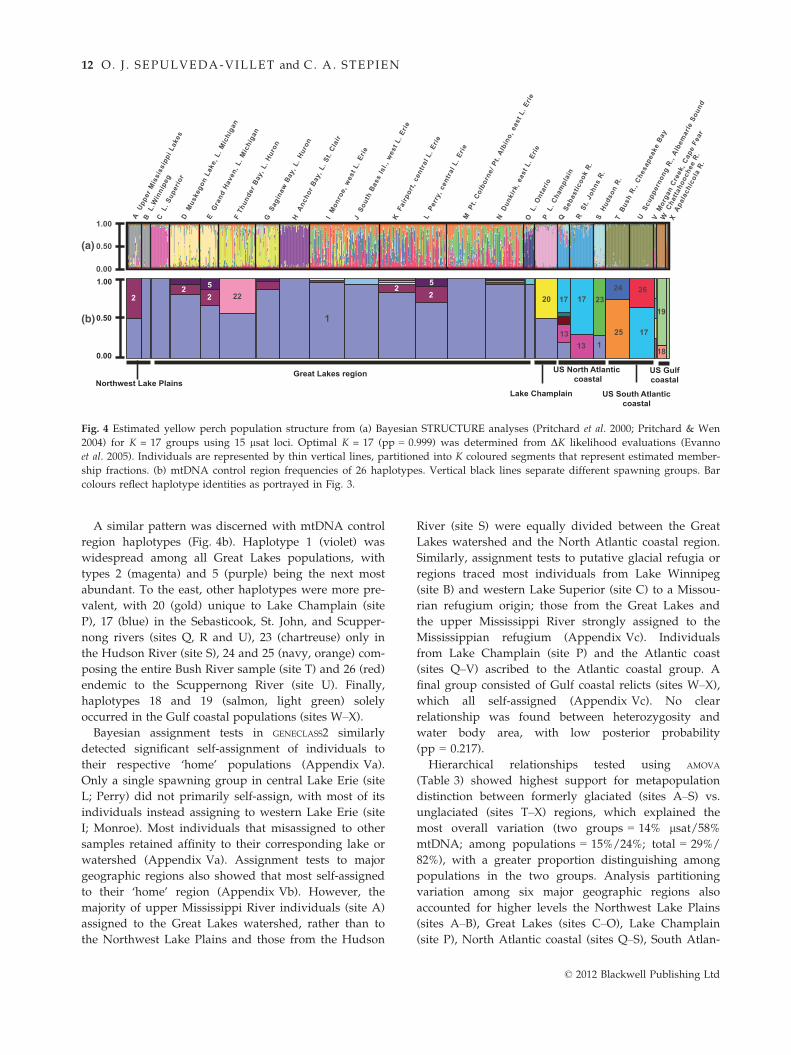
A similar pattern was discerned with mtDNA control
region haplotypes (Fig. 4b). Haplotype 1 (violet) was
widespread among all Great Lakes populations, with
types 2 (magenta) and 5 (purple) being the next most
abundant. To the east, other haplotypes were more pre-
valent, with 20 (gold) unique to Lake Champlain (site
P), 17 (blue) in the Sebasticook, St. John, and Scupper-
nong rivers (sites Q, R and U), 23 (chartreuse) only in
the Hudson River (site S), 24 and 25 (navy, orange) com-
posing the entire Bush River sample (site T) and 26 (red)
endemic to the Scuppernong River (site U). Finally,
haplotypes 18 and 19 (salmon, light green) solely
occurred in the Gulf coastal populations (sites W–X).
Bayesian assignment tests in GENECLASS2 similarly
detected significant self-assignment of individuals to
their respective ‘home’ populations (Appendix Va).
Only a single spawning group in central Lake Erie (site
L; Perry) did not primarily self-assign, with most of its
individuals instead assigning to western Lake Erie (site
I; Monroe). Most individuals that misassigned to other
samples retained affinity to their corresponding lake or
watershed (Appendix Va). Assignment tests to major
geographic regions also showed that most self-assigned
to their ‘home’ region (Appendix Vb). However, the
majority of upper Mississippi River individuals (site A)
assigned to the Great Lakes watershed, rather than to
the Northwest Lake Plains and those from the Hudson
River (site S) were equally divided between the Great
Lakes watershed and the North Atlantic coastal region.
Similarly, assignment tests to putative glacial refugia or
regions traced most individuals from Lake Winnipeg
(site B) and western Lake Superior (site C) to a Missou-
rian refugium origin; those from the Great Lakes and
the upper Mississippi River strongly assigned to the
Mississippian refugium (Appendix Vc). Individuals
from Lake Champlain (site P) and the Atlantic coast
(sites Q–V) ascribed to the Atlantic coastal group. A
final group consisted of Gulf coastal relicts (sites W–X),
which all self-assigned (Appendix Vc). No clear
relationship was found between heterozygosity and
water body area, with low posterior probability
(pp = 0.217).
Hierarchical relationships tested using AMOVA
(Table 3) showed highest support for metapopulation
distinction between formerly glaciated (sites A–S) vs.
unglaciated (sites T–X) regions, which explained the
most overall variation (two groups = 14% lsat/58%mtDNA; among populations = 15%/24%; total = 29%/
82%), with a greater proportion distinguishing among
populations in the two groups. Analysis partitioning
variation among six major geographic regions also
accounted for higher levels the Northwest Lake Plains
(sites A–B), Great Lakes (sites C–O), Lake Champlain
(site P), North Atlantic coastal (sites Q–S), South Atlan-
1.00
0.50
0.00
0.00
0.50
1.00
Great Lakes regionNorthwest Lake Plains
US North Atlantic coastal
US South Atlantic coastal
US Gulf coastal
Lake Champlain
I M
onro
e, w
est L
. Erie
J S
outh
Bas
s Is
l., w
est L
. Erie
K F
airp
ort,
cent
ral L
. Erie
L P
erry
, cen
tral
L. E
rieM
Pt.
Colb
orne
/ Pt.
Albi
no, e
ast L
. Erie
N D
unki
rk, e
ast L
. Erie
1
2 225
20 17
25
24 26
1317
19
18
13
17
1
23222 2
5
(a)
(b)
H A
ncho
r Bay
, L. S
t. Cl
air
G S
agin
aw B
ay, L
. Hur
on
F Th
unde
r Bay
, L. H
uron
E G
rand
Hav
en, L
. Mic
higa
n
D M
uske
gon
Lake
, L. M
ichi
gan
C L
. Sup
erio
r
B L
.Win
nipe
g
A U
pper
Mis
siss
ippi
Lak
es
U S
cupp
erno
ng R
., Al
bem
arle
Sou
nd
T B
ush
R., C
hesa
peak
e Ba
y
S H
udso
n R.
R S
t. Jo
hns
R.
Q S
ebas
ticoo
k R.
P L
. Cha
mpl
ain
O L
. Ont
ario
V M
orga
n Cr
eek,
Cap
e Fe
ar
W C
hatta
hooc
hee
R.
X A
pala
chic
ola
R.
Fig. 4 Estimated yellow perch population structure from (a) Bayesian STRUCTURE analyses (Pritchard et al. 2000; Pritchard & Wen
2004) for K = 17 groups using 15 lsat loci. Optimal K = 17 (pp = 0.999) was determined from DK likelihood evaluations (Evanno
et al. 2005). Individuals are represented by thin vertical lines, partitioned into K coloured segments that represent estimated member-
ship fractions. (b) mtDNA control region frequencies of 26 haplotypes. Vertical black lines separate different spawning groups. Bar
colours reflect haplotype identities as portrayed in Fig. 3.
© 2012 Blackwell Publishing Ltd
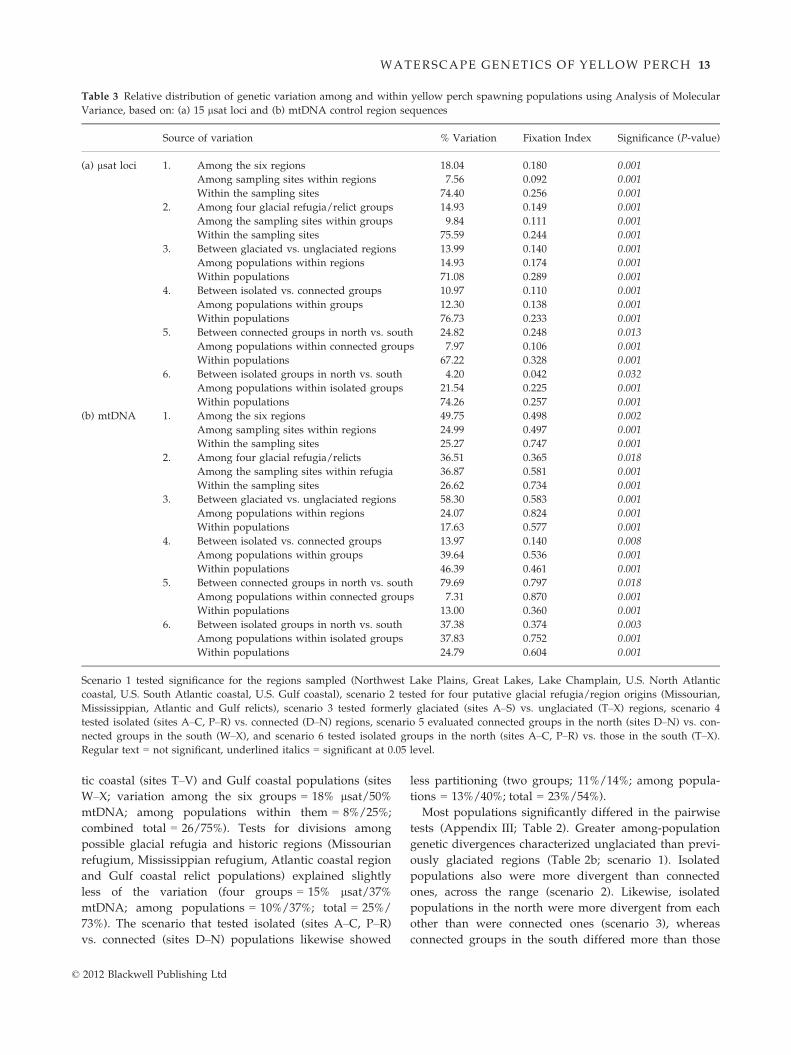
12 O. J . SEPULVEDA-VILLET and C. A. STEPIEN
tic coastal (sites T–V) and Gulf coastal populations (sites
W–X; variation among the six groups = 18% lsat/50%mtDNA; among populations within them = 8%/25%;
combined total = 26/75%). Tests for divisions among
possible glacial refugia and historic regions (Missourian
refugium, Mississippian refugium, Atlantic coastal region
and Gulf coastal relict populations) explained slightly
less of the variation (four groups = 15% lsat/37%mtDNA; among populations = 10%/37%; total = 25%/
73%). The scenario that tested isolated (sites A–C, P–R)
vs. connected (sites D–N) populations likewise showed
less partitioning (two groups; 11%/14%; among popula-
tions = 13%/40%; total = 23%/54%).
Most populations significantly differed in the pairwise
tests (Appendix III; Table 2). Greater among-population
genetic divergences characterized unglaciated than previ-
ously glaciated regions (Table 2b; scenario 1). Isolated
populations also were more divergent than connected
ones, across the range (scenario 2). Likewise, isolated
populations in the north were more divergent from each
other than were connected ones (scenario 3), whereas
connected groups in the south differed more than those
Table 3 Relative distribution of genetic variation among and within yellow perch spawning populations using Analysis of Molecular
Variance, based on: (a) 15 lsat loci and (b) mtDNA control region sequences
Source of variation % Variation Fixation Index Significance (P-value)
(a) lsat loci 1. Among the six regions 18.04 0.180 0.001
Among sampling sites within regions 7.56 0.092 0.001
Within the sampling sites 74.40 0.256 0.001
2. Among four glacial refugia/relict groups 14.93 0.149 0.001
Among the sampling sites within groups 9.84 0.111 0.001
Within the sampling sites 75.59 0.244 0.001
3. Between glaciated vs. unglaciated regions 13.99 0.140 0.001
Among populations within regions 14.93 0.174 0.001
Within populations 71.08 0.289 0.001
4. Between isolated vs. connected groups 10.97 0.110 0.001
Among populations within groups 12.30 0.138 0.001
Within populations 76.73 0.233 0.001
5. Between connected groups in north vs. south 24.82 0.248 0.013
Among populations within connected groups 7.97 0.106 0.001
Within populations 67.22 0.328 0.001
6. Between isolated groups in north vs. south 4.20 0.042 0.032
Among populations within isolated groups 21.54 0.225 0.001
Within populations 74.26 0.257 0.001
(b) mtDNA 1. Among the six regions 49.75 0.498 0.002
Among sampling sites within regions 24.99 0.497 0.001
Within the sampling sites 25.27 0.747 0.001
2. Among four glacial refugia/relicts 36.51 0.365 0.018
Among the sampling sites within refugia 36.87 0.581 0.001
Within the sampling sites 26.62 0.734 0.001
3. Between glaciated vs. unglaciated regions 58.30 0.583 0.001
Among populations within regions 24.07 0.824 0.001
Within populations 17.63 0.577 0.001
4. Between isolated vs. connected groups 13.97 0.140 0.008
Among populations within groups 39.64 0.536 0.001
Within populations 46.39 0.461 0.001
5. Between connected groups in north vs. south 79.69 0.797 0.018
Among populations within connected groups 7.31 0.870 0.001
Within populations 13.00 0.360 0.001
6. Between isolated groups in north vs. south 37.38 0.374 0.003
Among populations within isolated groups 37.83 0.752 0.001
Within populations 24.79 0.604 0.001
Scenario 1 tested significance for the regions sampled (Northwest Lake Plains, Great Lakes, Lake Champlain, U.S. North Atlantic
coastal, U.S. South Atlantic coastal, U.S. Gulf coastal), scenario 2 tested for four putative glacial refugia/region origins (Missourian,
Mississippian, Atlantic and Gulf relicts), scenario 3 tested formerly glaciated (sites A–S) vs. unglaciated (T–X) regions, scenario 4
tested isolated (sites A–C, P–R) vs. connected (D–N) regions, scenario 5 evaluated connected groups in the north (sites D–N) vs. con-
nected groups in the south (W–X), and scenario 6 tested isolated groups in the north (sites A–C, P–R) vs. those in the south (T–X).Regular text = not significant, underlined italics = significant at 0.05 level.
© 2012 Blackwell Publishing Ltd
WATERSCAPE GENETICS OF YELLOW PERCH 13
in the north (scenario 4). Isolated groups in the north
and south had similar degrees of interpopulational
divergence (scenario 5).
Discussion
Waterscape genetic patterns and relation to ourhypotheses
Our results lend support to the following underlying
questions and hypotheses:
1 Are genetic diversity and divergence patterns differ-
ent or comparable in connected vs. isolated popula-
tions for yellow perch across its native range? We
find that genetic diversity is highest in southern pop-
ulations of moderate sizes (i.e. the U.S. South Atlantic
coastal region) and also is relatively high in areas
where colonists from more than a single glacial refu-
gium probably met to found the populations (i.e.
Lake Erie; a connected system). Genetic diversity also
is higher in connected population systems, in com-
parison with isolated ones. Genetic divergence is
greater among isolated populations, both in formerly
glaciated and unglaciated regions.
2 Do population relationships reflect a pattern of
genetic isolation with geographic distance in con-
nected vs. unconnected sites? There is significant
genetic isolation with geographic distance across the
native North American range of yellow perch. How-
ever, this pattern often breaks down at fine-scales
among sites within a single water body or connected
watersheds. Specifically, genetic relationships among
spawning groups in Lake Erie and across the Great
Lakes system do not conform to an isolation-by-dis-
tance hypothesis, indicating that genetic structuring is
mediated by other processes, such as natal homing
and habitat specificity.
3 Are relationships among northern populations con-
sistent with colonization from various hypothesized
glacial refugia? Yes, our results indicate contribution
from at least two primary glacial refugia to the anal-
ysed populations; yellow perch from the Missourian
refugium may have founded present-day populations
in the Northwest Lake Plains and western Lake
Superior. Origins of most Great Lakes yellow perch
trace to the Mississippian refugium, with some possi-
ble contribution from the Atlantic refugium in the
east (eastern Lake Erie and Lake Ontario). Yellow
perch from the Atlantic coastal refugium founded
northern populations along the Atlantic seaboard,
Lake Champlain, and west to the Appalachian
Mountains.
4 Is genetic diversity and divergence greater in ungla-
ciated vs. glaciated regions? Our AMOVA results show
that genetic diversity overall is higher in unglaciated
populations vs. previously glaciated ones, especially
in the South Atlantic coastal region. U.S. Gulf coastal
relict populations are markedly isolated and diver-
gent from other samples, as well as from each other.
These rare relict populations occupy restricted ranges
and have relatively low diversity, which particularly
affected their mtDNA diversity (as it has a smaller
effective population size; see Avise 2004). Diver-
gences among populations are greater in the south
than in formerly glaciated populations; however, iso-
lated groups of both have similarly high divergence
levels. Thus, geographic and genetic isolation pro-
vided the strongest driver.
Genetic diversity and divergence trends
Our data show that genetic diversities of yellow perch
populations appear relatively consistent across the
native range, but are considerably lower in the small
relict Gulf coastal populations (by 17%, H = 0.387).
Greater diversity (by 13%) characterizes the southern
Atlantic coastal sites (H = 0.603), which were unglaciat-
ed and have smaller population sizes than those in the
Great Lakes (Muncy 1962). These South Atlantic coastal
populations also contain more unique alleles and haplo-
types than characterize other locations, indicating that
they may constitute an important genetic ‘reservoir’ for
the species. Higher genetic diversity often is characteris-
tic of older, long-established populations, provided that
they have not undergone bottlenecks (Tessier & Bernat-
chez 1999). The South Atlantic coastal yellow perch
populations are adapted to mesohaline conditions and
probably can readily migrate from fresh to brackish
waters (Grzybowski et al. 2010). These coastal popula-
tions appear particularly diverse.
Overall, yellow perch populations from formerly gla-
ciated regions have lower heterozygosities in both
nuclear and mitochondrial markers and lower propor-
tions of private alleles/haplotypes. In walleye, popula-
tions from unglaciated vs. formerly glaciated regions
had similar lsat heterozygosity levels (mean
HO = 0.698, range = 0.612–0.778), except for a rare relict
population in the Gulf coast, whose lower diversity
(HO = 0.537) was attributed to bottlenecks (Stepien et al.
2009). Yellow perch and walleye have different dis-
persal abilities, with walleye travelling greater distances
during foraging seasons (Houde 1969). The two species
occupy some different habitats, with walleye less com-
mon in smaller lakes and reservoirs (Nelson & Walburg
1977). They thus presumably responded differently to
© 2012 Blackwell Publishing Ltd
14 O. J . SEPULVEDA-VILLET and C. A. STEPIEN
geographic isolation, with greater divergences among
yellow perch populations (hST ranging to 0.018–0.472 in
our study) vs. walleye (0.010–0.295; Stepien et al. 2009).
Similarly, southerly populations of yellow perch are dif-
ferentiated by greater divergences (0.226–0.300) than
those in the north (0.011–0.276; Stepien et al. 2007).
Major population divisions
Our genetic divergence results delineate yellow perch
population divisions among six major geographic
regions: Northwest Lake Plains, Great Lakes watershed,
Lake Champlain, U.S. North Atlantic coastal, South
Atlantic coastal and Gulf coastal. A similar pattern was
discerned by Stepien et al. (2009) for the genetic structure
of walleye populations, which approximately corre-
sponded to our divisions: Northwest Lake Plains (Lake
Winnipeg, McKim Lake in Ontario, and the upper Mis-
sissippi River), the Great Lakes watershed (divided into
six groups: Lake Superior, Lakes Michigan/Huron, Lake
Huron’s Georgian Bay, Lake St. Clair, Lake Erie and
Lake Ontario), North Atlantic coastal, South Atlantic
coastal and Gulf coastal groups. Yellow perch and wall-
eye belong to the same family, occupy similar native
ranges, co-occur in many habitats and are both exploited;
they thus probably experienced similar historical and
contemporary selective and population pressures. Both
are believed to return to spawn in natal areas; however,
the walleye has been much better studied (Craig 2000;
Roseman et al. 2010; Barton 2011).
We discern genetic distinctiveness of most yellow
perch spawning groups across broad and fine geographic
scales, as evidenced by our barrier and FST analyses.
Broadscale patterns for yellow perch fit a range-wide
pattern of genetic isolation with geographic distance, as
have been shown for walleye (Stepien et al. 2009), small-
mouth bass Micropterus dolomieu (Stepien et al. 2007) and
ninespine stickleback Pungitius pungitius (Aldenhoven
et al. 2010).
Whereas geographic distance appears to significantly
drive genetic divergence among distant yellow perch
populations, site-to-site distance is not a significant deter-
minant of genetic structure among closely located
spawning populations within a single body of water (e.g.
Lake Erie; Sepulveda-Villet & Stepien 2011) or among
connected lakes (i.e., within the Great Lakes). Likewise,
relationships among closely spaced spawning groups of
walleye within lakes did not fit a genetic isolation by
geographic distance pattern (Strange & Stepien 2007;
Stepien et al. 2009, 2010), suggesting that spawning site
specificity drives genetic structure. Similarly, smallmouth
bass showed greater divergence than expected among
closely spaced tributary populations (Stepien et al. 2007).
Our present study found no significant correlation
between genetic diversity and water area of the sampled
locations (using the method of Foll & Gaggiotti 2006),
suggesting that processes other than available habitat
determine these patterns.
Many yellow perch spawning groups within a given
body of water are genetically divergent despite the
apparent potential for dispersal and gene flow among
them (e.g. those within Lake Erie; also see Sepulveda-Vil-
let & Stepien 2011). This may be due to homing behav-
iour and spawning group fidelity. A study by Bergek &
Bjorklund (2007) based on eight microsatellite loci
described divergent yet sympatric kin groups of Euro-
pean perch in a small lake that lacked physical barriers
to gene flow. Barriers to gene flow for European perch
probably resulted from reproductive isolation, either via
kin recognition (Gerlach et al. 2001) or due to reduced
hybrid fitness between sympatric but divergent cohorts
(Behrmann-Godel & Gerlach 2008). These factors remain
to be tested for yellow perch.
Evidence for discrete population groups within con-
nected water bodies recently was determined for yellow
perch in Lake Erie, from whole-body morphometric analy-
ses (Kocovsky & Knight 2012). In that study, morphomet-
ric shape patterns distinguished among Lake Erie
population samples. Our current results and previous
work (Sepulveda-Villet & Stepien 2011) support similar
fine-scale genetic patterns among yellow perch spawning
populations, which may be maintained by reproductive
isolation due to spawning group fidelity.
Relationships of contemporary northern populations toglacial refugia
Our divergence time estimates here used fossil records
as calibration points, which may affect accuracy, given
the vagaries in identifying and dating fossils and the
likelihood of variation in mutation rates, as discussed by
Ho et al. (2005, 2011). In contrast, our previous mtDNA
control region divergence estimates in Sepulveda-Villet
et al. (2009) were based on a molecular clock calibrated
to logperch Percina caprodes by Near & Benard (2004) at
2%/my. However, our results here revealed lack of cor-
respondence to a strict molecular clock. In the present
analysis, localized branch mutation rates ranged from
0.15% to 0.29%/my (about an order of magnitude slower
than the previous calibration). It thus is advisable to
carefully select a combination of available calibration
sources to better reconcile analytical variations in these
estimates.
Our mtDNA phylogeny indicates that yellow perch
populations are divided in two primary clades that may
have diverged c. 4.56 Ma. Most of the southern popu-
lation haplotypes appear to have differentiated c. 0.89–
2.78 Ma, with the North Atlantic coastal haplotypes
© 2012 Blackwell Publishing Ltd
WATERSCAPE GENETICS OF YELLOW PERCH 15
separating from the South Atlantic and Gulf coastal
haplotypes by c. 1.81 my. The South Atlantic and Gulf
coastal haplotypes are more closely related to each other
than to those from the North Atlantic. The second major
clade shows that the northern haplotypes shared a more
recent common ancestry, estimated as c. 0.45–1.17 Ma.
Yellow perch in the Northwest Lake Plains (Lake
Winnipeg and upper Mississippi River) and western
Lake Superior may have descended from Missourian
refugium colonists, following similar phylogeographic
patterns to those found in walleye (Stepien et al. 2009)
and other fish. The Missourian refugium similarly
founded populations of lake sturgeon Acipenser fulves-
cens in the Hudson Bay drainage (Ferguson & Duck-
worth 1997) and brown bullhead Ameiurus nebulosus in
western Lake Superior (Murdoch & Hebert 1997). Gla-
cial Lake Agassiz initially occupied much of the Hud-
son Bay watershed (including Lake Winnipeg), which
probably had some southern drainage to Lake Superior
(Mandrak & Crossman 1992; Rempel & Smith 1998),
facilitating fish movements 13 000–8500 ya. Ice later
blocked this passage, isolating the yellow perch popula-
tions in our Northwest Lake Plains sites (Saarnisto 1974;
Teller & Mahnic 1988), as is shown by their high diver-
gences. This pattern appears consistent with genetic
and geographic isolation of walleye populations from
Lake Winnipeg, southwest Ontario and the upper Mis-
sissippi River watersheds (Stepien et al. 2009). These
northwestern fish populations always have been small
in size and presumably occupy suboptimal habitats
(Hoagstrom & Berry 2010). We note that our samples
did not include sites from unglaciated portions of the
Missouri River, and thus, our interpretation of that refu-
gium is subject to further verification. However, the
extensive history of yellow perch stocking in those
regions (Lee et al. 1980; Fuller & Neilson 2012) probably
obscured the ability to detect a native genetic profile.
The Mississippian glacial refugium is believed to
have founded most of the Great Lakes fauna (Underhill
1986; Mandrak & Crossman 1992; Todd & Hatcher
1993), as indicated for yellow perch here, walleye (Step-
ien et al. 1998; Stepien et al. 2009, 2010), smallmouth
bass (Stepien et al. 2007), rainbow darter (Haponski
et al. 2009) and lake sturgeon (Ferguson & Duckworth
1997). Some mixed signal indicates genetic contributions
from the Atlantic refugium into the lower Great Lakes
for walleye (Stepien et al. 1998; Strange & Stepien 2007;
Stepien et al. 2009, 2010), smallmouth bass (Stepien et al.
2007), brown bullhead (Murdoch & Hebert 1997), lake
trout (Wilson & Hebert 1996) and ninespine stickleback
(Aldenhoven et al. 2010).
It generally is thought that southerly unglaciated
populations may harbour more genetic diversity,
because they have experienced a longer undisturbed
history for evolution and local adaptation (Petit et al.
2003). Greater diversity also is hypothesized for areas
where descendants from two or more glacial refugia
met (Petit et al. 2003). Thus, mixing of descendants
from multiple refugia may account for the relatively
high degree of genetic diversity in our Great Lakes
populations, as found in eastern Lake Erie. Uncon-
nected fringe populations that traced to a single refu-
gium probably experienced bottlenecks and genetic
drift, thereby reducing heterozygosity, as shown in our
Lake Winnipeg and Maine samples. The southern Gulf
relict population also has low heterozygosity, character-
istic of its small population size, bottlenecks, and
genetic drift.
Lake Champlain drains into the St. Lawrence River
and its yellow perch appear to trace to mixed origins
from the Atlantic and Mississippian refugia, but today
have a very divergent genetic composition from our
other samples. Lake Champlain received meltwaters
from glacial Lake St. Lawrence (c. 11 600 ya), and then
Lake Agassiz (c. 10 900–8000 ya) and glacial Lake Bar-
low-Ojibway (9500–8000 ya). This produced an exten-
sive freshwater habitat that replaced the former saline
Champlain Sea, which was a temporary inlet of the
Atlantic Ocean formed by the retreating glaciers (Rodri-
gues & Vilks 1994). Regional flooding presumably led
to colonization of Lake Champlain from the Atlantic
refugium, as suggested by genetic evidence from lake
cisco Coregonus artedi (Turgeon & Bernatchez 2001). Our
yellow perch mtDNA control region haplotype 1 proba-
bly already was widespread preglacially and then rep-
resented in the Mississippian and Atlantic refugia
populations but was more common in the west. Today,
haplotype 1 remains more abundant in the west.
The Atlantic coastal refugium formed a warm enclave
of diverse habitats in coastal plains and estuaries east
of the Appalachian Mountains (Schmidt 1986; Bernat-
chez 1997), which colonized contemporary northeastern
and northcentral populations (Russell et al. 2009). This
region supports high species richness and endemism
today (Griffiths 2010), as discerned for yellow perch.
The northeastern migrating populations split to found
those we sampled in Maine and those along the eastern
seaboard route to the Hudson River; both are very
divergent today. The St. Johns River population is less
diverse and presumably experienced a founder event
and/or genetic bottleneck. Its pattern appears to fit the
leading-edge dispersal hypothesis (Hewitt 1996, 1999).
Southern isolated and relict populations
Both southerly unglaciated regions sampled for yellow
perch—the South Atlantic and Gulf coastal regions—are
believed to be historically older populations (c. 2.78–
© 2012 Blackwell Publishing Ltd
16 O. J . SEPULVEDA-VILLET and C. A. STEPIEN
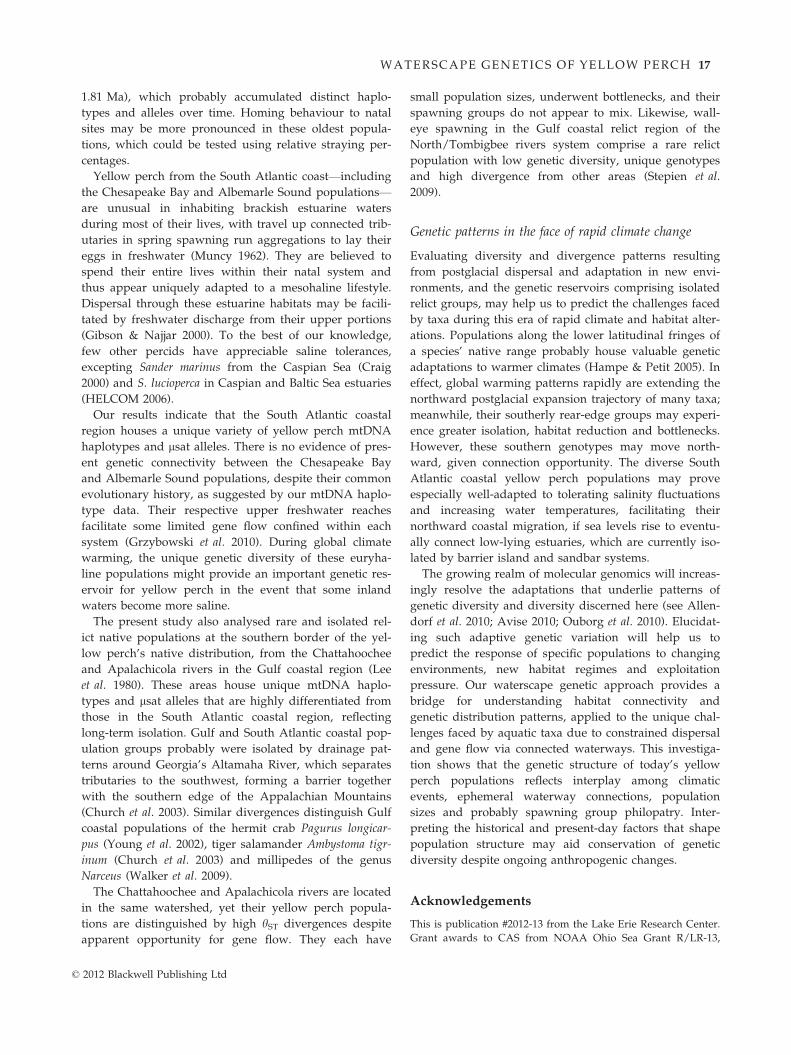
1.81 Ma), which probably accumulated distinct haplo-
types and alleles over time. Homing behaviour to natal
sites may be more pronounced in these oldest popula-
tions, which could be tested using relative straying per-
centages.
Yellow perch from the South Atlantic coast—including
the Chesapeake Bay and Albemarle Sound populations—
are unusual in inhabiting brackish estuarine waters
during most of their lives, with travel up connected trib-
utaries in spring spawning run aggregations to lay their
eggs in freshwater (Muncy 1962). They are believed to
spend their entire lives within their natal system and
thus appear uniquely adapted to a mesohaline lifestyle.
Dispersal through these estuarine habitats may be facili-
tated by freshwater discharge from their upper portions
(Gibson & Najjar 2000). To the best of our knowledge,
few other percids have appreciable saline tolerances,
excepting Sander marinus from the Caspian Sea (Craig
2000) and S. lucioperca in Caspian and Baltic Sea estuaries
(HELCOM 2006).
Our results indicate that the South Atlantic coastal
region houses a unique variety of yellow perch mtDNA
haplotypes and lsat alleles. There is no evidence of pres-
ent genetic connectivity between the Chesapeake Bay
and Albemarle Sound populations, despite their common
evolutionary history, as suggested by our mtDNA haplo-
type data. Their respective upper freshwater reaches
facilitate some limited gene flow confined within each
system (Grzybowski et al. 2010). During global climate
warming, the unique genetic diversity of these euryha-
line populations might provide an important genetic res-
ervoir for yellow perch in the event that some inland
waters become more saline.
The present study also analysed rare and isolated rel-
ict native populations at the southern border of the yel-
low perch’s native distribution, from the Chattahoochee
and Apalachicola rivers in the Gulf coastal region (Lee
et al. 1980). These areas house unique mtDNA haplo-
types and lsat alleles that are highly differentiated from
those in the South Atlantic coastal region, reflecting
long-term isolation. Gulf and South Atlantic coastal pop-
ulation groups probably were isolated by drainage pat-
terns around Georgia’s Altamaha River, which separates
tributaries to the southwest, forming a barrier together
with the southern edge of the Appalachian Mountains
(Church et al. 2003). Similar divergences distinguish Gulf
coastal populations of the hermit crab Pagurus longicar-
pus (Young et al. 2002), tiger salamander Ambystoma tigr-
inum (Church et al. 2003) and millipedes of the genus
Narceus (Walker et al. 2009).
The Chattahoochee and Apalachicola rivers are located
in the same watershed, yet their yellow perch popula-
tions are distinguished by high hST divergences despite
apparent opportunity for gene flow. They each have
small population sizes, underwent bottlenecks, and their
spawning groups do not appear to mix. Likewise, wall-
eye spawning in the Gulf coastal relict region of the
North/Tombigbee rivers system comprise a rare relict
population with low genetic diversity, unique genotypes
and high divergence from other areas (Stepien et al.
2009).
Genetic patterns in the face of rapid climate change
Evaluating diversity and divergence patterns resulting
from postglacial dispersal and adaptation in new envi-
ronments, and the genetic reservoirs comprising isolated
relict groups, may help us to predict the challenges faced
by taxa during this era of rapid climate and habitat alter-
ations. Populations along the lower latitudinal fringes of
a species’ native range probably house valuable genetic
adaptations to warmer climates (Hampe & Petit 2005). In
effect, global warming patterns rapidly are extending the
northward postglacial expansion trajectory of many taxa;
meanwhile, their southerly rear-edge groups may experi-
ence greater isolation, habitat reduction and bottlenecks.
However, these southern genotypes may move north-
ward, given connection opportunity. The diverse South
Atlantic coastal yellow perch populations may prove
especially well-adapted to tolerating salinity fluctuations
and increasing water temperatures, facilitating their
northward coastal migration, if sea levels rise to eventu-
ally connect low-lying estuaries, which are currently iso-
lated by barrier island and sandbar systems.
The growing realm of molecular genomics will increas-
ingly resolve the adaptations that underlie patterns of
genetic diversity and diversity discerned here (see Allen-
dorf et al. 2010; Avise 2010; Ouborg et al. 2010). Elucidat-
ing such adaptive genetic variation will help us to
predict the response of specific populations to changing
environments, new habitat regimes and exploitation
pressure. Our waterscape genetic approach provides a
bridge for understanding habitat connectivity and
genetic distribution patterns, applied to the unique chal-
lenges faced by aquatic taxa due to constrained dispersal
and gene flow via connected waterways. This investiga-
tion shows that the genetic structure of today’s yellow
perch populations reflects interplay among climatic
events, ephemeral waterway connections, population
sizes and probably spawning group philopatry. Inter-
preting the historical and present-day factors that shape
population structure may aid conservation of genetic
diversity despite ongoing anthropogenic changes.
Acknowledgements
This is publication #2012-13 from the Lake Erie Research Center.
Grant awards to CAS from NOAA Ohio Sea Grant R/LR-13,
© 2012 Blackwell Publishing Ltd
WATERSCAPE GENETICS OF YELLOW PERCH 17
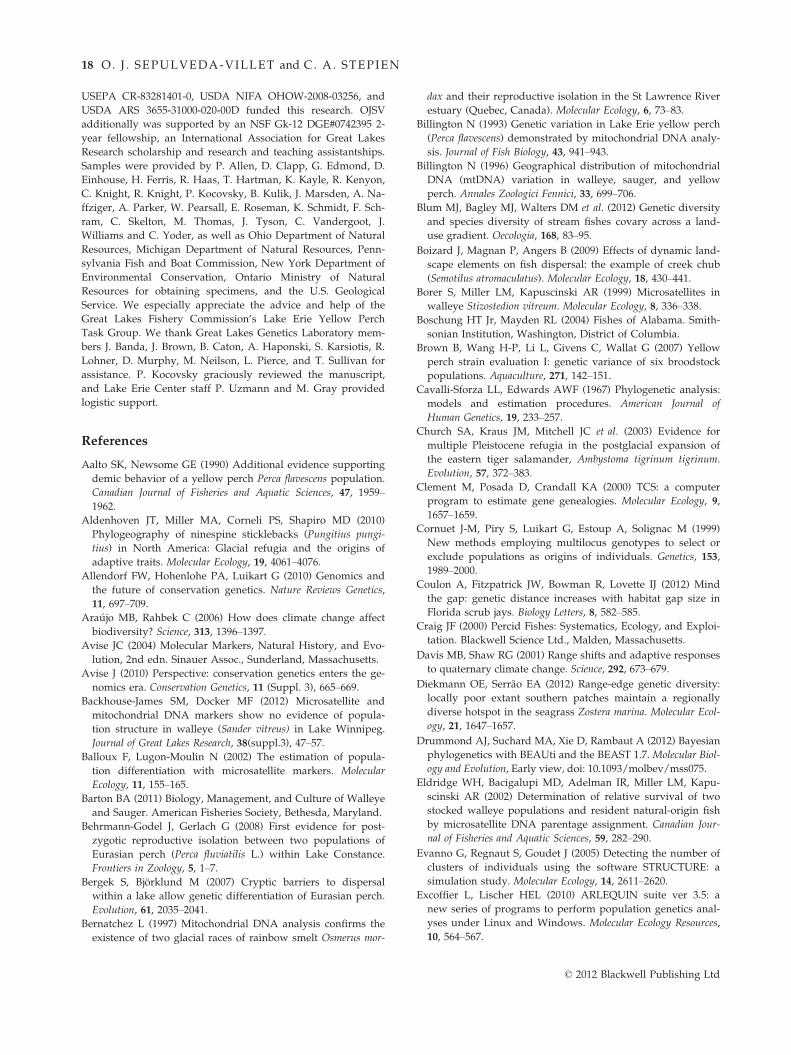
USEPA CR-83281401-0, USDA NIFA OHOW-2008-03256, and
USDA ARS 3655-31000-020-00D funded this research. OJSV
additionally was supported by an NSF Gk-12 DGE#0742395 2-
year fellowship, an International Association for Great Lakes
Research scholarship and research and teaching assistantships.
Samples were provided by P. Allen, D. Clapp, G. Edmond, D.
Einhouse, H. Ferris, R. Haas, T. Hartman, K. Kayle, R. Kenyon,
C. Knight, R. Knight, P. Kocovsky, B. Kulik, J. Marsden, A. Na-
ffziger, A. Parker, W. Pearsall, E. Roseman, K. Schmidt, F. Sch-
ram, C. Skelton, M. Thomas, J. Tyson, C. Vandergoot, J.
Williams and C. Yoder, as well as Ohio Department of Natural
Resources, Michigan Department of Natural Resources, Penn-
sylvania Fish and Boat Commission, New York Department of
Environmental Conservation, Ontario Ministry of Natural
Resources for obtaining specimens, and the U.S. Geological
Service. We especially appreciate the advice and help of the
Great Lakes Fishery Commission’s Lake Erie Yellow Perch
Task Group. We thank Great Lakes Genetics Laboratory mem-
bers J. Banda, J. Brown, B. Caton, A. Haponski, S. Karsiotis, R.
Lohner, D. Murphy, M. Neilson, L. Pierce, and T. Sullivan for
assistance. P. Kocovsky graciously reviewed the manuscript,
and Lake Erie Center staff P. Uzmann and M. Gray provided
logistic support.
References
Aalto SK, Newsome GE (1990) Additional evidence supporting
demic behavior of a yellow perch Perca flavescens population.
Canadian Journal of Fisheries and Aquatic Sciences, 47, 1959–
1962.
Aldenhoven JT, Miller MA, Corneli PS, Shapiro MD (2010)
Phylogeography of ninespine sticklebacks (Pungitius pungi-
tius) in North America: Glacial refugia and the origins of
adaptive traits. Molecular Ecology, 19, 4061–4076.Allendorf FW, Hohenlohe PA, Luikart G (2010) Genomics and
the future of conservation genetics. Nature Reviews Genetics,
11, 697–709.Araujo MB, Rahbek C (2006) How does climate change affect
biodiversity? Science, 313, 1396–1397.Avise JC (2004) Molecular Markers, Natural History, and Evo-
lution, 2nd edn. Sinauer Assoc., Sunderland, Massachusetts.
Avise J (2010) Perspective: conservation genetics enters the ge-
nomics era. Conservation Genetics, 11 (Suppl. 3), 665–669.Backhouse-James SM, Docker MF (2012) Microsatellite and
mitochondrial DNA markers show no evidence of popula-
tion structure in walleye (Sander vitreus) in Lake Winnipeg.
Journal of Great Lakes Research, 38(suppl.3), 47–57.Balloux F, Lugon-Moulin N (2002) The estimation of popula-
tion differentiation with microsatellite markers. Molecular
Ecology, 11, 155–165.
Barton BA (2011) Biology, Management, and Culture of Walleye
and Sauger. American Fisheries Society, Bethesda, Maryland.
Behrmann-Godel J, Gerlach G (2008) First evidence for post-
zygotic reproductive isolation between two populations of
Eurasian perch (Perca fluviatilis L.) within Lake Constance.
Frontiers in Zoology, 5, 1–7.
Bergek S, Bjorklund M (2007) Cryptic barriers to dispersal
within a lake allow genetic differentiation of Eurasian perch.
Evolution, 61, 2035–2041.Bernatchez L (1997) Mitochondrial DNA analysis confirms the
existence of two glacial races of rainbow smelt Osmerus mor-
dax and their reproductive isolation in the St Lawrence River
estuary (Quebec, Canada). Molecular Ecology, 6, 73–83.Billington N (1993) Genetic variation in Lake Erie yellow perch
(Perca flavescens) demonstrated by mitochondrial DNA analy-
sis. Journal of Fish Biology, 43, 941–943.
Billington N (1996) Geographical distribution of mitochondrial
DNA (mtDNA) variation in walleye, sauger, and yellow
perch. Annales Zoologici Fennici, 33, 699–706.Blum MJ, Bagley MJ, Walters DM et al. (2012) Genetic diversity
and species diversity of stream fishes covary across a land-
use gradient. Oecologia, 168, 83–95.
Boizard J, Magnan P, Angers B (2009) Effects of dynamic land-
scape elements on fish dispersal: the example of creek chub
(Semotilus atromaculatus). Molecular Ecology, 18, 430–441.Borer S, Miller LM, Kapuscinski AR (1999) Microsatellites in
walleye Stizostedion vitreum. Molecular Ecology, 8, 336–338.Boschung HT Jr, Mayden RL (2004) Fishes of Alabama. Smith-
sonian Institution, Washington, District of Columbia.
Brown B, Wang H-P, Li L, Givens C, Wallat G (2007) Yellow
perch strain evaluation I: genetic variance of six broodstock
populations. Aquaculture, 271, 142–151.
Cavalli-Sforza LL, Edwards AWF (1967) Phylogenetic analysis:
models and estimation procedures. American Journal of
Human Genetics, 19, 233–257.Church SA, Kraus JM, Mitchell JC et al. (2003) Evidence for
multiple Pleistocene refugia in the postglacial expansion of
the eastern tiger salamander, Ambystoma tigrinum tigrinum.
Evolution, 57, 372–383.
Clement M, Posada D, Crandall KA (2000) TCS: a computer
program to estimate gene genealogies. Molecular Ecology, 9,
1657–1659.Cornuet J-M, Piry S, Luikart G, Estoup A, Solignac M (1999)
New methods employing multilocus genotypes to select or
exclude populations as origins of individuals. Genetics, 153,
1989–2000.Coulon A, Fitzpatrick JW, Bowman R, Lovette IJ (2012) Mind
the gap: genetic distance increases with habitat gap size in
Florida scrub jays. Biology Letters, 8, 582–585.
Craig JF (2000) Percid Fishes: Systematics, Ecology, and Exploi-
tation. Blackwell Science Ltd., Malden, Massachusetts.
Davis MB, Shaw RG (2001) Range shifts and adaptive responses
to quaternary climate change. Science, 292, 673–679.
Diekmann OE, Serrao EA (2012) Range-edge genetic diversity:
locally poor extant southern patches maintain a regionally
diverse hotspot in the seagrass Zostera marina. Molecular Ecol-
ogy, 21, 1647–1657.
Drummond AJ, Suchard MA, Xie D, Rambaut A (2012) Bayesian
phylogenetics with BEAUti and the BEAST 1.7. Molecular Biol-
ogy and Evolution, Early view, doi: 10.1093/molbev/mss075.
Eldridge WH, Bacigalupi MD, Adelman IR, Miller LM, Kapu-
scinski AR (2002) Determination of relative survival of two
stocked walleye populations and resident natural-origin fish
by microsatellite DNA parentage assignment. Canadian Jour-
nal of Fisheries and Aquatic Sciences, 59, 282–290.
Evanno G, Regnaut S, Goudet J (2005) Detecting the number of
clusters of individuals using the software STRUCTURE: a
simulation study. Molecular Ecology, 14, 2611–2620.Excoffier L, Lischer HEL (2010) ARLEQUIN suite ver 3.5: a
new series of programs to perform population genetics anal-
yses under Linux and Windows. Molecular Ecology Resources,
10, 564–567.
© 2012 Blackwell Publishing Ltd
18 O. J . SEPULVEDA-VILLET and C. A. STEPIEN
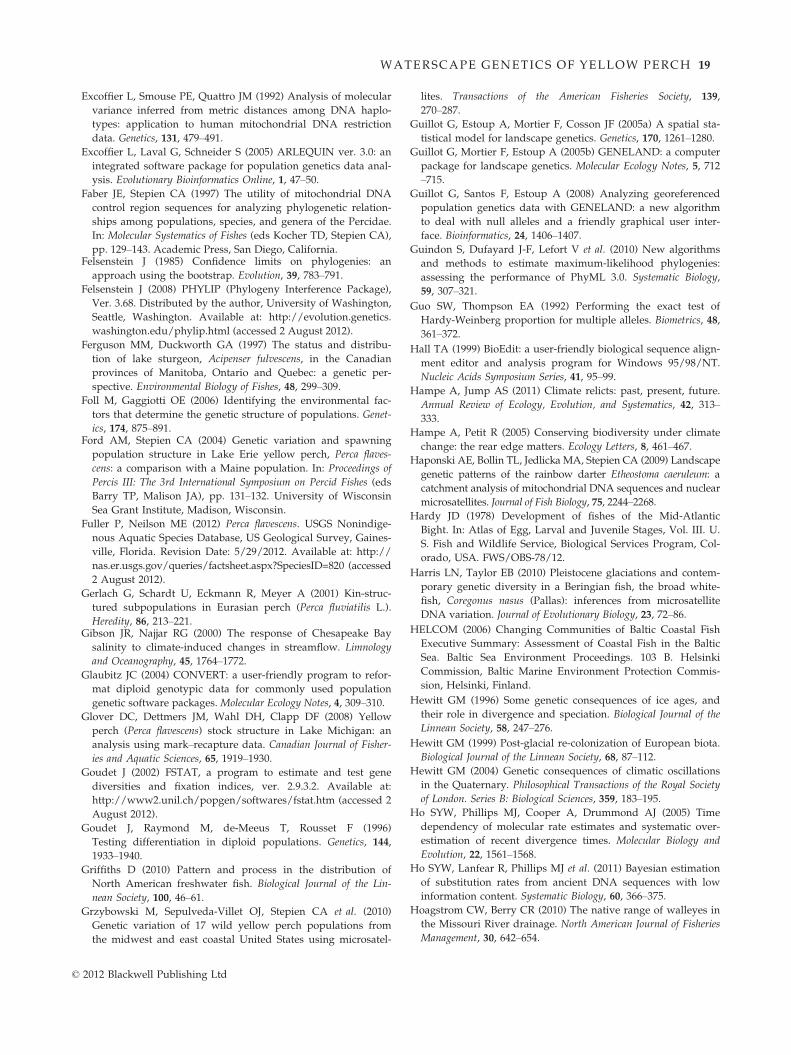
Excoffier L, Smouse PE, Quattro JM (1992) Analysis of molecular
variance inferred from metric distances among DNA haplo-
types: application to human mitochondrial DNA restriction
data. Genetics, 131, 479–491.Excoffier L, Laval G, Schneider S (2005) ARLEQUIN ver. 3.0: an
integrated software package for population genetics data anal-
ysis. Evolutionary Bioinformatics Online, 1, 47–50.
Faber JE, Stepien CA (1997) The utility of mitochondrial DNA
control region sequences for analyzing phylogenetic relation-
ships among populations, species, and genera of the Percidae.
In: Molecular Systematics of Fishes (eds Kocher TD, Stepien CA),
pp. 129–143. Academic Press, San Diego, California.Felsenstein J (1985) Confidence limits on phylogenies: an
approach using the bootstrap. Evolution, 39, 783–791.Felsenstein J (2008) PHYLIP (Phylogeny Interference Package),
Ver. 3.68. Distributed by the author, University of Washington,
Seattle, Washington. Available at: http://evolution.genetics.
washington.edu/phylip.html (accessed 2 August 2012).
Ferguson MM, Duckworth GA (1997) The status and distribu-
tion of lake sturgeon, Acipenser fulvescens, in the Canadian
provinces of Manitoba, Ontario and Quebec: a genetic per-
spective. Environmental Biology of Fishes, 48, 299–309.Foll M, Gaggiotti OE (2006) Identifying the environmental fac-
tors that determine the genetic structure of populations. Genet-
ics, 174, 875–891.Ford AM, Stepien CA (2004) Genetic variation and spawning
population structure in Lake Erie yellow perch, Perca flaves-
cens: a comparison with a Maine population. In: Proceedings of
Percis III: The 3rd International Symposium on Percid Fishes (eds
Barry TP, Malison JA), pp. 131–132. University of Wisconsin
Sea Grant Institute, Madison, Wisconsin.
Fuller P, Neilson ME (2012) Perca flavescens. USGS Nonindige-
nous Aquatic Species Database, US Geological Survey, Gaines-
ville, Florida. Revision Date: 5/29/2012. Available at: http://
nas.er.usgs.gov/queries/factsheet.aspx?SpeciesID=820 (accessed
2 August 2012).
Gerlach G, Schardt U, Eckmann R, Meyer A (2001) Kin-struc-
tured subpopulations in Eurasian perch (Perca fluviatilis L.).
Heredity, 86, 213–221.Gibson JR, Najjar RG (2000) The response of Chesapeake Bay
salinity to climate-induced changes in streamflow. Limnology
and Oceanography, 45, 1764–1772.
Glaubitz JC (2004) CONVERT: a user-friendly program to refor-
mat diploid genotypic data for commonly used population
genetic software packages. Molecular Ecology Notes, 4, 309–310.Glover DC, Dettmers JM, Wahl DH, Clapp DF (2008) Yellow
perch (Perca flavescens) stock structure in Lake Michigan: an
analysis using mark–recapture data. Canadian Journal of Fisher-
ies and Aquatic Sciences, 65, 1919–1930.Goudet J (2002) FSTAT, a program to estimate and test gene
diversities and fixation indices, ver. 2.9.3.2. Available at:
http://www2.unil.ch/popgen/softwares/fstat.htm (accessed 2
August 2012).
Goudet J, Raymond M, de-Meeus T, Rousset F (1996)
Testing differentiation in diploid populations. Genetics, 144,
1933–1940.
Griffiths D (2010) Pattern and process in the distribution of
North American freshwater fish. Biological Journal of the Lin-
nean Society, 100, 46–61.Grzybowski M, Sepulveda-Villet OJ, Stepien CA et al. (2010)
Genetic variation of 17 wild yellow perch populations from
the midwest and east coastal United States using microsatel-
lites. Transactions of the American Fisheries Society, 139,
270–287.Guillot G, Estoup A, Mortier F, Cosson JF (2005a) A spatial sta-
tistical model for landscape genetics. Genetics, 170, 1261–1280.Guillot G, Mortier F, Estoup A (2005b) GENELAND: a computer
package for landscape genetics. Molecular Ecology Notes, 5, 712
–715.
Guillot G, Santos F, Estoup A (2008) Analyzing georeferenced
population genetics data with GENELAND: a new algorithm
to deal with null alleles and a friendly graphical user inter-
face. Bioinformatics, 24, 1406–1407.
Guindon S, Dufayard J-F, Lefort V et al. (2010) New algorithms
and methods to estimate maximum-likelihood phylogenies:
assessing the performance of PhyML 3.0. Systematic Biology,
59, 307–321.
Guo SW, Thompson EA (1992) Performing the exact test of
Hardy-Weinberg proportion for multiple alleles. Biometrics, 48,
361–372.
Hall TA (1999) BioEdit: a user-friendly biological sequence align-
ment editor and analysis program for Windows 95/98/NT.
Nucleic Acids Symposium Series, 41, 95–99.
Hampe A, Jump AS (2011) Climate relicts: past, present, future.
Annual Review of Ecology, Evolution, and Systematics, 42, 313–
333.
Hampe A, Petit R (2005) Conserving biodiversity under climate
change: the rear edge matters. Ecology Letters, 8, 461–467.Haponski AE, Bollin TL, Jedlicka MA, Stepien CA (2009) Landscape
genetic patterns of the rainbow darter Etheostoma caeruleum: a
catchment analysis of mitochondrial DNA sequences and nuclear
microsatellites. Journal of Fish Biology, 75, 2244–2268.
Hardy JD (1978) Development of fishes of the Mid-Atlantic
Bight. In: Atlas of Egg, Larval and Juvenile Stages, Vol. III. U.
S. Fish and Wildlife Service, Biological Services Program, Col-
orado, USA. FWS/OBS-78/12.
Harris LN, Taylor EB (2010) Pleistocene glaciations and contem-
porary genetic diversity in a Beringian fish, the broad white-
fish, Coregonus nasus (Pallas): inferences from microsatellite
DNA variation. Journal of Evolutionary Biology, 23, 72–86.
HELCOM (2006) Changing Communities of Baltic Coastal Fish
Executive Summary: Assessment of Coastal Fish in the Baltic
Sea. Baltic Sea Environment Proceedings. 103 B. Helsinki
Commission, Baltic Marine Environment Protection Commis-
sion, Helsinki, Finland.
Hewitt GM (1996) Some genetic consequences of ice ages, and
their role in divergence and speciation. Biological Journal of the
Linnean Society, 58, 247–276.
Hewitt GM (1999) Post-glacial re-colonization of European biota.
Biological Journal of the Linnean Society, 68, 87–112.
Hewitt GM (2004) Genetic consequences of climatic oscillations
in the Quaternary. Philosophical Transactions of the Royal Society
of London. Series B: Biological Sciences, 359, 183–195.Ho SYW, Phillips MJ, Cooper A, Drummond AJ (2005) Time
dependency of molecular rate estimates and systematic over-
estimation of recent divergence times. Molecular Biology and
Evolution, 22, 1561–1568.Ho SYW, Lanfear R, Phillips MJ et al. (2011) Bayesian estimation
of substitution rates from ancient DNA sequences with low
information content. Systematic Biology, 60, 366–375.
Hoagstrom CW, Berry CR (2010) The native range of walleyes in
the Missouri River drainage. North American Journal of Fisheries
Management, 30, 642–654.
© 2012 Blackwell Publishing Ltd
WATERSCAPE GENETICS OF YELLOW PERCH 19
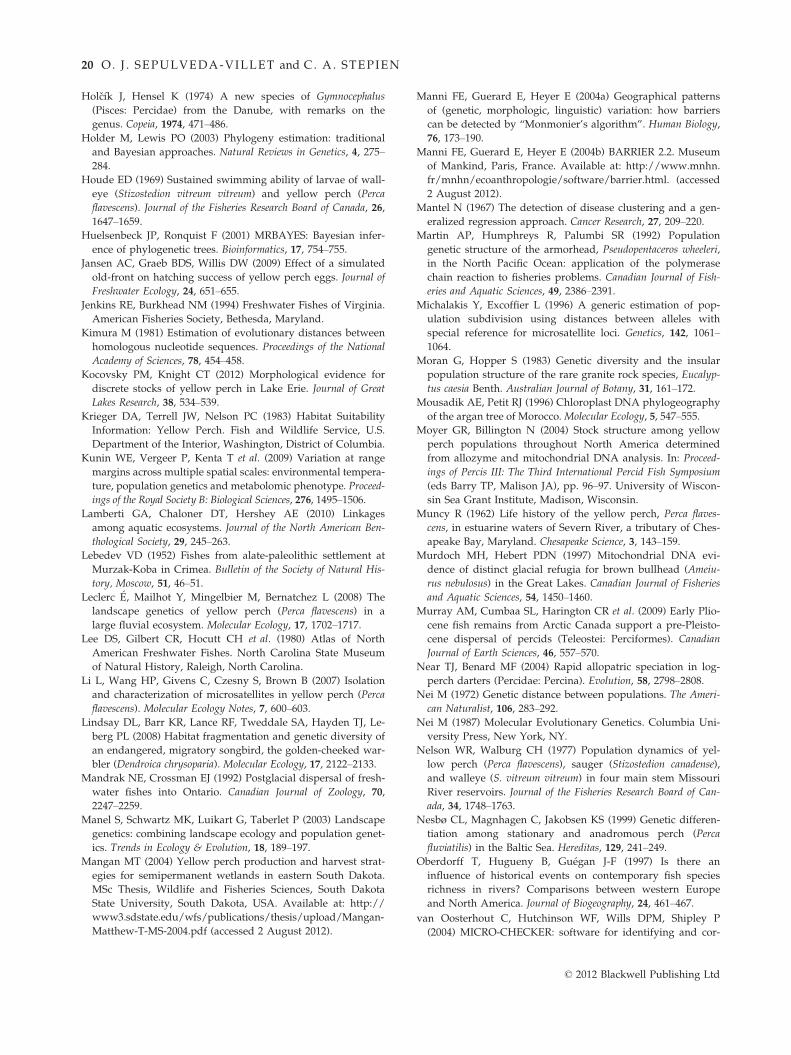
Holcık J, Hensel K (1974) A new species of Gymnocephalus
(Pisces: Percidae) from the Danube, with remarks on the
genus. Copeia, 1974, 471–486.
Holder M, Lewis PO (2003) Phylogeny estimation: traditional
and Bayesian approaches. Natural Reviews in Genetics, 4, 275–
284.
Houde ED (1969) Sustained swimming ability of larvae of wall-
eye (Stizostedion vitreum vitreum) and yellow perch (Perca
flavescens). Journal of the Fisheries Research Board of Canada, 26,
1647–1659.Huelsenbeck JP, Ronquist F (2001) MRBAYES: Bayesian infer-
ence of phylogenetic trees. Bioinformatics, 17, 754–755.Jansen AC, Graeb BDS, Willis DW (2009) Effect of a simulated
old-front on hatching success of yellow perch eggs. Journal of
Freshwater Ecology, 24, 651–655.
Jenkins RE, Burkhead NM (1994) Freshwater Fishes of Virginia.
American Fisheries Society, Bethesda, Maryland.
Kimura M (1981) Estimation of evolutionary distances between
homologous nucleotide sequences. Proceedings of the National
Academy of Sciences, 78, 454–458.Kocovsky PM, Knight CT (2012) Morphological evidence for
discrete stocks of yellow perch in Lake Erie. Journal of Great
Lakes Research, 38, 534–539.
Krieger DA, Terrell JW, Nelson PC (1983) Habitat Suitability
Information: Yellow Perch. Fish and Wildlife Service, U.S.
Department of the Interior, Washington, District of Columbia.
Kunin WE, Vergeer P, Kenta T et al. (2009) Variation at range
margins across multiple spatial scales: environmental tempera-
ture, population genetics and metabolomic phenotype. Proceed-
ings of the Royal Society B: Biological Sciences, 276, 1495–1506.
Lamberti GA, Chaloner DT, Hershey AE (2010) Linkages
among aquatic ecosystems. Journal of the North American Ben-
thological Society, 29, 245–263.Lebedev VD (1952) Fishes from alate-paleolithic settlement at
Murzak-Koba in Crimea. Bulletin of the Society of Natural His-
tory, Moscow, 51, 46–51.
Leclerc E, Mailhot Y, Mingelbier M, Bernatchez L (2008) The
landscape genetics of yellow perch (Perca flavescens) in a
large fluvial ecosystem. Molecular Ecology, 17, 1702–1717.Lee DS, Gilbert CR, Hocutt CH et al. (1980) Atlas of North
American Freshwater Fishes. North Carolina State Museum
of Natural History, Raleigh, North Carolina.
Li L, Wang HP, Givens C, Czesny S, Brown B (2007) Isolation
and characterization of microsatellites in yellow perch (Perca
flavescens). Molecular Ecology Notes, 7, 600–603.Lindsay DL, Barr KR, Lance RF, Tweddale SA, Hayden TJ, Le-
berg PL (2008) Habitat fragmentation and genetic diversity of
an endangered, migratory songbird, the golden-cheeked war-
bler (Dendroica chrysoparia). Molecular Ecology, 17, 2122–2133.Mandrak NE, Crossman EJ (1992) Postglacial dispersal of fresh-
water fishes into Ontario. Canadian Journal of Zoology, 70,
2247–2259.
Manel S, Schwartz MK, Luikart G, Taberlet P (2003) Landscape
genetics: combining landscape ecology and population genet-
ics. Trends in Ecology & Evolution, 18, 189–197.Mangan MT (2004) Yellow perch production and harvest strat-
egies for semipermanent wetlands in eastern South Dakota.
MSc Thesis, Wildlife and Fisheries Sciences, South Dakota
State University, South Dakota, USA. Available at: http://
www3.sdstate.edu/wfs/publications/thesis/upload/Mangan-
Matthew-T-MS-2004.pdf (accessed 2 August 2012).
Manni FE, Guerard E, Heyer E (2004a) Geographical patterns
of (genetic, morphologic, linguistic) variation: how barriers
can be detected by “Monmonier’s algorithm”. Human Biology,
76, 173–190.Manni FE, Guerard E, Heyer E (2004b) BARRIER 2.2. Museum
of Mankind, Paris, France. Available at: http://www.mnhn.
fr/mnhn/ecoanthropologie/software/barrier.html. (accessed
2 August 2012).
Mantel N (1967) The detection of disease clustering and a gen-
eralized regression approach. Cancer Research, 27, 209–220.Martin AP, Humphreys R, Palumbi SR (1992) Population
genetic structure of the armorhead, Pseudopentaceros wheeleri,
in the North Pacific Ocean: application of the polymerase
chain reaction to fisheries problems. Canadian Journal of Fish-
eries and Aquatic Sciences, 49, 2386–2391.
Michalakis Y, Excoffier L (1996) A generic estimation of pop-
ulation subdivision using distances between alleles with
special reference for microsatellite loci. Genetics, 142, 1061–1064.
Moran G, Hopper S (1983) Genetic diversity and the insular
population structure of the rare granite rock species, Eucalyp-
tus caesia Benth. Australian Journal of Botany, 31, 161–172.Mousadik AE, Petit RJ (1996) Chloroplast DNA phylogeography
of the argan tree of Morocco. Molecular Ecology, 5, 547–555.Moyer GR, Billington N (2004) Stock structure among yellow
perch populations throughout North America determined
from allozyme and mitochondrial DNA analysis. In: Proceed-
ings of Percis III: The Third International Percid Fish Symposium
(eds Barry TP, Malison JA), pp. 96–97. University of Wiscon-
sin Sea Grant Institute, Madison, Wisconsin.
Muncy R (1962) Life history of the yellow perch, Perca flaves-
cens, in estuarine waters of Severn River, a tributary of Ches-
apeake Bay, Maryland. Chesapeake Science, 3, 143–159.Murdoch MH, Hebert PDN (1997) Mitochondrial DNA evi-
dence of distinct glacial refugia for brown bullhead (Ameiu-
rus nebulosus) in the Great Lakes. Canadian Journal of Fisheries
and Aquatic Sciences, 54, 1450–1460.Murray AM, Cumbaa SL, Harington CR et al. (2009) Early Plio-
cene fish remains from Arctic Canada support a pre-Pleisto-
cene dispersal of percids (Teleostei: Perciformes). Canadian
Journal of Earth Sciences, 46, 557–570.Near TJ, Benard MF (2004) Rapid allopatric speciation in log-
perch darters (Percidae: Percina). Evolution, 58, 2798–2808.Nei M (1972) Genetic distance between populations. The Ameri-
can Naturalist, 106, 283–292.Nei M (1987) Molecular Evolutionary Genetics. Columbia Uni-
versity Press, New York, NY.
Nelson WR, Walburg CH (1977) Population dynamics of yel-
low perch (Perca flavescens), sauger (Stizostedion canadense),
and walleye (S. vitreum vitreum) in four main stem Missouri
River reservoirs. Journal of the Fisheries Research Board of Can-
ada, 34, 1748–1763.
Nesbø CL, Magnhagen C, Jakobsen KS (1999) Genetic differen-
tiation among stationary and anadromous perch (Perca
fluviatilis) in the Baltic Sea. Hereditas, 129, 241–249.Oberdorff T, Hugueny B, Guegan J-F (1997) Is there an
influence of historical events on contemporary fish species
richness in rivers? Comparisons between western Europe
and North America. Journal of Biogeography, 24, 461–467.
van Oosterhout C, Hutchinson WF, Wills DPM, Shipley P
(2004) MICRO-CHECKER: software for identifying and cor-
© 2012 Blackwell Publishing Ltd
20 O. J . SEPULVEDA-VILLET and C. A. STEPIEN
recting genotyping errors in microsatellite data. Molecular Ecol-
ogy Notes, 4, 535–538.
van Oosterhout C, Hutchinson WF, Wills DPM, Shipley P (2006)
MICRO-CHECKER. Available at: http://www.microchecker.
hull.ac.uk (accessed 2 August 2012).
Ouborg NJ, Pertoldi C, Loeschcke V, Bijlsma R, Hedrick PW
(2010) Conservation genetics in transition to conservation ge-
nomics. Trends in Genetics, 26, 177–187.
Parker AD, Stepien CA, Sepulveda-Villet OJ, Ruehl CB, Uzarski
DG (2009) The interplay of morphology, habitat, resource use,
and genetic relationships in young yellow perch. Transactions
of the American Fisheries Society, 138, 899–914.Petit RJ, Aguinagalde I, de Beaulieu J-L et al. (2003) Glacial refu-
gia: hotspots but not melting pots of genetic diversity. Science,
300, 1563–1565.
Piry S, Alapetite A, Cornuet J-M et al. (2004) GENECLASS2: a
software for genetic assignment and first-generation migrant
detection. Journal of Heredity, 95, 536–539.
Posada D (2008) jMODELTEST: phylogenetic model averaging.
Molecular Biology and Evolution, 25, 1253–1256.Pritchard JK, Wen W (2004) Documentation for STRUCTURE
Software: Ver 2.3.3. Department of Human Genetics, Univer-
sity of Chicago, Chicago, Illinois. Available at: http://pritch.
bsd.uchicago.edu/structure.html (accessed 2 August 2012).
Pritchard JK, Stephens M, Donnelly P (2000) Inference of popu-
lation structure using multilocus genotype data. Genetics, 155,
945–959.
Provan J, Bennett KD (2008) Phylogeographic insights into cryp-
tic glacial refugia. Trends in Ecology & Evolution, 23, 564–571.R Development Core Team (2008) R: A language and environ-
ment for statistical computing r foundation for statistical com-
puting. Available at: http://www.r-project.org (accessed 2
August 2012).
Radabaugh NB, Bauer WF, Brown ML (2010) A comparison of
seasonal movement patterns of yellow perch in simple and
complex lake basins. North American Journal of Fisheries Man-
agement, 30, 179–190.Rambaut A, Drummond AJ (2007) Tracer v1.4. Available at:
http://beast.bio.ed.ac.uk/Tracer (accessed 2 August 2012).
Raymond M, Rousset F (1995) An exact test for population dif-
ferentiation. Evolution, 49, 1280–1283.Rempel LL, Smith DG (1998) Postglacial fish dispersal from the
Mississippi refuge to the Mackenzie River basin. Canadian
Journal of Fisheries and Aquatic Sciences, 55, 893–899.
Rice WR (1989) Analyzing tables of statistical tests. Evolution, 43,
223–225.
Rodrigues CG, Vilks G (1994) The impact of glacial lake runoff
on the Goldthwait and Champlain seas: the relationship
between glacial Lake Agassiz runoff and the younger Dryas.
Quaternary Science Reviews, 13, 923–944.
Ronquist F, Huelsenbeck JP (2003) MRBAYES 3: Bayesian phylo-
genetic inference under mixed models. Bioinformatics, 19, 1572
–1574.Roseman E, Kocovsky P, Vandergoot C (2010) Status of Walleye
in the Great Lakes: Proceedings of the 2006 Symposium. Great
Lakes Fishery Commission Technical Report 69. Great Lakes
Fishery Commission, Ann Arbor, Michigan.
Rousset F (1997) Genetic differentiation and estimation of gene
flow from F-statistics under isolation by distance. Genetics,
145, 1219–1228.
Rousset F (2008) GENEPOP’007: a complete re-implementation
of the GENEPOP software for Windows and Linux. Molecular
Ecology Resources, 8, 103–106.
Russell DA, Rich FJ, Schneider V, Lynch-Stieglitz J (2009) A
warm thermal enclave in the late Pleistocene of the south-east-
ern United States. Biological Reviews, 84, 173–202.Saarnisto M (1974) The deglaciation history of the Lake Superior
region and its climatic implications. Quaternary Research, 4, 316
–339.
Sanderson MJ (2002) Estimating absolute rates of molecular evo-
lution and divergence times: a penalized likelihood approach.
Molecular Biology and Evolution, 19, 101–109.Sanderson MJ (2003) r8s: inferring absolute rates of molecular
evolution and divergence times in the absence of a molecular
clock. Bioinformatics, 19, 301–302.
Schmidt RE (1986) Zoogeography of the northern Appalachians.
In: The Zoogeography of North American Freshwater Fishes (eds
Hocutt CH, Wiley EO), pp. 137–159. John Wiley & Sons, New
York, NY.Scott WB, Crossman EJ (1973) Freshwater fishes of Canada. Fish-
eries Research Board of Canada Bulletin, 184, 1–196. Fisheries
Research Board of Canada, Ottawa, Canada.
Sepulveda-Villet OJ, Stepien CA (2011) Fine-scale population
genetic structure of the yellow perch Perca flavescens in Lake
Erie. Canadian Journal of Fisheries and Aquatic Sciences, 68, 1435–
1453.
Sepulveda-Villet OJ, Ford AM, Williams JD, Stepien CA (2009)
Population genetic diversity and phylogeographic divergence
patterns of the yellow perch (Perca flavescens). Journal of Great
Lakes Research, 35, 107–119.Sheldon CT, Cottier JW (1983) Origins of Mobile: archaeological
excavations at the Courthouse site, Mobile, Alabama. Auburn Uni-
versity Archaeological Monograph 5. Auburn University, Mobile,
Alabama.
Smith-Vaniz WF (1968) Fishes of Alabama. Paragon Press, Mont-
gomery, Alabama.
Sokal RR, Rohlf FJ (1995) Biometry, 3rd edn. WH Freeman and
Co, Inc., New York, NY.Soltis DE, Morris AB, McLachlan JS et al. (2006) Comparative
phylogeography of unglaciated eastern North America. Molec-
ular Ecology, 15, 4261–4293.Sork VL, Waits L (2010) Contributions of landscape genetics –
approaches, insights, and future potential. Molecular Ecology,
19, 3489–3495.
Stepien CA, Dillon AK, Chandler MD (1998) Genetic identity,
phylogeography, and systematics of ruffe Gymnocephalus in
the North American Great Lakes and Eurasia. Journal of Great
Lakes Research, 24, 361–378.
Stepien CA, Brown JE, Neilson ME, Tumeo MA (2005) Genetic
diversity of invasive species in the great lakes versus their
Eurasian source populations: insights for risk analysis. Risk
Analysis, 25, 1043–1060.
Stepien CA, Murphy DJ, Strange RM (2007) Broad- to fine-scale
population genetic patterning in the smallmouth bass Micr-
opterus dolomieu across the Laurentian Great Lakes and
beyond: an interplay of behaviour and geography. Molecular
Ecology, 16, 1605–1624.Stepien CA, Murphy DJ, Lohner RN et al. (2009) Signatures of
vicariance, postglacial dispersal and spawning philopatry:
population genetics of the walleye Sander vitreus. Molecular
Ecology, 18, 3411–3428.
© 2012 Blackwell Publishing Ltd
WATERSCAPE GENETICS OF YELLOW PERCH 21
Stepien CA, Murphy DJ, Lohner RN et al. (2010) Status and
delineation of walleye genetic stock structure across the
Great Lakes. In: Status of Walleye in the Great Lakes: Pro-
ceedings of the 2006 Symposium, pp. 189–223. Great Lakes
Fishery Commission Technical Report 69. Great Lakes Fish-
ery Commission, Ann Arbor, Michigan.
Strange RM, Stepien CA (2007) Genetic divergence and connec-
tivity among river and reef spawning groups of walleye
(Sander vitreus vitreus) in Lake Erie. Canadian Journal of Fisher-
ies and Aquatic Sciences, 64, 437–448.Teller JT, Mahnic P (1988) History of sedimentation in the
northwestern Lake Superior basin and its relation to Lake A-
gassiz overflow. Canadian Journal of Earth Sciences, 25, 1660–
1673.
Tessier N, Bernatchez L (1999) Stability of population structure
and genetic diversity across generations assessed by micro-
satellites among sympatric populations of landlocked Atlan-
tic salmon (Salmo salar L.). Molecular Ecology, 8, 169–179.Todd TN, Hatcher CO (1993) Genetic variability and glacial
origins of yellow perch (Perca flavescens) in North America.
Canadian Journal of Fisheries and Aquatic Sciences, 50, 1828–
1834.
Turgeon J, Bernatchez L (2001) Mitochondrial DNA phylogeog-
raphy of lake cisco (Coregonus artedi): evidence supporting
extensive secondary contacts between two glacial races.
Molecular Ecology, 10, 987–1001.Underhill JC (1986) The fish fauna of the Laurentian Great
Lakes, the St Lawrence lowlands, Newfoundland and Labra-
dor. In: The Zoogeography of North American Freshwater Fishes
(eds Hocutt CH, Wiley EO), pp. 105–136. John Willey &
Sons, Inc, New York, NY.
Vandewoestijne S, Schtickzelle N, Baguette M (2008) Positive
correlation between genetic diversity and fitness in a large,
well-connected metapopulation. BMC Biology, 6, 46.
Walker M, Stockman A, Marek P, Bond J (2009) Pleistocene
glacial refugia across the Appalachian Mountains and coastal
plain in the millipede genus Narceus: evidence from popula-
tion genetic, phylogeographic, and paleoclimatic data. BMC
Evolutionary Biology, 9, 25–36.Wang JCS, Kernehan RJ (1979) Fishes of the Delaware Estuar-
ies: A Guide to Early Life History Stages. EA Communica-
tions, Towson, Maryland.
Weir BS, Cockerham CC (1984) Estimating F-statistics for the
analysis of population structure. Evolution, 38, 1358–1370.
Wilson CC, Hebert PD (1996) Phylogeographic origins of lake
trout (Salvelinus namaycush) in eastern North America.
Canadian Journal of Fisheries and Aquatic Sciences, 53, 2764–
2775.
Young AY, Torres CT, Mack JM, Cunningham CC (2002) Mor-
phological and genetic evidence for vicariance and refugium
in Atlantic and Gulf of Mexico populations of the hermit
crab Pagurus longicarpus. Marine Biology, 140, 1059–1066.
C.A.S.’s Great Lakes Genetics Laboratory (GLGL) at the Lake
Erie Centre of the University of Toledo focuses on conservation
genetics and genomics of native fishes and on invasion genet-
ics of nonindigenous species. This study is part of a series on
percid genetic patterns, dating to publications since 1995. This
manuscript is part of O.J.S.-V.’s PhD dissertation study in the
GLGL. O.J.S.-V. now is working on yellow perch aquaculture,
nutrition, and genetics as a postdoctoral fellow at the USDA
Agricultural Research Service in Milwaukee, Wisconsin. The
GLGL also is investigating the evolutionary genetics and ge-
nomics of walleye Sander vitreus (see our 2009 Molecular Ecol-
ogy paper), smallmouth bass Micropterus dolomieu (2007
Molecular Ecology paper), round goby Neogobius melanostomus
(2009 and 2010 Molecular Ecology papers), tubenose goby Pro-
terorhinus semilunaris and the dreissenid mussels Dreissena poly-
morpha and D. bugensis. Additional information and updates
are available at http://www.utoledo.edu/nsm/lec/research/
glgl/index.html.
Data accessibility
DNA sequences: GenBank Accessions: 1 = FJ155931,
2 = FJ155932, 3 = FJ155933, 4 = FJ155934, 5 = FJ155935,
6 = FJ155936, 7 = FJ155937, 8 = FJ155938, 9 = FJ155939,
10 = FJ155940, 11 = FJ155941, 12 = FJ155942, 13 = FJ155943,
14 = FJ155944, 15 = FJ155945, 16 = FJ155946, 17 = FJ155947,
18 = FJ155948, 19 = FJ155949, 20 = FJ155950, 21 = FJ155951,
22 = JX454954, 23 = JX454955, 24 = X454956, 25 = JX454957,
and 26 = JX454958.
Arlequin-formatted nuclear microsatellite and mito-
chondrial haplotype input files, as well as Nexus-for-
matted mitochondrial haplotype alignments files, are
available at http://www.datadryad.org. doi: 10.5061/
dryad.91rg5.
© 2012 Blackwell Publishing Ltd
22 O. J . SEPULVEDA-VILLET and C. A. STEPIEN
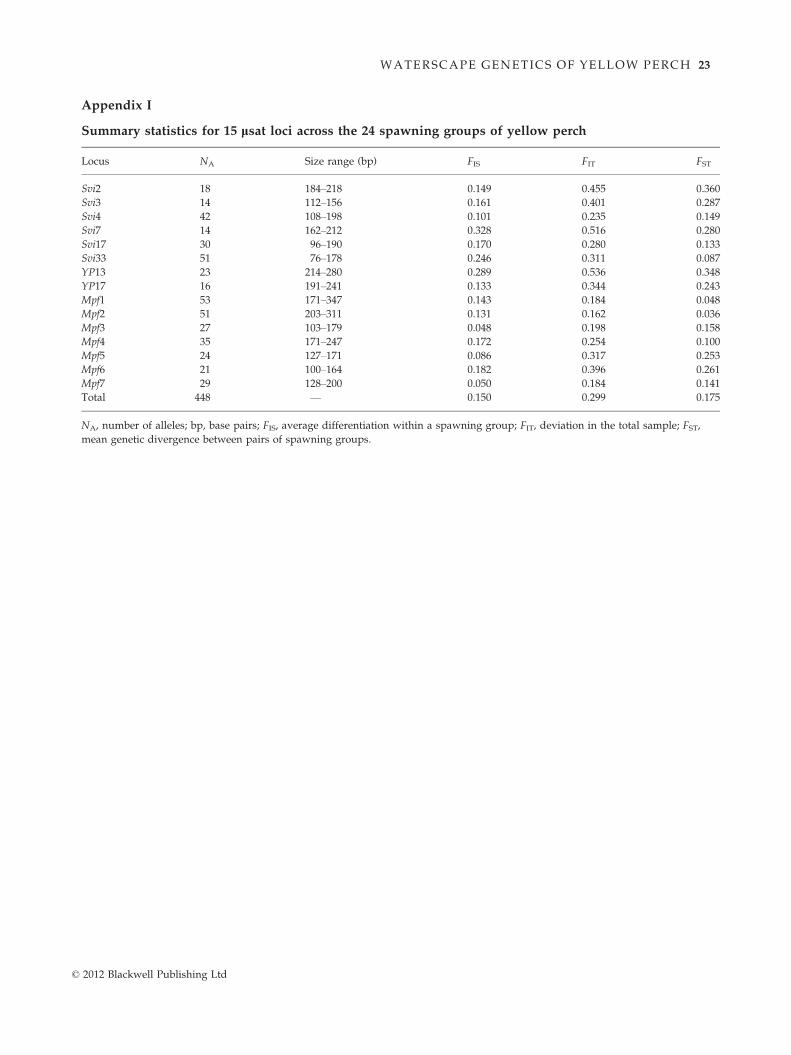
Appendix I
Summary statistics for 15 lsat loci across the 24 spawning groups of yellow perch
Locus NA Size range (bp) FIS FIT FST
Svi2 18 184–218 0.149 0.455 0.360
Svi3 14 112–156 0.161 0.401 0.287
Svi4 42 108–198 0.101 0.235 0.149
Svi7 14 162–212 0.328 0.516 0.280
Svi17 30 96–190 0.170 0.280 0.133
Svi33 51 76–178 0.246 0.311 0.087
YP13 23 214–280 0.289 0.536 0.348
YP17 16 191–241 0.133 0.344 0.243
Mpf1 53 171–347 0.143 0.184 0.048
Mpf2 51 203–311 0.131 0.162 0.036
Mpf3 27 103–179 0.048 0.198 0.158
Mpf4 35 171–247 0.172 0.254 0.100
Mpf5 24 127–171 0.086 0.317 0.253
Mpf6 21 100–164 0.182 0.396 0.261
Mpf7 29 128–200 0.050 0.184 0.141
Total 448 — 0.150 0.299 0.175
NA, number of alleles; bp, base pairs; FIS, average differentiation within a spawning group; FIT, deviation in the total sample; FST,
mean genetic divergence between pairs of spawning groups.
© 2012 Blackwell Publishing Ltd
WATERSCAPE GENETICS OF YELLOW PERCH 23
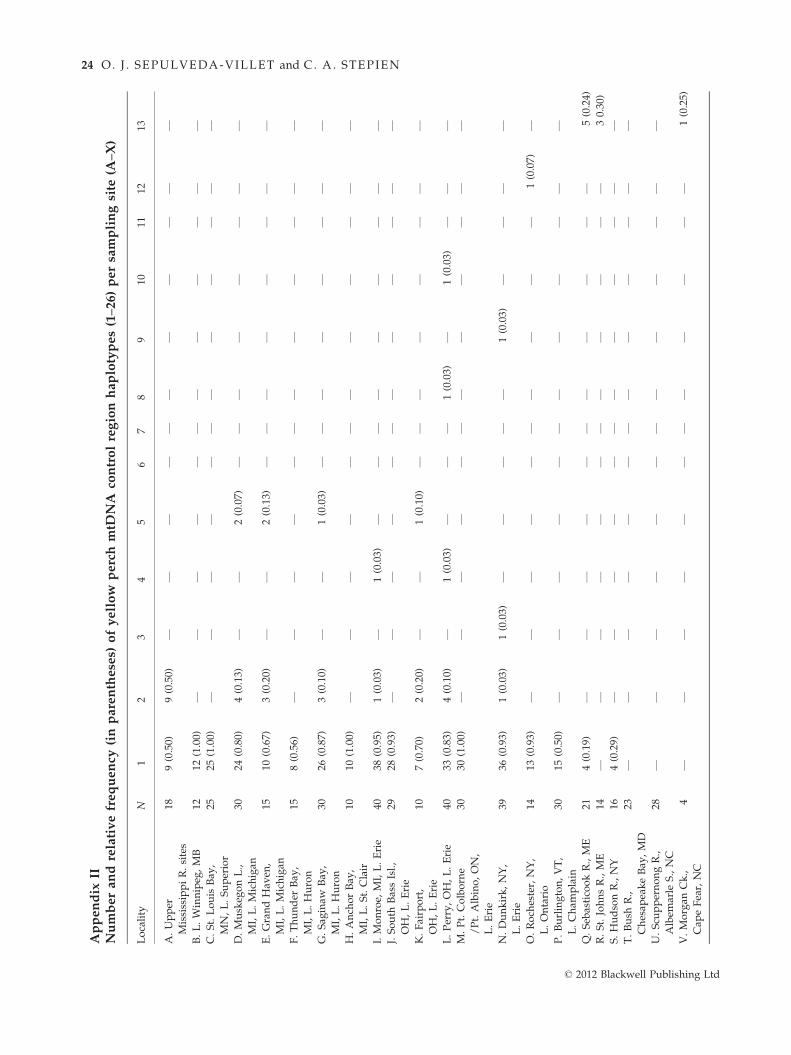
Appendix
IINumberandrelativefrequency
(inparentheses)
ofyellow
perchmtD
NA
controlregionhaplotypes(1–2
6)persamplingsite
(A–X
)
Locality
N1
23
45
67
89
1011
1213
A.Upper
MississippiR.sites
189(0.50)
9(0.50)
——
——
——
——
——
—
B.L.Winnipeg
,MB
1212
(1.00)
——
——
——
——
——
——
C.St.Louis
Bay
,
MN,L.Superior
2525
(1.00)
——
——
——
——
——
——
D.Muskeg
onL.,
MI,L.Michigan
3024
(0.80)
4(0.13)
——
2(0.07)
——
——
——
——
E.GrandHav
en,
MI,L.Michigan
1510
(0.67)
3(0.20)
——
2(0.13)
——
——
——
——
F.Thunder
Bay
,
MI,L.Huron
158(0.56)
——
——
——
——
——
——
G.Sag
inaw
Bay
,
MI,L.Huron
3026
(0.87)
3(0.10)
——
1(0.03)
——
——
——
——
H.Anch
orBay
,
MI,L.St.Clair
1010
(1.00)
——
——
——
——
——
——
I.Monroe,
MI,L.Erie
4038
(0.95)
1(0.03)
—1(0.03)
——
——
——
——
—
J.South
BassIsl.,
OH,L.Erie
2928
(0.93)
——
——
——
——
——
——
K.Fairport,
OH,L.Erie
107(0.70)
2(0.20)
——
1(0.10)
——
——
——
——
L.Perry,OH,L.Erie
4033
(0.83)
4(0.10)
—1(0.03)
——
—1(0.03)
—1(0.03)
——
—M.Pt.Colborne
/Pt.Albino,ON,
L.Erie
3030
(1.00)
——
——
——
——
——
——
N.Dunkirk,NY,
L.Erie
3936
(0.93)
1(0.03)
1(0.03)
——
——
—1(0.03)
——
——
O.Roch
ester,NY,
L.Ontario
1413
(0.93)
——
——
——
——
——
1(0.07)
—
P.Burlington,VT,
L.Cham
plain
3015
(0.50)
——
——
——
——
——
——
Q.Seb
asticookR.,ME
214(0.19)
——
——
——
——
——
—5(0.24)
R.St.JohnsR.,ME
14—
——
——
——
——
——
—30.30)
S.HudsonR.,NY
164(0.29)
——
——
——
——
——
——
T.Bush
R.,
Chesap
eakeBay
,MD
23—
——
——
——
——
——
——
U.Scu
ppernongR.,
Albem
arle
S.,NC
28—
——
——
——
——
——
——
V.Morgan
Ck.,
Cap
eFear,NC
4—
——
——
——
——
——
—1(0.25)
© 2012 Blackwell Publishing Ltd
24 O. J . SEPULVEDA-VILLET and C. A. STEPIEN
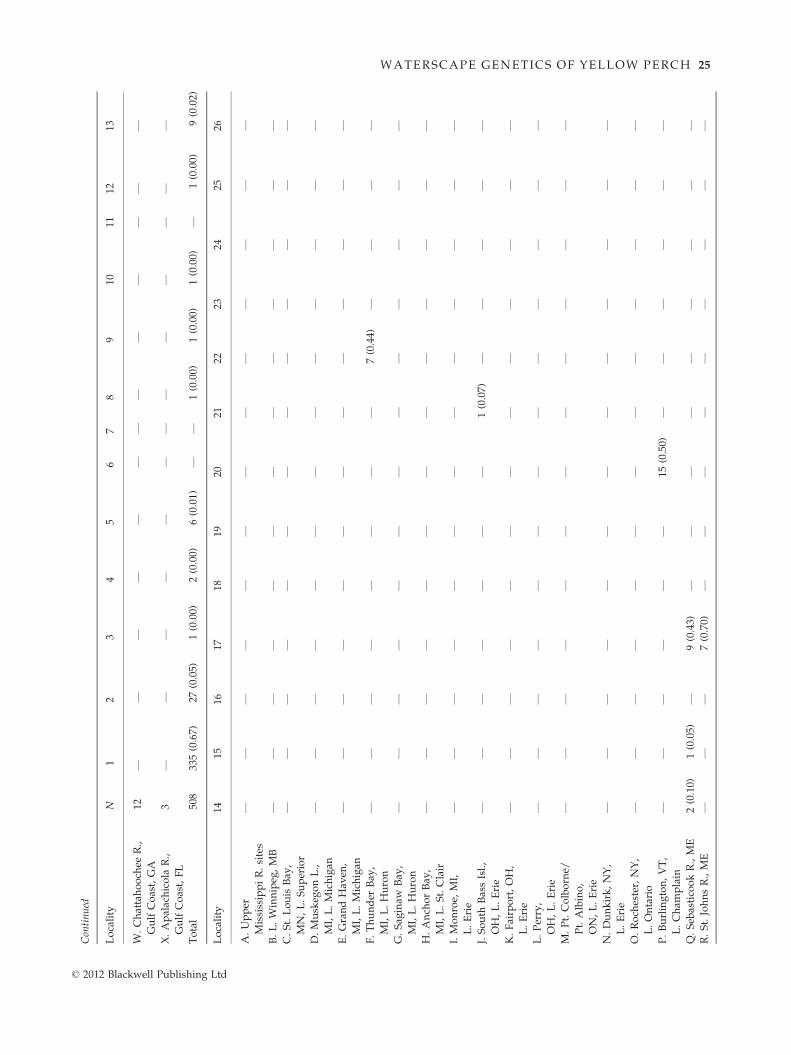
Continued
Locality
N1
23
45
67
89
1011
1213
W.Chattahooch
eeR.,
GulfCoast,GA
12—
——
——
——
——
——
——
X.Apalachicola
R.,
GulfCoast,FL
3—
——
——
——
——
——
——
Total
508
335(0.67)
27(0.05)
1(0.00)
2(0.00)
6(0.01)
——
1(0.00)
1(0.00)
1(0.00)
—1(0.00)
9(0.02)
Locality
1415
1617
1819
2021
2223
2425
26
A.Upper
MississippiR.sites
——
——
——
——
——
——
—
B.L.Winnipeg
,MB
——
——
——
——
——
——
—
C.St.Louis
Bay
,
MN,L.Superior
——
——
——
——
——
——
—
D.Muskeg
onL.,
MI,L.Michigan
——
——
——
——
——
——
—
E.GrandHav
en,
MI,L.Michigan
——
——
——
——
——
——
—
F.Thunder
Bay
,
MI,L.Huron
——
——
——
——
7(0.44)
——
——
G.Sag
inaw
Bay
,
MI,L.Huron
——
——
——
——
——
——
—
H.Anch
orBay
,
MI,L.St.Clair
——
——
——
——
——
——
—
I.Monroe,
MI,
L.Erie
——
——
——
——
——
——
—
J.South
BassIsl.,
OH,L.Erie
——
——
——
—1(0.07)
——
——
—
K.Fairport,OH,
L.Erie
——
——
——
——
——
——
—
L.Perry,
OH,L.Erie
——
——
——
——
——
——
—
M.Pt.Colborne/
Pt.Albino,
ON,L.Erie
——
——
——
——
——
——
—
N.Dunkirk,NY,
L.Erie
——
——
——
——
——
——
—
O.Roch
ester,NY,
L.Ontario
——
——
——
——
——
——
—
P.Burlington,VT,
L.Cham
plain
——
——
——
15(0.50)
——
——
——
Q.Seb
asticookR.,ME
2(0.10)
1(0.05)
—9(0.43)
——
——
——
——
—R.St.JohnsR.,ME
——
—7(0.70)
——
——
——
——
—
© 2012 Blackwell Publishing Ltd
WATERSCAPE GENETICS OF YELLOW PERCH 25
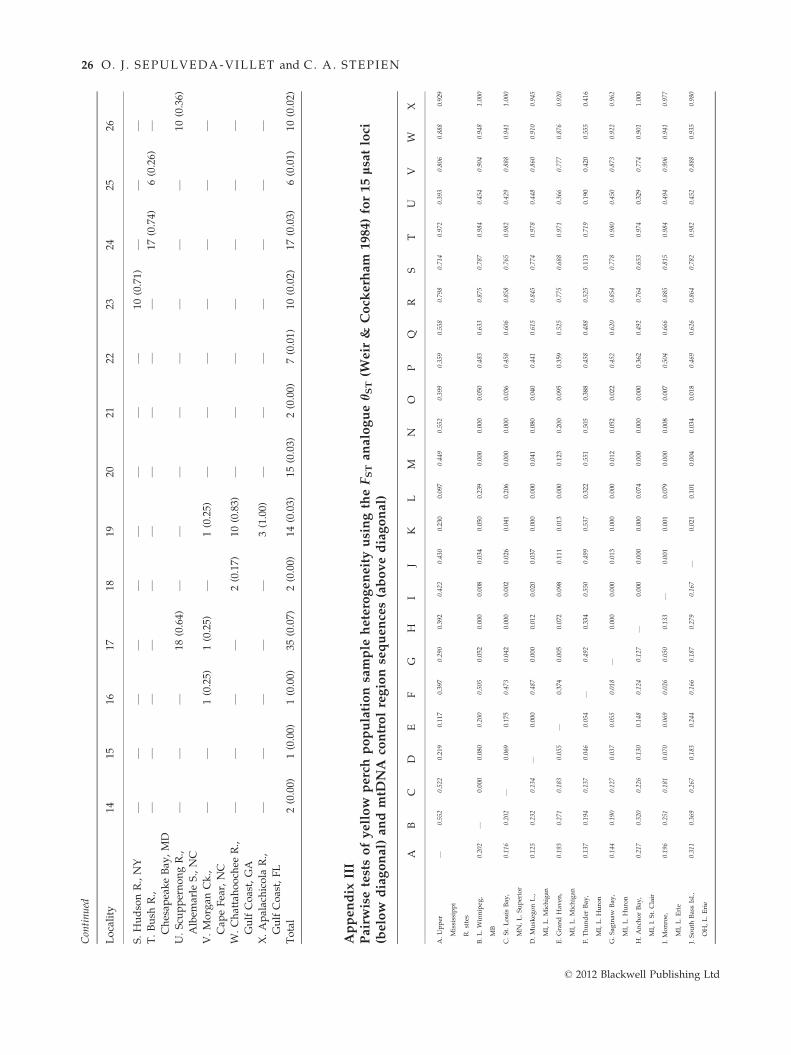
Continued
Locality
1415
1617
1819
2021
2223
2425
26
S.HudsonR.,NY
——
——
——
——
—10
(0.71)
——
—T.Bush
R.,
Chesap
eakeBay
,MD
——
——
——
——
——
17(0.74)
6(0.26)
—
U.Scu
ppernongR.,
Albem
arle
S.,NC
——
—18
(0.64)
——
——
——
——
10(0.36)
V.Morgan
Ck.,
Cap
eFear,NC
——
1(0.25)
1(0.25)
—1(0.25)
——
——
——
—
W.Chattahooch
eeR.,
GulfCoast,GA
——
——
2(0.17)
10(0.83)
——
——
——
—
X.Apalachicola
R.,
GulfCoast,FL
——
——
—3(1.00)
——
——
——
—
Total
2(0.00)
1(0.00)
1(0.00)
35(0.07)
2(0.00)
14(0.03)
15(0.03)
2(0.00)
7(0.01)
10(0.02)
17(0.03)
6(0.01)
10(0.02)
Appendix
III
Pairwisetestsofyellow
perchpopulationsample
heterogeneityusingtheFSTanaloguehST(W
eir
&Cock
erham
1984)for15lsatloci
(below
diagonal)
andmtD
NA
controlregionsequences(abovediagonal)
AB
CD
EF
GH
IJ
KL
MN
OP
QR
ST
UV
WX
A.Upper
Mississippi
R.sites
—0.55
20.52
20.21
90.11
70.39
70.29
00.39
20.42
20.43
00.23
00.09
70.44
90.55
20.39
90.35
90.55
80.79
80.71
40.97
20.39
30.80
60.88
80.92
9
B.L.W
innipeg,
MB
0.20
2—
0.00
00.08
00.20
00.50
50.05
20.00
00.00
80.03
40.05
00.23
90.00
00.00
00.05
00.48
30.63
30.87
50.78
70.98
40.45
40.90
40.94
81.00
0
C.St.Louis
Bay
,
MN,L.Superior
0.11
60.20
2—
0.06
90.17
50.47
30.04
20.00
00.00
20.02
60.04
10.20
60.00
00.00
00.03
60.45
80.60
60.85
80.76
50.98
20.42
90.88
80.94
11.00
0
D.Muskeg
onL.,
MI,L.Michigan
0.12
50.23
20.13
4—
0.00
00.48
70.00
00.01
20.02
00.03
70.00
00.00
00.04
10.08
00.04
00.44
10.61
50.84
50.77
40.97
80.44
80.86
00.91
00.94
5
E.GrandHav
en,
MI,L.Michigan
0.19
30.27
10.18
30.05
5—
0.37
40.00
50.07
20.09
80.11
10.01
30.00
00.12
30.20
00.09
50.35
90.52
50.77
50.68
80.97
10.36
60.77
70.87
60.92
0
F.Thunder
Bay
,
MI,L.Huron
0.13
70.19
40.13
70.04
60.05
4—
0.49
20.33
40.55
00.49
90.53
70.32
20.55
10.50
50.38
80.45
80.48
80.52
50.11
30.71
90.19
00.42
00.55
50.41
6
G.Sag
inaw
Bay
,
MI,L.Huron
0.14
40.19
00.12
70.03
70.05
50.01
8—
0.00
00.00
00.01
30.00
00.00
00.01
20.05
20.02
20.45
20.62
00.85
40.77
80.98
00.45
00.87
30.92
20.96
2
H.Anch
orBay
,
MI,l.St.Clair
0.21
70.32
00.22
60.13
00.14
80.12
40.12
7—
0.00
00.00
00.00
00.07
40.00
00.00
00.00
00.36
20.49
20.76
40.65
30.97
40.32
90.77
40.90
11.00
0
I.Monroe,
MI,L.Erie
0.19
60.25
10.18
10.07
00.06
90.02
60.05
00.13
3—
0.00
10.00
10.07
90.00
00.00
80.00
70.50
40.66
60.88
50.81
50.98
40.49
40.90
60.94
10.97
7
J.South
BassIsl.,
OH,L.Erie
0.31
10.36
90.26
70.18
30.24
40.16
60.18
70.27
90.16
7—
0.02
10.10
10.00
40.03
40.01
80.46
90.62
60.86
40.78
20.98
20.45
20.88
80.93
50.98
0
© 2012 Blackwell Publishing Ltd
26 O. J . SEPULVEDA-VILLET and C. A. STEPIEN
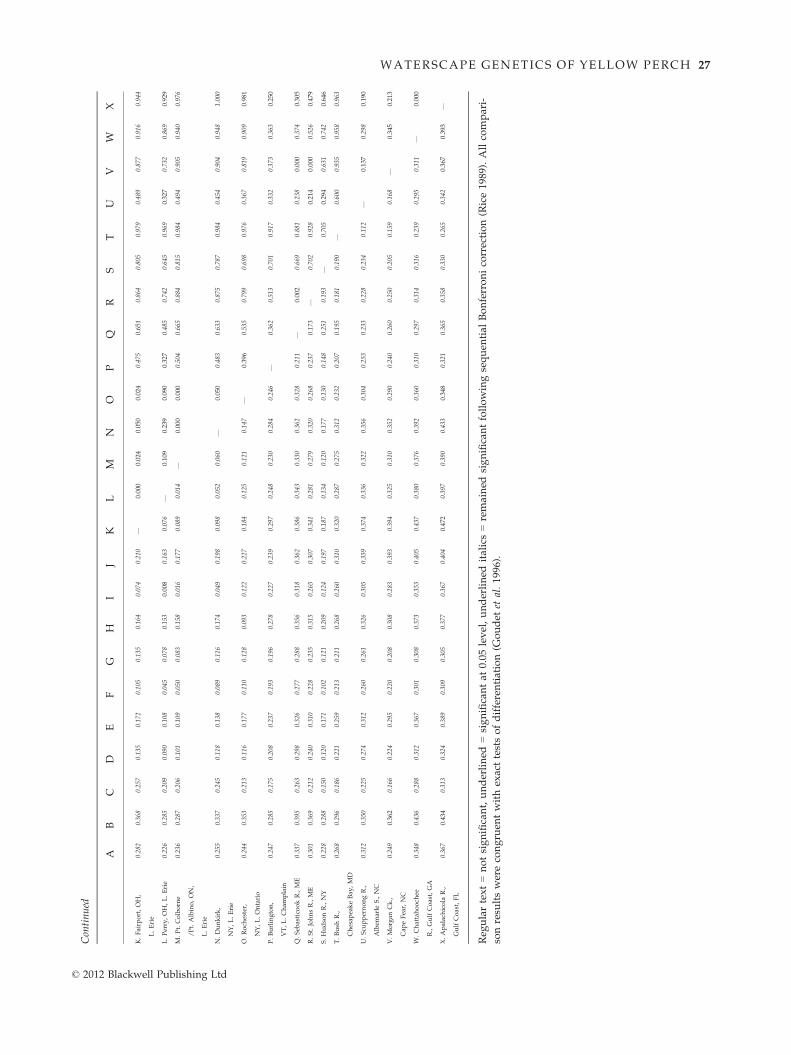
Continued
AB
CD
EF
GH
IJ
KL
MN
OP
QR
ST
UV
WX
K.Fairport,OH,
L.Erie
0.28
20.36
80.25
70.13
50.17
20.10
50.13
50.16
40.07
40.21
0—
0.00
00.02
40.05
00.02
40.47
50.65
10.86
40.80
50.97
90.48
90.87
70.91
60.94
4
L.Perry,OH,L.Erie
0.22
60.28
50.20
90.09
00.10
80.04
50.07
80.15
30.00
80.16
30.07
6—
0.10
90.23
90.09
00.32
70.48
50.74
20.64
50.96
90.32
70.73
20.86
90.92
9
M.Pt.Colborne
/Pt.Albino,ON,
L.Erie
0.23
60.28
70.20
60.10
10.10
90.05
00.08
30.15
80.01
60.17
70.08
90.01
4—
0.00
00.00
00.50
40.66
50.88
40.81
50.98
40.49
40.90
50.94
00.97
6
N.Dunkirk,
NY,L.Erie
0.25
50.33
70.24
50.11
80.13
80.08
90.11
60.17
40.04
90.19
80.09
80.05
20.06
0—
0.05
00.48
30.63
30.87
50.78
70.98
40.45
40.90
40.94
81.00
0
O.Roch
ester,
NY,L.Ontario
0.24
40.35
30.21
30.11
60.17
70.11
00.12
80.09
30.12
20.22
70.18
40.12
50.12
10.14
7—
0.39
60.53
50.79
90.69
80.97
60.36
70.81
90.90
90.98
1
P.Burlington,
VT,L.Cham
plain
0.24
70.28
50.17
50.20
80.23
70.19
30.19
60.27
80.22
70.23
90.29
70.24
80.23
00.28
40.24
6—
0.36
20.51
30.70
10.91
70.33
20.37
30.36
30.25
0
Q.Seb
asticookR.,ME
0.33
70.39
50.26
30.29
80.32
60.27
70.28
80.35
60.31
80.36
20.38
60.34
30.33
00.36
20.32
80.21
1—
0.00
20.66
90.88
10.23
80.00
00.37
40.30
5
R.St.JohnsR.,ME
0.30
10.36
90.21
20.24
00.31
00.22
80.23
50.31
50.26
50.30
70.34
10.28
10.27
90.32
00.26
80.23
70.17
3—
0.70
20.92
80.21
40.00
00.52
60.47
9
S.HudsonR.,NY
0.22
80.28
80.15
00.12
00.17
10.10
20.12
10.20
90.12
40.19
70.18
70.13
40.12
00.17
70.13
00.14
80.25
10.19
3—
0.70
50.29
40.63
10.74
20.64
6
T.Bush
R.,
Chesap
eakeBay
,MD
0.26
80.29
60.18
60.22
10.25
90.21
30.21
10.26
80.26
00.31
00.32
00.28
70.27
50.31
20.23
20.20
70.19
50.18
10.19
0—
0.60
00.93
50.95
80.96
3
U.Scu
ppernongR.,
Albem
arle
S.,NC
0.31
20.35
00.22
50.27
40.31
20.26
00.26
10.32
60.30
50.35
90.37
40.33
60.32
20.35
60.30
40.25
30.23
30.22
80.23
40.11
2—
0.13
70.29
80.19
0
V.Morgan
Ck.,
Cap
eFear,NC
0.24
90.36
20.16
60.22
40.29
50.22
00.20
80.30
80.28
30.39
30.39
40.32
50.31
00.35
20.29
00.24
00.26
00.25
00.20
50.15
90.16
8—
0.34
50.21
3
W.Chattahooch
ee
R.,GulfCoast,GA
0.34
80.43
60.28
80.31
20.36
70.30
10.30
80.37
30.35
30.40
50.43
70.38
00.37
60.39
20.36
00.31
00.29
70.31
40.31
60.23
90.29
50.31
1—
0.00
0
X.Apalachicola
R.,
GulfCoast,FL
0.36
70.43
40.31
30.32
40.38
90.30
90.30
50.37
70.36
70.40
40.47
20.39
70.39
00.43
30.34
80.32
10.36
50.35
80.33
00.26
50.34
20.36
70.39
3—
Reg
ulartext=notsignificant,underlined
=significantat
0.05
level,underlined
italics=remained
significantfollowingsequen
tial
Bonferronicorrection(Rice1989).Allcompari-
sonresu
ltswerecongruen
twithexacttestsofdifferentiation(G
oudet
etal.1996).
© 2012 Blackwell Publishing Ltd
WATERSCAPE GENETICS OF YELLOW PERCH 27
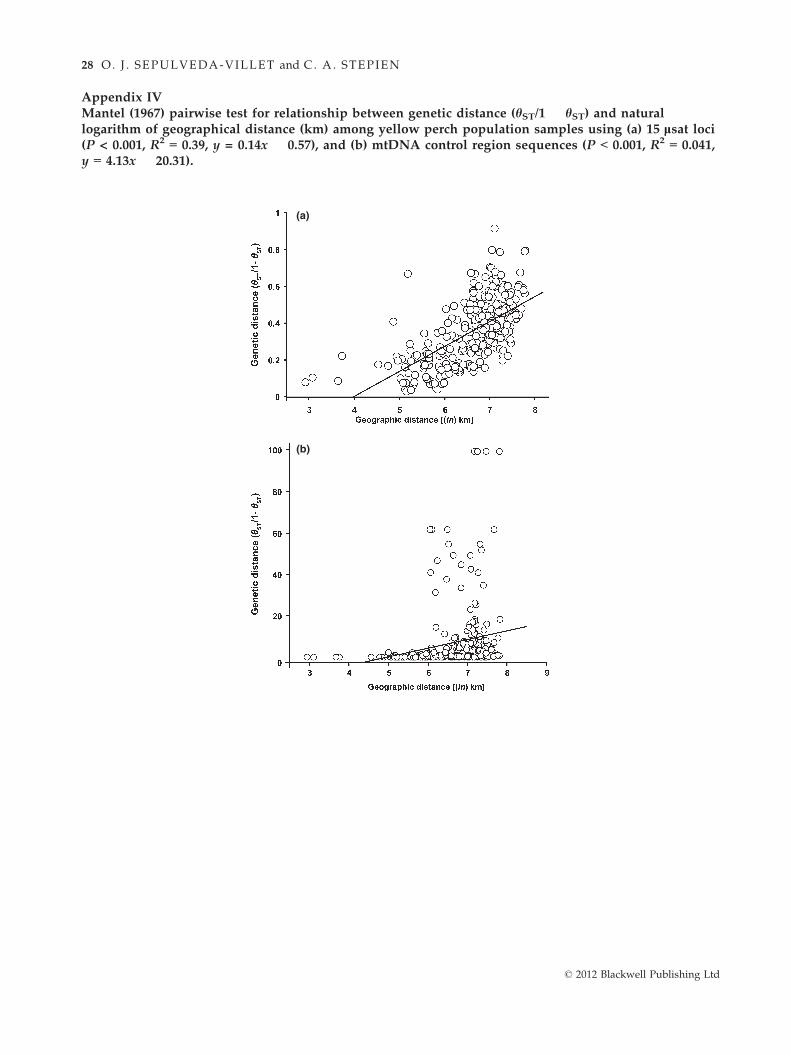
Appendix IVMantel (1967) pairwise test for relationship between genetic distance (hST/1 � hST) and naturallogarithm of geographical distance (km) among yellow perch population samples using (a) 15 lsat loci(P < 0.001, R2 = 0.39, y = 0.14x � 0.57), and (b) mtDNA control region sequences (P < 0.001, R2 = 0.041,y = 4.13x � 20.31).
(a)
(b)
© 2012 Blackwell Publishing Ltd
28 O. J . SEPULVEDA-VILLET and C. A. STEPIEN
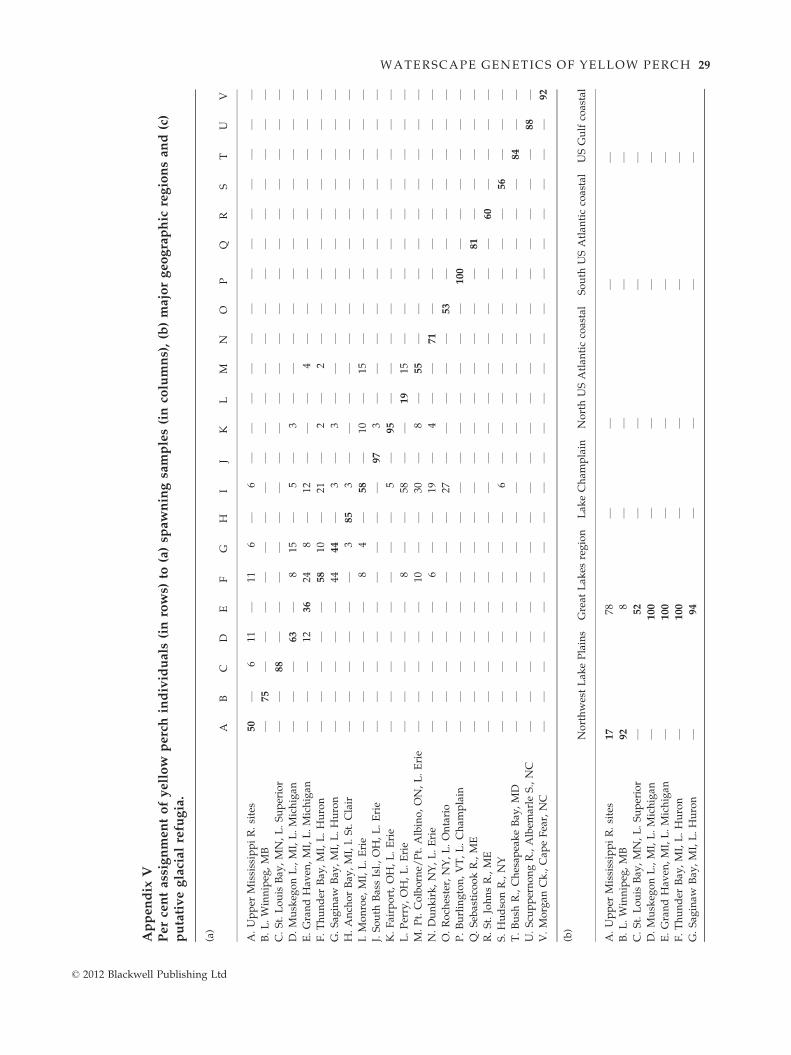
Appendix
VPercentassignmentofyellow
perchindividuals
(inrows)
to(a)sp
awningsamples(incolumns),(b)majorgeographic
regionsand(c)
putativeglacialrefugia.
(a)
AB
CD
EF
GH
IJ
KL
MN
OP
QR
ST
UV
A.Upper
MississippiR.sites
50
—6
11—
116
—6
——
——
——
——
——
——
—B.L.Winnipeg
,MB
—75
——
——
——
——
——
——
——
——
——
——
C.St.Louis
Bay
,MN,L.Superior
——
88
——
——
——
——
——
——
——
——
——
—D.Muskeg
onL.,MI,L.Michigan
——
—63
—8
15—
5—
3—
——
——
——
——
——
E.GrandHav
en,MI,L.Michigan
——
—12
36
248
—12
——
—4
——
——
——
——
—F.Thunder
Bay
,MI,L.Huron
——
——
—58
10—
21—
2—
2—
——
——
——
——
G.Sag
inaw
Bay
,MI,L.Huron
——
——
—44
44
—3
—3
——
——
——
——
——
—H.Anch
orBay
,MI,l.St.Clair
——
——
——
385
3—
——
——
——
——
——
——
I.Monroe,
MI,L.Erie
——
——
—8
4—
58
—10
—15
——
——
——
——
—J.South
BassIsl.,OH,L.Erie
——
——
——
——
—97
3—
——
——
——
——
——
K.Fairport,OH,L.Erie
——
——
——
——
5—
95
——
——
——
——
——
—L.Perry,OH,L.Erie
——
——
—8
——
58—
—19
15—
——
——
——
——
M.Pt.Colborne/
Pt.Albino,ON,L.Erie
——
——
—10
——
30—
8—
55
——
——
——
——
—N.Dunkirk,NY,L.Erie
——
——
—6
——
19—
4—
—71
——
——
——
——
O.Roch
ester,NY,L.Ontario
——
——
——
——
27—
——
——
53
——
——
——
—P.Burlington,VT,L.Cham
plain
——
——
——
——
——
——
——
—100
——
——
——
Q.Seb
asticookR.,ME
——
——
——
——
——
——
——
——
81
——
——
—R.St.JohnsR.,ME
——
——
——
——
——
——
——
——
—60
——
——
S.HudsonR.,NY
——
——
——
——
6—
——
——
——
——
56
——
—T.Bush
R.,Chesap
eakeBay
,MD
——
——
——
——
——
——
——
——
——
—84
——
U.Scu
ppernongR.,Albem
arle
S.,NC
——
——
——
——
——
——
——
——
——
——
88
—V.Morgan
Ck.,Cap
eFear,NC
——
——
——
——
——
——
——
——
——
——
—92
(b)
NorthwestLak
ePlains
Great
Lak
esregion
Lak
eCham
plain
NorthUSAtlan
ticcoastal
South
USAtlan
ticcoastal
USGulfcoastal
A.Upper
MississippiR.sites
17
78—
——
—B.L.Winnipeg
,MB
92
8—
——
—
C.St.Louis
Bay
,MN,L.Superior
—52
——
——
D.Muskeg
onL.,MI,L.Michigan
—100
——
——
E.GrandHav
en,MI,L.Michigan
—100
——
——
F.Thunder
Bay
,MI,L.Huron
—100
——
——
G.Sag
inaw
Bay
,MI,L.Huron
—94
——
——
© 2012 Blackwell Publishing Ltd
WATERSCAPE GENETICS OF YELLOW PERCH 29
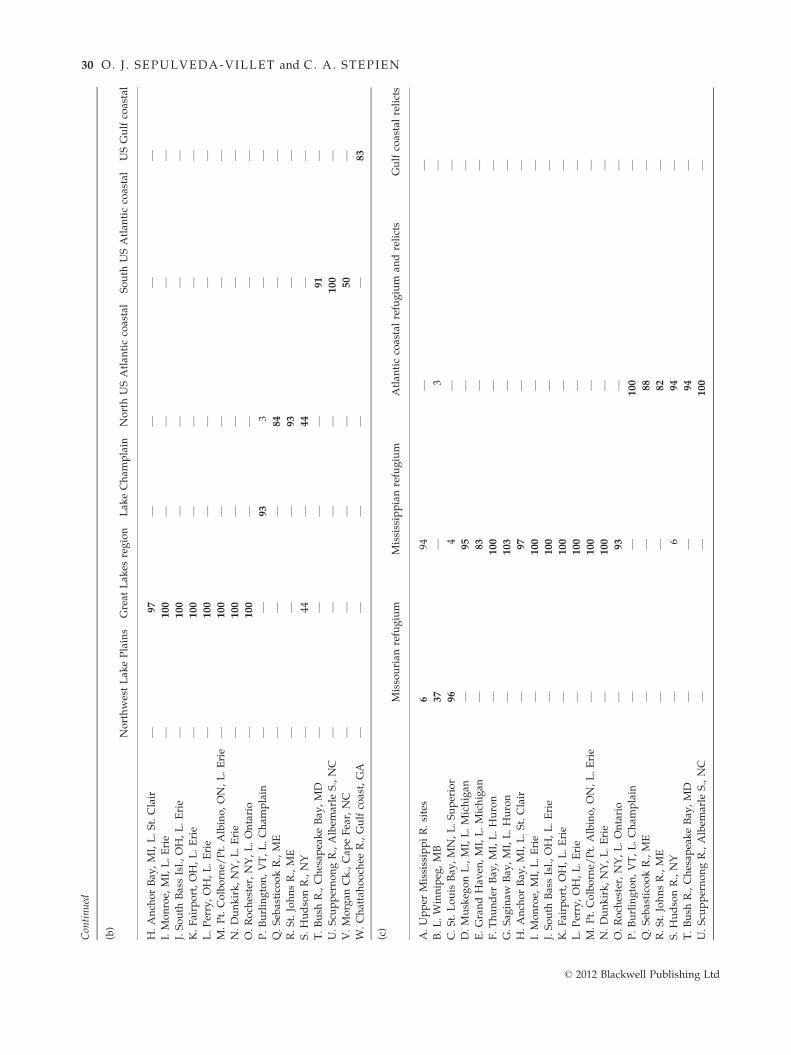
Continued
(b)
NorthwestLak
ePlains
Great
Lak
esregion
Lak
eCham
plain
NorthUSAtlan
ticcoastal
South
USAtlan
ticcoastal
USGulfcoastal
H.Anch
orBay
,MI,L.St.Clair
—97
——
——
I.Monroe,
MI,L.Erie
—100
——
——
J.South
BassIsl.,OH,L.Erie
—100
——
——
K.Fairport,OH,L.Erie
—100
——
——
L.Perry,OH,L.Erie
—100
——
——
M.Pt.Colborne/
Pt.Albino,ON,L.Erie
—100
——
——
N.Dunkirk,NY,L.Erie
—100
——
——
O.Roch
ester,NY,L.Ontario
—100
——
——
P.Burlington,VT,L.Cham
plain
——
93
3—
—Q.Seb
asticookR.,ME
——
—84
——
R.St.JohnsR.,ME
——
—93
——
S.HudsonR.,NY
—44
—44
——
T.Bush
R.,Chesap
eakeBay
,MD
——
——
91
—U.Scu
ppernongR.,Albem
arle
S.,NC
——
——
100
—
V.Morgan
Ck.,Cap
eFear,NC
——
——
50
—W.Chattahooch
eeR.,Gulfcoast,GA
——
——
—83
(c)
Missourian
refugium
Mississippianrefugium
Atlan
ticcoastalrefugium
andrelicts
Gulfcoastalrelicts
A.Upper
MississippiR.sites
694
——
B.L.Winnipeg
,MB
37
—3
—
C.St.Louis
Bay
,MN,L.Superior
96
4—
—D.Muskeg
onL.,MI,L.Michigan
—95
——
E.GrandHav
en,MI,L.Michigan
—83
——
F.Thunder
Bay
,MI,L.Huron
—100
——
G.Sag
inaw
Bay
,MI,L.Huron
—103
——
H.Anch
orBay
,MI,L.St.Clair
—97
——
I.Monroe,
MI,L.Erie
—100
——
J.South
BassIsl.,OH,L.Erie
—100
——
K.Fairport,OH,L.Erie
—100
——
L.Perry,OH,L.Erie
—100
——
M.Pt.Colborne/
Pt.Albino,ON,L.Erie
—100
——
N.Dunkirk,NY,L.Erie
—100
——
O.Roch
ester,NY,L.Ontario
—93
——
P.Burlington,VT,L.Cham
plain
——
100
—
Q.Seb
asticookR.,ME
——
88
—R.St.JohnsR.,ME
——
82
—
S.HudsonR.,NY
—6
94
—T.Bush
R.,Chesap
eakeBay
,MD
——
94
—
U.Scu
ppernongR.,Albem
arle
S.,NC
——
100
—
© 2012 Blackwell Publishing Ltd
30 O. J . SEPULVEDA-VILLET and C. A. STEPIEN
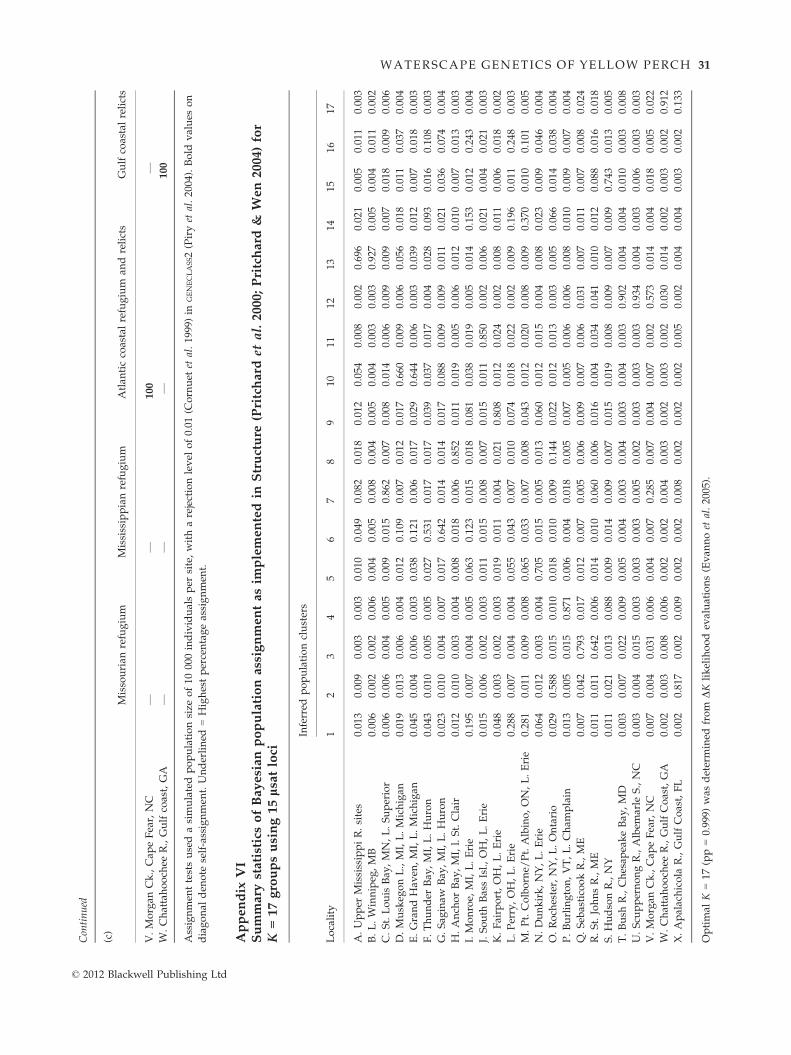
Continued
(c)
Missourian
refugium
Mississippianrefugium
Atlan
ticcoastalrefugium
andrelicts
Gulfcoastalrelicts
V.Morgan
Ck.,Cap
eFear,NC
——
100
—
W.Chattahooch
eeR.,Gulfcoast,GA
——
—100
Assignmen
ttestsusedasimulatedpopulationsize
of10
000individualsper
site,witharejectionlevel
of0.01
(Cornuet
etal.1999)in
GENECLASS2(Piryet
al.2004).Bold
values
on
diagonal
den
ote
self-assignmen
t.Underlined
=Highestpercentageassignmen
t.
Appendix
VI
Summary
statisticsofBayesianpopulationassignmentasim
plementedin
Structure
(Pritchard
etal.2000;Pritchard
&Wen2004)for
K=17groupsusing15lsatloci
Locality
Inferred
populationclusters
12
34
56
78
910
1112
1314
1516
17
A.Upper
MississippiR.sites
0.013
0.009
0.003
0.003
0.010
0.049
0.082
0.018
0.012
0.054
0.008
0.002
0.696
0.021
0.005
0.011
0.003
B.L.Winnipeg
,MB
0.006
0.002
0.002
0.006
0.004
0.005
0.008
0.004
0.005
0.004
0.003
0.003
0.927
0.005
0.004
0.011
0.002
C.St.Louis
Bay
,MN,L.Superior
0.006
0.006
0.004
0.005
0.009
0.015
0.862
0.007
0.008
0.014
0.006
0.009
0.009
0.007
0.018
0.009
0.006
D.Muskeg
onL.,MI,L.Michigan
0.019
0.013
0.006
0.004
0.012
0.109
0.007
0.012
0.017
0.660
0.009
0.006
0.056
0.018
0.011
0.037
0.004
E.GrandHav
en,MI,L.Michigan
0.045
0.004
0.006
0.003
0.038
0.121
0.006
0.017
0.029
0.644
0.006
0.003
0.039
0.012
0.007
0.018
0.003
F.Thunder
Bay
,MI,L.Huron
0.043
0.010
0.005
0.005
0.027
0.531
0.017
0.017
0.039
0.037
0.017
0.004
0.028
0.093
0.016
0.108
0.003
G.Sag
inaw
Bay
,MI,L.Huron
0.023
0.010
0.004
0.007
0.017
0.642
0.014
0.014
0.017
0.088
0.009
0.009
0.011
0.021
0.036
0.074
0.004
H.Anch
orBay
,MI,l.St.Clair
0.012
0.010
0.003
0.004
0.008
0.018
0.006
0.852
0.011
0.019
0.005
0.006
0.012
0.010
0.007
0.013
0.003
I.Monroe,
MI,L.Erie
0.195
0.007
0.004
0.005
0.063
0.123
0.015
0.018
0.081
0.038
0.019
0.005
0.014
0.153
0.012
0.243
0.004
J.South
BassIsl.,OH,L.Erie
0.015
0.006
0.002
0.003
0.011
0.015
0.008
0.007
0.015
0.011
0.850
0.002
0.006
0.021
0.004
0.021
0.003
K.Fairport,OH,L.Erie
0.048
0.003
0.002
0.003
0.019
0.011
0.004
0.021
0.808
0.012
0.024
0.002
0.008
0.011
0.006
0.018
0.002
L.Perry,OH,L.Erie
0.288
0.007
0.004
0.004
0.055
0.043
0.007
0.010
0.074
0.018
0.022
0.002
0.009
0.196
0.011
0.248
0.003
M.Pt.Colborne/
Pt.Albino,ON,L.Erie
0.281
0.011
0.009
0.008
0.065
0.033
0.007
0.008
0.043
0.012
0.020
0.008
0.009
0.370
0.010
0.101
0.005
N.Dunkirk,NY,L.Erie
0.064
0.012
0.003
0.004
0.705
0.015
0.005
0.013
0.060
0.012
0.015
0.004
0.008
0.023
0.009
0.046
0.004
O.Roch
ester,NY,L.Ontario
0.029
0.588
0.015
0.010
0.018
0.010
0.009
0.144
0.022
0.012
0.013
0.003
0.005
0.066
0.014
0.038
0.004
P.Burlington,VT,L.Cham
plain
0.013
0.005
0.015
0.871
0.006
0.004
0.018
0.005
0.007
0.005
0.006
0.006
0.008
0.010
0.009
0.007
0.004
Q.Seb
asticookR.,ME
0.007
0.042
0.793
0.017
0.012
0.007
0.005
0.006
0.009
0.007
0.006
0.031
0.007
0.011
0.007
0.008
0.024
R.St.JohnsR.,ME
0.011
0.011
0.642
0.006
0.014
0.010
0.060
0.006
0.016
0.004
0.034
0.041
0.010
0.012
0.088
0.016
0.018
S.HudsonR.,NY
0.011
0.021
0.013
0.088
0.009
0.014
0.009
0.007
0.015
0.019
0.008
0.009
0.007
0.009
0.743
0.013
0.005
T.Bush
R.,Chesap
eakeBay
,MD
0.003
0.007
0.022
0.009
0.005
0.004
0.003
0.004
0.003
0.004
0.003
0.902
0.004
0.004
0.010
0.003
0.008
U.Scu
ppernongR.,Albem
arle
S.,NC
0.003
0.004
0.015
0.003
0.003
0.003
0.005
0.002
0.003
0.003
0.003
0.934
0.004
0.003
0.006
0.003
0.003
V.Morgan
Ck.,Cap
eFear,NC
0.007
0.004
0.031
0.006
0.004
0.007
0.285
0.007
0.004
0.007
0.002
0.573
0.014
0.004
0.018
0.005
0.022
W.Chattahooch
eeR.,GulfCoast,GA
0.002
0.003
0.008
0.006
0.002
0.002
0.004
0.003
0.002
0.003
0.002
0.030
0.014
0.002
0.003
0.002
0.912
X.Apalachicola
R.,GulfCoast,FL
0.002
0.817
0.002
0.009
0.002
0.002
0.008
0.002
0.002
0.002
0.005
0.002
0.004
0.004
0.003
0.002
0.133
Optimal
K=17
(pp=0.999)
was
determined
from
DKlikelihoodev
aluations(Evan
noet
al.2005).
© 2012 Blackwell Publishing Ltd
WATERSCAPE GENETICS OF YELLOW PERCH 31
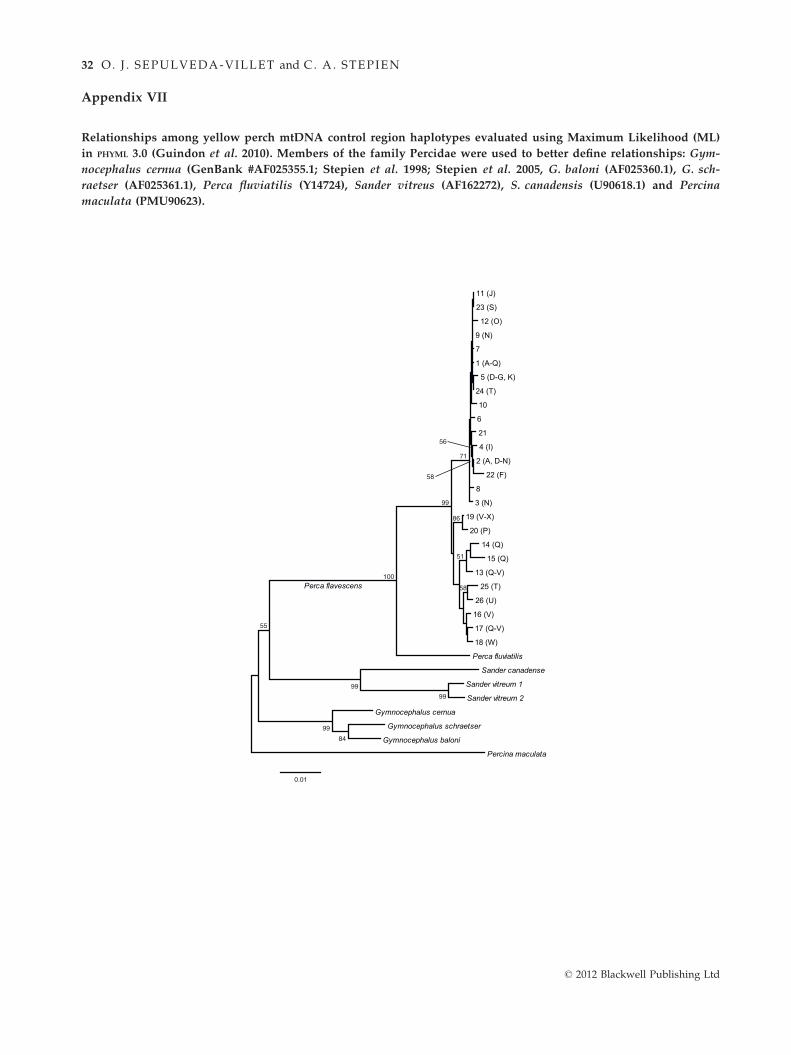
Appendix VII
Relationships among yellow perch mtDNA control region haplotypes evaluated using Maximum Likelihood (ML)
in PHYML 3.0 (Guindon et al. 2010). Members of the family Percidae were used to better define relationships: Gym-
nocephalus cernua (GenBank #AF025355.1; Stepien et al. 1998; Stepien et al. 2005, G. baloni (AF025360.1), G. sch-
raetser (AF025361.1), Perca fluviatilis (Y14724), Sander vitreus (AF162272), S. canadensis (U90618.1) and Percina
maculata (PMU90623).
11 (J)
23 (S)
12 (O)
9 (N)
7
1 (A-Q)
5 (D-G, K)
24 (T)
10
6
21
4 (I)
2 (A, D-N)
22 (F)
8
3 (N)
19 (V-X)
20 (P)
14 (Q)
15 (Q)
13 (Q-V)
25 (T)
26 (U)
16 (V)
17 (Q-V)
18 (W)
Perca fluviatilis
Sander canadense
Sander vitreum 1
Sander vitreum 2
Gymnocephalus cernua
Gymnocephalus schraetser
Gymnocephalus baloni
Percina maculata
Perca flavescens
56
71
58
99
86
51
58
100
55
99
99
99
84
0.01
© 2012 Blackwell Publishing Ltd
32 O. J . SEPULVEDA-VILLET and C. A. STEPIEN
Copyright © 2022 FDOKUMEN