Structurally complete superintuitionisic logics and primitive varieties of pseud-Boolean algebras
Upload
independentCategory
view
0download
0
Conventional tagging and acoustic telemetry of a smallsurgeonfish, Zebrasoma flavescens, in a structurally complexcoral reef environment
Jeremy T. Claisse & Timothy B. Clark & Brett D. Schumacher & Sarah A. McTee &
Megan E. Bushnell & Chatham K. Callan & Charles W. Laidley & James D. Parrish
Received: 25 May 2010 /Accepted: 3 February 2011 /Published online: 3 March 2011# Springer Science+Business Media B.V. 2011
Abstract Passive acoustic telemetry and conventionaltag/re-sight techniques were used to study daily move-ment patterns of adult yellow tang, Zebrasoma flaves-cens, over a period of months. Range testing and visualobservations revealed the limitations of using smallacoustic transmitters to monitor movements of smallcoral reef fish in a topographically complex and noisycoral reef environment. Visual observations of conven-tionally tagged and albino fish suggest individualsreturn each day to forage over the same few hundredm2 of shallow, turf algae dominated boulder and reef flathabitat for periods of at least weeks to months. Acoustictelemetry data suggest lower frequency of repeated useof daytime foraging, nighttime refuge and sunsetspawning sites. However, integration of observation
and acoustic telemetry data revealed that many fish werenot detected while they were within the empiricallytested range of the receivers. These observationsindicate that data from passive acoustic telemetry canunderestimate the frequency and duration of repeateduse of specific areas. Yellow tang adults made dailycrepuscular migrations of up to 600 m between foragingand spawning or sheltering sites at consistent timesrelative to sunset and sunrise. While there was highindividual variability in migration distance, almost allindividuals moved in the same direction (from south tonorth) at sunset. This study provided valuable informa-tion for evaluating ongoing fishery management effortsusing marine protected areas in Hawaii.
Keywords Acanthuridae . Aquarium fishery . Fishmovements . Home range . Site fidelity . Yellow tang
Introduction
Studies of habitat use and movement patterns of fishfrequently employ direct visual observation, conven-tional tags (e.g. elastomer, T-bar tags), acoustictransmitters, or a combination of these tools to gatherdata (Frederick 1997; Chapman and Kramer 2000;Eklund and Schull 2001; Meyer and Holland 2005;Heupel et al. 2006; Meyer et al. 2010). Each methodoffers a different perspective, level of detail, durationand intensity of observation of tagged specimens.Though direct observation and innovative conven-
Environ Biol Fish (2011) 91:185–201DOI 10.1007/s10641-011-9771-9
J. T. Claisse : T. B. Clark :B. D. Schumacher :S. A. McTee :M. E. Bushnell : J. D. ParrishHawaii Cooperative Fishery Research Unit,Department of Zoology, University of Hawaii,2538 The Mall, Edm 165,Honolulu, HI 96822, USA
C. K. Callan : C. W. LaidleyFinfish Department, Oceanic Institute,Makapuu Point, 41-202 Kalanianaole Highway,Waimanalo, HI 96795, USA
Present Address:J. T. Claisse (*)Vantuna Research Group, Occidental College,1600 Campus Road,Los Angeles, CA 90041, USAe-mail: [email protected]
tional tagging techniques have allowed for studies ofa large size range of specimens, physical andtechnological constraints have limited the suite ofreef fish species that could be studied using acoustictelemetry. The recent development of small trans-mitters such as the V7 transmitter (7×20 mm, 0.75 gin water) produced by Vemco™ has now made itpossible to use acoustic telemetry to study species thatwere previously too small to carry a transmitter.
In Hawaii, the rise of the aquarium trade broughtspecies into prominence whose economic weightstands in stark contrast to their relatively diminutivebody size. One small yet economically importantspecies is the yellow tang, Zebrasoma flavescens.This Acanthurid comprises 63% by number and 60%by value of the aquarium catch in the State (Friedlanderet al. 2008), with annual catches ranging from 200 000to more than 400 000 individuals over the last decade(Williams et al. 2009). The vast majority of yellowtang caught in the State of Hawaii for the liveaquarium trade are taken on the west coast of theIsland of Hawaii (hereafter “West Hawaii”) (Fried-lander et al. 2008); accordingly the study site for thepresent investigation was located on this coast.
Previous studies of yellow tang using directobservation of untagged individuals found that theyexhibit an ontogenetic pattern of habitat use in WestHawaii (Walsh 1984; Ortiz and Tissot 2008; Claisse etal. 2009). Post-larval yellow tang settle to mid-depth(10 to 25 m) reef habitats that tend to have high coralcover (Walsh 1984; Ortiz and Tissot 2008). Adultyellow tang (AYT) transition at around 13 to 15 cmtotal length (TL) (Claisse et al. 2009) to spendingtheir days foraging in shallower (<10 m) turf-algaedominated boulder and reef flat habitats, whilesheltering at night in deeper habitats (Walsh 1984;Ortiz and Tissot 2008). AYT reproductive effort peaksfrom March to July, although reproductive output andspawning behaviors, observed during the eveningcrepuscular period, appear to occur at some levelthroughout the year (Walsh 1984; Lobel 1989;Bushnell et al. 2010).
The present study used a combination of passiveacoustic telemetry and re-sighting conventionally T-bar tagged and untagged but individually identifiable(due to partial albinism) AYT to provide a detaileddescription and quantification of daily movementpatterns at different scales and intensities over aperiod of weeks to months. The study was conducted
at a site known as Wawaloli in West Hawaii (Fig. 1).Yellow tang are protected from aquarium fishing atthis site, which decreased the likelihood of fishermaninteracting with tagged fish and tracking equipment.Conventional tags were used to quantify the scale andpattern of movements relative to multiple daytimeforaging areas and an area AYT were previouslyobserved aggregating daily to spawn at sunset. Basedon result from the conventional tagging, a passiveacoustic telemetry array was deployed to studymovement patterns of AYT affixed with acoustictransmitters on a finer temporal and spatial scale.
Materials and methods
Conventional T-bar tagging
During the summer of 2005, T-bar tags wereemployed to investigate the scale of migrationdistances between AYT daytime feeding areas and alarge sunset spawning aggregation area (S1, Fig. 1).During the hour before sunset from 7 June 2005 to 15June 2005, AYT were captured using a fine meshbarrier net at a large sunset aggregation area (S1,Fig. 1). Fish were measured to the nearest mm (TL),tagged with a T-bar tag, and then released at the capturesite. Beginning 1 week after tagging was completed,snorkel surveys were conducted to locate tagged fishduring the daytime. During each survey the locationwhere tagged fish were observed was recorded using ahandheld GPS. The survey method did not permitidentification of tagged individuals. Surveys covered2 km of reef along the coastline centered on the taggingsite (Fig. 1) and were completed within a 2 hr periodbetween 8:00 and 17:00. Each surveywas conducted bya pair of snorkelers, one positioned about 20 m offshorefrom the other, who each surveyed a swath roughly 20mwide. They swam parallel to shore, following thecontour of the reef flat in one direction, returning alonga non-overlapping path farther offshore. While thetransect path varied among surveys, the same stretchof coastline and the majority of reef down to ∼20 mdepth was covered on each survey.
In the summer of 2006, group fidelity to daytimeforaging areas was investigated by T-bar tagging setsof AYT during the day (between 13:30 and 15:30) atsites within the daytime foraging habitat. From 13June 2006 to 15 June 2006, AYT were captured and
186 Environ Biol Fish (2011) 91:185–201

tagged at each of three shallow locations in boulderhabitats on the edge of the reef flat (d1, d2, d3 Fig. 1).A different color tag was used for each location, andthe tag was placed on the right side for males and leftside for females. It was discovered during theprevious field season (Bushnell et al. 2010) that sex
could be identified externally by close examination ofthe urogenital opening of a captured fish. Daytimesnorkel surveys were then conducted following thesame survey protocol as during 2005.
During the course of this project, three partialalbino AYT that could be individually identified were
-156 -155.5 -155
1919
.520
Island of
Hawaii
Wawaloli
Longitude
-156.05 -156.048
19.6
9619
.698
19.7
19.7
0219
.704
a2
d1
a1
a3
d2
d3
100m
0
5102025
15
-156.05 -156.048
19.6
9619
.698
19.7
19.7
0219
.704
Latit
ude
100m
0
5102025
15
2006 - 2007*
2005 2006
-156.05 -156.049
19.6
9719
.698
19.6
9919
.7
05
10
20
25 15
100m
1
2*
3
4*
5*6
7* 8 9*
10*
11
12
13*
14 1516
18*17*
19
20
S1
S1S1
S2
S2S2
Fig. 1 Location of Wawaloli study site on Hawaii Island.Locations of a larger (S1) and smaller (S2) sunset spawningaggregation are indicated. Isobaths are given in m. 2005 map:Daytime locations (black open circles) of yellow tang T-bartagged during sunset at the larger yellow circle. Surveysextended 1 km in each direction along the coastline from thetagging site, beyond the range of this figure. 2006 map:Daytime locations of 3 individually identifiable adult yellowtang albinos (a1 – pink circles, a2 – white circles, a3 – black
circles) and of yellow tang conventionally T-bar tagged duringthe daytime at the location of the nearest yellow circle (d1-green, d2 – blue, d3 - red). 2006–2007 map: Numberedlocations of the 11 and 20 acoustic receivers in the 2006 and2007 arrays respectively. * denotes those receivers added in2007. Symbols for each receiver are according to bottom depth(15 to 20 m—open circles, 10 to 15 m - triangles, 5 to 10 m –solid circles) with depth-specific maximum detection ranges(grey dotted lines: 50 m, 40 m, 30 m respectively)
Environ Biol Fish (2011) 91:185–201 187

found in the survey area. The daytime habitat areaused by each albino was examined by recording thelocations of these fish during the previously describeddaytime surveys and during surveys performedopportunistically throughout the 2.5 year duration ofthe project. Individual minimum convex polygon(MCP) areas were estimated around the locations ofthese fish. All maps, distance measurements and MCParea estimates were produced using the PBSmappingpackage in R (R_Development_Core_Team 2009).Bathymetry was adapted from Ortiz and Tissot(2008).
Acoustic telemetry
Range testing
Range testing of the Vemco™ acoustic receiver arrayand Vemco™ V7-2L-R256 acoustic transmitters wasconducted at Wawaloli during June 2006 and May2007 between 10:00 and 19:00. Range tests wereconducted on receivers moored in shallow (5 to10 m), medium (10 to 15 m) and deep (15–20 m)depths. Receivers had minimal biofouling at the timeof testing. Habitat complexity tended to transitionfrom complex boulder habitat in shallow depths torelatively lower relief, higher coral cover bottom, atdeeper sites. In 2006 we conducted range tests in fiveshallow and four deep locations. In 2007 weconducted tests in five mid-depth locations and onedeep location. During each test, transmitters wereplaced along a transect line parallel to shore at 10 mintervals from the receiver out to 50 m (five trans-mitters total). Transmitters were placed in a fine meshbag and suspended on a nylon line 1.5 m off thebottom, although this height likely varied somewhatduring tests due to surge. Transmitters were left inplace for 45 min before the transect was repositioned90° clockwise. This was repeated three times for atotal of 3 h of sampling time during each range test.The number of detections from each distance waspooled across all four transects during each test.
Transmitters produced signals at a randominterval between 60 and 180 s in 2006 (mean 30signals/hr), and between 40 and 120 s in 2007(mean 45 signals/hr). Therefore, the number ofdetections per test during 2007 was scaled using afactor of 0.66, to make results between years morecomparable.
Passive acoustic tracking
Passive acoustic tracking was used to study movementpatterns over a fixed area of reef, including anexamination of repeated use of daytime, nighttime andsunset locations by individual fish. From June throughDecember of 2006 an array of 11 Vemco™ (4 VR1 and7 VR2) passive acoustic receivers was deployed in reefhabitats at 5 to 20 m depth along 0.5 km of coastline atWawaloli (Fig. 1). Receivers were suspended 2 to 3 mabove the seafloor to maximize effective detectionrange in the rugose reef and boulder environments.Results from the 2005 conventional tagging effort werecombined with 2006 range testing results to determinethe scale over which to deploy the 11 availablereceivers in relation to the larger sunset spawning areaat the study site (Fig. 1). During a second deploymentfrom May through December of 2007, an additionalnine VR2 receivers were added to increase the densityof receivers within the array (Fig. 1).
In 2006 and 2007, AYT were captured nearreceivers during three specific diel periods: “day”(between 10:00 and 15:00), “sunset” (within 1 hrprior to sunset), and “night” (between 20:00 and22:00). Fish were captured during the day and sunsetby herding into a fine-mesh barrier net. At night, ahand net was used to capture fish after disorientingthem with a flashlight. After capture, each was affixedwith an acoustic transmitter (“acoustically tagged”)and released at the capture site.
Vemco™ acoustic transmitters (V7-2L-R256) wereexternally attached to AYT underwater to reducehandling stress and barotrauma. Transmitters wereattached to a 1 cm diameter plastic disc using epoxy,which was secured with stainless steel surgical wirethrough the dorsal musculature to another plastic disc onthe opposite side of the fish (see Claisse 2009 for moredetail). During a pilot study with fish held in tanks, noindividuals with internally implanted dummy trans-mitters (following the methods ofMeyer and Honebrink2005) survived more than 48 h, possibly due to thelimited gut cavity space given their laterally compressedmorphology and small body size. Sixty-six percent ofindividuals with the described external attachmentmethod survived the entire 6-month trial period andanother 17% survived at least 3 months (Claisse 2009).Swimming ability of both captive and wild fish did notappear to be affected by the external attachment oftransmitters. Methods conformed to the University of
188 Environ Biol Fish (2011) 91:185–201

Hawaii Animal Care & Use Committee vertebratehandling procedures under Protocol No. 03-054.
Transmitters were programmed to produce anacoustic signal at pseudorandom intervals between 60and 180 s in 2006 (manufacturer estimated battery lifeof 209 days) and between 40 and 120 s in 2007(manufactured estimated life of 146 days, programmedto stop after 150 days). The increase in signal rate in2007 was an attempt to increase the chance of detectionduring fish movements. Although the faster signal ratecould result in a higher incidence of overlapping (andtherefore indecipherable) signals, the Vemco™ Colli-sion Calculator (www.vemco.com) estimates that thiswould not decrease the expected detection rate unless13 or more transmitters are simultaneously in range ofa receiver, many more than would be expected in thepresent study.
Individual fish could be identified based on theside of the body and the colors of the plastic discswith which transmitters were attached. Visual obser-vations of acoustically tagged fish were recordedopportunistically throughout the study period and atthe time of receiver download to ground truthdetections (or lack thereof).
The location where an individual was detected mostoften during the “daytime” (7:00 to 17:00) or “night-time” (20:00 to 5:00) was designated as their “primarydaytime location” or “primary nighttime location,”respectively. These primary locations were usually thearea covered by detection range of a single receiver.However, with the increased density of receivers in the2007 array, a primary location was sometimes coveredby the overlapping detection range of two or threeadjacent receivers. Repeated use of these primarylocations was quantified in two ways. First, wecalculated the percentage of days a fish was detectedin either its primary daytime or nighttime locationduring its “total duration” detected (the number of daysfrom tagging to the last detection). Quantifying affinityto a site based on this measure was based on theassumption that fish were likely to be detected whenwithin the receivers’ estimated detection range. Second,we focused on the hours when a fish had been detectedanywhere in the array during either the daytime ornighttime, and calculated the percentage of those totalhours that a fish was detected in its primary daytime ornighttime location.
To examine if fish tagged during a certain time of daywere subsequently detected more often during that diel
time period, we performed a paired t-test comparing thetotal detections during the diel time period when the fishwas tagged to total detections during all other timeperiods, scaling total detections to a per hour per timeperiod basis.
Observations of untagged AYT suggested thatmales may maintain temporary spawning territoriesduring the sunset crepuscular period (Walsh 1984). Inorder to see if individuals were consistently returning tothe same territory, the data for each individual wereexamined for multiple detections on single receiverswithin 1 h of sunset. Mean time spent in a primarysunset area was calculated by taking the mean of thetime from first to last detection of all days a fish wasdetected multiple times during sunset by a givenreceiver. The receivers on which a fish was most oftendetected during the daytime and nighttime were ignoredfor this analysis as it would not be possible to determinewhen the fish shifted from a daytime feeding tospawning behavior, or from a spawning to a nighttimesheltering behavior.
Results
Conventional T-bar tagging
In 2005, 126 AYTwere tagged at a sunset aggregationsite (Table 1). These fish were subsequently resightedover a stretch of approximately 800m of reef during fivedaytime snorkel surveys conducted during the 48 daysafter tagging. Fish were primarily found in shallow(<10 m depth) complex boulder habitat along the edgeof the reef flat. Almost all (97%) observations of taggedfish occurred to the south or just inshore of the tagging
Table 1 Number (n) of T-bar tagged yellow tang in 2005 and2006. 2005 fish were tagged at a sunset spawning aggregation(S1. Fig. 1) and 2006 fish were tagged at 3 daytime foragingareas (d1–d3, Fig. 1)
Tagging date 2005 2006
7–15 Jun 13 Jun 14 Jun 15 Jun
Location S1 d1 d2 d3
n 126 18 17 16
Male:female NA 9:9 5:12 8:8
TL range (mm) 132–200 143–196 143–191 138–185
Environ Biol Fish (2011) 91:185–201 189

location with a maximum distance of 572 m from thetagging location (Fig. 1, Table 2).
In 2006, a total of 51 AYT were tagged at threedifferent daytime feeding areas (Table 1). All fishwere re-sighted in close proximity to their originaldaytime tagging location during four subsequentdaytime surveys over the 20-day period betweentagging and the final survey (d1, d2, d3 Fig. 1;Table 2). Beyond this time period, additional surveyswere not possible because the tags became heavilybio-fouled and tag color (and hence original tagginglocation) could no longer be determined.
All three albino yellow tang were repeatedlyobserved near the location where each was originallysighted (Fig. 1). Albino a1 was located on 7 out of8 surveys over 279 days within a MCP area of 154 m2.Albino a2 was located on 7 out of 7 surveys over a40 days within a MCP area 274 m2. Albino a3 waslocated on 9 out of 9 surveys over 287 days within aMCP area of 584 m2. Given the very limited numberof points used to calculate the MCPs, these measure-ments should only be viewed as rough estimates ofdaytime habitat use area.
Acoustic telemetry
Range testing
Testing revealed receivers have a limited detectionrange of V7 coded transmitters. Detection range wasgreater in deeper, less structurally complex habitats(Fig. 2). Receivers in shallow (5 to 10 m) areas had amaximum detection distance of 30 m, those in mid-depth areas (10 to 15 m) had a maximum detectiondistance of 40 m, and those in the deepest (15 to 20 m)areas had a maximum detection distance of 50 m.Although maximum detection distances are illustratedon the maps of the array, most detections came frommuch shorter distances (Fig. 2). For example, only onetransmission was detected from maximum detected
distance for the deep (50 m) and the shallow (30 m)receivers during the combined 15-hour testing period.Code collisions from five transmitters simulta-neously being in the water during range testingmay have reduced the total number of detections.However, assuming all transmitters were withinrange (which was not the case at all depths), theyall should have been detected at least once every6 min (Vemco™ Collision Calculator, Accessed 1Dec 2009, www.vemco.com).
Visual observations of acoustically tagged AYTindicated that fish within range of receivers were notalways detected, evenwell before the end of the nominalbattery life of the transmitters. During June and July2006 snorkel surveys, the six fish tagged during thedaytime near receiver 11, and the two tagged during thedaytime near receiver 15 (Table 3) were frequently
2005 2006
Tag location S1 S1 S1 S1 S1 S1 d1 d2 d3
Survey date 22 Jun 27 Jun 2 Jul 6 Jul 1 Aug all all all all
n observed 22 26 18 18 24 108 31 27 26
Distance (m) 96–538 17–572 84–539 63–535 49–487 17–572 4–40 3–14 2–26
Median (m) 181 214 214 166 186 192 16 8 10
Table 2 Number (n) of T-bar tagged yellow tang ob-served during individualdaytime surveys in 2005and all daytime surveyspooled in 2006. Distance =range of distances individu-als were observed from theoriginal tagging location
10 20 30 40 50
010
2030
4050
60
Distance (m)
Det
ectio
ns
Fig. 2 Mean number of detections (SE error bars) during rangetests with Vemco™V7-2L-R256 transmitters placed 10, 20, 30, 40,and 50 m from receivers moored in three depth categories: deep 15to 20 m (filled circles, solid line), mid-depth 10 to15 m (triangles,dashed line), shallow 5 to10 m (filled square, dotted line)
190 Environ Biol Fish (2011) 91:185–201
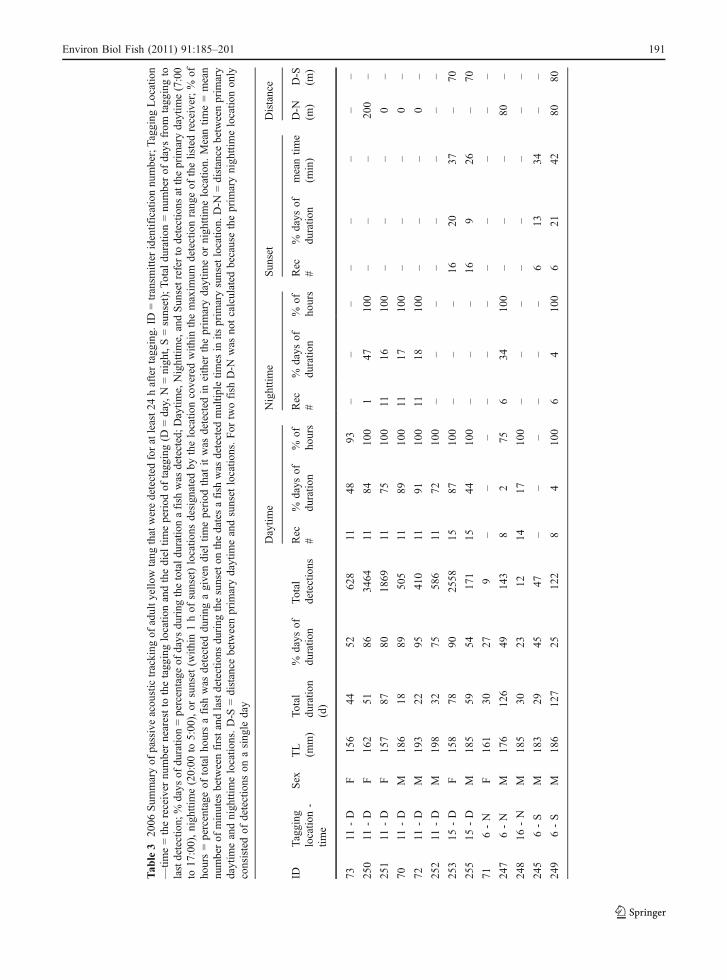
Tab
le3
2006
Sum
maryof
passiveacou
stictracking
ofadulty
ellowtang
thatweredetected
foratleast2
4haftertagg
ing.
ID=transm
itter
identificationnu
mber;Tagging
Location
—tim
e=thereceiver
numbernearestto
thetagg
inglocatio
nandthedieltim
eperiod
oftagg
ing(D
=day,N
=nigh
t,S=sunset);Total
duratio
n=nu
mberof
days
from
tagg
ingto
lastdetection;
%days
ofdu
ratio
n=percentage
ofdays
during
thetotald
urationafish
was
detected;D
aytim
e,Nighttim
e,andSun
setrefer
todetections
attheprim
arydaytim
e(7:00
to17
:00),nigh
ttime(20:00
to5:00
),or
sunset
(with
in1hof
sunset)locatio
nsdesign
ated
bythelocatio
ncoveredwith
inthemaxim
umdetectionrang
eof
thelistedreceiver;%
ofho
urs=percentage
oftotalho
ursafish
was
detected
during
agivendiel
timeperiod
that
itwas
detected
ineither
theprim
arydaytim
eor
nigh
ttimelocatio
n.Meantim
e=mean
numberof
minutes
betweenfirstandlastdetections
during
thesunseton
thedatesafish
was
detected
multip
letim
esin
itsprim
arysunsetlocatio
n.D-N
=distance
betweenprim
ary
daytim
eandnigh
ttimelocatio
ns.D-S
=distance
betweenprim
arydaytim
eandsunset
locatio
ns.For
twofish
D-N
was
notcalculated
becausetheprim
arynigh
ttimelocatio
non
lyconsistedof
detections
onasing
leday
Daytim
eNighttim
eSun
set
Distance
IDTagging
locatio
n-
time
Sex
TL
(mm)
Total
duratio
n(d)
%days
ofdu
ratio
nTotal
detections
Rec
#%
days
ofdu
ratio
n%
ofho
urs
Rec
#%
days
ofdu
ratio
n%
ofho
urs
Rec
#%
days
ofdu
ratio
nmeantim
e(m
in)
D-N
(m)
D-S
(m)
7311
-D
F15
644
5262
811
4893
––
––
––
––
250
11-D
F16
251
8634
6411
8410
01
4710
0–
––
200
–
251
11-D
F15
787
8018
6911
7510
011
1610
0–
––
0–
7011
-D
M18
618
8950
511
8910
011
1710
0–
––
0–
7211
-D
M19
322
9541
011
9110
011
1810
0–
––
0–
252
11-D
M19
832
7558
611
7210
0–
––
––
––
–
253
15-D
F15
878
9025
5815
8710
0–
––
1620
37–
70
255
15-D
M18
559
5417
115
4410
0–
––
169
26–
70
716-N
F16
130
279
––
––
––
––
––
–
247
6-N
M17
612
649
143
82
756
3410
0–
––
80–
248
16-N
M18
530
2312
1417
100
––
––
––
––
245
6-S
M18
329
4547
––
––
––
613
34–
–
249
6-S
M18
612
725
122
84
100
64
100
621
4280
80
Environ Biol Fish (2011) 91:185–201 191

observed <20 m from those receivers. Six out of 8 ofthese same individuals were again observed around thesame receivers in November. These individuals initiallyshowed a high frequency of acoustic detections at these
sites during the daytime (Fig. 3). However, all of theseindividuals were last acoustically detected between lateJune and early September. Similar acoustic detectionissues were found at a sunset spawning site. In July
15 Jun 02 Jul 18 Jul 04 Aug 22 Aug
253 F - D
0:00
6:00
12:00
18:00
15 Jun 28 Jun 11 Jul 23 Jul 05 Aug
255 M - D
0:00
6:00
12:00
18:00
13 Jun 24 Jun 05 Jul 15 Jul 25 Jul
250 F - D
0:00
6:00
12:00
18:00
13 Jun 18 Jun 23 Jun 28 Jun 03 Jul
72 M - D
0:00
6:00
12:00
18:00
13 Jun 17 Jun 21 Jun 25 Jun 29 Jun
70 M - D
0:00
6:00
12:00
18:00
13 Jun 02 Jul 20 Jul 08 Aug 28 Aug
251 F - D
0:00
6:00
12:00
18:00
02 Jul 28 Jul 24 Aug 22 Sep 21 Oct
249 M - S
0:00
6:00
12:00
18:00
05 Jul 30 Jul 26 Aug 24 Sep 22 Oct
247 M - N
0:00
6:00
12:00
18:00
02 Jul 08 Jul 14 Jul 20 Jul 26 Jul
245 M - S
0:00
6:00
12:00
18:00
Tim
e of
day
Date in 2006Date in 2006
0:00
6:00
12:00
18:00
03 Jul 09 Jul 15 Jul 21 Jul 27 Jul
248 M - N
-156.05 -156.049
19.6
9719
.698
19.6
9919
.7
Latit
ude
(°)
Longitude (°)
05
10
2025
15
100m
S2
S1
Fig. 3 2006 diel detection patterns of 10 acoustically taggedyellow tang. The transmitter number, sex, time of tagging (D,day; S, sunset; N, night) and symbol for the tagging location aregiven. Horizontal lines indicate time of sunset and sunrise. Notethat the temporal scale of the x-axis varies between plots,extending from the tagging date to the date of the last detection.The map displays the location of the 11 receivers in the 2006
array. Symbols for each receiver are according to bottom depth(15 to 20 m – open circles, 10 to 15 m - triangles, 5 to 10 m –solid circles) with depth-specific maximum detection ranges(grey dotted lines: 50 m, 40 m, 30 m respectively). Locations ofa larger (S1) and smaller (S2) sunset spawning aggregation areindicated. Isobaths are shown in m
192 Environ Biol Fish (2011) 91:185–201
2006 the two males tagged at receiver 6 at sunset(Table 3) were observed <20 m from the receiverfrom 18:20 to 18:45, maintaining small spawningterritories and courting passing females. Neitherfish was detected during the observation period bythat receiver. In November, just prior to sunset, thesame two individuals were observed again nearreceiver 6, displaying territorial and courtshipbehaviors. One was last detected by the receiver2 weeks prior, while the other was last detectedthere 3 months prior (Fig. 3).
Passive acoustic tracking
Twenty AYT were captured and acoustically taggedwithin 20 m of receivers from 13 June to 6 July 2006,and 33 more were tagged from 13 to 17 May 2007(Tables 3, 4). Sixty-five percent of the 2006 fish and88% of the 2007 fish were detected for more than 24 hafter release (Tables 3, 4), consistent with rates ofmortality experienced during trials of the externalattachment method (Claisse 2009). To control forpotentially aberrant behavior of moribund fish, subse-quent analysis is based only on fish detected for morethan 24 h.
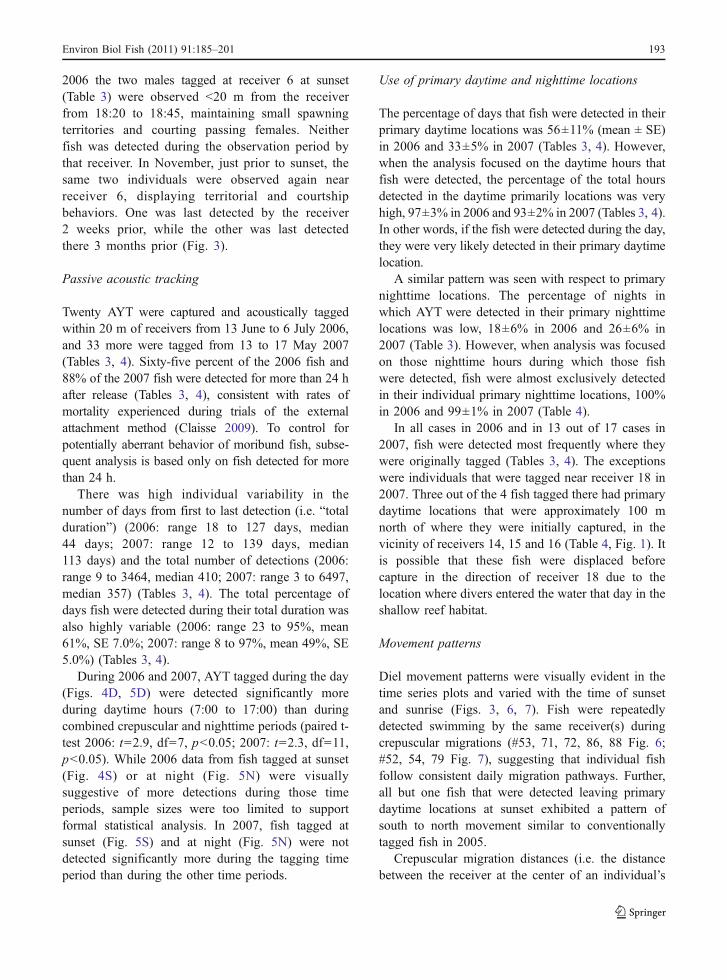
There was high individual variability in thenumber of days from first to last detection (i.e. “totalduration”) (2006: range 18 to 127 days, median44 days; 2007: range 12 to 139 days, median113 days) and the total number of detections (2006:range 9 to 3464, median 410; 2007: range 3 to 6497,median 357) (Tables 3, 4). The total percentage ofdays fish were detected during their total duration wasalso highly variable (2006: range 23 to 95%, mean61%, SE 7.0%; 2007: range 8 to 97%, mean 49%, SE5.0%) (Tables 3, 4).
During 2006 and 2007, AYT tagged during the day(Figs. 4D, 5D) were detected significantly moreduring daytime hours (7:00 to 17:00) than duringcombined crepuscular and nighttime periods (paired t-test 2006: t=2.9, df=7, p<0.05; 2007: t=2.3, df=11,p<0.05). While 2006 data from fish tagged at sunset(Fig. 4S) or at night (Fig. 5N) were visuallysuggestive of more detections during those timeperiods, sample sizes were too limited to supportformal statistical analysis. In 2007, fish tagged atsunset (Fig. 5S) and at night (Fig. 5N) were notdetected significantly more during the tagging timeperiod than during the other time periods.
Use of primary daytime and nighttime locations
The percentage of days that fish were detected in theirprimary daytime locations was 56±11% (mean ± SE)in 2006 and 33±5% in 2007 (Tables 3, 4). However,when the analysis focused on the daytime hours thatfish were detected, the percentage of the total hoursdetected in the daytime primarily locations was veryhigh, 97±3% in 2006 and 93±2% in 2007 (Tables 3, 4).In other words, if the fish were detected during the day,they were very likely detected in their primary daytimelocation.
A similar pattern was seen with respect to primarynighttime locations. The percentage of nights inwhich AYT were detected in their primary nighttimelocations was low, 18±6% in 2006 and 26±6% in2007 (Table 3). However, when analysis was focusedon those nighttime hours during which those fishwere detected, fish were almost exclusively detectedin their individual primary nighttime locations, 100%in 2006 and 99±1% in 2007 (Table 4).
In all cases in 2006 and in 13 out of 17 cases in2007, fish were detected most frequently where theywere originally tagged (Tables 3, 4). The exceptionswere individuals that were tagged near receiver 18 in2007. Three out of the 4 fish tagged there had primarydaytime locations that were approximately 100 mnorth of where they were initially captured, in thevicinity of receivers 14, 15 and 16 (Table 4, Fig. 1). Itis possible that these fish were displaced beforecapture in the direction of receiver 18 due to thelocation where divers entered the water that day in theshallow reef habitat.
Movement patterns
Diel movement patterns were visually evident in thetime series plots and varied with the time of sunsetand sunrise (Figs. 3, 6, 7). Fish were repeatedlydetected swimming by the same receiver(s) duringcrepuscular migrations (#53, 71, 72, 86, 88 Fig. 6;#52, 54, 79 Fig. 7), suggesting that individual fishfollow consistent daily migration pathways. Further,all but one fish that were detected leaving primarydaytime locations at sunset exhibited a pattern ofsouth to north movement similar to conventionallytagged fish in 2005.
Crepuscular migration distances (i.e. the distancebetween the receiver at the center of an individual’s
Environ Biol Fish (2011) 91:185–201 193

Tab
le4
2007
Sum
maryof
passiveacou
stictracking
ofadultyello
wtang
thatweredetected
foratleast2
4haftertagg
ing.
ID=transm
itter
identificationnu
mber;Tagging
Location
—tim
e=thereceiver
numbernearestto
thetagg
inglocatio
nandthediel
timeperiod
oftagg
ing(D
=day,N
=nigh
t,S=sunset);Total
duratio
n=nu
mberof
days
from
tagg
ingto
lastdetection;
%days
ofdu
ratio
n=percentage
ofdays
during
thetotald
urationafish
was
detected;D
aytim
e,Nighttim
e,andSun
setrefer
todetections
attheprim
arydaytim
e(7:00
to17
:00),n
ighttim
e(20:00
to5:00
),or
sunset(w
ithin
1hof
sunset)locatio
nsdesign
ated
bythelocatio
ncoveredwith
inthemaxim
umdetectionrang
eof
thelistedreceiver(s);%
ofho
urs=percentage
oftotalho
ursafish
was
detected
during
agivendiel
timeperiod
that
itwas
detected
ineither
theprim
arydaytim
eor
nigh
ttimelocatio
n.Meantim
e=mean
numberof
minutes
betweenfirstandlastdetections
during
thesunseton
thedatesafish
was
detected
multip
letim
esin
itsprim
arysunsetlocatio
n.D-N
=distance
betweenprim
ary
daytim
eandnigh
ttimelocatio
ns.D-S
=distance
betweenprim
arydaytim
eandsunset
locatio
ns
Daytim
eNighttim
eSun
set
Distance
IDTagg
ing
locatio
n-
time
Sex
TL(m
m)
Total
duratio
n(d)
%days
ofdu
ratio
nTo
tal
detections
Rec
#%
days
ofdu
ratio
n%
ofho
urs
Rec
#%
days
ofdu
ratio
n%
ofho
urs
Rec
#%
days
ofdu
ratio
nmeantim
e(m
in)
D-N
(m)
D-S
(m)
5213
-D
F160
5470
1112
1363
996
7100
––
–190
–
5513
-D
M179
138
835971
13,14
75100
133
100
1613
2550
20
6913
-D
M190
6261
475
13,14
58100
––
–16
3426
–20
7313
-D
M180
6949
199
13,14
32100
––
––
––
––
5411
-D
F157
8980
2410
1153
905
4398
––
–130
–
7911
-D
M184
146
64829
1160
100
––
–6
1025
–130
8111
-D
M205
142
381537
1137
100
––
––
––
––
8911
-D
M182
133
414461
1140
100
1118
100
––
–0
–
8418
-D
F151
2167
8014
6796
––
––
––
––
8518
-D
F152
130
1342
16,14
1181
21
100
––
–270
–
8718
-D
F147
124
22217
613
80–
––
––
––
–
8218
-D
M173
5461
2348
14,15,16
4190
1835
100
––
–80
–
534-N
M171
129
40501
192
100
429
95–
––
370
–
745-N
F156
107
2155
5,6
1084
––
––
––
––
805-N
F164
506
3–
––
––
––
––
––
835-N
F172
1694
175
––
–5
69100
––
––
–
865-N
F154
5283
1460
5,6,7
7582
537
88–
––
50–
515-N
M181
117
1764
13,14,16
6100
––
–16
1126
–20
715-N
M183
127
76503
1320
495
20100
633
19190
190
885-N
M186
149
472239
206
100
520
100
613
2440
40
604-S
F154
137
976497
896
100
85
100
610
170
80
564-S
M190
1233
7–
8–
––
––
––
––
594-S
M185
6740
357
4,5,6
2795
516
100
––
–40
–
684-S
M174
141
1124
––
––
––
––
––
–
724-S
M185
126
762900
512
805
58100
613
240
20
7016
-S
F154
113
1960
1612
100
––
––
––
––
5016
-S
M171
1275
130
208
100
––
–16
7539
–180
5716
-S
M173
138
41184
8,9
28100
––
––
––
––
5816
-S
M197
648
714
2100
––
––
––
––
194 Environ Biol Fish (2011) 91:185–201

0 2 4 6 8 11 14 17 20 23
010
020
030
040
050
060
070
0
D
Time of day (hr)
Tot
al d
etec
tions
eac
h ho
ur
0 2 4 6 8 11 14 17 20 23
010
020
030
040
050
060
070
0
N
Time of day (hr)
0 2 4 6 8 11 14 17 20 23
010
020
030
040
050
060
070
0
S
Time of day (hr)
Fig. 5 Total detections per hour for all yellow tang capturedand acoustically tagged during three diel categories in 2007:Day (D) n=12 , night (N) n=8, sunset (S) n=9. A single solid
line is plotted for each fish. The nighttime period (20:00 to5:00) is shaded grey and the daytime period (7:00 to 17:00) isindicated by the dotted lines
0 2 4 6 8 11 14 17 20 23
050
100
150
200
250
300
D
Time of day (hr)
Tot
al d
etec
tions
eac
h ho
ur
0 2 4 6 8 11 14 17 20 23
050
100
150
200
250
300
N
Time of day (hr)
0 2 4 6 8 11 14 17 20 23
050
100
150
200
250
300
S
Time of day (hr)
Fig. 4 Total detections per hour for all yellow tang capturedand acoustically tagged during three diel categories in 2006:Day (D) n=8 , night (N) n=3, sunset (S) n=2. A single solid
line is plotted for each fish. The nighttime period (20:00 to5:00) is shaded grey and the daytime period (7:00 to 17:00) isindicated by the dotted lines
Environ Biol Fish (2011) 91:185–201 195

primary daytime and nighttime location or daytimeand sunset locations) ranged from 0 to 200 m in 2006and from 0 to 400 m in 2007 (Tables 3, 4). However,three individuals consistently detected during thenighttime were detected by the southernmostreceivers during the crepuscular periods (#88, 72,
53, Fig. 6), suggesting that they may have beenmigrating south out of the array. This would equate toa daily migration distance of greater than 0.4 km. Incontrast, three fish in 2006 and three fish in 2007were detected most often by the same receiver duringthe daytime and nighttime.
-156.05 -156.049
19.6
9719
.698
19.6
9919
.7
Latit
ude
(°)
Longitude (°)
05
10
2025
15
100m
15 May 18 May 21 May 24 May
50 M - S
0:00
6:00
12:00
18:00
0:00
6:00
12:00
18:00
53 M - N
14 May 12 Jun 09 Jul 06 Aug 05 Sep
57 M - S
14 May 14 Jun 13 Jul 11 Aug 11 Sep
0:00
6:00
12:00
18:00
14 May 30 May 14 Jun 29 Jun 13 Jul
59 M - S
0:00
6:00
12:00
18:0060 F - S
0:00
6:00
12:00
18:00
14 May 14 Jun 13 Jul 11 Aug 11 Sep
0:00
6:00
12:00
18:0071 M - N
16 May 14 Jun 10 Jul 06 Aug 04 Sep
14 May 12 Jun 08 Jul 04 Aug 02 Sep
0:00
6:00
12:00
18:00
0:00
6:00
12:00
18:0083 F - N
16 May 20 May 24 May 28 May
86 F - N
0:00
6:00
12:00
18:00
15 May 28 May 09 Jun 20 Jun 01 Jul
88 M - N
0:00
6:00
12:00
18:00
16 May 19 Jun 20 Jul 21 Aug 24 Sep
S1
S2
Fig. 6 2007 diel detection patterns of 10 acoustically taggedyellow tang. The transmitter number, sex, time of tagging (S,sunset; N, night) and symbol for the tagging location are given.Horizontal lines indicate time of sunset and sunrise. Note thatthe temporal scale of the x-axis varies between plots, extendingfrom the tagging date to the date of the last detection. The mapdisplays the location of the 20 receivers in the 2007 array.
Symbols for each receiver are according to bottom depth (15 to20 m – open circles, 10 to 15 m - triangles, 5 to 10 m – solidcircles) with depth-specific maximum detection ranges (greydotted lines: 50 m, 40 m, 30 m respectively). Locations of alarger (S1) and smaller (S2) sunset spawning aggregation areindicated. Isobaths are shown in m
196 Environ Biol Fish (2011) 91:185–201
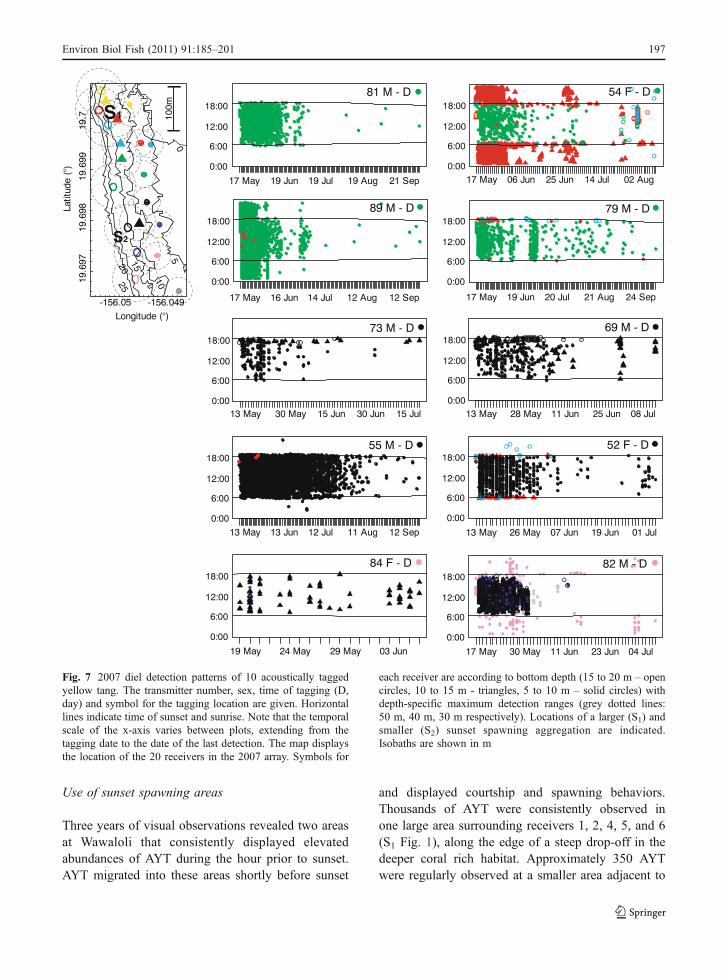
Use of sunset spawning areas
Three years of visual observations revealed two areasat Wawaloli that consistently displayed elevatedabundances of AYT during the hour prior to sunset.AYT migrated into these areas shortly before sunset
and displayed courtship and spawning behaviors.Thousands of AYT were consistently observed inone large area surrounding receivers 1, 2, 4, 5, and 6(S1 Fig. 1), along the edge of a steep drop-off in thedeeper coral rich habitat. Approximately 350 AYTwere regularly observed at a smaller area adjacent to
52 F - D
13 May 26 May 07 Jun 19 Jun 01 Jul
0:00
6:00
12:00
18:00
54 F - D
0:00
6:00
12:00
18:00
17 May 06 Jun 25 Jun 14 Jul 02 Aug
0:00
6:00
12:00
18:00
13 May 13 Jun 12 Jul 11 Aug 12 Sep
55 M - D
69 M - D
0:00
6:00
12:00
18:00
13 May 28 May 11 Jun 25 Jun 08 Jul 0:00
6:00
12:00
18:00
13 May 30 May 15 Jun 30 Jun 15 Jul
73 M - D
0:00
6:00
12:00
18:0079 M - D
17 May 19 Jun 20 Jul 21 Aug 24 Sep
0:00
6:00
12:00
18:0081 M - D
17 May 19 Jun 19 Jul 19 Aug 21 Sep
82 M - D
0:00
6:00
12:00
18:00
17 May 30 May 11 Jun 23 Jun 04 Jul
0:00
6:00
12:00
18:0089 M - D
17 May 16 Jun 14 Jul 12 Aug 12 Sep
84 F - D
19 May 24 May 29 May 03 Jun
0:00
6:00
12:00
18:00
-156.05 -156.049
19.6
9719
.698
19.6
9919
.7
Latit
ude
(°)
Longitude (°)
05
10
2025
15
100mS1
S2
Fig. 7 2007 diel detection patterns of 10 acoustically taggedyellow tang. The transmitter number, sex, time of tagging (D,day) and symbol for the tagging location are given. Horizontallines indicate time of sunset and sunrise. Note that the temporalscale of the x-axis varies between plots, extending from thetagging date to the date of the last detection. The map displaysthe location of the 20 receivers in the 2007 array. Symbols for
each receiver are according to bottom depth (15 to 20 m – opencircles, 10 to 15 m - triangles, 5 to 10 m – solid circles) withdepth-specific maximum detection ranges (grey dotted lines:50 m, 40 m, 30 m respectively). Locations of a larger (S1) andsmaller (S2) sunset spawning aggregation are indicated.Isobaths are shown in m
Environ Biol Fish (2011) 91:185–201 197

receiver 16 (S2 Fig. 1). This area was near a rock andcoral ridge that extended offshore to the edge of asteep drop-off in the deeper coral rich habitat. Smallergroups of AYT were also frequently observed court-ing and spawning just prior to sunset at otherlocations at Wawaloli, primarily along major crepus-cular migration paths along ridges of rock and coral.
Twelve male and one female acoustically taggedAYT (4 in 2006 and 9 in 2007) were repeatedlydetected spending time near the same receiver in oneof the two sunset aggregation areas (receiver 6 or 16,Fig. 1; Tables 3, 4) during the sunset crepuscularperiod. Individuals stayed in the area for a meanduration (± SE) of 35±3 min in 2006 and 25±2 minin 2007 (Tables 3, 4). Over the course of the study, nofish was detected spending time near more than onereceiver during the sunset crepuscular period. As withthe primary daytime and nighttime locations, thepercentage of days of total duration that fish weredetected at these sunset locations was relatively low(mean ± SE: 2006 16±3%; 2007 24±7%) (Tables 3, 4).There also did not appear to be any correlationbetween the lunar cycle and this pattern of detectionsor visual observations of spawning behavior.
Discussion
Comparison of tagging methods
Conventional T-bar tag and re-sight methods had someadvantages over passive acoustic tracking, and proveduseful for quantifying the scale of movements andfidelity to daytime foraging areas for larger groups ofAYT over a period of weeks. Fish could be tagged for arelatively low cost, since the individual T-bar tags costless than 1% of a Vemco™V7 acoustic transmitter. Costand ease of tagging permitted relatively large numbersof fish to be tagged in a single location in a short amountof time. Additionally, the spatial scale over whichmovements could be detected was not limited by therange of fixed acoustic receivers, nor the number ofreceivers available to construct the array. Rather,detection was limited to the area observers could coverduring visual surveys and the costs of these fieldactivities. However, the period of time during whichgroup identity of T-bar tagged AYT could be positivelydetermined was limited due to biofouling. While someT-bar tags were observed in AYT for well over a year,
biofouling covered T-bar tags in about 2 weeks, so thatthe color and therefore the original tagging locationscould no longer be identified. Thus, the temporal scopeand frequency of re-sighting T-bar tagged individualswas limited relative to the number of fish tagged and thelongevity of the tags themselves.
Passive acoustic tracking of AYT in West Hawaiipresented significant technical challenges. Due to theirsmall body size, AYT could only carry the smallesttransmitter available at the time (Vemco V7™), andtransmission power (dB) of transmitters typicallydecreases with size. The effect of this limitation wascompounded by the topographically complex (Ortiz andTissot 2008) and noisy shallow coral reef environment(Lammers et al. 2008) in which they live, which furtherlimits the ability of receivers to detect acoustic signals(Heupel et al. 2006). Snapping shrimp (Alpheus sp.)noise in particular is loud and very common onHawaiian reefs and is produced at frequencies whichspan that of the acoustic transmitters (69 kHz) (Au andBanks 1998; Lammers et al. 2008). Additionally,typical AYT daytime behavior of feeding on benthicalgae tends to put them behind acoustically-interferingstructures (e.g. boulders, coral) (Mitamura et al. 2005;Kawabata et al. 2008) on a consistent basis, makingconsistent detections of fish even in close proximity toa receiver less likely.
Biofouling on receivers has also been shown toaffect detection ability by increasing biological noiseand/or by its physical presence on the hydrophone ofa receiver (Heupel et al. 2008). In the present study,the effects of biofouling were likely greater since theacoustic transmitters - typically implanted into the gutcavity of fishes - were externally attached to yellowtang. Biofouling was visually apparent on both thetransmitters and the receivers after 2 to 3 weeks.Subsequent transmission interference could at leastpartially account for both the decrease in detections ofsome transmitters over time, and the absence ofdetections of fish visually observed near receiversmonths after last being detected.
Although previous studies in a variety of marineenvironments found that maximum detection distan-ces of larger (and thus more powerful) Vemco™transmitters can be up to 150 m or 0.5 km (Heupel etal. 2006; Topping et al. 2006; Afonso et al. 2008),range testing of V7s revealed severely limitedmaximum detection distances, and even more limiteddistances at which detection of transmitters was
198 Environ Biol Fish (2011) 91:185–201

frequent. It is necessary to consider these limitationswhen interpreting the passive acoustic tracking data ofAYT. For example, small changes (few meters) inforaging patterns would leave fish in essentially thesame site, but they would no longer be within therange of the receiver. In spite of our attempt to deploya relatively dense array of receivers, these rangetesting results suggest that over 50% of the relativelysmall area of reef (60 000 m2) within our 20 receiverarray had limited or no coverage.
Estimation of yellow tang movement patternsbased solely on the acoustic telemetry data wouldhave led to a rather different interpretation of dailyfish movements than is available from the multipletagging methods. Acoustic telemetry data indicatedthat while some fish demonstrated frequent use ofthe same daytime foraging areas for extendedperiods (months), many others appeared at thesame site for only a few days or weeks. Further,although most fish were detected at a singledaytime location, the percentage of days they weredetected at these sites varied considerably amongindividuals. However, visual observations of taggedand albino AYT indicate that passive acoustictelemetry can underestimate the consistency withwhich fish use specific daytime foraging sites overat least seasonal time scales.
Pattern and scale of daily movements
Visual observations of conventionally T-bar taggedand albino AYT suggest individual males andfemales consistently return to forage in the sameareas during the daytime. In West Hawaii, theseareas may cover up to a few hundred m2 of shallowcomplex reef flat and boulder habitats, and may beused repeatedly over periods of at least weeks tomonths. Attempts to further supplement these databy having divers and snorkelers follow tagged AYTand directly measure short-term daytime habitat usewere unsuccessful because observers could notmaintain visual contact with fish for an extendedperiod of time as fish eventually fled. This avoidancebehavior may have contributed to previous reports ofwide ranging adult daytime movements (Walsh1984). Other evidence of individual affinity todaytime foraging areas comes from passive acoustictracking of AYT, and observations of multipleacoustically tagged AYT in their primary daytime
location months after they were last acousticallydetected. These visual observations also demon-strate that acoustically tagged fish cannot beassumed to be outside of the detection range of areceiver or array of receivers when they are notdetected. Unfortunately, this finding limits theinterpretation of results from the acoustically telemetrydata in this regard.
However, the passive acoustic monitoring systemwas able to detect relatively fine-scale movementpatterns of AYT. Receivers detected individualsrepeatedly returning to the observed sunset aggrega-tion areas at Wawaloli just before sunset, andremaining there for mean durations of ∼30 min. Thisis consistent with previous observations of untaggedmale AYT maintaining temporary spawning territoriesat sunset (Walsh 1984), and with our visual observa-tions of tagged males returning to the same smallspawning territories to court females.
Similar to patterns of use of daytime foragingareas, most acoustically tagged AYT were detectedby only a single receiver during the nighttime.However, the percentage of nights during the totalduration that acoustically tagged fish were detectedwas low. This low level of detections occurreddespite a receiver array with high receiver densityand considerable detection range overlap in theparts of the array where most fish were detectedtaking refuge at night. Fish behavior most likelycontributed to the relatively low number of detec-tions, since adults typically shelter in coral orspaces between boulders at night (Atkins 1981;Walsh 1984). This type of behavior has beenobserved to block signals from reaching nearbyreceivers in other studies (Mitamura et al. 2005;Kawabata et al. 2008; Meyer et al. 2010). However,these data are consistent with previous visualobservations of an albino AYT in West Hawaii thatrepeatedly returned to the same nighttime refuge siteover an 11-month period (Walsh 1984), and withindividuals of other surgeonfish species consistentlyusing the same nighttime refuge sites (Shulman1985; Meyer and Holland 2005).
Crepuscular migrations between daytime foragingand nighttime refuge areas have been previouslyobserved in untagged AYT (Walsh 1984) and otherspecies of surgeonfish (Mazeroll and Montgomery1995; Meyer and Holland 2005; Meyer et al. 2010).AYT migrations up to 600 m in length occurred daily
Environ Biol Fish (2011) 91:185–201 199

at a consistent time relative to sunset and sunrise,although there was substantial variation in thedistances covered among individuals. These migrationdistances are similar in scale to the maximummovement distances (∼200 to ∼500 m) from traprecaptures and daytime re-sightings for similar sizedCaribbean surgeonfishes, Acanthurus coeruleus andA. bahianus (Chapman and Kramer 2000). Individualacoustically tagged AYT were repeatedly detected bythe same receivers during these migrations, and wereobserved with large numbers of untagged AYTmoving through gullies or alongside rock ridges atsunset. These observations suggest that they repeat-edly follow the same pathways along by distincttopographic habitat features, as has been observed inother surgeonfish and parrotfish species (Ogden andBuckman 1973; Walsh 1984; Meyer and Holland2005). A strong pattern of south to north movement atsunset agrees with a previous AYT study at anotherWest Hawaii site (Walsh 1984). It is not clear,however, if these directional movements relate tosite-specific geography of preferred foraging andsheltering areas, or if they are representative of amore ubiquitous pattern throughout West Hawaiirelating to larger scale environmental factors.
Linear distances between daytime and nighttimeuse areas of fishes provide critical information forfisheries management (Kramer and Chapman 1999;Botsford et al. 2009). These estimates, as compared toestimates of home range area, may be preferable sinceprotected areas are often designated as lengths orpercentages of coastlines, particularly when fishes aremoving through steep and relatively narrow coral reefhabitats like those in West Hawaii. The State ofHawaii has considered designating restricted areas forthe take of herbivorous fishes along coastlines withhigh cover of invasive alien algae. These managementactions would attempt to use the ecological servicesoffered by fish such as AYT as a means ofcontrolling invasive species. The present studyprovides some scientific basis for determining theappropriate size, proximity, and composition ofhabitat features that should be included in theseprotected areas. Additionally, daily migration distancesidentified in this study were used to determine thescale over which to survey when a study wasdesigned to measure potential spillover of AYTfrom marine protected areas in West Hawaii(Williams et al. 2009).
The combination of conventional tagging andpassive acoustic telemetry provided valuable infor-mation despite limitations of each method. Visualobservations of acoustically tagged fish revealedimportant limitations of the acoustic tracking tech-nique. In future studies, repeated visual observationsof individually identifiable acoustically-tagged fish isadvised to help determine when and where fish areand are not being detected. Additional range testing isalso needed to better understand the individual andsynergistic effects of various factors on performanceof acoustic receivers in shallow coral reef environ-ments, particularly when small, less powerful trans-mitters are being used. Audio recording devices (e.g.Lammers et al. 2008) could also be deployedalongside receivers so that rates of detection couldbe directly correlated with ambient noise. Finally,given the short duration of this study relative to the 40+year possible lifespan of yellow tang (Claisse et al. 2009),there remains a need for longer term studies of AYTspatial dynamics, including those directly associatedwith ontogenetic shifts in habitat use (Walsh 1984; Ortizand Tissot 2008, Claisse et al. 2009).
Acknowledgments This research was supported in part througha grant from Hawaii’s Fisheries Local Action Strategy throughHawaii Division of Aquatic Resources CoralManagement funding.This research was also funded in part by the National Oceanic andAtmospheric Administration (NOAA), Center for SponsoredCoastal Ocean Science, under awards #NA03NOS4260044,#NA04NOS4260172 and #NA160A2412 to the University ofHawaii for the Hawaii Coral Reef Initiative and in part by a grant/cooperative agreement fromNOAA, Project # R/FM-20, sponsoredby the University of Hawaii Sea Grant College Program, SOEST,under Institutional Grant No. NA05OAR4171048 from NOAAOffice of Sea Grant, Department of Commerce. The viewsexpressed herein are those of the author(s) and do not necessarilyreflect the views of NOAA or any of its subagencies. UNIHI-SEAGRANT- JC-06-40. Major equipment and logistical supportwere provided by the Hawaii Cooperative Fishery Research Unit,U.S. Geological Survey and theUniversity of Hawaii. This researchalso received both financial and logistical support from the HawaiiDivision of Aquatic Resources and generous logistical supportfrom the U.S. National Park Service Kaloko-Honokohau NationalHistorical Park. The use of trade, firm, or corporation names in thispublication is for the convenience of the reader. Such use does notconstitute an official endorsement or approval by the U.S.Government of any product or service to the exclusion of othersthat may be suitable. An NSF Graduate Research Fellowshipprovided support for J.T.C. D. Allen, S. Beavers, C. Birkeland, K.Boyle, B. Carmen, K. Howard, A. Meyer, C. Meyer, D. Ortiz, C.Smith, A. Taylor, W. Walsh and I. Williams provided field,logistical and/or scientific support throughout the study. We wouldfinally like to thank three anonymous reviewers for their efforts toimprove this manuscript.
200 Environ Biol Fish (2011) 91:185–201
References
Afonso P, Fontes J, Holland KN, Santos RS (2008) Socialstatus determines behaviour and habitat usage in atemperate parrotfish: implications for marine reservedesign. Mar Ecol Prog Ser 359:215–227
Atkins P (1981) Behavioral determinants of the nocturnalspacing pattern of the yellow tang Zebrasoma flavescens(Acanthuridae). Pac Sci 35:263–264
Au WWL, Banks K (1998) The acoustics of the snappingshrimp Synalpheus parneomeris in Kaneohe Bay. J AcoustSoc Am 103:41–47
Botsford L, Brumbaugh D, Grimes C, Kellner J, Largier J,O’Farrell M, Ralston S, Soulanille E, Wespestad V (2009)Connectivity, sustainability, and yield: bridging the gapbetween conventional fisheries management and marineprotected areas. Rev Fish Biol Fish 19:69–95
Bushnell ME, Claisse JT, Laidley CW (2010) Lunar andseasonal patterns in fecundity of an indeterminate,multiple-spawning surgeonfish, the yellow tang Zebra-soma flavescens. J Fish Biol 76:1343–1361
Chapman MR, Kramer DL (2000) Movements of fishes withinand among fringing coral reefs in Barbados. Environ BiolFish 57:11–24
Claisse JT (2009) The life history and movements of yellow tang,Zebrasoma flavescens, with implications for fisheriesmanagement using protected areas., PhD dissertation,University of Hawaii at Manoa, Honolulu, HI, Honolulu, HI
Claisse JT, Kienzle M, Bushnell ME, Shafer DJ, Parrish JD(2009) Habitat- and sex-specific life history patterns ofyellow tang Zebrasoma flavescens in Hawaii, USA. MarEcol Prog Ser 389:245–255
Eklund A, Schull J (2001) A stepwise approach to investigatingthe movement patterns and habitat utilization of goliathgrouper, Epinephelus itajara, using conventional tagging,acoustic telemetry and satellite tracking. In: JRSaJL N (ed)Electronic tagging and tracking in marine fisheries.Kluwer Academic, Netherlands, pp 189–216
Frederick JL (1997) Evaluation of fluorescent elastomerinjection as a method for marking small fish. Bull MarSci 61:399–408
Friedlander A, Aeby G, Brainard R, Brown E, Chaston K,Clark A, McGowan P, Montgomery T, Walsh W, WilliamsI, Wiltse W (2008) The state of coral reef ecosystems ofthe Main Hawaiian Islands. NOAA/NCOS Center forCoastal Monitoring and Assessment, BiogeographyBranch, Silver Spring, MD
Heupel MR, Semmens JM, Hobday AJ (2006) Automatedacoustic tracking of aquatic animals: scales, design anddeployment of listening station arrays. Mar Freshwat Res57:1–13
Heupel MR, Reiss KL, Yeiser BG, Simpfendorfer CA (2008)Effects of biofouling on performance of moored data loggingacoustic receivers. Limnol Oceanogr Meth 6:327–335
Kawabata Y, Okuyama J, Asami K, Yoseda K, Arai N (2008)The post-release process of establishing stable homeranges and diel movement patterns of hatchery-reared
black-spot tuskfish Choerodon schoenleinii. J Fish Biol73:1770–1782
Kramer DL, Chapman MR (1999) Implications of fish homerange size and relocation for marine reserve function.Environ Biol Fish 55:65–79
Lammers MO, Brainard RE, Au WL, Mooney TA, Wong KB(2008) An ecological acoustic recorder (EAR) for long-term monitoring of biological and anthropogenic soundson coral reefs and other marine habitats. J Acoust Soc Am123:1720–1728
Lobel PS (1989) Ocean current variability and the spawningseason of Hawaiian reef fishes. Environ Biol Fish 24:161–171
Mazeroll AI, Montgomery WL (1995) Structure and organiza-tion of local migrations in brown surgeonfish (Acanthurusnigrofuscus). Ethology 99:89–106
Meyer CG, Holland KN (2005) Movement patterns, homerange size and habitat utilization of the bluespine unicorn-fish, Naso unicornis (Acanthuridae) in a Hawaiian marinereserve. Environ Biol Fish 73:201–210
Meyer CG, Honebrink RR (2005) Transintestinal expulsion ofsurgically implanted dummy transmitters by bluefintrevally; Implications for long-term movement studies.Trans Am Fish Soc 134:602–606
Meyer C, Papastamatiou Y, Clark T (2010) Differentialmovement patterns and site fidelity among trophic groupsof reef fishes in a Hawaiian marine protected area. MarBiol 157:1499–1511
Mitamura H, Arai N, Mitsunaga Y, Yokota T, Takeuchi H,Tsuzaki T, Itani M (2005) Directed movements and dielburrow fidelity patterns of red tilefish Branchiostegusjaponicus determined using ultrasonic telemetry. Fish Sci71:491–498
Ogden JC, Buckman NS (1973) Movements, foraging groups,and diurnal migrations of the striped parrotfish Scaruscroicensis Bloch (Scaridae). Ecology 54:589–596
Ortiz DM, Tissot BN (2008) Ontogenetic patterns of habitat useby reef-fish in a Marine Protected Area network: a multi-scaled remote sensing and in situ approach. Mar Ecol ProgSer 365:217–232
R_Development_Core_Team (2009) R: A language and envi-ronment for statistical computing, R Foundation forStatistical Computing, Vienna, Austria
Shulman MJ (1985) Coral reef fish assemblages: intra- andinterspecific competition for shelter sites. Environ BiolFish 13:81–92
Topping DT, Lowe CG, Caselle JE (2006) Site fidelity andseasonal movement patterns of adult California sheepheadSemicossyphus pulcher (Labridae): an acoustic monitoringstudy. Mar Ecol Prog Ser 326:257–267
Walsh WJ (1984) Aspects of nocturnal shelter, habitat space, andjuvenile recruitment in Hawaiian coral reef fishes, Ph.D.Thesis. University of Hawaii at Manoa, Honolulu, HI. 474 pp
Williams ID, Walsh WJ, Claisse JT, Tissot BN, Stamoulis KA(2009) Impacts of a Hawaiian marine protected areanetwork on the abundance and fishery sustainability ofthe yellow tang, Zebrasoma flavescens. Biol Conserv142:1066–1073
Environ Biol Fish (2011) 91:185–201 201
Copyright © 2022 FDOKUMEN