Estimating material parameters of a structurally based constitutive relation for skin mechanics
12
Biomech Model Mechanobiol DOI 10.1007/s10237-010-0272-0 ORIGINAL PAPER Estimating material parameters of a structurally based constitutive relation for skin mechanics Jessica W. Y. Jor · Martyn P. Nash · Poul M. F. Nielsen · Peter J. Hunter Received: 1 September 2010 / Accepted: 10 November 2010 © Springer-Verlag 2010 Abstract This paper presents a structurally based modeling framework to characterize the structure–function relation in skin tissues, based upon biaxial tensile experi- ments performed in vitro on porcine skin. Equi-axial defor- mations were imposed by stretching circular skin specimens uniformly along twelve directions, and the resultant loads at the membrane attachment points were measured. Displace- ment fields at each deformation step were tracked using an image 2D cross-correlation technique. A modeling frame- work was developed to simulate the experiments, whereby measured forces were applied to finite element models that were created to represent the geometry and structure of the tissue samples. Parameters of a structurally based constitu- tive relation were then identified using nonlinear optimiza- tion. Results showed that the ground matrix stiffness ranged from 5 to 32 kPa, fiber orientation mean from 2 to 13 ◦ from the torso midline, fiber undulation mean from 1.04 to 1.34 and collagen fiber stiffness from 48 to 366 MPa. It was con- cluded that the objective function was highly sensitive to the mean orientation and that a priori information about fiber ori- entation mean was important for the reliable identification of constitutive parameters. Keywords Skin · Biomechanics · Collagen · Material parameter identification · Porcine J. W. Y.Jor (B ) · M. P. Nash · P. M. F. Nielsen · P. J. Hunter Auckland Bioengineering Institute, University of Auckland, 70 Symonds Street, Auckland, New Zealand e-mail: [email protected] M. P. Nash · P. M. F. Nielsen Department of Engineering Science, University of Auckland, 70 Symonds Street, Auckland, New Zealand 1 Introduction Human skin displays nonlinear, heterogeneous, anisotropic and viscoelastic mechanical properties, which are strongly influenced by the architecture and mechanical response of its microstructural components (Wilkes et al. 1973). Craik and McNeil (1965) were among the first researchers to histolog- ically show the alignment of collagen fibers under mechani- cal loading of abdominal human skin. Subsequently, similar observations were made from images obtained using scan- ning electron microscopy (SEM) by Finlay (1969). The typ- ical stress–strain response of skin subjected to mechanical stress has been well established (Daly 1966). There are three main phases, as shown in Fig. 1. The initial phase, or the low dynamic stiffness region, corresponds to a gradual increase in stress with strain. This is thought to be due to the reori- entation of fibers toward the axis of loading, followed by their straightening. Since the majority of fibers are initially undulated, the load required to reorient and straighten them is small. The second phase represents gradual stiffening when an increasing number of fibers become progressively aligned and load bearing when fibers are stretched. Due to varia- tion in the extent of fiber undulations, fibers begin to resist tension at different stages, and this is reflected by the non- linear mechanical response of skin. The final phase is an almost linear region showing greater stress at higher strains. Since the majority of fibers are aligned and stretching at this stage, the overall mechanical response becomes depen- dent upon the intrinsic mechanical properties of the fibers themselves. Deformation beyond the final phase leads to yielding and rupture of the skin (Wilkes et al. 1973). The geometrical arrangement of fibers plays a critical role in determining the mechanical response of skin. The observed anisotropic behavior is, in part, due to the varying degrees of packing of interweaving fibers throughout the depth of 123
Transcript of Estimating material parameters of a structurally based constitutive relation for skin mechanics
Biomech Model MechanobiolDOI 10.1007/s10237-010-0272-0
ORIGINAL PAPER
Estimating material parameters of a structurally basedconstitutive relation for skin mechanics
Jessica W. Y. Jor · Martyn P. Nash ·Poul M. F. Nielsen · Peter J. Hunter
Received: 1 September 2010 / Accepted: 10 November 2010© Springer-Verlag 2010
Abstract This paper presents a structurally basedmodeling framework to characterize the structure–functionrelation in skin tissues, based upon biaxial tensile experi-ments performed in vitro on porcine skin. Equi-axial defor-mations were imposed by stretching circular skin specimensuniformly along twelve directions, and the resultant loads atthe membrane attachment points were measured. Displace-ment fields at each deformation step were tracked using animage 2D cross-correlation technique. A modeling frame-work was developed to simulate the experiments, wherebymeasured forces were applied to finite element models thatwere created to represent the geometry and structure of thetissue samples. Parameters of a structurally based constitu-tive relation were then identified using nonlinear optimiza-tion. Results showed that the ground matrix stiffness rangedfrom 5 to 32 kPa, fiber orientation mean from 2 to 13◦ fromthe torso midline, fiber undulation mean from 1.04 to 1.34and collagen fiber stiffness from 48 to 366 MPa. It was con-cluded that the objective function was highly sensitive to themean orientation and that a priori information about fiber ori-entation mean was important for the reliable identification ofconstitutive parameters.
Keywords Skin · Biomechanics · Collagen ·Material parameter identification · Porcine
J. W. Y. Jor (B) · M. P. Nash · P. M. F. Nielsen · P. J. HunterAuckland Bioengineering Institute, University of Auckland,70 Symonds Street, Auckland, New Zealande-mail: [email protected]
M. P. Nash · P. M. F. NielsenDepartment of Engineering Science, University of Auckland,70 Symonds Street, Auckland, New Zealand
1 Introduction
Human skin displays nonlinear, heterogeneous, anisotropicand viscoelastic mechanical properties, which are stronglyinfluenced by the architecture and mechanical response of itsmicrostructural components (Wilkes et al. 1973). Craik andMcNeil (1965) were among the first researchers to histolog-ically show the alignment of collagen fibers under mechani-cal loading of abdominal human skin. Subsequently, similarobservations were made from images obtained using scan-ning electron microscopy (SEM) by Finlay (1969). The typ-ical stress–strain response of skin subjected to mechanicalstress has been well established (Daly 1966). There are threemain phases, as shown in Fig. 1. The initial phase, or the lowdynamic stiffness region, corresponds to a gradual increasein stress with strain. This is thought to be due to the reori-entation of fibers toward the axis of loading, followed bytheir straightening. Since the majority of fibers are initiallyundulated, the load required to reorient and straighten them issmall. The second phase represents gradual stiffening whenan increasing number of fibers become progressively alignedand load bearing when fibers are stretched. Due to varia-tion in the extent of fiber undulations, fibers begin to resisttension at different stages, and this is reflected by the non-linear mechanical response of skin. The final phase is analmost linear region showing greater stress at higher strains.Since the majority of fibers are aligned and stretching at thisstage, the overall mechanical response becomes depen-dent upon the intrinsic mechanical properties of the fibersthemselves. Deformation beyond the final phase leads toyielding and rupture of the skin (Wilkes et al. 1973). Thegeometrical arrangement of fibers plays a critical role indetermining the mechanical response of skin. The observedanisotropic behavior is, in part, due to the varying degreesof packing of interweaving fibers throughout the depth of
123

J. W. Y. Jor et al.
Fig. 1 Load–strain response of an in vitro uniaxial tensile test of humanabdominal skin and corresponding organization of collagen fibers inparallel sections of the dermis. Collagen fibers are undulated in a multi-directional system at the beginning of Phase 1, before becoming alignedalong the load axis at the end of Phase 1. At the end of Phase 2, fibersare aligned and almost straight. During Phase 3, fibers are aligned andstraight. Reproduced from Brown (1973)
the dermis. Experiments in which elastin and ground sub-stance were digested showed that elastin contributes to themechanical response of skin only at low tissue strains, whilethe contribution from ground substance is small (Daly 1969;Harkness and Harkness 1959).
Researchers have attempted to model the mechanicalresponse of connective tissues by taking one of two mainapproaches: a phenomenological approach in which mathe-matical expressions are chosen to best fit experimental dataor reflect material behavior; or a structural approach in whichconstitutive relations are based on the structural arrangementof the constituents. Phenomenological models cover a broadrange of mathematical functional forms, with the power andexponential forms considered as most common to model elas-tic stress–strain behavior of connective tissues (Fung 1967;Tong and Fung 1976). One disadvantage of phenomenolog-ical models is that, despite being able to accurately repre-sent tissue behavior, predictability remains a troublesomeissue and the parameters obtained for phenomenologicalmodels cannot be directly related to specific biological fea-tures of skin (Rodrigues 2001). In contrast, structural modelsderive constitutive relations based in part upon the underlyinghistology. Thus, the structural approach to mathematicalmodels is capable of providing important insights into thestructure–function relationship of a specific tissue. Perhapsone of the most extensive approaches to structurally basedconstitutive relations of collagenous tissues was presentedby Lanir (1979, 1983), who was one of the first to formulatea constitutive relation taking into consideration the geomet-ric arrangements of fiber networks in soft biological tissues.Structurally based constitutive relations have been developed
for a variety of tissues such as tendon/ligament (Hurschleret al. 1997), arterial walls (Holzapfel et al. 2002), pericar-dium (Sacks 2003), passive myocardium (Horowitz et al.1988; Holzapfel and Ogden 2009) and heart valves (Billiarand Sacks 2000).
Although a large number of experiments have beenconducted over the years on measuring the structural andfunctional properties of skin, standardization of such mea-surements and interpretation of results are difficult toestablish. Data obtained are often expressed as indices, pri-marily stretchability or stretchability ratios, which are highlydependent upon the experimental conditions (Diridollou et al.2000). Challenges in standardizing such definitions and inter-pretation have been described by Barel et al. (1995). In manycases, the complex structure of skin has been simplified toa homogeneous nonlinear elastic solid and represented bya simple constitutive relation. Often the different regions ofthe typical J-curve stress–strain plot are modeled separatelyusing a neo-Hookean description and a Young’s modulus,calculated for one particular region, without a clear descrip-tion of which part of the nonlinear curve it was derived from.Biaxial tensile tests have been previously performed to mea-sure the mechanical response of skin (Lanir and Fung 1974;Reihsner et al. 1995; Kvistedal and Nielsen 2009), but fewattempts have been made to represent observed behavior withappropriate constitutive relations (Meijer et al. 1999; Lokshinand Lanir 2009).
Identification of model parameters of structurally basedconstitutive relations may be greatly simplified since struc-tural parameters can be estimated directly from imaging.In order to be able to understand and quantify the relation-ship between microstructure and the mechanical function ofskin, specific quantitative data on collagen fiber orientationis required. In our laboratory, the dermal collagen networkin transverse sections of porcine skin has been studied usingconfocal laser scanning microscopy (CLSM) (Jor et al. 2010).Thick collagen bundles were observed to cross obliquely intwo main directions, between the epidermis and hypodermis(Fig. 2). A similar fiber lattice arrangement was observedin transverse planes sectioned at different orientations withrespect to the torso midline, such that that the collagen fibersform an interwoven network that exhibits common structureabout the normal direction to the epidermis. Fiber orienta-tions were extracted using a structure tensor algorithm. Ithas been demonstrated that the distribution of fiber orienta-tions may be quantified, and represented, by a two-parameterprobability density distribution.
Since the structure of skin is highly correlated to itsfunction, the development of a structurally based biome-chanical model is useful to help understand the underlyingfunction of not only healthy skin, but also damaged or dis-eased skin. This is highlighted by the fact that changes to thestructural arrangement of collagen are often associated with
123

Estimating material parameters
Fig. 2 A 60 µm saggital section of porcine skin imaged using confocallaser scanning microscopy (CLSM), with picrosirius red stained colla-gen appearing bright. Collagen fibers form a distinct lattice arrange-ment, with fibers aligned along two predominant directions that runobliquely from the upper to lower reticular dermis (Jor et al. 2010)
Fig. 3 The multiaxial tensile rig consists of a circular array of 12 auto-mated motor axes with displacement actuators and force transducersattached, a CCD camera mounted above the testing region and the com-puter system required to control the device
pathological disorders, such as the Ehlers–Danlos syndromewhich is a connective tissue disorder caused by a defect inthe synthesis of collagen (Pope et al. 1975). A structurallybased biomechanical model of the skin would allow one toinvestigate the effects of individual dermal components onthe overall macroscopic tissue response.
2 Materials and methods
2.1 Multiaxial tensile experiments
To investigate the mechanical properties of skin, in vitrotensile tests were performed on porcine skin using a custom-built multiaxial tensile rig (Nielsen et al. 2002). The rig con-
Fig. 4 Schematic diagram showing the location of excised samples inrelation to the animal’s torso midline
sisted of twelve Physik Instrumente DC-Mike M-226 actu-ators arranged in a circular array with 30◦ spacing (Fig. 3).Each actuator had a displacement range of 50 mm and res-olution of 0.2 µm. Custom-built 2D force transducers weremounted on the tips of the displacement actuators to recordthe corresponding force vector measured perpendicular toeach of the twelve attachment pins. Each force transducerwas constructed of two pairs of strain gauges bonded in ahalf-bridge configuration to the four necked surfaces of a can-tilever. Each pair of opposite faces was responsible for mea-suring the x and y components of the force vector. Images ofthe specimen geometry were captured using a Atmel Camelia4M CCD camera with 2,048 pixel × 2,048 pixel, which wasmounted overlooking the surface of the specimen. In orderto estimate the deformed geometry at each loading step, aspeckle pattern was created on the surface of the specimen,using a Harder and Steenbeck Infinity airbrush, to enabletracking of material points. A phase corrected cross-corre-lation technique (Malcolm 2000) was used to compute thedisplacements of 64 pixel × 64 pixel subimages and thusmaterial points between successive deformation steps. Thecross-correlation technique is capable of resolving displace-ments as small as 0.008 of a pixel, corresponding to a reso-lution for the measured displacements of ∼0.3 µm.
Three skin samples (labeled 7C5, 9B4, 9C5) were obtainedfrom two young pigs within 1 h of the animals being sacri-ficed for other medical research purposes. The surface of thetest area was shaved and cleaned with DO Weaver NuPrep toallow clear marking on the skin. A custom template was usedto determine the positions of the twelve attachment pointsarranged in a circle (∅60 mm) within each sample whilethe tissue was still intact. Square samples 70 mm × 70 mmwere excised from the abdominal region of each pig alongthe medial midline (Fig. 4), and they were stored in phos-phate-buffered solution (PBS) at room temperature (∼ 21◦C)before testing. Mechanical tests were conducted within 12 hpost-tissue excision. Prior to the experiments, the fat layer
123
J. W. Y. Jor et al.
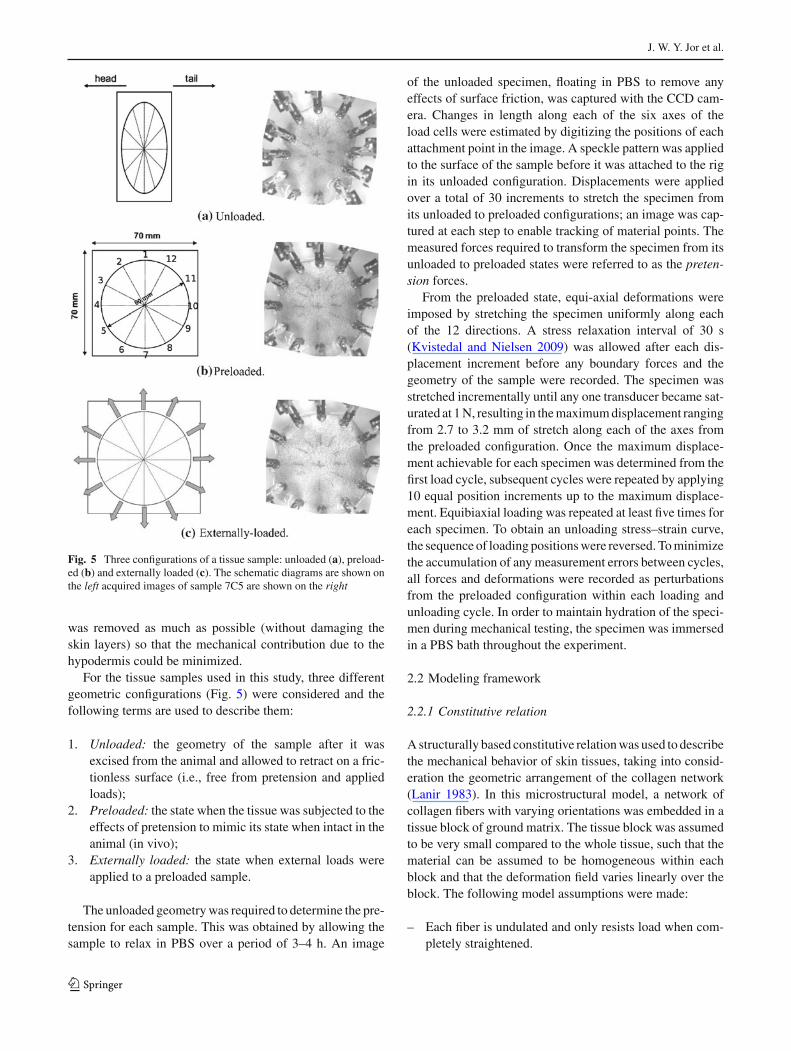
Fig. 5 Three configurations of a tissue sample: unloaded (a), preload-ed (b) and externally loaded (c). The schematic diagrams are shown onthe left acquired images of sample 7C5 are shown on the right
was removed as much as possible (without damaging theskin layers) so that the mechanical contribution due to thehypodermis could be minimized.
For the tissue samples used in this study, three differentgeometric configurations (Fig. 5) were considered and thefollowing terms are used to describe them:
1. Unloaded: the geometry of the sample after it wasexcised from the animal and allowed to retract on a fric-tionless surface (i.e., free from pretension and appliedloads);
2. Preloaded: the state when the tissue was subjected to theeffects of pretension to mimic its state when intact in theanimal (in vivo);
3. Externally loaded: the state when external loads wereapplied to a preloaded sample.
The unloaded geometry was required to determine the pre-tension for each sample. This was obtained by allowing thesample to relax in PBS over a period of 3–4 h. An image
of the unloaded specimen, floating in PBS to remove anyeffects of surface friction, was captured with the CCD cam-era. Changes in length along each of the six axes of theload cells were estimated by digitizing the positions of eachattachment point in the image. A speckle pattern was appliedto the surface of the sample before it was attached to the rigin its unloaded configuration. Displacements were appliedover a total of 30 increments to stretch the specimen fromits unloaded to preloaded configurations; an image was cap-tured at each step to enable tracking of material points. Themeasured forces required to transform the specimen from itsunloaded to preloaded states were referred to as the preten-sion forces.
From the preloaded state, equi-axial deformations wereimposed by stretching the specimen uniformly along eachof the 12 directions. A stress relaxation interval of 30 s(Kvistedal and Nielsen 2009) was allowed after each dis-placement increment before any boundary forces and thegeometry of the sample were recorded. The specimen wasstretched incrementally until any one transducer became sat-urated at 1 N, resulting in the maximum displacement rangingfrom 2.7 to 3.2 mm of stretch along each of the axes fromthe preloaded configuration. Once the maximum displace-ment achievable for each specimen was determined from thefirst load cycle, subsequent cycles were repeated by applying10 equal position increments up to the maximum displace-ment. Equibiaxial loading was repeated at least five times foreach specimen. To obtain an unloading stress–strain curve,the sequence of loading positions were reversed. To minimizethe accumulation of any measurement errors between cycles,all forces and deformations were recorded as perturbationsfrom the preloaded configuration within each loading andunloading cycle. In order to maintain hydration of the speci-men during mechanical testing, the specimen was immersedin a PBS bath throughout the experiment.
2.2 Modeling framework
2.2.1 Constitutive relation
A structurally based constitutive relation was used to describethe mechanical behavior of skin tissues, taking into consid-eration the geometric arrangement of the collagen network(Lanir 1983). In this microstructural model, a network ofcollagen fibers with varying orientations was embedded in atissue block of ground matrix. The tissue block was assumedto be very small compared to the whole tissue, such that thematerial can be assumed to be homogeneous within eachblock and that the deformation field varies linearly over theblock. The following model assumptions were made:
– Each fiber is undulated and only resists load when com-pletely straightened.
123

Estimating material parameters
– Fibers can only resist tensile loading and buckle undercompressive loads, i.e., no load is required to fold orunfold fibers.
– Each fiber undergoes a uniaxial strain, which is the tenso-rial transformation of the macroscopic tissue strain alongthe fiber direction (affine deformation). The justificationfor this assumption is provided by the abundance of inter-connections (attachments) between the different fibers.
– The fibers are linearly elastic when stretched and theirmechanical properties are governed by a 1D fiber load–stretch relation.
– The ground matrix behaves like an isotropic neo-Hookeanmaterial.
– The material properites are assumed to be homogeneousacross each of the tissue samples.
– Viscoelastic effects are neglected.
The full details of the development of this model are con-tained within Lanir (1983), but a brief summary of the rele-vant equations are contained here for completeness.
The second Piola–Kirchhoff stress tensor, S, sums the con-tributions from the ground matrix Sm and collagen fibers S f ,respectively, by taking into consideration the fiber volumefraction V f , such that
S = (1 − V f ) · Sm + V f · S f (1)
The ground matrix was assumed to be a neo-Hookean mate-rial; thus, the strain energy function of the ground matrix(Wm) is given by
Wm = Km(I1 − 3) (2)
where Km is the stiffness of the ground matrix and I1 is thefirst principal strain invariant. For a 2D membrane, the 2ndPiola–Kirchhoff stress tensor for the ground matrix can beexpressed as
Smi j = ∂Wm
∂ Ei j= ∂Wm
∂ I1
∂ I1
∂ Ei j=
{2Km i = j0 i �= j
(3)
where E is the Green–Langrage strain tensor. A uniaxial fiberstrain energy function (w f ) is defined as a function of thefiber stretch ratio λ
w f = Kc
2(λ − 1)2 (4)
where Kc is the collagen fiber stiffness and λ is given byEq. 5.
λ =√
2γ ′f + 1
=√
2(E11cos2θ + E22sin2θ + 2E12cosθsinθ) + 1 (5)
where γ ′f represents the strain along the fiber in the deformed
configuration and θ is the in-plane fiber angle.
The load per unit undeformed cross-sectional area in thefiber is
f (λ) = ∂w f (λ)
∂λ=
{Kc(λ − 1) λ > 10 λ ≤ 1
(6)
The total strain energy of all fibers in an undeformed volumeunit, W f , is given by
W f =∑θ
·R(θ) · w f (λ) · �θ (7)
where R is the probability density function for the fiber ori-entation. The summation can be replaced by integrals if thereis a large enough number of fibers in each direction.
For a 2D membrane, the 2nd Piola–Kirchhoff stress tensorfor the fibers can be expressed as
S fi j =
∫θ
R(θ)1
λ
∂γ ′f
∂ Ei j·
λ∫x=1
D(x) · f
(λ
x
)dxdθ (8)
where x is the stretch required to straighten an undulatedfiber and D(x) is the probability density function for fiberundulation.
A unimodal π -periodic von Mises distribution was chosento describe the in-plane fiber orientation, θ (Eq. 9).
R(θ) = exp [κθcos(2(θ − µθ ))]
π I0(κθ )(9)
where µθ is the fiber orientation mean, κ is the spread andI0(κ) is the modified Bessel function of order zero (Eq. 10).
I0(κ) = 1
π
π∫0
exp[κcos2θ ]dθ (10)
Eq. 9 must also satisfy the following normalization constraint
θ=+ π2∫
θ=− π2
R(θ)dθ = 1 (11)
The distribution function for fiber undulation is assumed tobe Gaussian and can thus be defined by:
D(x) = 1√2πσx
exp
{− (x − µx )
2
2σ 2x
}(12)
where µx and σx are the mean and standard deviation (SD)of the undulation distribution, respectively.
2.2.2 Finite element models
In order to interpret measurements of displacement field datain a quantitatively meaningful manner, a mathematical mod-eling framework was developed to simulate the mechanical
123

J. W. Y. Jor et al.
Fig. 6 Finite element (FE) mesh (green dots and blue lines) of a sam-ple in its preloaded configuration. The image of the sample capturedduring mechanical experiments is shown as the background. The 12attachment nodes are shown as yellow dots; the grid of material pointsat the preloaded configuration are shown as pink dots. The FE meshwith respect to the animal’s body coordinates is shown
experiments using finite element (FE) modeling. FE mod-els were created, using in-house software CMISS1 to rep-resent the preloaded geometries of skin tissue samples usedfor mechanical testing. They consisted of 2D square mesheswith 12 of the 169 nodes positioned at specific positions toform a circular array (Fig. 6). These nodes served as attach-ment points of the tissue to the multiaxial rig and will bereferred to as attachment nodes. In order to generate accurateand specific meshes for each tissue sample, the attachmentnodes were digitized from an image of the mounted sam-ple in the multiaxial rig in its preloaded configuration. Bi-cubic Hermite quadrilateral elements (Bradley et al. 1997)were used for all meshes in this study. A grid of approx-imately 1,200 material points was embedded within eachmesh, and the displacements of these points were mathemat-ically tracked between successive loading steps. Forces mea-sured during the tensile experiments were applied at the 12attachment nodes as boundary constraints. Comparison wasmade between experimentally tracked and model-predicteddisplacements of the material points.
2.3 Material parameter identification
The preloaded configuration of the tissue samples was treatedas the reference geometry for parameter estimation. A set of
1 www.cmiss.org.
initial parameter values were used in a forward mechanicssolution process, whereby experimental forces were appliedat the 12 attachment nodes as boundary constraints. The non-linear lsqnonlin optimization function in Matlab2, which isbased upon trust regions, was used to minimize the followingobjective function in a least-squares sense
(ϑ) =n∑
i=1
(yexpti − ymodel
i (ϑ))2 (13)
where n is the number of material points (about 1,200 in this
study), ϑ is the current set of material parameters, yexpti is the
positions of the experimentally tracked material points andymodel
i (ϑ) is the model-predicted positions of the materialpoints. An optimal solution was obtained when the change inmaterial parameters was less than 10−5 mm2, or the changein the objective function was less than 10−9 mm2.
Due to the large number of parameters in the constitu-tive relation described in Sect. 2.2.1, which appeared to have“trade-off” effects against each other, the number of esti-mated parameters was limited to subsets. In the identificationprocedure, two different estimation strategies were investi-gated, as listed in Table 1. The parameters to be identifiedfor Strategy A were fiber orientation mean (µθ ), collagenfiber stiffness (Kc) and ground matrix stiffness (Km); forStrategy B, parameters were the fiber orientation mean (µθ ),fiber undulation mean (µx ) and ground matrix stiffness (Km).The fixed parameters for both strategies were fiber orienta-tion spread (κ), fiber undulation SD (σx ) and fiber volumefraction (V f ). σx and V f were fixed to 0.2 and 1.2, respec-tively, with both values previously reported in the literature(Table 2). κ was fixed to 10 (equivalent to a circular SD of21◦) based upon quantitative analysis of collagen orientationin porcine skin (Jor et al. 2010). All parameters included inthe optimization procedure were subjected to physiologicallower and upper bounds. In order to investigate the identi-fiability of the parameters, both estimation strategies wereperformed starting from 10 different sets of initial estimates(random numbers generated between the lower and upperbounds of each parameter).
Three measures of optimality criteria for parameter iden-tification were used, as proposed by Nathanson and Saidel(1985), are described below:
1. D-optimality The D-optimality attempts to minimize thevolume of the ε-indifference region, resulting in least var-iance in all parameters. Since the ε-indifference region isinversely proportional to the determinant of the Hessianat the optimum, det(H0), the goal is then to maximizedet(H0). This is widely regarded as the most importantcriterion in parameter estimation.
2 www.mathworks.com.
123

Estimating material parameters
Table 1 List of parameters for a 2D a structural constitutive relation with the corresponding lower/upper bounds and values from the literature (seeTable 2)
Type Parameter Description L.B. U.B. Strategy A Strategy B
Structural Fiber orientation θ Mean µθ 0 π Free Free
Spread κθ – – Fixed at 10 Fixed at 10
Fiber undulation x Mean µx 1.0 1.8 Fixed at 1.2 Free
SD σθ – – Fixed at 0.2 Fixed at 0.2
Fiber volume fraction V f – – Fixed at 0.3 Fixed at 0.3
Nonstructural Collagen fiber stiffness Kc 0.3 MPa 500 MPa Free Fixed at 100 MPa
Ground matrix stiffness Km 1 kPa 100 kPa Free Free
Table 2 Values of material parameters that have been previouslyreported
Parameter Description Reported values
µx Fiber undulation mean 1.2–1.6 (Manschot 1985)
σx Fiber undulation SD 0.2 (Manschot 1985)
Kc Collagen fiber stiffness 100 MPa (Viidik 1980)
V f Fiber volume fraction 0.3 (Manschot 1985)
2. Condition number of the Hessian The condition numberof H0 is defined as the ratio between the smallest andlargest eigenvalues of H0. When the value of cond(H0)is close to 1, the axes of the hyperellipsoid approach equallengths, reflecting low anisotropy (or eccentricity) in theneighborhood of the optimum. An important thing to noteis that this criterion does not indicate the volume changeof the hyperellipsoid; thus, it should only be included asa secondary optimality criterion.
3. M-optimality The above-mentioned criteria do not takeinto account the degree of interaction between parame-ters, which is associated with the orientation of the indif-ference region with the material parameter axes. The goalis to minimize the off-diagonal terms of H0, or the anglebetween the orientation of the indifference region and thematerial parameter axes. To determine the M-optimality,a scaled Hessian (H̃) must first be computed, whose com-ponents are defined as
h̃i j = hi j√hii h j j
i, j not summed (14)
The M-optimality criterion aims to maximize det(H̃)toward the value of 1. This indicates no interactionbetween the parameters since the hyperellipsoid andmaterial parameter axes are completely aligned. It hasbeen shown 0 < det(H̃) ≤ 1.
Table 3 Dimensions of tissue samples in their unloaded configurationfor each sample
Dimension (mm) 7C5 9B4 9C5
Unloaded width 41.1 43.8 42.3
Unloaded length 55.8 53.7 57.1
3 Results
3.1 Pretension measurements
From images of the unloaded tissue samples, the origi-nally square-shaped specimens (70 mm × 70 mm) deformedto rectangular-shaped specimens such that most retractionoccurred in the direction parallel to the torso midline. Thisobservation is consistent with the previously reported direc-tion of Langer’s lines for pigs, which run parallel to thetorso midline (Rose et al. 1976). The dimensions of the tis-sue samples following tissue relaxation are given in Table 3.The averaged width and length measurements were calcu-lated from two measurements at the outer boundaries andone measurement at the center of the specimen. In general,the tissue samples retracted ∼ 40% in width and ∼ 20% inlength from the preloaded (in vivo) to the unloaded configu-ration.
The pretension forces were recorded for each of the 12directions (Fig. 7). The greatest pretension was measuredin directions coinciding with greatest retraction. Pretensionforces were much smaller than the forces measured when anexternal load was applied. The average measured pretensionwas as low as ∼ 2% of the average measured external forcesat approximately 12% stretch.
3.2 Optimal solutions
The optimal solutions for all tissue samples, using Strategy A(the optimized parameters were Km , µθ and Kc), are given
123

J. W. Y. Jor et al.
Fig. 7 Bar graph of pretension forces measured for each tissue speci-men along the 12 motor axes. The Langer’s lines coincide with axis 4and axis 10
in Table 4. An example of the distribution of displacementerrors for sample 7C5 is shown in Fig. 8. Values of groundmatrix stiffness ranged from 5 to 32 kPa. The mean orien-tations were similar across the three tissue samples, rangingbetween 167◦ and 178◦, indicating that the fiber orientationmean deviated only 2◦–13◦ from the torso midline. Colla-gen fiber stiffness varied greatly across the three samples,ranging from 48 to 366 MPa. The reported range of colla-gen fiber stiffness for tendons had also been large, rangingfrom 100 MPa to 1.2 GPa (van Brocklin and Ellis 1965;Wright and Rennels 1964). The mean displacement errorsof the optimized models using Strategy A ranged between0.64 and 0.90 mm. For Strategy B, the optimal values forKm and µθ were similar to those identified using StrategyA. The mean undulation at the optimum ranged from 1.04 to1.34 across all samples. The mean displacement errors of themodels optimized using Strategy B ranged between 0.63 and1.03 mm.
Fig. 8 The error distribution between experimentally measured andmodel-predicted material points for sample 7C5 at the optimum deter-mined using Strategy A
3.3 Identifiability of parameters
Of the 10 different sets of initial estimates used for Strat-egy A, only five sets converged to the global optimal solu-tion for all tissue samples. By plotting the position of theoptimum (denoted by the pink squares) in the 3D param-eter space, together with the positions of the initial esti-mates (denoted by the colored spheres), only initial estimateswith a mean orientation relatively close to the optimal meanorientation converged to the same optimum (denoted by
Table 4 Optimized parameters for each tissue sample using Strategy A
Strategy A Km (kPa) µθ (rad) Kc (MPa) Mean±SD displacement error (mm) det(H0) cond(H0) det(H̃0)
7C5 5.02 3.03 48.10 0.64±0.38 5.76E+03 7.63E−04 0.45
9B4 6.98 3.11 156.30 0.90±0.44 9.85E+01 3.00E−04 0.48
9C5 31.83 2.92 365.63 0.81±0.48 3.33E−01 3.6E−05 0.37
Strategy B Km (kPa) µθ (rad) µx Mean±SD displacement error ( mm) det(H0) cond(H0) det(H̃0)
7C5 4.99 3.03 1.34 0.63±0.37 5.92E+04 7.68E−04 0.43
9B4 6.96 3.12 1.07 0.94±0.42 1.53E+03 2.89E−04 0.83
9C5 30.98 2.95 1.04 1.07±0.53 5.73E+02 3.48E−05 0.71
The M-optimality criterion (det(H0)), condition number (cond(H0)) and D-optimality criterion (det(H̃0)s) at the optimum are also listed
123

Estimating material parameters
the larger spheres). Figure 9a and c show that any initialestimates within 46◦ of the optimal mean orientation con-verged to the optimum, regardless of large variations in theinitial estimates of Km and Kc (Fig.9b). The initial estimatesof µθ must be relatively close to the optimal values in orderfor the global minima to be found; thus, the identificationproblem was highly sensitive to µθ . This was confirmedfor sample 7C5 by a relatively large component of the Hes-sian at optimum H0(2, 2) associated with µθ , compared withthe Hessian components associated with Km , H0(1, 1), andKc, H0(3, 3), as seen in Eq. 15. Similar observations weremade for Strategy B, whereby the initial estimate for the meanorientation needed to be relatively close to the optimal meanorientation in order to achieve successful convergence.
7C5: H0 =
⎡⎢⎢⎢⎢⎣
Km µθ Kc
1.0 −14.5 −1.2
−14.5 981.4 73.6
−1.2 73.6 13.3
⎤⎥⎥⎥⎥⎦ ,
H̃0 =
⎡⎢⎢⎢⎢⎣
Km µθ Kc
1.00 −0.47 −0.34
−0.47 1.00 0.64
−0.34 0.64 1.00
⎤⎥⎥⎥⎥⎦
(15)
3.4 Parameter correlation
The scaled Hessian at the optimum, H̃0, gives a measure ofthe correlation between the parameters. For Strategy A, thedegree of interaction between fiber orientation mean (µθ ) andcollagen fiber stiffness (Kc) was consistently much greaterthan that between ground matrix stiffness (Km) and µθ , orbetween Km and Kc (Eq. 15). H̃0 showed an inverse relation-ship between Km and µθ and between Km and Kc. The over-all interaction between all parameters identified was reflectedby det(H̃0), whereby a value of 1 would indicate no inter-action between the parameters. Values of det(H̃0) across thesamples ranged between 0.37 and 0.48 (Table 4), indicatingthat the degree of interaction between the material parametersbeing identified was relatively large.
For Strategy B, the greatest interaction occurred betweenµθ and µx in an inverse manner. The interaction betweenKm and µx was positive. The degree of parameter interactionwas significantly smaller for samples 9B4 and 9C5, det(H̃0)
ranging from 0.71 to 0.83, compared with the degree of inter-action for the same samples using Strategy A. In contrast, thedegree of parameter interaction with Strategy B for sample7C5 was similar to that obtained using Strategy A.
Fig. 9 The relationship between the positions of the optimum (shownas the largest pink square) and initial estimates within the 3D parameterspace for sample 7C5, using Strategy A. Initial estimates that convergedto the optimum are denoted by larger dots (i.e., Sets 3, 5, 7, 9 and 10),while initial estimates that did not reach the optimum are denoted bysmaller dots. The region within the parameter space that converged tothe same optimum are highlighted in pale yellow in (a) and (c)
123

J. W. Y. Jor et al.
4 Discussion
In this study, the results on the identification of materialparameters of a structurally based constitutive relation basedupon experimental data obtained from multi-axial tensiletests on porcine skin are presented. Three main componentsinvolved in the identification process were (1) measurementsof displacement field data of material points from mechani-cal experiments; (2) FE modeling of the experiments; and (3)an iterative method of estimating the material parameters ofthe chosen constitutive relation to best match experimentaldisplacements. Due to a large number of material parametersand their interactions in the chosen 2D constitutive relation,a subset of the ground matrix stiffness (Km), fiber orientationmean (µθ ) and collagen fiber stiffness (Kc) was identified forStrategy A and Km , µθ and fiber undulation mean (µx ) forStrategy B. Other parameters were fixed to values reported inthe literature. The distribution and magnitude of mean dis-placement error were similar for both strategies and rangedfrom 0.63 to 1.07 mm across the samples. Limitations ofthe present modeling framework and the possible sources ofmodeling errors are listed below:
1. Analysis of the identifiability of the parameters reflectedhigh sensitivity to fiber orientation mean. In this study,the fiber orientation mean for the tissue samples were notknown. Although quantitative data on fiber orientationhave been extracted from confocal images in a previousstudy, these analyzes have been performed on saggital,not parallel, sections. Furthermore, although the sam-ples used in imaging and mechanical experiments wereexcised from similar body locations of the pig, it wouldbe ideal to use the same specimen for both imaging andexperimental purposes in any future work in order toeliminate any inter-specimen variations. Since a prioriknowledge of fiber orientation mean is important to thesuccess of parameter identification, quantitative imageanalysis of collagen orientation in the horizontal direc-tion is of high priority in future work.
2. There is a large inter-specimen variability in collage-nous tissues, such as the skin, making the determinationof unique material parameters a challenging task. Thehigh variability in the identified material parameters islikely to be due to this inter-specimen variability. Thesources of variability may be attributed to differences inthe strain history, internal tissue structure, age and exper-imental errors. Given that the inter-specimen variabilityin structural arrangement may be large, fixing structuralparameters such as fiber orientation spread, undulationmean, undulation spread and fiber volume fraction of allthe tissue samples to the same values (e.g., as reportedin the literature) may potentially cause problems. Thisunderscores the need for a richer set of structural
information specific for the testing subject. All of theparameters that were fixed during the estimation proce-dure were structural parameters. The motivation for thiswas that structural parameters may be attainable throughvarious types of imaging techniques. By collecting struc-tural data from various body locations, the variability ofstructural components may be investigated with respectto body location. This would aid in determining the opti-mal size of a specimen to be used such that the assump-tion of homogeneous material properties is valid acrossthe entire specimen. Alternatively, it may highlight theneed for heterogeneous fields to describe spatially vary-ing structural properties across the samples. In this study,the material properties were assumed to be homogeneousacross the entire specimen.
3. One of the limitations of the current FE model was thatelastin fibers were not included in the constitutive rela-tion; hence, the mechanical response for smaller strainswas assumed to be dominated by the ground matrixstiffness. Although the ground matrix contributes to themechanical response at low strains, it does not provideany anisotropic effects. By omitting the elastin fiber net-work, the prediction of the mechanical response for lowstrains may not be appropriate. An extension to the cur-rent work would be to include an additional family offibers into the constitutive framework to represent thestructure and properties of elastin fibers. However, thisomission is unlikely to affect the major outcomes of thepresent study.
The specific forms used to represent the structure (e.g., dis-tributions to describe fiber orientation and undulations) andproperties (e.g., fiber load–stretch relation) in the employedconstitutive relation are not unique. The von Mises distribu-tion to represent fiber orientation was chosen based upon itsrotational symmetry and its ability to provide a good fit tothe imaging data. However, other distributions may also beadequate. This is also the case for the choice of fiber undula-tion distribution. It may be advantageous to investigate otherforms of distribution functions in future studies.
The use of two different constitutive parameter estima-tion strategies has shown that sets of optimal values usingthe present constitutive relation were not unique. Differentsets of parameters resulted in similar magnitudes of error,indicating that the present sets of experimental data were notsufficient to uniquely characterize the parameters of the 2Dconstitutive relation. Further work could include performingnon-equi-axial loading states, such as imposing a differentextent of deformation along each of the 12 axes of the mul-tiaxial rig. It was apparent that additional experimental datawould be required in order for material parameters associ-ated with the out-of-plane dimension to be reliably identified.In order to identify the parameters of a 3D biomechanical
123

Estimating material parameters
model, experiments such as indentation and shear tests arelikely to help (Flynn et al. 2010).
It was acknowledged that by using the preloaded geom-etry as the mechanical reference (i.e., stress-free) state inthis study, the effects of pretension were neglected in themechanical analyzes. Given that the magnitudes of the mea-sured pretension forces were approximately 2–8% of theapplied load, it was unlikely that the modeling results wouldbe significantly affected by this omission from the mechanicsanalyzes. The choice of the preloaded geometry as the refer-ence configuration resulted in a relatively good fit betweenexperimental data and model results. However, the presentmodel was not capable of accurately simulating the cor-responding deformation when the unloaded geometry wasused as the reference configuration. The changes in struc-tural arrangement of different components and the interactionbetween them that occur during the early phases of deforma-tion (i.e., from the unloaded to preloaded states) are likelyto be complex. In contrast, deformation that occurs beyondthe preloaded configuration corresponds to a steeper part ofthe stress–strain relationship, where mechanical response isbetter defined. It is therefore not surprising that the presentmodel requires improvement before it is able to accuratelypredict the mechanical response using loads applied to theunloaded geometry. The omission of an elastin fiber networkmay be a significant factor in the mismatch between experi-mental and model predictions during the initial phases of thestress–strain response. Nevertheless, a biomechanical modelof skin tissue is useful if it is capable of accurately predict-ing the mechanical response of skin within the physiologicalrange (i.e., the preloaded configuration).
The experimental techniques and the structurally basedbiomechanical model developed in this study have been dem-onstrated to provide good fits to model parameters. The estab-lished framework is a valuable tool for future analyzes inorder to better understand the nonlinear, anisotropic mechan-ical behavior of skin.
Acknowledgments The assistance from Dr C. Flynn in instrumenta-tion and Mr P.B. Gamage in optimization are gratefully acknowledged.This publication is based on work supported in part by New EconomyResearch Fund (NERF) administered by the Foundation for Research,Science and Technology (FRST) and Award No KUK-C1-013-04, madeby King Abdullah University of Science and Technology (KAUST).J.W.Y. Jor is supported by Tertiary Education Commission (TEC) TopAchiever’s Scholarship and M.P. Nash is supported by a James CookFellowship administered by the Royal Society of New Zealand.
References
Barel AO, Courage W, Clarys P (1995) Suction method for measure-ment of skin mechanical properties: the cutometer. In: Handbookof noninvasive methods and the skin. CRC Press, London
Billiar K, Sacks M (2000) Biaxial mechanical properties of the nativeand glutarldehyde-treated aortic valve cusp: part II-A structuralconstitutive model. J Biomech Eng 122:327–335
Bradley CP, Pullan AJ, Hunter PJ (1997) Geometric modeling of thehuman torso using cubic Hermite elements. Ann Biomed Eng25(1):96–111
Brown IA (1973) A scanning electron microscope study of the effectsof uniaxial tension on human skin. Br J Dermatol 89(4):383–393
Craik JE, McNeil IRR (1965) Histological studies of stressed skin. In:Biomechanics and related bioengineering topics. Pergamon Press,Oxford, pp 159–164
Daly C (1966) The biomechanical characteristics of human skin. PhDthesis, University of Strathclyde, Scotland
Daly CH (1969) The role of elastin in the mechanical behavior of humanskin. In: 8th Int. Conf. Med. Biol. Eng
Diridollou S, Patat F, Gens F, Vaillant L, Black D, Lagarde JM, Gall Y,Berson M (2000) In vivo model of the mechanical properties ofthe human skin under suction. Skin Res Technol 6(4):214–221
Finlay B (1969) Scanning electron microscopy of the human dermisunder uni-axial strain. Biomed Eng 4(7):322–327
Flynn C, Taberner A, Nielsen PMF (2010) Mechanical characterisationof in vivo human skin using a 3D force-sensitive micro-robot andfinite element analysis. Biomech Model Mechanobiol publishedonline
Fung YC (1967) Elasticity of soft tissues in simple elongation. Am JPhysiol 213(6):1532–1544
Harkness ML, Harkness RD (1959) Effect of enzymes on mechanicalproperties of tissues. Nature 183:1821–1822
Holzapfel G, Ogden R (2009) On planar biaxial tests for anisotropicnonlinearly elastic solids. A continuum mechanical framework.Math Mech Solids 14:474–489
Holzapfel G, Gasser T, Stadler M (2002) A structural model for theviscoelastic behavior of arterial walls: continuum formulation andfinite element analysis. Eur J Mech A Solids 21:441–463
Horowitz A, Lanir Y, Yin FCP, Perl M, Sheinman I, Strumpf RK(1988) Structural three dimensional constitutive law for the pas-sive myocardium. J Biomech Eng 110:200–207
Hurschler C, Loitz-Ramage B, Vanderby R (1997) A structurally basedstress-stretch relationship for tendon and ligament. J Biomech Eng119(4):392–399
Jor JWY, Nielsen PMF, Nash MP, Hunter PJ (2010) Modelling col-lagen fibre orientation in porcine skin based upon confocal laserscanning microscopy. Skin Res Technol (accepted)
Kvistedal YA, Nielsen PMF (2009) Estimating material parameters ofhuman skin in vivo. Biomech Model Mechanobiol 8(1):1–8
Lanir Y (1979) A structural theory for the homogeneous biaxialstress-strain relationships in flat collagenous tissues. J Biomech12(6):423–436
Lanir Y (1983) Constitutive equations for fibrous connective tissues.J Biomech 16(1):1–12
Lanir Y, Fung YC (1974) Two-dimensional mechanical properties ofrabbit skin. I. Experimental system. J Biomech 7(1):29–34
Lokshin O, Lanir Y (2009) Micro and macro rheology of planar tissues.Biomaterials 30:3118–3127
Malcolm D (2000) Estimating the material properties of inhomogeneouselastic membranes. PhD thesis, University of Auckland
Manschot JFM (1985) The mechanical properties of human skin in vivo.PhD thesis, Nijmegen University, The Netherlands
Meijer R, Douven LFA, Oomens CWJ (1999) Characterisation ofanisotropic and non-linear behaviour of human skin in vivo. Com-put Methods Biomech Biomed Eng 2(1):13–27
Nathanson MH, Saidel GM (1985) Multiple-objective criteria for opti-mal experimental design: application to ferrokinetics. Am J Phys-iol 248:378–386
Nielsen PMF, Malcolm DTK, Hunter PJ, Charette PG (2002) Instru-mentation and procedures for estimating the constitutive param-
123

J. W. Y. Jor et al.
eters of inhomogeneous elastic membranes. Biomech ModelMechanobiol 1(3):211–218
Pope FM, Martin GR, Lichtenstein JR, Penttinen R, Gerson B,Rowe DW, McKusick VA (1975) Patients with Ehlers-Danlos syn-drome type IV lack type III collagen. Proc Natl Acad Sci USA72(4):1314–1316
Reihsner R, Balogh B, Menzel EJ (1995) Two-dimensional elasticproperties of human skin in terms of an incremental model at thein vivo configuration. Med Eng Phys 17(4):304–313
Rodrigues L (2001) EEMCO guidance to the in vivo assessment of ten-sile functional properties of the skin. Skin Pharmacol Appl SkinPhysiol 14:52–67
Rose EH, Ksander GA, Vistnes LM (1976) Skin tension lines in thedomestic pig. Plast Reconstr Surg 57(6):729–732
Sacks MS (2003) Incorporation of experimental derived fiber orienta-tion into a structural constitutive model for planar collagenoustissues. J Biomech Eng 125(2):280–287
Tong P, Fung YC (1976) The stress-strain relationship for the skin.J Biomech 9(10):649–657
van Brocklin D, Ellis DG (1965) A study of the mechanical behavior oftoe extensor tendons under applied stress. Arch Phys Med Rehabil46:369–373
Viidik A (1980) In: Viidik A, Vuust J (eds) Biology of collagen, chap 17,pp 239–355
Wilkes GL, Brown IA, Wildnauer RH (1973) The biomechanical prop-erties of skin. CRC Crit Rev Bioeng 1(4):453–495
Wright DG, Rennels DC (1964) A study of the elastic properties ofplanar fascia. J Bone Joint Surg 46:482–492
123