Induced spawning in perch, Perca fluviatilis L., using FSH + LH with pimozide or metoclopramide

This article appeared in a journal published by Elsevier. The attachedcopy is furnished to the author for internal non-commercial researchand education use, including for instruction at the authors institution
and sharing with colleagues.
Other uses, including reproduction and distribution, or selling orlicensing copies, or posting to personal, institutional or third party
websites are prohibited.
In most cases authors are permitted to post their version of thearticle (e.g. in Word or Tex form) to their personal website orinstitutional repository. Authors requiring further information
regarding Elsevier’s archiving and manuscript policies areencouraged to visit:
http://www.elsevier.com/copyright
Author's personal copy
Population genetic diversity and phylogeographic divergence patterns of the yellowperch (Perca flavescens)
Osvaldo J. Sepulveda-Villet a, Alexander M. Ford b, James D. Williams c, Carol A. Stepien a,⁎a Great Lakes Genetics Laboratory, Lake Erie Center and Department of Environmental Sciences, The University of Toledo, 6200 Bayshore Road, Toledo, OH 43618, USAb Former location of Great Lakes Genetics Laboratory at the Environmental Institute, Cleveland State University, 2121 Euclid Avenue, Cleveland, OH 44115, USAc Florida Museum of Natural History, Gainesville, FL 32611, USA
a b s t r a c ta r t i c l e i n f o
Article history:Received 4 January 2008Accepted 2 November 2008
Communicated by J. Ellen Marsden
Index words:Control regionGreat LakesMitochondrial DNAPerca flavescensPopulation geneticsYellow perch
Great Lakes populations of yellow perch have fluctuated throughout past decades to the present due tounstable recruitment patterns and exploitation. Our study analyzes genetic diversity and structure across thenative range in order to interpret phylogeographic history and contemporary patterns. We compare completemitochondrial DNA control region sequences (912 bp) from 568 spawning individuals at 32 sites,encompassing all 5 Great Lakes and outlying watersheds from the upper Mississippi River, Lake Winnipeg,Lake Champlain, and Atlantic and Gulf coastal relict populations. These broad-scale divergences additionallyare compared with fine-scale patterns from 334 individuals at 16 spawning sites across Lake Erie's 4 fisherymanagement units. We identify 21 mtDNA haplotypes, including a widespread type that totals 87% ofindividuals across the Great Lakes. Overall genetic diversity is relatively low in comparison with other GreatLakes fishes, congruent with prior allozyme and microsatellite studies. The largest genetic demarcationseparates 2 primary population groups: one in the Great Lakes, Lake Winnipeg, and upper Mississippi Riverwatersheds and the other along the Atlantic and Gulf coasts, together with Lake Champlain; which diverged∼365,000 years ago. In addition, the watersheds house genetically separable groups, whose patterns reflectbroad-scale isolation by geographic distance. A few spawning groups show some fine-scale differentiationwithin Lake Erie, which do not reflect fishery management units and need further study with higher-resolution markers.
© 2009 Elsevier Inc. All rights reserved.
Introduction
The yellow perch Perca flavescens (Percidae: Teleostei) is a keyNorth American sport and commercial fish whose populations havefluctuated over the past several decades due to unstable recruit-ment patterns and exploitation (Marsden and Robillard, 2004;Bronte et al., 1993). Its abundance and native distribution center inthe lower Great Lakes region (Scott and Crossman, 1973), whosepopulations originated ∼13,000 years ago (ya) from 2 primaryglacial refugia (Bailey and Smith, 1981; Crossman and McAllister,1986; Todd and Hatcher, 1993). The objective of our study is to testfor broad versus fine-scale population genetic divergence amongyellow perch spawning groups across the Great Lakes in compar-ison with other areas of the native range (Fig. 1). We use
mitochondrial (mt) DNA control region sequences to comparegenetic diversity and divergence levels, test the hypothesis ofgenetic isolation by geographic distance, and evaluate postglacialcolonization and present day patterns.
Maintenance of population genetic diversity is regarded asimportant to an organism's ability to withstand environmentalchanges (Moritz and Faith, 1998; Avise, 2004), which may includeclimate alterations, pollution, habitat loss, biological invasions, andexploitation; all of which likely have negatively affected yellowperch in the Great Lakes (Henderson and Nepszy, 1989; Tyson andKnight, 2001). Notably, Great Lakes yellow perch populations havewithstood exploitation dating to the early 1900s, severe pollution inthe 1950–60s, and biological invasions from the 1970s–present.Invasive species believed to have affected yellow perch populationsinclude white perch Morone americana introduced in 1977 (Parrishand Margraf, 1990; Munawar et al., 2005), ruffe Gymnocephaluscernuus dating to 1985 (Pratt et al., 1992; Fullerton and Lamberti,2006), and round goby Neogobius melanostomus since 1990 (Jude etal., 1992; Gonzalez, 2006).
Although sometimes regarded as a “second rate pan fish”, theyellow perch has been economically important to the Great Lakes
Journal of Great Lakes Research 35 (2009) 107–119
⁎ Corresponding author.E-mail addresses: [email protected] (O.J. Sepulveda-Villet),
[email protected] (A.M. Ford), [email protected] (J.D. Williams),[email protected] (C.A. Stepien).
0380-1330/$ – see front matter © 2009 Elsevier Inc. All rights reserved.doi:10.1016/j.jglr.2008.11.009
Contents lists available at ScienceDirect
Journal of Great Lakes Research
j ourna l homepage: www.e lsev ie r.com/ locate / jg l r
Author's personal copy
for more than a century (Clapp and Dettmers, 2004), with its mostsignificant fishery in Lake Erie (Trautman, 1981). Yellow perchsurvival and recruitment are highly stochastic (Trautman, 1981),with Great Lakes populations undergoing many fluctuations inrecruitment and population sizes (Kenyon and Murray, 2001; GLFC,2004). Peak fishery harvests occurred from 1928–35 and the mid-1950s to the early 1970s, mostly in years coinciding with lownumbers of walleye Sander vitreus (Craig, 2000). During the early1930s, Lake Erie yellow perch commercial landings increased to5700 metric tons, fueled by the collapse of the cisco Coregonus
artedi fishery and a switch of fishing efforts to the more abundantyellow perch (Craig, 2000). Decline in water quality, caused byorganic compounds and phosphorous-bearing detergent waste-water, as well as continued fishing pressure reduced the Lake Erieyellow perch catch below 3175 metric tons by 1976 (Hartmanet al., 1980).
Yellow perch became more abundant during the 1980s and thenmarkedly declined during the 1990s through the early 2000s,variously attributed to fluctuating phosphorous levels, recruitmentfailures, overexploitation, and influence of exotic species —
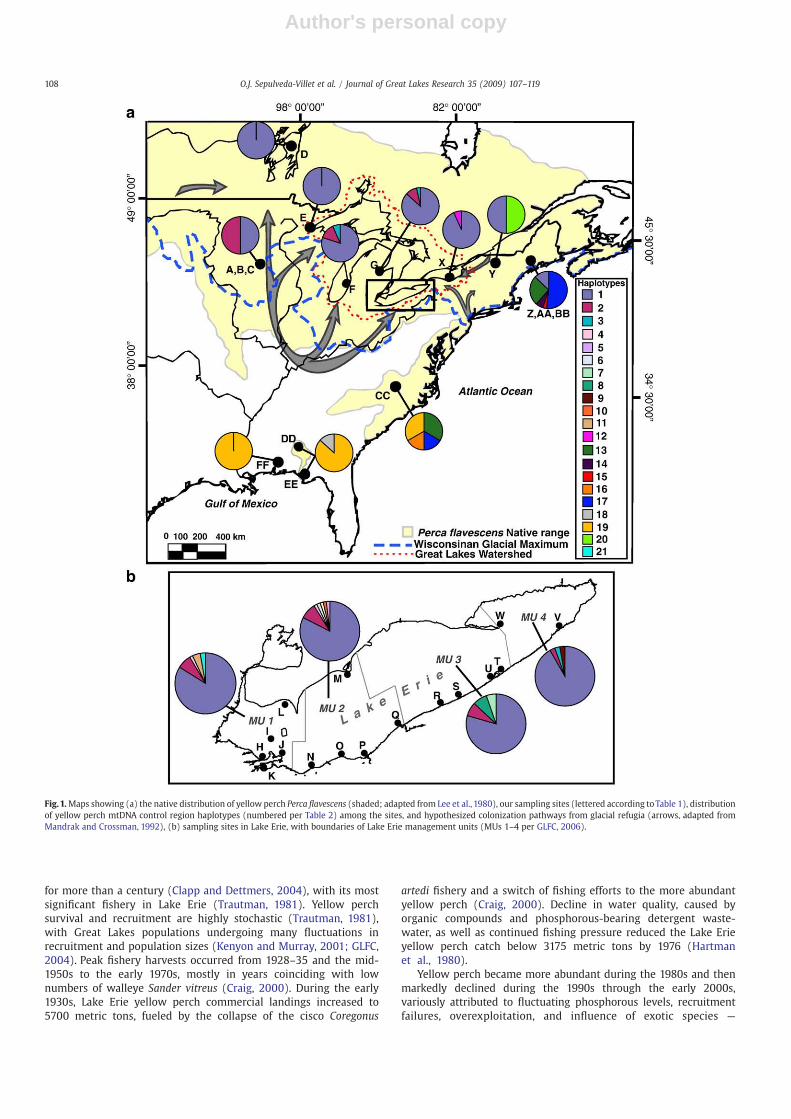
Fig.1.Maps showing (a) the native distribution of yellow perch Perca flavescens (shaded; adapted from Lee et al., 1980), our sampling sites (lettered according toTable 1), distributionof yellow perch mtDNA control region haplotypes (numbered per Table 2) among the sites, and hypothesized colonization pathways from glacial refugia (arrows, adapted fromMandrak and Crossman, 1992), (b) sampling sites in Lake Erie, with boundaries of Lake Erie management units (MUs 1–4 per GLFC, 2006).
108 O.J. Sepulveda-Villet et al. / Journal of Great Lakes Research 35 (2009) 107–119
Author's personal copy
including the white perch and alewife Alosa pseudoharengus(Shroyer and McComish, 2000; Ryan et al., 2003; Lauer et al.,2008). The Lake Michigan yellow perch fishery collapsed in 1990(Fulford et al., 2006) and has not yet fully recovered (Marsden andRobillard, 2004; GLFC, 2008a). Wilberg et al. (2005) estimated theremaining number of yellow perch in Lake Michigan waters in2005 as 10% of those found in 1986. Interagency cooperation acrossthe Great Lakes reduced exploitation and sought to protectspawning groups, increasing stocks and harvests (Ryan et al.,2003). Recent surveys point to an increase in mean fish length anda higher proportion of reproductive-age females as indicators offurther improvement of yellow perch populations in Lake Michigan,but recruitment remains erratic (Lauer et al., 2008). Fisheryrecovery in Lake Erie has been gradual, with a total allowable2006 catch of 7475 metric tons and profit exceeding $42 millionwholesale, largely due to the success of the 2003 year class (GLFC,2006). However, the 2007 total allowable catch was only 5165metric tons, due to weaker year classes in 2002, 2004, and 2006(GLFC, 2007a). The total allowable catch for 2008 further wasdecreased to 4386 metric tons, due to declining numbers of perchremaining in the 2003 year class and lower recruitment insubsequent years (GLFC, 2008b).
Our study was requested by the Great Lakes Fishery Commis-sion's Lake Erie Yellow Perch Task Group, who sought the geneticbasis for stock structure in order to facilitate managementdecisions and stabilize populations. We expanded our study'sscope to relate the population structure of yellow perch acrossthe Great Lakes to its broad-scale phylogeography, therebyincreasing understanding of relative genetic diversity and diver-gence patterns. We evaluate (1) the hypothesis of genetic isolationby geographic distance, (2) divergence patterns stemming fromprior isolation in glacial refugia, and (3) historic versus present-daybarriers and dispersal pathways. Lastly, we relate our findings toknown historic and present-day yellow perch population abun-dances, stock structure, and anthropogenic stresses; as well as topatterns in other fishes.
Materials and methods
Sample and DNA data collection
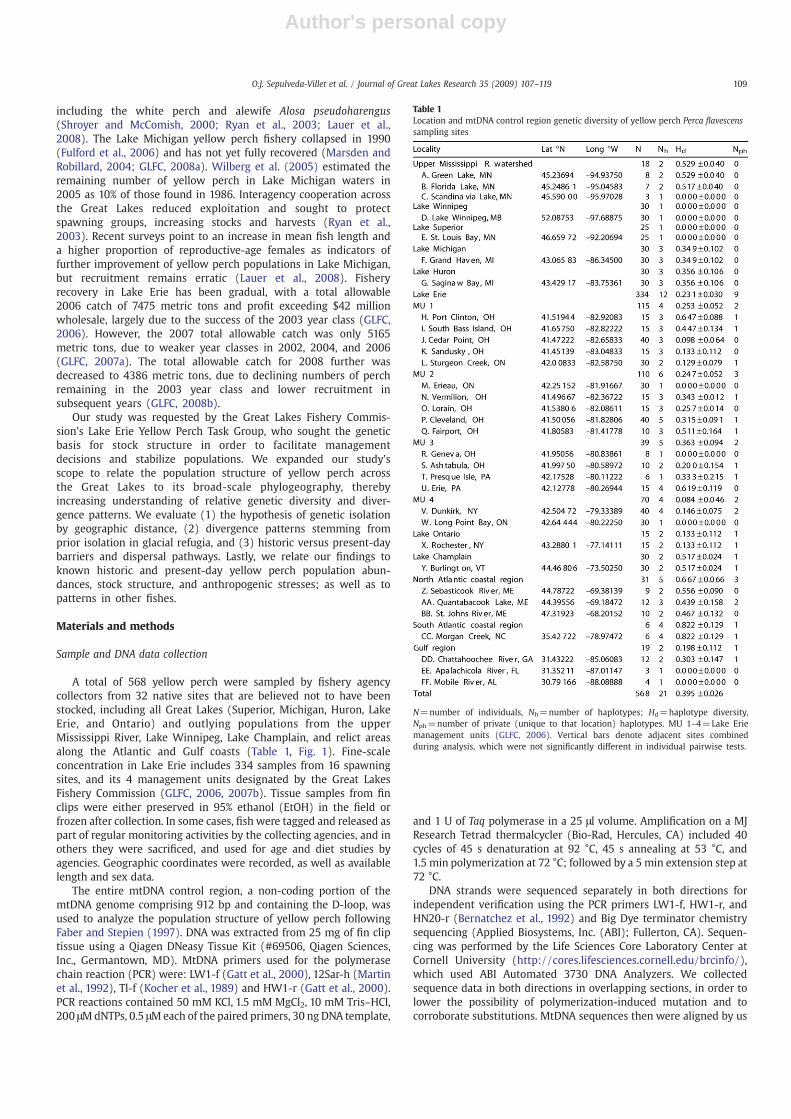
A total of 568 yellow perch were sampled by fishery agencycollectors from 32 native sites that are believed not to have beenstocked, including all Great Lakes (Superior, Michigan, Huron, LakeErie, and Ontario) and outlying populations from the upperMississippi River, Lake Winnipeg, Lake Champlain, and relict areasalong the Atlantic and Gulf coasts (Table 1, Fig. 1). Fine-scaleconcentration in Lake Erie includes 334 samples from 16 spawningsites, and its 4 management units designated by the Great LakesFishery Commission (GLFC, 2006, 2007b). Tissue samples from finclips were either preserved in 95% ethanol (EtOH) in the field orfrozen after collection. In some cases, fish were tagged and released aspart of regular monitoring activities by the collecting agencies, and inothers they were sacrificed, and used for age and diet studies byagencies. Geographic coordinates were recorded, as well as availablelength and sex data.
The entire mtDNA control region, a non-coding portion of themtDNA genome comprising 912 bp and containing the D-loop, wasused to analyze the population structure of yellow perch followingFaber and Stepien (1997). DNA was extracted from 25 mg of fin cliptissue using a Qiagen DNeasy Tissue Kit (#69506, Qiagen Sciences,Inc., Germantown, MD). MtDNA primers used for the polymerasechain reaction (PCR) were: LW1-f (Gatt et al., 2000), 12Sar-h (Martinet al., 1992), Tl-f (Kocher et al., 1989) and HW1-r (Gatt et al., 2000).PCR reactions contained 50 mM KCl, 1.5 mM MgCl2, 10 mM Tris–HCl,200 μMdNTPs, 0.5 μMeach of the paired primers, 30 ng DNA template,
and 1 U of Taq polymerase in a 25 μl volume. Amplification on a MJResearch Tetrad thermalcycler (Bio-Rad, Hercules, CA) included 40cycles of 45 s denaturation at 92 °C, 45 s annealing at 53 °C, and1.5 min polymerization at 72 °C; followed by a 5 min extension step at72 °C.
DNA strands were sequenced separately in both directions forindependent verification using the PCR primers LW1-f, HW1-r, andHN20-r (Bernatchez et al., 1992) and Big Dye terminator chemistrysequencing (Applied Biosystems, Inc. (ABI); Fullerton, CA). Sequen-cing was performed by the Life Sciences Core Laboratory Center atCornell University (http://cores.lifesciences.cornell.edu/brcinfo/),which used ABI Automated 3730 DNA Analyzers. We collectedsequence data in both directions in overlapping sections, in order tolower the possibility of polymerization-induced mutation and tocorroborate substitutions. MtDNA sequences then were aligned by us
Table 1Location and mtDNA control region genetic diversity of yellow perch Perca flavescenssampling sites
N=number of individuals, Nh=number of haplotypes; Hd=haplotype diversity,Nph=number of private (unique to that location) haplotypes. MU 1–4=Lake Eriemanagement units (GLFC, 2006). Vertical bars denote adjacent sites combinedduring analysis, which were not significantly different in individual pairwise tests.
109O.J. Sepulveda-Villet et al. / Journal of Great Lakes Research 35 (2009) 107–119
Author's personal copy
using the software BioEdit v. 7.05 (Hall, 1999; http://bioedit.software.informer.com/). Haplotypes were determined and compared toprevious results obtained by our laboratory (i.e., Faber and Stepien,1997; Ford and Stepien, 2004).
Data analyses
Population genetic data were analyzed using Arlequin 3.11(Excoffier et al., 2005; http://cmpg.unibe.ch/software/arlequin3/)and Genepop 4.0 (Rousset, 2007; http://kimura.univ-montp2.fr/~rousset/Genepop.htm) software packages in order to comparepatterns of genetic divergence and diversity within and amongsampling locations. Genetic variability measures included haplo-typic diversity (h) and nucleotide diversity (π), along with theirstandard errors (following Nei, 1987). Pairwise comparisonsamong spawning sites and population groups were conductedusing the F-statistic analog θST (Weir and Cockerham, 1984; seeBalloux and Lugon-Moulin, 2002) and χ2 contingency tests(Raymond and Rousset, 1995). Samples in adjacent areas werecombined when pairwise tests indicated they were not signifi-cantly different (i.e., the upper Mississippi River watershed, Gulfcoastal region, 2 sites from Maine in the North Atlantic coastalregion — excluding the Sebasticook River, and some adjacentareas within a single MU in Lake Erie; see Table 1). Resultantprobability values were adjusted using sequential Bonferronicorrection (Rice, 1989).
Analysis of MOlecular Variance (AMOVA; Excoffier, 1994) inArlequin was used to evaluate comparative hierarchical populationgenetic structure, with sampling sites grouped to test hypotheses oftheir genetic and geographic relationships. Relationships amonghaplotypes were evaluated using neighbor-joining trees (Saitou andNei, 1987) with Kimura (1980) 2-parameter genetic distances,which corrected for unequal rates of transitions and transversionscharacteristic of mtDNA, in Mega 4.0 (Tamura et al., 2007; http://www.megasoftware.net/). Trees were rooted to the mtDNA controlregion sequence of the Eurasian perch P. fluviatilis (GenBank #Y14724; Nesbo et al., 1999; http://www.ncbi.nlm.nih.gov/Genbank).
Bootstrap support for nodes of the tree was evaluated with 1000pseudoreplications (Felsenstein, 1985). We used a genetic distanceestimate of 2% nucleotide divergence per million years for themtDNA control region, determined from Faber and Stepien (1997and 1998) for yellow perch and walleye. This estimate matched thatdetermined by Near and Benard (2004) for cytochrome b mtDNA ofthe related logperch darters Percina spp.
The program Isolde (in Genepop) was employed to test thehypothesis of whether genetic distance θST/(1−θST) correspondedto geographic distance using the natural logarithm measured as theshortest distances between pairs of spawning sites (Rousset, 1997).Regression significance was tested using Mantel's (1967) procedurewith 1000 permutations in Genepop. Fine-scale structure wastested among individual and grouped locations in the 4 Lake ErieManagement Units (MUs 1–4) designated for the yellow perchfishery (GLFC, 2006).
Phylogeographic patterns further were analyzed using a NestedClade Analysis (NCA; Templeton et al., 1995) to delineate patterns ofgenetic aggregation and spatial dispersion, beginning with astatistical parsimony haplotype network created using TCS 1.21(Clement et al., 2000; http://darwin.uvigo.es/software/tcs.html).The software Geodis v2.5 (Posada et al., 2000; http://darwin.uvigo.es/software/geodis.html) additionally was used to determinewhether spatial distribution influenced haplotype distribution, byestimating 2 variables: 1) clade dispersion, which is the distancebetween the members of the clade and its geographic focus, and 2)clade displacement, which is the average distance of members of agiven clade to the geographic focus of the next incremental nestinggroup (Posada et al., 2006).
Results
Haplotypes and their geographic distribution
We identify 21 mtDNA control region yellow perch haplotypes(Tables 1–2 and Fig. 1; GenBank accession numbers FJ155931 –
FJ155951) that differ at 24 nucleotide positions, including 17
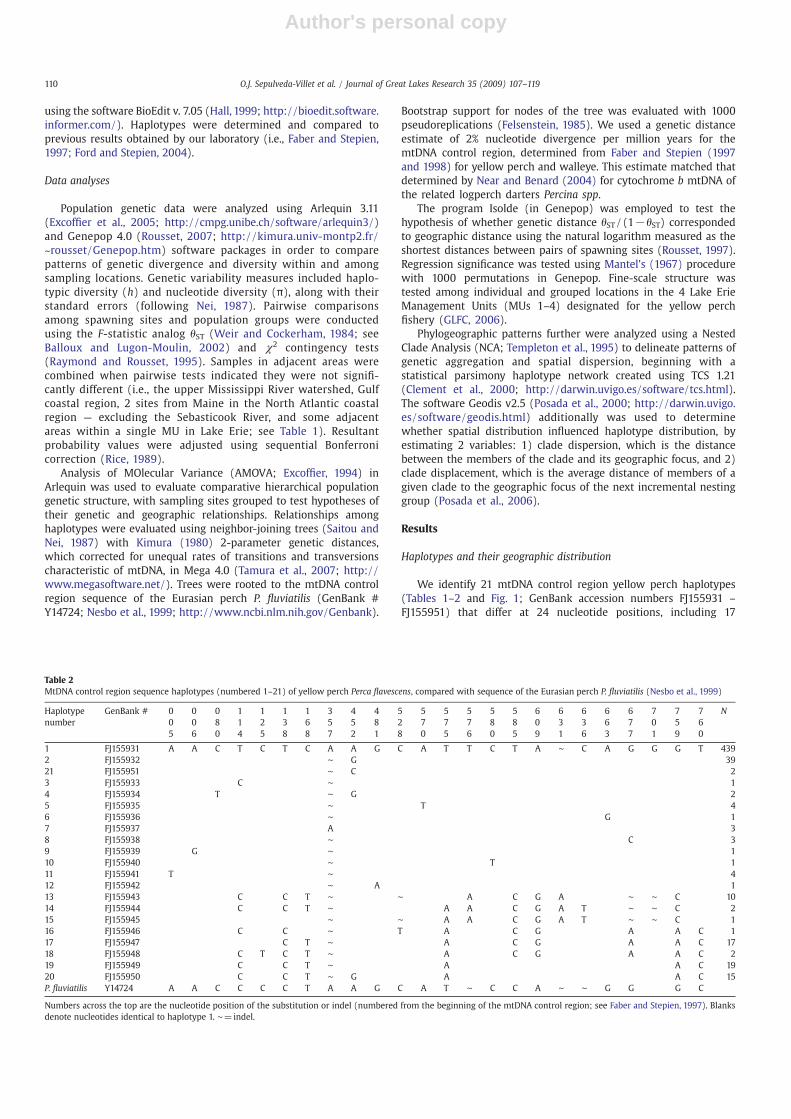
Table 2MtDNA control region sequence haplotypes (numbered 1–21) of yellow perch Perca flavescens, compared with sequence of the Eurasian perch P. fluviatilis (Nesbo et al., 1999)
Haplotypenumber
GenBank # 0 0 0 1 1 1 1 3 4 4 5 5 5 5 5 5 6 6 6 6 6 7 7 7 N0 0 8 1 2 3 6 5 5 8 2 7 7 7 8 8 0 3 3 6 7 0 5 65 6 0 4 5 8 8 7 2 1 8 0 5 6 0 5 9 1 6 3 7 1 9 0
1 FJ155931 A A C T C T C A A G C A T T C T A ∼ C A G G G T 4392 FJ155932 ∼ G 3921 FJ155951 ∼ C 23 FJ155933 C ∼ 14 FJ155934 T ∼ G 25 FJ155935 ∼ T 46 FJ155936 ∼ G 17 FJ155937 A 38 FJ155938 ∼ C 39 FJ155939 G ∼ 110 FJ155940 ∼ T 111 FJ155941 T ∼ 412 FJ155942 ∼ A 113 FJ155943 C C T ∼ ∼ A C G A ∼ ∼ C 1014 FJ155944 C C T ∼ A A C G A T ∼ ∼ C 215 FJ155945 ∼ ∼ A A C G A T ∼ ∼ C 116 FJ155946 C C ∼ T A C G A A C 117 FJ155947 C T ∼ A C G A A C 1718 FJ155948 C T C T ∼ A C G A A C 219 FJ155949 C C T ∼ A A C 1920 FJ155950 C C T ∼ G A A C 15P. fluviatilis Y14724 A A C C C C T A A G C A T ∼ C C A ∼ ∼ G G G C
Numbers across the top are the nucleotide position of the substitution or indel (numbered from the beginning of the mtDNA control region; see Faber and Stepien, 1997). Blanksdenote nucleotides identical to haplotype 1. ∼=indel.
110 O.J. Sepulveda-Villet et al. / Journal of Great Lakes Research 35 (2009) 107–119
Author's personal copy
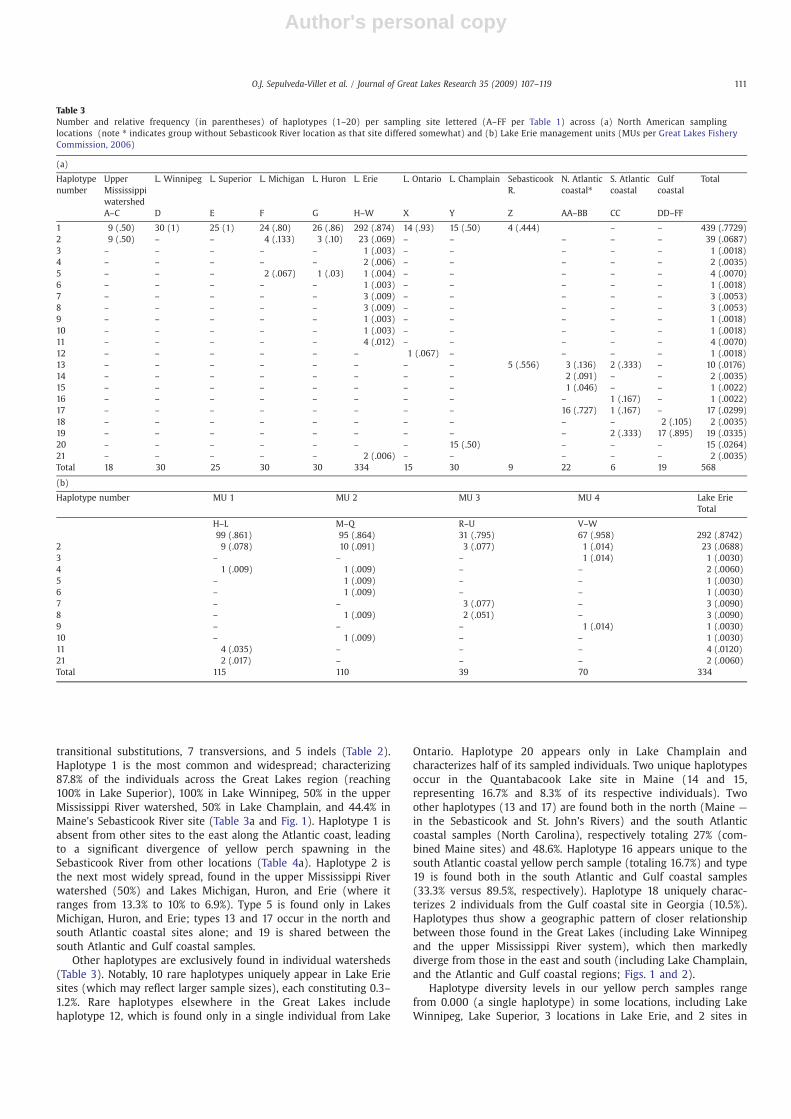
transitional substitutions, 7 transversions, and 5 indels (Table 2).Haplotype 1 is the most common and widespread; characterizing87.8% of the individuals across the Great Lakes region (reaching100% in Lake Superior), 100% in Lake Winnipeg, 50% in the upperMississippi River watershed, 50% in Lake Champlain, and 44.4% inMaine's Sebasticook River site (Table 3a and Fig. 1). Haplotype 1 isabsent from other sites to the east along the Atlantic coast, leadingto a significant divergence of yellow perch spawning in theSebasticook River from other locations (Table 4a). Haplotype 2 isthe next most widely spread, found in the upper Mississippi Riverwatershed (50%) and Lakes Michigan, Huron, and Erie (where itranges from 13.3% to 10% to 6.9%). Type 5 is found only in LakesMichigan, Huron, and Erie; types 13 and 17 occur in the north andsouth Atlantic coastal sites alone; and 19 is shared between thesouth Atlantic and Gulf coastal samples.
Other haplotypes are exclusively found in individual watersheds(Table 3). Notably, 10 rare haplotypes uniquely appear in Lake Eriesites (which may reflect larger sample sizes), each constituting 0.3–1.2%. Rare haplotypes elsewhere in the Great Lakes includehaplotype 12, which is found only in a single individual from Lake
Ontario. Haplotype 20 appears only in Lake Champlain andcharacterizes half of its sampled individuals. Two unique haplotypesoccur in the Quantabacook Lake site in Maine (14 and 15,representing 16.7% and 8.3% of its respective individuals). Twoother haplotypes (13 and 17) are found both in the north (Maine —
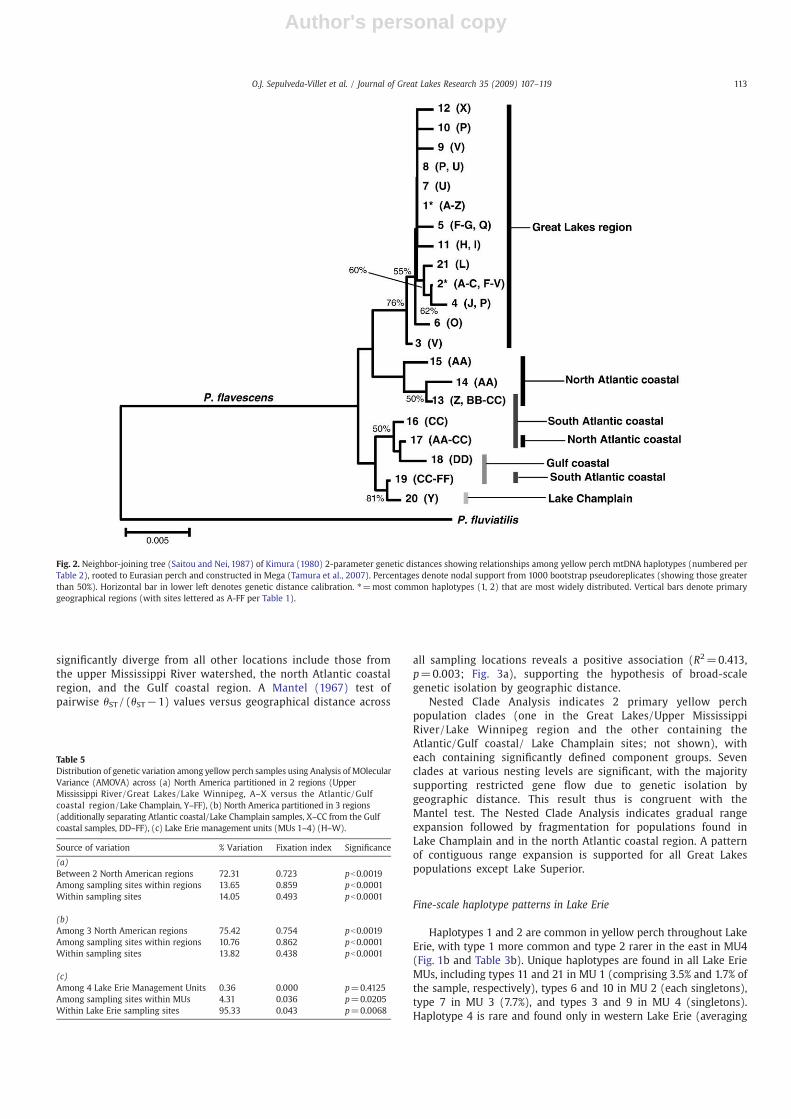
in the Sebasticook and St. John's Rivers) and the south Atlanticcoastal samples (North Carolina), respectively totaling 27% (com-bined Maine sites) and 48.6%. Haplotype 16 appears unique to thesouth Atlantic coastal yellow perch sample (totaling 16.7%) and type19 is found both in the south Atlantic and Gulf coastal samples(33.3% versus 89.5%, respectively). Haplotype 18 uniquely charac-terizes 2 individuals from the Gulf coastal site in Georgia (10.5%).Haplotypes thus show a geographic pattern of closer relationshipbetween those found in the Great Lakes (including Lake Winnipegand the upper Mississippi River system), which then markedlydiverge from those in the east and south (including Lake Champlain,and the Atlantic and Gulf coastal regions; Figs. 1 and 2).
Haplotype diversity levels in our yellow perch samples rangefrom 0.000 (a single haplotype) in some locations, including LakeWinnipeg, Lake Superior, 3 locations in Lake Erie, and 2 sites in
Table 3Number and relative frequency (in parentheses) of haplotypes (1–20) per sampling site lettered (A–FF per Table 1) across (a) North American samplinglocations (note ⁎ indicates group without Sebasticook River location as that site differed somewhat) and (b) Lake Erie management units (MUs per Great Lakes FisheryCommission, 2006)
(a)
Haplotypenumber
UpperMississippiwatershed
L. Winnipeg L. Superior L. Michigan L. Huron L. Erie L. Ontario L. Champlain SebasticookR.
N. Atlanticcoastal⁎
S. Atlanticcoastal
Gulfcoastal
Total
A–C D E F G H–W X Y Z AA–BB CC DD–FF
1 9 (.50) 30 (1) 25 (1) 24 (.80) 26 (.86) 292 (.874) 14 (.93) 15 (.50) 4 (.444) – – 439 (.7729)2 9 (.50) – – 4 (.133) 3 (.10) 23 (.069) – – – – – 39 (.0687)3 – – – – – 1 (.003) – – – – – 1 (.0018)4 – – – – – 2 (.006) – – – – – 2 (.0035)5 – – – 2 (.067) 1 (.03) 1 (.004) – – – – – 4 (.0070)6 – – – – – 1 (.003) – – – – – 1 (.0018)7 – – – – – 3 (.009) – – – – – 3 (.0053)8 – – – – – 3 (.009) – – – – – 3 (.0053)9 – – – – – 1 (.003) – – – – – 1 (.0018)10 – – – – – 1 (.003) – – – – – 1 (.0018)11 – – – – – 4 (.012) – – – – – 4 (.0070)12 – – – – – – 1 (.067) – – – – 1 (.0018)13 – – – – – – – – 5 (.556) 3 (.136) 2 (.333) – 10 (.0176)14 – – – – – – – – 2 (.091) – – 2 (.0035)15 – – – – – – – – 1 (.046) – – 1 (.0022)16 – – – – – – – – – 1 (.167) – 1 (.0022)17 – – – – – – – – 16 (.727) 1 (.167) – 17 (.0299)18 – – – – – – – – – – 2 (.105) 2 (.0035)19 – – – – – – – – – 2 (.333) 17 (.895) 19 (.0335)20 – – – – – – – 15 (.50) – – – 15 (.0264)21 – – – – – 2 (.006) – – – – – 2 (.0035)Total 18 30 25 30 30 334 15 30 9 22 6 19 568
(b)
Haplotype number MU 1 MU 2 MU 3 MU 4 Lake ErieTotal
H–L M–Q R–U V–W99 (.861) 95 (.864) 31 (.795) 67 (.958) 292 (.8742)
2 9 (.078) 10 (.091) 3 (.077) 1 (.014) 23 (.0688)3 – – – 1 (.014) 1 (.0030)4 1 (.009) 1 (.009) – – 2 (.0060)5 – 1 (.009) – – 1 (.0030)6 – 1 (.009) – – 1 (.0030)7 – – 3 (.077) – 3 (.0090)8 – 1 (.009) 2 (.051) – 3 (.0090)9 – – – 1 (.014) 1 (.0030)10 – 1 (.009) – – 1 (.0030)11 4 (.035) – – – 4 (.0120)21 2 (.017) – – – 2 (.0060)Total 115 110 39 70 334
111O.J. Sepulveda-Villet et al. / Journal of Great Lakes Research 35 (2009) 107–119
Author's personal copy
the Gulf coastal region (the latter may be an artifact of smallsample size) to 0.822 in the south Atlantic coastal site; averaging0.395±0.026 across all of our samples (Tables 1 and 3a). In theGreat Lakes, genetic diversity is greater in yellow perch samplesfrom Lakes Huron and Michigan than in Lakes Erie and Ontario.Genetic diversity is higher in Lake Champlain, as well as along theAtlantic coastal sites. (Table 1).
Divergences among individual haplotypes reach a pairwisegenetic distance of P=0.0073, corresponding to ∼365,000 esti-mated years of separation (Fig. 2). This greatest genetic divergencelevel separates haplotypes characteristic of the Great Lakes region(types 1–12 and 21; including Lake Winnipeg and the upperMississippi River samples) from those in the east comprising theLake Champlain/Atlantic/Gulf coastal population group (types 13–20). Maximal pairwise genetic divergence among Great Lakeshaplotypes is P=0.0031, corresponding to ∼155,000 years ofseparation. Sequence divergence of P=0.0034 separates haplotypesfound only in the north Atlantic coastal sites, diverging up to∼170,000 years, whereas the single unique south Atlantic coastalhaplotype (16) differs only by P=0.0007 and ∼34,000 years. Theunique haplotype (18) in the Gulf coastal sites is separated from theAtlantic coastal types by P=0.0025 and ∼124,000 years. Haplotype20 uniquely characterizes the Lake Champlain sample, diverging byP=0.001 and ∼50,000 years (Fig. 2).
Broad-scale population relationships
Genetic divergence between the Upper Mississippi River/Great Lakes/Lake Winnipeg samples versus the Lake Champlain/Atlantic/Gulf coastal regions explains 72% of the overall geneticvariation in the AMOVA analysis (pb0.0019) and has a fixationindex value of 0.73 (Table 5a), indicating a great geneticdivergence level (see Hartl, 1988). Further division into 3 groups(splitting the Gulf coast group from the Atlantic coastal/LakeChamplain group) accounts for 75% of the divergence, and afixation index of 0.75. There also is significant partitioning ofvariation among spawning locations within the groups in bothanalyses; respectively totaling 14% and 11%, with fixation indicesof 0.86 and 0.86 (Tables 5a, b). Thus, the hypothesis of 3 primaryyellow perch population groups is best supported by our data inthese analyses.
Many of the pairwise θST (Weir and Cockerham, 1984) and χ2
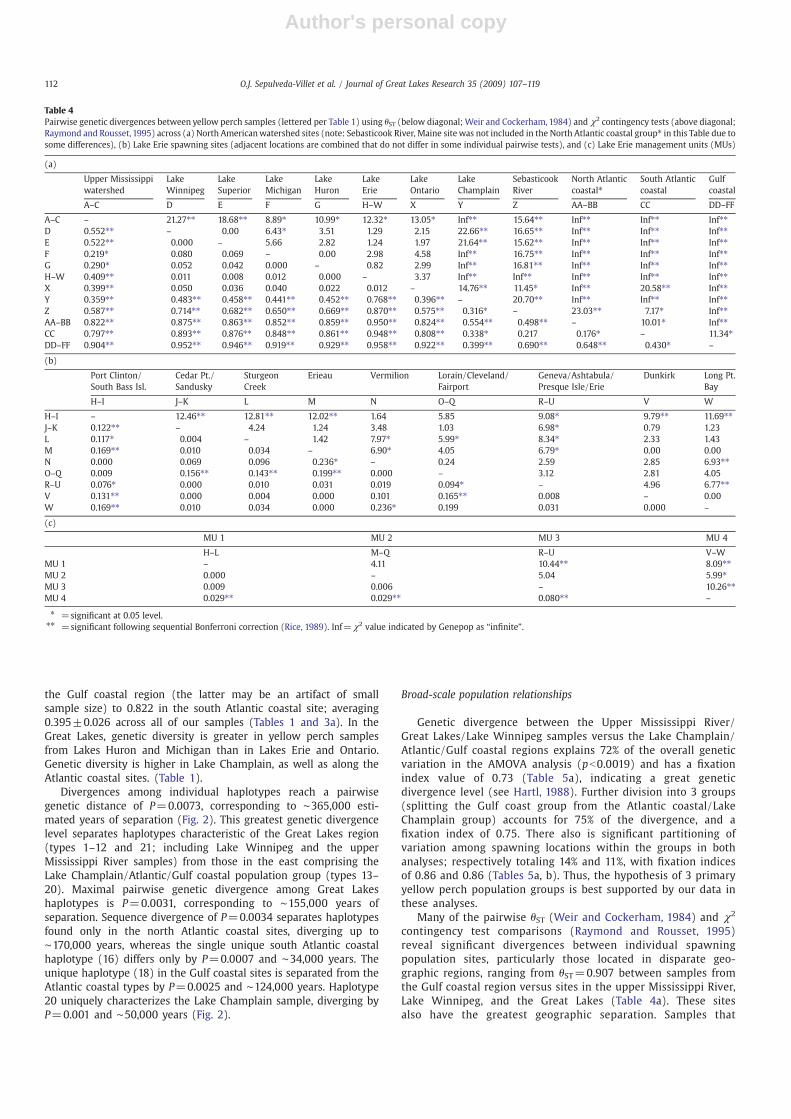
contingency test comparisons (Raymond and Rousset, 1995)reveal significant divergences between individual spawningpopulation sites, particularly those located in disparate geo-graphic regions, ranging from θST=0.907 between samples fromthe Gulf coastal region versus sites in the upper Mississippi River,Lake Winnipeg, and the Great Lakes (Table 4a). These sitesalso have the greatest geographic separation. Samples that
Table 4Pairwise genetic divergences between yellow perch samples (lettered per Table 1) using θST (below diagonal; Weir and Cockerham, 1984) and χ2 contingency tests (above diagonal;Raymond and Rousset, 1995) across (a) North Americanwatershed sites (note: Sebasticook River, Maine sitewas not included in the North Atlantic coastal group⁎ in this Table due tosome differences), (b) Lake Erie spawning sites (adjacent locations are combined that do not differ in some individual pairwise tests), and (c) Lake Erie management units (MUs)
(a)
Upper Mississippiwatershed
LakeWinnipeg
LakeSuperior
LakeMichigan
LakeHuron
LakeErie
LakeOntario
LakeChamplain
SebasticookRiver
North Atlanticcoastal⁎
South Atlanticcoastal
Gulfcoastal
A–C D E F G H–W X Y Z AA–BB CC DD–FF
A–C – 21.27⁎⁎ 18.68⁎⁎ 8.89⁎ 10.99⁎ 12.32⁎ 13.05⁎ Inf⁎⁎ 15.64⁎⁎ Inf⁎⁎ Inf⁎⁎ Inf⁎⁎D 0.552⁎⁎ – 0.00 6.43⁎ 3.51 1.29 2.15 22.66⁎⁎ 16.65⁎⁎ Inf⁎⁎ Inf⁎⁎ Inf⁎⁎E 0.522⁎⁎ 0.000 – 5.66 2.82 1.24 1.97 21.64⁎⁎ 15.62⁎⁎ Inf⁎⁎ Inf⁎⁎ Inf⁎⁎F 0.219⁎ 0.080 0.069 – 0.00 2.98 4.58 Inf⁎⁎ 16.75⁎⁎ Inf⁎⁎ Inf⁎⁎ Inf⁎⁎G 0.290⁎ 0.052 0.042 0.000 – 0.82 2.99 Inf⁎⁎ 16.81⁎⁎ Inf⁎⁎ Inf⁎⁎ Inf⁎⁎H–W 0.409⁎⁎ 0.011 0.008 0.012 0.000 – 3.37 Inf⁎⁎ Inf⁎⁎ Inf⁎⁎ Inf⁎⁎ Inf⁎⁎X 0.399⁎⁎ 0.050 0.036 0.040 0.022 0.012 – 14.76⁎⁎ 11.45⁎ Inf⁎⁎ 20.58⁎⁎ Inf⁎⁎Y 0.359⁎⁎ 0.483⁎⁎ 0.458⁎⁎ 0.441⁎⁎ 0.452⁎⁎ 0.768⁎⁎ 0.396⁎⁎ – 20.70⁎⁎ Inf⁎⁎ Inf⁎⁎ Inf⁎⁎Z 0.587⁎⁎ 0.714⁎⁎ 0.682⁎⁎ 0.650⁎⁎ 0.669⁎⁎ 0.870⁎⁎ 0.575⁎⁎ 0.316⁎ – 23.03⁎⁎ 7.17⁎ Inf⁎⁎AA–BB 0.822⁎⁎ 0.875⁎⁎ 0.863⁎⁎ 0.852⁎⁎ 0.859⁎⁎ 0.950⁎⁎ 0.824⁎⁎ 0.554⁎⁎ 0.498⁎⁎ – 10.01⁎ Inf⁎⁎CC 0.797⁎⁎ 0.893⁎⁎ 0.876⁎⁎ 0.848⁎⁎ 0.861⁎⁎ 0.948⁎⁎ 0.808⁎⁎ 0.338⁎ 0.217 0.176⁎ – 11.34⁎DD–FF 0.904⁎⁎ 0.952⁎⁎ 0.946⁎⁎ 0.919⁎⁎ 0.929⁎⁎ 0.958⁎⁎ 0.922⁎⁎ 0.399⁎⁎ 0.690⁎⁎ 0.648⁎⁎ 0.430⁎ –
(b)
Port Clinton/South Bass Isl.
Cedar Pt./Sandusky
SturgeonCreek
Erieau Vermilion Lorain/Cleveland/Fairport
Geneva/Ashtabula/Presque Isle/Erie
Dunkirk Long Pt.Bay
H–I J–K L M N O–Q R–U V W
H–I – 12.46⁎⁎ 12.81⁎⁎ 12.02⁎⁎ 1.64 5.85 9.08⁎ 9.79⁎⁎ 11.69⁎⁎J–K 0.122⁎⁎ – 4.24 1.24 3.48 1.03 6.98⁎ 0.79 1.23L 0.117⁎ 0.004 – 1.42 7.97⁎ 5.99⁎ 8.34⁎ 2.33 1.43M 0.169⁎⁎ 0.010 0.034 – 6.90⁎ 4.05 6.79⁎ 0.00 0.00N 0.000 0.069 0.096 0.236⁎ – 0.24 2.59 2.85 6.93⁎⁎O–Q 0.009 0.156⁎⁎ 0.143⁎⁎ 0.199⁎⁎ 0.000 – 3.12 2.81 4.05R–U 0.076⁎ 0.000 0.010 0.031 0.019 0.094⁎ – 4.96 6.77⁎⁎V 0.131⁎⁎ 0.000 0.004 0.000 0.101 0.165⁎⁎ 0.008 – 0.00W 0.169⁎⁎ 0.010 0.034 0.000 0.236⁎ 0.199 0.031 0.000 –
(c)
MU 1 MU 2 MU 3 MU 4
H–L M–Q R–U V–WMU 1 – 4.11 10.44⁎⁎ 8.09⁎⁎MU 2 0.000 – 5.04 5.99⁎MU 3 0.009 0.006 – 10.26⁎⁎MU 4 0.029⁎⁎ 0.029⁎⁎ 0.080⁎⁎ –
⁎ =significant at 0.05 level.⁎⁎ =significant following sequential Bonferroni correction (Rice, 1989). Inf=χ2 value indicated by Genepop as “infinite”.
112 O.J. Sepulveda-Villet et al. / Journal of Great Lakes Research 35 (2009) 107–119
Author's personal copy
significantly diverge from all other locations include those fromthe upper Mississippi River watershed, the north Atlantic coastalregion, and the Gulf coastal region. A Mantel (1967) test ofpairwise θST /(θST−1) values versus geographical distance across
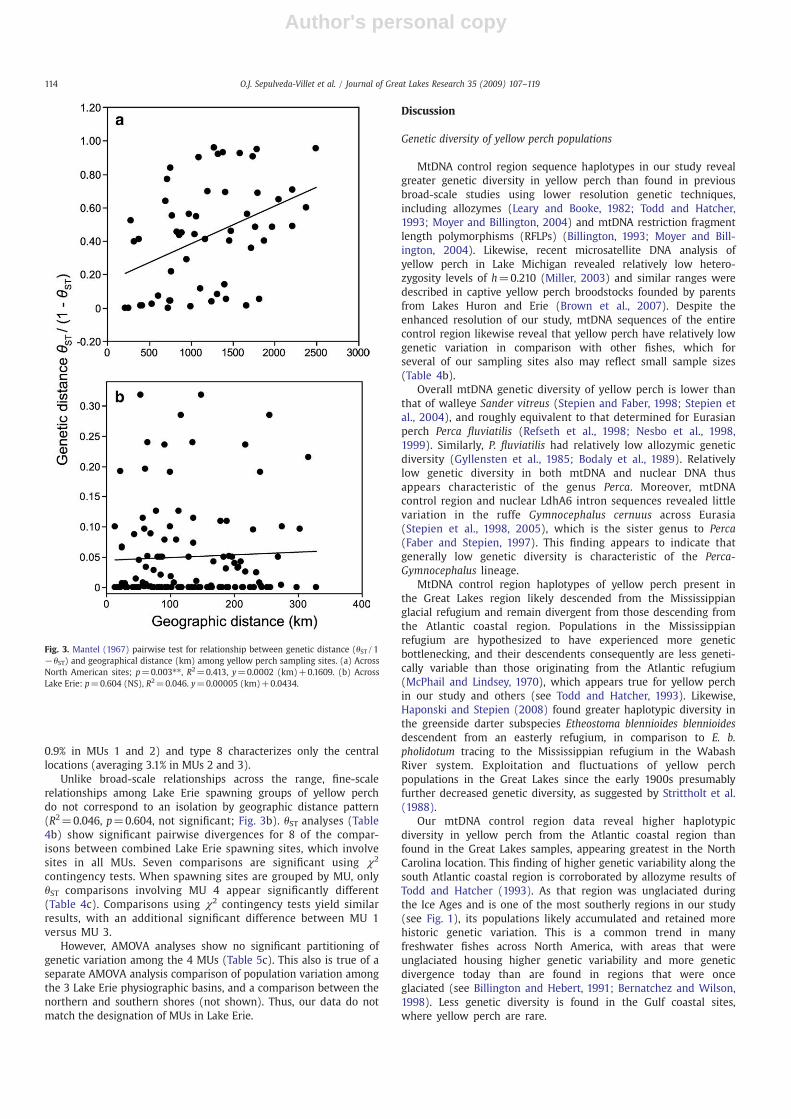
all sampling locations reveals a positive association (R2=0.413,p=0.003; Fig. 3a), supporting the hypothesis of broad-scalegenetic isolation by geographic distance.
Nested Clade Analysis indicates 2 primary yellow perchpopulation clades (one in the Great Lakes/Upper MississippiRiver/Lake Winnipeg region and the other containing theAtlantic/Gulf coastal/ Lake Champlain sites; not shown), witheach containing significantly defined component groups. Sevenclades at various nesting levels are significant, with the majoritysupporting restricted gene flow due to genetic isolation bygeographic distance. This result thus is congruent with theMantel test. The Nested Clade Analysis indicates gradual rangeexpansion followed by fragmentation for populations found inLake Champlain and in the north Atlantic coastal region. A patternof contiguous range expansion is supported for all Great Lakespopulations except Lake Superior.
Fine-scale haplotype patterns in Lake Erie
Haplotypes 1 and 2 are common in yellow perch throughout LakeErie, with type 1 more common and type 2 rarer in the east in MU4(Fig. 1b and Table 3b). Unique haplotypes are found in all Lake ErieMUs, including types 11 and 21 in MU 1 (comprising 3.5% and 1.7% ofthe sample, respectively), types 6 and 10 in MU 2 (each singletons),type 7 in MU 3 (7.7%), and types 3 and 9 in MU 4 (singletons).Haplotype 4 is rare and found only in western Lake Erie (averaging
Fig. 2. Neighbor-joining tree (Saitou and Nei, 1987) of Kimura (1980) 2-parameter genetic distances showing relationships among yellow perch mtDNA haplotypes (numbered perTable 2), rooted to Eurasian perch and constructed in Mega (Tamura et al., 2007). Percentages denote nodal support from 1000 bootstrap pseudoreplicates (showing those greaterthan 50%). Horizontal bar in lower left denotes genetic distance calibration. ⁎=most common haplotypes (1, 2) that are most widely distributed. Vertical bars denote primarygeographical regions (with sites lettered as A-FF per Table 1).
Table 5Distribution of genetic variation among yellow perch samples using Analysis of MOlecularVariance (AMOVA) across (a) North America partitioned in 2 regions (UpperMississippi River/Great Lakes/Lake Winnipeg, A–X versus the Atlantic/Gulfcoastal region/Lake Champlain, Y–FF), (b) North America partitioned in 3 regions(additionally separating Atlantic coastal/Lake Champlain samples, X–CC from the Gulfcoastal samples, DD–FF), (c) Lake Erie management units (MUs 1–4) (H–W).
Source of variation % Variation Fixation index Significance
(a)Between 2 North American regions 72.31 0.723 pb0.0019Among sampling sites within regions 13.65 0.859 pb0.0001Within sampling sites 14.05 0.493 pb0.0001
(b)Among 3 North American regions 75.42 0.754 pb0.0019Among sampling sites within regions 10.76 0.862 pb0.0001Within sampling sites 13.82 0.438 pb0.0001
(c)Among 4 Lake Erie Management Units 0.36 0.000 p=0.4125Among sampling sites within MUs 4.31 0.036 p=0.0205Within Lake Erie sampling sites 95.33 0.043 p=0.0068
113O.J. Sepulveda-Villet et al. / Journal of Great Lakes Research 35 (2009) 107–119
Author's personal copy
0.9% in MUs 1 and 2) and type 8 characterizes only the centrallocations (averaging 3.1% in MUs 2 and 3).
Unlike broad-scale relationships across the range, fine-scalerelationships among Lake Erie spawning groups of yellow perchdo not correspond to an isolation by geographic distance pattern(R2=0.046, p=0.604, not significant; Fig. 3b). θST analyses (Table4b) show significant pairwise divergences for 8 of the compar-isons between combined Lake Erie spawning sites, which involvesites in all MUs. Seven comparisons are significant using χ2
contingency tests. When spawning sites are grouped by MU, onlyθST comparisons involving MU 4 appear significantly different(Table 4c). Comparisons using χ2 contingency tests yield similarresults, with an additional significant difference between MU 1versus MU 3.
However, AMOVA analyses show no significant partitioning ofgenetic variation among the 4 MUs (Table 5c). This also is true of aseparate AMOVA analysis comparison of population variation amongthe 3 Lake Erie physiographic basins, and a comparison between thenorthern and southern shores (not shown). Thus, our data do notmatch the designation of MUs in Lake Erie.
Discussion
Genetic diversity of yellow perch populations
MtDNA control region sequence haplotypes in our study revealgreater genetic diversity in yellow perch than found in previousbroad-scale studies using lower resolution genetic techniques,including allozymes (Leary and Booke, 1982; Todd and Hatcher,1993; Moyer and Billington, 2004) and mtDNA restriction fragmentlength polymorphisms (RFLPs) (Billington, 1993; Moyer and Bill-ington, 2004). Likewise, recent microsatellite DNA analysis ofyellow perch in Lake Michigan revealed relatively low hetero-zygosity levels of h=0.210 (Miller, 2003) and similar ranges weredescribed in captive yellow perch broodstocks founded by parentsfrom Lakes Huron and Erie (Brown et al., 2007). Despite theenhanced resolution of our study, mtDNA sequences of the entirecontrol region likewise reveal that yellow perch have relatively lowgenetic variation in comparison with other fishes, which forseveral of our sampling sites also may reflect small sample sizes(Table 4b).
Overall mtDNA genetic diversity of yellow perch is lower thanthat of walleye Sander vitreus (Stepien and Faber, 1998; Stepien etal., 2004), and roughly equivalent to that determined for Eurasianperch Perca fluviatilis (Refseth et al., 1998; Nesbo et al., 1998,1999). Similarly, P. fluviatilis had relatively low allozymic geneticdiversity (Gyllensten et al., 1985; Bodaly et al., 1989). Relativelylow genetic diversity in both mtDNA and nuclear DNA thusappears characteristic of the genus Perca. Moreover, mtDNAcontrol region and nuclear LdhA6 intron sequences revealed littlevariation in the ruffe Gymnocephalus cernuus across Eurasia(Stepien et al., 1998, 2005), which is the sister genus to Perca(Faber and Stepien, 1997). This finding appears to indicate thatgenerally low genetic diversity is characteristic of the Perca-Gymnocephalus lineage.
MtDNA control region haplotypes of yellow perch present inthe Great Lakes region likely descended from the Mississippianglacial refugium and remain divergent from those descending fromthe Atlantic coastal region. Populations in the Mississippianrefugium are hypothesized to have experienced more geneticbottlenecking, and their descendents consequently are less geneti-cally variable than those originating from the Atlantic refugium(McPhail and Lindsey, 1970), which appears true for yellow perchin our study and others (see Todd and Hatcher, 1993). Likewise,Haponski and Stepien (2008) found greater haplotypic diversity inthe greenside darter subspecies Etheostoma blennioides blennioidesdescendent from an easterly refugium, in comparison to E. b.pholidotum tracing to the Mississippian refugium in the WabashRiver system. Exploitation and fluctuations of yellow perchpopulations in the Great Lakes since the early 1900s presumablyfurther decreased genetic diversity, as suggested by Strittholt et al.(1988).
Our mtDNA control region data reveal higher haplotypicdiversity in yellow perch from the Atlantic coastal region thanfound in the Great Lakes samples, appearing greatest in the NorthCarolina location. This finding of higher genetic variability along thesouth Atlantic coastal region is corroborated by allozyme results ofTodd and Hatcher (1993). As that region was unglaciated duringthe Ice Ages and is one of the most southerly regions in our study(see Fig. 1), its populations likely accumulated and retained morehistoric genetic variation. This is a common trend in manyfreshwater fishes across North America, with areas that wereunglaciated housing higher genetic variability and more geneticdivergence today than are found in regions that were onceglaciated (see Billington and Hebert, 1991; Bernatchez and Wilson,1998). Less genetic diversity is found in the Gulf coastal sites,where yellow perch are rare.
Fig. 3. Mantel (1967) pairwise test for relationship between genetic distance (θST/1−θST) and geographical distance (km) among yellow perch sampling sites. (a) AcrossNorth American sites; p=0.003⁎⁎, R2=0.413, y=0.0002 (km)+0.1609. (b) AcrossLake Erie: p=0.604 (NS), R2=0.046. y=0.00005 (km)+0.0434.
114 O.J. Sepulveda-Villet et al. / Journal of Great Lakes Research 35 (2009) 107–119
Author's personal copy
Broad-scale genetic divergence patterns
Two primary clades of yellow perch haplotypes are resolvedacross North America, corresponding to a primary division betweenthe descendents from the Mississippian refugium to the west versusthe Atlantic coastal refugium and southern unglaciated regions tothe east. Using the molecular clock calibration of 2% per millionyears (my) of Faber and Stepien (1998) and Near and Benard(2004), this separation of 0.73% dates to ∼365,000 years ago (ya)and a mid-Pleistocene divergence. This time corresponds to thelongest prolonged cold period during the Pleistocene ice age (Crespiet al., 2003), when there likely was little exchange between refugia.
A microsatellite study of smallmouth bass (Stepien et al., 2007)also found a marked divergence between the Great Lakes versusAtlantic coastal groups, which was the largest division amongpopulations across North America. Other fishes show similardichotomies between Mississippian and Atlantic ancestral distribu-tions, including cisco Coregonus artedi (Turgeon and Bernatchez,2001a,b), brook char Salvelinus fontinalis (Wilson and Hebert, 1996;Angers and Bernatchez, 1998; Danzmann et al., 1998), and northernhogsucker Hypentelium nigricans (Berendzen et al., 2003). Yellowperch haplotype 1 is widely distributed in the north towestern Maine,likely indicating common ancestry, but does not occur in the Atlanticseaboard populations. Most haplotypes in the Mississippi refugiumthat later colonized the Great Lakes differ only slightly from haplotype1, with maximal divergence time among them ranging to∼155,000 years.
Additional population division supports long-term separationof yellow perch in the Gulf coastal region from those in theAtlantic coastal samples. The Atlantic coastal haplotypes divergefrom one another by up to ∼170,000 years and from the uniqueGulf coastal type by ∼124,000 years. Billington et al. (1992)similarly found marked divergence in walleye from a relictpopulation in the Gulf coast versus other North Americanlocations analyzed.
The Lake Champlain population of yellow perch shows geneticisolation from populations in the Great Lakes drainage, as well asfrom those in the Atlantic/Gulf coasts. Notably, Lake Champlainhouses unique haplotype 20 that is the sister type of 19 from thesouthern Atlantic and Gulf coastal sites, suggesting a divergentpost-glacial dispersal pathway from the south that did not leadto Maine (see Fig. 1). Prevalence of haplotype 1 in LakeChamplain and western Maine also suggests common geneticcontribution from the west, which apparently did not reach thesites in eastern Maine or locations to the south. The geneticdivergence of endemic haplotype 20 dates to ∼50,000 ya (P-distance=0.001), indicating that it predated modern LakeChamplain.
Fine-scale divergence in Lake Erie
Stepien and Faber (1998) and Strange and Stepien (2007)postulated that genetic divergence patterns of walleye Sandervitreus spawning groups across Lake Erie were the result of historicrecolonization patterns from western (Mississippian) and eastern(Atlantic) glacial refugia, maintained by spawning site philopatryand likely natal homing to spawning sites. We find less geneticdivergence in yellow perch across Lake Erie than in walleye (Stepienand Faber, 1998; Strange and Stepien, 2007) or smallmouth bass(Stepien et al., 2007). Both walleye and smallmouth bass hadgreater genetic diversity in eastern Lake Erie. Our results suggestthat yellow perch in Lake Erie received less genetic contributionfrom an eastern glacial refugium than occurred for either walleye orsmallmouth bass.
Relatively low mtDNA genetic diversity and divergence levelsin Lake Erie yellow perch may have resulted from bottlenecks
due to population size fluctuations (Marsden and Robillard,2004), which affect mtDNA more than nuclear DNA (see Avise,2004). In contrast to our study, a fine-scale microsatelliteanalysis of yellow perch in Lake Michigan (Miller, 2003)described significant divergence between samples from GreenBay and surrounding inland lake sites, as well as groups in openwaters of Lake Michigan. Microsatellite markers also resolvedfine-scale differentiation in the St. Lawrence River system(LeClerc et al., 2008). Whereas we discern significant broad-scale correspondence between genetic divergence and geographicdistance in yellow perch, this is not true for its fine-scale analysisin Lake Erie. Likewise, walleye samples across Lake Erie did notcorrespond to a genetic isolation by geographic distance pattern(Strange and Stepien, 2007).
Overall, our mtDNA results indicate relatively low geneticvariability and population structure in Lake Erie. The distribution ofthis genetic variation in Lake Erie yellow perch does not appear tocorrespond to fishery management units (MUs). Our study revealssome genetic divergences among a few yellow perch spawning groupsacross Lake Erie, including differentiation of the eastern samples (MU4), which should be further assessed with higher-resolution micro-satellite data.
Summary and conclusions
The yellow perch displays considerable broad-scale populationgenetic structure across its range — reflecting vicariance amongdrainages, isolation by geographic distance, glacial refugium patterns,and post-glacial dispersion pathways. In comparison with otherpercids, the yellow perch has relatively low genetic diversity, likelydue to population fluctuations as well as its phylogenetic history(since other Perca and Gymnocephalus species show similarly lowvalues). Further fine-scale studies of yellow perch population geneticstructure using higher-resolution nuclear microsatellites additionallywill aid stock discrimination and help managers to conserve whatgenetic diversity remains.
Acknowledgements
This is Lake Erie Research Center publication #2009-06, whichwas supported by grant awards to CAS from NOAA Ohio SeaGrant Program R/LR-7 and 13, USEPA CR-83281401-0, Lake ErieProtection Fund #00-15, and NSF DGE#0742395. OJSV receivedan International Association for Great Lakes Research (IAGLR)scholarship and a GK-12 NSF fellowship. We thank P. Allen, D.Clapp, G. Edmond, D. Einhouse, H. Ferris, R. Haas, T. Hartman, K.Kayle, R. Kenyon, C. Knight, R. Knight, B. Kulik, J. Marsden, A.Naffziger, A. Parker, W. Pearsall, E. Roseman, K. Schmidt, F.Schram, C. Skelton, M. Thomas, J. Tyson, C. Vandergoot, and C.Yoder, Ohio DNR, Michigan DNR, Pennsylvania Fish and BoatCommission, and Ontario Ministry of Natural Resources forcollections; and the Great Lakes Fishery Commission's Lake ErieYellow Perch Task Group for advice. We especially thank ourGreat Lakes Genetics Laboratory: A. Brokaw, J. Banda, J. Brown, A.Haponski, R. Lohner, D. Murphy, M. Neilson, L. Pierce, R. Strange,C. Taylor, and C. Theisler.
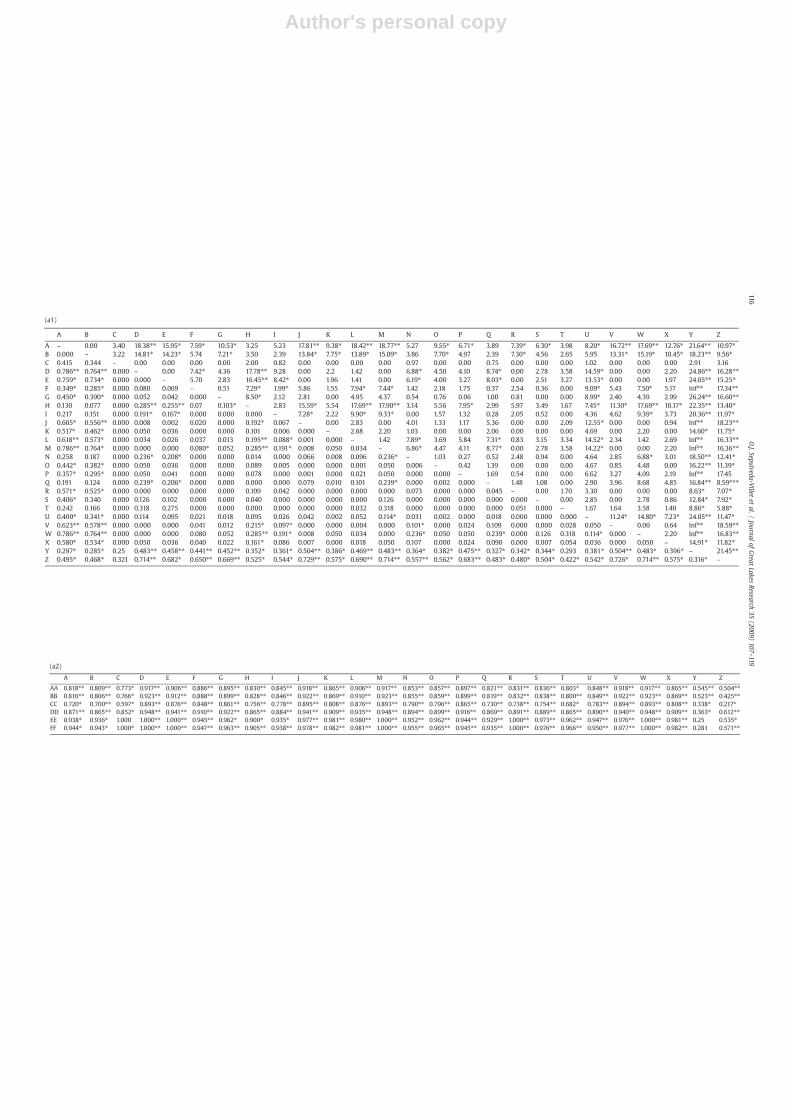
Appendix A
Pairwise genetic divergences between yellow perch samples usingθST (below diagonal; Weir and Cockerham, 1984) and χ2 contingencytests (above diagonal; Raymond and Rousset, 1995) across (a) allNorth American sites (identified by letters as indicated in Table 1), and(b) Lake Erie spawning sites. ⁎=significant at 0.05 level, ⁎⁎=sig-nificant following sequential Bonferroni correction (Rice, 1989).Inf=χ2 value indicated by Genepop as “infinite”.
115O.J. Sepulveda-Villet et al. / Journal of Great Lakes Research 35 (2009) 107–119
Author's personal copy
A B C D E F G H I J K L M N O P Q R S T U V W X Y Z
A – 0.00 3.40 18.38⁎⁎ 15.95⁎ 7.59⁎ 10.53⁎ 3.25 5.23 17.81⁎⁎ 9.38⁎ 18.42⁎⁎ 18.77⁎⁎ 5.27 9.55⁎ 6.71⁎ 3.89 7.39⁎ 6.30⁎ 3.98 8.20⁎ 16.72⁎⁎ 17.69⁎⁎ 12.76⁎ 21.64⁎⁎ 10.97⁎B 0.000 – 3.22 14.81⁎ 14.23⁎ 5.74 7.21⁎ 3.50 2.39 13.84⁎ 7.75⁎ 13.89⁎ 15.09⁎ 3.86 7.70⁎ 4.97 2.39 7.30⁎ 4.56 2.65 5.95 13.31⁎ 15.19⁎ 10.45⁎ 18.23⁎⁎ 9.56⁎C 0.415 0.344 – 0.00 0.00 0.00 0.00 2.00 0.82 0.00 0.00 0.00 0.00 0.97 0.00 0.00 0.75 0.00 0.00 0.00 1.02 0.00 0.00 0.00 2.91 3.16D 0.786⁎⁎ 0.764⁎⁎ 0.000 – 0.00 7.42⁎ 4.36 17.78⁎⁎ 9.28 0.00 2.2 1.42 0.00 6.88⁎ 4.50 4.10 8.74⁎ 0.00 2.78 3.58 14.59⁎ 0.00 0.00 2.20 24.86⁎⁎ 16.28⁎⁎E 0.759⁎ 0.734⁎ 0.000 0.000 – 5.70 2.83 16.45⁎⁎ 8.42⁎ 0.00 1.96 1.41 0.00 6.19⁎ 4.00 3.27 8.03⁎ 0.00 2.51 3.27 13.53⁎ 0.00 0.00 1.97 24.05⁎⁎ 15.25⁎F 0.349⁎ 0.285⁎ 0.000 0.080 0.069 – 0.51 7.29⁎ 1.99⁎ 5.86 1.55 7.94⁎ 7.44⁎ 1.42 2.18 1.75 0.37 2.54 0.36 0.00 9.09⁎ 5.43 7.50⁎ 5.17 Inf⁎⁎ 17.34⁎⁎G 0.450⁎ 0.390⁎ 0.000 0.052 0.042 0.000 – 8.50⁎ 2.12 2.81 0.00 4.95 4.37 0.54 0.76 0.06 1.00 0.81 0.00 0.00 8.99⁎ 2.40 4.39 2.99 26.24⁎⁎ 16.60⁎⁎H 0.130 0.077 0.000 0.285⁎⁎ 0.255⁎⁎ 0.07 0.103⁎ – 2.83 15.59⁎ 5.54 17.69⁎⁎ 17.90⁎⁎ 3.14 5.56 7.95⁎ 2.99 5.97 3.49 1.67 7.45⁎ 11.30⁎ 17.69⁎⁎ 10.17⁎ 22.35⁎⁎ 13.40⁎I 0.217 0.151 0.000 0.191⁎ 0.167⁎ 0.000 0.000 0.000 – 7.28⁎ 2.22 9.90⁎ 9.33⁎ 0.00 1.57 1.32 0.28 2.05 0.52 0.00 4.36 4.62 9.39⁎ 3.73 20.36⁎⁎ 11.97⁎J 0.605⁎ 0.556⁎⁎ 0.000 0.008 0.002 0.020 0.000 0.192⁎ 0.067 – 0.00 2.83 0.00 4.01 1.33 1.17 5.36 0.00 0.00 2.09 12.55⁎ 0.00 0.00 0.94 Inf⁎⁎ 18.23⁎⁎K 0.517⁎ 0.462⁎ 0.000 0.050 0.036 0.000 0.000 0.101 0.006 0.000 – 2.68 2.20 1.03 0.00 0.00 2.06 0.00 0.00 0.00 4.69 0.00 2.20 0.00 14.60⁎ 11.75⁎L 0.618⁎⁎ 0.573⁎ 0.000 0.034 0.026 0.037 0.013 0.195⁎⁎ 0.088⁎ 0.001 0.000 – 1.42 7.89⁎ 3.69 5.84 7.31⁎ 0.83 3.15 3.34 14.52⁎ 2.34 1.42 2.69 Inf⁎⁎ 16.33⁎⁎M 0.786⁎⁎ 0.764⁎ 0.000 0.000 0.000 0.080⁎ 0.052 0.285⁎⁎ 0.191⁎ 0.008 0.050 0.034 – 6.86⁎ 4.47 4.11 8.77⁎ 0.00 2.78 3.58 14.22⁎ 0.00 0.00 2.20 Inf⁎⁎ 16.36⁎⁎N 0.258 0.187 0.000 0.236⁎ 0.208⁎ 0.000 0.000 0.014 0.000 0.066 0.008 0.096 0.236⁎ – 1.03 0.27 0.52 2.48 0.94 0.00 4.64 2.85 6.88⁎ 3.01 18.50⁎⁎ 12.41⁎O 0.442⁎ 0.382⁎ 0.000 0.050 0.036 0.000 0.000 0.089 0.005 0.000 0.000 0.001 0.050 0.006 – 0.42 1.39 0.00 0.00 0.00 4.67 0.85 4.48 0.00 16.22⁎⁎ 11.39⁎P 0.357⁎ 0.295⁎ 0.000 0.050 0.041 0.000 0.000 0.078 0.000 0.001 0.000 0.021 0.050 0.000 0.000 – 1.69 0.54 0.00 0.00 6.62 3.27 4.09 2.19 Inf⁎⁎ 17.45Q 0.191 0.124 0.000 0.239⁎ 0.206⁎ 0.000 0.000 0.000 0.000 0.079 0.010 0.101 0.239⁎ 0.000 0.002 0.000 – 1.48 1.08 0.00 2.90 3.96 8.68 4.85 16.84⁎⁎ 8.59⁎⁎⁎R 0.571⁎ 0.525⁎ 0.000 0.000 0.000 0.000 0.000 0.109 0.042 0.000 0.000 0.000 0.000 0.073 0.000 0.000 0.045 – 0.00 1.70 3.30 0.00 0.00 0.00 8.63⁎ 7.07⁎S 0.406⁎ 0.340 0.000 0.126 0.102 0.000 0.000 0.040 0.000 0.000 0.000 0.000 0.126 0.000 0.000 0.000 0.000 0.000 – 0.00 2.85 0.00 2.78 0.86 12.84⁎ 7.92⁎T 0.242 0.166 0.000 0.318 0.275 0.000 0.000 0.000 0.000 0.000 0.000 0.032 0.318 0.000 0.000 0.000 0.000 0.051 0.000 – 1.67 1.64 3.58 1.40 8.86⁎ 5.88⁎U 0.400⁎ 0.341⁎ 0.000 0.114 0.095 0.021 0.018 0.095 0.026 0.042 0.002 0.052 0.114⁎ 0.031 0.002 0.000 0.018 0.000 0.000 0.000 – 11.24⁎ 14.80⁎ 7.23⁎ 24.05⁎⁎ 11.47⁎V 0.623⁎⁎ 0.578⁎⁎ 0.000 0.000 0.000 0.041 0.012 0.215⁎ 0.097⁎ 0.000 0.000 0.004 0.000 0.101⁎ 0.000 0.024 0.109 0.000 0.000 0.028 0.050 – 0.00 0.64 Inf⁎⁎ 18.59⁎⁎W 0.786⁎⁎ 0.764⁎⁎ 0.000 0.000 0.000 0.080 0.052 0.285⁎⁎ 0.191⁎ 0.008 0.050 0.034 0.000 0.236⁎ 0.050 0.050 0.239⁎ 0.000 0.126 0.318 0.114⁎ 0.000 – 2.20 Inf⁎⁎ 16.83⁎⁎X 0.580⁎ 0.534⁎ 0.000 0.050 0.036 0.040 0.022 0.161⁎ 0.086 0.007 0.000 0.018 0.050 0.107 0.000 0.024 0.090 0.000 0.007 0.054 0.036 0.000 0.050 – 14.91⁎ 11.82⁎Y 0.297⁎ 0.285⁎ 0.25 0.483⁎⁎ 0.458⁎⁎ 0.441⁎⁎ 0.452⁎⁎ 0.352⁎ 0.361⁎ 0.504⁎⁎ 0.386⁎ 0.469⁎⁎ 0.483⁎⁎ 0.364⁎ 0.382⁎ 0.475⁎⁎ 0.327⁎ 0.342⁎ 0.344⁎ 0.293 0.381⁎ 0.504⁎⁎ 0.483⁎ 0.396⁎ – 21.45⁎⁎Z 0.495⁎ 0.468⁎ 0.321 0.714⁎⁎ 0.682⁎ 0.650⁎⁎ 0.669⁎⁎ 0.525⁎ 0.544⁎ 0.729⁎⁎ 0.575⁎ 0.690⁎⁎ 0.714⁎⁎ 0.557⁎⁎ 0.562⁎ 0.683⁎⁎ 0.483⁎ 0.480⁎ 0.504⁎ 0.422⁎ 0.542⁎ 0.726⁎ 0.714⁎⁎ 0.575⁎ 0.316⁎ –
(a1)
A B C D E F G H I J K L M N O P Q R S T U V W X Y Z
AA 0.818⁎⁎ 0.809⁎⁎ 0.773⁎ 0.917⁎⁎ 0.906⁎⁎ 0.886⁎⁎ 0.895⁎⁎ 0.830⁎⁎ 0.845⁎⁎ 0.918⁎⁎ 0.865⁎⁎ 0.906⁎⁎ 0.917⁎⁎ 0.853⁎⁎ 0.857⁎⁎ 0.897⁎⁎ 0.821⁎⁎ 0.831⁎⁎ 0.836⁎⁎ 0.803⁎ 0.848⁎⁎ 0.918⁎⁎ 0.917⁎⁎ 0.865⁎⁎ 0.545⁎⁎ 0.504⁎⁎BB 0.816⁎⁎ 0.806⁎⁎ 0.766⁎ 0.923⁎⁎ 0.912⁎⁎ 0.888⁎⁎ 0.899⁎⁎ 0.828⁎⁎ 0.846⁎⁎ 0.922⁎⁎ 0.869⁎⁎ 0.910⁎⁎ 0.923⁎⁎ 0.855⁎⁎ 0.859⁎⁎ 0.899⁎⁎ 0.819⁎⁎ 0.832⁎⁎ 0.838⁎⁎ 0.800⁎⁎ 0.849⁎⁎ 0.922⁎⁎ 0.923⁎⁎ 0.869⁎⁎ 0.523⁎⁎ 0.425⁎⁎CC 0.720⁎ 0.700⁎⁎ 0.597⁎ 0.893⁎⁎ 0.876⁎⁎ 0.848⁎⁎ 0.861⁎⁎ 0.756⁎⁎ 0.778⁎⁎ 0.895⁎⁎ 0.808⁎⁎ 0.876⁎⁎ 0.893⁎⁎ 0.790⁎⁎ 0.796⁎⁎ 0.865⁎⁎ 0.730⁎⁎ 0.738⁎⁎ 0.754⁎⁎ 0.682⁎ 0.783⁎⁎ 0.894⁎⁎ 0.893⁎⁎ 0.808⁎⁎ 0.338⁎ 0.217⁎DD 0.871⁎⁎ 0.865⁎⁎ 0.852⁎ 0.948⁎⁎ 0.941⁎⁎ 0.910⁎⁎ 0.922⁎⁎ 0.865⁎⁎ 0.884⁎⁎ 0.941⁎⁎ 0.909⁎⁎ 0.935⁎⁎ 0.948⁎⁎ 0.894⁎⁎ 0.899⁎⁎ 0.916⁎⁎ 0.869⁎⁎ 0.891⁎⁎ 0.889⁎⁎ 0.865⁎⁎ 0.890⁎⁎ 0.940⁎⁎ 0.948⁎⁎ 0.909⁎⁎ 0.363⁎ 0.612⁎⁎EE 0.938⁎ 0.936⁎ 1.000 1.000⁎⁎ 1.000⁎⁎ 0.945⁎⁎ 0.962⁎ 0.900⁎ 0.935⁎ 0.977⁎⁎ 0.981⁎⁎ 0.980⁎⁎ 1.000⁎⁎ 0.952⁎⁎ 0.962⁎⁎ 0.944⁎⁎ 0.929⁎⁎ 1.000⁎⁎ 0.973⁎⁎ 0.962⁎⁎ 0.947⁎⁎ 0.976⁎⁎ 1.000⁎⁎ 0.981⁎⁎ 0.25 0.535⁎FF 0.944⁎ 0.943⁎ 1.000⁎ 1.000⁎⁎ 1.000⁎⁎ 0.947⁎⁎ 0.963⁎⁎ 0.905⁎⁎ 0.938⁎⁎ 0.978⁎⁎ 0.982⁎⁎ 0.981⁎⁎ 1.000⁎⁎ 0.955⁎⁎ 0.965⁎⁎ 0.945⁎⁎ 0.935⁎⁎ 1.000⁎⁎ 0.976⁎⁎ 0.966⁎⁎ 0.950⁎⁎ 0.977⁎⁎ 1.000⁎⁎ 0.982⁎⁎ 0.281 0.571⁎⁎
(a2)
116O.J.Sepulveda-V
illetet
al./Journal
ofGreat
LakesResearch
35(2009)
107–119
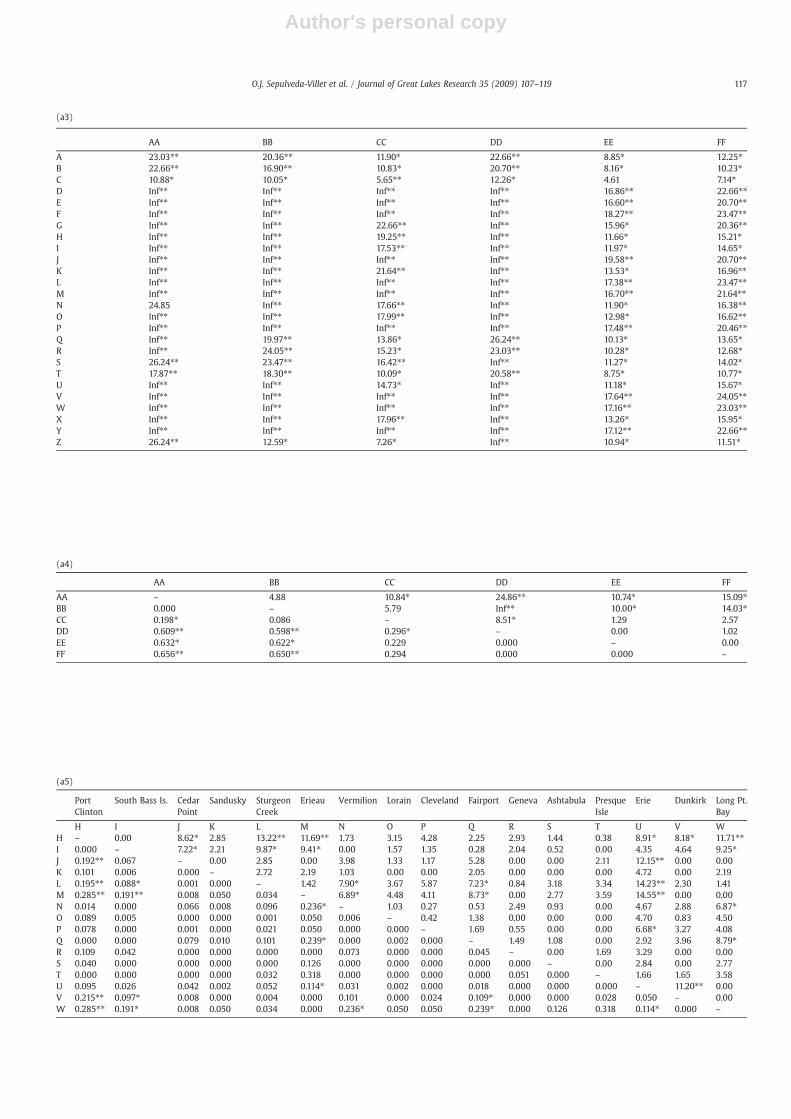
Author's personal copy
PortClinton
South Bass Is. CedarPoint
Sandusky SturgeonCreek
Erieau Vermilion Lorain Cleveland Fairport Geneva Ashtabula PresqueIsle
Erie Dunkirk Long Pt.Bay
H I J K L M N O P Q R S T U V WH – 0.00 8.62⁎ 2.85 13.22⁎⁎ 11.69⁎⁎ 1.73 3.15 4.28 2.25 2.93 1.44 0.38 8.91⁎ 8.18⁎ 11.71⁎⁎I 0.000 – 7.22⁎ 2.21 9.87⁎ 9.41⁎ 0.00 1.57 1.35 0.28 2.04 0.52 0.00 4.35 4.64 9.25⁎J 0.192⁎⁎ 0.067 – 0.00 2.85 0.00 3.98 1.33 1.17 5.28 0.00 0.00 2.11 12.15⁎⁎ 0.00 0.00K 0.101 0.006 0.000 – 2.72 2.19 1.03 0.00 0.00 2.05 0.00 0.00 0.00 4.72 0.00 2.19L 0.195⁎⁎ 0.088⁎ 0.001 0.000 – 1.42 7.90⁎ 3.67 5.87 7.23⁎ 0.84 3.18 3.34 14.23⁎⁎ 2.30 1.41M 0.285⁎⁎ 0.191⁎⁎ 0.008 0.050 0.034 – 6.89⁎ 4.48 4.11 8.73⁎ 0.00 2.77 3.59 14.55⁎⁎ 0.00 0.00N 0.014 0.000 0.066 0.008 0.096 0.236⁎ – 1.03 0.27 0.53 2.49 0.93 0.00 4.67 2.88 6.87⁎O 0.089 0.005 0.000 0.000 0.001 0.050 0.006 – 0.42 1.38 0.00 0.00 0.00 4.70 0.83 4.50P 0.078 0.000 0.001 0.000 0.021 0.050 0.000 0.000 – 1.69 0.55 0.00 0.00 6.68⁎ 3.27 4.08Q 0.000 0.000 0.079 0.010 0.101 0.239⁎ 0.000 0.002 0.000 – 1.49 1.08 0.00 2.92 3.96 8.79⁎R 0.109 0.042 0.000 0.000 0.000 0.000 0.073 0.000 0.000 0.045 – 0.00 1.69 3.29 0.00 0.00S 0.040 0.000 0.000 0.000 0.000 0.126 0.000 0.000 0.000 0.000 0.000 – 0.00 2.84 0.00 2.77T 0.000 0.000 0.000 0.000 0.032 0.318 0.000 0.000 0.000 0.000 0.051 0.000 – 1.66 1.65 3.58U 0.095 0.026 0.042 0.002 0.052 0.114⁎ 0.031 0.002 0.000 0.018 0.000 0.000 0.000 – 11.20⁎⁎ 0.00V 0.215⁎⁎ 0.097⁎ 0.008 0.000 0.004 0.000 0.101 0.000 0.024 0.109⁎ 0.000 0.000 0.028 0.050 – 0.00W 0.285⁎⁎ 0.191⁎ 0.008 0.050 0.034 0.000 0.236⁎ 0.050 0.050 0.239⁎ 0.000 0.126 0.318 0.114⁎ 0.000 –
AA BB CC DD EE FF
A 23.03⁎⁎ 20.36⁎⁎ 11.90⁎ 22.66⁎⁎ 8.85⁎ 12.25⁎B 22.66⁎⁎ 16.90⁎⁎ 10.83⁎ 20.70⁎⁎ 8.16⁎ 10.23⁎C 10.88⁎ 10.05⁎ 5.65⁎⁎ 12.26⁎ 4.61 7.14⁎D Inf⁎⁎ Inf⁎⁎ Inf⁎⁎ Inf⁎⁎ 16.86⁎⁎ 22.66⁎⁎E Inf⁎⁎ Inf⁎⁎ Inf⁎⁎ Inf⁎⁎ 16.60⁎⁎ 20.70⁎⁎F Inf⁎⁎ Inf⁎⁎ Inf⁎⁎ Inf⁎⁎ 18.27⁎⁎ 23.47⁎⁎G Inf⁎⁎ Inf⁎⁎ 22.66⁎⁎ Inf⁎⁎ 15.96⁎ 20.36⁎⁎H Inf⁎⁎ Inf⁎⁎ 19.25⁎⁎ Inf⁎⁎ 11.66⁎ 15.21⁎I Inf⁎⁎ Inf⁎⁎ 17.53⁎⁎ Inf⁎⁎ 11.97⁎ 14.65⁎J Inf⁎⁎ Inf⁎⁎ Inf⁎⁎ Inf⁎⁎ 19.58⁎⁎ 20.70⁎⁎K Inf⁎⁎ Inf⁎⁎ 21.64⁎⁎ Inf⁎⁎ 13.53⁎ 16.96⁎⁎L Inf⁎⁎ Inf⁎⁎ Inf⁎⁎ Inf⁎⁎ 17.38⁎⁎ 23.47⁎⁎M Inf⁎⁎ Inf⁎⁎ Inf⁎⁎ Inf⁎⁎ 16.70⁎⁎ 21.64⁎⁎N 24.85 Inf⁎⁎ 17.66⁎⁎ Inf⁎⁎ 11.90⁎ 16.38⁎⁎O Inf⁎⁎ Inf⁎⁎ 17.99⁎⁎ Inf⁎⁎ 12.98⁎ 16.62⁎⁎P Inf⁎⁎ Inf⁎⁎ Inf⁎⁎ Inf⁎⁎ 17.48⁎⁎ 20.46⁎⁎Q Inf⁎⁎ 19.97⁎⁎ 13.86⁎ 26.24⁎⁎ 10.13⁎ 13.65⁎R Inf⁎⁎ 24.05⁎⁎ 15.23⁎ 23.03⁎⁎ 10.28⁎ 12.68⁎S 26.24⁎⁎ 23.47⁎⁎ 16.42⁎⁎ Inf⁎⁎ 11.27⁎ 14.02⁎T 17.87⁎⁎ 18.30⁎⁎ 10.09⁎ 20.58⁎⁎ 8.75⁎ 10.77⁎U Inf⁎⁎ Inf⁎⁎ 14.73⁎ Inf⁎⁎ 11.18⁎ 15.67⁎V Inf⁎⁎ Inf⁎⁎ Inf⁎⁎ Inf⁎⁎ 17.64⁎⁎ 24.05⁎⁎W Inf⁎⁎ Inf⁎⁎ Inf⁎⁎ Inf⁎⁎ 17.16⁎⁎ 23.03⁎⁎X Inf⁎⁎ Inf⁎⁎ 17.96⁎⁎ Inf⁎⁎ 13.26⁎ 15.95⁎Y Inf⁎⁎ Inf⁎⁎ Inf⁎⁎ Inf⁎⁎ 17.12⁎⁎ 22.66⁎⁎Z 26.24⁎⁎ 12.59⁎ 7.26⁎ Inf⁎⁎ 10.94⁎ 11.51⁎
(a3)
AA BB CC DD EE FF
AA – 4.88 10.84⁎ 24.86⁎⁎ 10.74⁎ 15.09⁎BB 0.000 – 5.79 Inf⁎⁎ 10.00⁎ 14.03⁎CC 0.198⁎ 0.086 – 8.51⁎ 1.29 2.57DD 0.609⁎⁎ 0.598⁎⁎ 0.296⁎ – 0.00 1.02EE 0.632⁎ 0.622⁎ 0.229 0.000 – 0.00FF 0.656⁎⁎ 0.650⁎⁎ 0.294 0.000 0.000 –
(a4)
(a5)
117O.J. Sepulveda-Villet et al. / Journal of Great Lakes Research 35 (2009) 107–119
Author's personal copy
References
Angers, B., Bernatchez, L., 1998. Combined use of SMM and non-SMM methods to inferfine structure and evolutionary history of closely related brook charr (Salvelinusfontinalis, Salmonidae) populations from microsatellites. Mol. Biol. Evol. 15,143–159.
Avise, J.C., 2004. Molecular Markers, Natural History and Evolution. Chapman and Hall,New York.
Bailey, R.M., Smith, G.R., 1981. Origin and geography of the fish fauna of the LaurentianGreat Lakes basin. Can. J. Fish Aquat. Sci. 38, 1539–1561.
Balloux, F., Lugon-Moulin, N., 2002. The estimation of population differentiation withmicrosatellite markers. Mol. Ecol. 11, 155–165.
Berendzen, P.B., Simons, A.M., Wood, R.M., 2003. Phylogeography of the northernhogsucker, Hypentelium nigricans (Teleostei: Cypriniformes): genetic evidence forthe existence of the ancient Teays River. J. Biogeogr. 30, 1139–1152.
Bernatchez, L., Wilson, C.C., 1998. Comparative phylogeography of Nearctic andPalearctic fishes. Mol. Ecol. 7, 431–452.
Bernatchez, L., Gyuomark, R., Bonhomme, F., 1992. Sequence variation of themitochondrial control region among geographically and morphologically remoteEuropean brown trout (Salmo trutta) populations. Mol. Ecol. 1, 161–173.
Billington, N., 1993. Genetic variation in Lake Erie yellow perch (Perca flavescens)demonstrated by mitochondrial DNA analysis. J. Fish Biol. 43, 941–943.
Billington, N., Hebert, P.D.N., 1991. Mitochondrial DNA diversity in fishes and itsimplications for introductions. Can. J. Fish Aquat. Sci. 48, 80–94.
Billington, N., Barrette, R.J., Hebert, P.D.N., 1992. Management implications of mitochon-drial DNA variation in walleye stocks. North Am. J. Fish. Manage. 12, 276–284.
Bodaly, R.A., Ward, R.D., Mills, C.A., 1989. A genetic stock study of perch, Perca fluviatilis,in Windermere. J. Fish Biol. 34, 965–967.
Bronte, C.R., Selgeby, J.H., Swedberg, D.V., 1993. Dynamics of a yellow perch populationin Lake Superior. North Am. J. Fish. Manage. 12, 511–523.
Brown, B., Wang, H.P., Givens, C., Wallet, G., 2007. Yellow perch strain evaluation I:genetic variance of six broodstock populations. Aquaculture 271, 142–151.
Clapp, D.F., Dettmers, J.M., 2004. Fisheries research and management in Lake Michigan:evaluating progress in a cooperative effort, 1997–2001. Fisheries 29, 11–20.
Clement, M., Posada, D., Crandall, K., 2000. TCS: a computer program to estimate genegenealogies. Mol. Ecol. 9, 1657–1660.
Craig, J.F., 2000. Percid Fishes: Systematics, Ecology and Exploitation. Blackwell Science,Ltd, Oxford, UK.
Crespi, E.J., Rissler, L.J., Browne, R.A., 2003. Testing Pleistocene refugia theory:phylogeographical analysis of Desmognathus wrighti, a high-elevation salamanderin the southern Appalachians. Mol. Ecol. 12, 969–984.
Crossman, E.J., McAllister, D.E., 1986. Zoogeography of freshwater fishes of the HudsonBay drainage, Ungava Bay and the Artic Archipelago. In: Hocutt, C.H., Wiley, E.O.(Eds.), The Zoogeography of North American Freshwater Fishes. John Wiley andSons, New York, pp. 53–104.
Danzmann, R.G., Morgan II, R.P., Jones, M.W., Bernatchez, L., Ihssen, P.E., 1998. A majorsextet of mitochondrial DNA phylogenetic assemblages extant in eastern NorthAmerican brook trout (Salvelinus fontinalis): distribution and post-glacial dispersalpatterns. Can. J. Zool. 76, 1300–1318.
Excoffier, L., 1994. The statistical analysis of molecular data for inferring populationgenetic structure: the Amova framework. In: Perrin, N., Keller, L., Goudet, J. (Eds.),Bull. Soc. Vaud. Sc. Nat. Evolution of Structured Populations, 83, pp. 159–160.
Excoffier, L., Laval, G., Schneider, S., 2005. Arlequin ver. 3.0: an integrated softwarepackage for population genetics data analysis. Evol. Bioinformatics Online 1, 47–50.
Faber, J.E., Stepien, C.A., 1997. The utility of mitochondrial DNA control region sequencesfor analyzing phylogenetic relationships among populations, species, and genera ofthe Percidae. In: Kocher, T.D., Stepien, C.A. (Eds.), Molecular Systematics of Fishes.Academic Press, San Diego, California, pp. 199–218.
Faber, J.E., Stepien, C.A., 1998. Tandemly repeated sequences in the mitochondrial DNAcontrol region and phylogeography of the pike-perches Stizostedion. Mol.Phylogenet. Evol. 10, 310–323.
Felsenstein, J., 1985. Confidence limits on phylogenies: an approach using the bootstrap.Evolution 39, 783–791.
Ford, A.M., Stepien, C.A., 2004. Genetic variation and spawning population structure inLake Erie yellow perch, Perca flavescens: a comparison with a Maine population. In:Barry, T.P., Malison, J.A. (Eds.), Proceedings of Percis III, the 3rd InternationalSymposium on Percid Fishes. University of Wisconsin Sea Grant Institute, Madison,Wisconsin, pp. 131–132.
Fulford, R.S., Rice, J.A., Miller, T.J., Binkowski, F.P., 2006. Elucidating patterns of size-dependent predation on larval yellow perch (Perca flavescens) in Lake Michigan: anexperimental and modeling approach. Can. J. Fish Aquat. Sci. 63, 11–27.
Fullerton, A.H., Lamberti, G.A., 2006. A comparison of habitat use and habitat-specificfeeding efficiency by Eurasian ruffe (Gymnocephalus cernuus) and yellow perch(Perca flavescens). Ecol. Freshw. Fish 15, 1–9.
Gatt, M.H., Ferguson, M.M., Liskauskas, A.P., 2000. Comparison of control regionsequencing and fragment RFLP analysis for resolving mitochondrial DNA variationand phylogenetic relationships among Great Lakes walleyes. Trans. Am. Fish. Soc.129, 1288–1299.
Gonzalez, M.J. 2006. Competitive interactions between yellow perch and round goby.Lake Erie Protection Fund project report. Toledo, Ohio: Ohio Lake Erie Commission(http://www.epa.state.oh.us/oleo/Grant/freports/smallfinals/2004/sg234-04.pdf).
Great Lakes Fishery Commission, 2004. Annual Report of the Lake Erie Yellow PerchTask Group. Lake Erie Commission, Great Lakes Fishery Commission, Windsor,Ontario.
Great Lakes Fishery Commission, 2006. Lake Erie Committee Executive Summary. LakeErie Commission, Great Lakes Fishery Commission, Windsor, Ontario.
Great Lakes Fishery Commission, 2007a. Catch Limits Set for Walleye and Yellow Perchfor 2007. Lake Erie Commission, Great Lakes Fishery Commission, Windsor, Ontario.
Great Lakes Fishery Commission, 2007b. Annual Report of the Lake Erie Yellow PerchTask Group. Lake Erie Commission, Great Lakes Fishery Commission, Windsor,Ontario.
Great Lakes Fishery Commission, 2008a. Status of Yellow Perch in Lake Michigan andYellow Perch Task Group Progress Report. Report to the Lake Michigan Committee.Lake Michigan Committee, Great Lakes Fishery Commission, Niagara Falls, Ontario.
Great Lakes Fishery Commission, 2008b. Lake Erie Committee Executive Summary. LakeErie Commission, Great Lakes Fishery Commission, Windsor, Ontario.
Gyllensten, U., Ryman, N., Stahl, G., 1985. Monomorphism of allozymes in perch (Percafluviatilis L.). Hereditas 102, 57–61.
Hall, T.A., 1999. BioEdit: a user-friendly biological sequence alignment editor andanalysis program for Windows 95/98/NT. Nucleic Acids Symp. Ser. 41, 95–99.
Haponski, A.E., and Stepien, C.A. 2008. Molecular, morphological, and biogeographicresolution of cryptic taxa in the greenside darter Etheostoma blennioides complex.Mol. Phyl. Evol. 49, 69–83.
Hartl, D.L., 1988. A Primer of Population Genetics. Sinauer Associates, Inc, Sunderland,Massachusetts.
Hartman, W.L., Nepszy, S.J., Scholl, R.L., 1980. Minimum size limits for yellow perchPerca flavescens in western Lake Erie, Canada, USA. Great Lakes Fishery CommissionTech. Report 39, 1–32.
Henderson, B.A., Nepszy, S.J., 1989. Recruitment of yellow perch Perca flavescens affectedby stock size and water temperature in lakes Erie and St. Clair 1965–85. J. GreatLakes Res. 14, 205–215.
Jude, D.J., Reider, R.H., Smith, G.R., 1992. Establishment of Gobiidae in the Great Lakesbasin. Can. J. Fish Aquat. Sci. 49, 416–421.
Kenyon, R., Murray, C., 2001. A Review of the Lake Erie and Presque Isle Bay Yellow PerchSport Angling Fisheries, 1997–2001. Pennsylvania Fish and Boat Commission, LakeErie Research Unit, Fairview, PA.
Kimura, M., 1980. A simple method for estimating evolutionary rate of base substitutionthrough comparative studies of nucleotide sequences. J. Mol. Evol. 16, 111–120.
Kocher, T.D., Thomas, W.K., Meyer, A., Edwards, S.V., Paabo, S., Villablanca, F.X., Wilson,A.C., 1989. Dynamics of mitochondrial DNA evolution in animals: amplification andsequencing with conserved primers. Proc. Nat. Acad. Sci. U. S. A. 86, 6196–6200.
Lauer, T.E., Doll, J.C., Allen, P.J., Breidert, B., Palla, J., 2008. Changes in yellow perch lengthfrequencies and sex ratios following closure of the commercial fishery andreduction in sport bag limits in southern Lake Michigan. Fish. Mgt. Ecol. 15, 39–47.
Leary, R., Booke, H.E., 1982. Genetic stock analysis of yellow perch from Green Bay andLake Michigan. Trans. Am. Fish. Soc. 111, 52–57.
LeClerc, E., Mailhot, Y., Mingelbier, M., Bernatchez, L., 2008. The landscape genetics ofyellow perch (Perca flavescens) in a large fluvial ecosystem.Mol. Ecol. 17, 1702–1717.
Lee, D.S., Gilbert, C.R., Hocutt, C.H., Jenkins, R.E., McAllister, D.E., and Stauffer, J.R., Jr.1980. Atlas of North American Freshwater Fishes. North Carolina Biological SurveyPublication 1980-12. Raleigh, North Carolina: North Carolina State Museum ofNatural History. (with 1993 Supplement by Lee, D.S., Platania, S.P., and Burgess, G.H.North Carolina Biological Survey Contribution 1983-6).
Mandrak, N.E., Crossman, E.J., 1992. Postglacial dispersal of freshwater fishes intoOntario. Can. J. Zool. 70, 2247–2259.
Mantel, N., 1967. The detection of disease clustering and a generalized regressionapproach. Cancer Res. 27, 209–220.
Marsden, J.E., Robillard, S.R., 2004. Decline of yellow perch in southwestern LakeMichigan, 1987–1997. North Am. J. Fish. Manage. 24, 952–967.
Martin, A.P., Humphreys, R., Palumbi, S.R., 1992. Population genetic structure of thearmorhead, Psudopentaceros wheeleri, in the North Pacific Ocean: application tofisheries problems. Can. J. Fish Aquat. Sci. 49, 2386–2391.
McPhail, J.D., Lindsey, C.C., 1970. Freshwater fishes of northwestern Canada and Alaska.Fish. Res. Board Can. Bull. 173, 1–381.
Miller, L.M., 2003. Microsatellite DNA loci reveal genetic structure of yellow perch inLake Michigan. Trans. Am. Fish. Soc. 132, 503–513.
Moritz, C., Faith, D.P., 1998. Comparative phylogeography and the identification ofgenetically divergent areas for conservation. Mol. Ecol. 7, 419–429.
Moyer, G.R., Billington, N., 2004. A survey of genetic variation among yellow perch(Perca flavescens) populations determined from allozyme and mitochondrial DNAdata. In: Barry, T.P., Malison, J.A. (Eds.), Proceedings of Percis III, the 3rdInternational Symposium on Percid Fishes. University of Wisconsin Sea GrantInstitute, Madison, Wisconsin, pp. 93–94.
Munawar, M., Munawar, I.F., Mandrak, N.E., Fitzpatrick, M., Dermott, R., Leach, J., 2005.An overview of the impact of non-indigenous species on the food web integrity ofNorth American Great Lakes: Lake Erie example. Aquat. Ecosyst. Health Manag. 8,375–395.
Near, T.J., Benard, M.F., 2004. Rapid allopatric speciation in logperch darters (Percidae:Percina). Evolution 58, 2798–2808.
Nei, M., 1987. Molecular Evolutionary Genetics. Columbia University Press, New York.Nesbo, C.L., Magnhagen, C., Jakobsen, K.S., 1998. Genetic differentiation among
stationary and anadromous perch (Perca fluviatilis) in the Baltic Sea. Hereditas129, 241–249.
Nesbo, C.L., Fossheim, T., Vollestad, L.A., Jakobsen, K.S., 1999. Genetic divergenceand phylogeographic relationships among European perch (Perca fluviatilis)populations reflect glacial refugia and postglacial colonization. Mol. Ecol. 8,1387–1404.
Parrish, D.L., Margraf, F.J., 1990. Interactions between white perch (Morone americana)and yellow perch (Perca flavescens) in Lake Erie as determined from feeding andgrowth. Can. J. Fish Aquat. Sci. 47, 1779–1787.
118 O.J. Sepulveda-Villet et al. / Journal of Great Lakes Research 35 (2009) 107–119
Author's personal copy
Posada,D., Crandall, K.A., Templeton,A.R., 2000.GeoDis: a program for the cladistic analysisof the geographical distribution of genetic haplotypes. Mol. Ecol. 9, 487–488.
Posada, D., Crandall, K.A., Templeton, A.R., 2006. Nested clade analysis statistics. Mol.Ecol. Notes 6, 590–593.
Pratt, D.M., Blust, W.H., Selgeby, J.H., 1992. Ruffe, Gymnocephalus cernuus: newlyintroduced in North America. Can. J. Fish Aquat. Sci. 49, 1616–1618.
Raymond, M., Rousset, F., 1995. Genepop (Version 1.2): population genetics software forexact tests and ecumenicism. J. Heredity 86, 248–249.
Refseth, U.H., Nesbo, C.L., Stacy, J.E., Vollestad, L.A., Fjeld, E., Jakobsen, K.S., 1998. Geneticevidence for different migration routes of freshwater fish into Norway revealed byanalysis of current perch (Perca fluviatilis) populations in Scandinavia. Mol. Ecol. 7,1015–1027.
Rice, W.R., 1989. Analyzing tables of statistical tests. Evolution 43, 223–225.Rousset, F., 1997. Genetic differentiation and estimation of gene flow from F-statistics
under isolation by distance. Genetics 145, 1219–1228.Rousset, F., 2008. Genepop ‘007: a complete re-implementation of the Genepop
software for Windows and Linux. Mol. Ecol. Res. 8, 103–106.Ryan, P.A., Knight, R., MacGregor, R., Towns, G., Hoopes, R., Culligan, W., 2003. Fish-
community goals and objectives for Lake Erie. Great Lakes Fish. Comm. Spec. Publ.03-02, pp 1–56. Great Lakes Fishery Commission, Ann Arbor, Michigan.
Saitou, N., Nei, M., 1987. The neighbor-joiningmethod: a newmethod for reconstructingphylogenetic trees. Mol. Biol. Evol. 4, 406–425.
Scott, W.B., Crossman, E.J., 1973. Freshwater Fishes of Canada. Canadian GovernmentPublishing Centre, Ottawa, Canada.
Shroyer, S.M., McComish, T.S., 2000. Relationship between alewife abundance andyellow perch recruitment in southern Lake Michigan. North Am. J. Fish. Manage. 20,220–225.
Stepien, C.A., Faber, J.E., 1998. Population genetic structure, phylogeography, andspawning philopatry in walleye (Stizostedion vitreum) from mtDNA control regionsequences. Mol. Ecol. 7, 1757–1769.
Stepien, C.A., Dillon, A.K., Chandler, M.D., 1998. Genetic identity, phylogeography, andsystematics of ruffe Gymnocephalus in the North American Great Lakes and Eurasia.J. Great Lakes Res. 24, 361–378.
Stepien, C.A., Brown, J.E., Neilson, M.E., Tumeo, M.A., 2005. Genetic diversity of invasivespecies in the Great Lakes versus their Eurasian source populations: insights for riskanalysis. Risk Anal. 25, 1043–1060.
Stepien, C.A., Taylor, C.D., Einhouse, D.W., 2004. An analysis of genetic risk to a nativespawning stock of walleye Sander vitreus (Stizostedion vitreum) due to stocking inCattaraugus Creek. In: Barry, T.P., Malison, J.A. (Eds.), Proceedings of Percis III, the
3rd International Symposium on Percid Fishes. University of Wisconsin Sea GrantInstitute, Madison, WI, pp. 93–94.
Stepien, C.A., Murphy, D., Strange, R.M., 2007. Broad- to fine-scale population geneticpatterning in the smallmouth bass Micropterus dolomieu across the LaurentianGreat Lakes and beyond: an interplay of behavior and geography. Mol. Ecol. 16,1605–1624.
Strange, R.M., Stepien, C.A., 2007. Genetic divergence and connectivity among river andreef spawning populations of walleye (Sander vitreus) in Lake Erie. Can J. Fish Aquat.Sci. 64, 437–448.
Strittholt, J.R., Guttman, S.I., Wissing, T.E., 1988. Low levels of genetic variability ofyellow perch (Perca flavescens) in Lake Erie and selected impoundments. In:Downhower, J.E. (Ed.), The Biogeography of the Island Region of Western Lake Erie.Ohio State University Press, Columbus, Ohio, pp. 246–257.
Tamura, K., Dudley, J., Nei, M., Kumar, S., 2007. Mega 4: Molecular Evolutionary GeneticsAnalysis (MEGA) software version 4.0. Mol. Biol. Evol. 24, 1596–1599.
Templeton, A.R., Routman, E., Phillips, C.A., 1995. Separating population structure frompopulation history: a cladistic analysis of the geographical distribution ofmitochondrial DNA haplotypes in the tiger salamander, Ambystoma tigrinum.Genetics 140, 767–782.
Todd, N., Hatcher, C.O., 1993. Genetic variability and glacial origins of yellow perch(Perca flavescens) in North America. Can. J. Fish Aquat. Sci. 50, 1828–1834.
Trautman, M.B., 1981. The Fishes of Ohio. Ohio State University Press, Columbus,Ohio.
Turgeon, J., Bernatchez, L., 2001a. Mitochondrial DNA phylogeography of lake cisco(Coregonus artedi): evidence supporting extensive secondary contacts between twoglacial races. Mol. Ecol. 10, 987–1001.
Turgeon, J., Bernatchez, L., 2001b. Clinal variation at microsatellite loci reveals historicalsecondary intergradation between glacial races of Coregonus artedi (Teleostei:Coregoninae). Evolution 55, 2274–2286.
Tyson, J.T., Knight, R.L., 2001. Response of yellow perch to changes in the benthicinvertebrate community of western Lake Erie. Trans. Am. Fish. Soc. 130,766–782.
Weir, B.S., Cockerham, C.C., 1984. Estimating F-statistics for the analysis of populationstructure. Evolution 38, 1358–1370.
Wilberg, M.J., Bence, J.R., Eggold, B.T., Makauskas, D., Clapp, D.F., 2005. Yellow perchdynamics in southwestern Lake Michigan during 1986–2002. North Am. J. Fish.Manage. 25, 1130–1152.
Wilson, C.C., Hebert, P.D.N., 1996. Phylogeographic origins of lake trout (Salvelinusnamaycush) in eastern North America. Can. J. Fish Aquat. Sci. 53, 2764–2775.
119O.J. Sepulveda-Villet et al. / Journal of Great Lakes Research 35 (2009) 107–119
Copyright © 2022 FDOKUMEN