Farm-based Production Parameters and Breakeven Costs for Yellow Perch Grow-out in Ponds in Southern...
17
Farm-based Production Parameters and Break- even Costs for Yellow Perch Grow-out in Ponds in Southern Wisconsin By Jeffrey A. Malison and James A. Held University of Wisconsin-Madison Aquaculture Program Department of Animal Sciences Madison, WI 53706 and University of Wisconsin-Stevens Point Northern Aquaculture Demonstration Facility Stevens Point, WI 5448 Technical Bulletin Series #2 In cooperation with USDA’s Cooperative State Research, Education and Extension Service USDA Grant 2006 45079 03535 University of Wisconsin Extension August 2008
-
Upload
independent -
Category
Documents
-
view
0 -
download
0
Transcript of Farm-based Production Parameters and Breakeven Costs for Yellow Perch Grow-out in Ponds in Southern...
Farm-based Production Parameters and Breakeven Costs for Yellow Perch Grow-out in Ponds in Southern Wisconsin — �
Farm-based Production Parameters and Break-even Costs for Yellow Perch Grow-out in Ponds in
Southern Wisconsin
By Jeffrey A. Malison and James A. HeldUniversity of Wisconsin-Madison
Aquaculture ProgramDepartment of Animal Sciences
Madison, WI 53706
and
University of Wisconsin-Stevens PointNorthern Aquaculture Demonstration Facility
Stevens Point, WI 5448�
Technical Bulletin Series #�2�
In cooperation with USDA’s Cooperative State Research, Education and Extension Service
USDA Grant 2006 45079 03535University of Wisconsin Extension
August 2008
2 — Farm-based Production Parameters and Breakeven Costs for Yellow Perch Grow-out in Ponds in Southern Wisconsin
Production Parameters
IntroductionFor over 30 years the yellow perch (Perca fla-vescens) has been viewed as a species with great potential for aquaculture in the North Central Region (NCR). The species has been the focus of a significant amount of research over this period, and has been a priority species for research sponsored by the North Central Regional Aquaculture Center (NCRAC) since its inception in �988. De-spite these efforts almost no information has been available on “real world” produc-tion parameters and costs of raising yellow perch to market size using different system types. The lack of such basic information on production costs is a primary reason for the failure of numerous yellow perch operations in the NCR.
In the mid-�990s, two scientists (Jean Rosscup Riepe, then at Purdue University, and Harvey Hoven, then at University of
Wisconsin-Superior) developed enterprise budgets for raising yellow perch in ponds, net pens and recirculating aquaculture sys-tems (Riepe, �997a,b; Hoven �998). These models, although useful, had significant limitations because they used theoretical or “best guess” estimates for many production parameters including growth rates, food conversions, rearing densities, and survivals. Clearly, these parameters have an overarch-ing effect on production costs. Recognizing the limitations of the budgets developed by Riepe and Hoven, NCRAC funded a major re-search effort from 200� to 2004, the primary goal of which was to gather information on “actual” production parameters and costs of raising yellow perch to market size using different system types. This publication is a detailed summary of the information col-lected on pond culture systems.
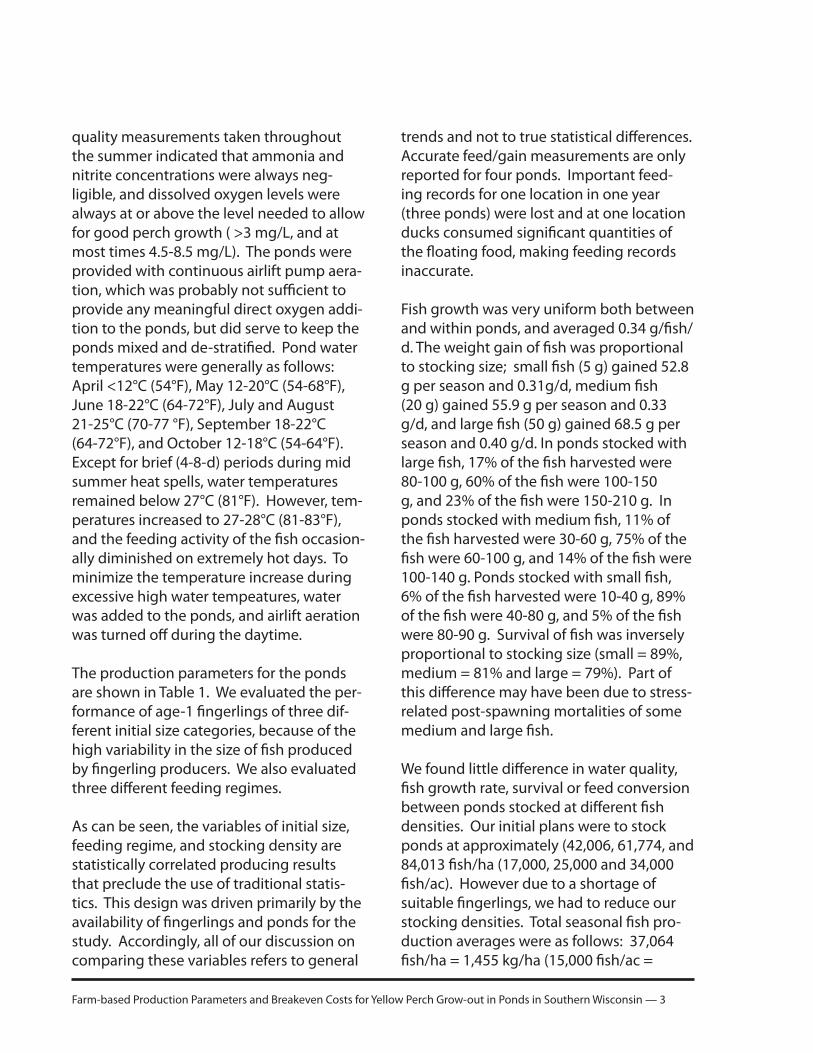
We conducted yellow perch grow-out trials in �7 ponds in a three-year period (2002-2004). The ponds were located at Coolwater Farms, LLC, Deerfield, (CWF) and at the Lake Mills State Fish Hatchery, Lake Mills, (LMSFH), two locations in south-central Wis-consin about ��.3 km (7 miles) apart. The ponds ranged in size 0.04-0.6� ha (0.�-�.5 ac), and were sloped from approximately 0.9 m (3 ft) deep at the shallow end to �.8-2.4 m (6-8 ft) deep at the deep end. Ponds were stocked with uniformly size-graded, feed-trained fingerlings in April, and were harvested in October at the end of the growing season (growing season = approxi-mately �90 d). It should be pointed out that the fish were monosex females (origi-
nally derived from Lake Mendota, Madison, Wisconsin), which many studies have shown grow faster than mixed sex perch. Fish were fed daily using a standard floating trout grower diet (Silver Cup steelhead �.5 mm or trout 3.5 mm; Nelson and Sons, Inc., Mur-ray, Utah). The fish were fed at times of low light levels (dawn or dusk), and, in general, a strong feeding response was observed in all ponds.
The ponds had virtually no flow-through water, but water was added as needed to make up for evaporation and seepage. The water supply at CWF was well water at ��°C (52 °F), and at LMSFH was water from near-by Rock Lake at �2-�8°C (54-64°F). Water
Farm-based Production Parameters and Breakeven Costs for Yellow Perch Grow-out in Ponds in Southern Wisconsin — 3
quality measurements taken throughout the summer indicated that ammonia and nitrite concentrations were always neg-ligible, and dissolved oxygen levels were always at or above the level needed to allow for good perch growth ( >3 mg/L, and at most times 4.5-8.5 mg/L). The ponds were provided with continuous airlift pump aera-tion, which was probably not sufficient to provide any meaningful direct oxygen addi-tion to the ponds, but did serve to keep the ponds mixed and de-stratified. Pond water temperatures were generally as follows: April <�2°C (54°F), May �2-20°C (54-68°F), June �8-22°C (64-72°F), July and August 2�-25°C (70-77 °F), September �8-22°C (64-72°F), and October �2-�8°C (54-64°F). Except for brief (4-8-d) periods during mid summer heat spells, water temperatures remained below 27°C (8�°F). However, tem-peratures increased to 27-28°C (8�-83°F), and the feeding activity of the fish occasion-ally diminished on extremely hot days. To minimize the temperature increase during excessive high water tempeatures, water was added to the ponds, and airlift aeration was turned off during the daytime.
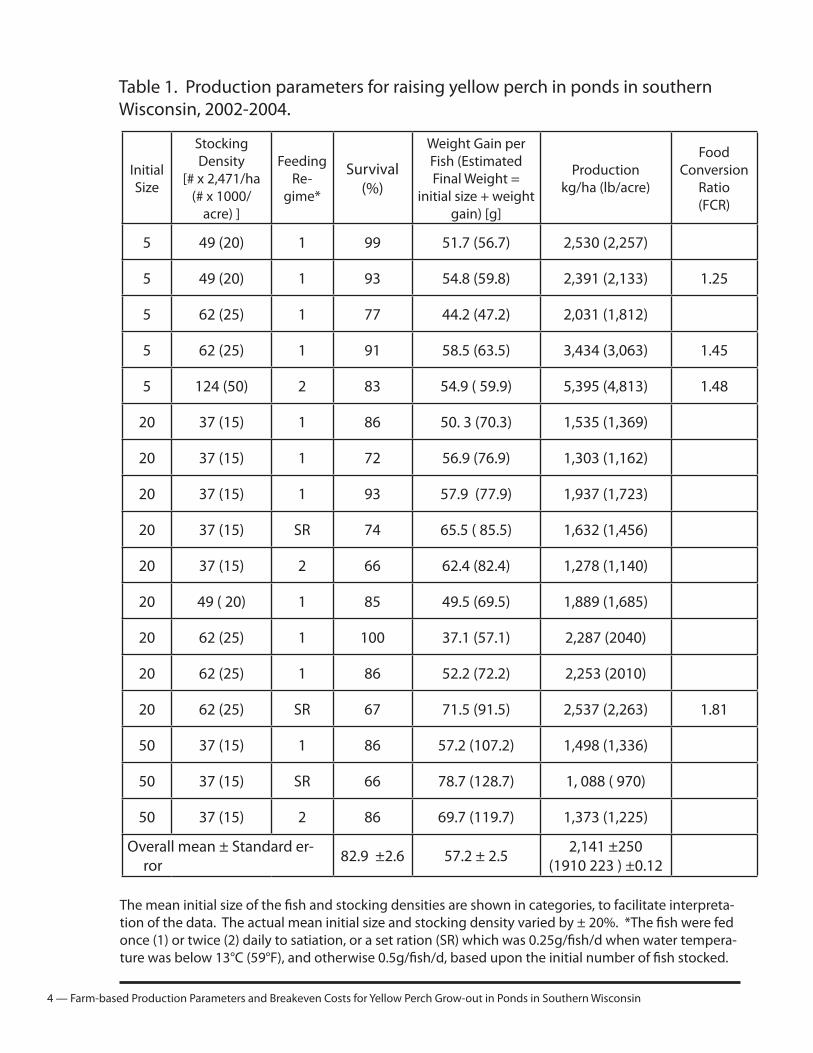
The production parameters for the ponds are shown in Table �. We evaluated the per-formance of age-� fingerlings of three dif-ferent initial size categories, because of the high variability in the size of fish produced by fingerling producers. We also evaluated three different feeding regimes.
As can be seen, the variables of initial size, feeding regime, and stocking density are statistically correlated producing results that preclude the use of traditional statis-tics. This design was driven primarily by the availability of fingerlings and ponds for the study. Accordingly, all of our discussion on comparing these variables refers to general
trends and not to true statistical differences. Accurate feed/gain measurements are only reported for four ponds. Important feed-ing records for one location in one year (three ponds) were lost and at one location ducks consumed significant quantities of the floating food, making feeding records inaccurate.
Fish growth was very uniform both between and within ponds, and averaged 0.34 g/fish/d. The weight gain of fish was proportional to stocking size; small fish (5 g) gained 52.8 g per season and 0.3�g/d, medium fish (20 g) gained 55.9 g per season and 0.33 g/d, and large fish (50 g) gained 68.5 g per season and 0.40 g/d. In ponds stocked with large fish, �7% of the fish harvested were 80-�00 g, 60% of the fish were �00-�50 g, and 23% of the fish were �50-2�0 g. In ponds stocked with medium fish, ��% of the fish harvested were 30-60 g, 75% of the fish were 60-�00 g, and �4% of the fish were �00-�40 g. Ponds stocked with small fish, 6% of the fish harvested were �0-40 g, 89% of the fish were 40-80 g, and 5% of the fish were 80-90 g. Survival of fish was inversely proportional to stocking size (small = 89%, medium = 8�% and large = 79%). Part of this difference may have been due to stress-related post-spawning mortalities of some medium and large fish.
We found little difference in water quality, fish growth rate, survival or feed conversion between ponds stocked at different fish densities. Our initial plans were to stock ponds at approximately (42,006, 6�,774, and 84,0�3 fish/ha (�7,000, 25,000 and 34,000 fish/ac). However due to a shortage of suitable fingerlings, we had to reduce our stocking densities. Total seasonal fish pro-duction averages were as follows: 37,064 fish/ha = �,455 kg/ha (�5,000 fish/ac =
4 — Farm-based Production Parameters and Breakeven Costs for Yellow Perch Grow-out in Ponds in Southern Wisconsin
Table �. Production parameters for raising yellow perch in ponds in southern Wisconsin, 2002-2004.
The mean initial size of the fish and stocking densities are shown in categories, to facilitate interpreta-tion of the data. The actual mean initial size and stocking density varied by ± 20%. *The fish were fed once (�) or twice (2) daily to satiation, or a set ration (SR) which was 0.25g/fish/d when water tempera-ture was below �3°C (59°F), and otherwise 0.5g/fish/d, based upon the initial number of fish stocked.
Initial Size
Stocking Density
[# x 2,47�/ha (# x �000/
acre) ]
Feeding Re-
gime*
Survival(%)
Weight Gain per Fish (Estimated Final Weight =
initial size + weight gain) [g]
Production kg/ha (lb/acre)
Food Conversion
Ratio(FCR)
5 49 (20) � 99 5�.7 (56.7) 2,530 (2,257)
5 49 (20) � 93 54.8 (59.8) 2,39� (2,�33) �.25
5 62 (25) � 77 44.2 (47.2) 2,03� (�,8�2)
5 62 (25) � 9� 58.5 (63.5) 3,434 (3,063) �.45
5 �24 (50) 2 83 54.9 ( 59.9) 5,395 (4,8�3) �.48
20 37 (�5) � 86 50. 3 (70.3) �,535 (�,369)
20 37 (�5) � 72 56.9 (76.9) �,303 (�,�62)
20 37 (�5) � 93 57.9 (77.9) �,937 (�,723)
20 37 (�5) SR 74 65.5 ( 85.5) �,632 (�,456)
20 37 (�5) 2 66 62.4 (82.4) �,278 (�,�40)
20 49 ( 20) � 85 49.5 (69.5) �,889 (�,685)
20 62 (25) � �00 37.� (57.�) 2,287 (2040)
20 62 (25) � 86 52.2 (72.2) 2,253 (20�0)
20 62 (25) SR 67 7�.5 (9�.5) 2,537 (2,263) �.8�
50 37 (�5) � 86 57.2 (�07.2) �,498 (�,336)
50 37 (�5) SR 66 78.7 (�28.7) �, 088 ( 970)
50 37 (�5) 2 86 69.7 (��9.7) �,373 (�,225)
Overall mean ± Standard er-ror 82.9 ±2.6 57.2 ± 2.5 2,�4� ±250
(�9�0 223 ) ±0.�2
Farm-based Production Parameters and Breakeven Costs for Yellow Perch Grow-out in Ponds in Southern Wisconsin — 5
�,298 lbs/ac); 49,4�9 fish/ha = 2,270 (20,000 fish/ac = 2,025 lbs/ac); and 6�,774 fish/ha = 2,509 kg/ha (25,000 fish/ac = 2,238 lbs/ac). These findings demonstrate the feasibil-ity of stocking yellow perch fingerlings for grow-out at densities as high as 6�,774 fish/ha (25,000 fish/ac). It also should be noted that in the one pond that was stocked at �23,548 fish/ha (50,000 fish/ac); we ob-served no problems with water quality and
fish growth rate and survival in this pond was similar to the ponds stocked at lower densities. Hence, higher stocking densities may be possible. We also found no differ-ences or trends in any production variable with regards to pond size.
It is difficult to compare the three feeding regimes because feeding regime is affected by initial stocking size, which had a notice-able effect on growth. Fish fed a set ration once daily, however, had growth rates that tended to be on the high side of our data set.
Enterprise Budgets
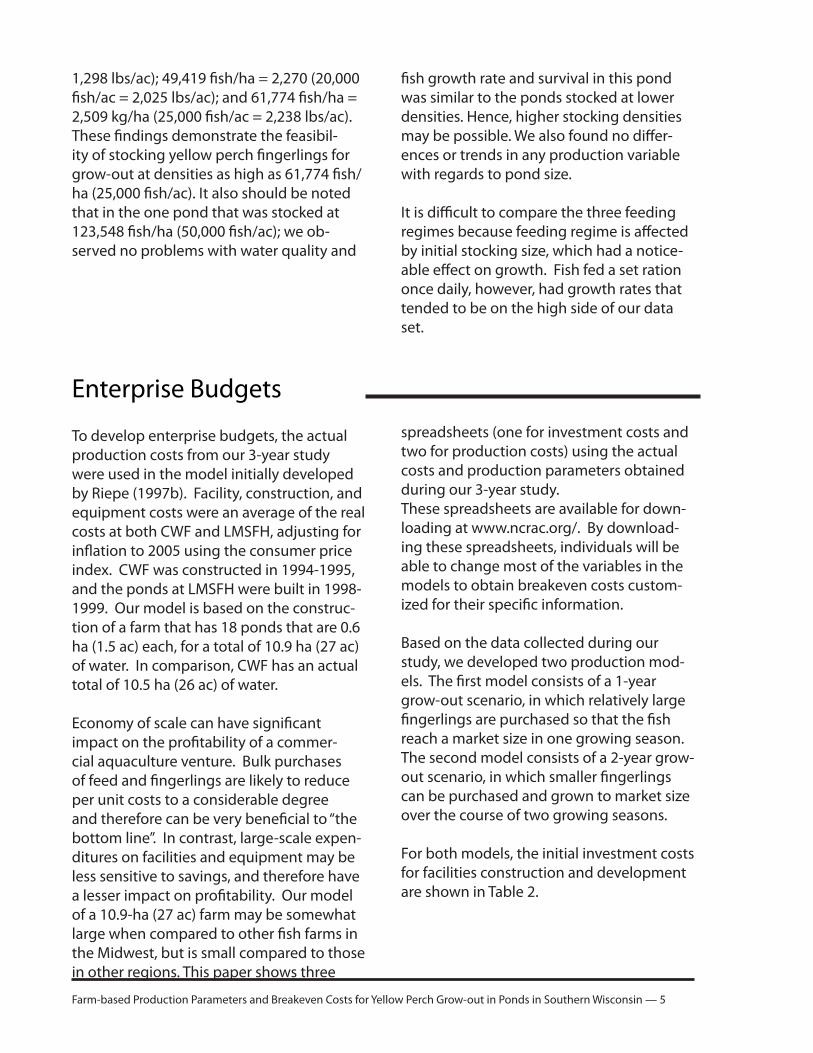
To develop enterprise budgets, the actual production costs from our 3-year study were used in the model initially developed by Riepe (�997b). Facility, construction, and equipment costs were an average of the real costs at both CWF and LMSFH, adjusting for inflation to 2005 using the consumer price index. CWF was constructed in �994-�995, and the ponds at LMSFH were built in �998-�999. Our model is based on the construc-tion of a farm that has �8 ponds that are 0.6 ha (�.5 ac) each, for a total of �0.9 ha (27 ac) of water. In comparison, CWF has an actual total of �0.5 ha (26 ac) of water.
Economy of scale can have significant impact on the profitability of a commer-cial aquaculture venture. Bulk purchases of feed and fingerlings are likely to reduce per unit costs to a considerable degree and therefore can be very beneficial to “the bottom line”. In contrast, large-scale expen-ditures on facilities and equipment may be less sensitive to savings, and therefore have a lesser impact on profitability. Our model of a �0.9-ha (27 ac) farm may be somewhat large when compared to other fish farms in the Midwest, but is small compared to those in other regions. This paper shows three
spreadsheets (one for investment costs and two for production costs) using the actual costs and production parameters obtained during our 3-year study. These spreadsheets are available for down-loading at www.ncrac.org/. By download-ing these spreadsheets, individuals will be able to change most of the variables in the models to obtain breakeven costs custom-ized for their specific information.
Based on the data collected during our study, we developed two production mod-els. The first model consists of a �-year grow-out scenario, in which relatively large fingerlings are purchased so that the fish reach a market size in one growing season. The second model consists of a 2-year grow-out scenario, in which smaller fingerlings can be purchased and grown to market size over the course of two growing seasons.
For both models, the initial investment costs for facilities construction and development are shown in Table 2.
6 — Farm-based Production Parameters and Breakeven Costs for Yellow Perch Grow-out in Ponds in Southern Wisconsin
Table 2. Investment costs for grow-out of yellow perch in ponds in southern Wisconsin
Farm-based Production Parameters and Breakeven Costs for Yellow Perch Grow-out in Ponds in Southern Wisconsin — 7
Our assumptions relevant to both models are as follows:
Land appreciates at 5% per year.
�00% of the money for investment is bor-rowed at an interest rate of 6.5% per year. Interest only is paid (i.e., any repayment of the original investment debt is consid-ered profit beyond breakeven).
�00% of the money for operating costs is borrowed at an interest rate of 6.5% per year. For the one year scenario the money is borrowed at the beginning of the growing season (day 0) and paid back in full at the end of the growing season (day �90). For the 2-year scenario the money is borrowed at the beginning of the first growing season and paid back in full at the end of the second growing season (day 555).
The labor needed for each year is 2 hrs for set up for each pond, 3 hrs/d for feeding fish, � hr/d for maintenance and repair, and 20 hrs/pond for harvest.
For both models we used stocking densities that targeted a production of approximately 3,363 kg/ha (3,000 lbs/ac) per season. Although these densities are higher than those used in most of the results detailed in Table �, other unreported findings at CWF, LMSFH and other pond-based yellow perch farms have indicated that yellow perch can generally be raised at these densities with little risk of incurring problems with water quality. If users of these models wish to do so, they can reduce rearing densities and production values in our downloadable excel spreadsheets. For ease of analysis, all
•
•
•
•
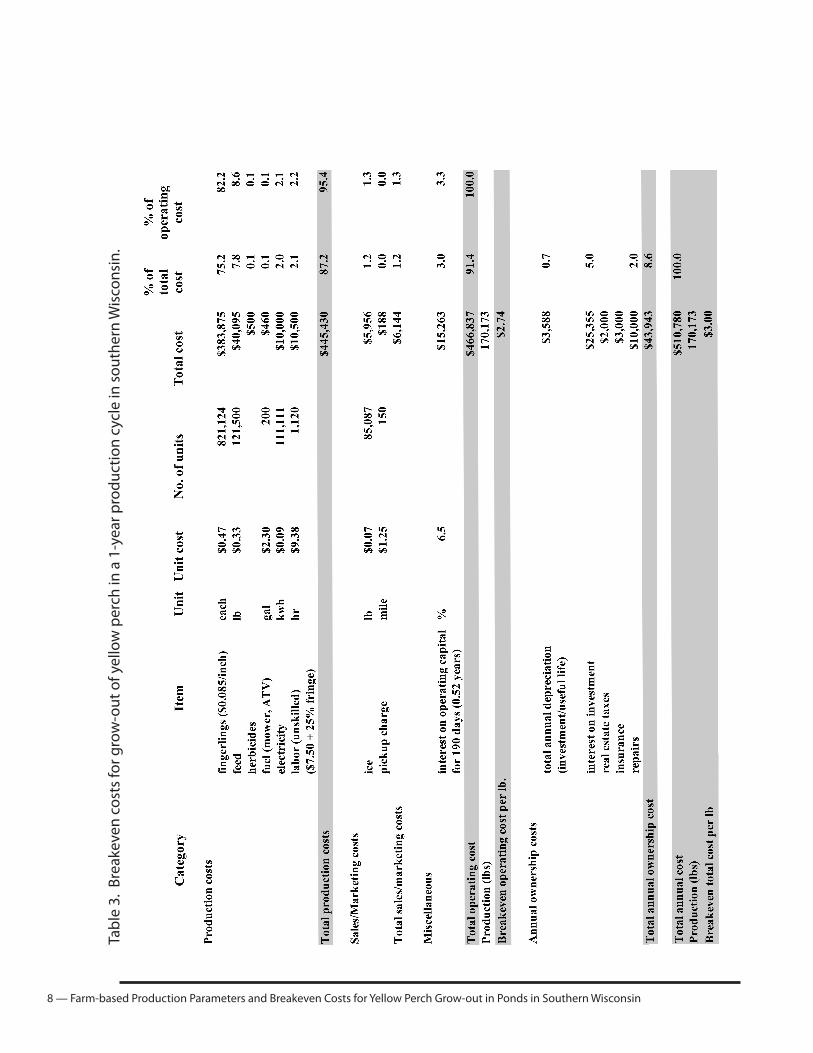
subsequent results will be reported primar-ily in English units.For the �-year grow-out model, fingerlings were purchased at 5.5 inches and 50 g, at $0.085 per inch. Fingerlings were stocked at 30,4�2 fish/ac and and production was estimated at 3,350 lbs/ac. The fish gained 68.5g each, and the survival rate was 79%. 6,350 lbs of fish/a were harvested, and 2,953 lbs/a of growth was obtained. The breakev-en costs of production for a �-year grow-out scenario are shown in Table 3.
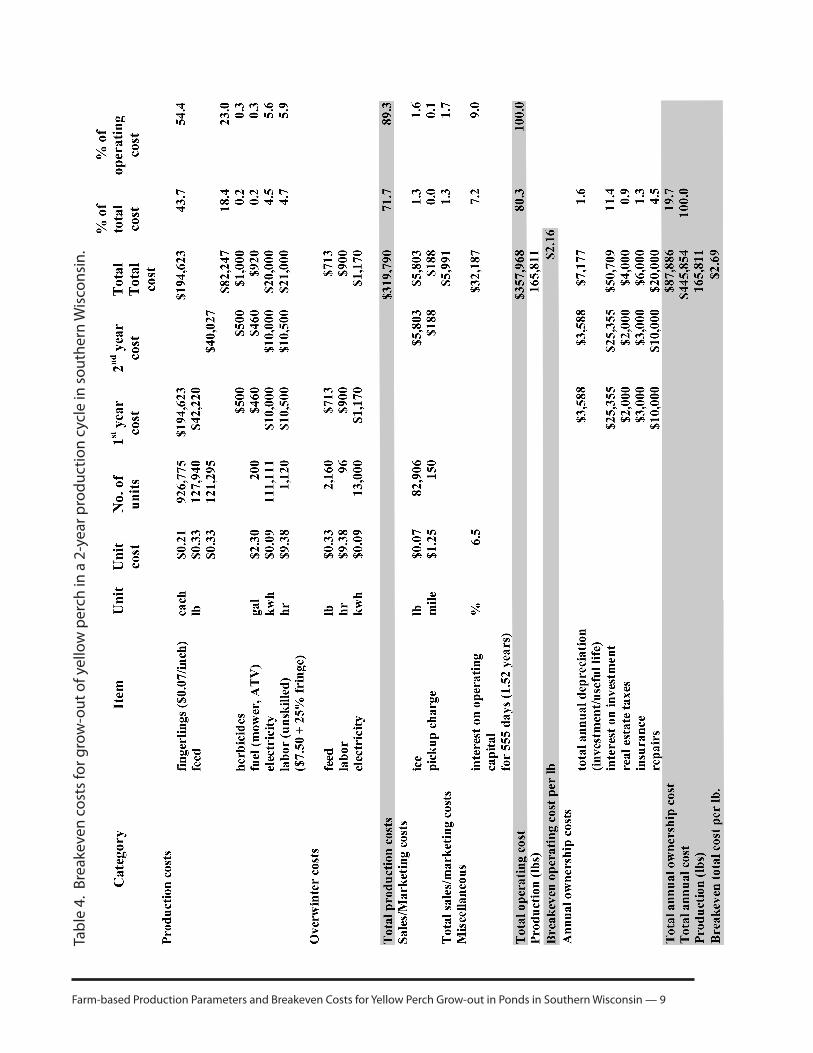
For the 2-year grow-out model, fingerlings were purchased at 3.0 inches and 5 g, at $0.07 per inch. Fingerlings were stocked at 34,325 fish/ac and 378 lbs/ac. In year � the fish gained 52.8 g each, and the survival rate was 89%. 3,537 lbs of fish/ac were harvested at the end of the year, and 3,�59 lbs/a of growth was obtained. The fish were over wintered (assuming �00% survival), and 75% of the fish spawned the following spring. Each fish that spawned lost 25% of its weight, for a total weight loss of �8.75%. In the beginning of the second year, post-spawn fish were stocked at 30,4�2/ac and production was estimated at 3,�48 lbs/ac. In year 2 the fish gained 68.5 g each, and the survival rate was 79%. 6,�43 lbs of fish/ac were harvested, and 2,995 lbs/ac of growth was obtained. Breakeven costs of produc-tion for a 2-year grow-out scenario are shown in Table 4.
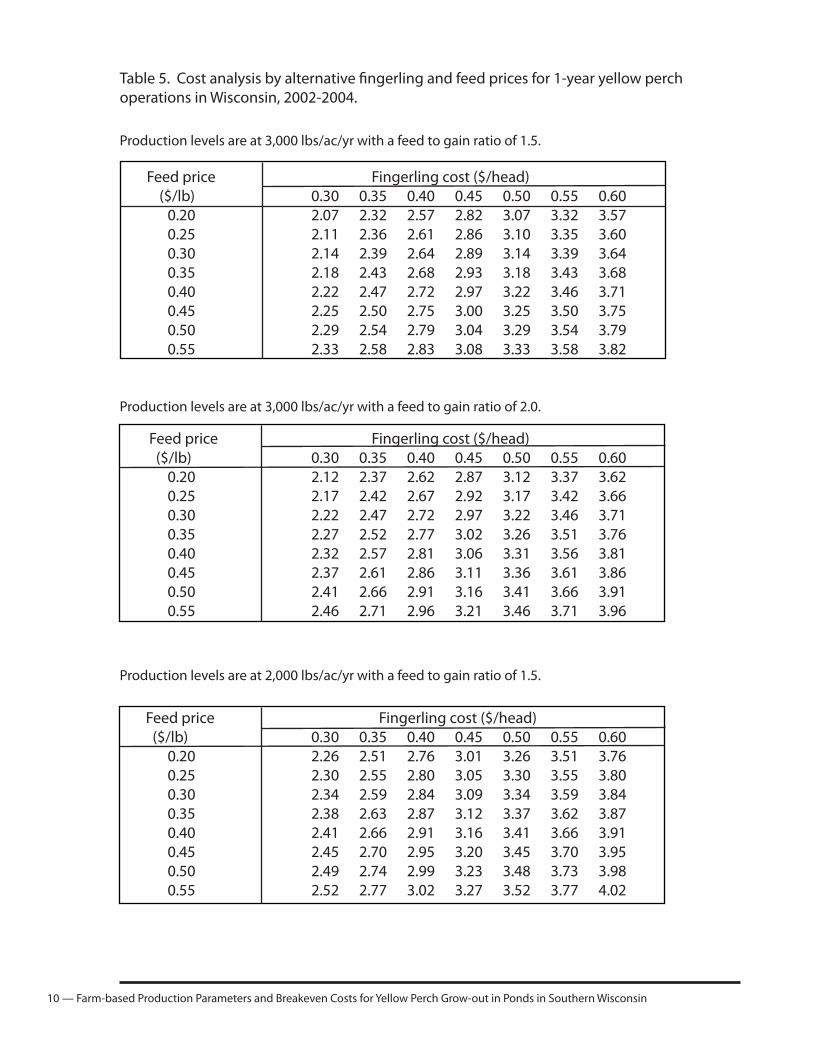
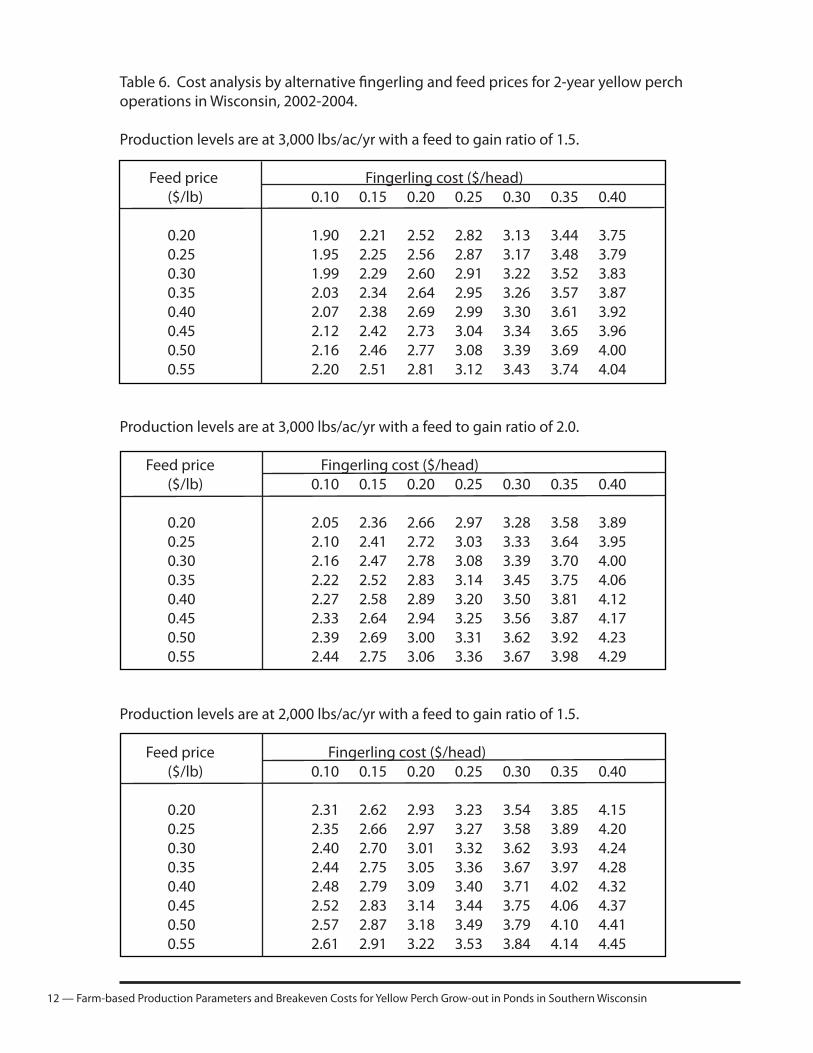
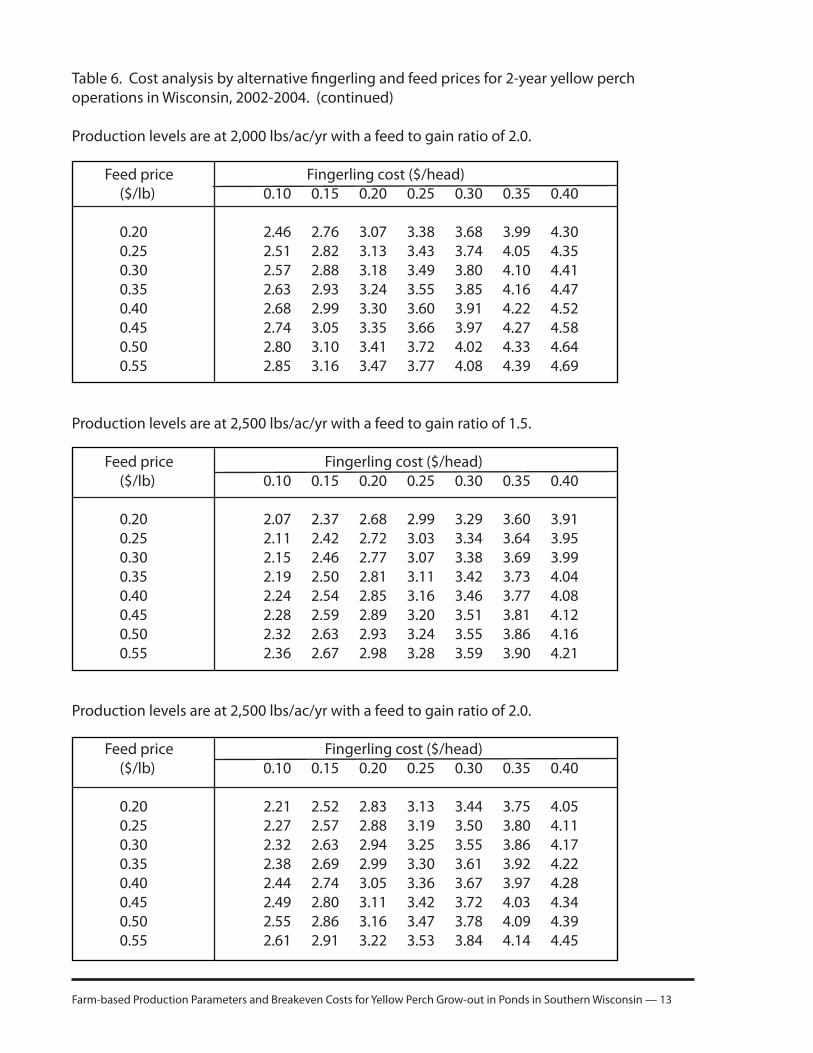
In addition to developing the previous tables, we have also done a limited sensitivi-ty analysis using the data garnered from our research (Tables 5 and 6). In these tables, the variable costs of fingerlings have the most substantial effect on break-even costs.
8 — Farm-based Production Parameters and Breakeven Costs for Yellow Perch Grow-out in Ponds in Southern Wisconsin
Tabl
e 3.
Bre
akev
en c
osts
for g
row
-out
of y
ello
w p
erch
in a
�-y
ear p
rodu
ctio
n cy
cle
in s
outh
ern
Wis
cons
in.
Farm-based Production Parameters and Breakeven Costs for Yellow Perch Grow-out in Ponds in Southern Wisconsin — 9
Tabl
e 4.
Bre
akev
en c
osts
for g
row
-out
of y
ello
w p
erch
in a
2-y
ear p
rodu
ctio
n cy
cle
in s
outh
ern
Wis
cons
in.
�0 — Farm-based Production Parameters and Breakeven Costs for Yellow Perch Grow-out in Ponds in Southern Wisconsin
Table 5. Cost analysis by alternative fingerling and feed prices for �-year yellow perch operations in Wisconsin, 2002-2004.
Feed price Fingerling cost ($/head) ($/lb) 0.30 0.35 0.40 0.45 0.50 0.55 0.60 0.20 2.07 2.32 2.57 2.82 3.07 3.32 3.57 0.25 2.�� 2.36 2.6� 2.86 3.�0 3.35 3.60 0.30 2.�4 2.39 2.64 2.89 3.�4 3.39 3.64 0.35 2.�8 2.43 2.68 2.93 3.�8 3.43 3.68 0.40 2.22 2.47 2.72 2.97 3.22 3.46 3.7� 0.45 2.25 2.50 2.75 3.00 3.25 3.50 3.75 0.50 2.29 2.54 2.79 3.04 3.29 3.54 3.79 0.55 2.33 2.58 2.83 3.08 3.33 3.58 3.82
Feed price Fingerling cost ($/head) ($/lb) 0.30 0.35 0.40 0.45 0.50 0.55 0.60 0.20 2.�2 2.37 2.62 2.87 3.�2 3.37 3.62 0.25 2.�7 2.42 2.67 2.92 3.�7 3.42 3.66 0.30 2.22 2.47 2.72 2.97 3.22 3.46 3.7� 0.35 2.27 2.52 2.77 3.02 3.26 3.5� 3.76 0.40 2.32 2.57 2.8� 3.06 3.3� 3.56 3.8� 0.45 2.37 2.6� 2.86 3.�� 3.36 3.6� 3.86 0.50 2.4� 2.66 2.9� 3.�6 3.4� 3.66 3.9� 0.55 2.46 2.7� 2.96 3.2� 3.46 3.7� 3.96
Feed price Fingerling cost ($/head) ($/lb) 0.30 0.35 0.40 0.45 0.50 0.55 0.60 0.20 2.26 2.5� 2.76 3.0� 3.26 3.5� 3.76 0.25 2.30 2.55 2.80 3.05 3.30 3.55 3.80 0.30 2.34 2.59 2.84 3.09 3.34 3.59 3.84 0.35 2.38 2.63 2.87 3.�2 3.37 3.62 3.87 0.40 2.4� 2.66 2.9� 3.�6 3.4� 3.66 3.9� 0.45 2.45 2.70 2.95 3.20 3.45 3.70 3.95 0.50 2.49 2.74 2.99 3.23 3.48 3.73 3.98 0.55 2.52 2.77 3.02 3.27 3.52 3.77 4.02
Production levels are at 3,000 lbs/ac/yr with a feed to gain ratio of �.5.
Production levels are at 3,000 lbs/ac/yr with a feed to gain ratio of 2.0.
Production levels are at 2,000 lbs/ac/yr with a feed to gain ratio of �.5.

Farm-based Production Parameters and Breakeven Costs for Yellow Perch Grow-out in Ponds in Southern Wisconsin — ��
Feed price Fingerling cost ($/head) ($/lb) 0.30 0.35 0.40 0.45 0.50 0.55 0.60 0.20 2.3� 2.56 2.8� 3.06 3.3� 3.56 3.8� 0.25 2.36 2.6� 2.86 3.�� 3.36 3.6� 3.86 0.30 2.4� 2.66 2.9� 3.�6 3.4� 3.66 3.9� 0.35 2.46 2.7� 2.96 3.2� 3.46 3.7� 3.96 0.40 2.5� 2.76 3.0� 3.26 3.5� 3.76 4.0� 0.45 2.56 2.8� 3.06 3.3� 3.56 3.8� 4.06 0.50 2.6� 2.86 3.�� 3.36 3.6� 3.86 4.�� 0.55 2.66 2.9� 3.�6 3.4� 3.66 3.9� 4.�6
Feed price Fingerling cost ($/head) ($/lb) 0.30 0.35 0.40 0.45 0.50 0.55 0.60 0.20 2.�5 2.40 2.65 2.90 3.�5 3.40 3.64 0.25 2.�8 2.43 2.68 2.93 3.�8 3.43 3.68 0.30 2.22 2.47 2.72 2.97 3.22 3.47 3.72 0.35 2.26 2.5� 2.76 3.0� 3.26 3.5� 3.76 0.40 2.30 2.55 2.79 3.04 3.29 3.54 3.79 0.45 2.33 2.58 2.83 3.08 3.33 3.58 3.83 0.50 2.37 2.62 2.87 3.�2 3.37 3.62 3.87 0.55 2.4� 2.66 2.9� 3.�5 3.40 3.65 3.90
Feed price Fingerling cost ($/head) ($/lb) 0.30 0.35 0.40 0.45 0.50 0.55 0.60 0.20 2.20 2.45 2.70 2.95 3.�9 3.44 3.69 0.25 2.25 2.50 2.75 2.99 3.24 3.49 3.74 0.30 2.30 2.55 2.79 3.04 3.29 3.54 3.79 0.35 2.34 2.59 2.84 3.09 3.34 3.59 3.84 0.40 2.39 2.64 2.89 3.�4 3.39 3.64 3.89 0.45 2.44 2.69 2.94 3.�9 3.44 3.69 3.94 0.50 2.49 2.74 2.99 3.24 3.49 3.74 3.99 0.55 2.54 2.79 3.04 3.29 3.54 3.79 4.04
Production levels are at 2,500 lbs/ac/yr with a feed to gain ratio of 2.0.
Production levels are at 2,500 lbs/ac/yr with a feed to gain ratio of �.5.
Production levels are at 2,000 lbs/ac/yr with a feed to gain ratio of 2.0.
Table 5. Cost analysis by alternative fingerling and feed prices for �-year yellow perch operations in Wisconsin, 2002-2004. (continued)
�2 — Farm-based Production Parameters and Breakeven Costs for Yellow Perch Grow-out in Ponds in Southern Wisconsin
Table 6. Cost analysis by alternative fingerling and feed prices for 2-year yellow perch operations in Wisconsin, 2002-2004. Production levels are at 3,000 lbs/ac/yr with a feed to gain ratio of �.5.
Feed price Fingerling cost ($/head) ($/lb) 0.�0 0.�5 0.20 0.25 0.30 0.35 0.40
0.20 �.90 2.2� 2.52 2.82 3.�3 3.44 3.75 0.25 �.95 2.25 2.56 2.87 3.�7 3.48 3.79 0.30 �.99 2.29 2.60 2.9� 3.22 3.52 3.83 0.35 2.03 2.34 2.64 2.95 3.26 3.57 3.87 0.40 2.07 2.38 2.69 2.99 3.30 3.6� 3.92 0.45 2.�2 2.42 2.73 3.04 3.34 3.65 3.96 0.50 2.�6 2.46 2.77 3.08 3.39 3.69 4.00 0.55 2.20 2.5� 2.8� 3.�2 3.43 3.74 4.04
Production levels are at 3,000 lbs/ac/yr with a feed to gain ratio of 2.0.
Feed price Fingerling cost ($/head) ($/lb) 0.�0 0.�5 0.20 0.25 0.30 0.35 0.40
0.20 2.05 2.36 2.66 2.97 3.28 3.58 3.89 0.25 2.�0 2.4� 2.72 3.03 3.33 3.64 3.95 0.30 2.�6 2.47 2.78 3.08 3.39 3.70 4.00 0.35 2.22 2.52 2.83 3.�4 3.45 3.75 4.06 0.40 2.27 2.58 2.89 3.20 3.50 3.8� 4.�2 0.45 2.33 2.64 2.94 3.25 3.56 3.87 4.�7 0.50 2.39 2.69 3.00 3.3� 3.62 3.92 4.23 0.55 2.44 2.75 3.06 3.36 3.67 3.98 4.29
Production levels are at 2,000 lbs/ac/yr with a feed to gain ratio of �.5.
Feed price Fingerling cost ($/head) ($/lb) 0.�0 0.�5 0.20 0.25 0.30 0.35 0.40
0.20 2.3� 2.62 2.93 3.23 3.54 3.85 4.�5 0.25 2.35 2.66 2.97 3.27 3.58 3.89 4.20 0.30 2.40 2.70 3.0� 3.32 3.62 3.93 4.24 0.35 2.44 2.75 3.05 3.36 3.67 3.97 4.28 0.40 2.48 2.79 3.09 3.40 3.7� 4.02 4.32 0.45 2.52 2.83 3.�4 3.44 3.75 4.06 4.37 0.50 2.57 2.87 3.�8 3.49 3.79 4.�0 4.4� 0.55 2.6� 2.9� 3.22 3.53 3.84 4.�4 4.45
Farm-based Production Parameters and Breakeven Costs for Yellow Perch Grow-out in Ponds in Southern Wisconsin — �3
Production levels are at 2,000 lbs/ac/yr with a feed to gain ratio of 2.0.
Feed price Fingerling cost ($/head) ($/lb) 0.�0 0.�5 0.20 0.25 0.30 0.35 0.40
0.20 2.46 2.76 3.07 3.38 3.68 3.99 4.30 0.25 2.5� 2.82 3.�3 3.43 3.74 4.05 4.35 0.30 2.57 2.88 3.�8 3.49 3.80 4.�0 4.4� 0.35 2.63 2.93 3.24 3.55 3.85 4.�6 4.47 0.40 2.68 2.99 3.30 3.60 3.9� 4.22 4.52 0.45 2.74 3.05 3.35 3.66 3.97 4.27 4.58 0.50 2.80 3.�0 3.4� 3.72 4.02 4.33 4.64 0.55 2.85 3.�6 3.47 3.77 4.08 4.39 4.69
Production levels are at 2,500 lbs/ac/yr with a feed to gain ratio of �.5.
Feed price Fingerling cost ($/head) ($/lb) 0.�0 0.�5 0.20 0.25 0.30 0.35 0.40
0.20 2.07 2.37 2.68 2.99 3.29 3.60 3.9� 0.25 2.�� 2.42 2.72 3.03 3.34 3.64 3.95 0.30 2.�5 2.46 2.77 3.07 3.38 3.69 3.99 0.35 2.�9 2.50 2.8� 3.�� 3.42 3.73 4.04 0.40 2.24 2.54 2.85 3.�6 3.46 3.77 4.08 0.45 2.28 2.59 2.89 3.20 3.5� 3.8� 4.�2 0.50 2.32 2.63 2.93 3.24 3.55 3.86 4.�6 0.55 2.36 2.67 2.98 3.28 3.59 3.90 4.2�
Production levels are at 2,500 lbs/ac/yr with a feed to gain ratio of 2.0.
Feed price Fingerling cost ($/head) ($/lb) 0.�0 0.�5 0.20 0.25 0.30 0.35 0.40
0.20 2.2� 2.52 2.83 3.�3 3.44 3.75 4.05 0.25 2.27 2.57 2.88 3.�9 3.50 3.80 4.�� 0.30 2.32 2.63 2.94 3.25 3.55 3.86 4.�7 0.35 2.38 2.69 2.99 3.30 3.6� 3.92 4.22 0.40 2.44 2.74 3.05 3.36 3.67 3.97 4.28 0.45 2.49 2.80 3.�� 3.42 3.72 4.03 4.34 0.50 2.55 2.86 3.�6 3.47 3.78 4.09 4.39 0.55 2.6� 2.9� 3.22 3.53 3.84 4.�4 4.45
Table 6. Cost analysis by alternative fingerling and feed prices for 2-year yellow perch operations in Wisconsin, 2002-2004. (continued)
�4 — Farm-based Production Parameters and Breakeven Costs for Yellow Perch Grow-out in Ponds in Southern Wisconsin
The investment and production costs dis-played in the tables in this paper represent the real expenditures at CWF and LMSFH from 200� to 2004. Depreciation rates can vary, but we note that most of the ponds, wells and major utilities at the LMSFH are over 50 yr old, and such facilities can have an extremely long life expectancy given an adequate repair budget (as we incorpo-rated into our model). This is in contrast to numerous published economic studies that use �0-20 yr for a pond’s useful life. All production models have limitations based on location, time, and a wide range of other variables. Land and pond construction costs, for example, can vary greatly by loca-tion. Location will also affect water temper-ature and growing season. Likewise, feed, labor, and fingerling costs can vary greatly over time, location and operational scale. Potential producers also should be aware of market limitations on the availability and quality of fingerlings. Given these concerns, the associated spreadsheets will allow indi-vidual producers the ability to make suit-able adjustments for their specific location and experiences, e.g., a pond’s useful life.
The authors strongly suggest that anyone using these models should download the available spread sheets and manipulate different variables to evaluate their effect on production costs. For example, chang-ing the fingerling price in the 2-yr scenario from $0.07/inch to $0.�0/inch changes the breakeven cost from $2.69 to $3.24 ($0.55 increase), similarly changing the production level from 3,000lbs/ac/yr to 2,000lbs/ac/yr raises the breakeven cost from $2.69 to $3.�0. Riepe (�997) indicated that a 5 cent increase in fingerling cost resulted in $0.�7-
Discussion and Conclusions30/lb increase in breakeven costs. Changes in investment costs and depreciation rates have relatively minor effects. For example, changing the useful life of pond construc-tion, well, levee improvements and building from 50 to 20 yr increases the breakeven cost from $2.69 to $2.76.
One striking feature of both �- and 2-yr models is the extremely high relative costs of purchasing fingerlings (approximately 75% of the total production costs for the �-yr scenario, and 44% of the total costs for the 2-year model). For the culture of most other food fish species, fingerlings normally represent no more than �0-30% of the total production costs. The disparity between yel-low perch and other species can be largely attributed to the fact that yellow perch are harvested at a comparatively small size. It should be noted that our models use the approximate wholesale price for purchasing fingerlings in 2005 (according to personnel of CWF). Fingerling costs could possibly be lowered significantly if one were to produce their own fingerlings. Regardless of produc-tion scenario, the development of methods for reducing fingerling production costs will clearly have a major impact on the efficien-cy of yellow perch grow-out.
The savings on initial fingerling costs makes a 2-yr grow-out scenario more than �0% more efficient than a �-yr scenario. By its very nature, however, a 2-yr scenario carries higher risk, because the fish need to be kept alive and healthy for a much longer period of time. In addition, the weight lost with overwintering and spawning needs to be addressed.

Farm-based Production Parameters and Breakeven Costs for Yellow Perch Grow-out in Ponds in Southern Wisconsin — �5
The grow-out of yellow perch in pond systems, in either a �- or 2-year scenario, is apparently more efficient than grow-out in recirculating systems, net pens, or flow through systems. The mean breakeven costs for the different system types have recently been reported as follows: pond, � year - $2.95/lb, 2 year - $2.59/lb, recirculat-ing systems $6.86/lb, net pens - $4.80/lb., and flow-through - $5.50/lb (NCRAC 2006). These numbers suggest that grow-out of yellow perch in ponds could be a profitable endeavor. However, prior to selecting any specific culture system, size distribution within each system as well as costs/lb need to be considered. For instance, yellow perch processors often require a specific size yel-low perch, often �20 g, for processing. As with all forms of aquaculture production, profitability is highly dependent on both species-specific markets and the marketing strategies of the producer.
Over the past decade, the wholesale mar-ket price for yellow perch in the round has varied considerably, both seasonally and annually. It is important to note that profit-ability of the �- and 2-yr production scenar-ios are approximately equal (approximately $50,000/yr) at a market price of $3.29/lb. Prices lower than $3.29/lb make the 2-yr scheme comparatively more profitable, while prices higher than $3.29/lb favor the �-yr production cycle. As with all fish spe-cies, market price of yellow perch can vary widely, e.g., <$2.00 to as much as $3.50/lb for this specific species. Yellow perch mar-ket factors are discussed in more detail by Malison (�999). Most producers will recog-nize that marketing “value-added” products, such as processed fillets, offer the potential of improving the “bottom line”.
�6 — Farm-based Production Parameters and Breakeven Costs for Yellow Perch Grow-out in Ponds in Southern Wisconsin
Hart, S.D., D.L. Garling, and J.A. Malison. 2006. Yellow perch (Perca flavescens) culture guide. North Central Regional Aquaculture Center Culture Series #�04, Ames, IA.
Hoven, H. �998. Economic model for yellow perch recirculating aquaculture system. World Aquaculture Society Book of Abstracts, 29th Annual Meeting of the World Aquaculture Soci-ety, Las Vegas, Nevada, February �5-�9, �998.
Malison, J.A. �999. (updated 2003). A white paper on the status and needs of yellow perch aquaculture in the North Central Region. Special publication of the North Central Regional Aquaculture Center, East Lansing, MI, �5 pp.
http://ag.ansc.purdue.edu/aquanic/ncracre/wpapers/wpapers.htm
North Central Regional Aquaculture Center (NCRAC). 2006. NCRAC annual progress report 2004-2005. NCRAC, Michigan State University, East Lansing, MI.
Riepe, J.R. �997a. Enterprise budgets for yellow perch production in cages and ponds in the North Central Region, �994/95. NCRAC Technical Bulletin Series #���, NCRAC Publications Office, Iowa State University, Ames.
Riepe, J.R. �997b. Costs for Pond Production of Yellow Perch in the North Central Region, �994-�995. NCRAC Fact Sheet Series #���, NCRAC Publications Office, Iowa State University, Ames.
Malison, J.A., T.B. Kayes, B.C. Wentworth, and C.H. Amundson. �988. Growth and feeding responses of male versus female yellow perch (Perca flavescens) treated with estradiol-�7b. Canadian Journal of Fisheries and Aquatic Sciences 45:�942-�948.
Malison, J.A., T.B. Kayes, B.C. Wentworth, and C.H. Amundson. �987. Control of sexually re-
lated dimorphic growth by gonadal steroids in yellow perch (Perca flavescens). In: Proceed-ings of the Third International Symposium on Reproductive Physiology of Fish, Idler, D.R., L.W. Crim, and J.M. Walsh, (ed.), Memorial University of Newfoundland, St. John’s, New-foundland, Canada, p. 206.
Malison, J.A., C.D. Best, T.B. Kayes, C.H. Amundson, and B.C. Wentworth. �986. Sexual differen-
tiation and the use of hormones to control sex in yellow perch (Perca flavescens). Canadian Journal of Fisheries and Aquatic Sciences 43:26-35.
Additional References
References
Farm-based Production Parameters and Breakeven Costs for Yellow Perch Grow-out in Ponds in Southern Wisconsin — �7
Malison, J.A. �985. Growth promotion and the influence of sex-steroids on sexually related dimorphic growth and differentiation in yellow perch (Perca flavescens). Ph.D. Thesis, University of Wisconsin-Madison, Madison.
Hayward, R. S., and N. Wang. 200�. Failure to induce over-compensation of growth in ma-turing yellow perch. Journal of Fish Biology 59:�26–�40.
For a long discussion of evidence for females outgrowing males - see pages 49-60:Thorpe, J. �977. Synopsis of biological data on the perch (Perca fluviatilis Linnaeus, �758 and Perca flavescens Mitchill, �8�4). Food and Agriculture Organization of the United Na-tions, Rome.